adoption of virtual services in judicially led diversion
TRANSCRIPT
Adoption of Virtual Services in Judicially LedDiversion ProgramsPreliminary Survey Findings
Prepared byTara Kunkel, MSWExecutive DirectorRulo Strategies LLC
Brad Ray, PhDDirectorCenter for Behavioral Health and JusticeWayne State University
Kristina Bryant, MBAPrincipal Court ConsultantNational Center for State Courts
February 2021

ContributorsJoel CohenBeverly Hanson, National Center for State CourtsKatie Bailey, MPA, Wayne State UniversityPhilip Huynh, MPH, Wayne State UniversityEmily Sightes, MPH, Wayne State UniversityBarbara “Basia” Andraka-Christou, J.D., Ph.D., University of Central Florida
Acknowledgment The authors would like to thank all of the individuals who responded to the survey and the court programs that participated. We would also like to thank the state court administrators, the statewide problem-solving court coordinators, and the national training and technical assistance providers who assisted with the distribution of the survey, provided feedback on the survey instruments, and reviewed drafts of this report.
Suggested CitationKunkel, T., Ray, B., Bryant, K. (February 2021). Adoption of Virtual Services in Judicially Led Diversion Programs: Preliminary Survey Findings. Rulo Strategies: Arlington, Virginia.
©2021, Rulo Strategies LLC. All rights reserved.
For More Information or to Participate in Ongoing Data CollectionWe continue to collect surveys from judges, court coordinators, community supervision, treatment providers, and peer recovery professionals who work in judicially led diversion initiatives through April 1, 2021. In addition, a companion survey to collect de-identified data from court participants will be launched on February 17, 2021. Data collection from participants will conclude in mid-April 2021. If you are interested in participating in data collection, please contact Tara Kunkel at [email protected] or Kristina Bryant at [email protected].
Funding for this initiative is made possible by Grant No. 6H79TI080816 from SAMHSA. The views expressed in written conference materials or publications and by speakers and moderators do not necessarily reflect the official policies of the Department of Health and Human Services; nor does mention of trade names, commercial practices, or organizations imply endorsement by the U.S. Government.
2

Table of ContentsIntroduction
Survey Respondents
Responses to COVID-19
Court Hearings and Pre-court Staffing
Treatment and Recovery Support Services
Community Supervision
Barriers and Facilitators
Next Steps
Conclusions
References
Appendix
4
5
8
10
20
29
32
34
35
37
39
3

IntroductionThis report reflects the preliminary findings from the Adoption of Virtual Services in Judicially Led Diversion Programs survey. The preliminary findings reflect data collected in November and December 2020.
The focus of this report is judicially led diversion programs, an umbrella term that encompasses drug courts, opioid courts, and recovery-oriented compliance dockets. While these models differ in design, they share the common features of early intervention, ongoing supervision, consistent judicial oversight, and an emphasis on providing substance use treatment and recovery services. In 2020, as the COVID-19 pandemic persisted, the use of “virtual services” to facilitate these traditionally in-person interactions went from innovative to essential. The term “virtual services” is used throughout the report to refer to the use of communications technology (cell phones, computers, web-based devices, and landlines) to support court hearings, staff meetings (referred to as pre-court staffings in this report), treatment, and community supervision. This report highlights preliminary survey results from 500 respondents—including judges, court coordinators, treatment providers, case managers, and community supervision officers—from 298 unique court programs and provides a multi-state examination of how practices were modified in judicially led diversion programs. It also documents barriers and facilitators program staff experienced during the implementation of these practices and their reported effectiveness in different domains, including court hearings, pre-court staffings, treatment, and community supervision. The findings reflected in this report are based on the data collected from three surveys that were foundationally similar with questions
Survey Version
# of
Respondents
Court Operations 258
Treatment and Recovery
Support
141
Community Supervision 101
Table 1: Number of Respondents by Survey Type (N=500)
tailored to three main groups as shown in Table 1: court operations (judges, court coordinators, prosecutors, defense attorneys); treatment and recovery support (treatment providers, case managers, peer recovery support); and community supervision (probation/parole, law enforcement).
4

Survey Respondents
The data examined for this report, which reflects preliminary findings, were collected through an online survey instrument between November 4, 2020 and December 11, 2020. An updated report will be released in the spring of 2021 with data from additional respondents. The survey was deployed with the assistance of regional and national organizations that support judicially led diversion programs. As shown in Table 2, the majority of survey respondents were court coordinators/administrators, treatment providers, and probation/parole officers.
Respondent Role % of Total Respondents
Court coordinator/administrator 35.6%
Treatment provider 16.4%
Probation/parole o�cer 14.0%
Judge/magistrate 11.4%
Case manager 5.4%
Defense attorney 4.6%
Peer recovery specialist 3.4%
Prosecutor 2.4%
Law enforcement o�cer 1.6%
Veterans justice specialist 0.4%
Other 4.8%
Table 2: Respondent Role as a Percentage of the Total (N=500)
"Other" includes titles such as program director, evaluator, child welfare supervisor, and forensic
psychologist.
5

The 500 respondents represent 298 unique court programs in 235 communities across 40 states and the territory of Guam. The 298 unique court programs across the country are illustrated in Figure 1. The states with the highest participation rates are Tennessee, New York, and Illinois. Two court programs did not provide a geographic location.
00
44
99 22
2211
99
55
00
11
3636 6600
00 55
11
88
22
333333
11
55
44
001212 00
1010
4242
1616
00
1717
00
22
22
11
33
4747
66
00
22
33
1111
22
4411
11
Table 3: Type of Unique Court Program (N=298)
Court Model % of Total Court Programs
Adult drug court 59.4%
Mental health court 10.1%
Family treatment court/Safe baby court 7.0%
Veterans treatment court 6.7%
DUI court 4.4%
Co-occurring court 2.7%
Hybrid court 2.0%
Other judicially led diversion programs 7.7%
As shown in Table 3, most court programs are identified as adult drug courts—followed by mental health
courts, family treatment courts/safe baby courts, and veterans treatment courts. The response rate by court
model closely mirrors the national prevalence of these program types (1, 2).
"Other judicially led diversion programs" include opioid courts, juvenile drug or reentry courts, domestic violence
courts, human trafficking courts, and prosecutor- and law enforcement-led diversion programs.
Figure 1: Map of Court Program Responses (N=298)
1
3
0
6

Thirty-nine percent (39.3%) of the court programs represented by the respondents were located in mixed rural and suburban communities, 37.2% of the court programs were located in predominantly or entirely rural communities, 13.4% were located in predominantly or entirely urban communities, 8.4% were located in predominantly or entirely suburban areas, and 1.7% were located in mixed suburban and urban communities (see Table 4).
% of Total Court Programs
Mixed rural and suburban community 39.3%
Predominantly or entirely rural community 37.2%
Predominantly or entirely urban community 13.4%
Predominantly or entirely suburban community 8.4%
Mixed suburban and urban community 1.7%
Table 4: Type of Community Represented by Unique Court Programs (N=298)
7

Responses to COVID-19
Survey respondents were asked about programmatic or policy changes that were made in their court programs in response to the COVID-19 pandemic at some point since March 2020, and if these changes continued to remain in effect at the time of responding to the survey in November and December 2020. The most common programmatic changes were related to lowering the use of jail as a sanction and reducing requirements that would potentially conflict with social distancing practices (see Table 5). For example, 81.5% of programs reported reducing jail sanctions—with 50.6% continuing this practice—and more than two-thirds (70.0%) reported suspending community service requirements. More than half of the court programs stopped issuing sanctions for technical violations for both positive drug/alcohol screens and other forms of supervision non-compliance (58.3% and 52.3%, respectively).
Which of the following did your court program do in light of the pandemic?
At some
point
Currently
doing
Reducing the use of jail as a sanction (N=259) 30.9% 50.6%
Suspending community service requirements (N=240) 40.8% 29.2%
Not issuing warrants or sanctions for technical violations for positive drug/alcohol
screens (N=259)
31.7% 26.6%
Not issuing warrants or sanctions for technical violations for other supervision non-
compliance (N=254)
28.7% 23.6%
Suspending requirements to attend peer or mutual support groups (N=270) 30.4% 11.9%
Table 5: Programmatic Changes Made During the Pandemic (N=298)
Table 5 is based on the count of unique court programs. For each practice examined, a single response per court was counted. The Coordinator's
response, if available, was selected as the default response for the program on most practices. In the absence of a Coordinator response, the
community supervision officer's response was used for community supervision practices and the treatment provider's response was used for the
treatment practice questions. A response of "At some point" indicates that a program deployed this practice at some point since March 2020 but
was no longer using the practice at the time of responding to the survey in November and December 2020. A response of "Currently doing"
indicates that a program deployed this practice at some point since March 2020 and it remained in place at the time of responding to the survey in
November and December 2020. It is important to note that some practices were not used by particular programs prior to March 2020 or since.
Additionally, some practices are not relevant to specific program models. For additional detail related to this issue, see Table 11 and Table 12 in the
Appendix.
8
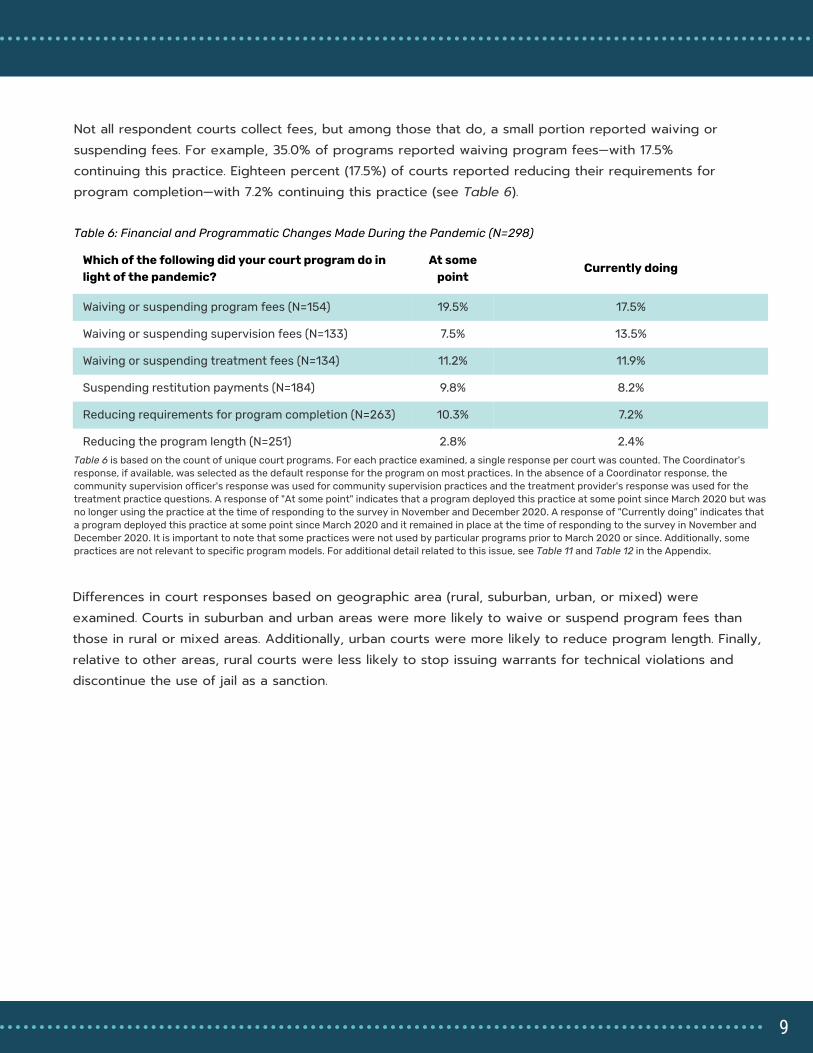
Which of the following did your court program do in
light of the pandemic?
At some
point
Currently doing
Waiving or suspending program fees (N=154) 19.5% 17.5%
Waiving or suspending supervision fees (N=133) 7.5% 13.5%
Waiving or suspending treatment fees (N=134) 11.2% 11.9%
Suspending restitution payments (N=184) 9.8% 8.2%
Reducing requirements for program completion (N=263) 10.3% 7.2%
Reducing the program length (N=251) 2.8% 2.4%
Differences in court responses based on geographic area (rural, suburban, urban, or mixed) were examined. Courts in suburban and urban areas were more likely to waive or suspend program fees than those in rural or mixed areas. Additionally, urban courts were more likely to reduce program length. Finally, relative to other areas, rural courts were less likely to stop issuing warrants for technical violations and discontinue the use of jail as a sanction.
Table 6: Financial and Programmatic Changes Made During the Pandemic (N=298)
Not all respondent courts collect fees, but among those that do, a small portion reported waiving or suspending fees. For example, 35.0% of programs reported waiving program fees—with 17.5% continuing this practice. Eighteen percent (17.5%) of courts reported reducing their requirements for program completion—with 7.2% continuing this practice (see Table 6).
Table 6 is based on the count of unique court programs. For each practice examined, a single response per court was counted. The Coordinator's
response, if available, was selected as the default response for the program on most practices. In the absence of a Coordinator response, the
community supervision officer's response was used for community supervision practices and the treatment provider's response was used for the
treatment practice questions. A response of "At some point" indicates that a program deployed this practice at some point since March 2020 but was
no longer using the practice at the time of responding to the survey in November and December 2020. A response of "Currently doing" indicates that
a program deployed this practice at some point since March 2020 and it remained in place at the time of responding to the survey in November and
December 2020. It is important to note that some practices were not used by particular programs prior to March 2020 or since. Additionally, some
practices are not relevant to specific program models. For additional detail related to this issue, see Table 11 and Table 12 in the Appendix.
9

Problem-solving courts and other judicially led diversion programs use a non-adversarial team approach where court professionals collaborate with treatment providers and community supervision officers to link participants to needed services and monitor compliance to court mandates. Prior to COVID-19, this team typically met in-person with participants for status hearings, as well as in-person as a team for pre-court staffings.
Figure 2: Method of Conducting Court Hearings in
November and December 2020 (N=281)
Team members who typically attended court were asked how court hearings were being conducted. As of November and December 2020, 36.7% of respondents reported court hearings were being held in-person (19.6% in-person only; 17.1% usually in-person, rarely virtual), 14.2% were conducting court hearings half in-person and half virtually, and 49.1% were holding court virtually (26.0% usually virtual, rarely in-person; 23.1% virtual only) (see Figure 2).
36.7%
in-person
49.1%
virtually
14.2%
half the time in-person and
half the time virtually
Court Hearings and Pre-court Staffings
Each program is counted only once in the figure above, even
when there were multiple respondents for a single program.
Seventeen programs did not provide a response to this
question or were not currently holding court.
10

For the following questions, respondents who attended court sessions in judicially led diversion programs were asked a series of questions about their experiences with in-person court and virtual court. Survey respondents who did not attend court were not included in the analysis that follows. Respondents were asked about the quality of information exchanged when court hearings were offered in-person and virtually (see Figure 3). The quality of information exchanged in court hearings was more likely to be rated as “high” when in-person (84.0%) compared to virtual (51.4%).
Said the quality of information exchanged is
high when court is offered in-person
84.0%
Said the quality of information exchanged is
high when court is offered virtually
51.4%
VIRTUALIN-PERSON
Figure 3: Quality of Information Exchanged in Court (N=257)
1.6% 35.8%
Said the quality of
information exchanged
increased when court is
offered virtually
Said the quality of
information exchanged
decreased when court is
offered virtually
Thirty-six percent (35.8%) of respondents reported that the quality of information exchanged decreased when court was held virtually versus in-person, while 62.6% felt there was no change in the quality of information when court transitioned from in-person to virtual (see Figure 4).
Figure 4: Change in the Quality of Information Exchanged in a Virtual Court Setting (N=257)
62.6%
Said the quality of
information exchanged was
the same when court is
offered virtually
11
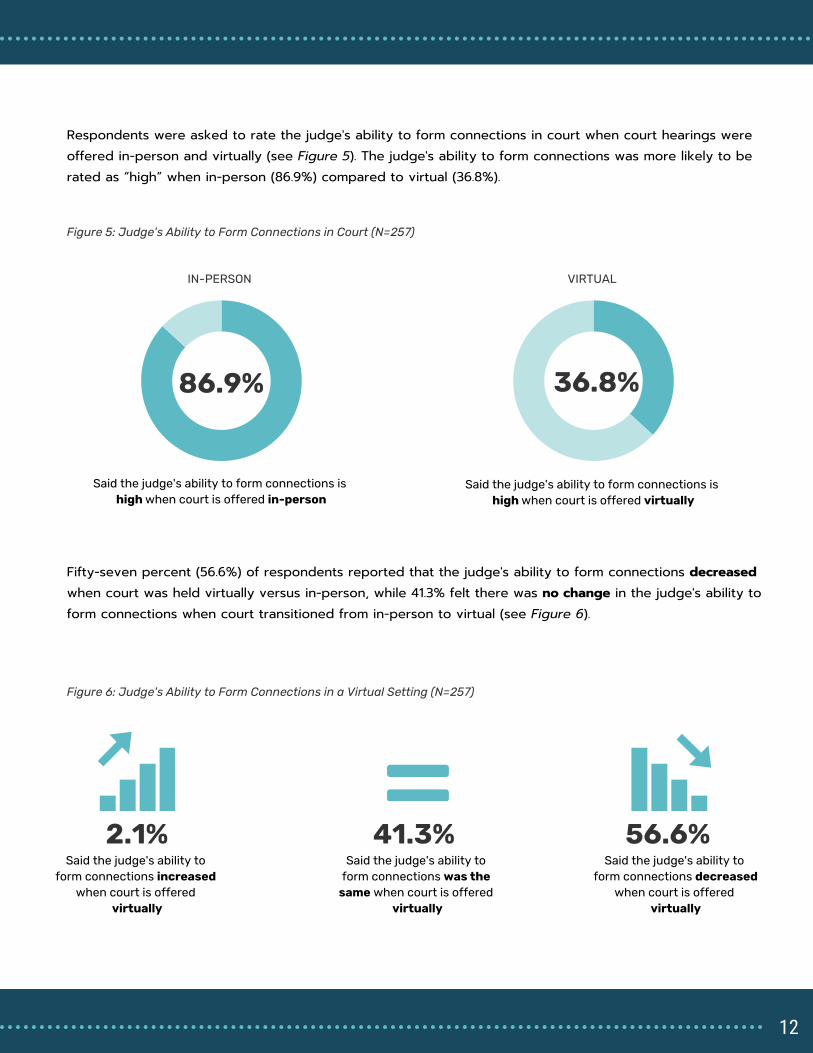
Respondents were asked to rate the judge's ability to form connections in court when court hearings were offered in-person and virtually (see Figure 5). The judge's ability to form connections was more likely to be rated as “high” when in-person (86.9%) compared to virtual (36.8%).
Said the judge's ability to form connections is
high when court is offered in-person
86.9%
Said the judge's ability to form connections is
high when court is offered virtually
36.8%
VIRTUALIN-PERSON
Figure 5: Judge's Ability to Form Connections in Court (N=257)
2.1% 56.6%
Said the judge's ability to
form connections increased
when court is offered
virtually
Said the judge's ability to
form connections decreased
when court is offered
virtually
Fifty-seven percent (56.6%) of respondents reported that the judge's ability to form connections decreased when court was held virtually versus in-person, while 41.3% felt there was no change in the judge's ability to form connections when court transitioned from in-person to virtual (see Figure 6).
Figure 6: Judge's Ability to Form Connections in a Virtual Setting (N=257)
41.3%
Said the judge's ability to
form connections was the
same when court is offered
virtually
12
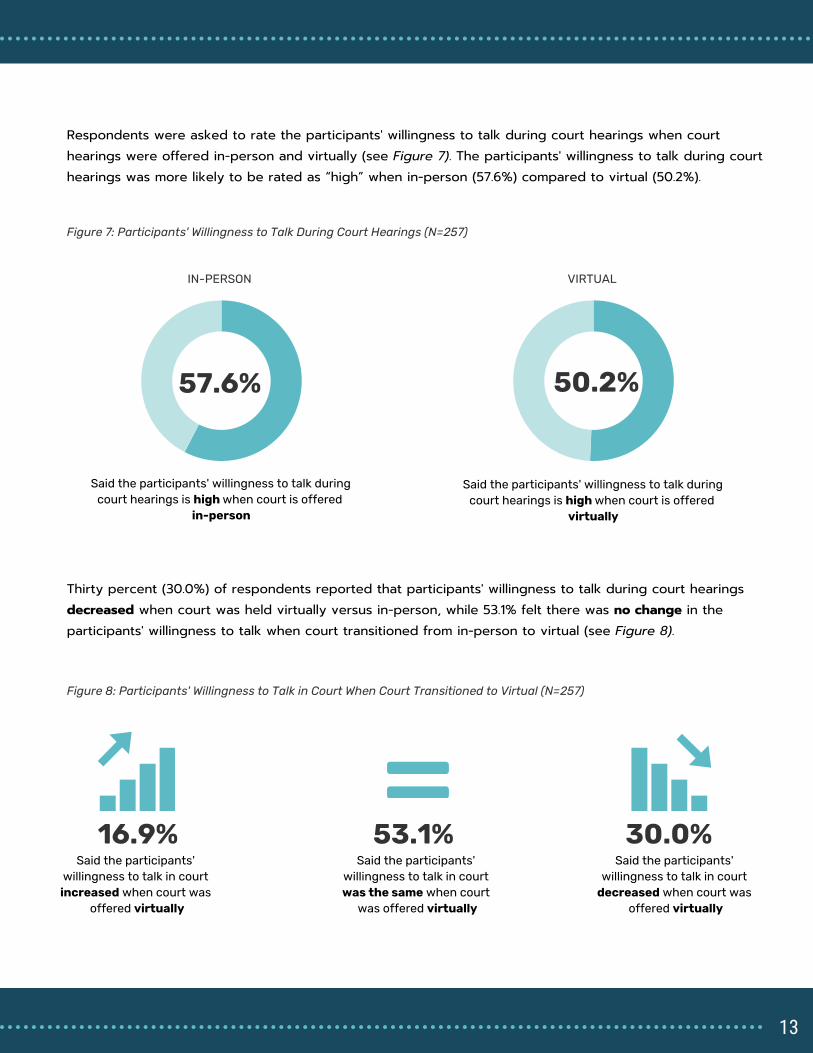
Respondents were asked to rate the participants' willingness to talk during court hearings when court hearings were offered in-person and virtually (see Figure 7). The participants' willingness to talk during court hearings was more likely to be rated as “high” when in-person (57.6%) compared to virtual (50.2%).
Said the participants' willingness to talk during
court hearings is high when court is offered
in-person
57.6%
Said the participants' willingness to talk during
court hearings is high when court is offered
virtually
50.2%
VIRTUALIN-PERSON
Figure 7: Participants' Willingness to Talk During Court Hearings (N=257)
16.9% 30.0%
Said the participants'
willingness to talk in court
increased when court was
offered virtually
Said the participants'
willingness to talk in court
decreased when court was
offered virtually
Thirty percent (30.0%) of respondents reported that participants' willingness to talk during court hearings decreased when court was held virtually versus in-person, while 53.1% felt there was no change in the participants' willingness to talk when court transitioned from in-person to virtual (see Figure 8).
Figure 8: Participants' Willingness to Talk in Court When Court Transitioned to Virtual (N=257)
53.1%
Said the participants'
willingness to talk in court
was the same when court
was offered virtually
13

Respondents were also asked about attendance when court hearings were offered in-person and virtually (see Figure 9). Attendance was more likely to be rated as “high” when court was held in-person (75.7%) compared to virtual (72.8%).
Said attendance in court is high when court is
offered in-person
75.7%
Said attendance in court is high when court is
offered virtually
72.8%
VIRTUALIN-PERSON
Figure 9: Attendance Rate in Court (N=257)
Respondents were asked to rank participants' engagement based on how they connected to virtual court hearings (see Figure 10). Engagement was more likely to be rated as “high” when participants connected to court hearings using audio and video (34.8%) versus audio only (20.7%).
Said participants' engagement is high
when participants connect to court
hearings using audio and video
Said participants' engagement is high
when participants connect to court
hearings using only audio
Figure 10: Engagement in Court Based on Technology Used (N=257)
34.8% 20.7%
14

47.2%
Figure 11: Support for Continuing Virtual Court Hearings (N=257)
Support for continuing virtual court hearings was ranked “high” among 47.2% of respondents (“average” and “low” support among respondents was 37.8% and 15.0%, respectively) (see Figure 11).
31.4%
in-person
Figure 12: Method of Conducting Pre-court Staffings in
November and December 2020 (N=277)
60.6%
virtually
7.9%
half the time in-person and half the
time virtually
As of November and December 2020, 31.4% of judicially led diversion programs reported they were holding pre-court staffings in-person (14.1% in-person only; 17.3% usually in-person, rarely virtual), 7.9% of staffings were held half in-person and half virtually, and 60.6% were holding pre-court staffings virtually (7.2% usually virtual, rarely in-person; 53.4% virtual only) (see Figure 12).
have a high level of support
for continuing virtual court
hearings
Each program is counted only once in the figure above, even when there
were multiple respondents for a single program. Twenty-one programs did
not provide a response to this question, don't hold staffings, or were not
currently holding staffings.
15

Respondents who regularly attended pre-court staffings were asked a series of questions about their experiences of in-person and virtual pre-court staffings. Respondents were first asked to rate the quality of information exchanged when pre-court staffings were held in-person and virtually (see Figure 13). The quality of information exchanged in pre-court staffings was more likely to be rated as “high” when they were conducted in-person compared to virtual (86.2% vs. 70.4%).
Said the quality of information exchanged is
high when pre-court staffings are held
in-person
86.2%
Said the quality of information exchanged is
high when pre-court staffings are held
virtually
70.4%
VIRTUAL
IN-PERSON
Figure 13: Quality of Information Exchanged in Pre-court Staffings (N=283)
2.5% 19.4%
Said the quality of
information exchanged
increased when pre-court
staffings were offered
virtually
Said the quality of
information decreased when
pre-court staffings were
offered virtually
Nineteen percent (19.4%) of respondents reported the quality of information exchanged decreased when pre-court staffings were held virtually versus in-person, while 78.1% felt there was no change in the quality of information when pre-court staffings transitioned from in-person to virtual (see Figure 14).
Figure 14: Quality of Information Exchanged When Pre-court Staffings Transitioned to Virtual (N=257)
78.1%
Said the quality of
information exchanged was
the same when pre-court
staffings were offered
virtually
16

Respondents were asked to rate the efficiency of staffing when pre-court staffings were held in-person and virtually (see Figure 15). The efficiency of staffing was more likely to be rated as “high” when in-person (75.8%) compared to virtual (64.8%).
Said the efficiency of staffing is high when
pre-court staffings are held in-person
75.8%
Said the efficiency of staffing is high when
pre-court staffings are held virtually
64.8%
VIRTUALIN-PERSON
Figure 15: Efficiency of Pre-court Staffings (N=285)
9.5% 22.8%
Said the efficiency of pre-
court staffings increased
when pre-court staffings
were offered virtually
Said the efficiency of pre-
court staffings decreased
when pre-court staffings
were offered virtually
Twenty-three percent (22.8%) of respondents reported the efficiency decreased when pre-court staffings were held virtually versus in-person, while 67.7% felt there was no change in efficiency when staffings transitioned from in-person to virtual (see Figure 16).
Figure 16: Efficiency of Pre-court Staffings When Staffings Transitioned to Virtual (N=257)
67.7%
Said the efficiency of pre-
court staffings was the
same when pre-court
staffings were offered
virtually
17
63.0%
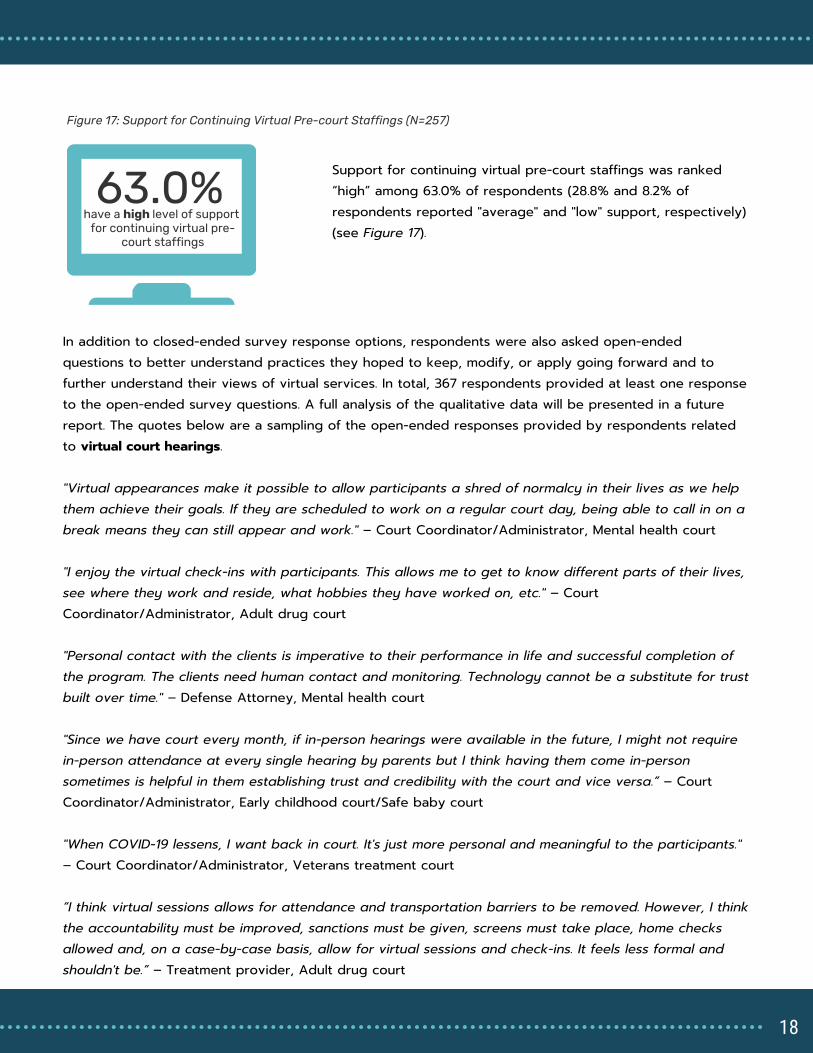
Figure 17: Support for Continuing Virtual Pre-court Staffings (N=257)
Support for continuing virtual pre-court staffings was ranked “high” among 63.0% of respondents (28.8% and 8.2% of respondents reported "average" and "low" support, respectively) (see Figure 17).
have a high level of support
for continuing virtual pre-
court staffings
In addition to closed-ended survey response options, respondents were also asked open-endedquestions to better understand practices they hoped to keep, modify, or apply going forward and to further understand their views of virtual services. In total, 367 respondents provided at least one response to the open-ended survey questions. A full analysis of the qualitative data will be presented in a future report. The quotes below are a sampling of the open-ended responses provided by respondents related to virtual court hearings. "Virtual appearances make it possible to allow participants a shred of normalcy in their lives as we help them achieve their goals. If they are scheduled to work on a regular court day, being able to call in on a break means they can still appear and work." – Court Coordinator/Administrator, Mental health court "I enjoy the virtual check-ins with participants. This allows me to get to know different parts of their lives, see where they work and reside, what hobbies they have worked on, etc." – Court Coordinator/Administrator, Adult drug court "Personal contact with the clients is imperative to their performance in life and successful completion of the program. The clients need human contact and monitoring. Technology cannot be a substitute for trust built over time." – Defense Attorney, Mental health court "Since we have court every month, if in-person hearings were available in the future, I might not require in-person attendance at every single hearing by parents but I think having them come in-person sometimes is helpful in them establishing trust and credibility with the court and vice versa.” – Court Coordinator/Administrator, Early childhood court/Safe baby court "When COVID-19 lessens, I want back in court. It's just more personal and meaningful to the participants." – Court Coordinator/Administrator, Veterans treatment court “I think virtual sessions allows for attendance and transportation barriers to be removed. However, I think the accountability must be improved, sanctions must be given, screens must take place, home checks allowed and, on a case-by-case basis, allow for virtual sessions and check-ins. It feels less formal and shouldn't be.” – Treatment provider, Adult drug court
18

The quotes below are a sampling of the open-ended responses provided by respondents related to virtual pre-court staffing. “The modern application of technology enabling virtual meetings is valuable to streamlining communications, increasing productivity, and reducing unnecessary travel.” – Probation/Parole Officer, Adult drug court “I would like the staffing to be open to use a virtual option as all staff members' input is valuable but understanding that staff may be needed elsewhere for needs or their agencies may not allow them to attend in-person for quite some time due to COVID-19." – Court Coordinator/Administrator, Family dependency drug court "Virtual staff meetings are a benefit to me because I have ready access to my database when additional questions are asked. Unfortunately, sometimes other team members are distracted because other business is going on in their offices during our staff meetings." – Court Coordinator/Administrator, Adult drug court "The opportunity to hold pre-court staffing virtually has allowed for greater participation by partner agencies. Moving forward, this is an area we will continue as it reduces travel time for our agency partners. Additionally, the option to attend court virtually has allowed participants who reside in and out of town residential placement to attend and we can see the benefit even without the pandemic." – Court Coordinator/Administrator, Adult drug court "Virtual staffing meetings have been very helpful. They allow me to have access to more information (at my computer) than if I am in a conference room stuck with just paper files." – Prosecutor, Adult drug court
19

Problem-solving courts and other judicially led diversion programs collaborate with behavioral health and recovery support service providers to connect court participants with needed treatment and services. Prior to COVID-19, providers typically conducted clinical assessments in-person to determine program eligibility and determine treatment needs.
Figure 18: Method of Conducting Clinical Assessments in
November and December 2020 (N=54)
Treatment respondents who conducted clinical assessments were asked how these assessments are taking place. As of November and December 2020, 38.9% of programs reported they were conducting clinical assessments in-person (14.8% in-person only; 24.1% usually in-person, rarely virtual), 25.9% were conducting clinical assessments half in-person and half virtually, and 35.2% were conducting clinical assessments virtually (7.4% usually virtual, rarely in-person; 27.8% virtual only) (see Figure 18).
38.9%
in-person
35.2%
virtually
25.9%
about half the time in-
person and half the time
virtually
Treatment and Recovery Support Services
Each program is counted only once in the figure above, even when
there were multiple respondents for a single program. The majority
of the survey respondents were not part of the assessment process
and did not provide responses for this portion of the survey.
20
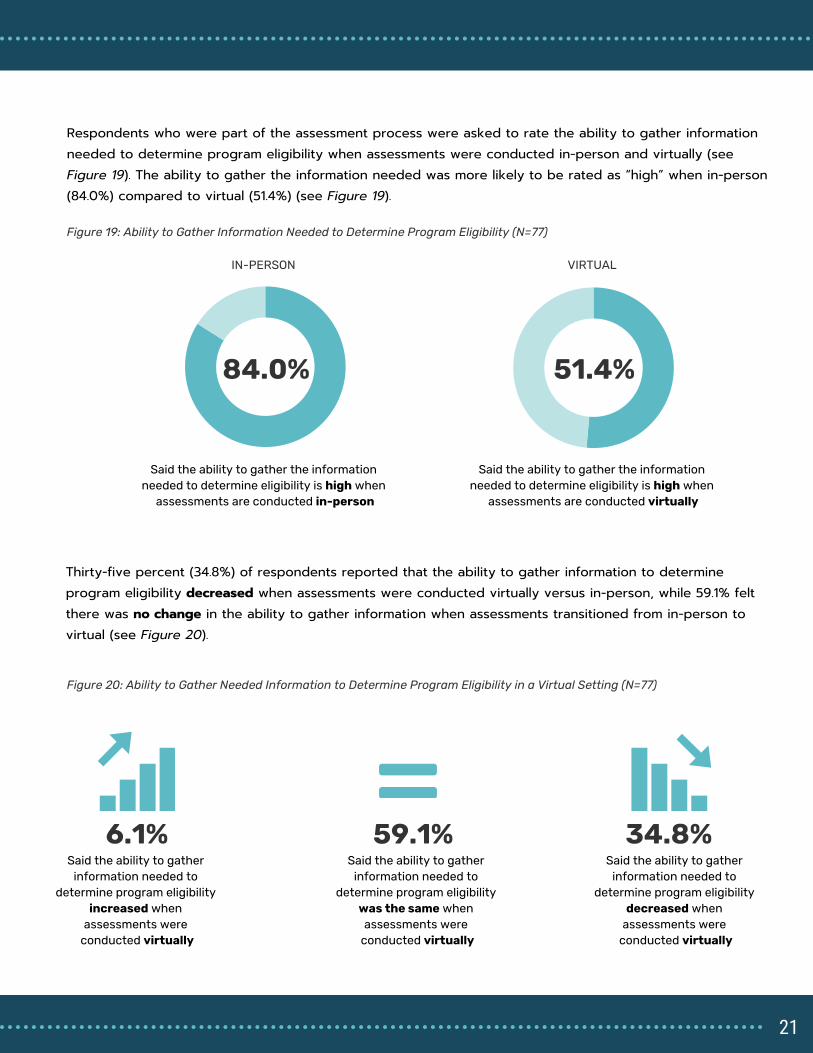
Respondents who were part of the assessment process were asked to rate the ability to gather information needed to determine program eligibility when assessments were conducted in-person and virtually (see Figure 19). The ability to gather the information needed was more likely to be rated as “high” when in-person (84.0%) compared to virtual (51.4%) (see Figure 19).
Said the ability to gather the information
needed to determine eligibility is high when
assessments are conducted in-person
84.0%
Said the ability to gather the information
needed to determine eligibility is high when
assessments are conducted virtually
51.4%
VIRTUALIN-PERSON
Figure 19: Ability to Gather Information Needed to Determine Program Eligibility (N=77)
6.1% 34.8%
Said the ability to gather
information needed to
determine program eligibility
increased when
assessments were
conducted virtually
Said the ability to gather
information needed to
determine program eligibility
decreased when
assessments were
conducted virtually
Thirty-five percent (34.8%) of respondents reported that the ability to gather information to determine program eligibility decreased when assessments were conducted virtually versus in-person, while 59.1% felt there was no change in the ability to gather information when assessments transitioned from in-person to virtual (see Figure 20).
Figure 20: Ability to Gather Needed Information to Determine Program Eligibility in a Virtual Setting (N=77)
59.1%
Said the ability to gather
information needed to
determine program eligibility
was the same when
assessments were
conducted virtually
21

Treatment staff who conducted assessments were asked to rate the quality of clinical information gathered when assessments were conducted in-person and virtually (see Figure 21). The quality of the clinical information was more likely to be rated as “high” when gathered in-person (86.9%) compared to virtual (36.8%).
Said the quality of clinical information
gathered is high when assessments are
conducted in-person
86.9%
Said the quality of clinical information
gathered is high when assessments are
conducted virtually
36.8%
VIRTUALIN-PERSON
Figure 21: Quality of Clinical Information Gathered in Assessments (N=77)
3.0% 36.4%
Said the quality of clinical
information collected for
assessments increased
when assessments were
conducted virtually
Said the quality of clinical
information collected for
assessments decreased
when assessments were
conducted virtually
Thirty-six percent (36.4%) of treatment staff reported that the quality of clinical information decreased when assessments were conducted virtually versus in-person, while 60.6% felt there was no change in the quality of information gathered when assessments transitioned from in-person to virtual (see Figure 22).
Figure 22: Quality of Clinical Information Collected for Assessments in a Virtual Setting (N=77)
60.6%
Said the quality of clinical
information collected for
assessments was the same
when assessments were
conducted virtually
22
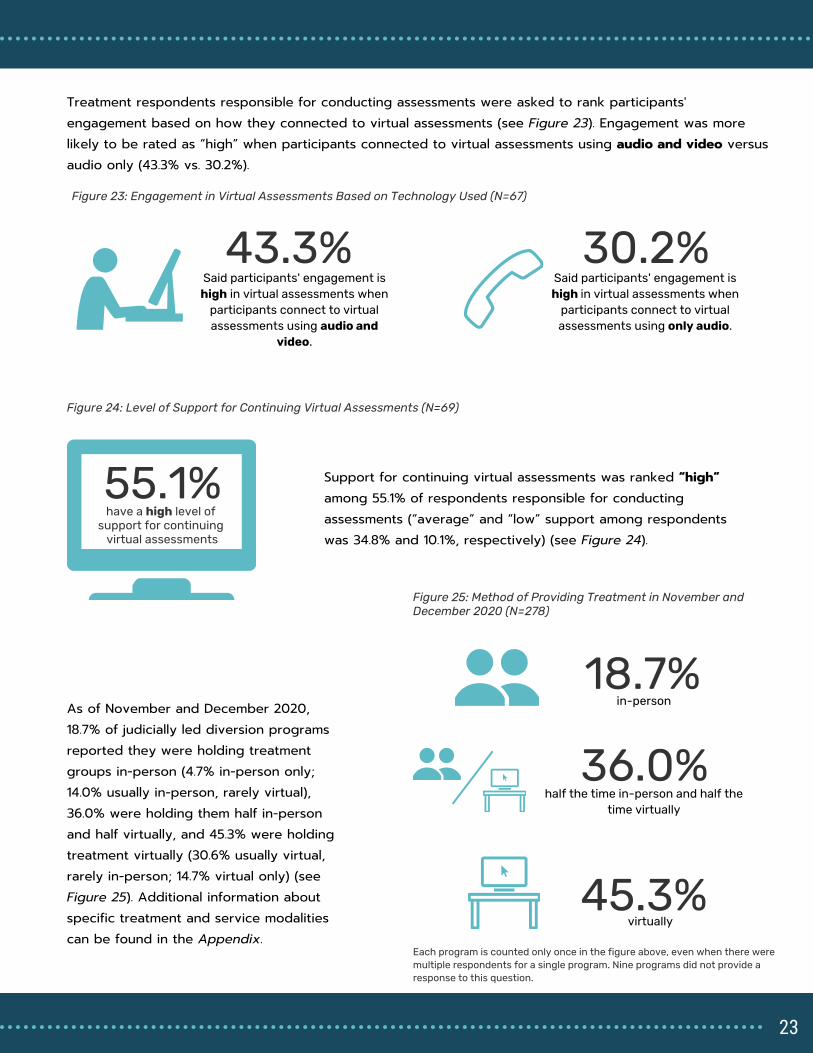
Treatment respondents responsible for conducting assessments were asked to rank participants' engagement based on how they connected to virtual assessments (see Figure 23). Engagement was more likely to be rated as “high” when participants connected to virtual assessments using audio and video versus audio only (43.3% vs. 30.2%).
30.2%
Said participants' engagement is
high in virtual assessments when
participants connect to virtual
assessments using only audio.
55.1%
Figure 23: Engagement in Virtual Assessments Based on Technology Used (N=67)
Figure 24: Level of Support for Continuing Virtual Assessments (N=69)
43.3%
Said participants' engagement is
high in virtual assessments when
participants connect to virtual
assessments using audio and
video.
Support for continuing virtual assessments was ranked “high” among 55.1% of respondents responsible for conducting assessments (“average” and “low” support among respondents was 34.8% and 10.1%, respectively) (see Figure 24).
18.7%
in-person
Figure 25: Method of Providing Treatment in November and
December 2020 (N=278)
45.3%
virtually
36.0%
half the time in-person and half the
time virtually
As of November and December 2020, 18.7% of judicially led diversion programs reported they were holding treatment groups in-person (4.7% in-person only; 14.0% usually in-person, rarely virtual), 36.0% were holding them half in-person and half virtually, and 45.3% were holding treatment virtually (30.6% usually virtual, rarely in-person; 14.7% virtual only) (see Figure 25). Additional information about specific treatment and service modalities can be found in the Appendix.
have a high level of
support for continuing
virtual assessments
Each program is counted only once in the figure above, even when there were
multiple respondents for a single program. Nine programs did not provide a
response to this question.
23

Treatment respondents were asked to rate the treatment group facilitator's ability to build rapport when treatment was offered in-person and virtually (see Figure 26). The ability to build rapport was more likely to be rated as “high” when offered in-person (83.6%) compared to virtual (35.3%).
Said the treatment group facilitator's ability to
build rapport is high when treatment is
offered in-person
83.6%
Said the treatment group facilitator's ability to
build rapport is high when treatment is
offered virtually
35.3%
VIRTUALIN-PERSON
Figure 26: Facilitator's Ability to Build Rapport in Treatment Groups (N=111)
2.6% 51.7%
Said the ability of the
treatment group facilitator to
build rapport increased
when treatment was
conducted virtually
Said the ability of the
treatment group facilitator to
build rapport decreased
when treatment was
conducted virtually
Fifty-two percent (51.7%) of treatment respondents reported that the treatment group facilitator's ability to build rapport decreased when treatment was held virtually versus in-person, while 45.7% felt there was no change in the ability to build rapport when treatment transitioned from in-person to virtual (see Figure 27).
Figure 27: Ability of the Treatment Group Facilitator to Build Rapport in a Virtual Setting (N=111)
45.7%
Said the ability of the
treatment group facilitator to
build rapport was the same
when treatment was
conducted virtually
24

Treatment respondents were asked to rate the participants' willingness to be forthcoming in group discussions when treatment was conducted in-person and virtually (see Figure 28). The respondents were more likely to rate the willingness of participants to be forthcoming in group discussions as “high” when in-person (67.6%) compared to virtual (30.8%).
Said participants' willingness to be
forthcoming in group discussions is high
when treatment is conducted in-person
67.6%
Said participants' willingness to be
forthcoming in group discussions is high
when treatment is conducted virtually
30.8%
VIRTUALIN-PERSON
Figure 28: Participants' Willingness to be Forthcoming in Group Discussions (N=111)
5.7%
51.0%
Said the participants'
willingness to be
forthcoming in group
discussions increased when
treatment was conducted
virtually
Said the participants'
willingness to be
forthcoming in group
discussions decreased
when treatment was
conducted virtually
Fifty-one percent (51.0%) of treatment respondents reported that the participants' willingness to be forthcoming in group discussions decreased when treatment was held virtually versus in-person, while 43.3% felt there was no change in the participants' willingness to be forthcoming in group discussions when treatment transitioned from in-person to virtual (see Figure 29).
Figure 29: Participants' Willingness to be Forthcoming in Group Discussions in a Virtual Setting (N=111)
43.3%
Said the participants'
willingness to be
forthcoming in group
discussions was the same
when treatment was
conducted virtually
25

Treatment respondents were asked to rate participants' engagement in treatment groups when groups were conducted in-person and virtually (see Figure 30). The level of participant engagement in treatment groups was more likely to be rated as “high” when treatment groups were offered in-person (70.6%) compared to virtual (30.6%).
Said participants' engagement in treatment
groups is high when treatment is conducted
in-person
70.6%
Said participants' engagement in treatment
groups is high when treatment is conducted
virtually
30.6%
VIRTUALIN-PERSON
Figure 30: Participants' Engagement in Group Discussions (N=111)
4.6% 50.9%
Said participants'
engagement in treatment
groups increased when
treatment was conducted
virtually
Said participants'
engagement in treatment
groups decreased when
treatment was conducted
virtually
Fifty-one percent (50.9%) of treatment respondents reported that engagement in group discussions decreased when treatment was held virtually versus in-person, while 44.4% felt there was no change in engagement in group discussions when treatment transitioned from in-person to virtual (see Figure 31).
Figure 31: Participants' Engagement in Treatment Groups in a Virtual Setting (N=108)
44.4%
Said participants'
engagement in treatment
groups was the same when
treatment was conducted
virtually
26

46.6%
Figure 32: Support for Continuing Virtual Treatment Groups (N=116)
Support for continuing virtual treatment groups was ranked “high” among 46.6% of treatment respondents (“average” and “low” support among respondents was 37.0% and 16.4%, respectively) (see Figure 32).
52.9%
do not believe maintaining
confidentiality in virtual treatment
groups has been a major issue
Figure 33: Confidentiality in Virtual Treatment Groups (N=121)
have a high level of
support for continuing
virtual treatment groups
Fifty-three percent (52.9%) of the treatment respondents did not believe maintaining confidentiality in virtual treatment groups has been a major issue for their agencies (see Figure 33).
The quotes below are a sampling of the open-ended responses provided by respondents related to virtual treatment. "I love doing virtual groups. It has provided people more opportunity to participate because they can remain at work and stop for their session, then return to work. I think individual sessions should be face-to-face in some capacity." – Treatment provider, Adult drug court “Virtual participation and intakes have had advantages for some clients, but in-person participation is also needed, especially for groups and individual treatment. An integrated combination of both tailored to individual needs is probably ideal.” – Treatment provider, Adult drug court “We hope to retain some capability for group and individual counseling as well as psychiatry and case management. For some of our client population we have seen increased engagement, attendance, and progress. It cannot be a one-size-fits-all approach as some other clients who do not respond well to telehealth started to disengage and had to be shifted to in-person services.” – Treatment provider, Mental health court “Virtual video visitation would be something I would like to remain, so children and parents can have more visits.”– Court Coordinator/Administrator, Early childhood court/Safe baby court
27

“I think the client's type of illness, functioning, and symptomology impacts how well they do virtually versus in-person for treatment. We have had to create decision trees to determine if audio, video, or in-person treatment is best for each client. Generally speaking, we find clients who participate in virtual appointments with video benefit and it can be less intimidating at times than in-person settings.” – Treatment provider, Mental health court “As with all things related to treatment, some participants respond better to virtual treatment and others prefer and respond better to in-person treatment services. Still others don't appear to have any preference at all between in-person and virtual. Virtual treatment options are a huge asset to remove transportation barriers to accessing and maintaining continuity of care.” – Treatment provider, Co-occurring court “Engagement is definitely improved with video capabilities. With video capabilities we can also better ensure the confidentiality of participants, and are able to use visual cues as to their demeanor, self-care, etc. However, the biggest obstacle has been that participants lack data on their phones and can't support both video and audio at the same time.” – Treatment provider, Veterans treatment court “Lack of technology is a big part of non-compliance at this time. It is also challenging for people to participate in a group while at home, as there are multiple distractions at home. We have no available sanctions to help incentivize people to participate.” – Treatment provider, Adult drug court “When we went all virtual, it impacted our clients tremendously considering they had been receiving all services in-person. Some relapsed and started to slide due to the missed face-to-face contact they were used to having. It seems to work better with at least a mixture of face-to-face and virtual services.” – Treatment provider, Adult drug court
28
Community Supervision
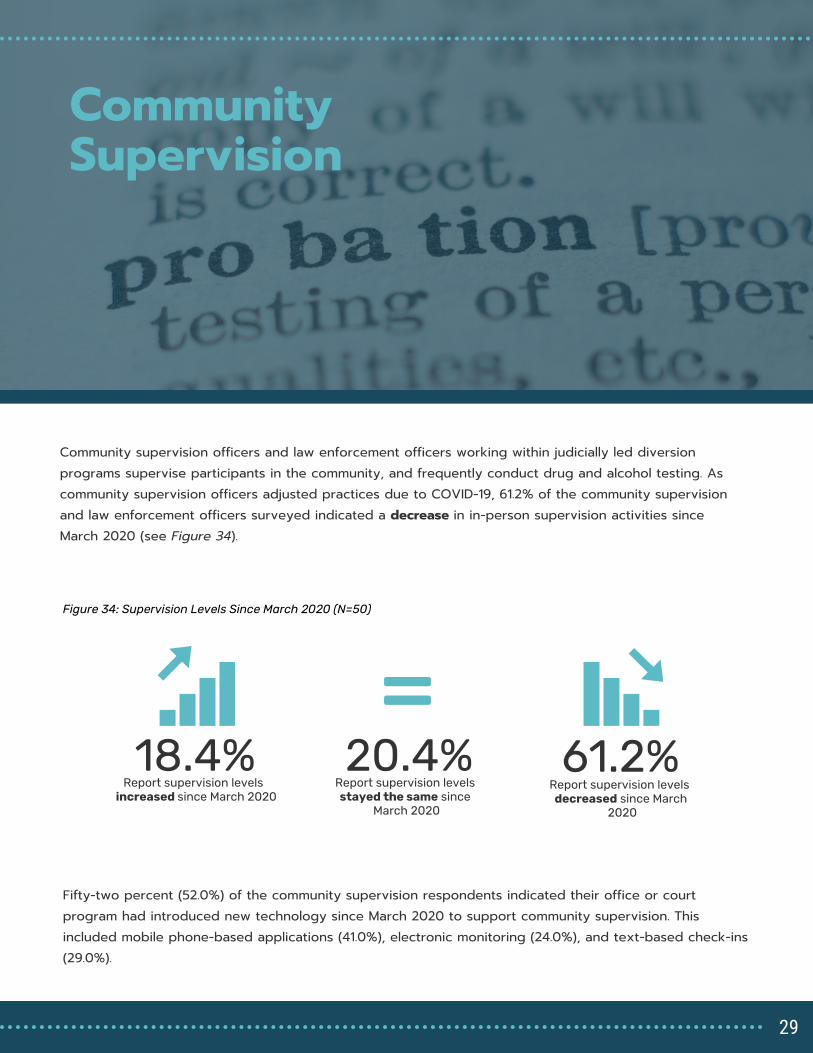
Community supervision officers and law enforcement officers working within judicially led diversion programs supervise participants in the community, and frequently conduct drug and alcohol testing. As community supervision officers adjusted practices due to COVID-19, 61.2% of the community supervision and law enforcement officers surveyed indicated a decrease in in-person supervision activities since March 2020 (see Figure 34).
Figure 34: Supervision Levels Since March 2020 (N=50)
Report supervision levels
increased since March 2020
18.4%
Report supervision levels
stayed the same since
March 2020
20.4%
Report supervision levels
decreased since March
2020
61.2%
Fifty-two percent (52.0%) of the community supervision respondents indicated their office or court program had introduced new technology since March 2020 to support community supervision. This included mobile phone-based applications (41.0%), electronic monitoring (24.0%), and text-based check-ins (29.0%).
29
All Majority Some Very Few
Not
conducted
In-person Supervision
O�ce-based supervision visits 13.0% 13.0% 17.4% 26.2% 30.4%
Home visits in-person 4.8% 23.8% 19.0% 14.3% 38.1%
Employment checks in-person 5.6% 0.0% 11.0% 27.8% 55.6%
Curfew checks in -person 16.7% 4.2% 12.5% 12.5% 54.1%
Virtual Supervision
Virtual home visits 44.4% 11.1% 5.6% 5.6% 33.3%
Virtual employment checks 6.7% 0.0% 26.7% 13.3% 53.3%
Virtual curfew checks 17.4% 17.4% 26.1% 17.4% 21.7%
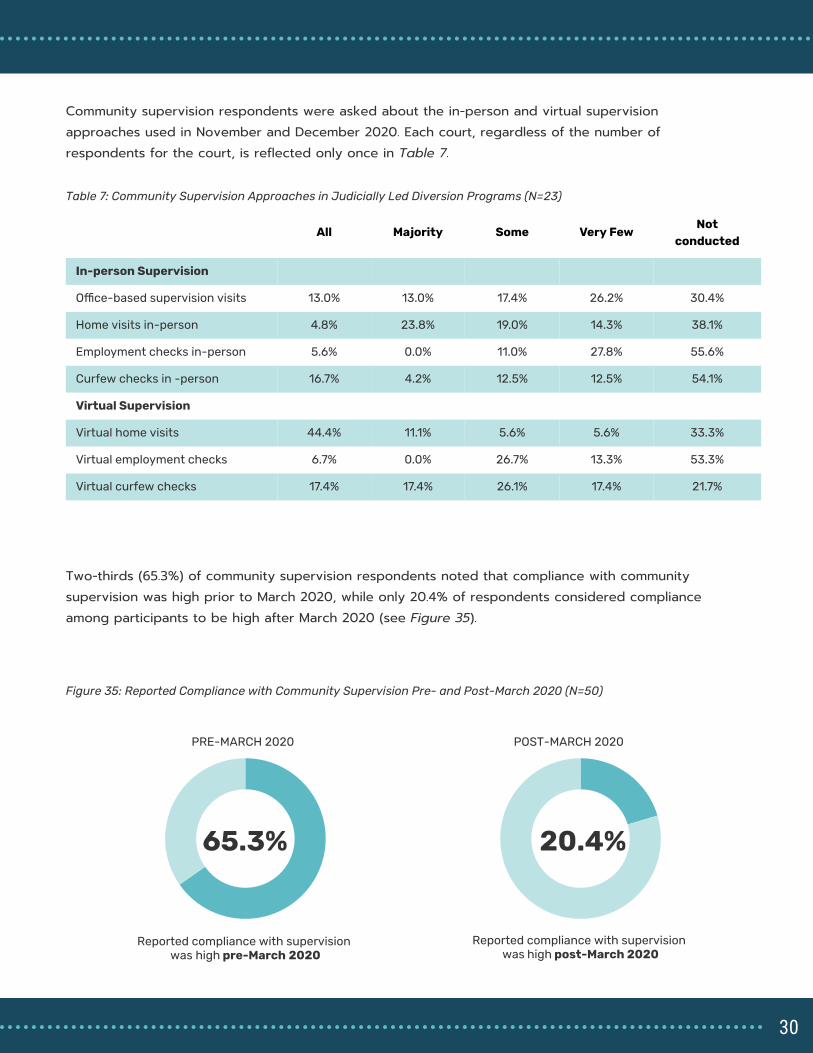
Table 7: Community Supervision Approaches in Judicially Led Diversion Programs (N=23)
Two-thirds (65.3%) of community supervision respondents noted that compliance with community supervision was high prior to March 2020, while only 20.4% of respondents considered compliance among participants to be high after March 2020 (see Figure 35).
Reported compliance with supervision
was high pre-March 2020
65.3%
PRE-MARCH 2020
20.4%
POST-MARCH 2020
Reported compliance with supervision
was high post-March 2020
Figure 35: Reported Compliance with Community Supervision Pre- and Post-March 2020 (N=50)
Community supervision respondents were asked about the in-person and virtual supervision approaches used in November and December 2020. Each court, regardless of the number of respondents for the court, is reflected only once in Table 7.
30
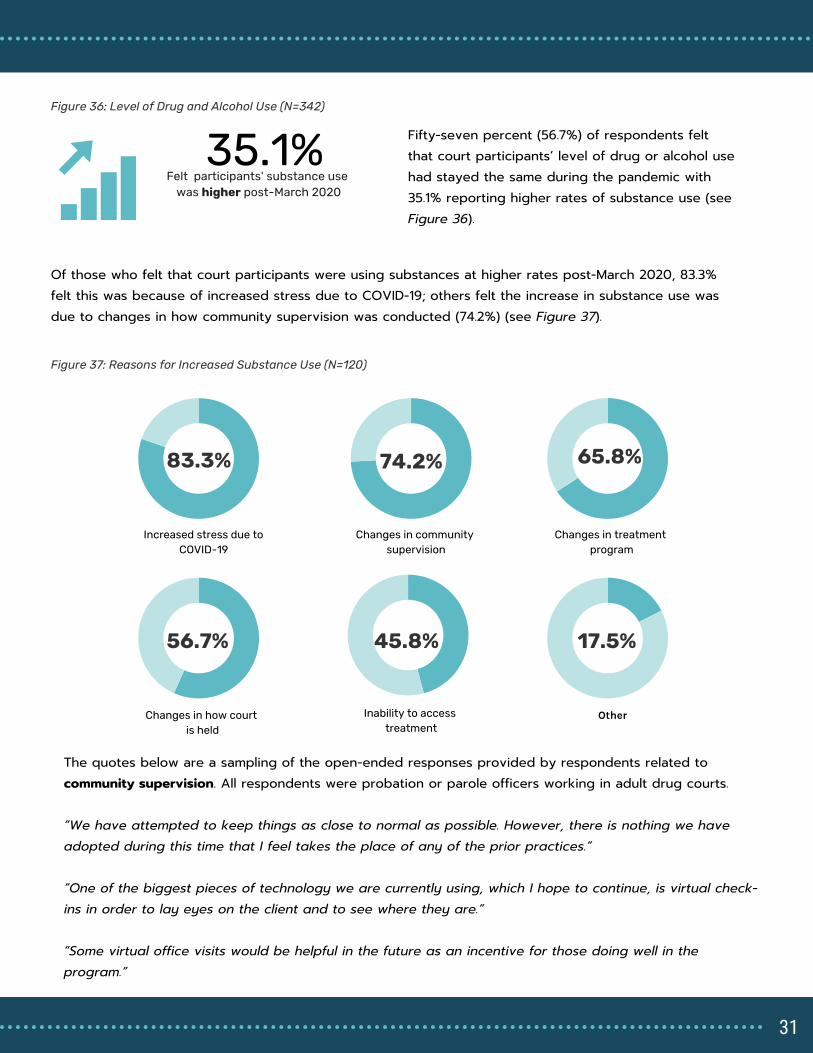
Fifty-seven percent (56.7%) of respondents felt that court participants’ level of drug or alcohol use had stayed the same during the pandemic with 35.1% reporting higher rates of substance use (see Figure 36).
83.3%
Increased stress due to
COVID-19
Changes in community
supervision
Changes in treatment
program
Changes in how court
is held
45.8%
Inability to access
treatment
Other
65.8%
74.2%
56.7% 17.5%
35.1%
Felt participants' substance use
was higher post-March 2020
Of those who felt that court participants were using substances at higher rates post-March 2020, 83.3% felt this was because of increased stress due to COVID-19; others felt the increase in substance use was due to changes in how community supervision was conducted (74.2%) (see Figure 37).
Figure 36: Level of Drug and Alcohol Use (N=342)
Figure 37: Reasons for Increased Substance Use (N=120)
The quotes below are a sampling of the open-ended responses provided by respondents related to community supervision. All respondents were probation or parole officers working in adult drug courts. “We have attempted to keep things as close to normal as possible. However, there is nothing we have adopted during this time that I feel takes the place of any of the prior practices.” “One of the biggest pieces of technology we are currently using, which I hope to continue, is virtual check-ins in order to lay eyes on the client and to see where they are.” “Some virtual office visits would be helpful in the future as an incentive for those doing well in the program.”
31
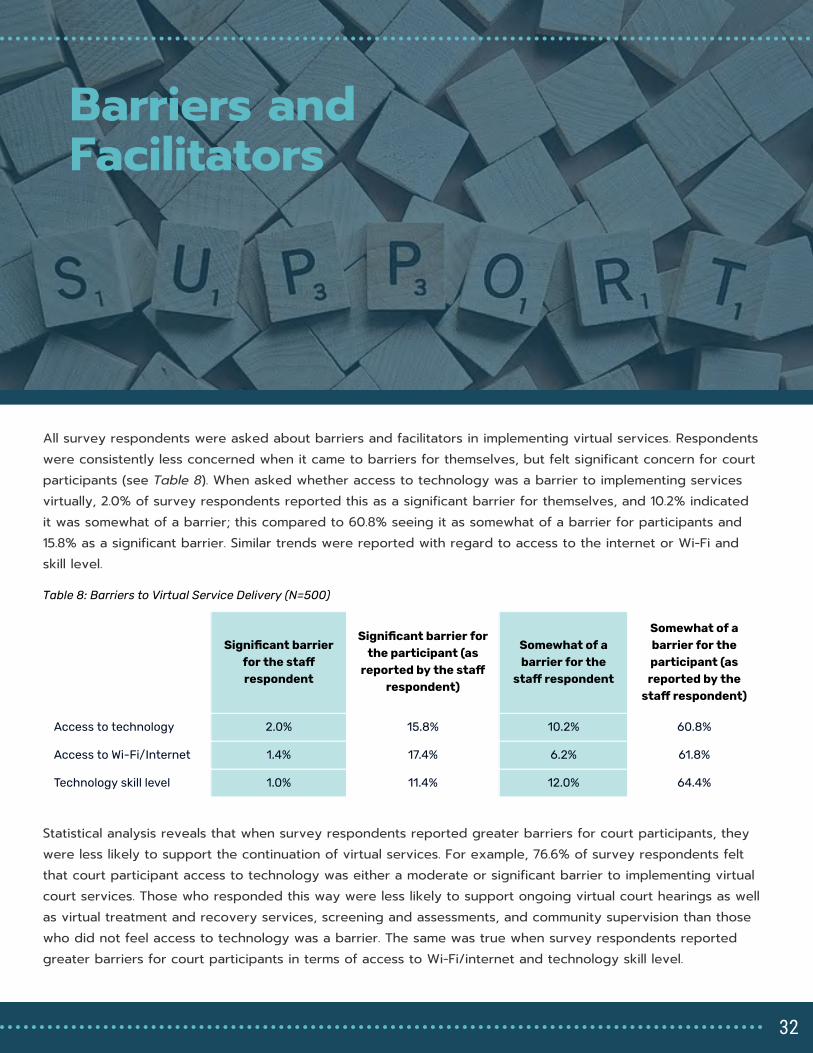
Barriers and Facilitators
All survey respondents were asked about barriers and facilitators in implementing virtual services. Respondents were consistently less concerned when it came to barriers for themselves, but felt significant concern for court participants (see Table 8). When asked whether access to technology was a barrier to implementing services virtually, 2.0% of survey respondents reported this as a significant barrier for themselves, and 10.2% indicated it was somewhat of a barrier; this compared to 60.8% seeing it as somewhat of a barrier for participants and 15.8% as a significant barrier. Similar trends were reported with regard to access to the internet or Wi-Fi and skill level.
Signi�cant barrier
for the sta�
respondent
Signi�cant barrier for
the participant (as
reported by the sta�
respondent)
Somewhat of a
barrier for the
sta� respondent
Somewhat of a
barrier for the
participant (as
reported by the
sta� respondent)
Access to technology 2.0% 15.8% 10.2% 60.8%
Access to Wi-Fi/Internet 1.4% 17.4% 6.2% 61.8%
Technology skill level 1.0% 11.4% 12.0% 64.4%
Table 8: Barriers to Virtual Service Delivery (N=500)
Statistical analysis reveals that when survey respondents reported greater barriers for court participants, they were less likely to support the continuation of virtual services. For example, 76.6% of survey respondents felt that court participant access to technology was either a moderate or significant barrier to implementing virtual court services. Those who responded this way were less likely to support ongoing virtual court hearings as well as virtual treatment and recovery services, screening and assessments, and community supervision than those who did not feel access to technology was a barrier. The same was true when survey respondents reported greater barriers for court participants in terms of access to Wi-Fi/internet and technology skill level.
32

Figure 38: Facilitators Supporting Virtual Court Services
Court programs that deliver services virtually were asked about factors that respondents might consider facilitators, or things that ease the implementation of virtual services. High levels of agency support facilitated the transition to virtual services as approximately two-thirds of respondents indicated they received moderate or strong support in the provision of and training for the necessary equipment and software, policy and practice guidance from the leadership, and buy-in from other justice agencies (see Figure 38).
With regard to facilitators, respondents who felt they received the necessary equipment and software to conduct services virtually were more likely than those who did not receive this support to favor the continuation of virtual court hearings, staff meetings, treatment and recovery services, and community supervision.
58.3%
44.8%
50.5%
56.5%
11.5%
18.1%
13.1%
9.4%
30.2%
37.1%
36.4%
34.1%
No support Moderate support Strong support
The provision of the necessary equipment
and software to go virtual (N=314)
Training on how to use the
equipment/software in order to go virtual
(N=310)
Policy and practice guidance from the
leadership within my court on how to go
virtual (N=313)
Buy-in and cooperation from other justice
agencies in my community to go virtual
(N=276)
33

Next Steps
In February 2021, a survey designed to collect feedback from court participants will be deployed nationally to further contribute to the preliminary findings in this report focused on feedback from practitioners. The participant survey will collect information related to the following areas:
Experiences with virtual court and treatment groupsBarriers and facilitators to participating in virtual servicesSupport for continued virtual or hybrid service modelsExperiences during the pandemic
In January 2021, a pilot participant survey was deployed in a drug court located in a suburban community in Virginia. The pilot survey helped to validate the concepts in the survey and ensure the survey could be successfully deployed electronically. Thirteen participants completed the survey for a response rate of 68.4%. The authors would like to thank the drug court administrator and the respondents for supporting the pilot participant survey. Data collection from participants will conclude in mid-April 2021. If you are interested in participating in data collection, please contact Tara Kunkel at [email protected] or Kristina Bryant at [email protected].
34

Conclusions
Based on the preliminary survey findings highlighted in this report, judicially led diversion programs have reduced in-person interactions and incorporated virtual services in some capacity in response to the COVID-19 pandemic. However, there was mixed support for continuing virtual delivery of services. The strongest support was for virtual pre-court staffings, with respondents rating virtual staffings as effective as in-person. There was also support for continuing virtual court hearings, but concern was expressed about the ability of judges to build rapport with court participants. Further analysis noted if a judge was able to develop rapport in-person, they were also able to do so virtually. Treatment and supervision received less support to be continued virtually as there were significant concerns around participant engagement and treatment effectiveness. Court team members reported few barriers for themselves toward implementing virtual services; however, there was notable concern about barriers for the court participants that included access to technology, Wi-Fi, skills, and physical space to use virtual services. Importantly, those who reported high barriers for participants were less likely to support the continued use of virtual services. Additionally, those who felt they were provided with the necessary equipment and software to deliver the services virtually were more likely to support continuing virtual court hearings, staffings, and treatment and recovery services. Research on telehealth has demonstrated increased access to care, high levels of satisfaction among patients and providers for a variety of services (3,4), and is comparable to in-person care (5). The implementation of telehealth services in correctional settings has been found to improve behavioral health services for people incarcerated with little additional cost (6), and prior research in drug treatment courts show virtual services can improve access to resources, particularly in rural areas (7). However, this
35
research is reflective of the use of virtual services prior to the onset of the COVID-19 pandemic, when it served as a supplement, not a replacement, to in-person interactions. Research will be needed to determine whether concerns are related to the efficacy of virtual delivery, equity in access to the technology required to use virtual services, or both. Research is also needed to determine the effectiveness of these practices in a post-pandemic environment. And finally, it is also critical to understand the views of the court participants themselves.
36

References
37

References
1. National Institute of Justice: Problem-Solving Courts, 2020.Available from: https://nij.ojp.gov/topics/articles/problem-solving-courts
2. Strong SM, Rantala R, Kyckelhahn T: Census of Problem-Solving Courts, 2012. U.S. Department of Justice, Office of Justice Programs, Bureau of Justice Statistics, 2016. Available from: https://www.bjs.gov/content/pub/pdf/cpsc12.pdf
3. Hilty DM, Marks SL, Urness D, et al.: Clinical and educational telepsychiatry applications: a review. Can J Psychiatry 49: 12–23, 2004.
4. Hubley S, Lynch SB, Schneck C, et al.: Review of key telepsychiatry outcomes. World J Psychiatry 6: 269–282, 2016.
5. Hilty DM, Ferrer DC, Parish MB, et al.: The Effectiveness of Telemental Health: A 2013 Review. Telemedicine and e-Health 19: 444–454, 2013.
6. Telepsychiatry in Correctional Facilities: Using Technology to Improve Access and Decrease Costs of Mental Health Care in Underserved Populations. Available from: https://www.ncbi.nlm.nih.gov/pmc/articles/PMC3783076/
7. Schachar A, Arnold A, Benally P: The Future is Now: Enhancing Drug Court Operations Through Technology | Center for Court Innovation. Bureau of Justice Assistance, U.S. Department of Justice, 2015 [cited 2020 Dec 22]. Available from: https://www.courtinnovation.org/publications/future-now-enhancing-drug-court-operations-through-technology
8. Edge C, Black G, King E, et al.: Improving care quality with prison telemedicine: The effects of context and multiplicity on successful implementation and use. J Telemed Telecare 1357633X19869131, 2019.
38

Appendix
39
Additional Data
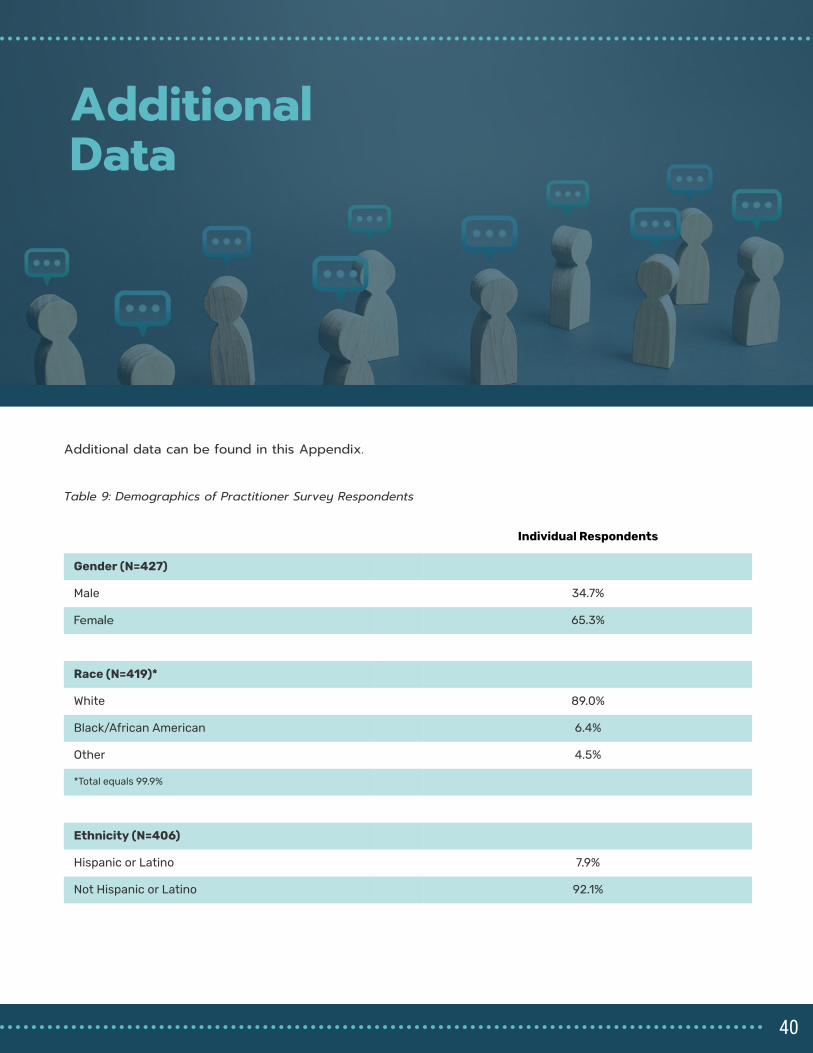
The survey collected information from judges, treatment providers and community supervision officers working directly in a local or regional problem-solving court, specialty court or other judicially-led diversion programs.
Individual Respondents
Gender (N=427)
Male 34.7%
Female 65.3%
Race (N=419)*
White 89.0%
Black/African American 6.4%
Other 4.5%
*Total equals 99.9%
Ethnicity (N=406)
Hispanic or Latino 7.9%
Not Hispanic or Latino 92.1%
Additional data can be found in this Appendix.
Table 9: Demographics of Practitioner Survey Respondents
40
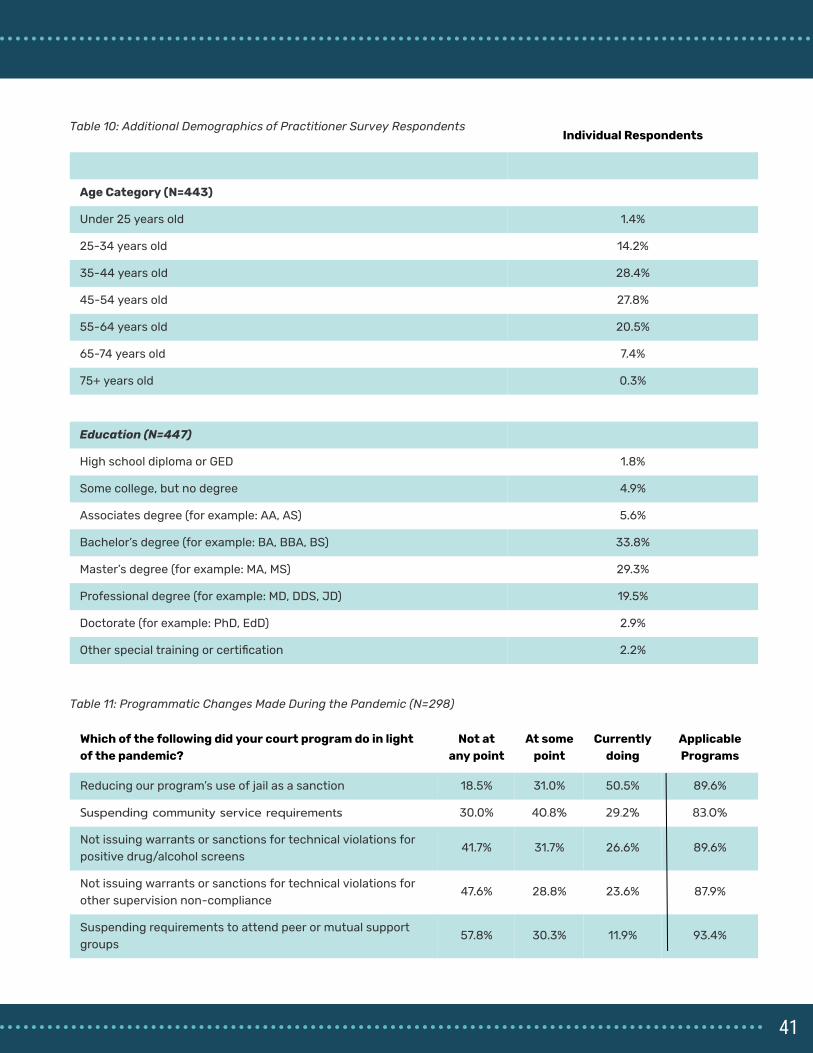
Individual Respondents
Age Category (N=443)
Under 25 years old 1.4%
25-34 years old 14.2%
35-44 years old 28.4%
45-54 years old 27.8%
55-64 years old 20.5%
65-74 years old 7.4%
75+ years old 0.3%
Education (N=447)
High school diploma or GED 1.8%
Some college, but no degree 4.9%
Associates degree (for example: AA, AS) 5.6%
Bachelor’s degree (for example: BA, BBA, BS) 33.8%
Master’s degree (for example: MA, MS) 29.3%
Professional degree (for example: MD, DDS, JD) 19.5%
Doctorate (for example: PhD, EdD) 2.9%
Other special training or certi�cation 2.2%
Table 10: Additional Demographics of Practitioner Survey Respondents
Which of the following did your court program do in light
of the pandemic?
Not at
any point
At some
point
Currently
doing
Applicable
Programs
Reducing our program’s use of jail as a sanction 18.5% 31.0% 50.5% 89.6%
Suspending community service requirements 30.0% 40.8% 29.2% 83.0%
Not issuing warrants or sanctions for technical violations for
positive drug/alcohol screens
41.7% 31.7% 26.6% 89.6%
Not issuing warrants or sanctions for technical violations for
other supervision non-compliance
47.6% 28.8% 23.6% 87.9%
Suspending requirements to attend peer or mutual support
groups
57.8% 30.3% 11.9% 93.4%
Table 11: Programmatic Changes Made During the Pandemic (N=298)
41

Which of the following did your court program do in
light of the pandemic?
Not at any
point
At some
point
Currently
doing
Applicable
Programs
Waiving or suspending program fees 63.0% 19.5% 17.5% 53.3%
Waiving or suspending supervision fees 79.0% 7.5% 13.5% 46.0%
Waiving or suspending treatment fees 76.9% 11.2% 11.9% 46.4%
Suspending restitution payments 82.5% 10.3% 7.2% 63.7%
Reducing requirements for program completion 82.5% 10.3% 7.2% 91.0%
Reducing the program length 94.8% 2.8% 2.4% 86.9%
Table 12: Financial and Programmatic Changes Made During the Pandemic (N=298)
Treatment and Recovery Support Services In-person Virtual
Outpatient substance abuse treatment (N=38) 57.9% 42.1%
Mental health treatment (N=34) 61.8% 38.2%
Peer recovery support services (N=32) 71.9% 28.1%
Medication assisted treatment (N=25) 56.0% 44.0%
Parenting and family strengthening programs (N=34) 61.8% 38.2%
Family navigation and supportive services (N=35) 71.4% 28.6%
Clinical case management (N=36) 63.9% 36.1%
Psychiatric services (N=36) 52.8% 47.2%
Cognitive-behavioral treatment (e.g., Thinking for a
Change, MRT) (N=27)
51.9% 48.1%
Trauma-speci�c services (N=36) 46.2% 53.8%
Table 13: Treatment and Recovery Support Services by Delivery Method
Table 13 is based on the count of unique court programs. For each practice examined, a single response per court was counted. Responses of "Offered in-person" and "Offered primarily in-person and rarely virtually" were included "In-person." Responses of "Offered primarily virtually and rarely in-person," and "Offered about half of the time in person, half of the time virtually" were included in "Virtual." It is important to note that some services were not used by particular programs prior to March 2020 or since which is why the number of responses changes for each service.
42
