adriana kroenke , victoriana rubiales caballero bianca ... · adriana kroenke, victoriana rubiales...
TRANSCRIPT
�
�
“main” — 2018/7/9 — 19:35 — page 215 — #1�
�
�
�
�
�
Pesquisa Operacional (2018) 38(2): 215-246© 2018 Brazilian Operations Research SocietyPrinted version ISSN 0101-7438 / Online version ISSN 1678-5142www.scielo.br/popedoi: 10.1590/0101-7438.2018.038.02.0215
SCALAR AND VECTOR GAMES IN THE EVALUATIONOF SOCIAL AND ENVIRONMENTAL DISCLOSURE AND THEIR
RELATIONSHIP WITH MARKET VALUE
Adriana Kroenke1*, Victoriana Rubiales Caballero2,Bianca Cecon3 and Nelson Hein1
Received November 7, 2017 / Accepted March 17, 2018
ABSTRACT. This study evaluated the association of social, environmental and socio-environmental dis-
closure with the market value of Brazilian companies with high environmental impact based on the Game
Theory. To perform the analysis, rankings were developed by using scalar and vector gaming techniques.
After the construction of the rankings, the association between them was verified through Kendall’s correla-
tion analysis. The findings indicate a positive association of social, environmental and socio-environmental
disclosure with the market value of Brazilian companies with high environmental impact. In addition, there
was an increase in the degree of association during the investigated periods. This result suggests that the
market is increasingly demanding regarding the disclosure of this information, which indicates that the
disclosure of these information can bring competitive advantages in relation to the market value.
Keywords: socio-environmental disclosure, market value, game theory.
1 INTRODUCTION
Interest in socio-environmental issues has been growing significantly in recent years (Cintra,2011). Sousa, Silva, Ribeiro & Weffort (2014) emphasize that social and environmental disclo-sures have gained prominence due to the initiatives of national and international organizationsconcerned with social responsibility and due to the broad recognition of debates regarding sus-
tainability. However, according to Bauer & Naime (2012), the studies regarding this topic stillremain scarce in the Brazilian scenario, which encourages the conduction of new researches tobetter understand the field and to fill this research gap.
*Corresponding author.1Universidade Regional de Blumenau, Rua Antonio da Veiga, 140 – Itoupava Seca, 89030-903 Blumenau, SC, Brasil.Tel.: (47) 3321-0565 – E-mails: [email protected]; [email protected] de Sevilla, Departamento de Economia Aplicada III, C/S. Fernando, 4, C.P. 41004 – Sevilla, Espana.E-mail: [email protected] Federal do Parana, Centro Politecnico, 81531-980 Curitiba, PR, Brasil. E-mail: [email protected]
�
�
“main” — 2018/7/9 — 19:35 — page 216 — #2�
�
�
�
�
�
216 SCALAR AND VECTOR GAMES IN THE EVALUATION OF SOCIAL AND ENVIRONMENTAL DISCLOSURE
In light of voluntary disclosure by organizations, Dye (2001) states that there is a Theory of
Voluntary Disclosure. For the author, this theory has as its central premise that organizations willonly disclose information that is favorable to them and will not disclose information that is unfa-vorable. Therefore, if companies do not disclose some information, the market will consequently
interpret it as negative, because if it were positive, there would be no reason why companieswould hide such information (Dye, 1985; Salotti & Yamamot, 2005). Verrecchia (1983) alsopoints out that users may even think that the information not shown is positive, but they will
think at the same time that, because they have not been shown, they are not positive enough tocompensate costs.
According to Santos, Araujo & Leite Filho (2016) there have been advances, in developed cap-ital markets, in the investigations of topics related to the research of voluntary disclosure which
involve the relationship between voluntary disclosure and the market value of companies. How-ever, Uyar & Kilic (2012) mention that this is not the reality which is evidenced in researcheswith companies of emerging capital markets, since such relationship is still an unexplored topic.
In this sense, there is scope in this research gap regarding the association between voluntarydisclosure and market value in emerging market companies. In addition, the relevance of inves-tigating such association in the Brazilian context to the construction of scientific knowledge isemphasized, since Brazil is one of the emerging countries of the world (Murcia, 2009).
Thus, considering the current scenario in which external users of the organization are increasinglydemanding transparency from companies in relation to the socio-environmental issues they face(Sobhani, Amran & Zainuddin, 2009), the non-disclosure of this information may prejudice theimage of the company. This occurs because if the organization omits certain information, the
market can assume that the value of the same company is being overestimated, which can leadinvestors to sell their shares, and this consequently entails a lower market value for this companycompared to its competitors who disclose information (Dye, 1985).
In this context, considering that voluntary disclosure tends to be associated with the companies’market value, according to the conclusion of Dye (1985) in relation to Voluntary DisclosureTheory, this research seeks to evaluate the association between the disclosure of social, envi-ronmental and socio-environmental information, which are voluntary in the national context,
with the market value of the same companies, in order to verify empirical evidences relatedto such association.
In view of the research aspects presented in the literature and its previous results, this study seeksto answer the following research question: What is the association between socio-environmental
disclosure with the market value of Brazilian companies with high environmental impact? Inorder to answer the aforementioned research problem, the main goal which this research aims toachieve is to assess the association of socio-environmental disclosure with the market value of
Brazilian companies with a high environmental impact, through scalar and vector games, giventhe characteristics of the groups of indicators (social and environmental).
Pesquisa Operacional, Vol. 38(2), 2018

�
�
“main” — 2018/7/9 — 19:35 — page 217 — #3�
�
�
�
�
�
ADRIANA KROENKE, VICTORIANA RUBIALES CABALLERO, BIANCA CECON and NELSON HEIN 217
The measurement of the social, environmental, and socio-environmental disclosures and market
value make up the originality of the research and, similarly, its scientific contribution indeed.Non-triviality is achieved by the composition of the variables, sample and methods, as well asthe volume and extent of the analysis. In short, these elements of the scientific tripod account for
the impact and contribution to the area of operational research.
The uniqueness sought by this research arises from two contributions. The first one related tothe measurement of the market value of the organizations, using as metric the stock price. Thismetric was verified only in international studies that analyzed the association between the socio-
environmental disclosure and the market value of companies. There are no records of nationalstudies of this kind. The second one comes from the technique used in the process of companyranking according to the level of social, environmental and socio-environmental disclosure that,
for the lack of a better view, was not found in previous surveys. The results of the ranking of thecompanies according to social, environmental and socio-environmental disclosure were obtainedusing tools related to Game Theory. Specifically, scalar games (unicriteria) in the formation of
rankings of social and environmental disclosure and vector games (multicriteria) in the formationof rankings of socio-environmental disclosure.
The study is justified by the debate regarding the association of voluntary disclosure and the mar-ket value of companies. Currently there are two aspects, one argues that disclosure of voluntary
information adds value to the company, since it increases the competitive advantage of the orga-nization, taking the company to a higher market value than its competitors that do not discloseinformation. The other part argues that voluntary disclosure represents only an increase in coststo the organization and consequently results in a lower market value for the company, according
to Olayinka & Oluwamayowa (2014).
2 INFORMATION DISCLOSURE
The information disclosure can be interpreted as being the channel of information transmission
of the company to the market (Murcia, 2009). According to Healy & Palepu (2001) and Fran-cis, Nanda & Olsson (2008), the information disclosure is demanded by the market as a con-sequence of the informational asymmetry that occurs between internal users and external users
of the company, since internal users usually have more information about the organization thanexternal users.
According to Bushman & Smith (2001), the higher the level of disclosure of the company, thebetter the expectations of investors, customers, suppliers, consumers, government and society
in relation to the organization, which tends to value the company. In light of this competitiveadvantage, several companies that disclose information beyond what is done as a result of reg-ulation appear in the global scenario. Such disclosure is called voluntary disclosure and, unlike
the compulsory disclosure, it occurs on the part of the company even though there is no legalobligation (Yamamoto & Salotti, 2006).
Pesquisa Operacional, Vol. 38(2), 2018

�
�
“main” — 2018/7/9 — 19:35 — page 218 — #4�
�
�
�
�
�
218 SCALAR AND VECTOR GAMES IN THE EVALUATION OF SOCIAL AND ENVIRONMENTAL DISCLOSURE
According to Malacrida & Yamamoto (2006), the highest level of voluntary disclosure by com-
panies occurs due to the expectation of a positive repercussion of this information in the market,thus improving the financial situation of the company. Sousa, Silva, Ribeiro & Weffort (2014)point out that, at present, the voluntary disclosure occurs due to the organizations’ need to dif-
ferentiate themselves from the others which are in the market, in such a way that the disclosurecan provide decisions of the agents that maximize the value of the organization.
In the international context, the field of research that involves issues related to the disclosure ofvoluntary information of companies is relatively advanced (Healy & Palepu, 2001). It is possible
to verify several studies on this subject in countries such as: Balgadesh, France, Hong Kong,Japan, Malaysia, Mexico, the Czech Republic, Sweden and Switzerland (Murcia, 2009). Thefrequency of studies is incipient in capital markets in underdeveloped and emerging countries, as
is the case in Brazil. Lanzana (2004) confirms that in the national context, this field of researchstill remains scarce.
Regarding the disclosure made voluntarily by organizations, the highlight in the national contextis the disclosure of socio-environmental information. In Brazilian organizations, the disclosure
of social and environmental information is considered voluntary, since there are no rules regu-lating the disclosure of such issues. However, it is worth highlighting the strong recommenda-tions of the Brazilian Electricity Regulatory Agency – Agencia Nacional de Energia Eletrica in
Portuguese (ANEEL) – for companies that operate in the electricity sector to disclose certainsocio-environmental information (Rover, 2013).
For Santos, Araujo & Leite Filho (2016), the main justification for conducting research involvingsuch an association is due to the issue of being directly related to the fact that the manager
discloses information to stakeholders. According to Rover & Santos (2014), investigating thisissue contributes with the companies, as these can improve their issues regarding the disclosureof the findings of such association. In addition, if a higher market value were evidenced due
to the disclosure of socio-environmental information, this fact could encourage companies todisclose such information (Souza, 2013), which would contribute to reducing the problem ofinformational asymmetry in companies. Therefore, it is important to investigate the relationshipbetween socioenvironmental disclosure and its relevance to the capital market is important both
for the academic scope and for the users of the information (Rover, 2013).
At the national level, research that investigated the association between socio-environmentaldisclosure and market value has so far used only the binary form to measure disclosure. Giventhis issue, the present research seeks to innovate using the linear measurement form, as conducted
by Rover (2013) when investigating the relationship between the socio-environmental disclosureand the cost of equity of companies. This method of measurement is appropriate since it allowsto verify not only the quantity, but the quality of the information evidenced, as mentioned by
Cormier, Magnam & Val Velthoven (2005).
Pesquisa Operacional, Vol. 38(2), 2018
�
�
“main” — 2018/7/9 — 19:35 — page 219 — #5�
�
�
�
�
�
ADRIANA KROENKE, VICTORIANA RUBIALES CABALLERO, BIANCA CECON and NELSON HEIN 219
3 METHOD AND RESEARCH PROCEDURES
This section presents the method and procedures used in the study when achieving the proposedobjectives and is divided into four subdivisions. Initially, there is a discussion about the design
of the research in relation to the objective, procedure and approach of the problem. Next, thepopulation and the delimitation of the sample are highlighted. In the third section we present theresearch construct and the form of data collection. Finally, in the fourth section the procedures
used during data analysis are exposed.
3.1 Research Design
In relation to the research objective, the study is classified as descriptive once it evaluates theassociation of social disclosure with the market value of companies, of the environmental dis-
closure with the market value of companies and socio-environmental disclosure with the marketvalue of Brazilian companies with high environmental impact. Regarding the procedures, thestudy is characterized as documentary, since the data related to the socio-environmental disclo-
sure were collected from the following reports: sustainability report, annual report, standardizedfinancial statements, explanatory notes, independent auditor’s reports, fiscal council opinion,audit committee report and reference form, as well as data related to the market value of the
companies collected through the Economatica� database. Finally, in relation to the approach ofthe problem, the study is classified as predominantly quantitative, since it uses the techniques ofdescriptive statistics, scalar games, vector games and the ordinal correlation coefficient (Kendall)
to reach the proposed goal.
3.2 Population and Sample
The study population corresponds to the 48 companies in the areas of extraction and treatmentof minerals, to the metallurgical industry, to the paper and pulp industry, to the leather and furs
industry, to the chemical industry and to transport, terminals, warehouses and commerce com-panies of the Sao Paulo Stock Exchange (BM&FBovespa), which are defined as having a highenvironmental impact, according to Law No. 10.165, dated December 27, 2000. Four of these
were excluded because they were controlled by other companies in the sample, 5 were eliminatedbecause they were in judicial recovery during the analyzed period and 15 were excluded becausethey did not present all the necessary information for the calculation of the socio-environmental
disclosure index and market value. Thus, the sample consisted of 24 companies.
3.3 Research and Data Collection Construct
This section is structured in two subdivisions: the construct (of the research and data collection)of the level of social and environmental disclosure of companies and the construct (of research
and data collection) of the market value index. Such division is pertinent since such variableswere collected in different ways and sources.
Pesquisa Operacional, Vol. 38(2), 2018
�
�
“main” — 2018/7/9 — 19:35 — page 220 — #6�
�
�
�
�
�
220 SCALAR AND VECTOR GAMES IN THE EVALUATION OF SOCIAL AND ENVIRONMENTAL DISCLOSURE
3.3.1 Level of Social and Environmental Disclosure
The Rover metric (2013) was used in order to measure the level of social, environmental andsocio-environmental disclosure of the organizations of the sample. This metric was chosen be-cause its author is one of the main researchers on the topic of “socio-environmental disclosure”
in Brazil and she constructed the metric based on 20 relevant national and international studiesin the literature on the topic.
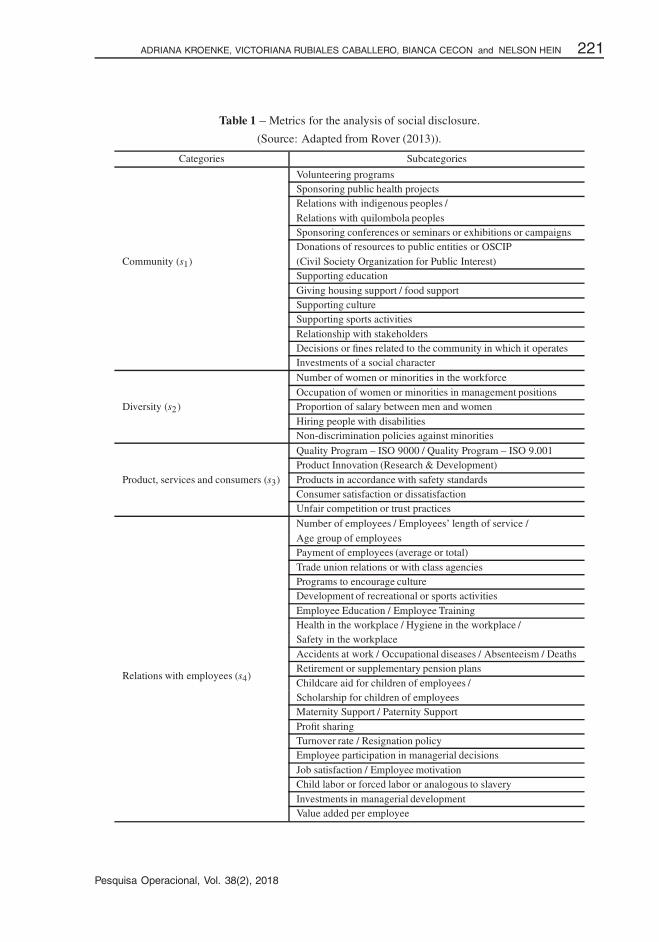
Table 1 shows the four social categories of the Rover metric (2013), with their respective socialsubcategories adapted to the data collection of the present research regarding the level of social
disclosure.
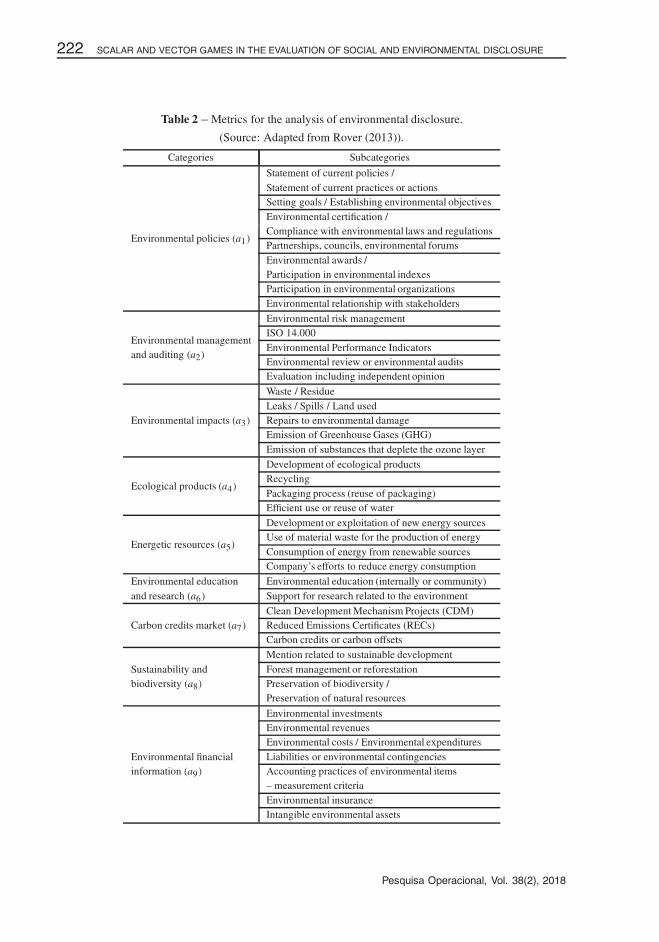
Table 2 presents the Rover metric (2013) in relation to the environmental categories and theirsubcategories adapted to this research.
It should be noted that the Rover metric is composed of 40 environmental subcategories and
40 social subcategories. Thus, there was a need for adaptations, since, unlike Rover’s (2013)research, this study was not concerned with the number of times the information was disclosed,but whether the information was evidenced by the company or not.
To measure each of the adapted subcategories and presented in Tables 1 and 2, we chose to use
linear weighting, since for this weighting format, the higher the quality of information, the greaterthe weight assigned to it. Table 3 summarizes the values applied to each type of information.
The criteria presented in Table 3 sought to quantify the social and environmental subcategoriesin the following documents: Standardized Financial Statements (Balance Sheet, Statement of
Changes in Shareholders’ Equity, Statement of Cash Flows, Statement of Income for the Yearand Statement of Value Added) Notes to the Financial Statements, Independent Auditor’s Report,Fiscal Council’s Report, Audit Committee’s Report, Sustainability Report, Annual Report and
Reference Form (item 7.8). It is worth noting that, in order to search for such information in thecited documents, we used NVivo software, which searches through semantic words. After thesections containing the semantic words were located, the analysis was performed through theNVivo software regarding the type of information. If the information was of a qualitative nature,
the linear weighting assigned was ’1’, if non-monetary quantitative ’2’ and in case of monetaryquantitative ’3’, according to Table 3.
Finally, to quantify the social categories (s1, s2, s3 and s4) and environmental categories(a1, a2, a3, a4, a5, a6, a7, a8 and a9) presented in Tables 1 and 2, the division of the amount
of information associated with each category was conducted for the maximum amount that itcould achieve, as it was conducted by Rover (2013). It is important to emphasize that beforecalculating the rankings of the companies, according to the level of social, environmental and
socio-environmental disclosure, the data were normalized for the formation of payment matrices.The normalization was done by dividing each value obtained by the companies by the maximumof the group in each criterion, i.e., xi, j = xi, j
max j xi, j, where i is the company and j the criterion.
Pesquisa Operacional, Vol. 38(2), 2018
�
�
“main” — 2018/7/9 — 19:35 — page 221 — #7�
�
�
�
�
�
ADRIANA KROENKE, VICTORIANA RUBIALES CABALLERO, BIANCA CECON and NELSON HEIN 221
Table 1 – Metrics for the analysis of social disclosure.
(Source: Adapted from Rover (2013)).
Categories Subcategories
Community (s1)
Volunteering programsSponsoring public health projectsRelations with indigenous peoples /Relations with quilombola peoplesSponsoring conferences or seminars or exhibitions or campaignsDonations of resources to public entities or OSCIP(Civil Society Organization for Public Interest)Supporting educationGiving housing support / food supportSupporting cultureSupporting sports activitiesRelationship with stakeholdersDecisions or fines related to the community in which it operatesInvestments of a social character
Diversity (s2)
Number of women or minorities in the workforceOccupation of women or minorities in management positionsProportion of salary between men and womenHiring people with disabilitiesNon-discrimination policies against minorities
Product, services and consumers (s3)
Quality Program – ISO 9000 / Quality Program – ISO 9.001Product Innovation (Research & Development)Products in accordance with safety standardsConsumer satisfaction or dissatisfactionUnfair competition or trust practices
Relations with employees (s4)
Number of employees / Employees’ length of service /Age group of employeesPayment of employees (average or total)Trade union relations or with class agenciesPrograms to encourage cultureDevelopment of recreational or sports activitiesEmployee Education / Employee TrainingHealth in the workplace / Hygiene in the workplace /Safety in the workplaceAccidents at work / Occupational diseases / Absenteeism / DeathsRetirement or supplementary pension plansChildcare aid for children of employees /Scholarship for children of employeesMaternity Support / Paternity SupportProfit sharingTurnover rate / Resignation policyEmployee participation in managerial decisionsJob satisfaction / Employee motivationChild labor or forced labor or analogous to slaveryInvestments in managerial developmentValue added per employee
Pesquisa Operacional, Vol. 38(2), 2018
�
�
“main” — 2018/7/9 — 19:35 — page 222 — #8�
�
�
�
�
�
222 SCALAR AND VECTOR GAMES IN THE EVALUATION OF SOCIAL AND ENVIRONMENTAL DISCLOSURE
Table 2 – Metrics for the analysis of environmental disclosure.
(Source: Adapted from Rover (2013)).
Categories Subcategories
Environmental policies (a1)
Statement of current policies /Statement of current practices or actionsSetting goals / Establishing environmental objectivesEnvironmental certification /Compliance with environmental laws and regulationsPartnerships, councils, environmental forumsEnvironmental awards /Participation in environmental indexesParticipation in environmental organizationsEnvironmental relationship with stakeholders
Environmental management
Environmental risk management
and auditing (a2)
ISO 14.000Environmental Performance IndicatorsEnvironmental review or environmental auditsEvaluation including independent opinion
Environmental impacts (a3)
Waste / ResidueLeaks / Spills / Land usedRepairs to environmental damageEmission of Greenhouse Gases (GHG)Emission of substances that deplete the ozone layer
Ecological products (a4)
Development of ecological productsRecyclingPackaging process (reuse of packaging)Efficient use or reuse of water
Energetic resources (a5)
Development or exploitation of new energy sourcesUse of material waste for the production of energyConsumption of energy from renewable sourcesCompany’s efforts to reduce energy consumption
Environmental education Environmental education (internally or community)and research (a6) Support for research related to the environment
Carbon credits market (a7)
Clean Development Mechanism Projects (CDM)Reduced Emissions Certificates (RECs)Carbon credits or carbon offsets
Sustainability andMention related to sustainable development
biodiversity (a8)
Forest management or reforestationPreservation of biodiversity /Preservation of natural resources
Environmental financial
Environmental investments
information (a9)
Environmental revenuesEnvironmental costs / Environmental expendituresLiabilities or environmental contingenciesAccounting practices of environmental items– measurement criteriaEnvironmental insuranceIntangible environmental assets
Pesquisa Operacional, Vol. 38(2), 2018

�
�
“main” — 2018/7/9 — 19:35 — page 223 — #9�
�
�
�
�
�
ADRIANA KROENKE, VICTORIANA RUBIALES CABALLERO, BIANCA CECON and NELSON HEIN 223
Table 3 – Criteria for linear weighting.
(Source: Adapted from Rover (2013)).
Criteria Linear
No disclosure 0
Qualitative disclosures 1
Non-monetary quantitative disclosures 2
Monetary quantitative disclosures 3
3.3.2 Market Value of Companies
The word value, in the accounting, economic and legal context is very broad, which leads to ithaving different meanings (Neiva, 1999). According to Neiva (1999) it is necessary to use someterms to better explain the meaning of value, such as: real value, current value, intrinsic value,
book value, settlement value, market value, among others.
The market value of an organization in the capital market refers to the value that the investor iswilling to pay for the company (Chaves & Pimenta Junior, 2013). Regarding this, Santos, Araujo& Leite Filho (2016) mention that investors generally pay for the organization according to the
expectations generated by them through the information available in the market.
The variable used in this research to measure the companies’ market value was the share pricemultiplied by the number of shares on December 31. The date of December 31 was chosen, sincethere is a need to use a moment in which all the information evidenced has already been absorbed
by the market. Therefore, due to the use of reports that are not mandatory by law, which do nothave a specific period for disclosure, it was decided to carry out the market value analysis onDecember 31 and December of the year following the report.
In order to analyze the association between the level of social, environmental and socio-environ-mental disclosure with market value, the market value of 2014 was used in relation to the disclo-sure of 2013 and the market value of 2015 in relation to the disclosure of 2014. This is justifiedsince the report is released during the following year. The information regarding the market value
was collected in the Economatica� database.
3.4 Data Analysis Procedures
In this section we present the techniques used in the research to achieve the proposed objective.
In the first moment, the ranking conducted by means of scalar and vector games is highlighted.Afterwards, we present Kendall’s correlation, which was used to verify the association betweenthe study variables.
It is worth mentioning the procedures of game theory, a technique that according to Marmol &
Monroy (1999), provides a unified framework in economic analysis contributing to the modelingof economic behavior and helping decisions in the optimization of a single objective. According
Pesquisa Operacional, Vol. 38(2), 2018

�
�
“main” — 2018/7/9 — 19:35 — page 224 — #10�
�
�
�
�
�
224 SCALAR AND VECTOR GAMES IN THE EVALUATION OF SOCIAL AND ENVIRONMENTAL DISCLOSURE
to Zeleny (1982), games in which the payments received by players are represented by vectors
and not by scalars are called vector games, multicriteria games or games with multiple payments.Vector games differ from scalar games because of the payment structure, which is enough so thatmany of the results of scalar games can not be extended directly to vector games because there
is no order among vector payments, resulting in new concepts and solution procedures (Monroy& Marmol, 1999; Puerto, Hinojosa, Marmol, Monroy & Fernandez, 1999; Monroy, Marmol &Rubiales, 2008).
3.4.1 Preliminaries of Game Theory
Scalar games
Let P = (ai j ); i = 1, . . . , n, j = 1, . . . , m be the payment matrix of a zero-sum two-personal
game and the mixed strategy sets for both player I and player II are respectively:
X ={
x ∈ Rn∣∣∣
n∑i=1
xi = 1, xi ≥ 0, i = 1, . . . , n
}(1)
Y ={
y ∈ Rm∣∣∣
m∑j=1
y j = 1, y j ≥ 0, j = 1, . . . , m
}(2)
The expected payment of the game when player I uses his mixed strategy x = (x1, . . . , xn) and
player II uses his mixed strategy y = (y1, . . . , yn), is given by:
v(x, y) = xt Py =n∑
i=1
m∑j=1
xiai j y j ∀x ∈ X, ∀y ∈ Y (3)
For each mixed strategy, x ∈ X , the level of security for player I is v(x) = miny∈Y xt Py.This player looks for strategies that provide him/her with the best level of security, i.e. strate-gies x ∈ X that maximize v(x). To him/her this must solve the problem maxx∈X v(x) s.t.v(x) = min1≤ j≤m
∑ni=1 xi ai j . By making the change and variable v = min1≤ j≤m
∑ni=1 xi ai j ,
the solution of the following equivalent linear problem provides the optimal security strategies:
max v
s.t.n∑
i=1
xiai j ≥ v, j = 1, . . . , m
n∑i=1
xi = 1, xi ≥ 0, i = 1, . . . , n
(4)
Pesquisa Operacional, Vol. 38(2), 2018
�
�
“main” — 2018/7/9 — 19:35 — page 225 — #11�
�
�
�
�
�
ADRIANA KROENKE, VICTORIANA RUBIALES CABALLERO, BIANCA CECON and NELSON HEIN 225
Vector Games
Let a two-personal game of zero sum be in normal form and let P = (ai j ); 1 ≤ i ≤ n, 1 ≤ j ≤ mbe the matrix of payments of the game. Each element ai j of the matrix is a vector of k dimension
(Fernandez & Puerto, 1996):
ai j = (ai j (1), ai j (2), . . . , ai j (k)) ∈ Rk (5)
which determines k matrices of n × m order in the form:
P(p) = (ai j (p))1 ≤ p ≤ k; 1 ≤ i ≤ n; 1 ≤ j ≤ m (6)
The expected payment of the game when players choose their mixed strategies x ∈ X and y ∈ Y ,respectively, is given by:
v(x, y) = xt Py = (v1(x, y), . . . , vk(x, y)) (7)
where:vp(x, y) = xt P(p)y; p = 1, . . . , k (8)
For each x ∈ X strategy of player I the security level vector for that player is the payment thatcan guarantee in each scalar game induced by the vector game v(x) = (v1(x), . . . , vk(x)) wherevp(x) = miny∈Y vp(x, y) = miny∈Y xt P(p)y.
The optimal strategies and their associated security level vector are obtained from the following
linear multi-objective problem
max v1, . . . , vk
s.t. xt P(p) ≥ (vp, . . . , vp); p = 1, . . . , k
n∑i = 1
xi = 1; xi ≥ 0
(9)
A classic procedure for obtaining solutions to multiobjective problems is the programming by
compromise (Zeleny, 1976). It is based on considering the points closest to an ideal point ofreference. In this case we consider the scalar problem that minimizes the distance, consideringthe L1 metric, between the security level vector v(x) = (v1(x), . . . , vk(x)) and an ideal payment
vector v∗(x) = (v∗1 , . . . , v∗
k ), where v∗p = maxx∈X vp(x), p = 1, . . . , k,
min[
v∗1−v1(x)
v∗1
]+
[v∗
2−v2(x)
v∗2
]+ · · · +
[v∗
k −vk (x)
v∗k
]
s.t. xt P(p) ≥ (vp, . . . , vp); p = 1, . . . , k
n∑i = 1
xi = 1; xi ≥ 0
(10)
Pesquisa Operacional, Vol. 38(2), 2018

�
�
“main” — 2018/7/9 — 19:35 — page 226 — #12�
�
�
�
�
�
226 SCALAR AND VECTOR GAMES IN THE EVALUATION OF SOCIAL AND ENVIRONMENTAL DISCLOSURE
3.4.2 Construction of the Model
In the current context, Game Theory has been applied in several areas of knowledge, such asadministration, biology, political sciences, law and economics (Fiani, 2004), it has also has beendeveloped within the area of Operational Research (Dimand & Dimand, 1996). According to
Brandt, Fischer, Harrenstein & Shoham (2009), Kreuzberg (2013), Kroenke (2014) and Rubiales,Monroy & Marmol (2017) it can be used today as a ranking technique.
In this research, the scalar games technique was used for the development of rankings referringto social disclosure and rankings related to environmental disclosure. In addition, in order to
rank companies according to the level of socio-environmental disclosure, the technique of vec-tor games was used. For Leoneti (2016), to choose multicriteria decision methods involves theobservation of key factors, given the variability of methods, such as ability with method, need
for conflict minimization and need for transparency. The methods may be sensitive when smallvariations occur in the input and alert data that different classifications can be obtained whendifferent multicriteria decision methods are applied to obtain rankings.
According to Kroenke (2014), the scoring technique through scalar games is used when there is
only one payment per indicator, or allotments of indicators. In this study, they are represented bymeans of allotments of levels of social and environmental disclosure when analyzed separately.In the scalar game related to social disclosure, four (4) strategies were assumed, each being a
social indicator: community (s1), diversity (s2), “product, services and consumers” (s3) and re-lationships with employees (s4). Nine (9) strategies were attributed to the scalar game relatedto the environmental disclosure given by the indicators: environmental policies (a1), environ-
mental management and auditing (a2), environmental impacts (a3), ecological products (a4),energetic resources (a5), environmental education and research (a6), carbon credits market (a7),sustainability and biodiversity (a8) and environmental financial information (a9).
According to Kreuzberg (2013), in order to find the solution to scalar games and thus elaborate
the rankings by means of such technique, it is necessary to construct the matrix of payments, inwhich the strategies of the Player I will be distributed in the lines and the Strategies of the PlayerII, in the columns. The following are two payment matrices (PS: social; PA: environmental),
each with a single payment per line and column.
PS =
⎛⎜⎜⎜⎜⎝
s1,1 s1,2 · · · s1,4
s2,1 s2,2 · · · s2,4...
.... . .
...
s24,1 s24,2 · · · s24,4
⎞⎟⎟⎟⎟⎠ ; PA =
⎛⎜⎜⎜⎜⎜⎝
a1,1 a1,2 · · · a1,9
a2,1 a2,2...
...
· · · a2,9. . .
...
a24,1 a24,2 · · · a24,9
⎞⎟⎟⎟⎟⎟⎠
(11)
In the matrix of payments, Player I (Sector) makes its choices in light of the strategies arrangedin the lines which, in this research, refer to the companies of the sample. On the other hand,
Player II (Nature) makes its choices based on the gains presented in the columns which, in afirst moment in this study, are formed by the indicators of the level of social disclosure and, in asecond moment, by the indicators of the level of environmental disclosure.
Pesquisa Operacional, Vol. 38(2), 2018
�
�
“main” — 2018/7/9 — 19:35 — page 227 — #13�
�
�
�
�
�
ADRIANA KROENKE, VICTORIANA RUBIALES CABALLERO, BIANCA CECON and NELSON HEIN 227
Games against nature are locked against some entity that is not specifically a rational humanplayer, but rather a game from a “point of view in which the decision maker plays against thediabolic nature” (Luce & Raiffa, 1957, p. 279). Ostolaza (1969, p. 10) states that “Nature ispassive, in the sense that it does not affect neither gains nor losses of the game”.
The verification of the optimal strategies in the scalar game for Player I is obtained by solving theLinear Programming Problem (LPP) (Magro, Gorla, Kroenke & Hein, 2015). The following LPPbrings the primal model of the game that the 24 companies play with the four social indicators:
max vS
s.t.
s1,1x1 + s2,1x2 + · · · + s24,1x24 ≥ vs
s1,2x1 + s2,2x2 + · · · + s24,2x24 ≥ vs...
... + · · · + ... ≥ ...
s1,4x1 + s2,4x2 + · · · + s24,4x24 ≥ vs
x1 + x2 + · · · + x24 = 1x1, x2, . . . , x24 ≥ 0
(12)
In a similar way, the PPL was constructed, and it models the primal game established betweenthe 24 companies of the sample, against the nine (9) environmental indicators:
max vA
s.t.
a1,1x1 + a2,1x2 + · · · + a24,1x24 ≥ va
a1,2x1 + a2,2x2 + · · · + a24,2x24 ≥ va...
... + · · · + ... ≥ ...
a1,9x1 + a2,9x2 + · · · + a24,9x24 ≥ va
x1 + x2 + · · · + x24 = 1x1, x2, . . . , x24 ≥ 0
(13)
In this research the LPPs were solved through PLM 3.0 software (Programacao LinearMista v.3.0). After checking the optimal strategy suggested: pure or mixed for Player I in thefirst round, the company (pure strategy) or companies (mixed strategy) that are presented as op-timal strategies were removed from the problem. In a recurrent way, the LPP was successivelyexecuted until the complete formation of the ranking.
For the construction of the rankings of companies, according to the levels of social and environ-mental disclosure, the vector games were used, taking two allotments of indicators: social andenvironmental. Vector games are used when the payment is not unique, that is, there are twoor more payments. In the research, the allotments of social and environmental indicators wereassumed as possible strategies and payments as their indicators, i.e., four (4) payments for thesocial strategy and nine (9) payments in the environmental strategy.
The following matrix refers to the vector game of the 24 companies established against twostrategies: an environmental one and a social one. The social strategy brings 4 payments, given
Pesquisa Operacional, Vol. 38(2), 2018
�
�
“main” — 2018/7/9 — 19:35 — page 228 — #14�
�
�
�
�
�
228 SCALAR AND VECTOR GAMES IN THE EVALUATION OF SOCIAL AND ENVIRONMENTAL DISCLOSURE
by indicators: community (s1), diversity (s2), “product, services and consumers” (s3) and rela-tions with employees (s4). The environmental strategy has 9 payments, given by indicators: en-vironmental policies (a1), environmental management and auditing (a2), environmental impacts(a3), ecological products (a4), energetic resources (a5), environmental education and research(a6), carbon credits market (a7), sustainability and biodiversity (a8) and environmental financialinformation (a9). The multiple payment matrix scheme is shown below:
P =
⎛⎜⎜⎜⎜⎝
(s1,1, s1,2, . . . , s1,4) (a1,1, a1,2, . . . , a1,9)
(s2,1, s2,2, . . . , s2,4) (a2,1, a2,2, . . . , a2,9)
......
(s24,1, s24,2, . . . , s24,4) (a24,1, a24,2, . . . , a24,9)
⎞⎟⎟⎟⎟⎠ (14)
In a similar way to the scalar game, in the matrix presented in relation to the vector game Player I(companies of the sector) makes its choices in light of the strategies presented in the lines, whilePlayer II (allotments of indicators) makes its choices in light of the strategies distributed in thecolumns. However, by presenting more than one allotment of indicators, the Linear ProgrammingProblem used to verify the optimal strategies is adjusted according to what was modeled byKroenke, Hein & Wilhelm (2015).
max v1, . . . , vk
s.t.xt P(p) ≥ (v1, . . . , vk); p = 1, . . . , k;k = 1, . . . , n (allotments of indicators)
n∑i = 1
xi = 1; xi ≥ 0
(15)
Specifically for this game we consider that k = 2, where the first allotment of indicators has 4elements, which are taken as payments and the second one 9 indicators, that is, considered in theresearch as payments. The model used is described below:
max vS, vA
s.t.s1,1x1 + s2,1x2 + · · · + s24,1x24 ≥ vS
s1,2x1 + s2,2x2 + · · · + s24,2x24 ≥ vS...
... + · · · + ... ≥ ...
s1,4x1 + s2,4x2 + · · · + s24,4x24 ≥ vS
a1,1x1 + a2,1x2 + · · · + a24,1x24 ≥ vA
a1,2x1 + a2,2x2 + · · · + a24,2x24 ≥ vA...
... + · · · + ... ≥ ...
a1,9x1 + a2,9x2 + · · · + a24,9x24 ≥ vA
x1 + x2 + · · · + x24 = 1
x1, x2, . . . , x24 ≥ 0
(16)
Pesquisa Operacional, Vol. 38(2), 2018
�
�
“main” — 2018/7/9 — 19:35 — page 229 — #15�
�
�
�
�
�
ADRIANA KROENKE, VICTORIANA RUBIALES CABALLERO, BIANCA CECON and NELSON HEIN 229
Unlike Kroenke, Hein & Wilhelm (2015), who adapted this LPP to make use of the value of theinformation found by means of the variance of the normalized data of each allotment of indicatorsfor the construction of the objective function, in this research the multi-objective optimizationwas used by means of global criterion with the normalized data. Multi-objective optimizationrefers to a problem in which there are two or more objectives to be optimized (maximized orminimized) simultaneously (Azuma, 2011). According to Antunes & Alves (2012), this opti-mization problem is generally used since in real problems there are usually multiple optics toevaluate the merits of the permissible solutions.
It should be mentioned that the objectives to be optimized in multi-objective optimization prob-lems are usually conflicting, since there is usually not a single optimal solution that simultane-ously meets all the objectives (Amorim, Romero & Mantovani, 2009). In light of this type ofproblem Rao (1996) described the Global Criteria Method, in which the optimal solution is evi-denced by minimizing a pre-established criterion. According to Carmelossi (2014) by means ofsuch a method it is possible to obtain the closest solution possible to the ideal solution.
For the linear problem of the previous bi-criteria game, the problem that gives the compromisesolution is:
min[
v∗S −vS (x)
v∗S
]+
[v∗
A−vA(x)
v∗A
]s.t.
s1,1x1 + s2,1x2 + · · · + s24,1x24 ≥ vS
s1,2x1 + s2,2x2 + · · · + s24,2x24 ≥ vS...
... + · · · + ... ≥ ...
s1,4x1 + s2,4x2 + · · · + s24,4x24 ≥ vS
a1,1x1 + a2,1x2 + · · · + a24,1x24 ≥ vA
a1,2x1 + a2,2x2 + · · · + a24,2x24 ≥ vA...
... + · · · + ... ≥ ...
a1,9x1 + a2,9x2 + · · · + a24,9x24 ≥ vA
x1 + x2 + · · · + x24 = 1x1, x2, . . . , x24 ≥ 0
(17)
As in scalar games, the multi-objective LPP was solved through PLM v.3.0. In addition, the formof ranking was the same one adopted for the scalar games, since the company or the companiesthat presented themselves as optimal strategies were removed from the problem, conducting itagain until the complete formation of the rankings.
3.4.3 Kendall Correlation
In order to reach the objective of the study of evaluating the degree of association between so-cial disclosure and market value, environmental disclosure with market value and socio-environ-
mental disclosure with market value, respectively, the statistical method was adopted byKendall’s correlation. We chose such metrics because, according to Martins & Theophilo (2007),it measures the degree of association between two sets of points.
Pesquisa Operacional, Vol. 38(2), 2018
�
�
“main” — 2018/7/9 — 19:35 — page 230 — #16�
�
�
�
�
�
230 SCALAR AND VECTOR GAMES IN THE EVALUATION OF SOCIAL AND ENVIRONMENTAL DISCLOSURE
According to Kaveski (2013) Kendall’s correlation coefficient is defined by three steps, the first
being the statistical test S, which measures the monotonic dependence between the variable Y inrelation to the variable X. In order to verify such dependency, the difference between the numberof discordant pairs by the number of matching pairs is calculated.
The second step refers to the calculation that determines the Kendall correlation coefficient, given
by:
τ = Sn(n−1)
2
(18)
where:τ the Kendall correlation coefficient;S relation of the orders found (monotonous dependence); andn sample size.
Finally, the last step regarding this technique concerns the measurement of the significance ofthe Kendall correlation coefficient, which is evaluated by means of a two-tailed hypothesis testthat checks if S is statistically different from zero (Kaveski, 2013). As mentioned by Martins &
Theophilo (2007), Kendall’s correlation coefficient can vary from −1 to 1, in which values closeto 1 indicate concordance between variables, while values close to −1 indicate aversion of theirvalues. It should be noted that the Statistical Package for the Social Sciences (SPSS) was usedto perform the Kendall correlation method.
4 PRESENTATION AND ANALYSIS OF RESULTS
This chapter presents the results obtained in the study, whose purpose was to establish the as-sociation of social, environmental and socio-environmental disclosure with the market value of
Brazilian companies with high environmental impact. To do so, it was necessary to divide thischapter into two sections, the first section presenting the social, environmental, socio-environ-mental and market value rankings, and in the second section the results obtained through
Kendall’s correlation.
4.1 Rankings
This section presents the rankings formed by the levels of social, environmental, socio-environ-mental disclosure and the rankings referring to the market value indicator. For this the section
was divided into four subsections. In the first and second subsection, the company’s 2013 and2014 rankings are presented according to the level of social disclosure and the level of envi-ronmental disclosure, respectively, which were obtained through the scalar games technique.
The following subsection presents the 2013 and 2014 rankings referring to the level of socio-environmental disclosure of companies, and these were obtained through the technique of vectorgames. Finally, in the last subsection, the 2014 and 2015 rankings of the market value indicator
are presented, which were elaborated by means of the descending order of such variable.
Pesquisa Operacional, Vol. 38(2), 2018
�
�
“main” — 2018/7/9 — 19:35 — page 231 — #17�
�
�
�
�
�
ADRIANA KROENKE, VICTORIANA RUBIALES CABALLERO, BIANCA CECON and NELSON HEIN 231
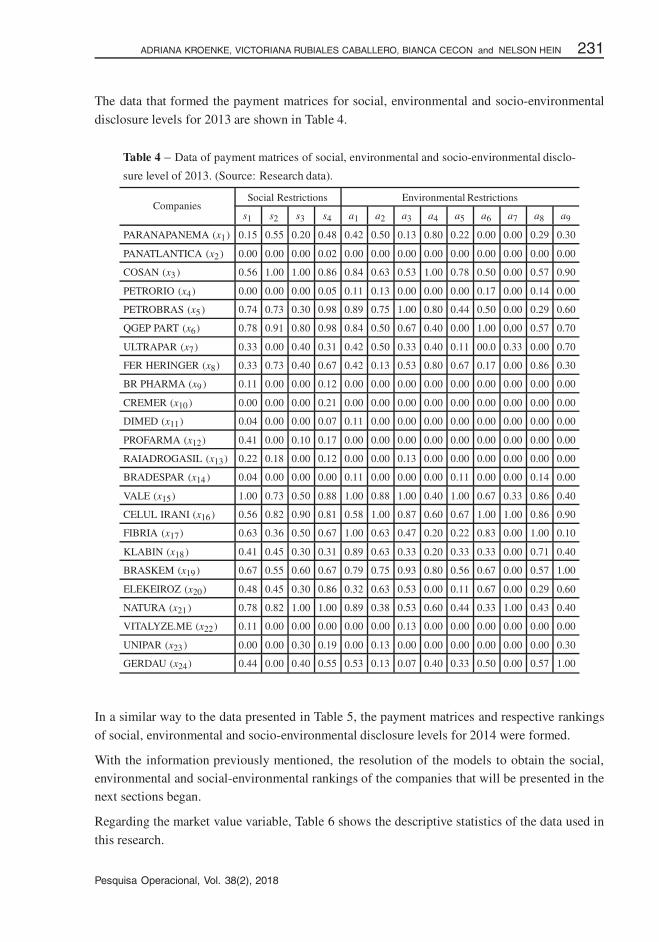
The data that formed the payment matrices for social, environmental and socio-environmental
disclosure levels for 2013 are shown in Table 4.
Table 4 – Data of payment matrices of social, environmental and socio-environmental disclo-
sure level of 2013. (Source: Research data).
CompaniesSocial Restrictions Environmental Restrictions
s1 s2 s3 s4 a1 a2 a3 a4 a5 a6 a7 a8 a9
PARANAPANEMA (x1) 0.15 0.55 0.20 0.48 0.42 0.50 0.13 0.80 0.22 0.00 0.00 0.29 0.30
PANATLANTICA (x2 ) 0.00 0.00 0.00 0.02 0.00 0.00 0.00 0.00 0.00 0.00 0.00 0.00 0.00
COSAN (x3 ) 0.56 1.00 1.00 0.86 0.84 0.63 0.53 1.00 0.78 0.50 0.00 0.57 0.90
PETRORIO (x4) 0.00 0.00 0.00 0.05 0.11 0.13 0.00 0.00 0.00 0.17 0.00 0.14 0.00
PETROBRAS (x5 ) 0.74 0.73 0.30 0.98 0.89 0.75 1.00 0.80 0.44 0.50 0.00 0.29 0.60
QGEP PART (x6) 0.78 0.91 0.80 0.98 0.84 0.50 0.67 0.40 0.00 1.00 0,00 0.57 0.70
ULTRAPAR (x7) 0.33 0.00 0.40 0.31 0.42 0.50 0.33 0.40 0.11 00.0 0.33 0.00 0.70
FER HERINGER (x8) 0.33 0.73 0.40 0.67 0.42 0.13 0.53 0.80 0.67 0.17 0.00 0.86 0.30
BR PHARMA (x9 ) 0.11 0.00 0.00 0.12 0.00 0.00 0.00 0.00 0.00 0.00 0.00 0.00 0.00
CREMER (x10 ) 0.00 0.00 0.00 0.21 0.00 0.00 0.00 0.00 0.00 0.00 0.00 0.00 0.00
DIMED (x11) 0.04 0.00 0.00 0.07 0.11 0.00 0.00 0.00 0.00 0.00 0.00 0.00 0.00
PROFARMA (x12) 0.41 0.00 0.10 0.17 0.00 0.00 0.00 0.00 0.00 0.00 0.00 0.00 0.00
RAIADROGASIL (x13) 0.22 0.18 0.00 0.12 0.00 0.00 0.13 0.00 0.00 0.00 0.00 0.00 0.00
BRADESPAR (x14 ) 0.04 0.00 0.00 0.00 0.11 0.00 0.00 0.00 0.11 0.00 0.00 0.14 0.00
VALE (x15) 1.00 0.73 0.50 0.88 1.00 0.88 1.00 0.40 1.00 0.67 0.33 0.86 0.40
CELUL IRANI (x16 ) 0.56 0.82 0.90 0.81 0.58 1.00 0.87 0.60 0.67 1.00 1.00 0.86 0.90
FIBRIA (x17) 0.63 0.36 0.50 0.67 1.00 0.63 0.47 0.20 0.22 0.83 0.00 1.00 0.10
KLABIN (x18 ) 0.41 0.45 0.30 0.31 0.89 0.63 0.33 0.20 0.33 0.33 0.00 0.71 0.40
BRASKEM (x19 ) 0.67 0.55 0.60 0.67 0.79 0.75 0.93 0.80 0.56 0.67 0.00 0.57 1.00
ELEKEIROZ (x20) 0.48 0.45 0.30 0.86 0.32 0.63 0.53 0.00 0.11 0.67 0.00 0.29 0.60
NATURA (x21 ) 0.78 0.82 1.00 1.00 0.89 0.38 0.53 0.60 0.44 0.33 1.00 0.43 0.40
VITALYZE.ME (x22) 0.11 0.00 0.00 0.00 0.00 0.00 0.13 0.00 0.00 0.00 0.00 0.00 0.00
UNIPAR (x23 ) 0.00 0.00 0.30 0.19 0.00 0.13 0.00 0.00 0.00 0.00 0.00 0.00 0.30
GERDAU (x24) 0.44 0.00 0.40 0.55 0.53 0.13 0.07 0.40 0.33 0.50 0.00 0.57 1.00
In a similar way to the data presented in Table 5, the payment matrices and respective rankings
of social, environmental and socio-environmental disclosure levels for 2014 were formed.
With the information previously mentioned, the resolution of the models to obtain the social,environmental and social-environmental rankings of the companies that will be presented in thenext sections began.
Regarding the market value variable, Table 6 shows the descriptive statistics of the data used in
this research.
Pesquisa Operacional, Vol. 38(2), 2018
�
�
“main” — 2018/7/9 — 19:35 — page 232 — #18�
�
�
�
�
�
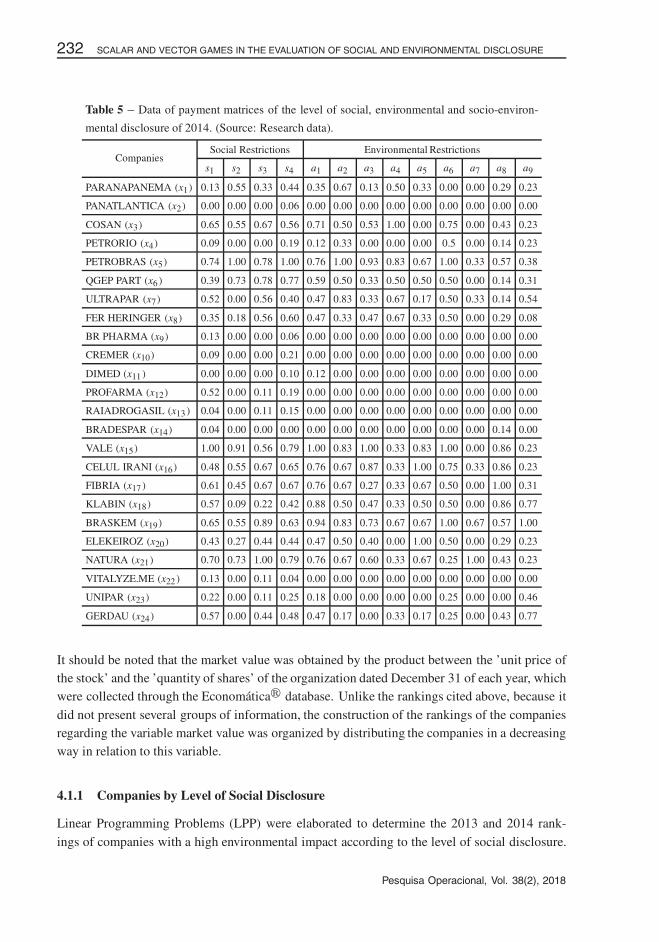
232 SCALAR AND VECTOR GAMES IN THE EVALUATION OF SOCIAL AND ENVIRONMENTAL DISCLOSURE
Table 5 – Data of payment matrices of the level of social, environmental and socio-environ-
mental disclosure of 2014. (Source: Research data).
CompaniesSocial Restrictions Environmental Restrictions
s1 s2 s3 s4 a1 a2 a3 a4 a5 a6 a7 a8 a9
PARANAPANEMA (x1) 0.13 0.55 0.33 0.44 0.35 0.67 0.13 0.50 0.33 0.00 0.00 0.29 0.23
PANATLANTICA (x2) 0.00 0.00 0.00 0.06 0.00 0.00 0.00 0.00 0.00 0.00 0.00 0.00 0.00
COSAN (x3) 0.65 0.55 0.67 0.56 0.71 0.50 0.53 1.00 0.00 0.75 0.00 0.43 0.23
PETRORIO (x4) 0.09 0.00 0.00 0.19 0.12 0.33 0.00 0.00 0.00 0.5 0.00 0.14 0.23
PETROBRAS (x5) 0.74 1.00 0.78 1.00 0.76 1.00 0.93 0.83 0.67 1.00 0.33 0.57 0.38
QGEP PART (x6 ) 0.39 0.73 0.78 0.77 0.59 0.50 0.33 0.50 0.50 0.50 0.00 0.14 0.31
ULTRAPAR (x7) 0.52 0.00 0.56 0.40 0.47 0.83 0.33 0.67 0.17 0.50 0.33 0.14 0.54
FER HERINGER (x8) 0.35 0.18 0.56 0.60 0.47 0.33 0.47 0.67 0.33 0.50 0.00 0.29 0.08
BR PHARMA (x9) 0.13 0.00 0.00 0.06 0.00 0.00 0.00 0.00 0.00 0.00 0.00 0.00 0.00
CREMER (x10) 0.09 0.00 0.00 0.21 0.00 0.00 0.00 0.00 0.00 0.00 0.00 0.00 0.00
DIMED (x11 ) 0.00 0.00 0.00 0.10 0.12 0.00 0.00 0.00 0.00 0.00 0.00 0.00 0.00
PROFARMA (x12) 0.52 0.00 0.11 0.19 0.00 0.00 0.00 0.00 0.00 0.00 0.00 0.00 0.00
RAIADROGASIL (x13 ) 0.04 0.00 0.11 0.15 0.00 0.00 0.00 0.00 0.00 0.00 0.00 0.00 0.00
BRADESPAR (x14) 0.04 0.00 0.00 0.00 0.00 0.00 0.00 0.00 0.00 0.00 0.00 0.14 0.00
VALE (x15) 1.00 0.91 0.56 0.79 1.00 0.83 1.00 0.33 0.83 1.00 0.00 0.86 0.23
CELUL IRANI (x16) 0.48 0.55 0.67 0.65 0.76 0.67 0.87 0.33 1.00 0.75 0.33 0.86 0.23
FIBRIA (x17 ) 0.61 0.45 0.67 0.67 0.76 0.67 0.27 0.33 0.67 0.50 0.00 1.00 0.31
KLABIN (x18) 0.57 0.09 0.22 0.42 0.88 0.50 0.47 0.33 0.50 0.50 0.00 0.86 0.77
BRASKEM (x19) 0.65 0.55 0.89 0.63 0.94 0.83 0.73 0.67 0.67 1.00 0.67 0.57 1.00
ELEKEIROZ (x20) 0.43 0.27 0.44 0.44 0.47 0.50 0.40 0.00 1.00 0.50 0.00 0.29 0.23
NATURA (x21) 0.70 0.73 1.00 0.79 0.76 0.67 0.60 0.33 0.67 0.25 1.00 0.43 0.23
VITALYZE.ME (x22 ) 0.13 0.00 0.11 0.04 0.00 0.00 0.00 0.00 0.00 0.00 0.00 0.00 0.00
UNIPAR (x23) 0.22 0.00 0.11 0.25 0.18 0.00 0.00 0.00 0.00 0.25 0.00 0.00 0.46
GERDAU (x24) 0.57 0.00 0.44 0.48 0.47 0.17 0.00 0.33 0.17 0.25 0.00 0.43 0.77
It should be noted that the market value was obtained by the product between the ’unit price ofthe stock’ and the ’quantity of shares’ of the organization dated December 31 of each year, whichwere collected through the Economatica� database. Unlike the rankings cited above, because it
did not present several groups of information, the construction of the rankings of the companiesregarding the variable market value was organized by distributing the companies in a decreasingway in relation to this variable.
4.1.1 Companies by Level of Social Disclosure
Linear Programming Problems (LPP) were elaborated to determine the 2013 and 2014 rank-
ings of companies with a high environmental impact according to the level of social disclosure.
Pesquisa Operacional, Vol. 38(2), 2018

�
�
“main” — 2018/7/9 — 19:35 — page 233 — #19�
�
�
�
�
�
ADRIANA KROENKE, VICTORIANA RUBIALES CABALLERO, BIANCA CECON and NELSON HEIN 233
Table 6 – Information regarding the stocks of the companies that composed the sample.
(Source: Research data).
Market Value 2014 2015
Unit share price (R$)
Minimum 0.79 0.48
Maximum 212.14 290.00Mean 27.21 25.29
Standard deviation 47.33 58.41
Number of shares (UN)
Minimum 4.560 4.559
Maximum 13,044.497 13,044.497Mean 1,253.602 1,209.223
Standard deviation 2,841.363 2,854.873
Market value =Minimum 64,087.00 35,941.95
unit share price × Maximum 125,096,726.23 111,791,339.29
number of shares (R$)Mean 16,825,591.80 13,964,524.64
Standard deviation 32,558,422.84 26,520,894.49
Table 7 shows the rankings formed according to the level of social disclosure of the companiesthat composed the sample in the years of 2013 and 2014.
It can be seen from Table 7 that the company that presented in both years the highest social
disclosure indexes, according to the Rover metric (2013) and the scalar games technique, wasNatura. Besides Natura, Braskem (4th), Celul Irani (7th), Fibria (8th), Klabin (12th), Unipar (16th),Bradespar (22nd) and Panatlantica (24th) also did not change their ranking positions from the year
2013 to the ranking of the year 2014.
The other companies investigated varied their positions from 2013 to 2014, as is the case of theQgep Part that changed its position as the 2nd company with the highest social disclosure indexin 2013 to the company with the 5th highest social disclosure index in 2014. However, it should
be noted that among the five companies that occupied the top positions in the 2013 ranking, fourremained among the five best positions of the following year and among the five companies withthe worst positions in the 2013 ranking, four remained in positions in the year 2014.
In light of the findings in Table 7, it should be noted that the organizations that generally ranked
highest in the rankings were companies that showed an Annual Report or Sustainability Report.On the other hand, the organizations with the inferior positions of the rankings of 2013 and 2014were those that did not disclose such reports during the investigated years.
4.1.2 Companies by Level of Environmental Disclosure
For the elaboration of the rankings of the organizations of the sample according to the level ofenvironmental disclosure in the years of 2013 and 2014, Linear Programming Problems werealso constructed. Table 8 shows the rankings obtained.
Pesquisa Operacional, Vol. 38(2), 2018
�
�
“main” — 2018/7/9 — 19:35 — page 234 — #20�
�
�
�
�
�
234 SCALAR AND VECTOR GAMES IN THE EVALUATION OF SOCIAL AND ENVIRONMENTAL DISCLOSURE
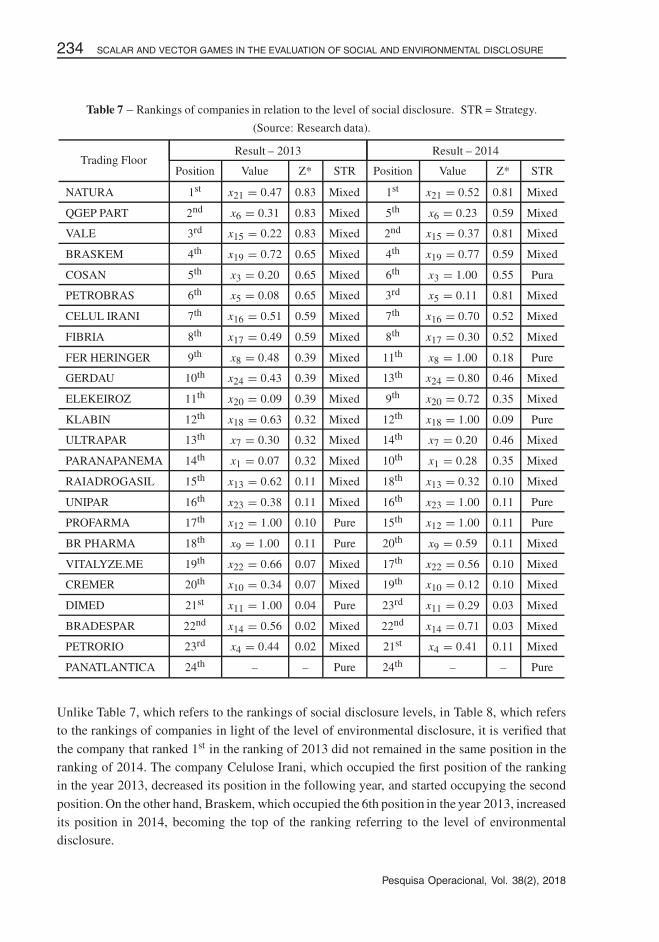
Table 7 – Rankings of companies in relation to the level of social disclosure. STR = Strategy.
(Source: Research data).
Trading FloorResult – 2013 Result – 2014
Position Value Z* STR Position Value Z* STR
NATURA 1st x21 = 0.47 0.83 Mixed 1st x21 = 0.52 0.81 Mixed
QGEP PART 2nd x6 = 0.31 0.83 Mixed 5th x6 = 0.23 0.59 Mixed
VALE 3rd x15 = 0.22 0.83 Mixed 2nd x15 = 0.37 0.81 Mixed
BRASKEM 4th x19 = 0.72 0.65 Mixed 4th x19 = 0.77 0.59 Mixed
COSAN 5th x3 = 0.20 0.65 Mixed 6th x3 = 1.00 0.55 Pura
PETROBRAS 6th x5 = 0.08 0.65 Mixed 3rd x5 = 0.11 0.81 Mixed
CELUL IRANI 7th x16 = 0.51 0.59 Mixed 7th x16 = 0.70 0.52 Mixed
FIBRIA 8th x17 = 0.49 0.59 Mixed 8th x17 = 0.30 0.52 Mixed
FER HERINGER 9th x8 = 0.48 0.39 Mixed 11th x8 = 1.00 0.18 Pure
GERDAU 10th x24 = 0.43 0.39 Mixed 13th x24 = 0.80 0.46 Mixed
ELEKEIROZ 11th x20 = 0.09 0.39 Mixed 9th x20 = 0.72 0.35 Mixed
KLABIN 12th x18 = 0.63 0.32 Mixed 12th x18 = 1.00 0.09 Pure
ULTRAPAR 13th x7 = 0.30 0.32 Mixed 14th x7 = 0.20 0.46 Mixed
PARANAPANEMA 14th x1 = 0.07 0.32 Mixed 10th x1 = 0.28 0.35 Mixed
RAIADROGASIL 15th x13 = 0.62 0.11 Mixed 18th x13 = 0.32 0.10 Mixed
UNIPAR 16th x23 = 0.38 0.11 Mixed 16th x23 = 1.00 0.11 Pure
PROFARMA 17th x12 = 1.00 0.10 Pure 15th x12 = 1.00 0.11 Pure
BR PHARMA 18th x9 = 1.00 0.11 Pure 20th x9 = 0.59 0.11 Mixed
VITALYZE.ME 19th x22 = 0.66 0.07 Mixed 17th x22 = 0.56 0.10 Mixed
CREMER 20th x10 = 0.34 0.07 Mixed 19th x10 = 0.12 0.10 Mixed
DIMED 21st x11 = 1.00 0.04 Pure 23rd x11 = 0.29 0.03 Mixed
BRADESPAR 22nd x14 = 0.56 0.02 Mixed 22nd x14 = 0.71 0.03 Mixed
PETRORIO 23rd x4 = 0.44 0.02 Mixed 21st x4 = 0.41 0.11 Mixed
PANATLANTICA 24th – – Pure 24th – – Pure
Unlike Table 7, which refers to the rankings of social disclosure levels, in Table 8, which refersto the rankings of companies in light of the level of environmental disclosure, it is verified that
the company that ranked 1st in the ranking of 2013 did not remained in the same position in theranking of 2014. The company Celulose Irani, which occupied the first position of the rankingin the year 2013, decreased its position in the following year, and started occupying the second
position. On the other hand, Braskem, which occupied the 6th position in the year 2013, increasedits position in 2014, becoming the top of the ranking referring to the level of environmentaldisclosure.
Pesquisa Operacional, Vol. 38(2), 2018

�
�
“main” — 2018/7/9 — 19:35 — page 235 — #21�
�
�
�
�
�
ADRIANA KROENKE, VICTORIANA RUBIALES CABALLERO, BIANCA CECON and NELSON HEIN 235
Table 8 – Rankings of companies in relation to the level of environmental disclosure. STR = Strategy.
(Source: Research data).
Trading FloorResult – 2013 Result – 2014
Position Value Z* STR Position Value Z* STR
CELUL IRANI 1st x16 = 0.60 0.70 Mixed 2nd x16 = 0.16 0.62 Mixed
COSAN 2nd x3 = 0.27 0.70 Mixed 9th x3 = 0.16 0.44 Mixed
NATURA 3rd x21 = 0.08 0.70 Mixed 3rd x21 = 0.35 0.47 Mixed
VALE 4th x15 = 0.05 0.70 Mixed 7th x15 = 0.45 0.44 Mixed
ULTRAPAR 5th x7 = 0.68 0.22 Mixed 5th x7 = 0.24 0.47 Mixed
BRASKEM 6th x19 = 0.22 0.22 Mixed 1st x19 = 0.84 0.62 Mixed
FIBRIA 7th x17 = 0.09 0.22 Mixed 11th x17 = 0.20 0.31 Mixed
FER HERINGER 8th x8 = 0.01 0.22 Mixed 16th x8 = 0.48 0.16 Mixed
PETROBRAS 9th x5 = 0.72 0.41 Mixed 6th x5 = 0.13 0.47 Mixed
KLABIN 10th x18 = 0.28 0.41 Mixed 4th x18 = 0.28 0.47 Mixed
GERDAU 11th x24 = 0.62 0.25 Mixed 8th x24 = 0.39 0.44 Mixed
ELEKEIROZ 12th x20 = 0.38 0.25 Mixed 13th x20 = 0.54 0.23 Mixed
PARANAPANEMA 13th x1 = 0.82 0.18 Mixed 14th x1 = 0.46 0.23 Mixed
QGEP PART 14th x6 = 0.18 0.18 Mixed 10th x6 = 0.78 0.31 Mixed
BRADESPAR 15th x14 = 0.35 0.04 Mixed 18th x14 = 0.46 0.06 Mixed
RAIADROGASIL 16th x13 = 0.30 0.04 Mixed 21st – – Mixed
PETRORIO 17th x4 = 0.23 0.04 Mixed 15th x4 = 0.52 0.16 Mixed
UNIPAR 18th x23 = 0.13 0.04 Mixed 12th x23 = 0.02 0.31 Mixed
DIMED 19th x11 = 0.54 0.06 Mixed 17th x11 = 0.54 0.06 Mixed
VITALYZE.ME 20th x22 = 0.46 0.06 Mixed 23rd – – Mixed
PROFARMA 21st – – Mixed 19th – – Mixed
BR PHARMA 22nd – – Mixed 20th – – Mixed
CREMER 23rd – – Mixed 22nd – – Mixed
PANATLANTICA 24th – – Mixed 24th – – Mixed
It should also be noted that, similarly to social disclosure rankings, in the rankings of environ-mental disclosure levels, there were companies that remained in the same position in both of theanalyzed periods. Among these companies was Natura that remained in both years in 3rd place,
as well as Ultrapar, which occupied the 8th position and Panatlantica which occupied the 24th
position. However, it can be seen that, unlike the social disclosure rankings, the changes com-pared to the first placements from the year 2013 to the year 2014 were higher. Among the com-
panies with the least evidence of environmental issues, there is a similarity with social rankings,since among the five companies with the worst positions in 2013, four remained in the fiveworst positions in 2014.
Pesquisa Operacional, Vol. 38(2), 2018

�
�
“main” — 2018/7/9 — 19:35 — page 236 — #22�
�
�
�
�
�
236 SCALAR AND VECTOR GAMES IN THE EVALUATION OF SOCIAL AND ENVIRONMENTAL DISCLOSURE
It should again be noted that the companies that were in the top positions of the rankings are
organizations that released Annual or Sustainability Reports of the analyzed years. And, unlikethese companies, the organizations found in the lower ranks of the environmental rankings arethose who did not disclose such reports.
4.1.3 Companies by Level of Socio-environmental Disclosure
For the construction of social and environmental rankings of 2013 and 2014 of the companiesthat composed the research sample, the Linear Programming Problems elaborated refer to vectorgames, that is, the model deals with social and environmental variables in the same LPP. The
socio-environmental rankings of 2013 and 2014 are evidenced by means of Table 9.
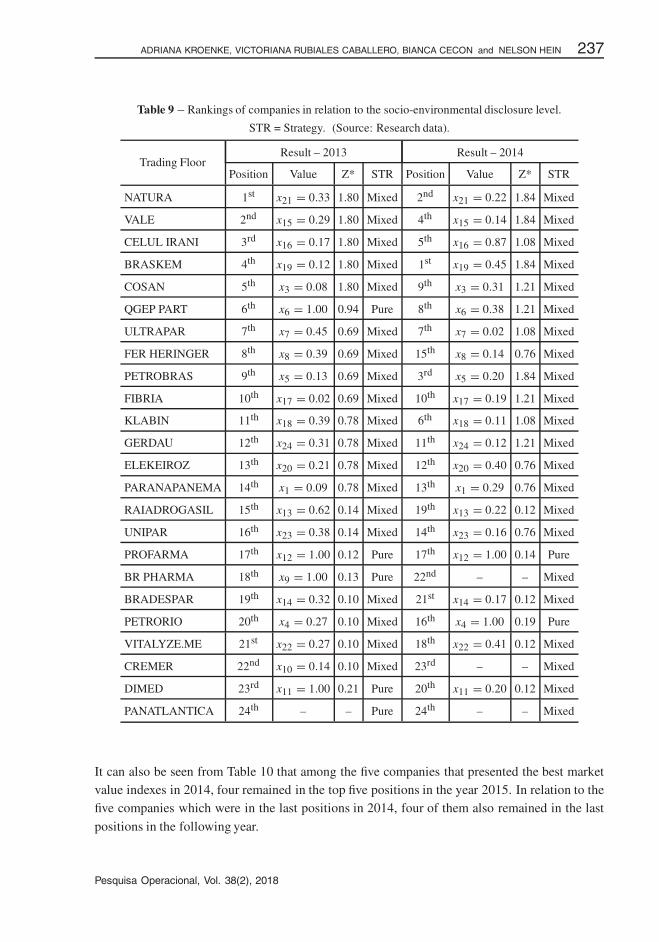
Regarding the results presented in Table 9, it should be pointed out that Natura, which ranked1st in the ranking in 2013, fell, in the second year, to the 2nd position. On the other hand, thecompany Braskem, which occupied the 4th position in the year 2013, started to lead the ranking
in the following year, being considered in 2014 the company with high environmental impactamong those analyzed, with a higher level of socio-environmental disclosure.
It must also be emphasized that again there were companies that maintained their positions duringthe analyzed years. Among these are Ultrapar, occupying the 7th position, Fibria, which occu-
pied the 10th position, Profarma, which occupied the 17th position in the ranking and Panatlanticaagain, as has already been evidenced in the rankings of the level of social and environmental dis-closure, was in the 24th position. It can also be verified that, generally, the companies positionedin the first and last positions of the ranking of 2013, tended to remain in such positions in the
following year.
As previously evidenced in the rankings regarding social disclosure and environmental disclo-sure, the companies belonging to the former are organizations that are concerned with dissemi-
nating Annual or Sustainability Reports. On the other hand, the companies with the worst rankingpositions were those that did not show Annual or Sustainability Reports.
4.1.4 Companies by Market Value
Table 10 shows the results obtained by means of the variable market value for each one of thecompanies in the sample, together with their respective position in relation to such index.
In contrast to the companies that presented the highest market value indexes, as evidenced
by Table 10, Petrobras, which is in the 1st position in both years and Vale, which is in the2nd, both in the ranking for the year 2014, and in the ranking for the year 2015 should behighlighted. In addition to these, other organizations Ultrapar (4th), Fibria (5th), Natura (8th),
Cosan (9th), Fertilizantes Heringer (22nd) and Profarma (19th) remained in the same positionsduring both periods.
Pesquisa Operacional, Vol. 38(2), 2018
�
�
“main” — 2018/7/9 — 19:35 — page 237 — #23�
�
�
�
�
�
ADRIANA KROENKE, VICTORIANA RUBIALES CABALLERO, BIANCA CECON and NELSON HEIN 237
Table 9 – Rankings of companies in relation to the socio-environmental disclosure level.
STR = Strategy. (Source: Research data).
Trading FloorResult – 2013 Result – 2014
Position Value Z* STR Position Value Z* STR
NATURA 1st x21 = 0.33 1.80 Mixed 2nd x21 = 0.22 1.84 Mixed
VALE 2nd x15 = 0.29 1.80 Mixed 4th x15 = 0.14 1.84 Mixed
CELUL IRANI 3rd x16 = 0.17 1.80 Mixed 5th x16 = 0.87 1.08 Mixed
BRASKEM 4th x19 = 0.12 1.80 Mixed 1st x19 = 0.45 1.84 Mixed
COSAN 5th x3 = 0.08 1.80 Mixed 9th x3 = 0.31 1.21 Mixed
QGEP PART 6th x6 = 1.00 0.94 Pure 8th x6 = 0.38 1.21 Mixed
ULTRAPAR 7th x7 = 0.45 0.69 Mixed 7th x7 = 0.02 1.08 Mixed
FER HERINGER 8th x8 = 0.39 0.69 Mixed 15th x8 = 0.14 0.76 Mixed
PETROBRAS 9th x5 = 0.13 0.69 Mixed 3rd x5 = 0.20 1.84 Mixed
FIBRIA 10th x17 = 0.02 0.69 Mixed 10th x17 = 0.19 1.21 Mixed
KLABIN 11th x18 = 0.39 0.78 Mixed 6th x18 = 0.11 1.08 Mixed
GERDAU 12th x24 = 0.31 0.78 Mixed 11th x24 = 0.12 1.21 Mixed
ELEKEIROZ 13th x20 = 0.21 0.78 Mixed 12th x20 = 0.40 0.76 Mixed
PARANAPANEMA 14th x1 = 0.09 0.78 Mixed 13th x1 = 0.29 0.76 Mixed
RAIADROGASIL 15th x13 = 0.62 0.14 Mixed 19th x13 = 0.22 0.12 Mixed
UNIPAR 16th x23 = 0.38 0.14 Mixed 14th x23 = 0.16 0.76 Mixed
PROFARMA 17th x12 = 1.00 0.12 Pure 17th x12 = 1.00 0.14 Pure
BR PHARMA 18th x9 = 1.00 0.13 Pure 22nd – – Mixed
BRADESPAR 19th x14 = 0.32 0.10 Mixed 21st x14 = 0.17 0.12 Mixed
PETRORIO 20th x4 = 0.27 0.10 Mixed 16th x4 = 1.00 0.19 Pure
VITALYZE.ME 21st x22 = 0.27 0.10 Mixed 18th x22 = 0.41 0.12 Mixed
CREMER 22nd x10 = 0.14 0.10 Mixed 23rd – – Mixed
DIMED 23rd x11 = 1.00 0.21 Pure 20th x11 = 0.20 0.12 Mixed
PANATLANTICA 24th – – Pure 24th – – Mixed
It can also be seen from Table 10 that among the five companies that presented the best marketvalue indexes in 2014, four remained in the top five positions in the year 2015. In relation to thefive companies which were in the last positions in 2014, four of them also remained in the last
positions in the following year.
Pesquisa Operacional, Vol. 38(2), 2018
�
�
“main” — 2018/7/9 — 19:35 — page 238 — #24�
�
�
�
�
�
238 SCALAR AND VECTOR GAMES IN THE EVALUATION OF SOCIAL AND ENVIRONMENTAL DISCLOSURE
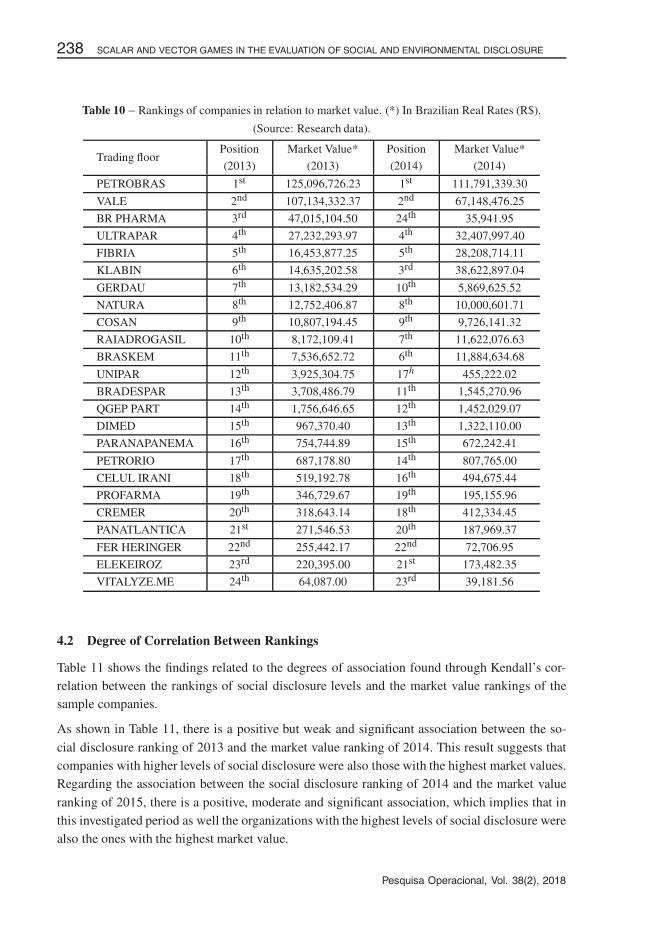
Table 10 – Rankings of companies in relation to market value. (*) In Brazilian Real Rates (R$).
(Source: Research data).
Trading floorPosition Market Value* Position Market Value*
(2013) (2013) (2014) (2014)
PETROBRAS 1st 125,096,726.23 1st 111,791,339.30
VALE 2nd 107,134,332.37 2nd 67,148,476.25
BR PHARMA 3rd 47,015,104.50 24th 35,941.95
ULTRAPAR 4th 27,232,293.97 4th 32,407,997.40
FIBRIA 5th 16,453,877.25 5th 28,208,714.11
KLABIN 6th 14,635,202.58 3rd 38,622,897.04
GERDAU 7th 13,182,534.29 10th 5,869,625.52
NATURA 8th 12,752,406.87 8th 10,000,601.71
COSAN 9th 10,807,194.45 9th 9,726,141.32
RAIADROGASIL 10th 8,172,109.41 7th 11,622,076.63
BRASKEM 11th 7,536,652.72 6th 11,884,634.68
UNIPAR 12th 3,925,304.75 17h 455,222.02
BRADESPAR 13th 3,708,486.79 11th 1,545,270.96
QGEP PART 14th 1,756,646.65 12th 1,452,029.07
DIMED 15th 967,370.40 13th 1,322,110.00
PARANAPANEMA 16th 754,744.89 15th 672,242.41
PETRORIO 17th 687,178.80 14th 807,765.00
CELUL IRANI 18th 519,192.78 16th 494,675.44
PROFARMA 19th 346,729.67 19th 195,155.96
CREMER 20th 318,643.14 18th 412,334.45
PANATLANTICA 21st 271,546.53 20th 187,969.37
FER HERINGER 22nd 255,442.17 22nd 72,706.95
ELEKEIROZ 23rd 220,395.00 21st 173,482.35
VITALYZE.ME 24th 64,087.00 23rd 39,181.56
4.2 Degree of Correlation Between Rankings
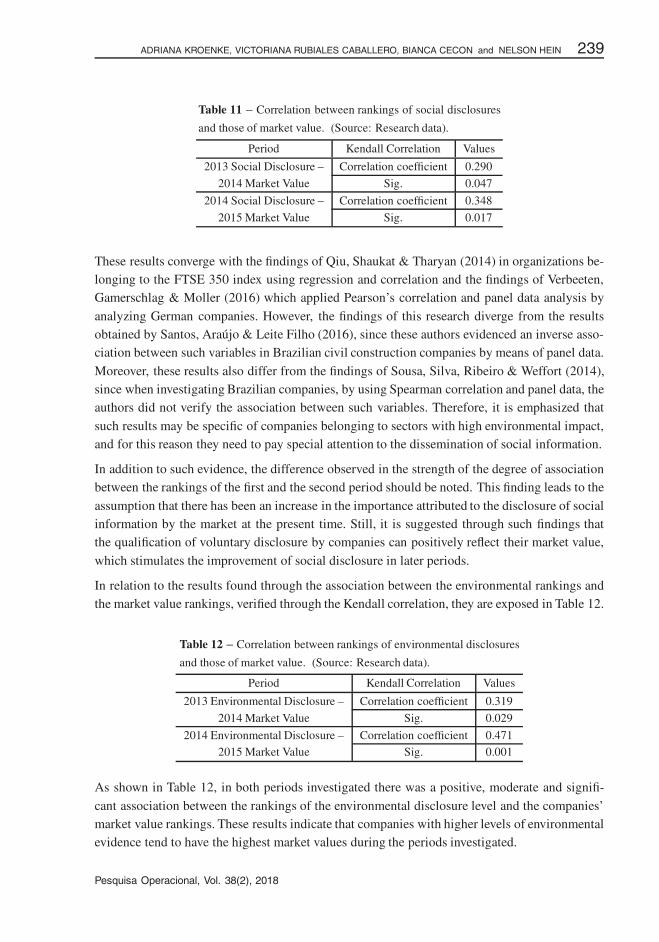
Table 11 shows the findings related to the degrees of association found through Kendall’s cor-relation between the rankings of social disclosure levels and the market value rankings of thesample companies.
As shown in Table 11, there is a positive but weak and significant association between the so-
cial disclosure ranking of 2013 and the market value ranking of 2014. This result suggests thatcompanies with higher levels of social disclosure were also those with the highest market values.Regarding the association between the social disclosure ranking of 2014 and the market value
ranking of 2015, there is a positive, moderate and significant association, which implies that inthis investigated period as well the organizations with the highest levels of social disclosure werealso the ones with the highest market value.
Pesquisa Operacional, Vol. 38(2), 2018
�
�
“main” — 2018/7/9 — 19:35 — page 239 — #25�
�
�
�
�
�
ADRIANA KROENKE, VICTORIANA RUBIALES CABALLERO, BIANCA CECON and NELSON HEIN 239
Table 11 – Correlation between rankings of social disclosures
and those of market value. (Source: Research data).
Period Kendall Correlation Values
2013 Social Disclosure – Correlation coefficient 0.290
2014 Market Value Sig. 0.047
2014 Social Disclosure – Correlation coefficient 0.348
2015 Market Value Sig. 0.017
These results converge with the findings of Qiu, Shaukat & Tharyan (2014) in organizations be-longing to the FTSE 350 index using regression and correlation and the findings of Verbeeten,Gamerschlag & Moller (2016) which applied Pearson’s correlation and panel data analysis by
analyzing German companies. However, the findings of this research diverge from the resultsobtained by Santos, Araujo & Leite Filho (2016), since these authors evidenced an inverse asso-ciation between such variables in Brazilian civil construction companies by means of panel data.
Moreover, these results also differ from the findings of Sousa, Silva, Ribeiro & Weffort (2014),since when investigating Brazilian companies, by using Spearman correlation and panel data, theauthors did not verify the association between such variables. Therefore, it is emphasized that
such results may be specific of companies belonging to sectors with high environmental impact,and for this reason they need to pay special attention to the dissemination of social information.
In addition to such evidence, the difference observed in the strength of the degree of associationbetween the rankings of the first and the second period should be noted. This finding leads to the
assumption that there has been an increase in the importance attributed to the disclosure of socialinformation by the market at the present time. Still, it is suggested through such findings thatthe qualification of voluntary disclosure by companies can positively reflect their market value,
which stimulates the improvement of social disclosure in later periods.
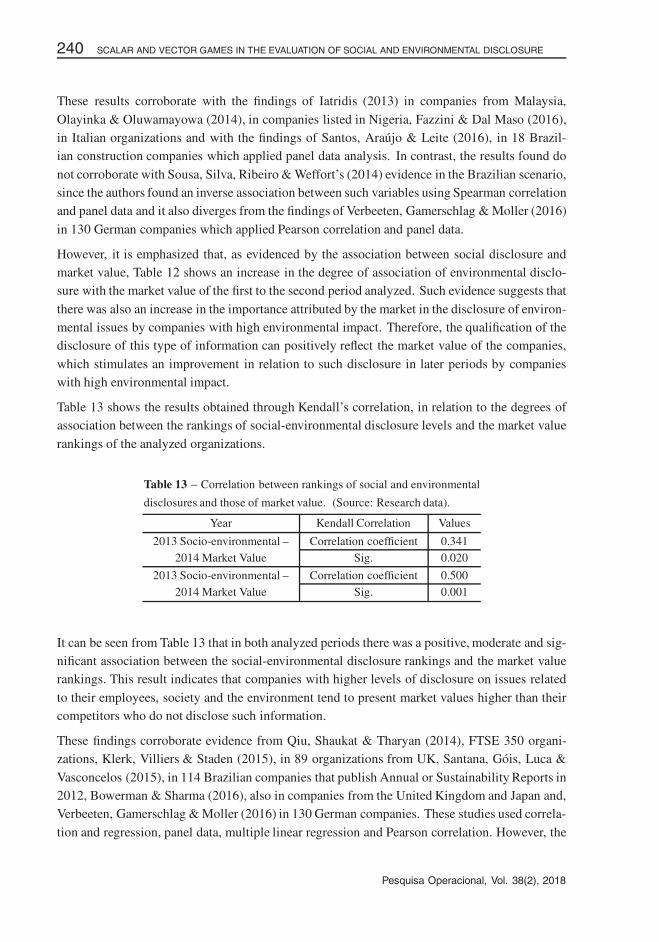
In relation to the results found through the association between the environmental rankings andthe market value rankings, verified through the Kendall correlation, they are exposed in Table 12.
Table 12 – Correlation between rankings of environmental disclosures
and those of market value. (Source: Research data).
Period Kendall Correlation Values
2013 Environmental Disclosure – Correlation coefficient 0.319
2014 Market Value Sig. 0.029
2014 Environmental Disclosure – Correlation coefficient 0.4712015 Market Value Sig. 0.001
As shown in Table 12, in both periods investigated there was a positive, moderate and signifi-
cant association between the rankings of the environmental disclosure level and the companies’market value rankings. These results indicate that companies with higher levels of environmentalevidence tend to have the highest market values during the periods investigated.
Pesquisa Operacional, Vol. 38(2), 2018
�
�
“main” — 2018/7/9 — 19:35 — page 240 — #26�
�
�
�
�
�
240 SCALAR AND VECTOR GAMES IN THE EVALUATION OF SOCIAL AND ENVIRONMENTAL DISCLOSURE
These results corroborate with the findings of Iatridis (2013) in companies from Malaysia,
Olayinka & Oluwamayowa (2014), in companies listed in Nigeria, Fazzini & Dal Maso (2016),in Italian organizations and with the findings of Santos, Araujo & Leite (2016), in 18 Brazil-ian construction companies which applied panel data analysis. In contrast, the results found do
not corroborate with Sousa, Silva, Ribeiro & Weffort’s (2014) evidence in the Brazilian scenario,since the authors found an inverse association between such variables using Spearman correlationand panel data and it also diverges from the findings of Verbeeten, Gamerschlag & Moller (2016)
in 130 German companies which applied Pearson correlation and panel data.
However, it is emphasized that, as evidenced by the association between social disclosure andmarket value, Table 12 shows an increase in the degree of association of environmental disclo-sure with the market value of the first to the second period analyzed. Such evidence suggests that
there was also an increase in the importance attributed by the market in the disclosure of environ-mental issues by companies with high environmental impact. Therefore, the qualification of thedisclosure of this type of information can positively reflect the market value of the companies,
which stimulates an improvement in relation to such disclosure in later periods by companieswith high environmental impact.
Table 13 shows the results obtained through Kendall’s correlation, in relation to the degrees ofassociation between the rankings of social-environmental disclosure levels and the market value
rankings of the analyzed organizations.
Table 13 – Correlation between rankings of social and environmental
disclosures and those of market value. (Source: Research data).
Year Kendall Correlation Values
2013 Socio-environmental – Correlation coefficient 0.3412014 Market Value Sig. 0.020
2013 Socio-environmental – Correlation coefficient 0.5002014 Market Value Sig. 0.001
It can be seen from Table 13 that in both analyzed periods there was a positive, moderate and sig-nificant association between the social-environmental disclosure rankings and the market valuerankings. This result indicates that companies with higher levels of disclosure on issues related
to their employees, society and the environment tend to present market values higher than theircompetitors who do not disclose such information.
These findings corroborate evidence from Qiu, Shaukat & Tharyan (2014), FTSE 350 organi-zations, Klerk, Villiers & Staden (2015), in 89 organizations from UK, Santana, Gois, Luca &
Vasconcelos (2015), in 114 Brazilian companies that publish Annual or Sustainability Reports in2012, Bowerman & Sharma (2016), also in companies from the United Kingdom and Japan and,Verbeeten, Gamerschlag & Moller (2016) in 130 German companies. These studies used correla-
tion and regression, panel data, multiple linear regression and Pearson correlation. However, the
Pesquisa Operacional, Vol. 38(2), 2018

�
�
“main” — 2018/7/9 — 19:35 — page 241 — #27�
�
�
�
�
�
ADRIANA KROENKE, VICTORIANA RUBIALES CABALLERO, BIANCA CECON and NELSON HEIN 241
results obtained in this research do not corroborate with the findings of Rover & Murcia (2010)
and Murcia & Santos (2012) in the Brazilian context using correlation and with the results ofMorais (2014) in companies in Portugal, Spain and Italy.
Reinforcing the results related to the association of social disclosure and environmental disclo-sure with the market value of the companies, Table 13 shows an increase in the strength of the
association from the first to the second period evaluated. This finding supports the idea that themarket is becoming more interested and valuing organizations with high environmental impactthat disclose information about their employees, society and the environment. Such finding en-
courages these organizations to highlight such issues in order to improve their perception inrelation to thee investors, resulting in a market value superior to their competitors who do notworry about such disclosure.
In addition, such evidence encourages further research to evaluate the consistency of such re-
lationships in later periods, since such studies would contribute to the analyzed organizations,assisting them in their dissemination practices on social and environmental issues.
5 CONCLUSIONS
After the use of the mathematical models, based on scalar and vector games, it can be concluded,
in relation to the positioning of the companies of the sample according to the level of socialdisclosure, that the companies that were in the best positions were Natura, Qgep Part, Vale, andBraskem, and in the last positions were Panatlantica, Petrorio, Dimed and Bradespar. Regarding
the accounting positioning of the sample companies, according to the level of environmentaldisclosure, Celul Irani, Vale and Ultrapar have the best positions. In contrast, the organizationswith the lowest levels of environmental disclosure were Panatlantica, Cremer, Dimed, Br Pharma
and Vitalyze.me.
Evaluating jointly the level of social and environmental disclosure of the organizations of highenvironmental impact belonging to the sample, it can be verified that among the companieswith the best levels of social and environmental disclosure are Natura, Vale, Celul Irani and
Fibria. In the lowest positions are Panatlantica, Dimed and Cremer. Regarding the rankingsof the organizations according to the market value, Petrobras, Vale, Ultrapar and Fibria oc-cupy the best positions, while Vitalyze.me, Elekeiroz, Fer Heringer and Panatlantica are in the
lowest rankings.
Regarding the association of social, environmental and socio-environmental disclosure with themarket value of Brazilian companies with high environmental impact, the results of this researchconverge with the conclusion of Dye (1985) regarding Voluntary Disclosure Theory. This fact
results from the empirical evidence that companies with higher levels of social, environmentaland socio-environmental voluntary disclosures tend to present market values superior to theircompetitors that disclose less information of these genres.
Finally, the results of the present study corroborate the research that affirms that greater voluntary
disclosure increases the competitive advantage of the company, since companies with greater
Pesquisa Operacional, Vol. 38(2), 2018
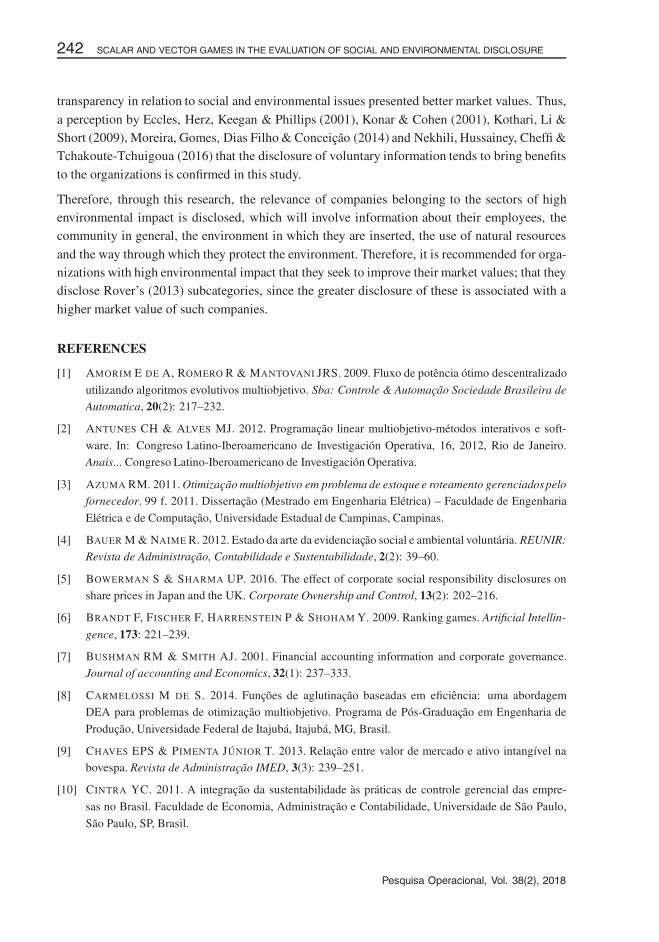
�
�
“main” — 2018/7/9 — 19:35 — page 242 — #28�
�
�
�
�
�
242 SCALAR AND VECTOR GAMES IN THE EVALUATION OF SOCIAL AND ENVIRONMENTAL DISCLOSURE
transparency in relation to social and environmental issues presented better market values. Thus,
a perception by Eccles, Herz, Keegan & Phillips (2001), Konar & Cohen (2001), Kothari, Li &Short (2009), Moreira, Gomes, Dias Filho & Conceicao (2014) and Nekhili, Hussainey, Cheffi &Tchakoute-Tchuigoua (2016) that the disclosure of voluntary information tends to bring benefits
to the organizations is confirmed in this study.
Therefore, through this research, the relevance of companies belonging to the sectors of highenvironmental impact is disclosed, which will involve information about their employees, thecommunity in general, the environment in which they are inserted, the use of natural resources
and the way through which they protect the environment. Therefore, it is recommended for orga-nizations with high environmental impact that they seek to improve their market values; that theydisclose Rover’s (2013) subcategories, since the greater disclosure of these is associated with a
higher market value of such companies.
REFERENCES
[1] AMORIM E DE A, ROMERO R & MANTOVANI JRS. 2009. Fluxo de potencia otimo descentralizado
utilizando algoritmos evolutivos multiobjetivo. Sba: Controle & Automacao Sociedade Brasileira de
Automatica, 20(2): 217–232.
[2] ANTUNES CH & ALVES MJ. 2012. Programacao linear multiobjetivo-metodos interativos e soft-
ware. In: Congreso Latino-Iberoamericano de Investigacion Operativa, 16, 2012, Rio de Janeiro.Anais... Congreso Latino-Iberoamericano de Investigacion Operativa.
[3] AZUMA RM. 2011. Otimizacao multiobjetivo em problema de estoque e roteamento gerenciadospelo
fornecedor. 99 f. 2011. Dissertacao (Mestrado em Engenharia Eletrica) – Faculdade de Engenharia
Eletrica e de Computacao, Universidade Estadual de Campinas, Campinas.
[4] BAUER M & NAIME R. 2012. Estado da arte da evidenciacao social e ambiental voluntaria. REUNIR:
Revista de Administracao, Contabilidade e Sustentabilidade, 2(2): 39–60.
[5] BOWERMAN S & SHARMA UP. 2016. The effect of corporate social responsibility disclosures onshare prices in Japan and the UK. Corporate Ownership and Control, 13(2): 202–216.
[6] BRANDT F, FISCHER F, HARRENSTEIN P & SHOHAM Y. 2009. Ranking games. Artificial Intellin-
gence, 173: 221–239.
[7] BUSHMAN RM & SMITH AJ. 2001. Financial accounting information and corporate governance.Journal of accounting and Economics, 32(1): 237–333.
[8] CARMELOSSI M DE S. 2014. Funcoes de aglutinacao baseadas em eficiencia: uma abordagemDEA para problemas de otimizacao multiobjetivo. Programa de Pos-Graduacao em Engenharia de
Producao, Universidade Federal de Itajuba, Itajuba, MG, Brasil.
[9] CHAVES EPS & PIMENTA JUNIOR T. 2013. Relacao entre valor de mercado e ativo intangıvel nabovespa. Revista de Administracao IMED, 3(3): 239–251.
[10] CINTRA YC. 2011. A integracao da sustentabilidade as praticas de controle gerencial das empre-
sas no Brasil. Faculdade de Economia, Administracao e Contabilidade, Universidade de Sao Paulo,
Sao Paulo, SP, Brasil.
Pesquisa Operacional, Vol. 38(2), 2018
�
�
“main” — 2018/7/9 — 19:35 — page 243 — #29�
�
�
�
�
�
ADRIANA KROENKE, VICTORIANA RUBIALES CABALLERO, BIANCA CECON and NELSON HEIN 243
[11] CORMIER D, MAGNAN M & VAN VELTHOVEN B. 2005. Environmental disclosure quality in large
German companies: economic incentives, public pressures or institutional conditions? European
Accounting Review, 14(1): 3–39.
[12] DIMAND MA & DIMAND RW. 1996. The history of game theory, Volume I: from the beginnings to1945. London: Routledge.
[13] DYE RA. 1985. Disclosure of nonproprietary information. Journal of Accounting Research, 23(1):
123–145.
[14] DYE RA. 2001. An evaluation of “essays on disclosure” and the disclosure literature in accounting.
Journal of Accounting and Economics, 32(1): 181–235.
[15] ECCLES RG, HERZ RH, KEEGAN EM & PHILLIPS DM. 2001. The Value Reporting revolution:moving beyond the earnings game. Price water house Coopers. New York: John Wiley & Sons, Inc.
[16] FAZZINI M & DAL MASO L. 2016. The value relevance of ‘assured’ environmental disclosure. The
Italian experience. Sustainability Accounting, Management and Policy Journal, 7(2): 225–245.
[17] FERNANDEZ FR & PUERTO J. 1996. Vector linear programming in zero-sum multicriteria matrix
games. Journal of Optimization Theory and Applications, 89: 115–127.
[18] FIANI R. 2004. Teoria dos jogos: para cursos de Administracao e economia. Rio de Janeiro: Elsevier.
[19] FRANCIS J, NANDA D & OLSSON P. 2008. Voluntary disclosure, earnings quality, and cost ofcapital. Journal of Accounting Research, 46(1): 53–99.
[20] HEALY PM & PALEPU KG. 2001. Information asymmetry, corporate disclosure, and the capitalmarkets: A review of the empirical disclosure literature. Journal of Accounting and Economics, 31(1):
405–440.
[21] IATRIDIS GE. 2013. Environmental disclosure quality: Evidence on environmental performance,corporate governance and value relevance. Emerging Markets Review, 14: 55–75.
[22] KAVESKI IDS. 2013. Grau de relacionamento entre os indicadores de mercado de capitais, os in-
dicadores economico-financeiro e o retorno da acao, nas empresas brasileiras. Programa de Pos-
Graduacao em Ciencias Contabeis da Universidade Regional de Blumenau, Blumenau, SC, Brasil.
[23] KLERK M, VILLIERS C & STADEN CV. 2015. The influence of corporate social responsibilitydisclosure on share prices: evidence from the United Kingdom. Pacific Accounting Review, 27(2):
208–228.
[24] KONAR S & COHEN MA. 2001. Does the market value environmental performance? Review of
Economics and Statistics, 83(2): 281–289.
[25] KOTHARI SP, LI X & SHORT JE. 2009. The effect of disclosures by management, analysts, andbusiness press on cost of capital, return volatility, and analyst forecasts: A study using content analy-
sis. The Accounting Review, 84(5): 1639–1670.
[26] KREUZBERG F. 2013. Indicadores economicos versus indicadores sociais: uma analise de empresaslistadas na BM&FBovespa por meio da teoria dos jogos. Programa de Pos-Graduacao em Ciencias
Contabeis da Universidade Regional de Blumenau, Blumenau, SC, Brasil.
[27] KROENKE A. 2014. Jogos vetoriais no posicionamento contabil das empresas de metalurgia e side-
rurgia listadas na BM&FBovespa. Programa de Pos-Graduacao em Metodos Numericos em Enge-nharia. Universidade Federal do Parana, Curitiba, PR, Brasil.
Pesquisa Operacional, Vol. 38(2), 2018
�
�
“main” — 2018/7/9 — 19:35 — page 244 — #30�
�
�
�
�
�
244 SCALAR AND VECTOR GAMES IN THE EVALUATION OF SOCIAL AND ENVIRONMENTAL DISCLOSURE
[28] KROENKE A, HEIN N & WILHELM VE. 2015. Jogos vetoriais como ferramenta de avaliacao
economico-financeira: um estudo multicriterio. In: SBPO – Simposio Brasileiro de Pesquisa Ope-racional, 2015, Porto de Galinhas. Anais... SBPO.
[29] LANZANA AP. 2004. Relacao entre disclosure e governanca corporativa das empresas brasileiras.165f. Dissertacao (Mestrado em Administracao) – Faculdade de Economia, Administracao e Con-
tabilidade, Universidade de Sao Paulo, Sao Paulo.
[30] LEONETI AB. 2016. Considerations regarding the choice of ranking multiple criteria decision makingmethods. Pesquisa. Operacional, 36(2): 259–277.
[31] LUCE D & RAIFFA H. 1957. Games and decisions. New York: John Wiley and Sons.
[32] MAGRO CBD, GORLA MC, KROENKE A & HEIN N. 2015. Ranking das cooperativas agropecua-rias: um estudo dos indicadores de desempenho e a relacao com atributos de governanca corporativa.
Organizacoes Rurais & Agroindustriais, 17(2): 253–268.
[33] MALACRIDA MJC & YAMAMOTO MM. 2006. Governanca corporativa: nıvel de evidenciacaodas informacoes e sua relacao com a volatilidade das acoes do Ibovespa. Revista Contabilidade e
Financas, 17: 65–79.
[34] MARMOL A & MONROY L. 1999. Aplicaciones economicas. In: BILBAO JM & FERNANDEZ FR
(Orgs.), Avances em teoria de juegos com aplicaciones economicas y sociales. Sevilla: Secretariadode publicaciones de la Universidad de Sevilla, 71–104.
[35] MARTINS G DE A & THEOPHILO CR. 2007. Metodologia da investigacao cientıfica para ciencias
sociais. Sao Paulo: Atlas.
[36] MONROY L & MARMOL AM. 1999. Estrategias de seguridad Pareto Optimas en modelos de inte-
raccion entre empresas. Cuadernos de Ciencias Economicas y Empresariales, 36: 7–16.
[37] MONROY L, MARMOL AM & RUBIALES V. 2008. A bargaining model for finite n-person multicri-teria games. International Game Theory Review, 11: 1–19.
[38] MORAIS MRPB DE. 2014. Corporate social responsibility levels and firm performance: Evidence
from countries in crisis. Faculdade de Economia, Universidade Nova de Lisboa, Lisboa, Portugal.
[39] MOREIRA NB, GOMES SM DA S, DIAS FILHO JM & CONCEICAO MG. 2014. Fatores que
Impactam a Divulgacao Voluntaria de Informacoes Socioambientais na Percepcao dos Gestores.REUNIR: Revista de Administracao, Contabilidade e Sustentabilidade, 4(1): 62–82.
[40] MURCIA FD. 2009. Fatores Determinantes do Nıvel de Disclosure Voluntario de Companhias Aber-
tas no Brasil. Faculdade de Economia, Administracao e Contabilidade, Universidade de Sao Paulo,Sao Paulo, SP, Brasil.
[41] MURCIA FD & SANTOS A DOS. 2012. Discretionary-based disclosure: evidence from the Brazilianmarket. BAR – Brazilian Administration Review, 9(1): 88–109.
[42] NEIVA RA. 1999. Valor de mercado da empresa: modelos de avaliacaoeconomico-financeira de em-
presas, exemplos de avaliacao com calculos de valores, subsıdios para privatizacao, compra e venda,cisao, fusao e incorporacao. 3 ed. Sao Paulo: Atlas.
[43] NEKHILI M, HUSSAINEY K, CHEFFI W & TCHAKOUTE-TCHUIGOUA H. 2016. R&D narrative
disclosure, corporate governance and market value: Evidence from France. Journal of Applied Busi-
ness Research, 32(1): 1–38.
Pesquisa Operacional, Vol. 38(2), 2018
�
�
“main” — 2018/7/9 — 19:35 — page 245 — #31�
�
�
�
�
�
ADRIANA KROENKE, VICTORIANA RUBIALES CABALLERO, BIANCA CECON and NELSON HEIN 245
[44] OLAYINKA AO & OLUWAMAYOWA IO. 2014. Corporate environmental disclosures and market
value of quoted companies in Nigeria. The Business & Management Review, 5(3): 171–184.
[45] OSTOLAZA MCN. 1969. Problema de Adopcion de Decisiones Frente a la Incentidumbre en la Agri-
cultura. Revista de Estudios Agrosociales, 68: 7–21.
[46] PLM. 2009. Programacao Linear e Mista v. 3.0. Blumenau: Copyright.
[47] PUERTO J, HINOJOSA MA, MARMOL AM, MONROY L & FERNANDEZ FR. 1999. Solution con-cepts for multiple objective n-person games. Investigacao Operacional, 19: 193–209.
[48] QIU Y, SHAUKAT A & THARYAN R. 2014. Environmental and social disclosures: Link with corpo-rate financial performance. The British Accounting Review, 30: 1–15.
[49] RAO SS. 1996. Engineering optimization: theory and practice. 3 ed. USA: John Wiley & Sons.
[50] ROVER S. 2013. Disclosure socioambiental e custo de capital proprio de companhias abertas
no Brasil. Faculdade de Economia, Administracao e Contabilidade, Universidade de Sao Paulo,
Sao Paulo, SP, Brasil.
[51] ROVER S & MURCIA FD. 2010. Influencia do Disclosure Voluntario Economico e Socioambientalno Custo de Capital Proprio das Empresas Brasileiras. In: CONGRESSO ANPCONT, 4., 2010, Natal.
Anais... ANPCONT.
[52] ROVER S & SANTOS A. 2014. Revisitando os Determinantes do Disclosure Voluntario Socioambi-ental no Brasil: Em Busca de Robustez na Mensuracao da Variavel Socioambiental. Contabilometria,
1(2): 15–35.
[53] RUBIALES V, MONROY L & MARMOL AM. 2017. Diseno de un ranking relativo con indicadores
multicriterio. Una aplicacion al sector bancario espanol. XI Reunion del Grupo Espanol de DecisionMulticriterio. Malaga, Espana.
[54] SALOTTI BM & YAMAMOTO MM. 2005. Ensaio sobre a teoria da divulgacao. BBR – Brazilian
Business Review, 2(1): 53–70.
[55] SANTANA LM DE, GOIS AD, LUCA MMM DE & VASCONCELOS AC DE. 2015. Relacao entre
disclosure socioambiental, praticas de governanca corporativa e desempenho empresarial. Revista
Organizacoes em Contexto, 11(21): 49–72.
[56] SANTOS LM DA S, ARAUJO RA DE M & LEITE FILHO PAM. 2016. Divulgacao Voluntaria
e o Valor de Mercado: Um Estudo nas Empresas Brasileiras de Construcao Civil Listadas naBM&FBovespa. In: CONGRESSO ANPCONT, 10, 2016, Ribeirao Preto. Anais... ANPCONT.
[57] SOBHANI FA, AMRAN A & ZAINUDDIN Y. 2009. Revisiting the practices of corporate social
and environmental disclosure in Bangladesh. Corporate Social Responsibility and Environmental
Management, 16(3): 167–183.
[58] SOUZA CB. 2013. Valor de mercado e disclosure voluntario: estudo empırico em companhias listadasna BM&FBOVESPA. 101 f. Dissertacao (Mestrado em Ciencias Contabeis) – Fundacao Escola de
Comercio Alvares Penteado – FECAP, Sao Paulo.
[59] SOUSA CB DE, SILVA AF DA, RIBEIRO M DE S & WEFFORT EFJ. 2014. Valor de mercado e dis-closure voluntario: estudo empırico em companhias listadas na BM&FBOVESPA. Revista Ambiente
Contabil, 6(2): 94–115.
[60] IBM SPSS. 2013. IBM SPSS statistics 22. New York: IBM Corp.
Pesquisa Operacional, Vol. 38(2), 2018

�
�
“main” — 2018/7/9 — 19:35 — page 246 — #32�
�
�
�
�
�
246 SCALAR AND VECTOR GAMES IN THE EVALUATION OF SOCIAL AND ENVIRONMENTAL DISCLOSURE
[61] UYAR A & KILIC M. 2012. Value relevance of voluntary disclosure: evidence from Turkish firms.
Journal of Intellectual Capital, 13(3): 363–376.
[62] VERBEETEN FHM, GAMERSCHLAG R & MOLLER K. 2016. Are CSR disclosures relevant for
investors? Empirical evidence from Germany. Management Decision, 54(6): 1359–1382.
[63] VERRECCHIA RE. 1983. Discretionary disclosure. Journal of Accounting and Economics, 5:179–194.
[64] YAMAMOTO MM & SALOTTI BM. 2006. Informacao contabil: estudos sobre a sua divulgacao no
mercado de capitais. Sao Paulo: Atlas.
[65] ZELENY M. 1976. Linear Multiobjetive Programming. Berlin: Springer Verlag.
[66] ZELENY, M. 1982. Multiple criteria decision making. New Yor: McGraw-Hill.
Pesquisa Operacional, Vol. 38(2), 2018