adsorption and microfiltration processes to treat dye and
TRANSCRIPT

Cleveland State UniversityEngagedScholarship@CSU
ETD Archive
2018
Adsorption and Microfiltration Processes to TreatDye and Coffee Wastewater.Abhiram Siva Prasad PamulaCleveland State University
Follow this and additional works at: https://engagedscholarship.csuohio.edu/etdarchive
Part of the Civil Engineering Commons, and the Environmental Engineering CommonsHow does access to this work benefit you? Let us know!
This Thesis is brought to you for free and open access by EngagedScholarship@CSU. It has been accepted for inclusion in ETD Archive by anauthorized administrator of EngagedScholarship@CSU. For more information, please contact [email protected].
Recommended CitationPamula, Abhiram Siva Prasad, "Adsorption and Microfiltration Processes to Treat Dye and Coffee Wastewater." (2018). ETD Archive.1101.https://engagedscholarship.csuohio.edu/etdarchive/1101
ADSORPTION AND MICROFILTRATION PROCESSES TO TREAT DYE AND
COFFEE WASTEWATER
ABHIRAM SIVA PRASAD PAMULA
Bachelor of Technology in Civil Engineering
Indian Institute of Technology
June 2014
Submitted in partial fulfillment of requirements for the degree
MASTER OF SCIENCE IN ENVIRONMENTAL ENGINEERING
at the
CLEVELAND STATE UNIVERSITY
May 2018

We hereby approve this thesis
for
ABHIRAM SIVA PRASAD PAMULA
Candidate for the Master of Science in Environmental Engineering for the
Department of Civil and Environmental Engineering
at
CLEVELAND STATE UNIVERSITY’S
College of Graduate Studies by
Student’s Date of Defense April 24, 2018
Dr. Yung-Tse Hung, Thesis Committee Chairperson
Department of Civil and Environmental Engineering
Date
Dr. Walter M. Kocher
Department of Civil and Environmental Engineering
Date
Dr. Lili Dong
Department of Electrical Engineering and Computer Science
Date
Dr. Chung-Yi Suen
Department of Mathematics
Date
Dr. Howard Paul
Department of Information Systems
Date

DEDICATION
This work is dedicated to my parents and family members for their constant support.

ACKNOWLEDGEMENTS
I am thankful to God for giving me this wonderful opportunity to work on the
thesis. I am very thankful for my mother Mrs. Sudharani Pamula and my late father Mr.
Veeresam Pamula. There are no words to convey my gratitude and respect for my thesis
advisor Dr. Yung-Tse-Hung, Ph.D., P.E., DEE, Professor of Civil and Environmental
Engineering, Cleveland State University. He has been helpful in my research and gave
me guidance and continuous support during my master’s in Environmental Engineering.
I would like to thank the committee members Dr. Walter Kocher, Associate
Professor of Civil and Environmental Engineering, Dr. Lili Dong, Associate Professor of
Electrical and Computer Engineering, Dr. Chung-Yi Suen, Professor of Mathematics, and
Dr. Howard Paul, Associate Professor of Information systems at Cleveland State
University for serving in my M.S thesis committee and giving their valuable inputs for
the improvement of my research.
Also, I would like to thank Dr. Lutful Khan, Chair & Associate Professor of Civil
& Environmental Engineering for his support and Washkewicz College of Engineering
for giving me this opportunity. I would like to thank Ms. Diane Tupa, Secretary of Civil
& Environmental Engineering for providing thesis students with the lab access and
keeping me updated with the lab equipment status. I would like to thank Mr. James.W.
Barker, Technician, College of Engineering, Cleveland State University, Ms Karen K.
Jackson, Technician, College of Engineering, Cleveland State University, Mr. Ali
Kaddah, Technician, College of Engineering, Cleveland State University for their
assistance with the Total organic carbon (TOC) analyzer.

I would like to thank my fellow graduate students Venkatesh Kummarakuntla,
Harsha Madiraju, Nikita Shamirpet, Olwatobiloba Akinwande for their help and support
in the laboratory. It was a memorable experience to work and study with my friends. I
would like to thank my wife Srilakshmi Vykuntapu for always being supportive in every
step I have taken in my life. She is a wonderful companion and my best friend.

vi
ADSORPTION AND MICROFILTRATION PROCESSES TO TREAT DYE AND
COFFEE WASTEWATER
ABHIRAM SIVA PRASAD PAMULA
ABSTRACT
Wastewater from coffee processing industry creates high biological and chemical
oxygen demand in the surface water. In addition to coffee wastewater from coffee
industry, dyes from textile industry enter surface water affecting water quality in terms of
transmissivity of light. Adsorption is an economical wastewater treatment process to
remove color from dye and coffee wastewater.
In the current thesis, adsorption using low-cost adsorbents like peanut hull and
onion peel are used to treat combined dye and coffee wastewater. Three representative
dyes including acid black 48, disperse yellow 3, crystal violet certified with processed
coffee is used in preparing batch adsorption samples. Using UV-Vis Spectrophotometer,
absorbance and transmittance of the wastewater samples are measured. After adsorbents
reach adsorption capacity, the suspended solids are removed using Whatman 41
microfilters. To understand the change in organic carbon before and after treatment in the
wastewater, NPOC (Non-Purgeable Organic Carbon) is compared using Shimadzu TOC
analyzer.
This thesis focuses on the two-stage treatment process of adsorption and
microfiltration in a binary mixture of dye and coffee wastewater. Increasing Adsorbent
dosage in the representative wastewater samples gives us the idea of optimum dosage
required in the treatment process. The comparative study of adsorbent dosage with
vii
transmittance and NPOC gives us an understanding of the efficiency of low-cost
adsorbents when compared to Powdered Activated Carbon.
Keywords: Adsorption, Micro-filtration, Non-purgeable Organic Carbon (NPOC), Dye
and coffee wastewater, Total Suspended Solids (TSS)
viii
TABLE OF CONTENTS
ABSTRACT……………………………………………………………………….
LIST OF TABLES………………………………………………………………...
LIST OF FIGURES……………………………………………………………….
CHAPTER
I. INTRODUCTION………………………………………………………
1.1 Introduction…………………………………............................
1.2 Objectives……………………………………………………...
II. LITERATURE REVIEW………………………………………………
2.1 Dyes…………………………………………………………...
2.2 Classification of dyes………………………………………….
2.2.1 Classification based on chemical structure…………..
2.2.2 Classification based on origin………………………
2.2.3 Classification based on industrial usage………...….
2.3 Dyes in wastewater……………………………………………
2.4 Coffee wastewater…………………………………………….
2.5 Acid black 48………………………………………………….
2.6 Crystal violet ………………………………………………….
2.7 Disperse yellow 3……………………………………………...
2.8 Dye wastewater quality parameters…………………...............
2.9 Absorbance…………………………………………………….
2.10 Transmittance………………………………………………...
Page
vi
xi
xv
1
1
2
4
4
5
5
6
7
7
7
8
8
9
9
10
10

ix
2.11 NPOC………………………………………………………...
2.12 Treatment technologies in dye wastewater………………….
2.13 Adsorption……………………………………………………
2.14 Adsorption of dyes…………………………………………...
2.15 Effect of adsorbent dosage…………………………………...
2.16 Effect of pH………………………………………………….
2.17 Effect of temperature………………………………………...
2.18 Effect of dye adsorbent contact time ………………………...
2.19 Types of adsorbents………………………………………….
2.20 Membrane filtration………………………………………….
2.21 Microfiltration……………………………………………….
III. MATERIALS AND METHODS……………………………………...
3.1 Dyes used……………………………………………………...
3.2 Adsorbents used……………………………………………….
3.3 Equipment used……………………………………………….
3.4 Adsorbent preparation…………………………........................
3.5 Method………………………………………………………...
3.6 Run protocol…………………………………………………...
IV. RESULTS & DISCUSSION………………………………………….
4.1 Results…………………………………………………………
4.2 Results on effects of pH ….…………………………………...
4.3 Results of isotherms and isotherm coefficients...……………...
4.4 Discussion on effects of parameters on color removal……….
10
11
11
12
12
13
13
13
14
14
15
16
16
16
16
17
17
18
46
46
55
56
56

x
V. CONCLUSION………………………………………………………...
5.1 Conclusion……………………………………………………
5.2 Significance and application………………………………….
5.3 Recommendations on future research…………………………
REFERENCES………………………………………….........................................
APPENDICES
A. TABLES…………………………………………………………...
B. FIGURES………………………………………………………….
57
57
58
58
59
62
76

xi
LIST OF TABLES
Table Page
I.
Run protocol of low strength acid black 48 with PAC………………
19
II. Run protocol of medium strength acid black 48 with PAC…………...
20
III. Run protocol of high strength acid black 48 with PAC…….…………
21
IV. Run protocol of low strength acid black 48 with peanut hull……….... 22
V. Run protocol of medium strength acid black 48 with peanut hull……. 23
VI. Run protocol of high strength acid black 48 with peanut hull……… 24
VII. Run protocol of low strength acid black 48 with onion peel………….. 25
VIII. Run protocol of medium strength acid black 48 with onion peel…….. 26
IX. Run protocol of high strength acid black 48 with onion peel………… 27
X. Run protocol of low strength crystal violet certified with PAC………. 28
XI. Run protocol of medium strength crystal violet with PAC…………… 29
XII. Run protocol of high strength crystal violet with PAC……………….. 30
XIII. Run protocol of low strength crystal violet with peanut hull………….
31
XIV. Run protocol of medium strength crystal violet with peanut hull……
32
XV. Run protocol of high strength crystal violet with peanut hull…………
33
XVI. Run protocol of low strength crystal violet with onion peel…………..
34
XVII. Run protocol of medium strength crystal violet with onion peel……... 35
XVIII. Run protocol of high strength crystal violet with onion peel………….
36
XIX. Run protocol of low strength disperse yellow 3 with PAC…………… 37
XX. Run protocol of medium strength disperse yellow 3 with PAC………. 38

xii
XXI. Run protocol of high strength disperse yellow 3 with PAC…............... 39
XXII. Run protocol of low strength disperse yellow 3 with peanut hull…… 40
XXIII. Run protocol of medium strength disperse yellow 3 with peanut hull
41
XXIV. Run protocol of high strength disperse yellow 3 with peanut hull……. 42
XXV. Run protocol of low strength disperse yellow 3 with onion peel……... 43
XXVI. Run protocol of medium strength disperse yellow 3with onion peel….
44
XXVII. Run protocol of high strength disperse yellow 3 with onion peel…….. 45
XXVIII. Transmittance of acid black 48 at optimum size and dosage…………
47
XXIX. Transmittance of crystal violet at optimum size and dosage…………
48
XXX. Transmittance of disperse yellow 3 at optimum size and dosage……..
49
XXXI. NPOC of combined acid black 48 and coffee wastewater…………….
50
XXXII. NPOC of combined crystal violet and coffee wastewater……………..
52
XXXIII. NPOC of combined disperse yellow 3 and coffee wastewater………..
54
XXXIV. Transmittance of acid black 48 with PAC at low concentration………
62
XXXV. Transmittance of acid black 48 with PAC at medium concentration….
62
XXXVI. Transmittance of acid black 48 with PAC at high concentration……..
63
XXXVII. Transmittance of acid black 48 with peanut hull at low concentration.
63
XXXVIII. Transmittance of acid black 48 with peanut hull at medium
concentration…………………………………………………………..
64
XXXIX. Transmittance of acid black 48 with peanut hull at high concentration.
64
XL. Transmittance of acid black 48 with onion peel at low concentration...
65
XLI. Transmittance of acid black 48 with onion peel at medium
concentration..........................................................................................
65

xiii
XLII. Transmittance of acid black 48 with onion peel at high
concentration…………………………………………………………..
66
XLIII. Transmittance of crystal violet with PAC at low
concentration…………………………………………………………..
66
XLIV. Transmittance of crystal violet with PAC at medium
concentration…………………………………………………………
67
XLV. Transmittance of crystal violet with PAC at high concentration……...
67
XLVI. Transmittance of crystal violet with peanut hull at low
concentration…………………………………………………………
68
XLVII. Transmittance of crystal violet with peanut hull at medium
concentration..........................................................................................
68
XLVIII. Transmittance of crystal violet with peanut hull at high
concentration…………………………………………………………..
69
XLIX. Transmittance of crystal violet with onion peel at low concentration... 69
L. Transmittance of crystal violet with onion peel at medium
concentration…………………………………………………………..
70
LI. Transmittance of crystal violet with onion peel at high
concentration…………………………………………………………..
70
LII. Transmittance of disperse yellow 3 with PAC at low
concentration…………………………………………………………..
71
LIII. Transmittance of disperse yellow 3 with PAC at medium
concentration…………………………………………………………..
71
LIV. Transmittance of disperse yellow 3 with PAC at high concentration… 72
LV. Transmittance of disperse yellow 3 with peanut hull at low
concentration...………………………………………………………...
72
LVI. Transmittance of disperse yellow 3 with peanut hull at medium
concentration…………………………………………………………..
73
LVII. Transmittance of disperse yellow 3 with peanut hull at high
concentration…………………………………………………………..
73
LVIII. Transmittance of disperse yellow 3 with onion peel at low
concentration. …………………………………………………………
74

xiv
LIX. Transmittance of disperse yellow 3 with onion peel at medium
concentration…………………………………………………………..
74
LX. Transmittance of disperse yellow 3 with onion peel at high
concentration…………………………………………………………..
75

xv
LIST OF FIGURES
Figure Page
1. Transmittance of acid black 48 at optimum size and dosage …………..……….
47
2. Transmittance of crystal violet at optimum size and dosage…………….……...
48
3. Transmittance of disperse yellow 3 at optimum size and dosage……….………
49
4. NPOC of high concentration acid black 48 with three adsorbents………..…….
51
5. NPOC of high concentration crystal violet with three adsorbents……….……...
53
6. NPOC of high concentration disperse yellow 3 with three adsorbents…….…...
55
7. Comparison of transmittance before and after treatment in low concentration
acid black 48………………………………………….…………………….…….
76
8. Comparison of transmittance before and after treatment in medium
concentration acid black 48…………………………………..…...…………….
76
9. Comparison of transmittance before and after treatment in high concentration
acid black 48………………………………………………………….………….
77
10. Comparison of transmittance before and after treatment in low concentration
acid black 48……………………………………………………………….…….
77
11. Comparison of transmittance before and after treatment in medium
concentration acid black 48……………………………..……………………….
78
12. Comparison of transmittance before and after treatment in high concentration
acid black 48………………………………………………………………..…….
78
13. Comparison of transmittance before and after treatment in low concentration
acid black 48……………………………………………….……………….…….
79
14. Comparison of transmittance before and after treatment in medium
concentration acid black 48……………………………..……………………….
79
15. Comparison of transmittance before and after treatment in high concentration
acid black 48……………………………………………………………….…….
80
16.
Comparison of transmittance before and after treatment in low concentration
crystal violet ………………………………..…………………………..……….
80

xvi
17. Comparison of transmittance before and after treatment in medium
concentration crystal violet ………………………………..…………………….
81
18. Comparison of transmittance before and after treatment in high concentration
crystal violet ……………………………………………...………..…………….
81
19. Comparison of transmittance before and after treatment in low concentration
crystal violet……………………………………………………………..……….
82
20. Comparison of transmittance before and after treatment in medium
concentration crystal violet …………………………………..………………….
82
21. Comparison of transmittance before and after treatment in high concentration
crystal violet …………………………………………………………….……….
83
22. Comparison of transmittance before and after treatment in low concentration
crystal violet ………………………………………..………………...………….
83
23. Comparison of transmittance before and after treatment in medium
concentration crystal violet …………………………………………..………….
84
24. Comparison of transmittance before and after treatment in high concentration
crystal violet ………………………………………………………………….….
84
25. Comparison of transmittance before and after treatment in low concentration
disperse yellow 3………………………………………………………….……...
85
26. Comparison of transmittance before and after treatment in medium
concentration disperse yellow 3…………………………..……………………...
85
27. Comparison of transmittance before and after treatment in high concentration
disperse yellow 3………………………………………………………………....
86
28. Comparison of transmittance before and after treatment in low concentration
disperse yellow 3………………………………………………………….……...
86
29. Comparison of transmittance before and after treatment in medium
concentration disperse yellow 3…………………………..……………………...
87
30. Comparison of transmittance before and after treatment in high concentration
disperse yellow 3………………………………………………………………...
87
31.
Comparison of transmittance before and after treatment in low concentration
disperse yellow 3………………………………………………………………...
88

xvii
32. Comparison of transmittance before and after treatment in medium
concentration disperse yellow 3……………………………………………..…...
88
33. Comparison of transmittance before and after treatment in high concentration
disperse yellow 3…………………………………………………………….…...
.
89
34. Langmuir isotherm model of acid black 48 adsorption on PAC…………..…….
90
35. Langmuir isotherm model of acid black 48 adsorption on peanut hull……….....
90
36. Langmuir isotherm model of acid black 48 adsorption on onion peel……...…..
91
37. Freundlich isotherm model of acid black 48 adsorption on peanut hull………..
91
38. Freundlich isotherm model of acid black 48 adsorption on peanut hull………..
92
39. Freundlich isotherm model of acid black 48 adsorption on onion peel………….
92
40. Langmuir isotherm model of crystal violet adsorption on PAC………………...
93
41. Langmuir isotherm model of crystal violet adsorption on peanut hull……….…
93
42. Langmuir isotherm model of crystal violet adsorption on onion peel…………..
94
43. Freundlich isotherm model of crystal violet adsorption on PAC…………….…
94
44. Freundlich isotherm model of crystal violet adsorption on peanut hull………..
95
45. Freundlich isotherm model of crystal violet adsorption on onion peel……........
95
46. Langmuir isotherm model of disperse yellow 3 adsorption on PAC…………....
96
47. Langmuir isotherm model of disperse yellow 3 adsorption on peanut hull…….
96
48. Langmuir isotherm model of disperse yellow 3 adsorption on onion peel……...
97
49. Freundlich isotherm model of disperse yellow 3 adsorption on PAC…………..
97
50. Freundlich isotherm model of disperse yellow 3 adsorption on peanut hull........
98
51. Freundlich isotherm model of disperse yellow 3 adsorption on onion peel……..
98
52. Plot of pH with varying adsorbents used in the color removal………………….
99

1
CHAPTER I
INTRODUCTION
1.1 Introduction
In the contemporary world, water resources are exploited due to increasing usage
in agriculture and industry. According to United States Geological Survey (USGS), about
355,000 (MGD) of water was withdrawn for use (1). This can create water stress in
certain areas and increase the energy demand for the water and wastewater treatment. For
pumping and treatment of water and wastewater approximately 3-4% of energy i.e. 4*
1013 btu is used in the united states annually (2). This can create both energy and an
environmental burden due to the depletion of energy resources like fossil fuels and
increase the greenhouse gas (GHG) emissions. This creates the need for low cost and
economical treatment technologies to be used in water and wastewater treatment
processes.
Apart from the increase in water usage, point and non-point sources of pollution
are contaminating surface water in lakes, rivers with synthetic chemicals which are
difficult to treat. Coffee is the second largest consuming commodity after crude oil and
other subsidiary fuels creates a lot of wastewater with effluent containing organic waste
2
that can increase the Biological oxygen demand in the surface water. Industries like
textile, pharmaceutical, paper and pulp use large amount of water in processing and daily
operations. This result in large quantities of wastewater being produced by these
industries which can reduce dissolved oxygen in the aquatic environment.
Dyes used in these industries influence water quality due to change in color and
prevent sunlight to pass through water. Some of the organic chemicals in the textile dyes
are resistant to biological degradation (3). Wastewater of combined coffee and dye can
contain complex chemical compounds which might be difficult to treat. Colored dyes not
only affect the transparency of water but also can be mutagenic, cancerous, and toxic (3).
The chemical structure of the dyes makes them resistant to fading on exposure to
sunlight. They are difficult to decolorize due to synthetic nature and complex structure.
To treat dye wastewater various methods are used such as photocatalytic oxidation,
ozonation, and electrochemical Destruction (4). For effective and economic treatment of
the dye wastewater adsorption technique is used with adsorbents like Activated Carbon,
Peanut hull Ash and Onion Peel. Adsorption is widely used because of the low capital
cost and efficiency in removing color. To maintain water quality, an additional treatment
stage of membrane filtration is used.
1.2 Objectives
The objective of the thesis is to observe and analyze the treatment of dye and coffee
wastewater using low-cost adsorbents. Summary of the objectives are in the following
manner
1. Studying the color removal and increasing the transparency of wastewater using
adsorption and microfiltration.
3
2. Analyzing the BOD removal using Total Organic Carbon in the wastewater after
combined adsorption and microfiltration processes.
3. Understanding the dye strength and removal trend of the adsorbent using the plot
of transmittance vs adsorbent dosage
4. Observing the water quality after two-stage treatment of adsorption and micro-
filtration

4
CHAPTER II
LITERATURE REVIEW
2.1 Dyes
Dye is a colored, ionizing, and aromatic compound that has an affinity towards a
substrate to which they are applied. They are generally applied to aqueous solutions
and most of them are soluble in water. Dyes have the property to absorb light
between the wavelength (400-700 nm) i.e. the visible range. Dyes are colored
because of the presence of chromophore which is responsible for absorbing and
varying the electromagnetic radiation. This property of color and affinity towards
water makes the dye a significant pollutant in the wastewater effluent of various
textile industries (5).
Biological wastewater treatment is not effective in the treatment of dye
wastewater because of the synthetic origin and complex aromatic structure which
makes them stable. Based on the ionic properties of dyes they are categorized as
cationic, anionic, and non-ionic.

5
2.2 Classification of dyes
Dyes can be classified based on several ways. Each type of dye has a unique
chemical structure and bonding characteristics. Based on certain important factors
dyes are classified as follows:
1. Classification of dyes based on chemical structure
2. Classification based on the origin
3. Classification based on applicability or industrial usage
2.2.1 Classification based on chemical structure
Chemical classification of the dye is based on the chromophore present in their
structures. Some of them are as follows:
1. Azo dyes
2. Nitro or nitroso dyes
3. Triaryl methane dyes
4. Anthraquinone dyes
5. Indigo dyes
Azo dyes are synthetic organic dyes that contain the nitrogen as the azo group
such as -N=N- as the chromophore in the chemical structure. They are commercial and
highly colored. They are mostly prepared by azo coupling of the amine with an aromatic
compound (5). Some of them are methyl orange, congo red and so on.
Nitro or Nitroso dyes contain nitro groups as chromophore and OH- as auxo
chrome. Nitroso dyes are aromatic compounds that are resistant to light and heat which
are commonly used for dyeing rubbers in the production of wallpapers and paint
6
industry. Some of the nitro and nitroso dyes are naphthol yellow, naphthol green B,
mordant green.
Triaryl methane dyes are synthetic organic compounds which have
triphenylmethane backbone in the structure. Some of the examples are malachite green,
phenolphthalein.
Anthraquinone dyes are organic compounds which have ketone groups in the
central ring. They are poorly soluble in water but highly soluble in the organic solvents.
Some of the examples of anthraquinone dyes are alizarin, anthrapyrimidine yellow.
Indigo dye is an organic compound which is usually extracted from indigo. It
contains carbonyl chromophore. It is used for dyeing textiles and in the production of
denim jeans.
2.2.2 Classification based on origin
Dyes can be classified based on the source of material. They are mainly classified as
follows:
1. Natural Dyes
2. Synthetic Dyes
Natural dyes
Natural dyes are colorants derived from natural sources like plants, minerals, and
other invertebrates. Dyeing process has been used in the textile industry by humans for
thousands of years. Fabrics like silk and wool can be colored by simply dipping in dye
water but cotton requires a mordant such as alum to evenly distribute the color. Some of
the examples of natural dyes are madder, cochineal.

7
Synthetic dyes
Dyes derived from complex organic and inorganic compounds by man are called
synthetic dyes. William Henry Perkin accidentally discovered the first synthetic dye in
search of finding a cure for malaria. Since the discovery, they are produced in large scale
because of the low production costs and easy application to the fabric. Some of the
synthetic dyes are acid dyes, azo dyes, reactive dyes, disperse dyes and so on.
2.2.3 Classification based on industrial usage
Most dyes are used in the Textile industry for dyeing fabrics. Classification of the
dye in the industries is based on the applicability of dye and fabric. Some of the dyes
used are azo dyes, direct dyes, vat dyes, basic dyes, fiber-reactive dyes.
2.3 Dyes in wastewater
Textile industries use large amounts of water in the dyeing process. This results in
a high volume of dye wastewater enter the surface water. The most significant
environmental concern of dye in surface water is that it absorbs and reflect sunlight.
Absorption of sunlight reduces the photosynthesis of algae which in turn affects the food
chain. The half-life of dyes is very high which makes them remain in the environment for
a long time. Due to their stability they are difficult to treat using biological treatment
processes. Some of the azo dyes used in the textile industry contains benzidine which is a
known carcinogen. Dye wastewater due to the complex aromatic structure and synthetic
nature is difficult to treat biologically and not easily biodegradable (6).
2.4 Coffee wastewater
Coffee wastewater is the effluent of coffee processing industry. Coffee produced
using wet milling process takes large amount of water and release contaminants in the
8
surface water. The resulting effluent after coffee processing contains high amounts of
sugar and pectin. The sugar and pectin can be broken down to acetic acid by dissolved
oxygen. Depleting DO (Dissolved Oxygen) results in high BOD (Biological Oxygen
Demand) and COD (Chemical Oxygen Demand). Also, the fermentation process used in
the effluent from pulpers in the coffee processing pH of the water may be dropped from 7
to 4. This can create acidic conditions in surface water and affect aquatic life (7,8).
2.5 Acid black 48
Acid black 48 is a non-disperse, anthraquinone dye. It has the physical
characteristic of grey to navy blue color. It has sulfonic acid groups which render the
solubility in water. The dye has the affinity to fabric without the need of auxiliary
binding agents such as mordants.
The structure of acid black 48 contains amine and sodium hexane sulfonate groups with
ketone in the central ring. Anthraquinone dyes are commercially not widely used because
they are not cost effective (9).
2.6 Crystal violet certified
Crystal violet is a basic dye which is positively charged. This property makes the
dye bond with negative charged materials such as acrylics and other synthetic materials.
It is triaryl methane dye which can be used as histological stain and Gram’s method of
classifying bacteria. It has antibacterial, antifungal characteristics and was formerly used
as an antiseptic in tropical medication. It has veterinary uses such as prevent the growth
of fungi in poultry feed due to its mutagenic and bacteriostatic agent characteristics.
9
Due to its physical and chemical characteristics, crystal violet persists in
environment for long time and poses toxic effects. It is a potential carcinogen and
promotes tumor growth in fish affecting food chain (10).
2.7 Disperse yellow 3
Disperse Yellow 3 belongs to the group of azo dyes that are not easily soluble in
water. They are identified with the physical characteristic of yellow powder. Being a part
of azo dye, Disperse Yellow 3 can be used in dyeing of fabrics. It has the characteristic of
chromophore azo group (-N=N-). It has been banned by European Union because of the
skin sensitizing and allergic properties of the dye. The World Health Organization
(WHO) has categorized the dye as a potential carcinogen. Some lab rats exposed to the
disperse yellow 3 has developed benign liver tumors. Azo dyes have lower water
solubility but, when released to surface water they remain in low concentrations (11).
Azo disperse dyes are likely to deposit as sediment in soil if they are released into the soil
in the form of sludge. This low solubility of azo disperse dyes in water and volatility in
the environment, the bioavailability of the dye to the aquatic species is very high.
2.8 Dye wastewater quality parameters
To describe the quality of dye and coffee wastewater we have considered
spectrophotometer parameters like absorbance and transmittance. Distilled water is
considered as a benchmark for calibration with the absorbance of monochromatic light
being 0 and transmittance 100.
Spectrophotometry can be used to calculate water quality parameters like COD
(Chemical Oxygen Demand), BOD (Biological Oxygen Demand) and concentration of
contaminants in the water. Hence the parameters we have considered like absorbance and

10
transmittance is proportional to the concentration of dye and coffee wastewater using
beer lambert’s law.
2.9Absorbance
Absorbance is the measurement of amount of UV/Visible light absorbed by a
given sample. Matter in the wastewater samples such as organics, color and nitrates can
attract light in different regions of UV-Vis spectrum wavelength. It is given by
where T is transmittance along the path length of the cell (12).
2.10 Transmittance
Transmittance is the fraction of electromagnetic light that pass through the batch
sample. Transmittance T is defined as , where Ф𝑝 represents the amount of radiant
flux passing through the cell and Ф𝑟 represents the amount of radiant flux received by the
incident light. For an example if a monochromatic light is passed through a sample then
when 40% (A =0.2218) of light is absorbed the remaining 60% is the transmittance. The
relation between absorbance and transmittance can be theoretically observed using beer-
lambert’s law (13).
2.11 NPOC
NPOC stands for Non-purgeable organic carbon. This component is used to
measure the organic carbon of the sample after purging the purgeable organic carbon by
adding Hydrochloric acid. When adding the acid IC (Inorganic Carbon) is removed with
POC (Purgeable Organic Carbon) in the form of CO2.When a sample contains no
inorganic carbon then the TC can be referred to as NPOC. Therefore NPOC = TC – IC

11
When there are Volatile organic compounds in the sample then NPOC is measured as
TC-IC (Total Carbon – Inorganic Carbon)
2.12 Treatment technologies in dye wastewater treatment
There are several treatment processes involved in treating dye wastewater. To
obtain maximum efficiency and economic viability combined biological with physio-
chemical process are used in the dye wastewater treatment plant. Some of the treatment
process involves coagulation, adsorption, electrochemical destruction and so on.
2.13 Adsorption
Adsorption is defined as a process in which contaminants are adhered to the
surface. In a solution where the particles come in to contact with a surface that contains
pores to adhere to. This surface phenomenon is because of the electrostatic attraction
between the solute particles and the surface of the body in the solution. The contaminants
or solute particles which are adhered to the surface are called adsorbate. The solid body
on which the particles are accumulated is called adsorbent. Based on the nature of forces
acting between the adsorbate and adsorbent, the adsorption process can be classified in to
physisorption and chemisorption (14).
In physisorption the nature of bonding involved between adsorbate and adsorbent
are the weak van der Waals forces. It is reversible in nature. It is an exothermic process
where the heat energy is released in the binding process. Chemisorption mainly occurs
because of the covalent bonding between the contaminants and the surface of adsorbent.
Chemical adsorption is irreversible. It is an exothermic process but occurs slowly at high
temperatures (15).
12
2.14 Adsorption of dyes
To treat dye wastewater from textile industries adsorption is considered as an
effective treatment process. Synthetic textile dyes contain organic pollutants which are
complex to degrade biologically. This makes the aerobic biological treatment process
ineffective to treat dyes in wastewater. Based on several case studies it is observed that
activated carbon being an adsorbent gives excellent results in removing color from dye
wastewater. But engineering requires a cost-effective treatment to make the treatment
process economical.
Hence, several low-cost adsorbents like rice husk ash, fly ash can be used to treat
dye wastewater. In a municipal wastewater treatment plant activated carbon can be
prepared from sludge. It is cost effective and an efficient way to dispose waste. The
sludge contains high nutrients and carbonaceous material that cannot be allowed to be
disposed in to land directly (15). Hence activated carbon directly produced at the
wastewater treatment plant can be considered as the low-cost adsorbent to treat
wastewater.
2.15 Effect of adsorbent dosage on dye wastewater
The effect of adsorbent dosage can be observed with change in transmittance. As
predicted the percentage removal of color is directly proportional to the adsorbent
dosage. As the dose increases the removal capacity reaches to a threshold because of the
excess availability of the adsorbent that is accessible to adsorbate. Initially adding
adsorbent provides extra surface area and larger number of sorption sites for the
adsorbate to get adhered to the surface of the adsorbent. As the adsorbent sites increase
more than required the treatment efficiency do not increase due to saturation (16).

13
2.16 Effect of pH
pH is a very important factor in the dye wastewater adsorption process. The
electrostatic forces vary according to the pH of the aqueous solution. Therefore, the pH
of the dye wastewater plays an important role in the adsorption process. Let us consider
an adsorbent which is electropositive. For cationic dyes at lower pH indicating that more
positive (H+) ions decrease the amount of dye to be adsorbed because of the less negative
charged adsorption sites in the adsorbent (17). For anionic dyes the at low pH the
percentage of dye removal increases because of the more positive adsorbent sites.
2.17 Effect of temperature
Adsorption is affected by several factors including change in temperature. In the
adsorption process two major factors are affected i.e., the equilibrium with respect to the
exothermicity and the swelling capacity of the adsorbent. The uptake of the contaminants
usually depends on whether the process of adsorption is exothermic or endothermic. To
understand whether the adsorption process is endothermic or exothermic depends majorly
on Gibbs free energy, enthalpy, and entropy in the adsorption process with change in
temperature (18).
2.18 Effect of dye adsorbent contact time
The effect of adsorbent varies with the dye contact time. Based on the reference it
is observed that as the contact time increased from 5 to 24 hrs. the %absorbance
increased from 78 to 88% (19). During the initial period of the contact time i.e. in the
first 30 mins the rate of adsorption is rapid due to strong electrostatic forces between dye
and adsorbent. After reaching the saturation of adsorption capacity i.e. after attaining the
equilibrium, the rate of adsorption is constant. The main reason of adsorption being

14
constant after reaching the saturated adsorption capacity is because of all the available
adsorbent surface being filled with the adsorbate.
2.19 Types of adsorbents
Industrially adsorbents are classified in to three categories. They are as follows
Carbon based- Typically hydrophobic and nonpolar
Polymer based- In a porous polymer matrix, they might be polar on non-polar
Oxygen containing adsorbents- Typically hydrophilic such as Silica gel and
zeolites Based on origin adsorbents are classified as natural and synthetic.
Natural adsorbents used in the process of adsorption include, clay, graphite,
charcoal, zeolites and so on. Synthetic adsorbents include byproducts of agricultural and
industrial waste such as fly ash, rice husk ash, Peanut hull, Onion Peel and so on.
Adsorption capacity of an adsorbent depends on surface area and pore size distribution of
the adsorbent material (20).
2.20 Membrane filtration methods
Membrane filtration or separation process are used to remove contaminants in the
solution by passing the solution through a semipermeable membrane. The separation
process of contaminants from the solution depends on the driving force or pressure acting
on the semipermeable membrane. Membrane filtration technologies based on the pore
size of the membranes are as follows: Microfiltration, Ultra-filtration, Nano-filtration,
and reverse osmosis (21).

15
2.21 Microfiltration
Microfiltration is the separation process where suspended particles or inorganics
are removed by using a semi-permeable membrane. The separation process is based on
driving pressure acting on the membrane. The membranes used in the microfiltration
process are designed to remove particles such as sediment, algae, and large bacteria.
Although the separation process has wide variety of applications in water treatment
process. It is widely used in the treatment of potable water supply.
The main advantage of using the membranes in the treatment of water is because
of averting chemicals such as chlorine being used as a traditional disinfectant (22). This
makes the membrane process a two-stage treatment including filtration and disinfection
together. The only disadvantage in membrane separation process is fouling. Fouling i.e.
deposition of sediments on the semipermeable membrane decreases the flux capacity and
overall efficiency of the membrane (23,24).
16
CHAPTER III
MATERIALS AND METHODS
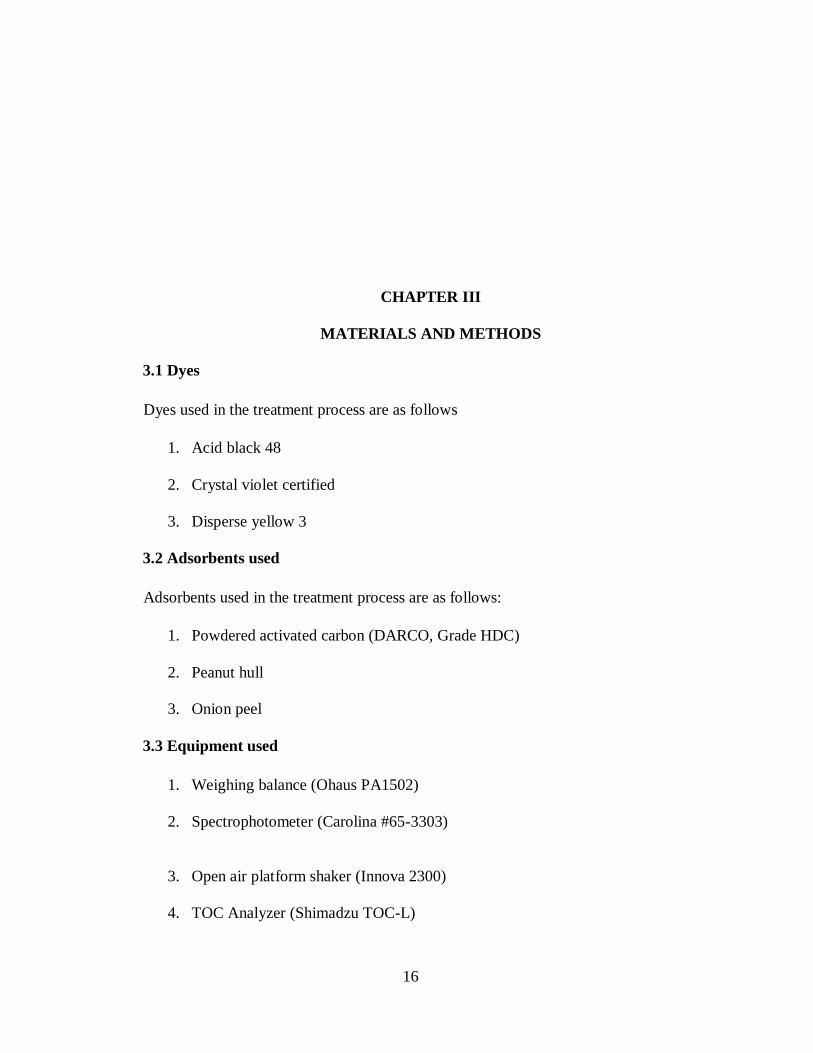
3.1 Dyes
Dyes used in the treatment process are as follows
1. Acid black 48
2. Crystal violet certified
3. Disperse yellow 3
3.2 Adsorbents used
Adsorbents used in the treatment process are as follows:
1. Powdered activated carbon (DARCO, Grade HDC)
2. Peanut hull
3. Onion peel
3.3 Equipment used
1. Weighing balance (Ohaus PA1502)
2. Spectrophotometer (Carolina #65-3303)
3. Open air platform shaker (Innova 2300)
4. TOC Analyzer (Shimadzu TOC-L)
17
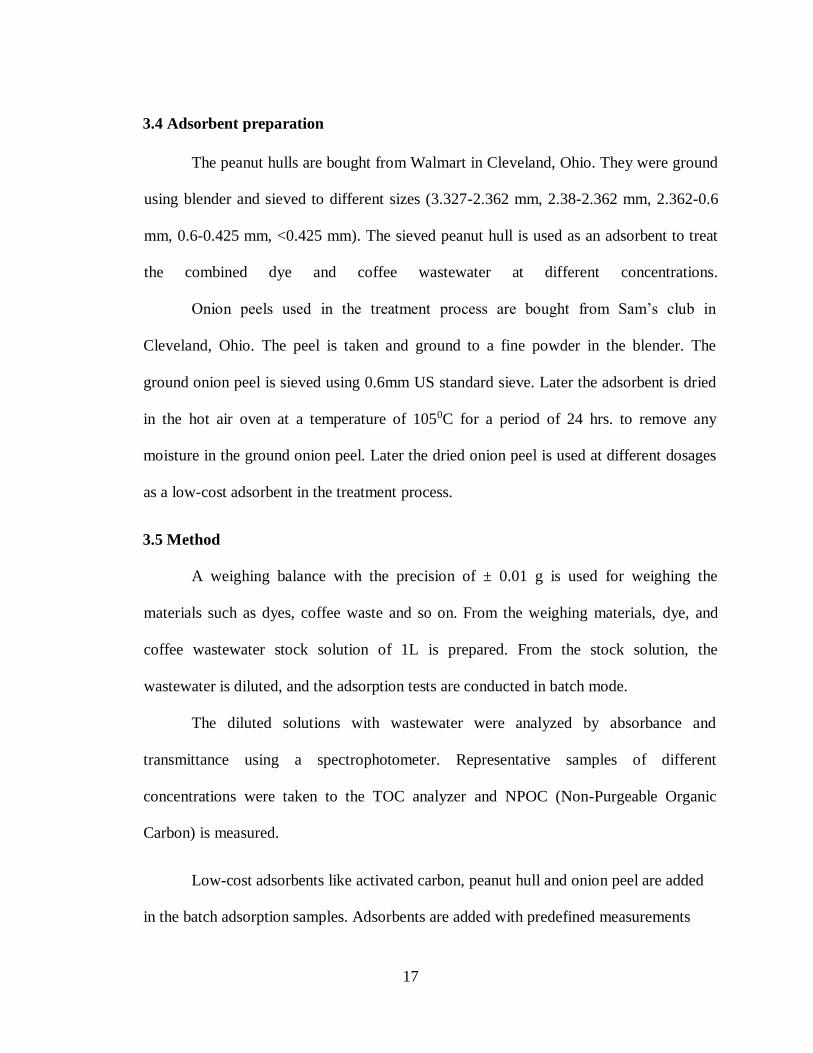
3.4 Adsorbent preparation
The peanut hulls are bought from Walmart in Cleveland, Ohio. They were ground
using blender and sieved to different sizes (3.327-2.362 mm, 2.38-2.362 mm, 2.362-0.6
mm, 0.6-0.425 mm, <0.425 mm). The sieved peanut hull is used as an adsorbent to treat
the combined dye and coffee wastewater at different concentrations.
Onion peels used in the treatment process are bought from Sam’s club in
Cleveland, Ohio. The peel is taken and ground to a fine powder in the blender. The
ground onion peel is sieved using 0.6mm US standard sieve. Later the adsorbent is dried
in the hot air oven at a temperature of 1050C for a period of 24 hrs. to remove any
moisture in the ground onion peel. Later the dried onion peel is used at different dosages
as a low-cost adsorbent in the treatment process.
3.5 Method
A weighing balance with the precision of ± 0.01 g is used for weighing the
materials such as dyes, coffee waste and so on. From the weighing materials, dye, and
coffee wastewater stock solution of 1L is prepared. From the stock solution, the
wastewater is diluted, and the adsorption tests are conducted in batch mode.
The diluted solutions with wastewater were analyzed by absorbance and
transmittance using a spectrophotometer. Representative samples of different
concentrations were taken to the TOC analyzer and NPOC (Non-Purgeable Organic
Carbon) is measured.
Low-cost adsorbents like activated carbon, peanut hull and onion peel are added
in the batch adsorption samples. Adsorbents are added with predefined measurements

18
and put on the shaker where the samples are mixed at 100 rpm for 1 minute (Fast Shake)
and 30 rpm for 1 hour (Slow shake). After shaking and mixing the samples are left to
settle for an hour. The samples are filtered using microfilters (Whatman 41) with pore
size 20-25 µm. After combined adsorption and microfiltration, absorbance and
transmittance values are analyzed using the spectrophotometer. With the remaining
treated sample NPOC values are measured using the Shimadzu TOC analyzer
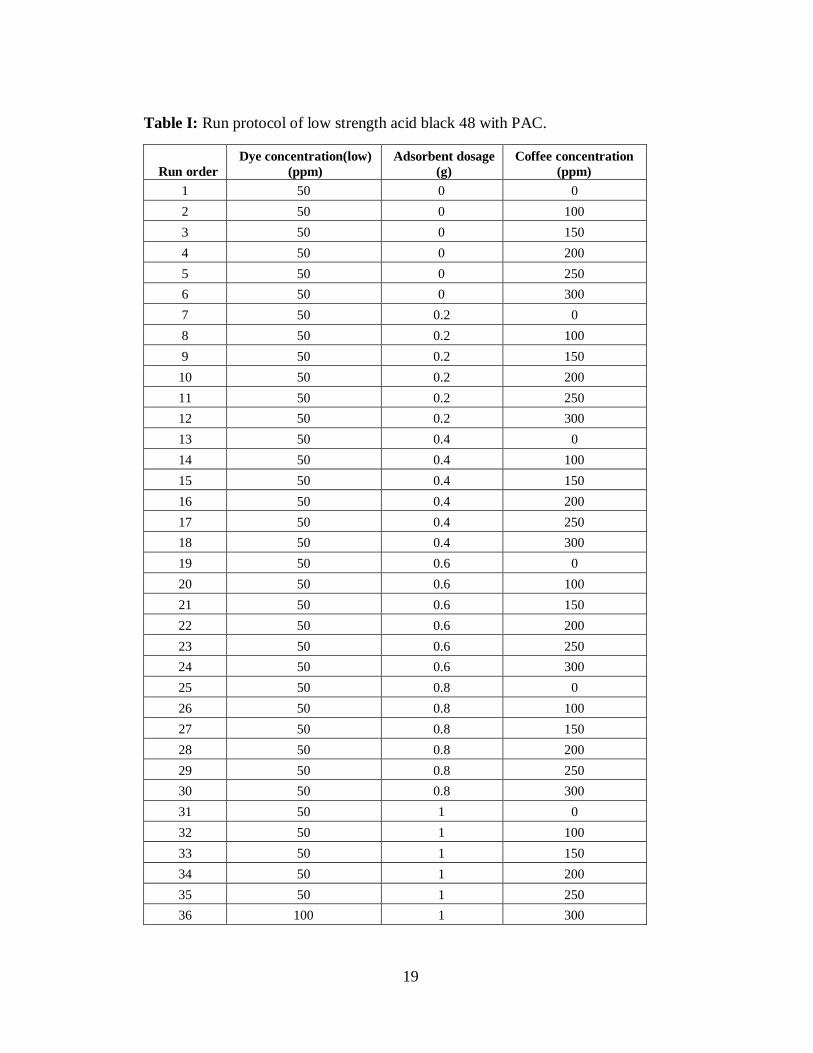
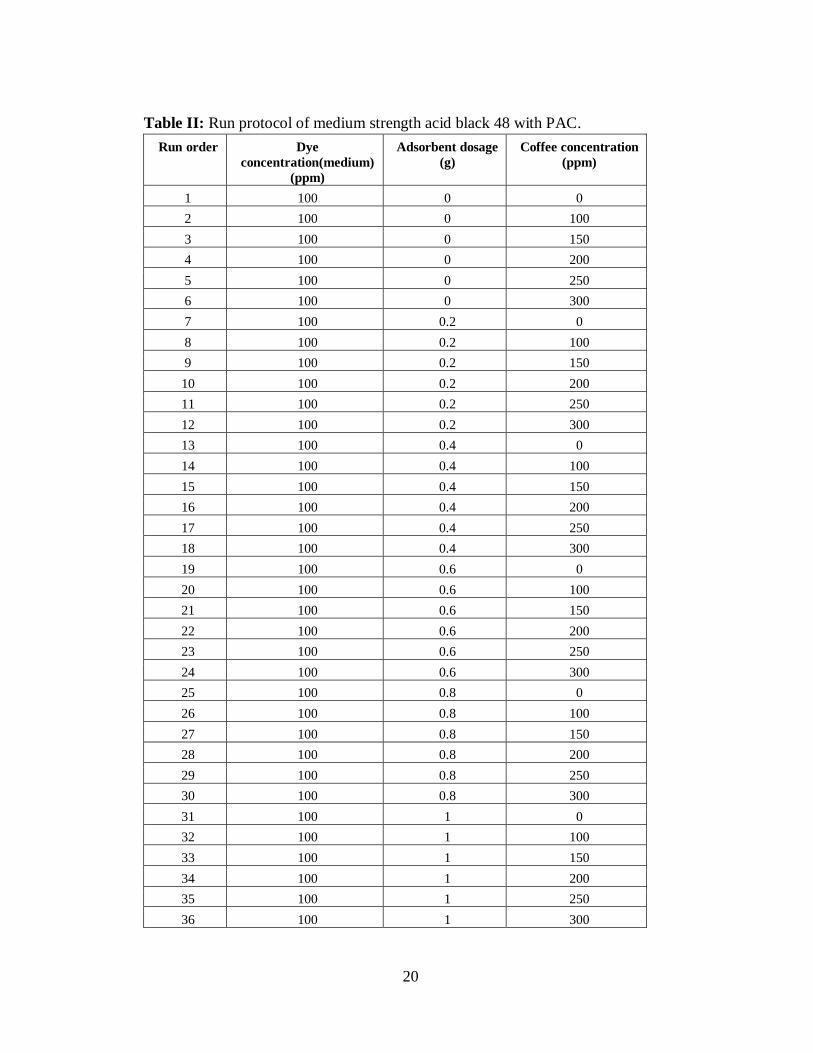
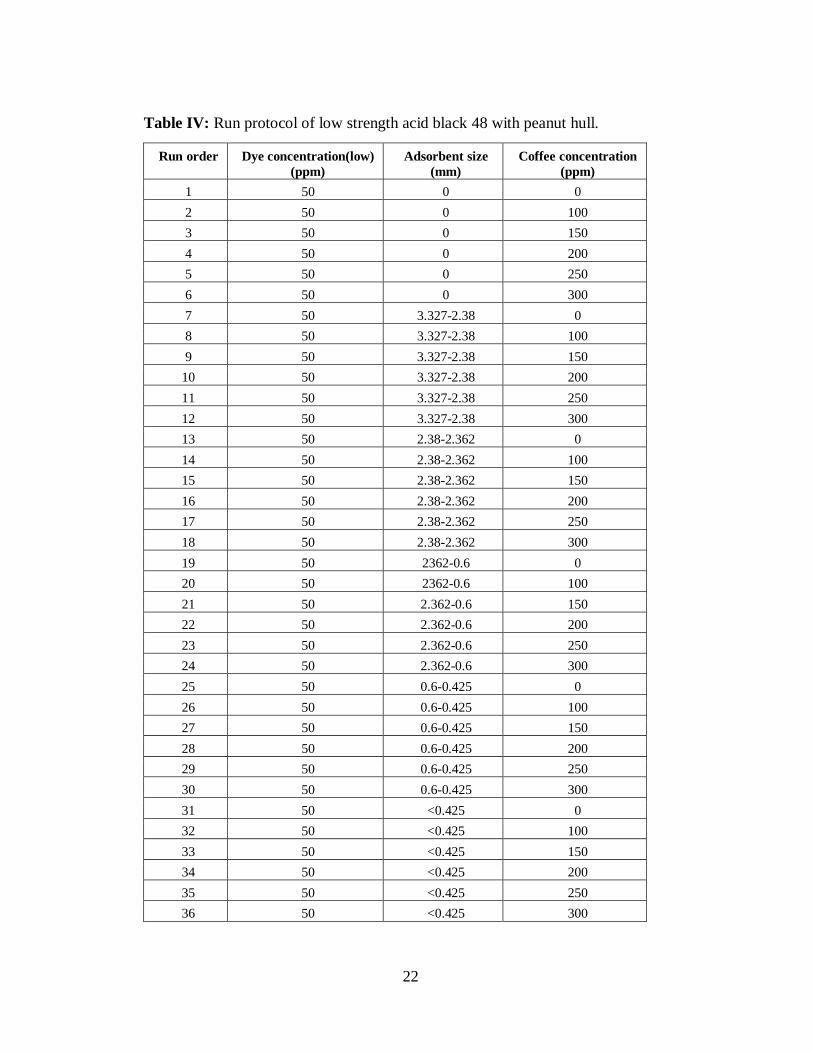
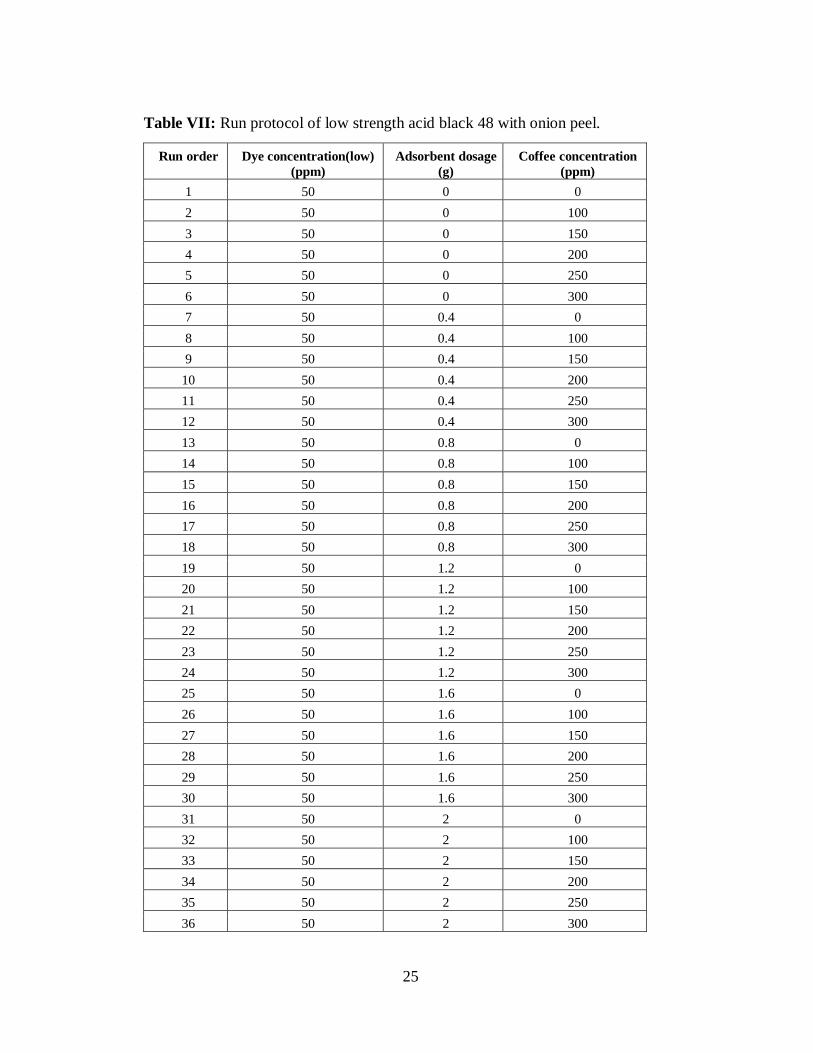
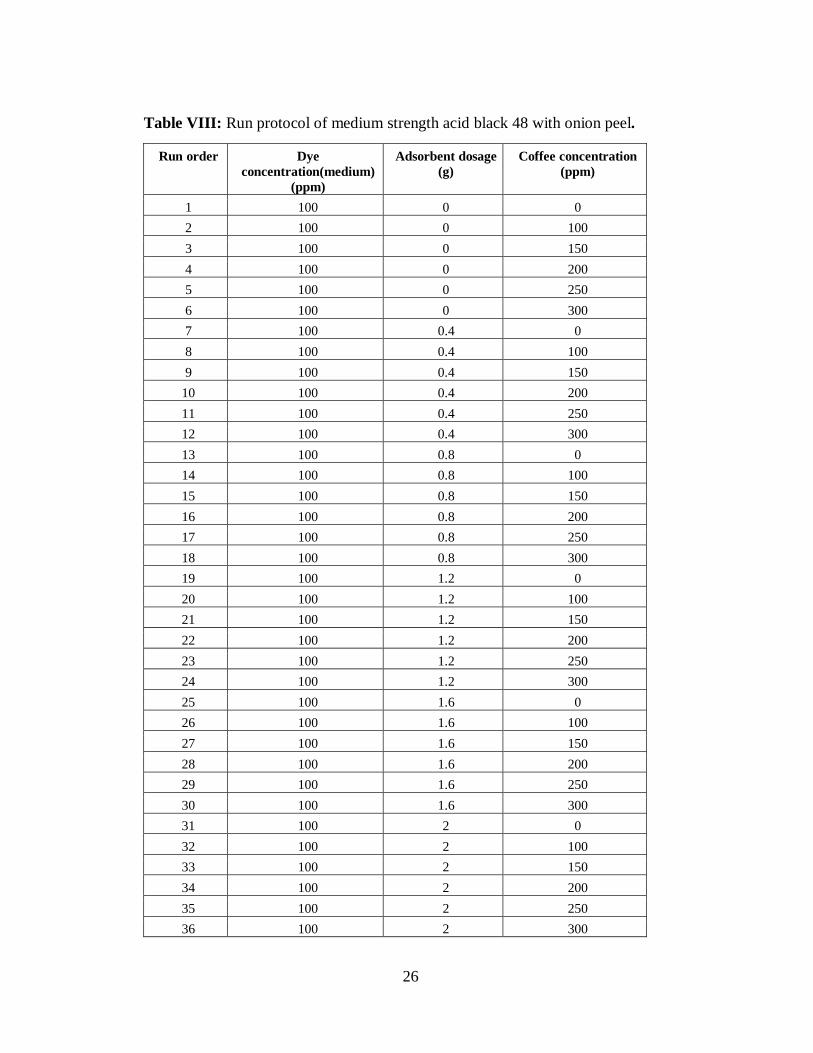
3.6 Run protocols
Table 1 to Table 27 are the tables of run protocols for this research study. The parameters
which are varied in this research consist of type of dyes and concentration of dye
wastewater and concentration of coffee wastewater type of adsorbent and dosage of
adsorbent
19
Table I: Run protocol of low strength acid black 48 with PAC.
Run order
Dye concentration(low)
(ppm)
Adsorbent dosage
(g)
Coffee concentration
(ppm)
1 50 0 0
2 50 0 100
3 50 0 150
4 50 0 200
5 50 0 250
6 50 0 300
7 50 0.2 0
8 50 0.2 100
9 50 0.2 150
10 50 0.2 200
11 50 0.2 250
12 50 0.2 300
13 50 0.4 0
14 50 0.4 100
15 50 0.4 150
16 50 0.4 200
17 50 0.4 250
18 50 0.4 300
19 50 0.6 0
20 50 0.6 100
21 50 0.6 150
22 50 0.6 200
23 50 0.6 250
24 50 0.6 300
25 50 0.8 0
26 50 0.8 100
27 50 0.8 150
28 50 0.8 200
29 50 0.8 250
30 50 0.8 300
31 50 1 0
32 50 1 100
33 50 1 150
34 50 1 200
35 50 1 250
36 100 1 300
20
Table II: Run protocol of medium strength acid black 48 with PAC.
Run order Dye
concentration(medium)
(ppm)
Adsorbent dosage
(g)
Coffee concentration
(ppm)
1 100 0 0
2 100 0 100
3 100 0 150
4 100 0 200
5 100 0 250
6 100 0 300
7 100 0.2 0
8 100 0.2 100
9 100 0.2 150
10 100 0.2 200
11 100 0.2 250
12 100 0.2 300
13 100 0.4 0
14 100 0.4 100
15 100 0.4 150
16 100 0.4 200
17 100 0.4 250
18 100 0.4 300
19 100 0.6 0
20 100 0.6 100
21 100 0.6 150
22 100 0.6 200
23 100 0.6 250
24 100 0.6 300
25 100 0.8 0
26 100 0.8 100
27 100 0.8 150
28 100 0.8 200
29 100 0.8 250
30 100 0.8 300
31 100 1 0
32 100 1 100
33 100 1 150
34 100 1 200
35 100 1 250
36 100 1 300

21
Table III: Run protocol of high strength acid black 48 with PAC.
Run order
Dye concentration(high)
(ppm) Adsorbent dosage
(g)
Coffee concentration
(ppm)
1 200 0 0
2 200 0 100
3 200 0 150
4 200 0 200
5 200 0 250
6 200 0 300
7 200 0.2 0
8 200 0.2 100
9 200 0.2 150
10 200 0.2 200
11 200 0.2 250
12 200 0.2 300
13 200 0.4 0
14 200 0.4 100
15 200 0.4 150
16 200 0.4 200
17 200 0.4 250
18 200 0.4 300
19 200 0.6 0
20 200 0.6 100
21 200 0.6 150
22 200 0.6 200
23 200 0.6 250
24 200 0.6 300
25 200 0.8 0
26 200 0.8 100
27 200 0.8 150
28 200 0.8 200
29 200 0.8 250
30 200 0.8 300
31 200 1 0
32 200 1 100
33 200 1 150
34 200 1 200
35 200 1 250
36 200 1 300
22
Table IV: Run protocol of low strength acid black 48 with peanut hull.
Run order Dye concentration(low)
(ppm)
Adsorbent size
(mm)
Coffee concentration
(ppm)
1 50 0 0
2 50 0 100
3 50 0 150
4 50 0 200
5 50 0 250
6 50 0 300
7 50 3.327-2.38 0
8 50 3.327-2.38 100
9 50 3.327-2.38 150
10 50 3.327-2.38 200
11 50 3.327-2.38 250
12 50 3.327-2.38 300
13 50 2.38-2.362 0
14 50 2.38-2.362 100
15 50 2.38-2.362 150
16 50 2.38-2.362 200
17 50 2.38-2.362 250
18 50 2.38-2.362 300
19 50 2362-0.6 0
20 50 2362-0.6 100
21 50 2.362-0.6 150
22 50 2.362-0.6 200
23 50 2.362-0.6 250
24 50 2.362-0.6 300
25 50 0.6-0.425 0
26 50 0.6-0.425 100
27 50 0.6-0.425 150
28 50 0.6-0.425 200
29 50 0.6-0.425 250
30 50 0.6-0.425 300
31 50 <0.425 0
32 50 <0.425 100
33 50 <0.425 150
34 50 <0.425 200
35 50 <0.425 250
36 50 <0.425 300

23
Table V: Run protocol of medium strength acid black 48 with peanut hull.
Run order Dye
concentration(medium)
(ppm)
Adsorbent size
(mm)
Coffee concentration
(ppm)
1 100 0 0
2 100 0 100
3 100 0 150
4 100 0 200
5 100 0 250
6 100 0 300
7 100 3.327-2.38 0
8 100 3.327-2.38 100
9 100 3.327-2.38 150
10 100 3.327-2.38 200
11 100 3.327-2.38 250
12 100 3.327-2.38 300
13 100 2.38-2.362 0
14 100 2.38-2.362 100
15 100 2.38-2.362 150
16 100 2.38-2.362 200
17 100 2.38-2.362 250
18 100 2.38-2.362 300
19 100 2362-0.6 0
20 100 2362-0.6 100
21 100 2.362-0.6 150
22 100 2.362-0.6 200
23 100 2.362-0.6 250
24 100 2.362-0.6 300
25 100 0.6-0.425 0
26 100 0.6-0.425 100
27 100 0.6-0.425 150
28 100 0.6-0.425 200
29 100 0.6-0.425 250
30 100 0.6-0.425 300
31 100 <0.425 0
32 100 <0.425 100
33 100 <0.425 150
34 100 <0.425 200
35 100 <0.425 250
36 100 <0.425 300

24
Table VI: Run protocol of high strength acid black 48 with peanut hull.
Run order Dye
concentration(high)
(ppm)
Adsorbent size
(mm)
Coffee concentration
(ppm)
1 200 0 0
2 200 0 100
3 200 0 150
4 200 0 200
5 200 0 250
6 200 0 300
7 200 3.327-2.38 0
8 200 3.327-2.38 100
9 200 3.327-2.38 150
10 200 3.327-2.38 200
11 200 3.327-2.38 250
12 200 3.327-2.38 300
13 200 2.38-2.362 0
14 200 2.38-2.362 100
15 200 2.38-2.362 150
16 200 2.38-2.362 200
17 200 2.38-2.362 250
18 200 2.38-2.362 300
19 200 2362-0.6 0
20 200 2362-0.6 100
21 200 2.362-0.6 150
22 200 2.362-0.6 200
23 200 2.362-0.6 250
24 200 2.362-0.6 300
25 200 0.6-0.425 0
26 200 0.6-0.425 100
27 200 0.6-0.425 150
28 200 0.6-0.425 200
29 200 0.6-0.425 250
30 200 0.6-0.425 300
31 200 <0.425 0
32 200 <0.425 100
33 200 <0.425 150
34 200 <0.425 200
35 200 <0.425 250
36 200 <0.425 300
25
Table VII: Run protocol of low strength acid black 48 with onion peel.
Run order Dye concentration(low)
(ppm)
Adsorbent dosage
(g)
Coffee concentration
(ppm)
1 50 0 0
2 50 0 100
3 50 0 150
4 50 0 200
5 50 0 250
6 50 0 300
7 50 0.4 0
8 50 0.4 100
9 50 0.4 150
10 50 0.4 200
11 50 0.4 250
12 50 0.4 300
13 50 0.8 0
14 50 0.8 100
15 50 0.8 150
16 50 0.8 200
17 50 0.8 250
18 50 0.8 300
19 50 1.2 0
20 50 1.2 100
21 50 1.2 150
22 50 1.2 200
23 50 1.2 250
24 50 1.2 300
25 50 1.6 0
26 50 1.6 100
27 50 1.6 150
28 50 1.6 200
29 50 1.6 250
30 50 1.6 300
31 50 2 0
32 50 2 100
33 50 2 150
34 50 2 200
35 50 2 250
36 50 2 300
26
Table VIII: Run protocol of medium strength acid black 48 with onion peel.
Run order Dye
concentration(medium)
(ppm)
Adsorbent dosage
(g)
Coffee concentration
(ppm)
1 100 0 0
2 100 0 100
3 100 0 150
4 100 0 200
5 100 0 250
6 100 0 300
7 100 0.4 0
8 100 0.4 100
9 100 0.4 150
10 100 0.4 200
11 100 0.4 250
12 100 0.4 300
13 100 0.8 0
14 100 0.8 100
15 100 0.8 150
16 100 0.8 200
17 100 0.8 250
18 100 0.8 300
19 100 1.2 0
20 100 1.2 100
21 100 1.2 150
22 100 1.2 200
23 100 1.2 250
24 100 1.2 300
25 100 1.6 0
26 100 1.6 100
27 100 1.6 150
28 100 1.6 200
29 100 1.6 250
30 100 1.6 300
31 100 2 0
32 100 2 100
33 100 2 150
34 100 2 200
35 100 2 250
36 100 2 300
27
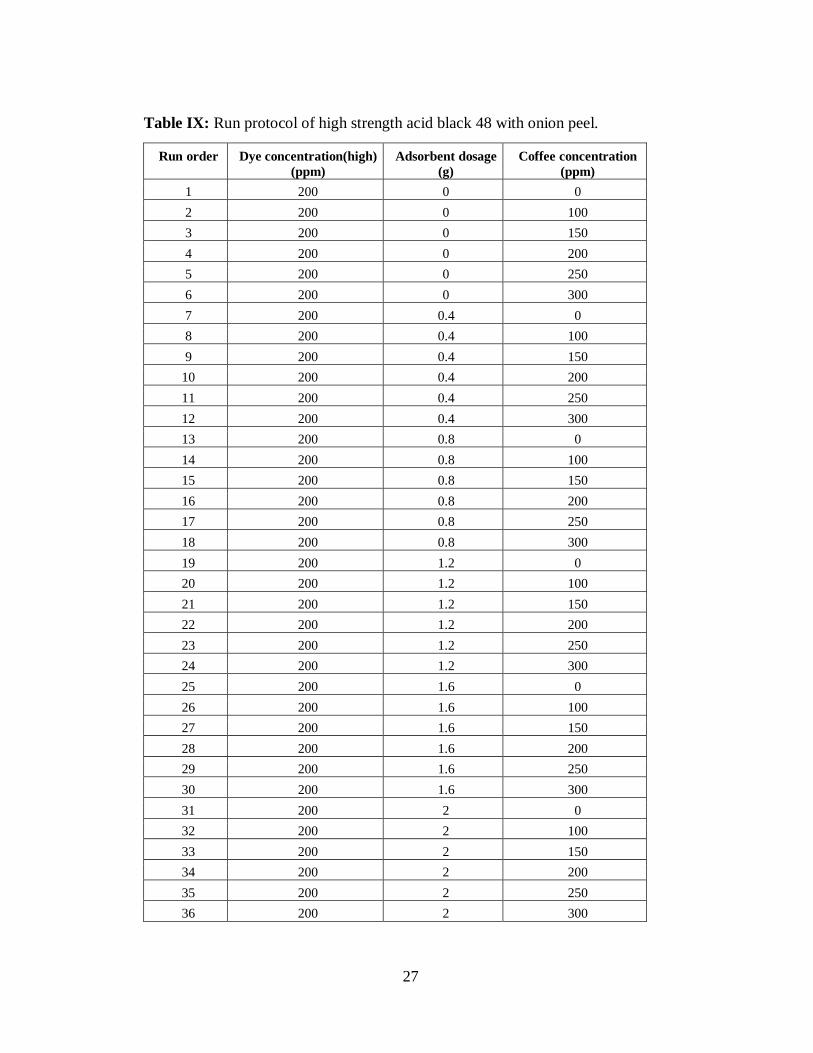
Table IX: Run protocol of high strength acid black 48 with onion peel.
Run order Dye concentration(high)
(ppm)
Adsorbent dosage
(g)
Coffee concentration
(ppm)
1 200 0 0
2 200 0 100
3 200 0 150
4 200 0 200
5 200 0 250
6 200 0 300
7 200 0.4 0
8 200 0.4 100
9 200 0.4 150
10 200 0.4 200
11 200 0.4 250
12 200 0.4 300
13 200 0.8 0
14 200 0.8 100
15 200 0.8 150
16 200 0.8 200
17 200 0.8 250
18 200 0.8 300
19 200 1.2 0
20 200 1.2 100
21 200 1.2 150
22 200 1.2 200
23 200 1.2 250
24 200 1.2 300
25 200 1.6 0
26 200 1.6 100
27 200 1.6 150
28 200 1.6 200
29 200 1.6 250
30 200 1.6 300
31 200 2 0
32 200 2 100
33 200 2 150
34 200 2 200
35 200 2 250
36 200 2 300
28
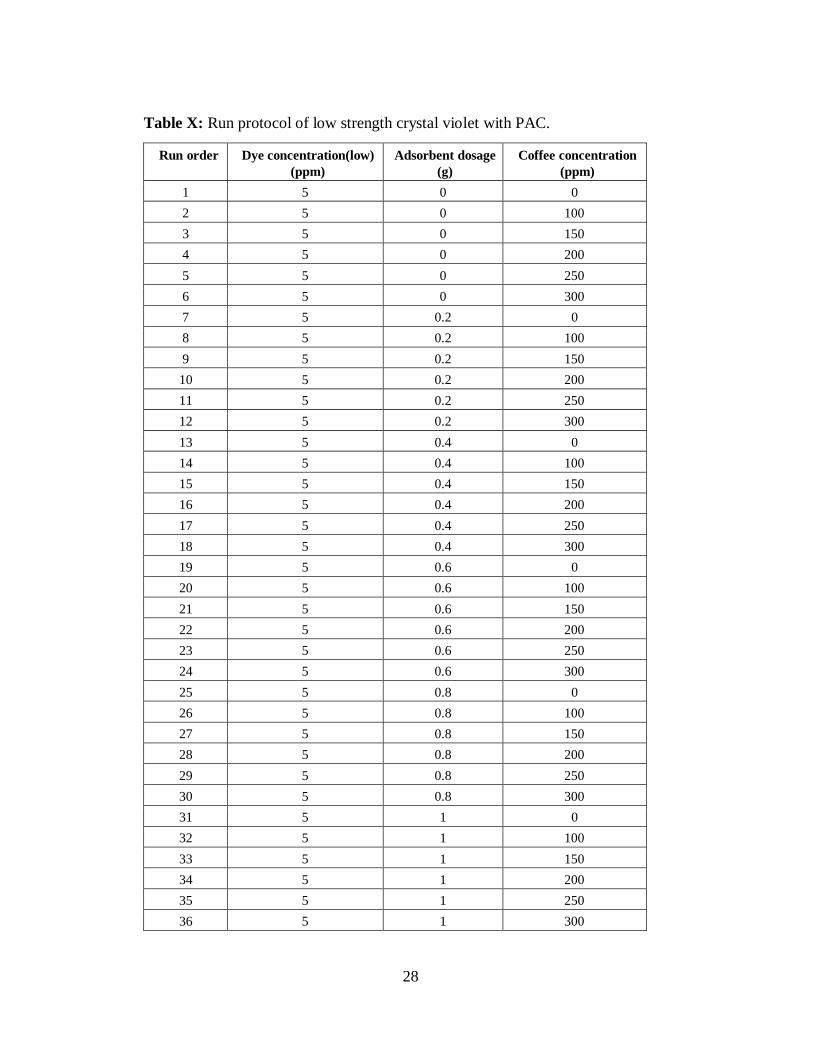
Table X: Run protocol of low strength crystal violet with PAC.
Run order Dye concentration(low)
(ppm)
Adsorbent dosage
(g)
Coffee concentration
(ppm)
1 5 0 0
2 5 0 100
3 5 0 150
4 5 0 200
5 5 0 250
6 5 0 300
7 5 0.2 0
8 5 0.2 100
9 5 0.2 150
10 5 0.2 200
11 5 0.2 250
12 5 0.2 300
13 5 0.4 0
14 5 0.4 100
15 5 0.4 150
16 5 0.4 200
17 5 0.4 250
18 5 0.4 300
19 5 0.6 0
20 5 0.6 100
21 5 0.6 150
22 5 0.6 200
23 5 0.6 250
24 5 0.6 300
25 5 0.8 0
26 5 0.8 100
27 5 0.8 150
28 5 0.8 200
29 5 0.8 250
30 5 0.8 300
31 5 1 0
32 5 1 100
33 5 1 150
34 5 1 200
35 5 1 250
36 5 1 300

29
Table XI: Run protocol of medium strength crystal violet with PAC.
Run order Dye
concentration(medium)
(ppm)
Adsorbent dosage
(g)
Coffee concentration
(ppm)
1 10 0 0
2 10 0 100
3 10 0 150
4 10 0 200
5 10 0 250
6 10 0 300
7 10 0.2 0
8 10 0.2 100
9 10 0.2 150
10 10 0.2 200
11 10 0.2 250
12 10 0.2 300
13 10 0.4 0
14 10 0.4 100
15 10 0.4 150
16 10 0.4 200
17 10 0.4 250
18 10 0.4 300
19 10 0.6 0
20 10 0.6 100
21 10 0.6 150
22 10 0.6 200
23 10 0.6 250
24 10 0.6 300
25 10 0.8 0
26 10 0.8 100
27 10 0.8 150
28 10 0.8 200
29 10 0.8 250
30 10 0.8 300
31 10 1 0
32 10 1 100
33 10 1 150
34 10 1 200
35 10 1 250
36 10 1 300

30
Table XII: Run protocol of high strength crystal violet with PAC.
Run order Dye concentration(high)
(ppm)
Adsorbent
dosage (g)
Coffee concentration
(ppm)
1 20 0 0
2 20 0 100
3 20 0 150
4 20 0 200
5 20 0 250
6 20 0 300
7 20 0.2 0
8 20 0.2 100
9 20 0.2 150
10 20 0.2 200
11 20 0.2 250
12 20 0.2 300
13 20 0.4 0
14 20 0.4 100
15 20 0.4 150
16 20 0.4 200
17 20 0.4 250
18 20 0.4 300
19 20 0.6 0
20 20 0.6 100
21 20 0.6 150
22 20 0.6 200
23 20 0.6 250
24 20 0.6 300
25 20 0.8 0
26 20 0.8 100
27 20 0.8 150
28 20 0.8 200
29 20 0.8 250
30 20 0.8 300
31 20 1 0
32 20 1 100
33 20 1 150
34 20 1 200
35 20 1 250
36 20 1 300
31
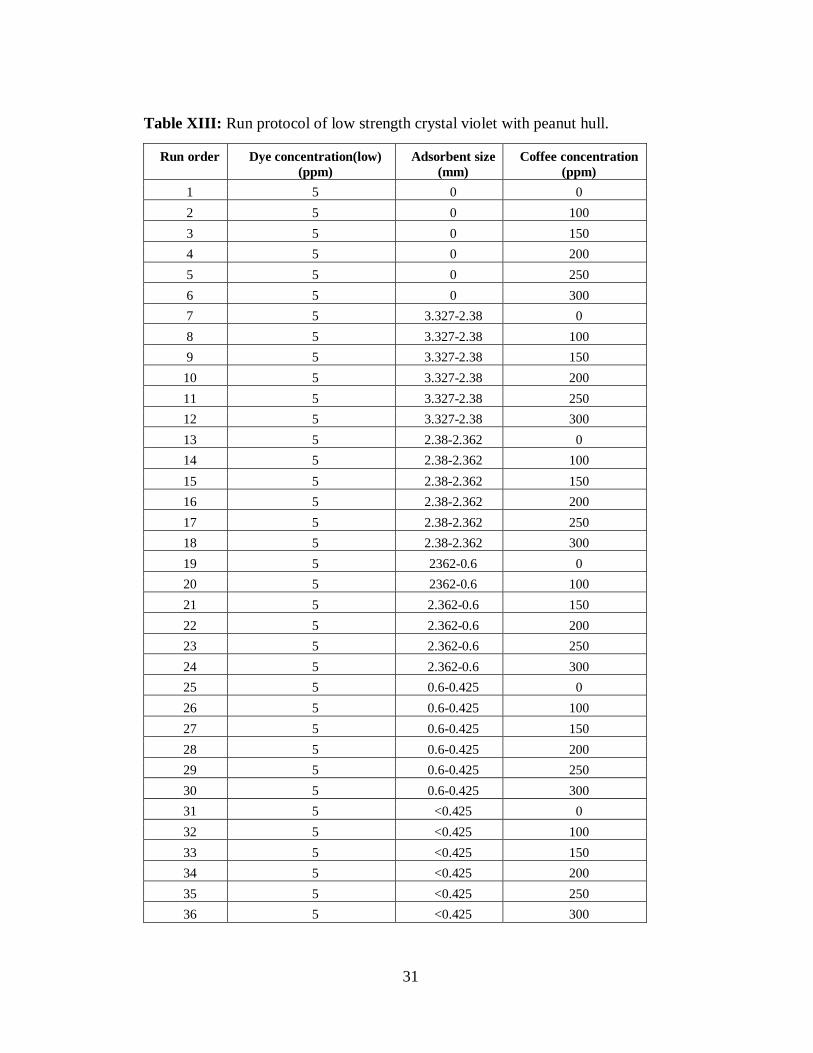
Table XIII: Run protocol of low strength crystal violet with peanut hull.
Run order Dye concentration(low)
(ppm)
Adsorbent size
(mm)
Coffee concentration
(ppm)
1 5 0 0
2 5 0 100
3 5 0 150
4 5 0 200
5 5 0 250
6 5 0 300
7 5 3.327-2.38 0
8 5 3.327-2.38 100
9 5 3.327-2.38 150
10 5 3.327-2.38 200
11 5 3.327-2.38 250
12 5 3.327-2.38 300
13 5 2.38-2.362 0
14 5 2.38-2.362 100
15 5 2.38-2.362 150
16 5 2.38-2.362 200
17 5 2.38-2.362 250
18 5 2.38-2.362 300
19 5 2362-0.6 0
20 5 2362-0.6 100
21 5 2.362-0.6 150
22 5 2.362-0.6 200
23 5 2.362-0.6 250
24 5 2.362-0.6 300
25 5 0.6-0.425 0
26 5 0.6-0.425 100
27 5 0.6-0.425 150
28 5 0.6-0.425 200
29 5 0.6-0.425 250
30 5 0.6-0.425 300
31 5 <0.425 0
32 5 <0.425 100
33 5 <0.425 150
34 5 <0.425 200
35 5 <0.425 250
36 5 <0.425 300

32
Table XIV: Run protocol of medium strength crystal violet with peanut hull.
Run order Dye
concentration(medium)
(ppm)
Adsorbent size
(mm)
Coffee concentration
(ppm)
1 10 0 0
2 10 0 100
3 10 0 150
4 10 0 200
5 10 0 250
6 10 0 300
7 10 3.327-2.38 0
8 10 3.327-2.38 100
9 10 3.327-2.38 150
10 10 3.327-2.38 200
11 10 3.327-2.38 250
12 10 3.327-2.38 300
13 10 2.38-2.362 0
14 10 2.38-2.362 100
15 10 2.38-2.362 150
16 10 2.38-2.362 200
17 10 2.38-2.362 250
18 10 2.38-2.362 300
19 10 2362-0.6 0
20 10 2362-0.6 100
21 10 2.362-0.6 150
22 10 2.362-0.6 200
23 10 2.362-0.6 250
24 10 2.362-0.6 300
25 10 0.6-0.425 0
26 10 0.6-0.425 100
27 10 0.6-0.425 150
28 10 0.6-0.425 200
29 10 0.6-0.425 250
30 10 0.6-0.425 300
31 10 <0.425 0
32 10 <0.425 100
33 10 <0.425 150
34 10 <0.425 200
35 10 <0.425 250
36 10 <0.425 300

33
Table XV: Run protocol of high strength crystal violet with peanut hull.
Run order Dye concentration(high)
(ppm)
Adsorbent size
(mm)
Coffee concentration
(ppm)
1 20 0 0
2 20 0 100
3 20 0 150
4 20 0 200
5 20 0 250
6 20 0 300
7 20 3.327-2.38 0
8 20 3.327-2.38 100
9 20 3.327-2.38 150
10 20 3.327-2.38 200
11 20 3.327-2.38 250
12 20 3.327-2.38 300
13 20 2.38-2.362 0
14 20 2.38-2.362 100
15 20 2.38-2.362 150
16 20 2.38-2.362 200
17 20 2.38-2.362 250
18 20 2.38-2.362 300
19 20 2362-0.6 0
20 20 2362-0.6 100
21 20 2.362-0.6 150
22 20 2.362-0.6 200
23 20 2.362-0.6 250
24 20 2.362-0.6 300
25 20 0.6-0.425 0
26 20 0.6-0.425 100
27 20 0.6-0.425 150
28 20 0.6-0.425 200
29 20 0.6-0.425 250
30 20 0.6-0.425 300
31 20 <0.425 0
32 20 <0.425 100
33 20 <0.425 150
34 20 <0.425 200
35 20 <0.425 250
36 20 <0.425 300
34
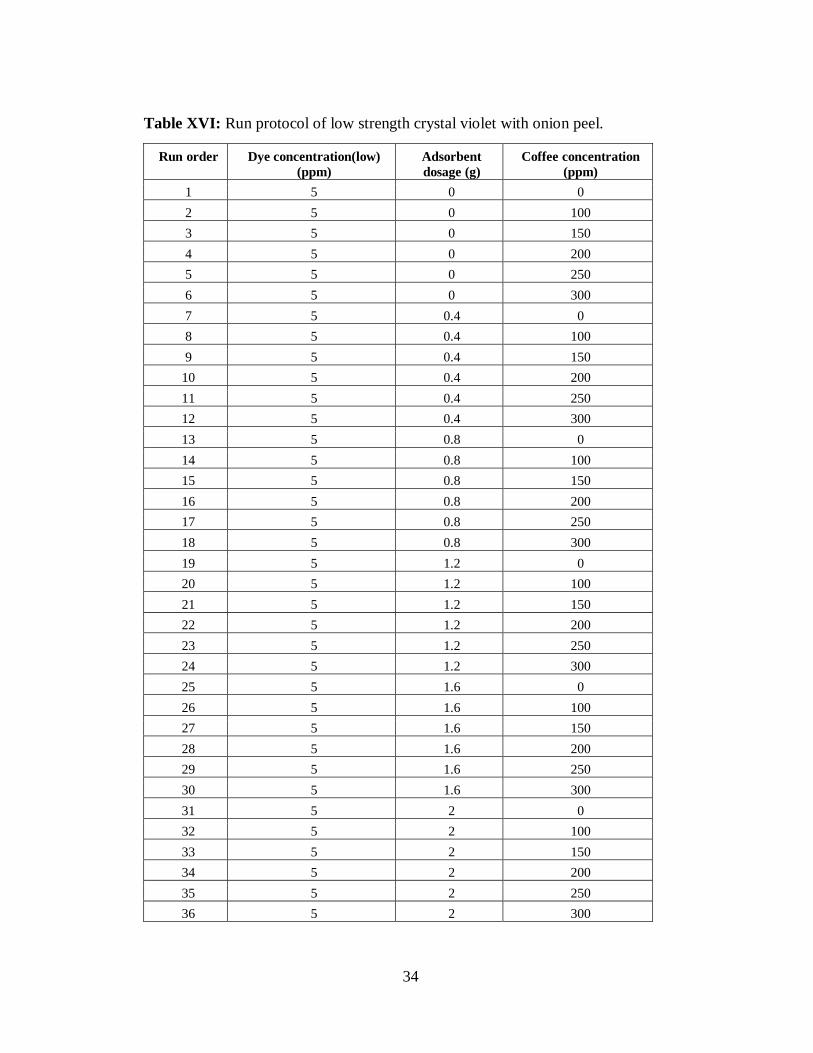
Table XVI: Run protocol of low strength crystal violet with onion peel.
Run order Dye concentration(low)
(ppm)
Adsorbent
dosage (g)
Coffee concentration
(ppm)
1 5 0 0
2 5 0 100
3 5 0 150
4 5 0 200
5 5 0 250
6 5 0 300
7 5 0.4 0
8 5 0.4 100
9 5 0.4 150
10 5 0.4 200
11 5 0.4 250
12 5 0.4 300
13 5 0.8 0
14 5 0.8 100
15 5 0.8 150
16 5 0.8 200
17 5 0.8 250
18 5 0.8 300
19 5 1.2 0
20 5 1.2 100
21 5 1.2 150
22 5 1.2 200
23 5 1.2 250
24 5 1.2 300
25 5 1.6 0
26 5 1.6 100
27 5 1.6 150
28 5 1.6 200
29 5 1.6 250
30 5 1.6 300
31 5 2 0
32 5 2 100
33 5 2 150
34 5 2 200
35 5 2 250
36 5 2 300
35
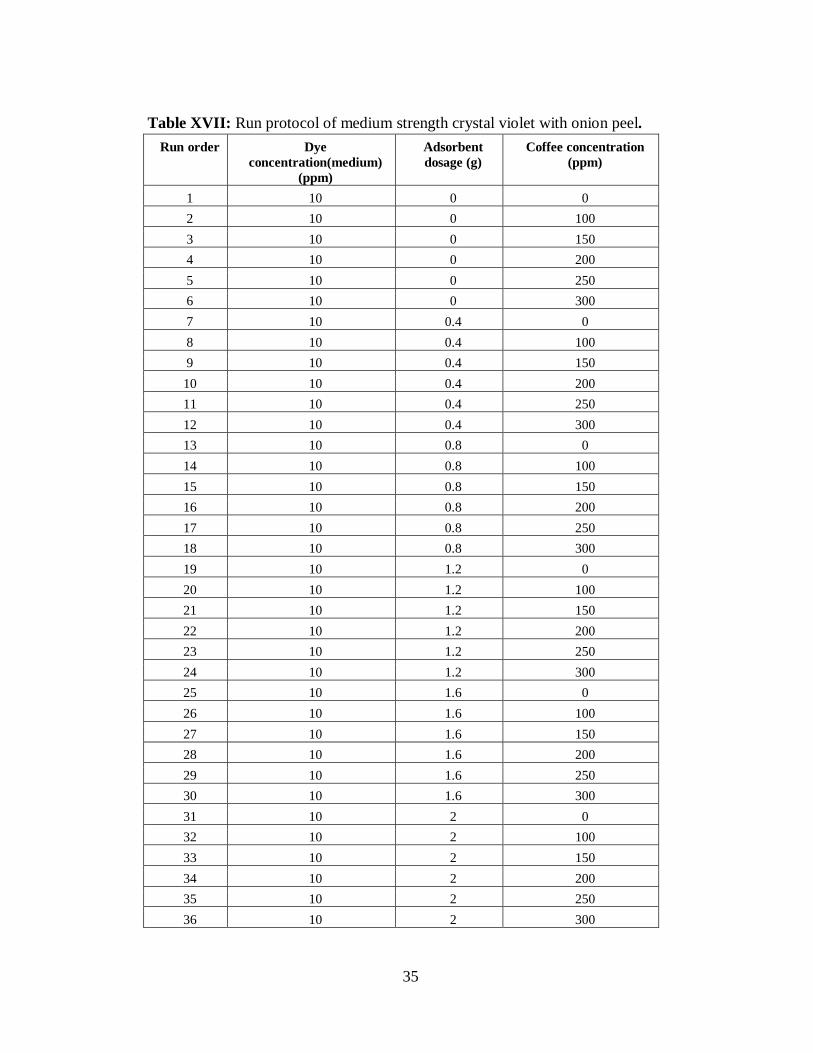
Table XVII: Run protocol of medium strength crystal violet with onion peel.
Run order Dye
concentration(medium)
(ppm)
Adsorbent
dosage (g)
Coffee concentration
(ppm)
1 10 0 0
2 10 0 100
3 10 0 150
4 10 0 200
5 10 0 250
6 10 0 300
7 10 0.4 0
8 10 0.4 100
9 10 0.4 150
10 10 0.4 200
11 10 0.4 250
12 10 0.4 300
13 10 0.8 0
14 10 0.8 100
15 10 0.8 150
16 10 0.8 200
17 10 0.8 250
18 10 0.8 300
19 10 1.2 0
20 10 1.2 100
21 10 1.2 150
22 10 1.2 200
23 10 1.2 250
24 10 1.2 300
25 10 1.6 0
26 10 1.6 100
27 10 1.6 150
28 10 1.6 200
29 10 1.6 250
30 10 1.6 300
31 10 2 0
32 10 2 100
33 10 2 150
34 10 2 200
35 10 2 250
36 10 2 300

36
Table XVIII: Run protocol of high strength crystal violet with onion peel.
Run order Dye concentration(high)
(ppm)
Adsorbent
dosage (g)
Coffee concentration
(ppm)
1 20 0 0
2 20 0 100
3 20 0 150
4 20 0 200
5 20 0 250
6 20 0 300
7 20 0.4 0
8 20 0.4 100
9 20 0.4 150
10 20 0.4 200
11 20 0.4 250
12 20 0.4 300
13 20 0.8 0
14 20 0.8 100
15 20 0.8 150
16 20 0.8 200
17 20 0.8 250
18 20 0.8 300
19 20 1.2 0
20 20 1.2 100
21 20 1.2 150
22 20 1.2 200
23 20 1.2 250
24 20 1.2 300
25 20 1.6 0
26 20 1.6 100
27 20 1.6 150
28 20 1.6 200
29 20 1.6 250
30 20 1.6 300
31 20 2 0
32 20 2 100
33 20 2 150
34 20 2 200
35 20 2 250
36 20 2 300
37
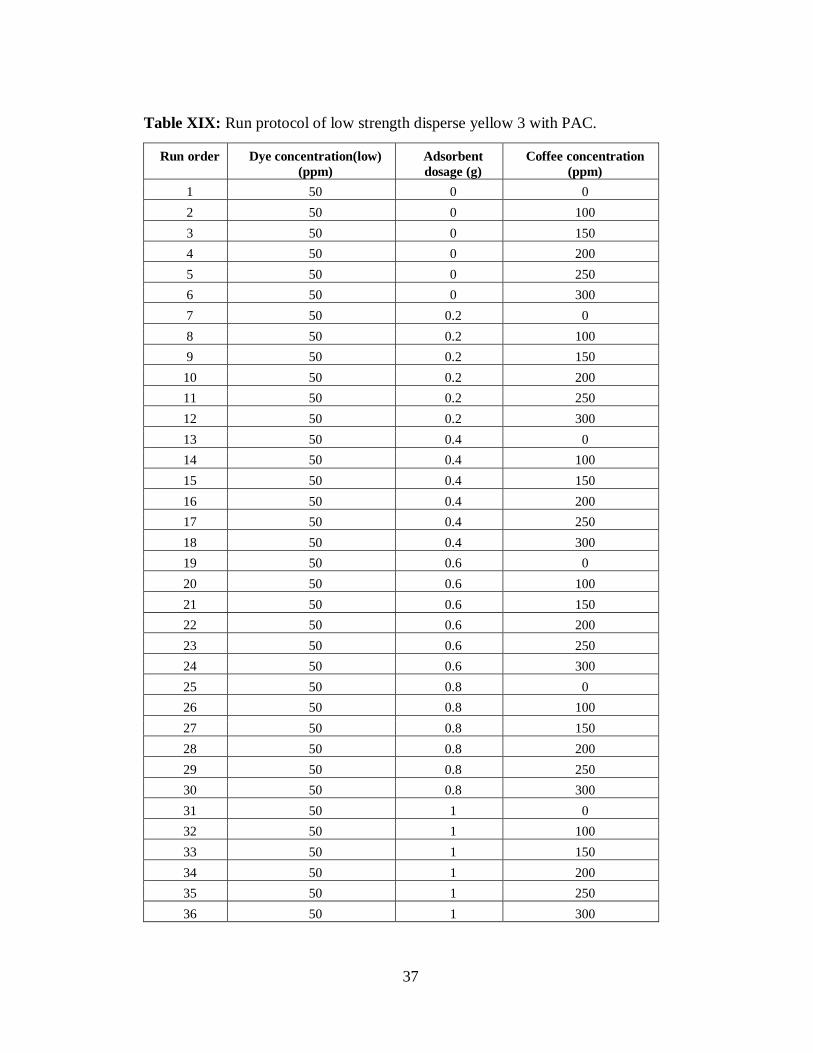
Table XIX: Run protocol of low strength disperse yellow 3 with PAC.
Run order Dye concentration(low)
(ppm)
Adsorbent
dosage (g)
Coffee concentration
(ppm)
1 50 0 0
2 50 0 100
3 50 0 150
4 50 0 200
5 50 0 250
6 50 0 300
7 50 0.2 0
8 50 0.2 100
9 50 0.2 150
10 50 0.2 200
11 50 0.2 250
12 50 0.2 300
13 50 0.4 0
14 50 0.4 100
15 50 0.4 150
16 50 0.4 200
17 50 0.4 250
18 50 0.4 300
19 50 0.6 0
20 50 0.6 100
21 50 0.6 150
22 50 0.6 200
23 50 0.6 250
24 50 0.6 300
25 50 0.8 0
26 50 0.8 100
27 50 0.8 150
28 50 0.8 200
29 50 0.8 250
30 50 0.8 300
31 50 1 0
32 50 1 100
33 50 1 150
34 50 1 200
35 50 1 250
36 50 1 300

38
Table XX: Run protocol of medium strength disperse yellow 3 with PAC.
Run order Dye
concentration(medium)
(ppm)
Adsorbent
dosage (g)
Coffee concentration
(ppm)
1 100 0 0
2 100 0 100
3 100 0 150
4 100 0 200
5 100 0 250
6 100 0 300
7 100 0.2 0
8 100 0.2 100
9 100 0.2 150
10 100 0.2 200
11 100 0.2 250
12 100 0.2 300
13 100 0.4 0
14 100 0.4 100
15 100 0.4 150
16 100 0.4 200
17 100 0.4 250
18 100 0.4 300
19 100 0.6 0
20 100 0.6 100
21 100 0.6 150
22 100 0.6 200
23 100 0.6 250
24 100 0.6 300
25 100 0.8 0
26 100 0.8 100
27 100 0.8 150
28 100 0.8 200
29 100 0.8 250
30 100 0.8 300
31 100 1 0
32 100 1 100
33 100 1 150
34 100 1 200
35 100 1 250
36 100 1 300
39
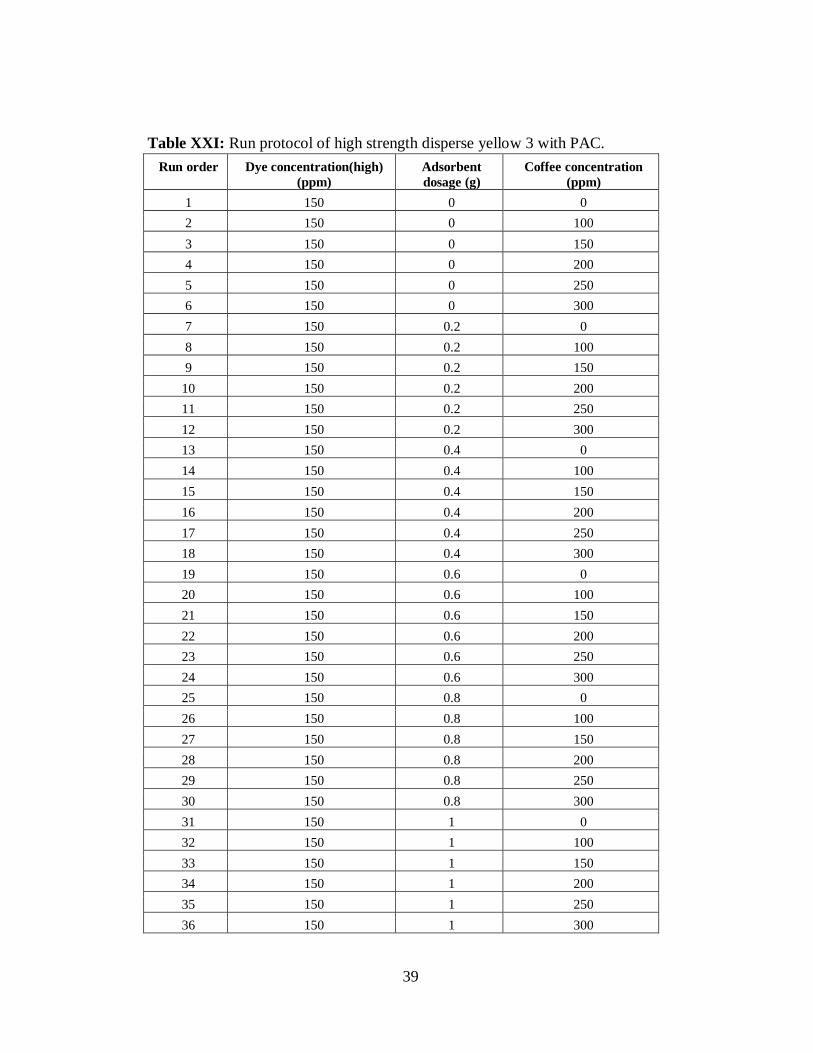
Table XXI: Run protocol of high strength disperse yellow 3 with PAC.
Run order Dye concentration(high)
(ppm)
Adsorbent
dosage (g)
Coffee concentration
(ppm)
1 150 0 0
2 150 0 100
3 150 0 150
4 150 0 200
5 150 0 250
6 150 0 300
7 150 0.2 0
8 150 0.2 100
9 150 0.2 150
10 150 0.2 200
11 150 0.2 250
12 150 0.2 300
13 150 0.4 0
14 150 0.4 100
15 150 0.4 150
16 150 0.4 200
17 150 0.4 250
18 150 0.4 300
19 150 0.6 0
20 150 0.6 100
21 150 0.6 150
22 150 0.6 200
23 150 0.6 250
24 150 0.6 300
25 150 0.8 0
26 150 0.8 100
27 150 0.8 150
28 150 0.8 200
29 150 0.8 250
30 150 0.8 300
31 150 1 0
32 150 1 100
33 150 1 150
34 150 1 200
35 150 1 250
36 150 1 300

40
Table XXII: Run protocol of low strength disperse yellow 3 with peanut hull.
Run order Dye concentration(low)
(ppm)
Adsorbent size
(mm)
Coffee concentration
(ppm)
1 50 0 0
2 50 0 100
3 50 0 150
4 50 0 200
5 50 0 250
6 50 0 300
7 50 3.327-2.38 0
8 50 3.327-2.38 100
9 50 3.327-2.38 150
10 50 3.327-2.38 200
11 50 3.327-2.38 250
12 50 3.327-2.38 300
13 50 2.38-2.362 0
14 50 2.38-2.362 100
15 50 2.38-2.362 150
16 50 2.38-2.362 200
17 50 2.38-2.362 250
18 50 2.38-2.362 300
19 50 2362-0.6 0
20 50 2362-0.6 100
21 50 2.362-0.6 150
22 50 2.362-0.6 200
23 50 2.362-0.6 250
24 50 2.362-0.6 300
25 50 0.6-0.425 0
26 50 0.6-0.425 100
27 50 0.6-0.425 150
28 50 0.6-0.425 200
29 50 0.6-0.425 250
30 50 0.6-0.425 300
31 50 <0.425 0
32 50 <0.425 100
33 50 <0.425 150
34 50 <0.425 200
35 50 <0.425 250
36 50 <0.425 300

41
Table XXIII: Run protocol of medium strength disperse yellow 3 with peanut hull.
Run order Dye
concentration(medium)
(ppm)
Adsorbent size
(mm)
Coffee concentration
(ppm)
1 100 0 0
2 100 0 100
3 100 0 150
4 100 0 200
5 100 0 250
6 100 0 300
7 100 3.327-2.38 0
8 100 3.327-2.38 100
9 100 3.327-2.38 150
10 100 3.327-2.38 200
11 100 3.327-2.38 250
12 100 3.327-2.38 300
13 100 2.38-2.362 0
14 100 2.38-2.362 100
15 100 2.38-2.362 150
16 100 2.38-2.362 200
17 100 2.38-2.362 250
18 100 2.38-2.362 300
19 100 2362-0.6 0
20 100 2362-0.6 100
21 100 2.362-0.6 150
22 100 2.362-0.6 200
23 100 2.362-0.6 250
24 100 2.362-0.6 300
25 100 0.6-0.425 0
26 100 0.6-0.425 100
27 100 0.6-0.425 150
28 100 0.6-0.425 200
29 100 0.6-0.425 250
30 100 0.6-0.425 300
31 100 <0.425 0
32 100 <0.425 100
33 100 <0.425 150
34 100 <0.425 200
35 100 <0.425 250
36 100 <0.425 300

42
Table XXIV: Run protocol of high strength disperse yellow 3 with peanut hull.
Run order Dye concentration(high)
(ppm)
Adsorbent size
(mm)
Coffee concentration
(ppm)
1 150 0 0
2 150 0 100
3 150 0 150
4 150 0 200
5 150 0 250
6 150 0 300
7 150 3.327-2.38 0
8 150 3.327-2.38 100
9 150 3.327-2.38 150
10 150 3.327-2.38 200
11 150 3.327-2.38 250
12 150 3.327-2.38 300
13 150 2.38-2.362 0
14 150 2.38-2.362 100
15 150 2.38-2.362 150
16 150 2.38-2.362 200
17 150 2.38-2.362 250
18 150 2.38-2.362 300
19 150 2362-0.6 0
20 150 2362-0.6 100
21 150 2.362-0.6 150
22 150 2.362-0.6 200
23 150 2.362-0.6 250
24 150 2.362-0.6 300
25 150 0.6-0.425 0
26 150 0.6-0.425 100
27 150 0.6-0.425 150
28 150 0.6-0.425 200
29 150 0.6-0.425 250
30 150 0.6-0.425 300
31 150 <0.425 0
32 150 <0.425 100
33 150 <0.425 150
34 150 <0.425 200
35 150 <0.425 250
36 150 <0.425 300

43
Table XXV: Run protocol of low strength disperse yellow 3 with onion peel.
Run order Dye concentration(low)
(ppm)
Adsorbent
dosage (g)
Coffee concentration
(ppm)
1 50 0 0
2 50 0 100
3 50 0 150
4 50 0 200
5 50 0 250
6 50 0 300
7 50 0.4 0
8 50 0.4 100
9 50 0.4 150
10 50 0.4 200
11 50 0.4 250
12 50 0.4 300
13 50 0.8 0
14 50 0.8 100
15 50 0.8 150
16 50 0.8 200
17 50 0.8 250
18 50 0.8 300
19 50 1.2 0
20 50 1.2 100
21 50 1.2 150
22 50 1.2 200
23 50 1.2 250
24 50 1.2 300
25 50 1.6 0
26 50 1.6 100
27 50 1.6 150
28 50 1.6 200
29 50 1.6 250
30 50 1.6 300
31 50 2 0
32 50 2 100
33 50 2 150
34 50 2 200
35 50 2 250
36 50 2 300
44
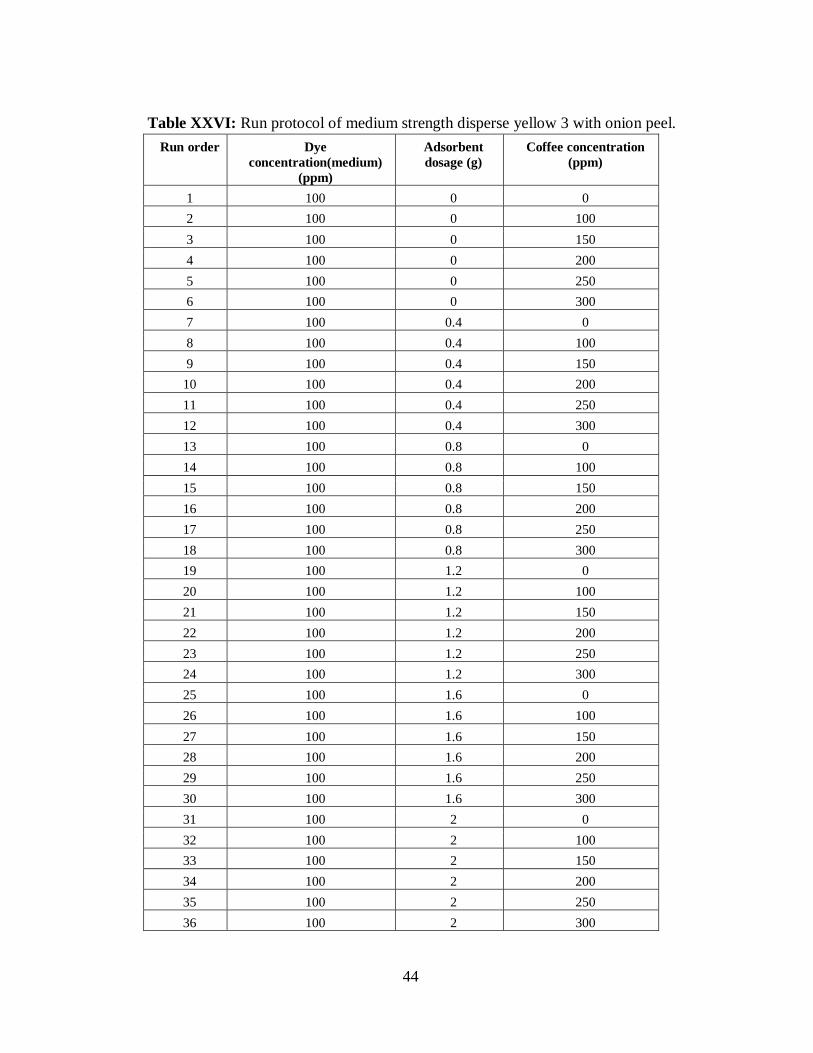
Table XXVI: Run protocol of medium strength disperse yellow 3 with onion peel.
Run order Dye
concentration(medium)
(ppm)
Adsorbent
dosage (g)
Coffee concentration
(ppm)
1 100 0 0
2 100 0 100
3 100 0 150
4 100 0 200
5 100 0 250
6 100 0 300
7 100 0.4 0
8 100 0.4 100
9 100 0.4 150
10 100 0.4 200
11 100 0.4 250
12 100 0.4 300
13 100 0.8 0
14 100 0.8 100
15 100 0.8 150
16 100 0.8 200
17 100 0.8 250
18 100 0.8 300
19 100 1.2 0
20 100 1.2 100
21 100 1.2 150
22 100 1.2 200
23 100 1.2 250
24 100 1.2 300
25 100 1.6 0
26 100 1.6 100
27 100 1.6 150
28 100 1.6 200
29 100 1.6 250
30 100 1.6 300
31 100 2 0
32 100 2 100
33 100 2 150
34 100 2 200
35 100 2 250
36 100 2 300
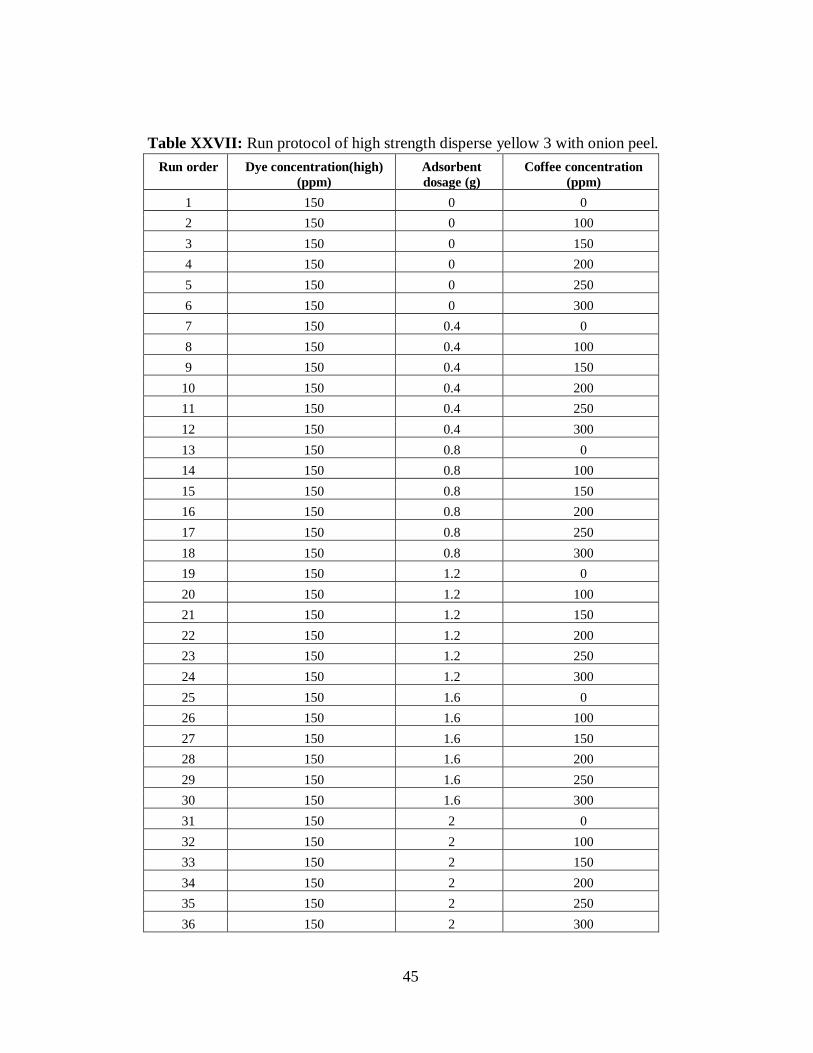
45
Table XXVII: Run protocol of high strength disperse yellow 3 with onion peel.
Run order Dye concentration(high)
(ppm)
Adsorbent
dosage (g)
Coffee concentration
(ppm)
1 150 0 0
2 150 0 100
3 150 0 150
4 150 0 200
5 150 0 250
6 150 0 300
7 150 0.4 0
8 150 0.4 100
9 150 0.4 150
10 150 0.4 200
11 150 0.4 250
12 150 0.4 300
13 150 0.8 0
14 150 0.8 100
15 150 0.8 150
16 150 0.8 200
17 150 0.8 250
18 150 0.8 300
19 150 1.2 0
20 150 1.2 100
21 150 1.2 150
22 150 1.2 200
23 150 1.2 250
24 150 1.2 300
25 150 1.6 0
26 150 1.6 100
27 150 1.6 150
28 150 1.6 200
29 150 1.6 250
30 150 1.6 300
31 150 2 0
32 150 2 100
33 150 2 150
34 150 2 200
35 150 2 250
36 150 2 300

46
CHAPTER IV
RESULTS AND DISCUSSION
In the Appendix A and B 976 sample runs are presented as follows
1. Appendix A contains tables of all the sample runs
2. Appendix B contains figures of all the sample runs
4.1 Results
The results in the tables are compared to interpret and understand the treatment
performance of the low-cost adsorbents like Peanut hull, Onion Peel. Various adsorbent
sizes with Peanut hull and dosages with Onion Peel are used with different coffee
concentrations and compared with varying dye concentration (Low, Medium and High).
Using UV-Visible spectrophotometer absorbance and transmittance readings are
measured before and after the treatment i.e. after adsorption and microfiltration.
The terms BT, AT in the table listed indicates before treatment and after treatment
of batch adsorption of dye and coffee wastewater samples.
The following tables in the results and discussion tells the transmittance of
different dyes and coffee wastewater at optimum size and dosage of the adsorbent.
47
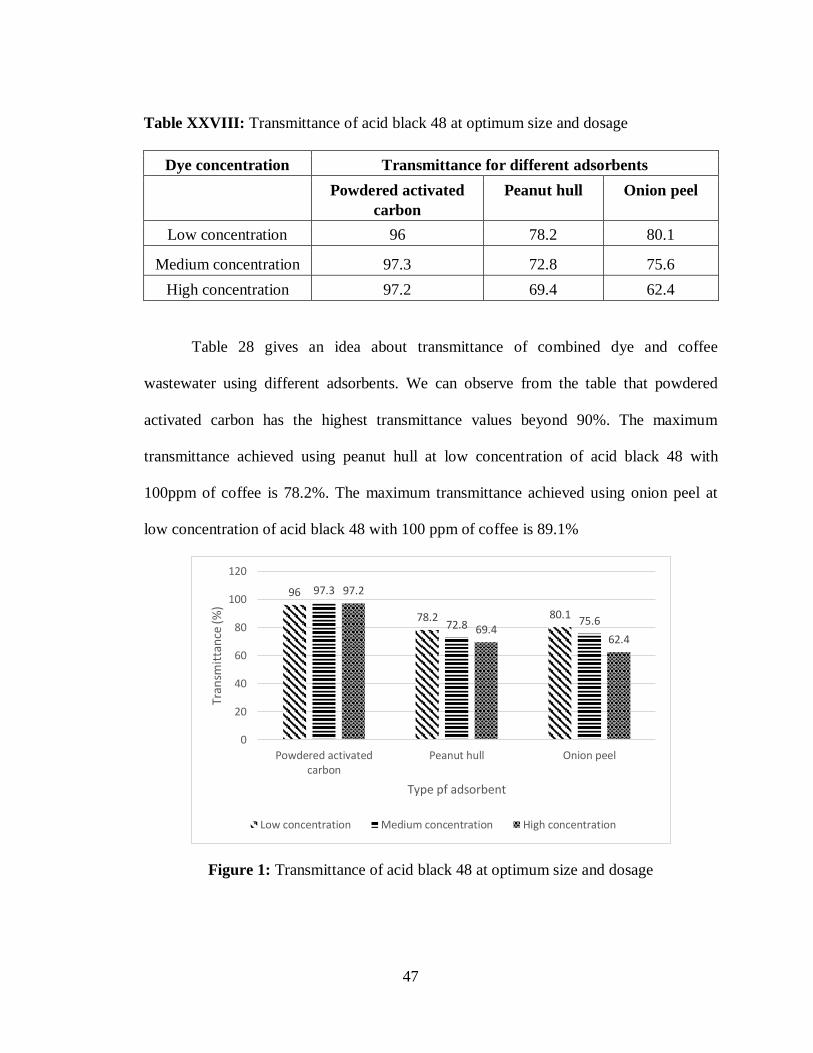
Table XXVIII: Transmittance of acid black 48 at optimum size and dosage
Dye concentration Transmittance for different adsorbents
Powdered activated
carbon
Peanut hull Onion peel
Low concentration 96 78.2 80.1
Medium concentration 97.3 72.8 75.6
High concentration 97.2 69.4 62.4
Table 28 gives an idea about transmittance of combined dye and coffee
wastewater using different adsorbents. We can observe from the table that powdered
activated carbon has the highest transmittance values beyond 90%. The maximum
transmittance achieved using peanut hull at low concentration of acid black 48 with
100ppm of coffee is 78.2%. The maximum transmittance achieved using onion peel at
low concentration of acid black 48 with 100 ppm of coffee is 89.1%
Figure 1: Transmittance of acid black 48 at optimum size and dosage
96
78.2 80.1
97.3
72.8 75.6
97.2
69.462.4
0
20
40
60
80
100
120
Powdered activatedcarbon
Peanut hull Onion peel
Tran
smit
tan
ce (%
)
Type pf adsorbent
Low concentration Medium concentration High concentration
48
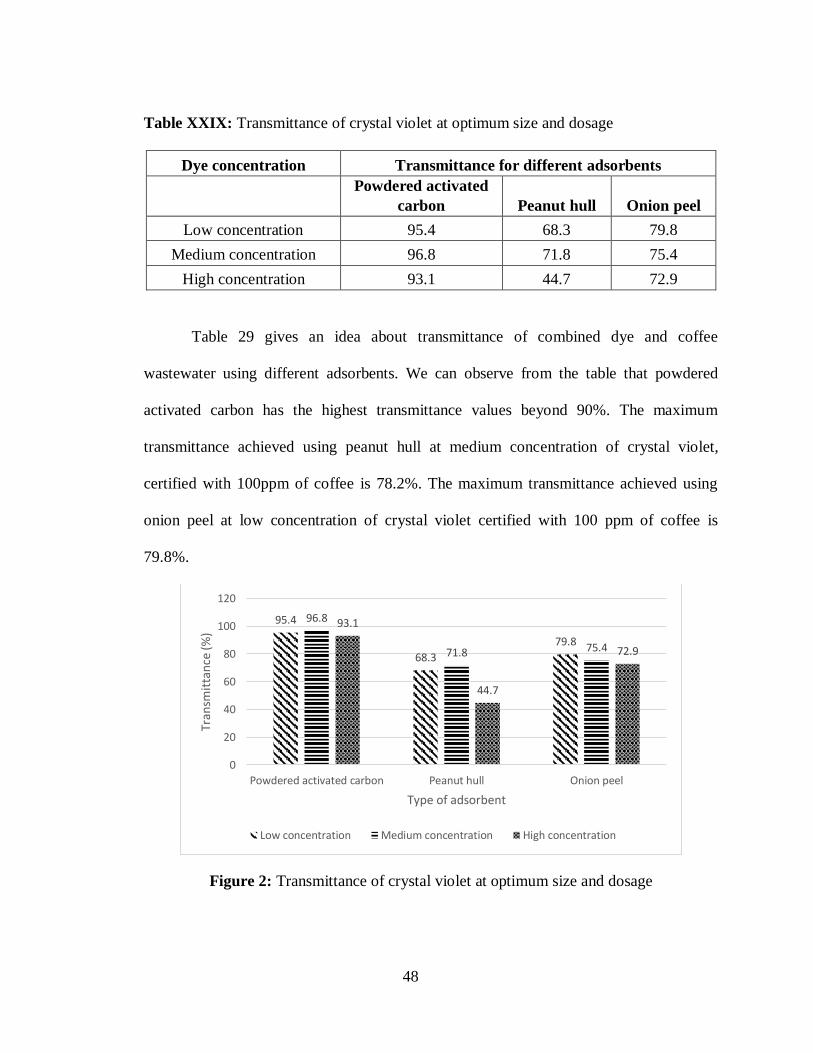
Table XXIX: Transmittance of crystal violet at optimum size and dosage
Dye concentration Transmittance for different adsorbents
Powdered activated
carbon Peanut hull Onion peel
Low concentration 95.4 68.3 79.8
Medium concentration 96.8 71.8 75.4
High concentration 93.1 44.7 72.9
Table 29 gives an idea about transmittance of combined dye and coffee
wastewater using different adsorbents. We can observe from the table that powdered
activated carbon has the highest transmittance values beyond 90%. The maximum
transmittance achieved using peanut hull at medium concentration of crystal violet,
certified with 100ppm of coffee is 78.2%. The maximum transmittance achieved using
onion peel at low concentration of crystal violet certified with 100 ppm of coffee is
79.8%.
Figure 2: Transmittance of crystal violet at optimum size and dosage
95.4
68.3
79.8
96.8
71.8 75.4
93.1
44.7
72.9
0
20
40
60
80
100
120
Powdered activated carbon Peanut hull Onion peel
Tran
smit
tan
ce (%
)
Type of adsorbent
Low concentration Medium concentration High concentration
49
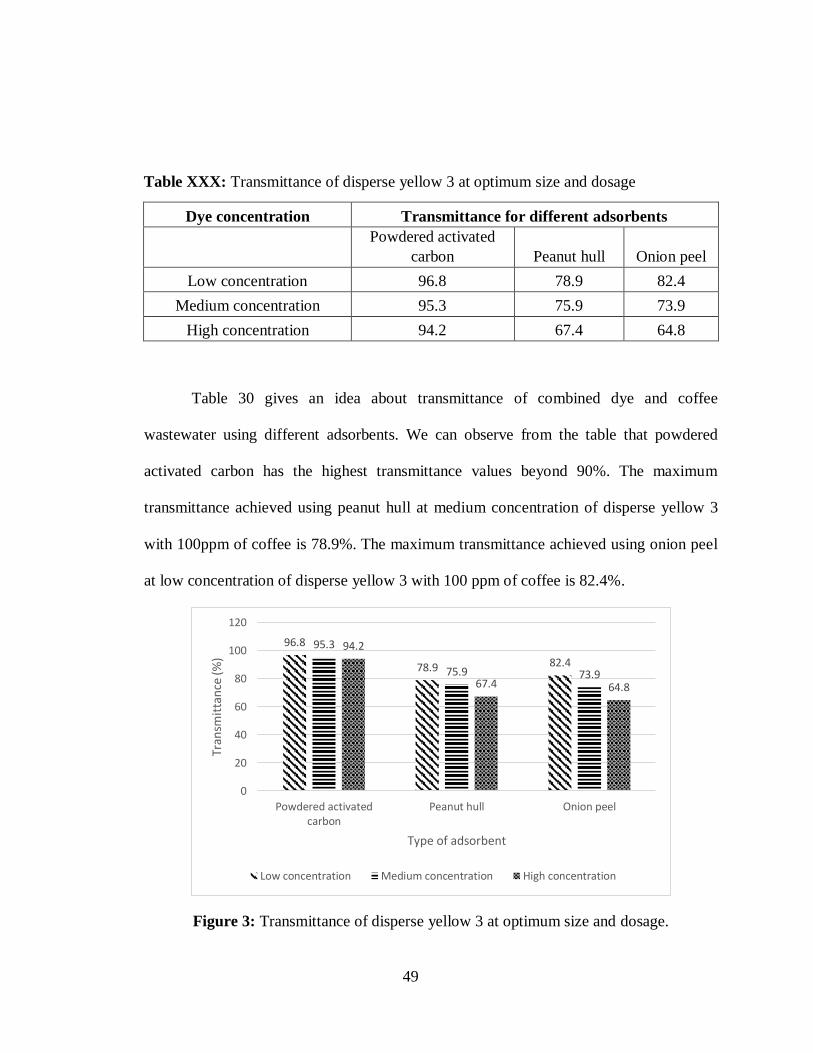
Table XXX: Transmittance of disperse yellow 3 at optimum size and dosage
Dye concentration Transmittance for different adsorbents
Powdered activated
carbon Peanut hull Onion peel
Low concentration 96.8 78.9 82.4
Medium concentration 95.3 75.9 73.9
High concentration 94.2 67.4 64.8
Table 30 gives an idea about transmittance of combined dye and coffee
wastewater using different adsorbents. We can observe from the table that powdered
activated carbon has the highest transmittance values beyond 90%. The maximum
transmittance achieved using peanut hull at medium concentration of disperse yellow 3
with 100ppm of coffee is 78.9%. The maximum transmittance achieved using onion peel
at low concentration of disperse yellow 3 with 100 ppm of coffee is 82.4%.
Figure 3: Transmittance of disperse yellow 3 at optimum size and dosage.
96.8
78.9 82.4
95.3
75.9 73.9
94.2
67.4 64.8
0
20
40
60
80
100
120
Powdered activatedcarbon
Peanut hull Onion peel
Tran
smit
tan
ce (%
)
Type of adsorbent
Low concentration Medium concentration High concentration

50
Table XXXI: NPOC of combined acid black 48 and coffee wastewater.
Coffee wastewater
concentration (ppm)
Powdered activated
carbon Onion peel Peanut hull
100
4.61 8.49 12.47
4.87 8.74 12.75
5.14 8.84 12.72
5.32 9.62 13.06
5.94 9.41 14.14
6.07 9.95 13.16
150
11.48 14.46 19.21
11.67 15.54 19.98
12.09 15.47 20.72
12.87 16.64 20.95
12.52 16.81 21.61
12.39 16.06 21.79
200
17.21 20.44 29.24
17.64 20.63 29.44
17.94 21.45 31.62
18.42 22.96 31.77
17.96 23.32 32.43
18.51 22.76 30.74
250
23.94 28.03 37.61
24.43 29.84 37.52
24.78 29.64 38.76
24.95 29.43 38.94
25.31 32.48 37.52
25.67 30.67 38.44
300
29.65 35.42 41.47
30.54 39.64 41.66
30.21 36.18 42.79
30.86 36.84 42.61
30.43 37.81 43.49
30.66 37.62 42.78

51
Table 31 represents the NPOC of acid black 48 mixed with coffee wastewater
treated with three different adsorbents including PAC, peanut hull, onion peel. From the
table it is observed that peanut hull has maximum NPOC value of 43.49 mg/L, orange
peel and powdered activated carbon has 39.64 and 30.66 mg/L respectively.
Figure 4: NPOC of high concentration acid black with three adsorbents.
0
20
40
60
80
100
120
1 0 0 1 5 0 2 0 0 2 5 0 3 0 0
NP
OC
(mg/
L)
Coffee concentration (ppm)
Activated Carbon Onion Peel Peanut Hull

52
Table XXXII: NPOC of combined crystal violet and coffee wastewater.
Coffee wastewater
concentration (ppm)
Powdered activated
carbon Onion peel Peanut hull
100
2.48 4.51 6.15
2.75 4.31 6.34
2.98 4.27 6.94
2.54 4.95 6.37
2.76 5.07 6.88
2.77 5.16 7.64
150
5.39 7.15 8.14
5.75 7.38 8.31
5.51 7.81 8.46
5.26 8.24 8.76
5.87 8.57 9.06
5.41 8.96 9.55
200
8.95 11.72 16.48
8.71 11.63 16.64
8.64 11.54 16.44
8.72 11.75 16.87
8.04 11.84 16.18
9.67 12.93 16.94
250
9.16 15.31 27.59
9.64 15.47 27.43
9.84 15.91 27.67
9.71 15.42 28.42
9.42 16.17 28.64
9.91 16.84 27.43
300
12.24 20.16 34.31
12.81 21.94 34.92
12.56 21.46 34.15
12.51 21.71 35.48
12.91 21.62 35.22
12.55 21.83 36.87

53
Table 32 represents the NPOC of crystal violet, certified mixed with coffee
wastewater treated with three different adsorbents including PAC, peanut hull, onion
peel. From the table it is observed that peanut hull has maximum NPOC value of 36.87
mg/L, orange peel and powdered activated carbon has 21.94 and 12.91 mg/L
respectively.
Figure 5: NPOC of high concentration crystal violet with three adsorbents.
0
5
10
15
20
25
30
35
40
1 0 0 1 5 0 2 0 0 2 5 0 3 0 0
NP
OC
(MG
/L)
Coffee concentration (ppm)
Activated Carbon Peanut Hull Onion Peel
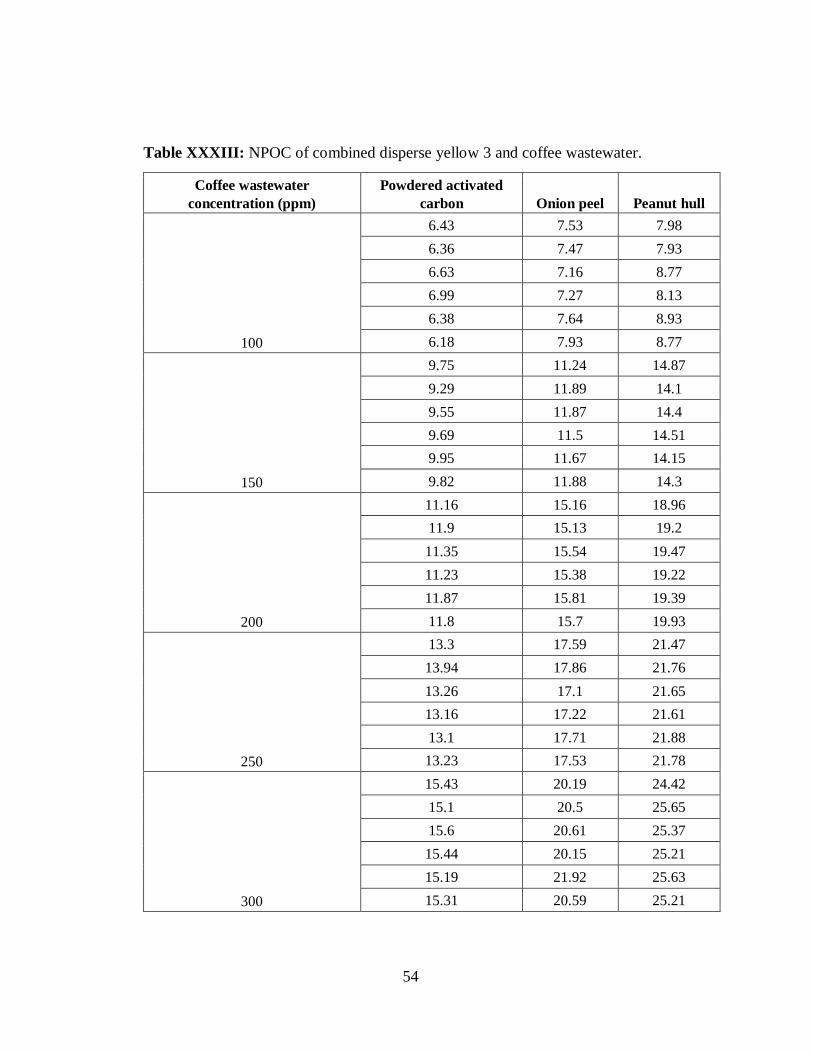
54
Table XXXIII: NPOC of combined disperse yellow 3 and coffee wastewater.
Coffee wastewater
concentration (ppm)
Powdered activated
carbon Onion peel Peanut hull
100
6.43 7.53 7.98
6.36 7.47 7.93
6.63 7.16 8.77
6.99 7.27 8.13
6.38 7.64 8.93
6.18 7.93 8.77
150
9.75 11.24 14.87
9.29 11.89 14.1
9.55 11.87 14.4
9.69 11.5 14.51
9.95 11.67 14.15
9.82 11.88 14.3
200
11.16 15.16 18.96
11.9 15.13 19.2
11.35 15.54 19.47
11.23 15.38 19.22
11.87 15.81 19.39
11.8 15.7 19.93
250
13.3 17.59 21.47
13.94 17.86 21.76
13.26 17.1 21.65
13.16 17.22 21.61
13.1 17.71 21.88
13.23 17.53 21.78
300
15.43 20.19 24.42
15.1 20.5 25.65
15.6 20.61 25.37
15.44 20.15 25.21
15.19 21.92 25.63
15.31 20.59 25.21
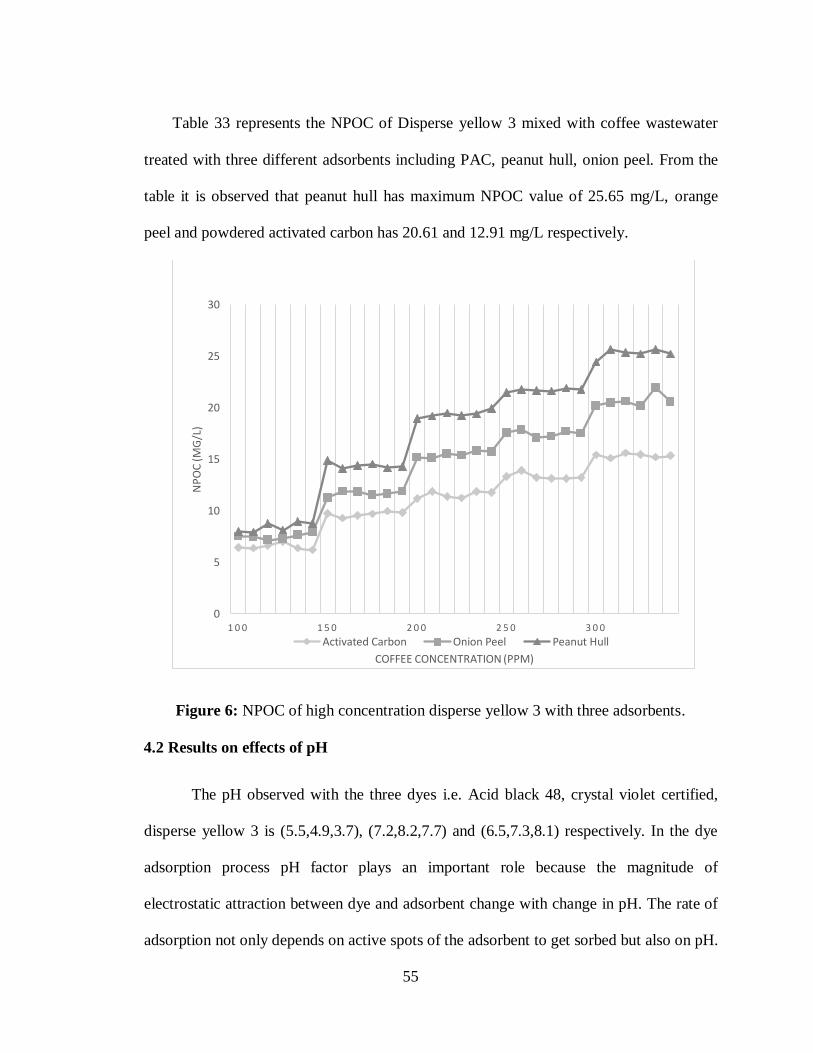
55
Table 33 represents the NPOC of Disperse yellow 3 mixed with coffee wastewater
treated with three different adsorbents including PAC, peanut hull, onion peel. From the
table it is observed that peanut hull has maximum NPOC value of 25.65 mg/L, orange
peel and powdered activated carbon has 20.61 and 12.91 mg/L respectively.
Figure 6: NPOC of high concentration disperse yellow 3 with three adsorbents.
4.2 Results on effects of pH
The pH observed with the three dyes i.e. Acid black 48, crystal violet certified,
disperse yellow 3 is (5.5,4.9,3.7), (7.2,8.2,7.7) and (6.5,7.3,8.1) respectively. In the dye
adsorption process pH factor plays an important role because the magnitude of
electrostatic attraction between dye and adsorbent change with change in pH. The rate of
adsorption not only depends on active spots of the adsorbent to get sorbed but also on pH.
0
5
10
15
20
25
30
1 0 0 1 5 0 2 0 0 2 5 0 3 0 0
NP
OC
(MG
/L)
COFFEE CONCENTRATION (PPM)
Activated Carbon Onion Peel Peanut Hull
56
For example, cationic dyes have less adsorption rate because of the presence of excess
H+ ions at low pH. In contrast the anionic dyes have more adsorption at low pH.
4.3 Results of isotherms and isotherm coefficients
Freundlich isotherm is the best fit for Acid black 48 with the optimum dosage of
low cost adsorbent being orange peel. The linear equation is y = 2.1873x - 0.0339 and
coefficient of determination R2 = 0.7338, coefficient of Freundlich isotherm, Kf = 0.9122
Langmuir isotherm is the best fit for crystal violet certified with the optimum
dosage of low cost adsorbent being peanut hull. The linear equation is y = 0.0079x -
0.0013 and coefficient of determination R2 = 0.9465, coefficient of Langmuir isotherm,
KL= 796.23
Langmuir isotherm is the best fit for Disperse yellow 3 with optimum dosage of
low cost adsorbent being orange peel. The linear equation is y = 82.423x + 0.0078 and
the coefficient of determination R2 = 0.946, coefficient of Langmuir isotherm KL =
128.20
4.4 Discussion on effects of parameters on color removal
The two-major parameter in color removal which are used to distinguish the water
quality are absorbance and transmittance. The highest color removal and the efficiency of
the adsorption process is represented by maximum transmittance and minimum
absorbance. Since the batch adsorption process is conducted in laboratory constant
temperature is maintained. pH factor is also considered but usually adsorption is done at
tertiary treatment process. NPOC is another factor where organic carbon is removed
which represent treatment efficiency.
57
CHAPTER V
CONCLUSION
5.1 Conclusions based on the research
1. Acid Black 48 has best treatment in terms of transmittance 78.2% and 89.1% with
peanut hull at optimum size of (0.6-0.425 mm) and onion peel with optimum
dosage of 1.2 g respectively.
2. Crystal Violet certified has best treatment in terms of transmittance is 71.8% and
79.8% with peanut hull at optimum size of (<0.425 mm) and onion peel with
optimum dosage of 2 g respectively.
3. Disperse Yellow 8 has best treatment in terms of transmittance is 78.9% and
82.4% with peanut hull at optimum size (2.362-0.6 mm) and optimum dosage of
1.2 g respectively.
4. Powdered Activated Carbon has the best transmittance values of more than 90%
and hence we considered PAC as reference in the comparison of transmittance
with low-cost adsorbents.
5. Color removal and treatment is better for the combined dye and coffee wastewater
because of the dilution involved.

58
6. NPOC of Acid black 48, crystal violet, certified and disperse yellow 3 has high
values with peanut hull. Powdered activated carbon, onion peel has reduced
NPOC values after treatment when compared to before treatment.
5.2 Significance and application
The significance of the adsorption process is to treat dye wastewater as a tertiary
treatment before releasing it in to the surface water. The effluent should maintain EPA
wastewater standard as per NPDES permit under Clean Water Act. The two-stage
treatment of adsorption and micro-filtration has proved to be an effective treatment
process to remove dye and coffee color from the wastewater. Textile and coffee
industries being highly polluting because of high BOD and COD in the effluent require
pre-treatment of the wastewater. Adsorption using low-cost adsorbents is an economical
way to treat binary mixture of dye and coffee wastewater. The engineering significance
of the treatment process is about being efficient and economical.
5.3 Recommendations for future research
1. Every dye reacts differently with various adsorbents. More investigations should
be carried out with different types of adsorbents to understand the efficient
removal of dye and coffee waste in the wastewater to maintain surface water
quality.
2. More economical treatment methods such as biosorption and electrochemical
oxidation must be studied using low-cost adsorbents for effective removal of dyes
in wastewater.

59
REFERENCES
[1] J.F. Kenny, N.L. Barber, S.S. Huston, K.S. Linsey, J.K. Lovelace, M.A. Maupin,
Estimated use of water in the United States in 2005. U.S Geological Survey
Circular. 2009.
[2] A.S. Stillwell, D.C. Hoppcock, M.E. Webber, Energy recovery from wastewater
treatment plants in the United States: A Case Study of the Energy-Water Nexus.
Journal of Sustainability. 2 (2010) 945-962.
[3] F.M. Chequer, D.J. Dorta, P. Oliveria, Azo Dyes and Their Metabolites: Does the
Discharge of the Azo Dye into Water Bodies Represent Human and Ecological
Risks? Intech open. 2 (2011) 28-38.
[4] A. Muhammad, A. Shafeeq, M.A. Butt, H. Rizvi, M.A. Chughtai, S. Rehman,
Decolorization and Removal of cod and bod from raw and biotreated textile dye
bath effluent through advanced oxidation process (AOPS). Brazilian Journal of
Chemical Engineering. 25 (2008) 1678-4383.
[5] H. Zollinger, Color Chemistry Synthesis, Properties and Applications of Organic
Dyes and Pigments. Third edition., Wiley-VCH, Switzerland. 2003.
[6] R.A. Devi, V.B. Singh, A.C. Kumar, COD and BOD reduction from coffee
processing wastewater using Avacado peel carbon. Journal of Bioresource
Technology. 99 (2007) 1853-1860.
[7] F. Han, V.S.R. Kambala, M. Srinivasan, D. Rajarathnam, R. Naidu, Tailored
titanium dioxide photocatalysts for the degradation of organic dyes in wastewater
treatment. Applied Catalysis A: General. 359 (2009) 25-40.
[8] B. Gathuo, P. Rantala, R. Maatta, Industry Wastes. Journal of Water Science and
Technology. 24 (1991) 53-60.
[9] H.Y. Shu, M.C. Chang, H.H. Yu, W.H. Chen, Reduction of an azo dye Acid black
24 solution using synthesized nanoscale zerovalent iron particles. Journal of
Colloid and Interface Science. 314 (2007) 89-97.
[10] A. Mittal, J. Mittal, A. Malviya, D. Kaur, V.K. Gupta, Adsorption of hazardous
dye crystal violet from wastewater by waste materials. Journal of Colloid and
Interface Science. 343 (2010) 463-473.

60
[11] J.T. Spadaro, V. Renganathan, Peroxidase-catalyzed oxidation of azo dyes:
mechanism of disperse yellow 3 degradation. Archives of Biochemistry and
Biophysics. 312 (1994) 301-307.
[12] M. Xiong, G. Gu, B. You, L. Wu, Preparation and characterization of poly
(styrene butylacrylate) latex/nano-Zno nanocomposites. Journal of Applied
Polymer Science. 90 (2003) 1923-1931.
[13] W.R. Kim, H. Park, W-Y. Choi, TiO2 micro-flowers composed of nanotubes and
their application to dye-sensitized solar cells. Nanoscale Research Letters. 9
(2014) 93.
[14] W.S.W. Ngah, L.C. Teong, M.A.K.M. Hanafiah, Adsorption of dyes and heavy
metal ions by chitosan composites: A review. Carbohydrate Polymers. 83 (2011)
1446-1456.
[15] Y.S. Degs, M.I. Barghouthi, A.H. Sheikh, G.M. Walker, Effect of solution pH,
ionic strength, and temperature on adsorption behavior of reactive dyes on
activated carbon. Dyes and Pigments. (2007) 1-8.
[16] Metcalf & Eddy, G. Tchobanoglous, D.H. Stensel, R. Tsuchihasi, F.L. Burton,
Wastewater Engineering: Treatment and Resource Recovery. Fifth edition. Tata
McGraw Hill, New York. 2013.
[17] A.Y. Zahrim, N. Hilal, Treatment of highly concentrated dye solution by
coagulation/flocculation-sand filtration and nanofiltration. Water Resources and
Industry. 3 (2013) 23-34.
[18] J.W. Lee, S.P. Choi, R. Thiruvenkatachari, W.G. Shim, H. Moon, Submerged
microfiltration membrane coupled with alum coagulation/powdered activation carbon
adsorption for complete decolorization of reactive dyes. Water Research. 40 (2006)
435-444.
[19] N.V. Narayanan, M. Ganesan, Use of adsorption using granular activated carbon
(GAC) for the enhancement of removal of chromium from synthetic wastewater by
electrocoagulation. Journal of Hazardous Materials. 161 (2009) 575-580.
[20] M.A.M. Salleh, D.K. Mahmoud, W.A.W.A Karim, A. Idris, Cationic and anionic dye
adsorption by agricultural solid wastes: A comprehensive review. Desalination. 280
(2011) 1-13.
[21] R. Kumar, R. Ahmad, Biosorption of hazardous crystal violet dye from aqueous
solution onto treated ginger waste (TGW). Desalination. 265 (2011) 112-118.
61
[22] R. Thiruvenkatachari, W.G. Shim, J.W. Lee, H. Moon, Effect of powdered
activation carbon type on the performance of an adsorption-microfiltration
submerged hollow fiber membrane hybrid system. 21 (2004) 1044-1052.
[23] F.B.A. Rahman, M. Akhter, M.Z. Abedin, Dyes Removal from Textile Wastewater
Using Orange Peels. International Journal of Scientific & Technology, 2 (2013) 47-
50.
[24] M. Arami, N.Y. Limaee, N.M. Mahmoodi, Removal of dyes from colored textile
wastewater by orange peel adsorbent: Equilibrium and kinetic studies. 288 (2005)
371-376.

62
APPENDIX A: Tables
Table XXXIV: Transmittance of acid black 48 with PAC at low concentration.
Coffee
concentration
(ppm)
Transmittance (%) results with varying activated carbon dosage (g)
0 0.2 0.4 0.6 0.8
1
BT AT BT AT BT AT BT AT BT AT BT AT
0 54.7 62.7 55 86.1 58.7 83.5 56.7 96.4 56.6 95.5 58.3 95.3
100 72.9 74.3 69 96 73 94.6 73.4 94.3 76.3 95.4 73 94.2
150 68.3 72.9 70.1 91.4 69.6 93.5 69.8 92.8 68.7 93.9 69.7 93.4
200 68.2 72.4 68.1 90 69.4 92.4 69 92.9 67.4 93 68.3 93.1
250 67.8 69.9 67.9 88 67.5 90.3 67 91.7 67.2 93 67.4 92.9
300 67.2 69.7 67.9 87.8 67.7 89.9 65.4 91.2 67 92.4 66.2 90.7
Table XXXV: Transmittance of acid black 48 with PAC at medium concentration.
Coffee
concentration
(ppm)
Transmittance (%) results with varying activated carbon dosage (g)
0 0.2 0.4 0.6 0.8 1
BT AT BT AT BT AT BT AT BT AT BT AT
0 32.2 57.3 32 89.5 31.9 89.5 31.2 92.1 31.1 95.4 30.8 98.9
100 49.2 63.7 48.9 87 49 95.6 50.9 91.3 50.1 97.3 49.8 99.2
150 48.5 62.4 48.5 86.3 48.6 86.6 49.8 90.1 48.9 92.1 49 94.1
200 48.4 61.8 48.3 89.1 48.3 79.4 48.2 98.5 47.7 92 49.5 94.1
250 47.7 60.3 47.7 85.3 47.2 78.9 47.7 92.3 47.5 93.5 48.2 99.4
300 46.4 59.7 46.2 74 46.6 76.7 46.3 91.6 46.5 92.2 46.4 97.4
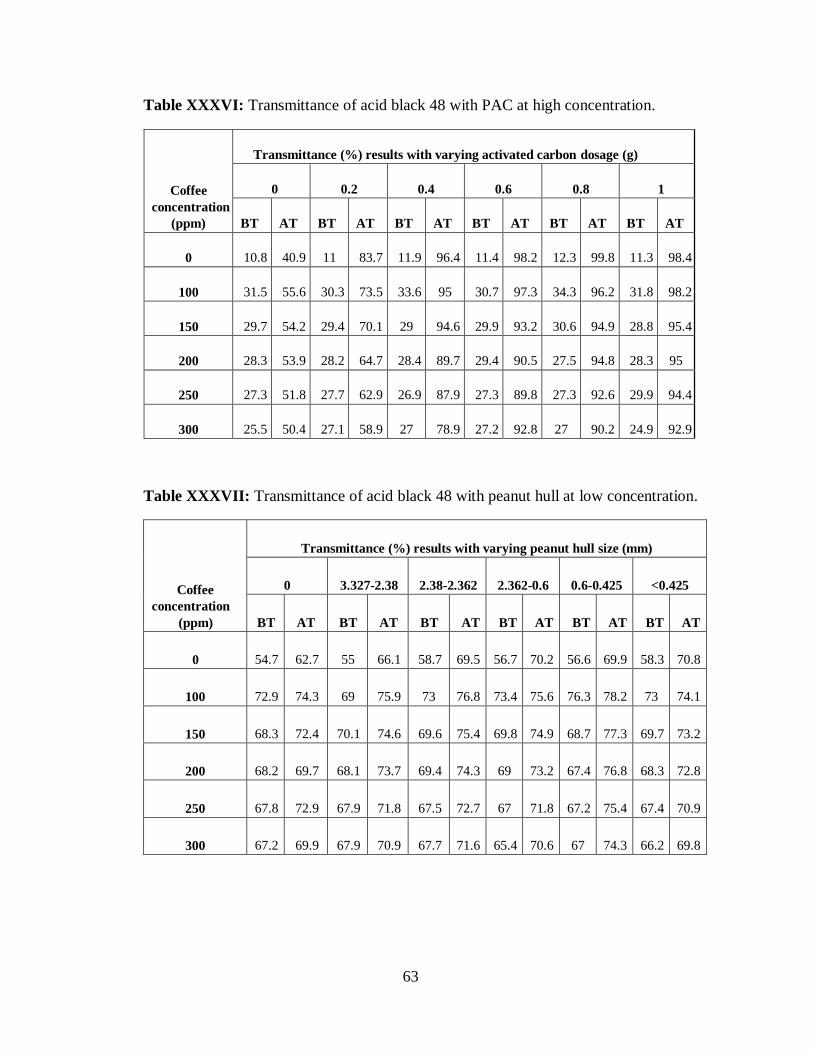
63
Table XXXVI: Transmittance of acid black 48 with PAC at high concentration.
Coffee
concentration
(ppm)
Transmittance (%) results with varying activated carbon dosage (g)
0 0.2 0.4 0.6 0.8
1
BT AT BT AT BT AT BT AT BT AT BT AT
0 10.8 40.9 11 83.7 11.9 96.4 11.4 98.2 12.3 99.8 11.3 98.4
100 31.5 55.6 30.3 73.5 33.6 95 30.7 97.3 34.3 96.2 31.8 98.2
150 29.7 54.2 29.4 70.1 29 94.6 29.9 93.2 30.6 94.9 28.8 95.4
200 28.3 53.9 28.2 64.7 28.4 89.7 29.4 90.5 27.5 94.8 28.3 95
250 27.3 51.8 27.7 62.9 26.9 87.9 27.3 89.8 27.3 92.6 29.9 94.4
300 25.5 50.4 27.1 58.9 27 78.9 27.2 92.8 27 90.2 24.9 92.9
Table XXXVII: Transmittance of acid black 48 with peanut hull at low concentration.
Coffee
concentration
(ppm)
Transmittance (%) results with varying peanut hull size (mm)
0 3.327-2.38 2.38-2.362 2.362-0.6 0.6-0.425 <0.425
BT AT BT AT BT AT BT AT BT AT BT AT
0 54.7 62.7 55 66.1 58.7 69.5 56.7 70.2 56.6 69.9 58.3 70.8
100 72.9 74.3 69 75.9 73 76.8 73.4 75.6 76.3 78.2 73 74.1
150 68.3 72.4 70.1 74.6 69.6 75.4 69.8 74.9 68.7 77.3 69.7 73.2
200 68.2 69.7 68.1 73.7 69.4 74.3 69 73.2 67.4 76.8 68.3 72.8
250 67.8 72.9 67.9 71.8 67.5 72.7 67 71.8 67.2 75.4 67.4 70.9
300 67.2 69.9 67.9 70.9 67.7 71.6 65.4 70.6 67 74.3 66.2 69.8

64
Table XXXVIII: Transmittance of acid black 48 with peanut hull at medium
concentration.
Coffee
concentration
(ppm)
Transmittance (%) results with varying peanut hull size (mm)
0 3.327-2.38 2.38-2.362 2.362-0.6 0.6-0.425 <0.425
BT AT BT AT BT AT BT AT BT AT BT AT
0 32.2 40.9 32 53.9 31.9 52.6 31.2 61.6 31.1 65.4 30.8 67.6
100 49.2 55.6 48.9 66.8 49 67.8 50.9 71.9 50.1 72.8 49.8 70.2
150 48.5 54.2 48.5 65.4 48.6 66.4 49.8 70.5 48.9 71.3 49 69.5
200 48.4 53.9 48.3 64.3 48.3 65.8 48.2 69.7 47.7 70.4 49.5 68.2
250 47.7 51.8 47.7 63.9 47.2 64.3 47.7 68.4 47.5 69.7 48.2 67.6
300 46.4 50.4 46.2 62.5 46.6 63.2 46.3 67.3 46.5 68.1 46.4 65.9
Table XXXIX: Transmittance of acid black 48 with peanut hull at high concentration.
Coffee
concentration
(ppm)
Transmittance (%) results with varying peanut hull size (mm)
0 3.327-2.38 2.38-2.632 2.362-0.6 0.6-0.425 <0.425
BT AT BT AT BT AT BT AT BT AT BT AT
0 10.8 54.7 11 46.2 11.9 48.9 11.4 50.3 12.3 52.7 11.3 51.6
100 31.5 61.4 30.3 67.8 33.6 67.9 30.7 68.7 34.3 69.4 31.8 68.7
150 29.7 60.1 29.4 66.2 29 68.6 29.9 67.8 30.6 68.6 28.8 67.5
200 28.3 59.8 28.2 65.4 28.4 67.4 29.4 66.2 27.5 67.3 28.3 66.7
250 27.3 58.5 27.7 64.3 26.9 66.9 27.3 65.4 27.3 66.8 29.9 65.4
300 25.5 57.6 27.1 62.9 27 65.5 27.2 63.1 27 65.4 24.9 64.1

65
Table XL: Transmittance of acid black 48 with onion peel at low concentration.
Coffee
concentration
(ppm)
Transmittance (%) results with varying onion peel dosage
(g)
0 0.4 0.8 1.2 1.6
2
BT AT BT AT BT AT BT AT BT AT BT
AT
0 54.7 62.7 55 63.2 58.7 67.4 56.7 69.2 56.6 63.4 58.3
61.5
100 72.9 74.3 69 76.4 73 78.6 73.4 80.1 76.3 78.4 73
75.1
150 68.3 72.4 70.1 75.1 69.6 77.4 69.8 79.4 68.7 77.2 69.7
73.2
200 68.2 69.7 68.1 74.6 69.4 76.2 69 78.1 67.4 76.4 68.3
71.7
250 67.8 72.9 67.9 73.2 67.5 75.7 67 77.5 67.2 74.5 67.4
69.4
300 67.2 69.9 67.9 72.4 67.7 74.1 65.4 76.9 67 72.8 66.2
68.4
Table XLI: Transmittance of acid black 48 with onion peel at medium concentration
Coffee
concentration
(ppm)
Transmittance (%) results with varying onion peel dosage
(g)
0 0.4 0.8 1.2 1.6
2
BT AT BT AT BT AT BT AT BT AT BT
AT
0 32.2 40.9 32 55.4 31.9 58.1 31.2 67.5 31.1 63.8 30.8
51.6
100 49.2 55.6 48.9 62.7 49 67.2 50.9 75.6 50.1 67.6 49.8
57.9
150 48.5 54.2 48.5 60.8 48.6 65.7 49.8 73.1 48.9 65.1 49
55.4
200 48.4 53.9 48.3 59.1 48.3 64.1 48.2 71.7 47.7 64.8 49.5
53.1
250 47.7 51.8 47.7 57.6 47.2 62.7 47.7 70.2 47.5 62.9 48.2
51.7
300 46.4 50.4 46.2 56.1 46.6 61.2 46.3 68.5 46.5 60.7 46.4
50.4
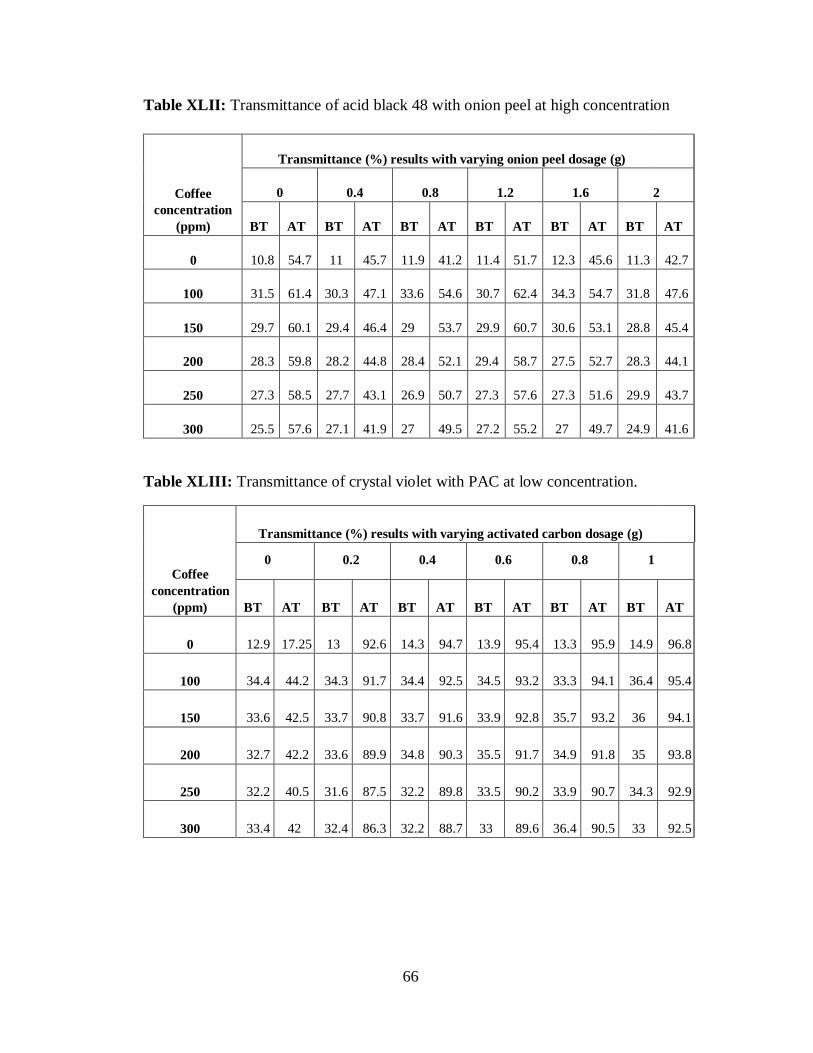
66
Table XLII: Transmittance of acid black 48 with onion peel at high concentration
Coffee
concentration
(ppm)
Transmittance (%) results with varying onion peel dosage (g)
0 0.4 0.8 1.2 1.6
2
BT AT BT AT BT AT BT AT BT AT BT
AT
0 10.8 54.7 11 45.7 11.9 41.2 11.4 51.7 12.3 45.6 11.3
42.7
100 31.5 61.4 30.3 47.1 33.6 54.6 30.7 62.4 34.3 54.7 31.8
47.6
150 29.7 60.1 29.4 46.4 29 53.7 29.9 60.7 30.6 53.1 28.8
45.4
200 28.3 59.8 28.2 44.8 28.4 52.1 29.4 58.7 27.5 52.7 28.3
44.1
250 27.3 58.5 27.7 43.1 26.9 50.7 27.3 57.6 27.3 51.6 29.9
43.7
300 25.5 57.6 27.1 41.9 27 49.5 27.2 55.2 27 49.7 24.9
41.6
Table XLIII: Transmittance of crystal violet with PAC at low concentration.
Coffee
concentration
(ppm)
Transmittance (%) results with varying activated carbon dosage (g)
0 0.2 0.4 0.6 0.8 1
BT AT BT AT BT AT BT AT BT AT BT AT
0 12.9 17.25 13 92.6 14.3 94.7 13.9 95.4 13.3 95.9 14.9 96.8
100 34.4 44.2 34.3 91.7 34.4 92.5 34.5 93.2 33.3 94.1 36.4 95.4
150 33.6 42.5 33.7 90.8 33.7 91.6 33.9 92.8 35.7 93.2 36 94.1
200 32.7 42.2 33.6 89.9 34.8 90.3 35.5 91.7 34.9 91.8 35 93.8
250 32.2 40.5 31.6 87.5 32.2 89.8 33.5 90.2 33.9 90.7 34.3 92.9
300 33.4 42 32.4 86.3 32.2 88.7 33 89.6 36.4 90.5 33 92.5

67
Table XLIV: Transmittance of crystal violet with PAC at medium concentration.
Coffee
concentr
ation
(ppm)
Transmittance (%) results with varying activated carbon dosage (g)
0 0.2 0.4 0.6 0.8 1
BT AT BT AT BT AT BT AT BT AT BT AT
0
8.8 16.3 8.6 94.6 8.7 95.1 8.9 96.3 8.8 96.3 9.1 97
100
35.4 44.8 35.6 92.9 35.7 94.8 35.2 94.8 35.4 95.2 35.
7
96.8
150
34.3 43.6 34.2 91.2 34.3 93.2 34.2 93.9 34.3 94.2 34.6 95.2
200
33.9 42.9 33.7 90.6 33.8 91.6 33.5 92.6 33.9 93.7 33.2 94.7
250
33.2 41.3 33.5 89.7 33.6 90.4 33.1 91.8 33.2 92.8 32.
8
93.5
300
32 41.1 31.7 87.2 31.8 89.6 31.5 90.7 32 91.3 31.7 92.4
Table XLV: Transmittance of crystal violet with PAC at high concentration.
Coffee
concentration
(ppm)
Transmittance (%) results with varying activated carbon dosage (g)
0 0.2 0.4 0.6 0.8
1
BT AT BT AT BT AT BT AT BT AT BT AT
0 0.4 5.3 0.4 84.6 0.5 86.3 0.4 86.4 0.5 89.7 0.4 90.6
100 6 6.7 6.1 89.3 6.2 90.7 6.7 91.5 6.4 92.8 7.1 93.1
150 5.5 6.2 5.2 87.2 5.6 88.6 5.5 90.4 5.2 91.2 5.5 92.7
200 5.3 6.7 5.5 85.4 5.4 86.5 5.3 88.9 4.9 90.6 5.3 91.5
250 4.8 5.3 4.9 84.6 5.8 85.9 5.4 87.1 5.1 89.5 5.4 89.4
300 5.1 5.9 4.9 83.4 5.4 84.6 5.5 85.7 5.4 87.6 4.8 87.3
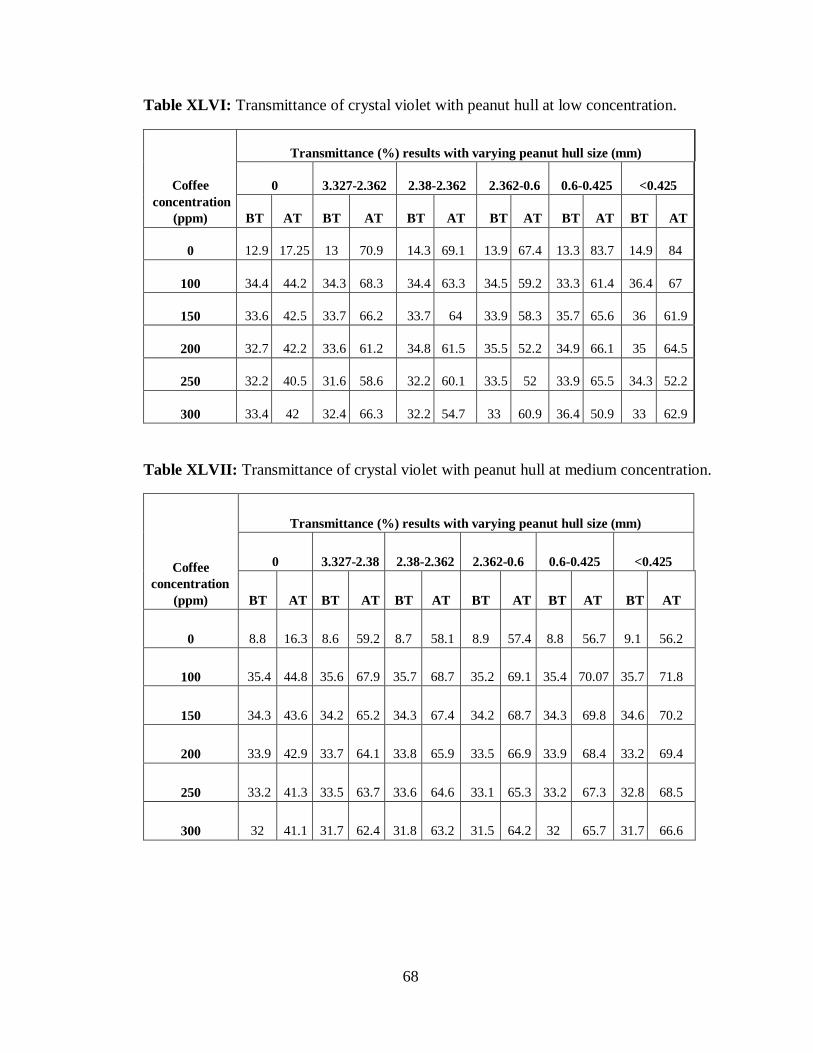
68
Table XLVI: Transmittance of crystal violet with peanut hull at low concentration.
Coffee
concentration
(ppm)
Transmittance (%) results with varying peanut hull size (mm)
0 3.327-2.362 2.38-2.362 2.362-0.6 0.6-0.425 <0.425
BT AT BT AT BT AT BT AT BT AT BT AT
0 12.9 17.25 13 70.9 14.3 69.1 13.9 67.4 13.3 83.7 14.9 84
100 34.4 44.2 34.3 68.3 34.4 63.3 34.5 59.2 33.3 61.4 36.4 67
150 33.6 42.5 33.7 66.2 33.7 64 33.9 58.3 35.7 65.6 36 61.9
200 32.7 42.2 33.6 61.2 34.8 61.5 35.5 52.2 34.9 66.1 35 64.5
250 32.2 40.5 31.6 58.6 32.2 60.1 33.5 52 33.9 65.5 34.3 52.2
300 33.4 42 32.4 66.3 32.2 54.7 33 60.9 36.4 50.9 33 62.9
Table XLVII: Transmittance of crystal violet with peanut hull at medium concentration.
Coffee
concentration
(ppm)
Transmittance (%) results with varying peanut hull size (mm)
0 3.327-2.38 2.38-2.362 2.362-0.6 0.6-0.425 <0.425
BT AT BT AT BT AT BT AT BT AT BT AT
0 8.8 16.3 8.6 59.2 8.7 58.1 8.9 57.4 8.8 56.7 9.1 56.2
100 35.4 44.8 35.6 67.9 35.7 68.7 35.2 69.1 35.4 70.07 35.7 71.8
150 34.3 43.6 34.2 65.2 34.3 67.4 34.2 68.7 34.3 69.8 34.6 70.2
200 33.9 42.9 33.7 64.1 33.8 65.9 33.5 66.9 33.9 68.4 33.2 69.4
250 33.2 41.3 33.5 63.7 33.6 64.6 33.1 65.3 33.2 67.3 32.8 68.5
300 32 41.1 31.7 62.4 31.8 63.2 31.5 64.2 32 65.7 31.7 66.6

69
Table XLVIII: Transmittance of crystal violet with peanut hull at high concentration.
Coffee
concentration
(ppm)
Transmittance (%) results with varying peanut hull size (mm)
0 3.327-2.38 2.38-2.362 2.362-0.6 0.6-0.425 <0.425
BT AT BT AT BT AT BT AT BT AT BT AT
0 0.4 5.3 0.4 45.8 0.5 41.6 0.4 38 0.5 32.7 0.4 31.4
100 6 6.7 6.1 37.6 6.2 44.7 6.7 41.2 6.4 36.6 7.1 34.3
150 5.5 6.2 5.2 37.2 5.6 38.5 5.5 39.9 5.2 32.4 5.5 31.2
200 5.3 6.7 5.5 35.6 5.4 37.3 5.3 36.3 4.9 31.4 5.3 30.1
250 4.8 5.3 4.9 31.9 5.8 36.3 5.4 34.1 5.1 31.5 5.4 30.2
300 5.1 5.9 4.9 30.7 5.4 30.9 5.5 34.9 5.4 33.6 4.8 30.5
Table XLIX: Transmittance of crystal violet with onion peel at low concentration.
Coffee
concentration
(ppm)
Transmittance (%) results with varying onion peel dosage (g)
0 0.4 0.8 1.2 1.6
2
BT AT BT AT BT AT BT AT BT AT BT AT
0 12.9 20.2 13 74.7 14.3 76.7 13.9 78.9 13.3 80.7 14.9 82.4
100 34.4 37.1 34.3 72.9 34.4 75.8 34.5 77.2 33.3 78.1 36.4 79.8
150 33.6 36.8 33.7 71.6 33.7 74.6 33.9 76.4 35.7 77.6 36 78.4
200 32.7 35.4 33.6 71.3 34.8 73.8 35.5 75.9 34.9 76.9 35 77.6
250 32.2 33.9 31.6 70.1 32.2 72.3 33.5 73.1 33.9 74.5 34.3 76.3
300 33.4 33.5 32.4 69.7 32.2 70.8 33 72.8 36.4 73.2 33 74.9

70
Table L: Transmittance of crystal violet with onion peel at medium concentration.
Coffee
concentration
(ppm)
Transmittance (%) results with varying onion peel dosage (g)
0 0.4 0.8 1.2 1.6
2
BT
AT BT AT BT AT BT AT BT AT BT AT
0 8.8
15.4 8.6 69.4 8.7 71.9 8.9 73.1 8.8 74.6 9.1 76.9
100 35.4
36.2 35.6 68.8 35.7 70.8 35.2 72.8 35.4 73.2 35.7 75.4
150 34.3
35.3 34.2 67.5 34.3 69.1 34.2 71.9 34.3 72.5 34.6 74.6
200 33.9
34.7 33.7 66.4 33.8 67.8 33.5 70.2 33.9 71.8 33.2 73.9
250 33.2
33.9 33.5 63.9 33.6 66.2 33.1 69.8 33.2 70.9 32.8 72.1
300 32
32.7 31.7 62.8 31.8 64.9 31.5 67.5 32 68.6 31.7 70.8
Table LI: Transmittance of crystal violet with onion peel at high concentration.
Coffee
concentration
(ppm)
Transmittance (%) results with varying onion peel dosage (g)
0 0.4 0.8 1.2 1.6
2
BT AT BT AT BT AT BT AT BT AT BT
AT
0 0.4 5.3 0.4 65.6 0.5 67.4 0.4 69.5 0.5 71.9 0.4
73.2
100 6 6.7 6.1 64.2 6.2 66.5 6.7 68.2 6.4 69.3 7.1
72.9
150 5.5 6.2 5.2 63.8 5.6 64.9 5.5 67.5 5.2 68.4 5.5
71.8
200 5.3 6.7 5.5 62.9 5.4 63.2 5.3 66.7 4.9 67.7 5.3
70.6
250 4.8 5.3 4.9 60.6 5.8 62.1 5.4 65.3 5.1 65.9 5.4
69.5
300 5.1 5.9 4.9 59.2 5.4 60.8 5.5 63.8 5.4 64.6 4.8
68.2

71
Table LII: Transmittance of disperse yellow 3 with PAC at low concentration.
Coffee
concentration
(ppm)
Transmittance (%) results with varying powdered activated carbon dosage (g)
0 0.2 0.4 0.6 0.8 1
BT AT BT AT BT AT BT AT BT AT BT AT
0 49.1 57.1 48.7 96.5 48.7 97.5 49.3 96.3 48.6 97.7 47.8 97.7
100 67.3 73.2 67.2 95.3 67.4 96.1 67.8 95.2 67.3 96.4 67.9 96.8
150 65.4 72.8 65.4 94.2 65.8 95.3 65.6 94.1 65.2 95.9 65.3 95.1
200 63.9 71.9 63.7 93.8 63.2 94.4 63.8 93.7 63.9 94.5 63.7 94.5
250 62.1 70.4 62.8 92.1 62.8 93.8 62.6 92.9 62.5 93.2 62.6 93.2
300 61 69.3 61.4 87.1 61.5 89.3 61.9 88.6 61.3 91.4 61.4 92.6
Table LIII: Transmittance of disperse yellow 3 with PAC at medium concentration.
Coffee
concentration
(ppm)
Transmittance (%) results with varying powdered activated carbon dosage (g)
0 0.2 0.4 0.6 0.8 1
BT AT BT AT BT AT BT AT BT AT BT AT
0 28.8 35.4 29.1 92.1 27.5 93.1 28.7 93.8 28.3 95.6 27.3 96.4
100 47.6 54.1 47.8 91.7 46.4 92.6 47.2 92.9 47.1 94.2 47.6 95.3
150 46.3 53.7 46.1 90.3 46.2 91.4 46.4 91.7 46.8 93.3 46.1 94.7
200 45.8 52.9 45.4 89 45.3 90 45.3 91.2 45.5 92.1 45.2 93.8
250 44.2 51.6 44.2 88.8 44.1 89.7 44.5 90.4 44.2 91.7 44 92.5
300 43 50.3 43.1 87.4 43.6 88.9 43.8 89.8 43.4 90.2 43.4 91.9
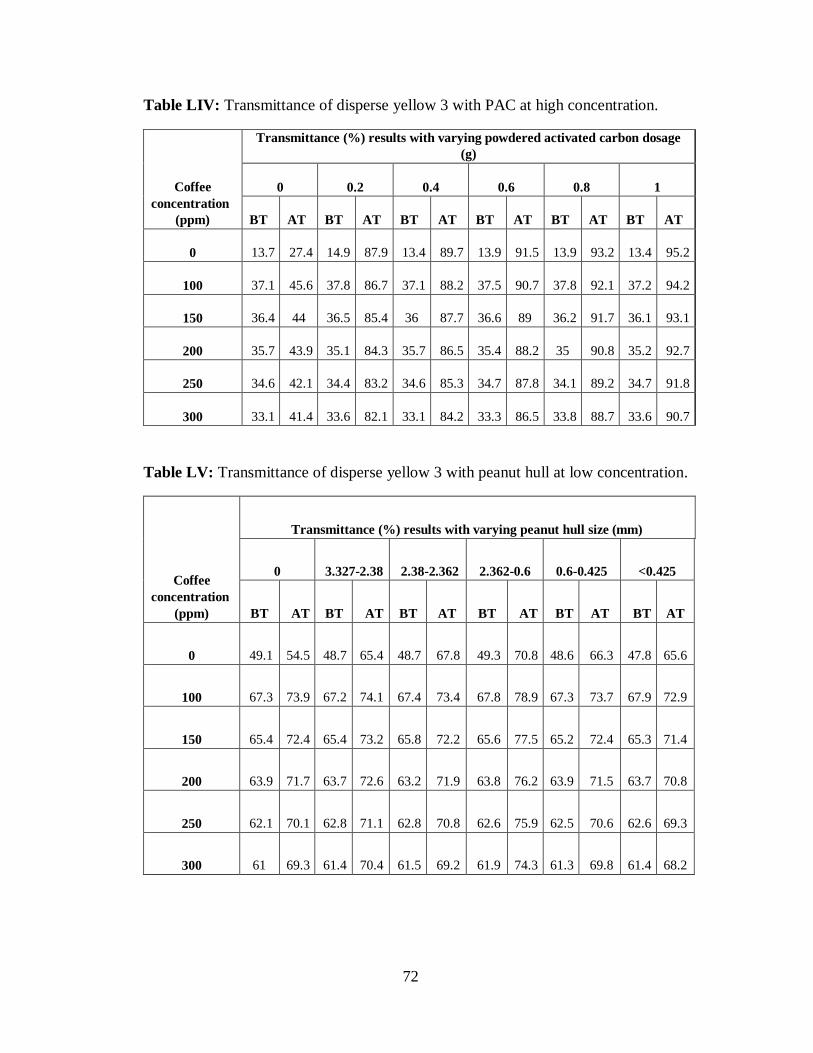
72
Table LIV: Transmittance of disperse yellow 3 with PAC at high concentration.
Coffee
concentration
(ppm)
Transmittance (%) results with varying powdered activated carbon dosage
(g)
0 0.2 0.4 0.6 0.8 1
BT AT BT AT BT AT BT AT BT AT BT AT
0 13.7 27.4 14.9 87.9 13.4 89.7 13.9 91.5 13.9 93.2 13.4 95.2
100 37.1 45.6 37.8 86.7 37.1 88.2 37.5 90.7 37.8 92.1 37.2 94.2
150 36.4 44 36.5 85.4 36 87.7 36.6 89 36.2 91.7 36.1 93.1
200 35.7 43.9 35.1 84.3 35.7 86.5 35.4 88.2 35 90.8 35.2 92.7
250 34.6 42.1 34.4 83.2 34.6 85.3 34.7 87.8 34.1 89.2 34.7 91.8
300 33.1 41.4 33.6 82.1 33.1 84.2 33.3 86.5 33.8 88.7 33.6 90.7
Table LV: Transmittance of disperse yellow 3 with peanut hull at low concentration.
Coffee
concentration
(ppm)
Transmittance (%) results with varying peanut hull size (mm)
0 3.327-2.38 2.38-2.362 2.362-0.6 0.6-0.425 <0.425
BT AT BT AT BT AT BT AT BT AT BT AT
0 49.1 54.5 48.7 65.4 48.7 67.8 49.3 70.8 48.6 66.3 47.8 65.6
100 67.3 73.9 67.2 74.1 67.4 73.4 67.8 78.9 67.3 73.7 67.9 72.9
150 65.4 72.4 65.4 73.2 65.8 72.2 65.6 77.5 65.2 72.4 65.3 71.4
200 63.9 71.7 63.7 72.6 63.2 71.9 63.8 76.2 63.9 71.5 63.7 70.8
250 62.1 70.1 62.8 71.1 62.8 70.8 62.6 75.9 62.5 70.6 62.6 69.3
300 61 69.3 61.4 70.4 61.5 69.2 61.9 74.3 61.3 69.8 61.4 68.2
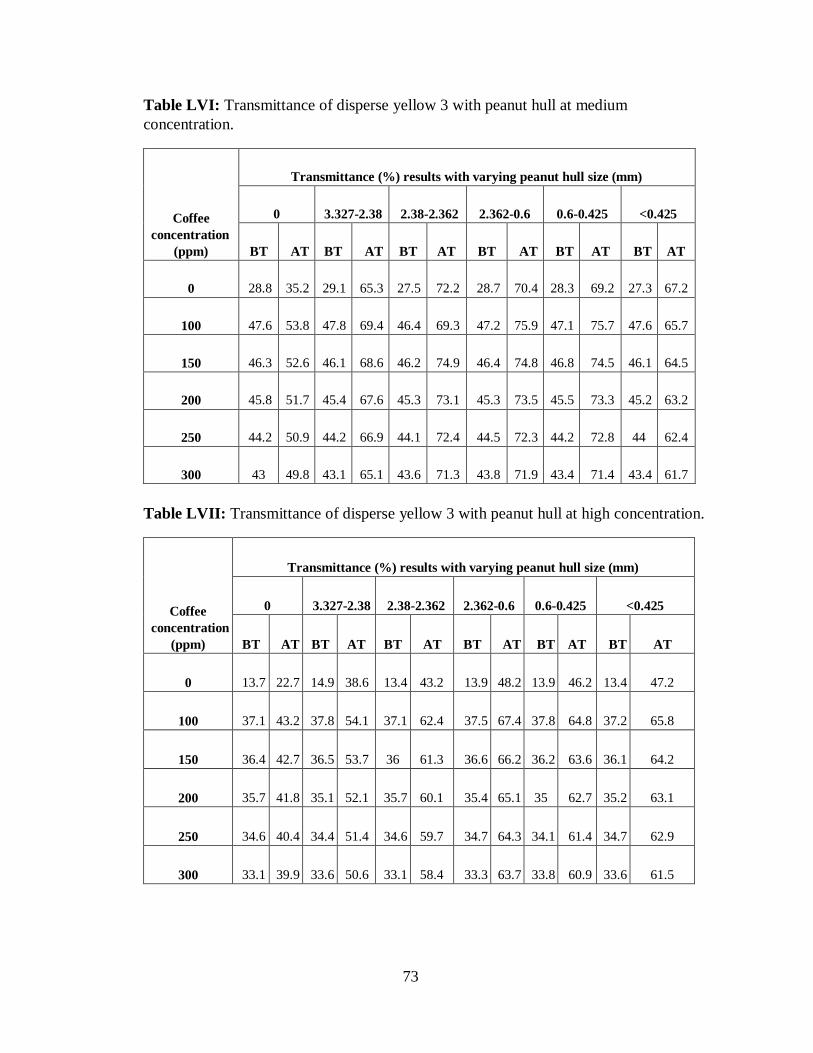
73
Table LVI: Transmittance of disperse yellow 3 with peanut hull at medium
concentration.
Coffee
concentration
(ppm)
Transmittance (%) results with varying peanut hull size (mm)
0 3.327-2.38 2.38-2.362 2.362-0.6 0.6-0.425 <0.425
BT AT BT AT BT AT BT AT BT AT BT AT
0 28.8 35.2 29.1 65.3 27.5 72.2 28.7 70.4 28.3 69.2 27.3 67.2
100 47.6 53.8 47.8 69.4 46.4 69.3 47.2 75.9 47.1 75.7 47.6 65.7
150 46.3 52.6 46.1 68.6 46.2 74.9 46.4 74.8 46.8 74.5 46.1 64.5
200 45.8 51.7 45.4 67.6 45.3 73.1 45.3 73.5 45.5 73.3 45.2 63.2
250 44.2 50.9 44.2 66.9 44.1 72.4 44.5 72.3 44.2 72.8 44 62.4
300 43 49.8 43.1 65.1 43.6 71.3 43.8 71.9 43.4 71.4 43.4 61.7
Table LVII: Transmittance of disperse yellow 3 with peanut hull at high concentration.
Coffee
concentration
(ppm)
Transmittance (%) results with varying peanut hull size (mm)
0 3.327-2.38 2.38-2.362 2.362-0.6 0.6-0.425 <0.425
BT AT BT AT BT AT BT AT BT AT BT AT
0 13.7 22.7 14.9 38.6 13.4 43.2 13.9 48.2 13.9 46.2 13.4 47.2
100 37.1 43.2 37.8 54.1 37.1 62.4 37.5 67.4 37.8 64.8 37.2 65.8
150 36.4 42.7 36.5 53.7 36 61.3 36.6 66.2 36.2 63.6 36.1 64.2
200 35.7 41.8 35.1 52.1 35.7 60.1 35.4 65.1 35 62.7 35.2 63.1
250 34.6 40.4 34.4 51.4 34.6 59.7 34.7 64.3 34.1 61.4 34.7 62.9
300 33.1 39.9 33.6 50.6 33.1 58.4 33.3 63.7 33.8 60.9 33.6 61.5

74
Table LVIII: Transmittance of disperse yellow 3 with onion peel at low concentration.
Coffee
concentration
(ppm)
Transmittance (%) results with varying onion peel dosage (g)
0 0.4 0.8 1.2 1.6
2
BT AT BT AT BT AT BT AT BT AT BT
AT
0 49.1 55.2 48.7 63.2 48.7 65.4 49.3 68.7 48.6 64.8 47.8
58.3
100 67.3 73.7 67.2 74.1 67.4 78.9 67.8 82.4 67.3 73.9 67.9
67.9
150 65.4 72.3 65.4 73.3 65.8 77.4 65.6 81.8 65.2 72.4 65.3
66.8
200 63.9 71.5 63.7 72.8 63.2 76.6 63.8 80.2 63.9 74.6 63.7
65.4
250 62.1 70.8 62.8 71.7 62.8 75.3 62.6 79.9 62.5 73.3 62.6
64.6
300 61 69.6 61.4 70.6 61.5 74.7 61.9 78.5 61.3 72.2 61.4
63.3
Table LIX: Transmittance of disperse yellow 3 with onion peel at medium
concentration.
Coffee
concentration
(ppm)
Transmittance (%) results with varying onion peel dosage (g)
0 0.4 0.8 1.2 1.6
2
BT AT BT AT BT AT BT AT BT AT BT
AT
0 28.8 35.4 29.1 59.8 27.5 60.2 28.7 65.7 28.3 63.9 27.3
59.7
100 47.6 53.7 47.8 63.3 46.4 67.3 47.2 73.9 47.1 67.5 47.6
57.9
150 46.3 52.9 46.1 62.1 46.2 66.5 46.4 72.3 46.8 66.2 46.1
56.3
200 45.8 51.8 45.4 61.4 45.3 65.6 45.3 71.2 45.5 65.5 45.2
55.2
250 44.2 50.2 44.2 60.7 44.1 64.1 44.5 70.4 44.2 64.2 44
54.6
300 43 49.1 43.1 59.8 43.6 63.8 43.8 69.9 43.4 63.8 43.4
53.2

75
Table LX: Transmittance of disperse yellow 3 with onion peel at high concentration.
Coffee
concentration
(ppm)
Transmittance (%) results with varying onion peel dosage (g)
0 0.4 0.8 1.2 1.6
2
BT AT BT AT BT AT BT AT BT AT BT
AT
0 13.7 21.9 14.9 45.4 13.4 41.1 13.9 65.4 13.9 61.7 13.4
52.5
100 37.1 45.3 37.8 52.1 37.1 57 37.5 64.8 37.8 60.1 37.2
57.9
150 36.4 44.6 36.5 51.2 36 56.2 36.6 63.5 36.2 59.4 36.1
58.6
200 35.7 43.5 35.1 50.3 35.7 55.1 35.4 62.9 35 58.5 35.2
57.4
250 34.6 42.8 34.4 49.05 34.6 54.4 34.7 61.6 34.1 57.6 34.7
56.7
300 33.1 41.7 33.6 48.2 33.1 53.7 33.3 60.3 33.8 55.2 33.6
55.3

76
APPENDIX B: FIGURES
Figure 7: Comparison of transmittance before and after treatment in low concentration
acid black 48
Figure 8: Comparison of transmittance before and after treatment in medium
concentration acid black 48.
0
20
40
60
80
100
120
BT AT BT AT BT AT BT AT BT AT BT AT
0 0.2 0.4 0.6 0.8 1
Tra
nsm
itta
nce
(%
)
Adsorbent dosage (g)
0 100 150 200 250 300
0
20
40
60
80
100
120
BT AT BT AT BT AT BT AT BT AT BT AT
0 0.2 0.4 0.6 0.8 1
Tra
nsm
itta
nce
(%
)
Adsorbent dosage (g)
0 100 150 200 250 300
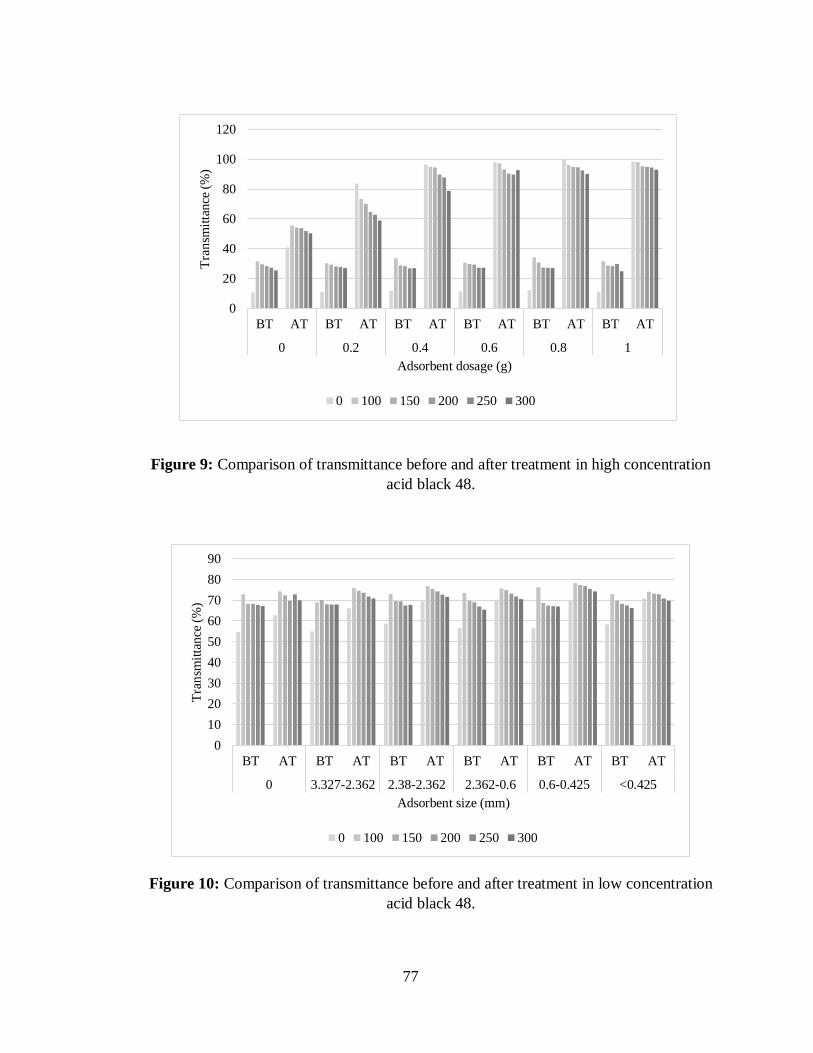
77
Figure 9: Comparison of transmittance before and after treatment in high concentration
acid black 48.
Figure 10: Comparison of transmittance before and after treatment in low concentration
acid black 48.
0
10
20
30
40
50
60
70
80
90
BT AT BT AT BT AT BT AT BT AT BT AT
0 3.327-2.362 2.38-2.362 2.362-0.6 0.6-0.425 <0.425
Tra
nsm
itta
nce
(%
)
Adsorbent size (mm)
0 100 150 200 250 300
0
20
40
60
80
100
120
BT AT BT AT BT AT BT AT BT AT BT AT
0 0.2 0.4 0.6 0.8 1
Tra
nsm
itta
nce
(%
)
Adsorbent dosage (g)
0 100 150 200 250 300

78
Figure 11: Comparison of transmittance before and after treatment in medium
concentration acid black 48.
Figure 12: Comparison of transmittance before and after treatment in high concentration
acid black 48.
0
10
20
30
40
50
60
70
80
BT AT BT AT BT AT BT AT BT AT BT AT
0 3.327-2.362 2.38-2.362 2.362-0.6 0.6-0.425 <0.425
Tra
nsm
itta
nce
(%
)
Adsorbent size (mm)
0 100 150 200 250 300
0
10
20
30
40
50
60
70
80
BT AT BT AT BT AT BT AT BT AT BT AT
0 3.327-2.362 2.38-2.362 2.362-0.6 0.6-0.425 <0.425
Tra
nsm
itta
nce
(%
)
Adsorbent Size (mm)
0 100 150 200 250 300

79
Figure 13: Comparison of transmittance before and after treatment in low concentration
acid black 48.
Figure 14: Comparison of transmittance before and after treatment in medium
concentration acid black 48.
0
10
20
30
40
50
60
70
80
90
BT AT BT AT BT AT BT AT BT AT BT AT
0 0.4 0.8 1.2 1.6 2
Tra
nsm
itta
nce
(%
)
Adsorbent dosage (g)
0 100 150 200 250 300
0
10
20
30
40
50
60
70
80
BT AT BT AT BT AT BT AT BT AT BT AT
0 0.4 0.8 1.2 1.6 2
Tra
nsm
itta
nce
(%
)
Adsorbent dosage (g)
0 100 150 200 250 300

80
Figure 15: Comparison of transmittance before and after treatment in high concentration
acid black 48.
Figure 16: Comparison of transmittance before and after treatment in low concentration
crystal violet.
0
10
20
30
40
50
60
70
BT AT BT AT BT AT BT AT BT AT BT AT
0 0.4 0.8 1.2 1.6 2
Tra
nsm
itta
nce
(%
)
Adsorbent dosage (g)
0 100 150 200 250 300
0
20
40
60
80
100
120
BT AT BT AT BT AT BT AT BT AT BT AT
0 0.2 0.4 0.6 0.8 1
Tra
nsm
itta
nce
(%
)
Adsorbent dosage (g)
0 100 150 200 250 300
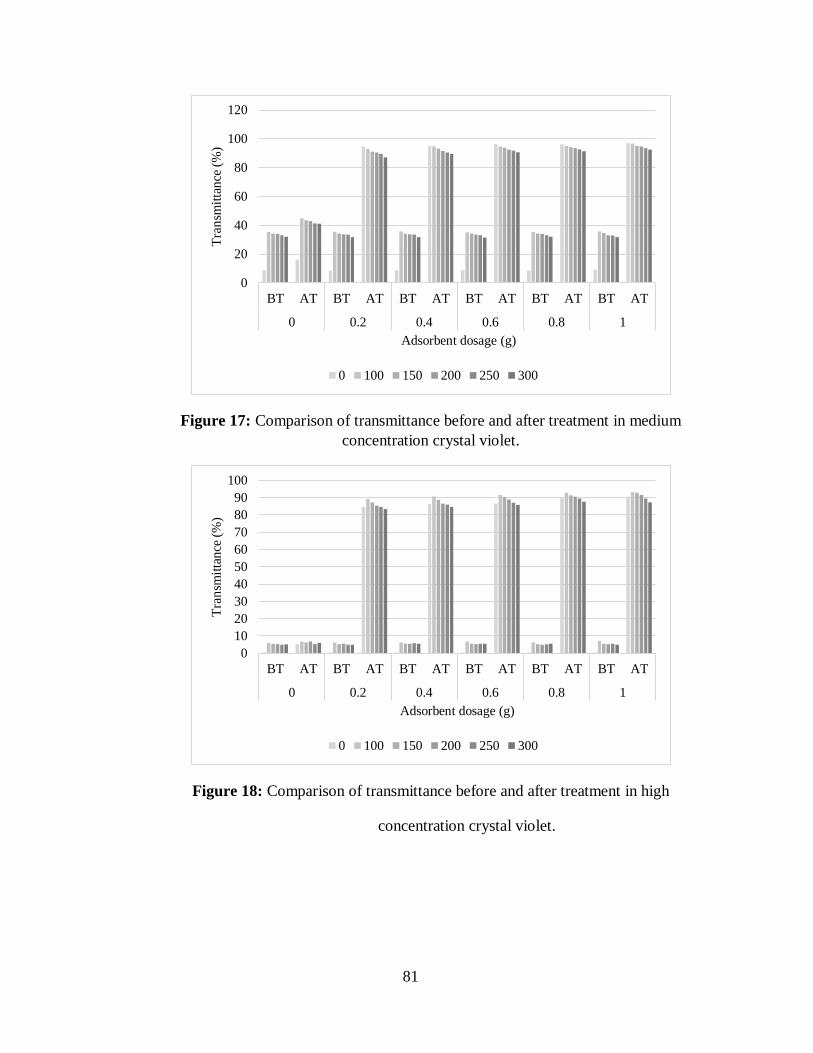
81
Figure 17: Comparison of transmittance before and after treatment in medium
concentration crystal violet.
Figure 18: Comparison of transmittance before and after treatment in high
concentration crystal violet.
0
20
40
60
80
100
120
BT AT BT AT BT AT BT AT BT AT BT AT
0 0.2 0.4 0.6 0.8 1
Tra
nsm
itta
nce
(%
)
Adsorbent dosage (g)
0 100 150 200 250 300
0
10
20
30
40
50
60
70
80
90
100
BT AT BT AT BT AT BT AT BT AT BT AT
0 0.2 0.4 0.6 0.8 1
Tra
nsm
itta
nce
(%
)
Adsorbent dosage (g)
0 100 150 200 250 300
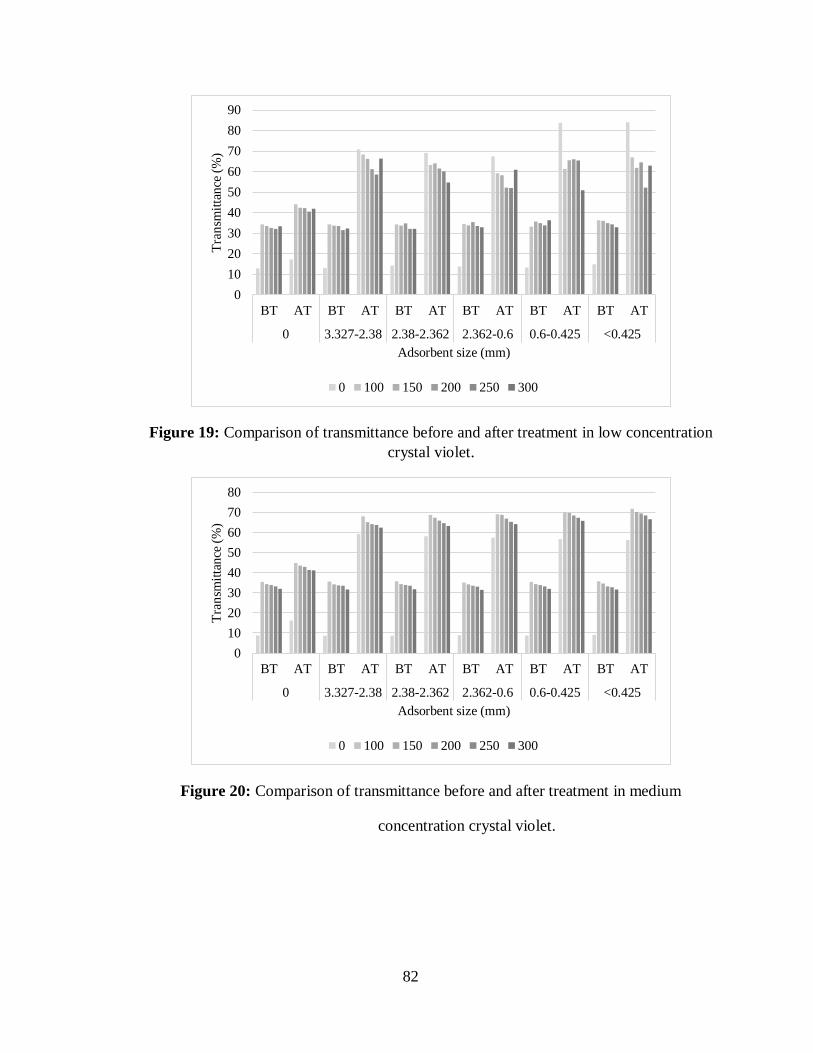
82
Figure 19: Comparison of transmittance before and after treatment in low concentration
crystal violet.
Figure 20: Comparison of transmittance before and after treatment in medium
concentration crystal violet.
0
10
20
30
40
50
60
70
80
90
BT AT BT AT BT AT BT AT BT AT BT AT
0 3.327-2.38 2.38-2.362 2.362-0.6 0.6-0.425 <0.425
Tra
nsm
itta
nce
(%
)
Adsorbent size (mm)
0 100 150 200 250 300
0
10
20
30
40
50
60
70
80
BT AT BT AT BT AT BT AT BT AT BT AT
0 3.327-2.38 2.38-2.362 2.362-0.6 0.6-0.425 <0.425
Tra
nsm
itta
nce
(%
)
Adsorbent size (mm)
0 100 150 200 250 300
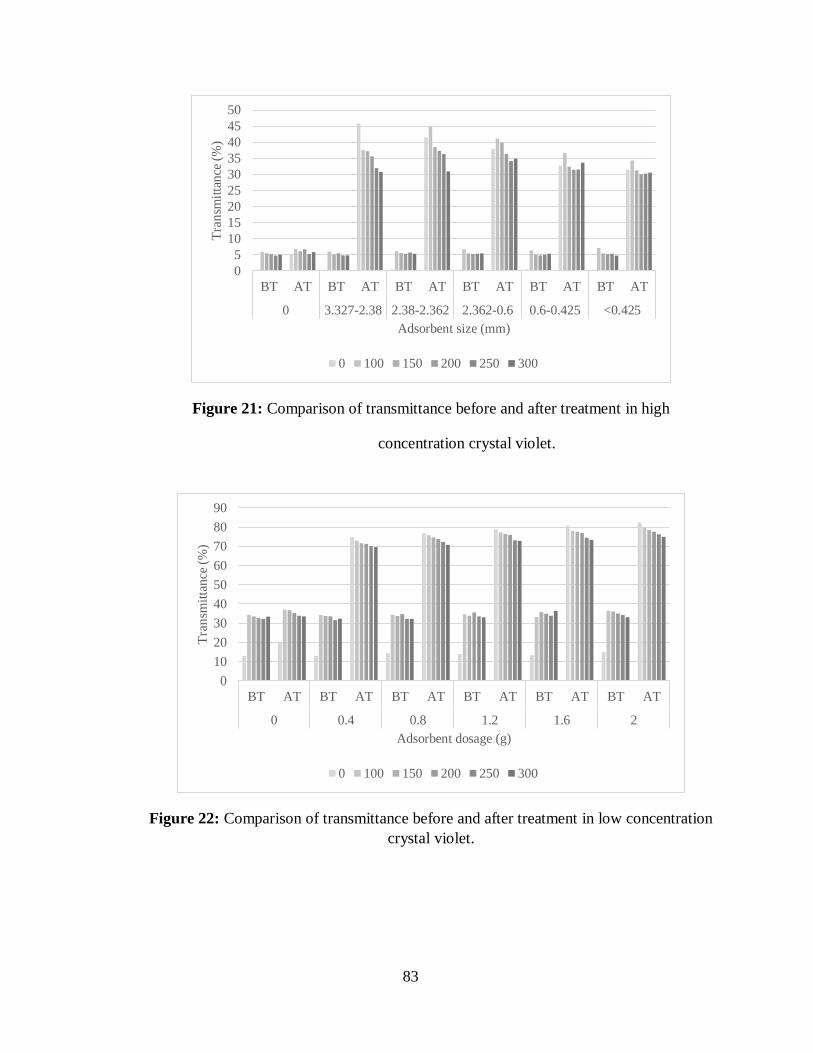
83
Figure 21: Comparison of transmittance before and after treatment in high
concentration crystal violet.
Figure 22: Comparison of transmittance before and after treatment in low concentration
crystal violet.
0
5
10
15
20
25
30
35
40
45
50
BT AT BT AT BT AT BT AT BT AT BT AT
0 3.327-2.38 2.38-2.362 2.362-0.6 0.6-0.425 <0.425
Tra
nsm
itta
nce
(%
)
Adsorbent size (mm)
0 100 150 200 250 300
0
10
20
30
40
50
60
70
80
90
BT AT BT AT BT AT BT AT BT AT BT AT
0 0.4 0.8 1.2 1.6 2
Tra
nsm
itta
nce
(%
)
Adsorbent dosage (g)
0 100 150 200 250 300
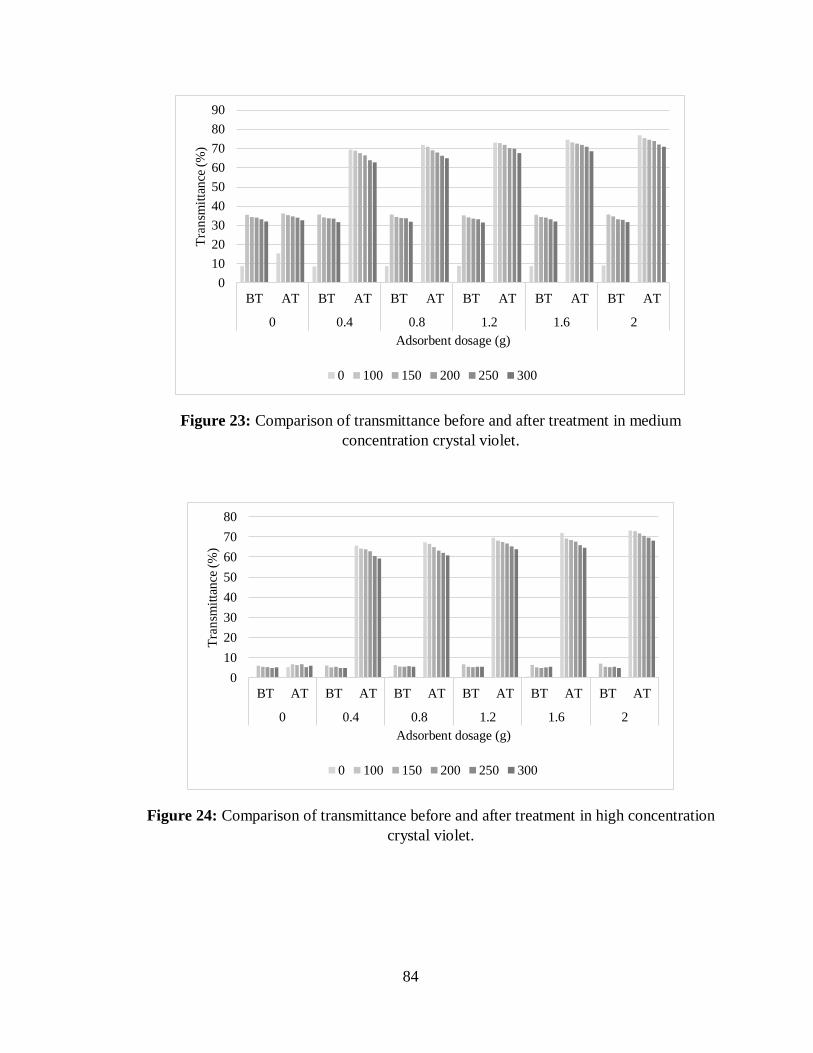
84
Figure 23: Comparison of transmittance before and after treatment in medium
concentration crystal violet.
Figure 24: Comparison of transmittance before and after treatment in high concentration
crystal violet.
0
10
20
30
40
50
60
70
80
90
BT AT BT AT BT AT BT AT BT AT BT AT
0 0.4 0.8 1.2 1.6 2
Tra
nsm
itta
nce
(%
)
Adsorbent dosage (g)
0 100 150 200 250 300
0
10
20
30
40
50
60
70
80
BT AT BT AT BT AT BT AT BT AT BT AT
0 0.4 0.8 1.2 1.6 2
Tra
nsm
itta
nce
(%
)
Adsorbent dosage (g)
0 100 150 200 250 300

85
Figure 25: Comparison of transmittance before and after treatment in low concentration
disperse yellow 3.
Figure 26: Comparison of transmittance before and after treatment in medium
concentration disperse yellow 3.
0
20
40
60
80
100
120
BT AT BT AT BT AT BT AT BT AT BT AT
0 0.2 0.4 0.6 0.8 1
Tra
nsm
itta
nce
(%
)
Adsorbent dosage (g)
0 100 150 200 250 300
0
20
40
60
80
100
120
BT AT BT AT BT AT BT AT BT AT BT AT
0 0.2 0.4 0.6 0.8 1
Tra
nsm
itta
nce
(%
)
Adsorbent dosage (g)
0 100 150 200 250 300

86
Figure 27: Comparison of transmittance before and after treatment in high concentration
disperse yellow 3.
Figure 28: Comparison of transmittance before and after treatment in low concentration
disperse yellow 3.
0
10
20
30
40
50
60
70
80
90
100
BT AT BT AT BT AT BT AT BT AT BT AT
0 0.2 0.4 0.6 0.8 1
Tra
nsm
itta
nce
(%
)
Adsorbent dosage (g)
0 100 150 200 250 300
0
10
20
30
40
50
60
70
80
90
BT AT BT AT BT AT BT AT BT AT BT AT
0 3.327-2.38 2.38-2.362 2.362-0.6 0.6-0.425 <0.425
Tra
nsm
itta
nce
(%
)
Adsorbent size (mm)
0 100 150 200 250 300

87
Figure 29: Comparison of transmittance before and after treatment in medium
concentration disperse yellow 3.
Figure 30: Comparison of transmittance before and after treatment in high concentration
disperse yellow 3.
0
10
20
30
40
50
60
70
80
BT AT BT AT BT AT BT AT BT AT BT AT
0 3.327-2.38 2.38-2.362 2.362-0.6 0.6-0.425 <0.425
Tra
nsm
itta
nce
(%
)
Adsorbent size (mm)
0 100 150 200 250 300
0
10
20
30
40
50
60
70
80
BT AT BT AT BT AT BT AT BT AT BT AT
0 3.327-2.38 2.38-2.362 2.362-0.6 0.6-0.425 <0.425
Tra
nsm
itta
nce
(%
)
Adsorbent size (mm)
0 100 150 200 250 300
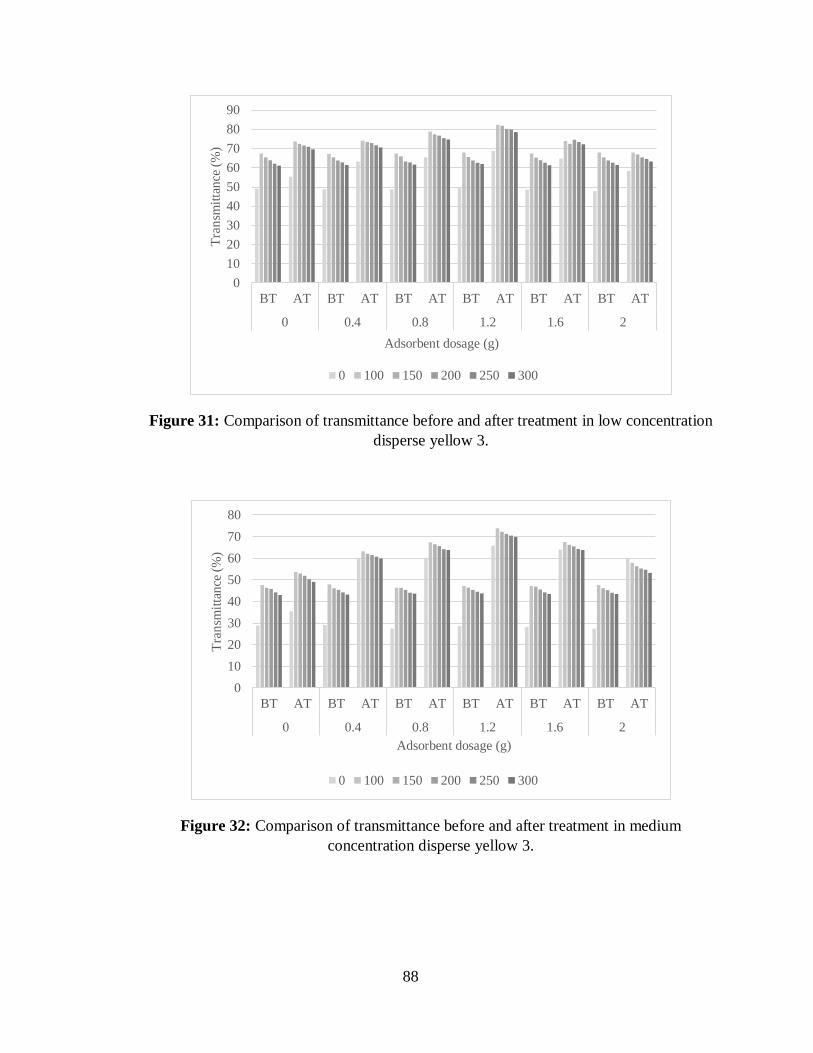
88
Figure 31: Comparison of transmittance before and after treatment in low concentration
disperse yellow 3.
Figure 32: Comparison of transmittance before and after treatment in medium
concentration disperse yellow 3.
0
10
20
30
40
50
60
70
80
90
BT AT BT AT BT AT BT AT BT AT BT AT
0 0.4 0.8 1.2 1.6 2
Tra
nsm
itta
nce
(%
)
Adsorbent dosage (g)
0 100 150 200 250 300
0
10
20
30
40
50
60
70
80
BT AT BT AT BT AT BT AT BT AT BT AT
0 0.4 0.8 1.2 1.6 2
Tra
nsm
itta
nce
(%
)
Adsorbent dosage (g)
0 100 150 200 250 300
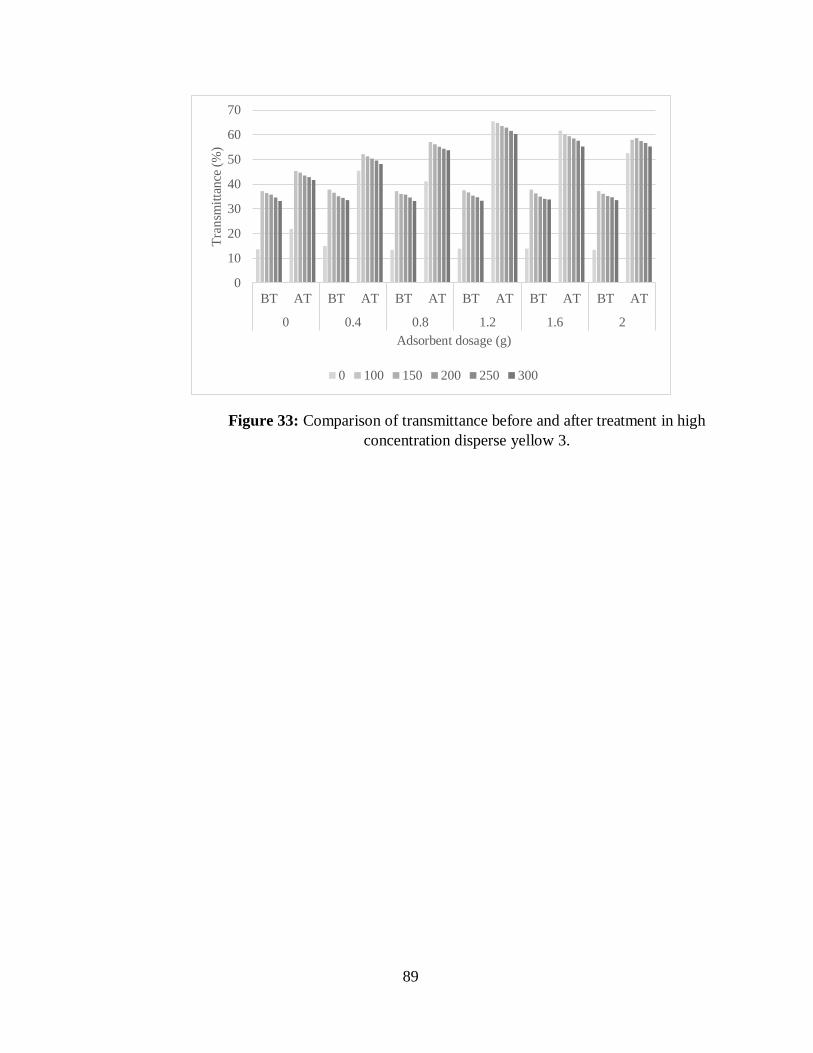
89
Figure 33: Comparison of transmittance before and after treatment in high
concentration disperse yellow 3.
0
10
20
30
40
50
60
70
BT AT BT AT BT AT BT AT BT AT BT AT
0 0.4 0.8 1.2 1.6 2
Tra
nsm
itta
nce
(%
)
Adsorbent dosage (g)
0 100 150 200 250 300

90
Figure 34: Langmuir isotherm model of acid black 48 adsorption on PAC.
Figure 35: Langmuir isotherm model of acid black 48 adsorption on peanut hull.
y = 0.1827x - 0.0481
R² = 0.9883
0
0.05
0.1
0.15
0.2
0.25
0 0.2 0.4 0.6 0.8 1 1.2 1.4 1.6
1/q
e
1/Ce
y = 7.3059x + 0.0216
R² = 0.8316
0
0.05
0.1
0.15
0.2
0.25
0.3
0.35
0.4
0 0.01 0.02 0.03 0.04 0.05
1/q
e
1/Ce
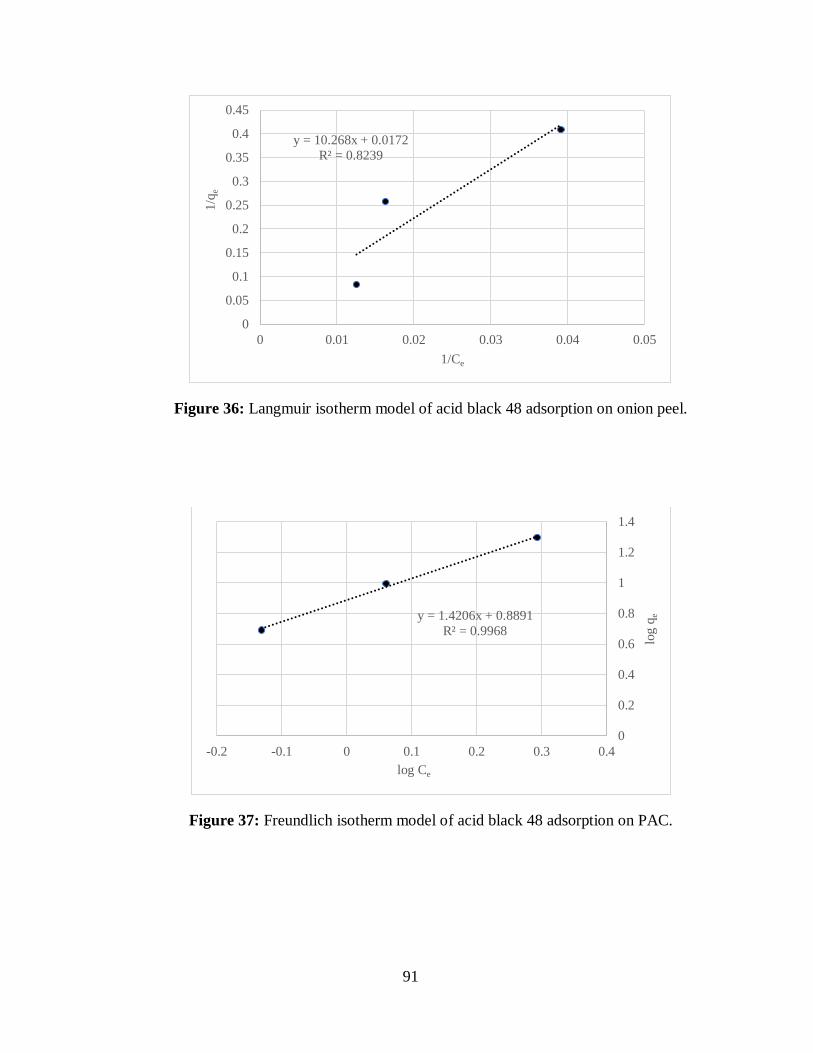
91
Figure 36: Langmuir isotherm model of acid black 48 adsorption on onion peel.
Figure 37: Freundlich isotherm model of acid black 48 adsorption on PAC.
y = 10.268x + 0.0172
R² = 0.8239
0
0.05
0.1
0.15
0.2
0.25
0.3
0.35
0.4
0.45
0 0.01 0.02 0.03 0.04 0.05
1/q
e
1/Ce
y = 1.4206x + 0.8891
R² = 0.9968
0
0.2
0.4
0.6
0.8
1
1.2
1.4
-0.2 -0.1 0 0.1 0.2 0.3 0.4
log
qe
log Ce

92
Figure 38: Freundlich isotherm model of acid black 48 adsorption on peanut hull.
Figure 39: Freundlich isotherm model of acid black 48 adsorption on onion peel.
y = 1.1086x - 1.0656
R² = 0.7372
0
0.2
0.4
0.6
0.8
1
1.2
0 0.5 1 1.5 2
log
qe
log Ce
y = 10.268x + 0.0172
R² = 0.8239
0
0.05
0.1
0.15
0.2
0.25
0.3
0.35
0.4
0.45
0 0.01 0.02 0.03 0.04 0.05
1/q
e
log Ce
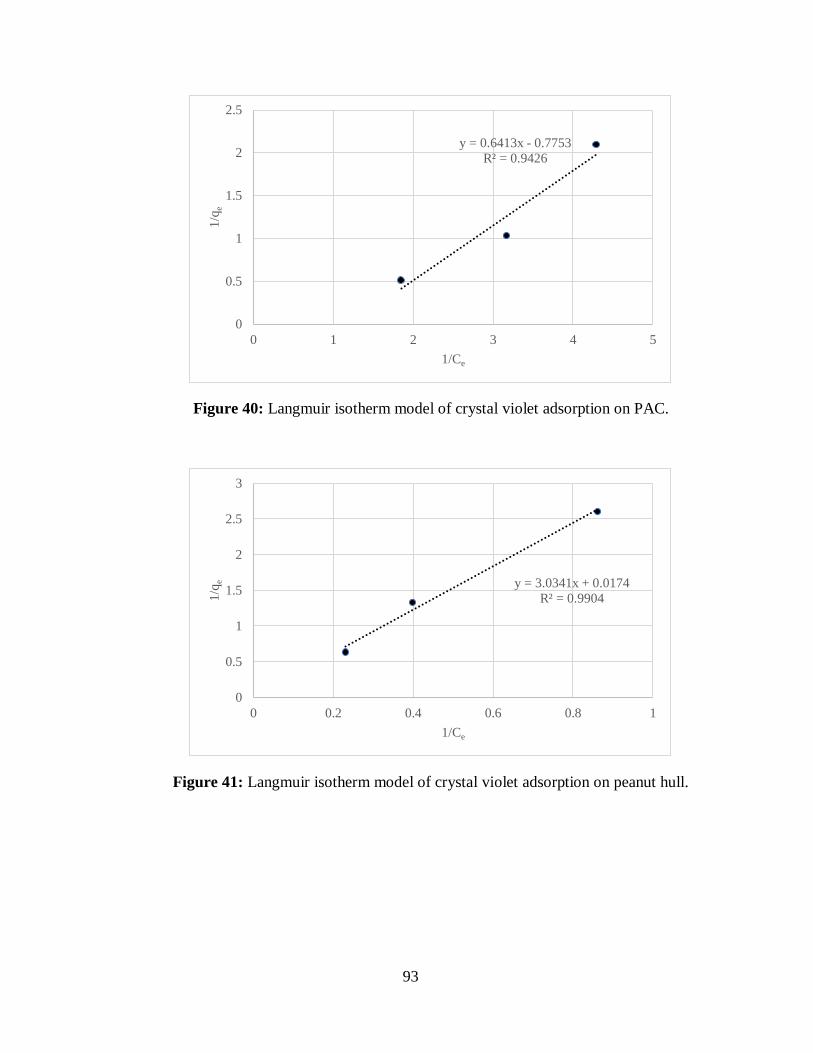
93
Figure 40: Langmuir isotherm model of crystal violet adsorption on PAC.
Figure 41: Langmuir isotherm model of crystal violet adsorption on peanut hull.
y = 0.6413x - 0.7753
R² = 0.9426
0
0.5
1
1.5
2
2.5
0 1 2 3 4 5
1/q
e
1/Ce
y = 3.0341x + 0.0174
R² = 0.9904
0
0.5
1
1.5
2
2.5
3
0 0.2 0.4 0.6 0.8 1
1/q
e
1/Ce

94
Figure 42: Langmuir isotherm model of crystal violet adsorption on onion peel.
Figure 43: Freundlich isotherm model of crystal violet adsorption on PAC.
y = 2.895x + 0.0172
R² = 0.9158
0
0.5
1
1.5
2
2.5
3
0 0.2 0.4 0.6 0.8 1
1/q
e
1/Ce
y = 1.6281x + 0.7445
R² = 0.9735
-0.4
-0.3
-0.2
-0.1
0
0.1
0.2
0.3
0.4
-0.7 -0.6 -0.5 -0.4 -0.3 -0.2 -0.1 0
log
qe
log Ce

95
Figure 44: Freundlich isotherm model of crystal violet adsorption on peanut hull.
Figure 45: Freundlich isotherm model of crystal violet adsorption on onion peel.
y = 1.0542x - 0.5021
R² = 0.9838
-0.5
-0.4
-0.3
-0.2
-0.1
0
0.1
0.2
0.3
0 0.1 0.2 0.3 0.4 0.5 0.6 0.7
log q
e
log Ce
y = 1.1275x - 0.4917R² = 0.8317
-0.5
-0.4
-0.3
-0.2
-0.1
0
0.1
0.2
0.3
0 0.1 0.2 0.3 0.4 0.5 0.6

96
Figure 46: Langmuir isotherm model of disperse yellow 3 adsorption on PAC.
Figure 47: Langmuir isotherm model of disperse yellow 3 adsorption on peanut hull.
y = 0.8396x + 0.0566
R² = 0.9883
0
0.05
0.1
0.15
0.2
0.25
0.3
0 0.05 0.1 0.15 0.2 0.25
1/q
e
1/Ce
y = 0.0311x + 0.0174
R² = 0.6846
0
0.005
0.01
0.015
0.02
0.025
0.03
0.035
0.04
0 0.1 0.2 0.3 0.4 0.5 0.6
1/q
e
1/Ce

97
Figure 48: Langmuir isotherm model of disperse yellow 3 adsorption on onion peel.
Figure 49: Freundlich isotherm model of disperse yellow 3 adsorption on PAC.
y = 0.0824x + 0.0078
R² = 0.9459
0
0.005
0.01
0.015
0.02
0.025
0.03
0.035
0.04
0.045
0 0.1 0.2 0.3 0.4 0.5
1/q
e
1/Ce
y = 0.6757x + 0.1712
R² = 0.9936
0
0.2
0.4
0.6
0.8
1
1.2
0 0.2 0.4 0.6 0.8 1 1.2 1.4
log
qe
log Ce

98
Figure 50: Freundlich isotherm model of disperse yellow 3 adsorption on peanut hull.
Figure 51: Freundlich isotherm model of disperse yellow 3 adsorption on onion peel.
y = 0.3739x + 1.3552
R² = 0.7175
0
0.2
0.4
0.6
0.8
1
1.2
1.4
1.6
1.8
2
0 0.2 0.4 0.6 0.8 1 1.2
log q
e
log Ce
y = 0.7623x + 1.0746
R² = 0.9341
0
0.2
0.4
0.6
0.8
1
1.2
1.4
1.6
1.8
2
0 0.2 0.4 0.6 0.8 1
log
qe
log Ce
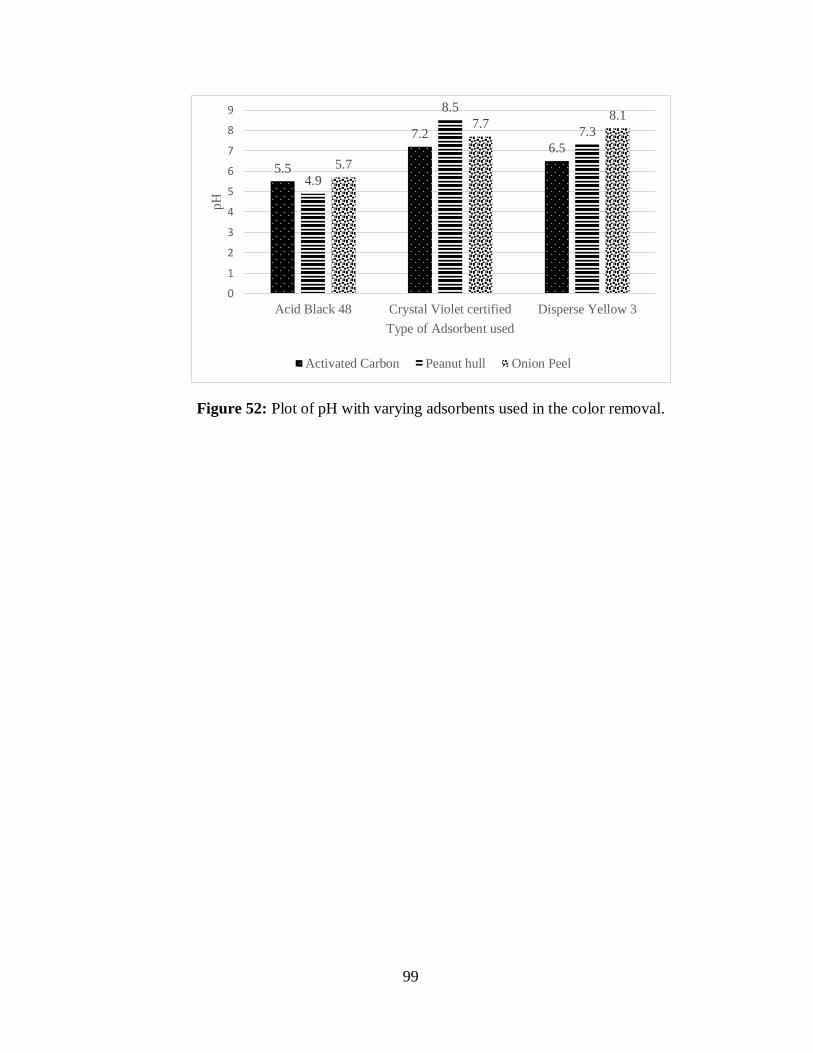
99
Figure 52: Plot of pH with varying adsorbents used in the color removal.
5.5
7.26.5
4.9
8.5
7.3
5.7
7.78.1
0
1
2
3
4
5
6
7
8
9
Acid Black 48 Crystal Violet certified Disperse Yellow 3
pH
Type of Adsorbent used
Activated Carbon Peanut hull Onion Peel