adsorption isotherm and thermodynamic studies of the
TRANSCRIPT

Jeje et. al.: Nigerian Journal of Materials Science and Engineering (NJMSE), Vol. 8:57 - 66 (2018)
57 Copyright Reserved © NJMSE, 2018
Adsorption Isotherm and Thermodynamic Studies of the Bleaching of Palm Oil using Modified Shells Powder
*Jeje Oludiya Ayorinde,
1Okoronkwo Afamefuna E. and
1Ajayi Olubode O.
.Department of Basic Sciences, Federal Polytechnic Auchi. Nigeria
1Department of Chemistry, Federal University of Technology, Akure. Nigeria
*Corresponding author: [email protected]
Abstract The use of locally sourced materials as adsorbents has been investigated as a result of high cost of bleaching clay
for the purpose of bleaching vegetable oils. Consequently, shells such as oyster and periwinkle as wastes were
collected and processed into powder forms (oyster shell powder; OSP and periwinkle shell powder; PSP) and
used for the removal of colour pigments and other minor impurities from palm oil. Adsorption studies were car-
ried out at different temperatures (308, 328, 348, 368, and 388 K) and adsorbent dosages (1.0, 1.5, 2.0, 2.5, 3.0 g).
The equilibrium adsorption data were tested with three isotherms: Langmuir, Freundlich, and Dubinin-
Radushkevich (D-R). Best fit was found to be Freundlich isotherm with its range of correlation coefficient R2 of
(0.955 to 0.966). The negative values of ΔG° showed that the adsorption process is feasible and spontaneous and
the negative values of ΔH° suggested exothermic nature of the adsorption process while the positive and low val-
ues of ΔS° indicated good affinity between the adsorbents and the adsorbate. The values of mean free energy (E
kJ/mol) obtained from Dubinin-Radushkevich which was less than 8 kJ/mol and the values of ΔH° which were
less than 20 kJ/mol suggested the adsorption process to be physisorption.
Keywords: Isotherms, Adsorption, Powder Oyster and Periwinkle shells, Palm oil.
1. INTRODUCTION Fats and oils are the raw materials used for production
of liquid oils, shortenings, margarines, and other
products. Humans have used fats and oils for food
and a variety of other applications from time imme-
morial as the oils can be isolated easily from their
source. These ingredients were found to improve on
the flavour, and add satiety to foods. The highest
energy source of the three basic foods (carbohydrates,
proteins, and fats) are found in fats and oils and many
contain fatty acids essential for human health that are
not manufactured by the human system. Fats and oils
occur naturally in a wide range of sources, with each
source providing a separate and distinctive material.
Hundreds of seeds and fruits bear oil, all animals pro-
duce fat, and marine sources also provide oils. All
edible fats and oils are water insoluble substances that
consist predominantly of glycerol esters of fatty acids,
or triacylglycerol, with some non saponifiable matter
present in trace quantities. The terms fats and oils are
used interchangeably, and the choice of terms is
usually based on the physical state of the material at
ambient temperature. Generally, fats appear solid at
ambient temperatures and oils appear liquid but it is
the chemical composition that defines the characteris-
tics of the individual fat or oil, which in turn deter-
mines the suitability of this ingredient in various
processes and applications.
The oil palm (Elaies guinensis) produces two dis-
tinct oils; palm oil and palm kernel oil. It grows in the
tropical regions of Asia, Africa, and America and
predominantly in Nigeria, Malaysia and Indonesia
(Jalani et al., 2000). Palm oil is derived from the me-
socarp of the palm fruit, species Elaeis guineesis. Pre-
sently, palm oil is the second largest vegetable oil in
the world production and the leader in the world ex-
ports (Pantzaris, 1995). In general, palm oil had red-
dish brown in colour due to its high content of carote-
noid; α and β carotene about 500-700 ppm. The chain
length of fatty acids present in the triglyceride has a
very narrow range from 12 to 20 carbon atoms (Basi-
ron 1996).
Bleaching is an adsorption process whereby clay is
used as adsorbent. It is used in vegetable oil refinery
industries to stabilize the oil by removing coloured
and colourless pigments that destabilize vegetable oils
(Didi et al., 2009; Usman et al., 2013).
Jeje et. al.: Nigerian Journal of Materials Science and Engineering (NJMSE), Vol. 8:57 - 66 (2018)
58 Copyright Reserved © NJMSE, 2018
Refining process of crude vegetable oils involves
several stages such as degumming, neutralization,
bleaching and deodorization (Al-Zahrani et al., 2000;
Berbesi, 2006, CIWC, 2008, Farihahusnah et al.,
2011; Adel Abd EL-Razek et al., 2017). Bleaching is
the most critical stage since it helps to enhance the
quality and improve the appearance, flavour, taste and
stability of the final oil products (Farihahusnah et al.,
2011; Rohani et al., 2006). The bleaching process is
carried out after degumming and neutralizing the veg-
etable oil under specific conditions (Diaz and Santos,
2001).
Activated bleaching clay is the most common ad-
sorbent used for oil purification. Other adsorbents that
have been tested for adsorption of colour pigments
and other impurities from oil included activated car-
bon and silica based products (Ejikeme et al., 2013).
Bentonite clays are used widely as binding agent in
foundry sand and iron ore palleterization. Acid acti-
vated clays have been used as catalysts in industrial
processes (Foletto et al., 2011; Didi et al., 2009,
EUBA, 2011). The application of activated clays in
paper industry have also been reported, production of
sulphur for environmental protection (Foletto et al.,
2011, EUBA, 2011). Activated carbon has the poten-
tials in the removal of colour pigments, odours, tastes
and contaminants in vegetable oils and in water puri-
fication processes (Lin and Zhao. 2016). However,
synthetic activated carbons usually prepared from
petroleum sources are expensive and non-
biodegradable and therefore pose serious threat of
environmental pollution after use (Abba et al.,2018).
Acid activation of clay has been investigated to ef-
fectively improve the adsorption property of clay (Fo-
letto et al., 2011). Clays in their activated forms are
extensively used in the fat and oil industries in the
bleaching of vegetable oils. Imported bleaching clays
make oil production expensive yet local materials can
be used if properly prepared (Mukasa-Tebandeke et
al., 2016).
Generally, the demand for edible oil is continuous-
ly increasing. Thus, there is need to initiate the devel-
opment of raw materials that can serve as alternative
to clays. The commercial bleaching earth used is for
the most part imported by the refining industries.
Therefore, it is important to investigate the use of
non-clay materials for their potential in making subs-
titutes for this purpose since the materials are cost
effective and readily available compare to the im-
ported and expensive clays
2. EXPERIMENTAL Materials and methods
Palm oil (PO) was bought from the production site in
Auchi, Edo state, Nigeria while oyster and periwinkle
shells were purchased in Warri, Delta state, Nigeria.
All chemicals used were of reagent grade.
Activation of Oyster shell powder (OSP)
OSP was prepared by washing the oyster shells with
hot water to remove surface dirts, sun dried, crushed
and ground to powder form using a roller mill ma-
chine and sieved using a sieve of 100 µ. The particle
size was activated with 5 M HCl. The reagent (100
mL) was added to 250 g of OSP, heated in a water
bath at 80 oC for 30 min. The mixture was washed
severally with distilled water in order to remove the
residual activating reagents and then filtered, dried in
an electric oven at 105 oC for two hours. The dried
sample was ground and sieved again to required par-
ticle size (100 µ) and stored in a clean dry container
for the purpose of bleaching the PO. The same proce-
dure was repeated for periwinkle shell powder (PSP).
Pretreatment of the Oils
Degumming
The oil was initially heated up to 60 oC in order to
melt the oil before treatment with a food grade phos-
phoric acid (approximately 85 %) about 0.1 % of oil
weight was thoroughly mixed and stirred for about 10
– 15 min to decompose the non-hydratable phospha-
tides present in the oil as well as to coagulate the
phosphatides making them insoluble and for easy ad-
sorption during bleaching.
Bleaching and Adsorption Studies
The bleaching of palm oil and adsorption process
The bleaching experiments were performed by batch
method on a thermostatically controlled hot plate with
stirrer. The degummed oil (50 g) was treated with 1.0
g of activated adsorbent separately at varied tempera-
tures of 308, 328, 348, 368, and 388 K for 30 min.
The hot mixture was then filtered using a filter paper.
During the measurement of the absorbance, the fil-
tered oil (2.5 g) was transferred into 25 mL standard
flask and diluted and make up to the mark with n-
hexane (w/v). The bleaching efficiency of the adsor-
bent was determined by measuring the colour of
bleached oil using a UV-Vis spectrophotometer at
wavelength of 450 nm. The same procedure was re-
peated for 1.5, 2.0, 2.5 and 3.0 g. of activated adsor-
bent.

Jeje et. al.: Nigerian Journal of Materials Science and Engineering (NJMSE), Vol. 8:57 - 66 (2018)
59 Copyright Reserved © NJMSE, 2018
The percentage bleaching efficiency of the oyster
shell powder was determined as:
% bleaching efficiency
=𝐴𝑜 − 𝐴𝑡𝐴𝑜
𝑥100……… . . (1)
where; A0 and At are the absorbances of the un-
bleached and bleached oil samples respectively.
Adsorbents Characterization: Analysis using
Scanning Electron Microscopy-Energy Dispersive
Spectroscopy (SEM-EDS)
Scanning Electron Microscopy coupled with Energy
Dispersive Spectroscopy (SEM-EDS) brand instru-
ment was used to observe the surface of cells or other
microscopic structures that is surface morphology of
the samples. The elemental compositions of untreated
and treated adsorbents were determined using energy
dispersive spectroscopy.
3. RESULTS AND DISCUSSION Elemental composition of adsorbents
Presented in Table 1 are the elemental compositions
of activated and unactivated oyster shell, periwinkle
shell. The reduction in the CaO content indicated that
the Ca2+
exchange cations were replaced by hydrogen
ions and polyvalent cations leached from the octahe-
dral sheet.
Table 1: Elemental Composition of Treated and
Untreated Adsorbents
OSP
PSP
Un-
treated
Treate
d
Un-
treated
Treate
d
MgO 0.80 0.69 1.00 0.52
Al2O3 2.87 0.95 0.79 0.40
SiO2 0.77 0.68 1.11 16.2
CaO 77.9 35.7 56.2 48.7
Na2O 0.70 0.62 1.10 0.78
Fe2O
3 13.8 4.30 9.29 BDL
The decrease in the octahedral sheet oxides; Al2O3,
MgO, Fe2O3 along with the increase in silica content
proved that the original structure was altered. The
behavior shown by these oxides contents with acid
modification is related to the progressive dissolution
of the adsorbents minerals. The destruction of the oc-
tahedral layer leached the cations into solution, while
the silica generated by the tetrahedral layer remains in
the solid phase due to its insolubility (Diaz et al.,
2003).
The increase in relative content of these cations
occurs as a result of depletion of the cations from the
interlayer and octahedral sheets of the samples struc-
tures. Pesguera et al., (1992) suggested that this free
silica generated as a result of initial destruction of the
tetrahedral layer was polymerized by the effect of
activating reagents and was deposited on the unde-
stroyed silicate layers protecting it from any further
attack by the reagents. The silica content showed in-
crease in periwinkle shell powder modified with 5 M
HCl.
The decrease in the amount of other oxides was
due to the dissolution of the adsorbents minerals as a
result of modification by acid. The lower value of
Fe2O3 and its absence in some of the adsorbent sam-
ples after modification proved them to be efficient for
the adsorption process (Egbuna et al., 2014), This
results in the creation of more pore size and volume
which enhanced the adsorption capacity of the acti-
vated adsorbent samples. The tetrahedral cations are
generally the most resistant to acid attack, followed
by the octahedral cations with exchangeable cations
the most vulnerable.
However, a considerable amount of these elements
is still found in the activated samples due to the pres-
ence of impurities which is due to feldspar that has
calcium, and sodium that is resistant to acid attack
and precipitated as a new amorphous phase from the
leachate.
Scanning electron microscopy (SEM) analysis Presented in Figures 1 and 2 are the scanning electron
micrographs of oyster shell and periwinkle shell re-
spectively. The SEM micrographs were studied for
the surface and morphological characteristics in the
adsorbent materials. In comparison with the unmodi-
fied OSP, the SEM images showed clear changes in
the micrographs of all the modified adsorbent mate-
rials in comparison to the unmodified adsorbents.
This change in the SEM micrographs revealed the
structural changes in the modified adsorbent mate-
rials.

Jeje et. al.: Nigerian Journal of Materials Science and Engineering (NJMSE), Vol. 8:57 - 66 (2018)
60 Copyright Reserved © NJMSE, 2018
(a) (b)
Figure 1: Scanning electron micrographs of untreated (a) and (b) HCl-treated Oyster shell powder.
(a) (b)
Figure 2: Scanning electron micrographs of (a) untreated and (b) HCl-treated Periwinkle shell powder.
The modified adsorbents looked more porous than
the unmodified. Figure 1b appeared smooth on the
surface with thread-like structure in nature when
compared with the untreated oyster shell powder
which indicates that impurities have been removed
from the adsorbent after activation. Figure 2a was
the untreated periwinkle shell powder which
looked like flakes and PSP treated with 5 M HCl
(Figure 2b) appeared like broken rod particles due
to creation of more pores and increase in pore vo-
lumes.
Effect of adsorbent dosage.
The adsorbents (oyster shell and periwinkle shell
powder) were varied from 1.0 to 3.0 g in 50 g of
palm oil. The relative bleachability is shown in fig
3 at 368 K optimum bleaching temperature. The
quantity of activated bleaching adsorbents re-
quired for the bleaching of vegetable oil depends
on the quality of the oil, activity of the adsorbents
and process conditions (Hoffmann, 1989).
It was observed that increasing the adsorbents
dosage increased the bleaching efficiency in OSP
treated with 5 M HCl. The results are in agree-
ments with those obtained by Kheok and Lim
(1982) who reported that an increase in clay do-
sage would be expected to lead to an increase in
colour reduction. This can be attributed to the in-
crease in the number of adsorption sites as a result
of the increase in surface area, pore sizes, and vo-
lumes of the adsorbents as dosage increases The
percentage bleaching efficiency decreased using 2
g of the adsorbent (PSP) with 5 M HCl while it
further increase when the quantity of adsorbent
was increase from 2.5 to 3.0 g. This might be as a
result of equality in the rate of adsorption and de-
sorption whereby most of the adsorbed materials
dissolve back into the oil due to high temperature
that convert the pigments to colourless form. It is
observed that the activated OSP and PSP perform
better than the unmodified ones.
Effect of Bleaching Temperature
The bleaching efficiency was determined by vary-
ing the contact temperature in the range 308 to 388
K by keeping the other parameters constant. The

Jeje et. al.: Nigerian Journal of Materials Science and Engineering (NJMSE), Vol. 8:57 - 66 (2018)
61 Copyright Reserved © NJMSE, 2018
adsorption equilibrium was attained at 308 K us-
ing OSP treated with 5 M HCl as presented in
Figure 4 using 3 g optimum adsorbent dosage.
The increase observed at 348 to 368 K was
due to the rate of adsorption equal the rate of de-
sorption whereby some of the adsorbed pigments
dissolved back into the oil and converted into co-
lourless forms after equilibrium has been
achieved. This was attri-
Figure 3. Bleachability of OSP and PSP with
palm oil showing the effect of dosage
uted to heat bleaching effect at high temperature
(Madya et al., 2006). However, percentage
bleaching efficiency increase in PSP treated 5 M
HCl up to 368 K this caused the amount of colour
pigments adsorbed to increase and consequently
the residual relative amount in palm oil phase de-
creased which seems to support the assertion that
higher temperature create more adsorption sites in
the adsorbent phase (Sabah et al., 2005).
Figure 4: Bleachability of OSP and PSP with palm oil
showing the effect of temperature
The graph shows that activated adsorbents dis-
played better efficiency in comparison with the
unmodified OSP and PSP in the bleaching of palm
oil.
Adsorption Isotherms: Langmuir isotherm
model
The Langmuir isotherm has been employed to ex-
plain the adsorption of oil pigment and other mi-
nor oil solutes during oil processing. Though, de-
veloped by Irving Langmuir in 1916 to describe
gas adsorption. The model assumes that the adsor-
bate is bound to a fixed number of energetically
equal, specific sites, each adsorbing one molecule
with no interaction occurring between molecules
on adjacent sites (Proctor et al., 2005). The Lang-
muir isotherm has been applied to pigment adsorp-
tion from vegetable oil in the form written accord-
ing to Equation 2:
𝑥𝑒𝑥 𝑚
=1
𝑎𝑏+
1
𝑎𝑥𝑒 (2)
where x = amount of solute adsorbed in PO, Xe =
amount of unadsorbed solute in PO, m= grams of
adsorbent used, „a‟ is the surface area of the ad-
sorbent (m2/100g), and b is a constant of the inten-
sity of the adsorption. According to general belief,
adsorption of the colour bodies from a solution or
dispersion is predominantly a surface phenomenon
and is dependent upon the specific affinity be-
tween adsorbent and solute. The solute may be
either dissolved or colloidally dispersed. The es-
sential characteristics of the Langmuir isotherm
can also be expressed in terms of a dimensionless
constant of separation factor or equilibrium para-
meter, RL which is defined by Equation 3
𝑅𝐿 =1
1 + 𝑏𝐶𝑜…………………… . (3)
where, b (L/mg) is the Langmuir constant, Co is
the highest initial concentration (mg/l). The RL
values indicate the shape of the isotherm. RL val-
ues between 0 and 1 indicate favourable adsorp-
tion; while RL ≥ 1 indicate unfavourable and RL
equal 0 is irreversible adsorption.
Freundlich isotherm model
Freundlich in 1926 developed an empirical equa-
tion that correlates the capacity of the adsorbent
with the residual solute concentration. 𝑥
𝑚= 𝑘𝑐𝑛 ………………………… . (4)
where x = amount of solute adsorbed (mg), m =
amount of adsorbent (g), c = amount of residual
solute (concentration) (mg|L) at equilibrium. The
0
20
40
60
80
100
120
1 1.5 2 2.5 3
% B
kea
chin
g E
ffic
ien
cy
Dosage (g)
OSP PSP UNOSP UNPSP
0
20
40
60
80
100
120
3 0 8 3 2 8 3 4 8 3 6 8 3 8 8
% B
kea
ch
ing
Eff
icie
ncy
Temp. (K)
OSP PSP UNOSP UNPSP
Jeje et. al.: Nigerian Journal of Materials Science and Engineering (NJMSE), Vol. 8:57 - 66 (2018)
62 Copyright Reserved © NJMSE, 2018
Freundlich model is used to estimate the adsorp-
tion affinity of the sorbents towards the adsorbate.
K is a constant indicating adsorption capacity, and
n is a constant of the energy of adsorption. Empir-
ical data are evaluated for Freundlich behavior by
using the equation in its logarithmic form, as equa-
tion of a straight line (Achife et al., 1989).
𝑙𝑜𝑔𝑥
𝑚= log𝑘 + 𝑛 log𝑥𝑒 ……………… (5)
Dubinin- Radushkevich isotherm model
Dubinin – Radushkevich isotherm is generally
applied to express the adsorption mechanism with
a Gaussian energy distribution onto a heterogene-
ous surface (Dabrowski, 2001; Gunay et al.,
2007). The model has often successfully fitted
high solute activities and the intermediate range of
concentrations data well.
𝑞𝑒 = 𝑞𝑠 exp −𝐾𝑎𝑑 𝜀2 ………………… (6)
ln 𝑞𝑒 = ln 𝑞𝑠 − (𝐾𝑎𝑑 . 𝜀2)………………… . (7)
qe =amount of adsorbate in the adsorbent at equili-
brium(mg/g); qs = theoretical isotherm saturation
capacity(mg/g); Kad = Dubinin-Radushkevich iso-
therm constant (mol2/kJ
2); ɛ= Dubinin – Radush-
kevich isotherm constant.
The approach was usually applied to distin-
guish the physical and chemical adsorption of
metal ions with its mean free energy (E kJ/mol)
for removing a molecule from its location in the
sorption space to the infinity, which can be com-
puted by the relationship (Dubinin, 1960 and Hob-
son, 1969).
𝐸 = 1
2𝐵𝐷𝑅 ………………………… (8)
BDR is the isotherm constant
𝜀 = 𝑅𝑇 ln 1 +1
𝐶𝑒 ………………………
where R=8.314 J/mol.K; T=absolute temperature;
Ce = adsorbate equilibrium concentration (mg/L).
One of the unique features of the Dubinin – Ra-
dushkevich ( D-R) isotherm model lies on the fact
that it is temperature – dependent, which when
adsorption data at different temperatures are plot-
ted as a function of logarithm of amount adsorbed
lnqe against ɛ2 the square of potential energy. All
suitable data will lie on the same curve, named as
the characteristic curve (Foo et al., 2010). The
constant such as qs and Kad are determined from
the appropriate plot using Equation 7
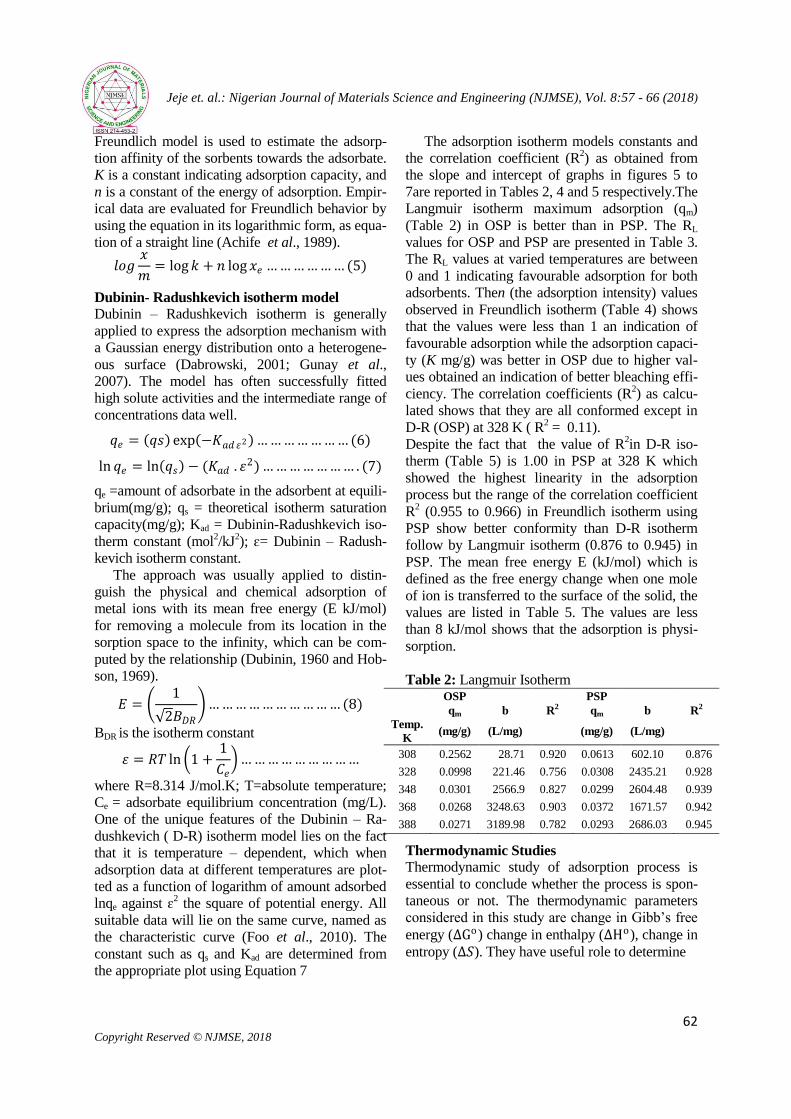
The adsorption isotherm models constants and
the correlation coefficient (R2) as obtained from
the slope and intercept of graphs in figures 5 to
7are reported in Tables 2, 4 and 5 respectively.The
Langmuir isotherm maximum adsorption (qm)
(Table 2) in OSP is better than in PSP. The RL
values for OSP and PSP are presented in Table 3.
The RL values at varied temperatures are between
0 and 1 indicating favourable adsorption for both
adsorbents. Then (the adsorption intensity) values
observed in Freundlich isotherm (Table 4) shows
that the values were less than 1 an indication of
favourable adsorption while the adsorption capaci-
ty (K mg/g) was better in OSP due to higher val-
ues obtained an indication of better bleaching effi-
ciency. The correlation coefficients (R2) as calcu-
lated shows that they are all conformed except in
D-R (OSP) at 328 K ( R2 = 0.11).
Despite the fact that the value of R2in D-R iso-
therm (Table 5) is 1.00 in PSP at 328 K which
showed the highest linearity in the adsorption
process but the range of the correlation coefficient
R2 (0.955 to 0.966) in Freundlich isotherm using
PSP show better conformity than D-R isotherm
follow by Langmuir isotherm (0.876 to 0.945) in
PSP. The mean free energy E (kJ/mol) which is
defined as the free energy change when one mole
of ion is transferred to the surface of the solid, the
values are listed in Table 5. The values are less
than 8 kJ/mol shows that the adsorption is physi-
sorption.
Table 2: Langmuir Isotherm OSP
PSP
qm b R2 qm b R2
Temp.
K (mg/g) (L/mg)
(mg/g) (L/mg)
308 0.2562 28.71 0.920 0.0613 602.10 0.876
328 0.0998 221.46 0.756 0.0308 2435.21 0.928
348 0.0301 2566.9 0.827 0.0299 2604.48 0.939
368 0.0268 3248.63 0.903 0.0372 1671.57 0.942
388 0.0271 3189.98 0.782 0.0293 2686.03 0.945
Thermodynamic Studies Thermodynamic study of adsorption process is
essential to conclude whether the process is spon-
taneous or not. The thermodynamic parameters
considered in this study are change in Gibb‟s free
energy (∆Go) change in enthalpy (∆Ho), change in
entropy (∆𝑆). They have useful role to determine

Jeje et. al.: Nigerian Journal of Materials Science and Engineering (NJMSE), Vol. 8:57 - 66 (2018)
63 Copyright Reserved © NJMSE, 2018
(a)
Figure 5. Langmuir isotherms of OSP treated with (a) HCl and PSP treated with (b) HCl
(a) (b)
Figure 6: Freundlich isotherms of OSP treated with (a) HCl and PSP treated with (b) HCl
(a) (b)
Figure 7: D-R isotherms of OSP treated with (a) HCl and PSP treated with (b) HCl
spontaneity and heat change of the adsorption
process. The modified Van‟t Hoff equation used to
determine the value of the equilibrium constant
with temperature changes is given in Equation 10.
-10
0
10
20
30
40
50
60
70
80
90
100
- 3 - 2 - 1 0 1
Xe/X
/m
Xe
308 K 328 K 348 K 368 K 388 K
-10
0
10
20
30
40
50
60
70
80
90
- 3 - 2 . 5 - 2 - 1 . 5 - 1 - 0 . 5 0 0 . 5
Xe/X
/m
Xe
308 K 328 K 348 K 368 K 388 K
0
0.1
0.2
0.3
0.4
0.5
0.6
0.3 0.32 0.34 0.36 0.38 0.4
Lo
g X
/m
Log Xe
308 K 328 K 348 K 368 K 388 K
0
0.1
0.2
0.3
0.4
0.5
0.6
0 . 3 6 0 . 3 6 5 0 . 3 7 0 . 3 7 5 0 . 3 8
Lo
g X
/m
Log Xe
308 K 328 K 348 K 368 K 388 K
0
0.2
0.4
0.6
0.8
1
1.2
1.4
0 5 0 0 0 0 0 0 1 0 0 0 0 0 0 0 1 5 0 0 0 0 0 0
lnq
e
ɛ2
308 K 328 K 348 K 368 K 388 K
0
0.2
0.4
0.6
0.8
1
1.2
1.4
6 0 0 0 0 0 0 8 0 0 0 0 0 0 1 0 0 0 0 0 0 0 1 2 0 0 0 0 0 0
lnq
e
ε2
308 K 328 K 348 K 368 K 388 K

Jeje et. al.: Nigerian Journal of Materials Science and Engineering (NJMSE), Vol. 8:57 - 66 (2018)
64 Copyright Reserved © NJMSE, 2018
ln𝑋𝑒 =∆𝑆𝑜
𝑅=∆𝐻𝑜
𝑅
1
𝑇 ……………… (10)
The values of ∆Ho and ∆So can be obtained from
the slope and intercept of the graph by plotting
lnK against 1
T.
Adsorption Isotherm Constants
Table 3: The Rl Values for Pigments Adsorption from
Palm Oil Onto Activated OSP and PSP
Temp
(K) OSP PSP
308 0.01017 0.00049
328 0.00133 0.000121
348 0.000115 1.13E-04
368 9.08E-05 0.000176
388 9.25E-05 0.00011
Table 4: Freundlich Isotherm
OSP PSP
Temp.
K n
k
(mg/g) R
2 n
k
(mg/g) R
2
308 -5.96 2.732 0.927 -30.22 0.944 0.956
328 -18.59 1.172 0.862 -59.59 0.739 0.955
348 -35.56 0.891 0.964 -61.69 0.731 0.967
368 -13.44 1.384 0.559 -49.02 0.788 0.957
388 -61.98 0.729 0.983 -62.37 0.730 0.966
The Gibb‟s free energy can be calculated from the
relationship presented in Equation 11
ΔG° = ΔH° = -TΔS° ……………………(11)
The calculated values of the thermodynamic parame-
ters are listed in the table 6. The negative values of
enthalpy change, ∆Ho implies the exothermic nature
of the adsorption process and also shows that the ad-
sorption is physisorption since the values are less than
20 kJ/mol. The positive values of ∆So shows increase
in the randomness of the adsorption process an indi-
cation of favourable adsorption whereby the transition
state is highly disordered compared to the ground
state, the translational, rotational and vibrational de-
grees of freedom are liberated on going from the
ground state to the transition state and the reaction
proceeds fast and reach completion. The negative
values of ∆GO confirmed the feasibility of the process
and the spontaneous nature of the adsorption process.
Activation Energy Determination The sticking probability, S
* of an adsorbate on adsor-
bent can be expressed by a modified Arrhenius-type
equation related to surface coverage (Ѳ). The S* is a
function of the adsorbate/adsorbent system is the
measure of the ability of an adsorbate to remain on
the adsorbent indefinitely, and it is expressed as:
𝑆∗ = 1 − 𝜃 exp− 𝐸𝑎𝑅𝑇
…………… . . (12)
log 1 − 𝜃 = log S∗ + 𝐸𝑎𝑅𝑇
……………… (13)
where; Ѳ is surface coverage, Ea is activation energy.
𝜃 = 1 −𝐶𝑒𝐶𝑜 ………………………… (14)
where Co and Ce are the initial and equilibrium con-
centrations respectively.
The values of Ea and S* can be obtained from the
slope and intercept of the graph of log (1- θ) against 1
T.
The values obtained for activation energy are
listed in Table 6. The values are low and below 20
kJ/mol.which shows that the adsorption process is
physisorption in nature and S* which is the probabili-
ty of the adsorbate to stick onto the surface of the ad-
sorbent is below 1 an indication of high probability of
the adsorbate to stick to the surface of the adsorbent
(Horsfall and Spiff, 2005).
Table 5: Dubinin – Radushkevich
OSP
PSP Temp
(K)
Kad
mol2/kJ2
qs
mg/g R2
E
kJ/mol
Kad
mol2/kJ2
qs
mg/g R2
E
kJ/mol

Jeje et. al.: Nigerian Journal of Materials Science and Engineering (NJMSE), Vol. 8:57 - 66 (2018)
65 Copyright Reserved © NJMSE, 2018
308 2.00E-07 3.22 0.961 1.58 2.00E-07 2.31 0.972 1.58
328 4.00E-07 2.19 0.11 1.12 3.00E-07 1.99 1.000 1.29
348 3.00E-07 2.05 0.979 1.29 3.00E-07 2.24 0.883 1.29
368 5.00E-08 1.91 0.217 3.16 3.00E-07 2.09 0.925 1.29
388 3.00E-08 3.19 0.129 4.08 2.00E-07 2.42 0.961 1.58
Table 6: Thermodynamics Parameters OSP PSP
Temp
(OC)
ΔH
(kJ/mol)
ΔS
(kJ/mol)
ΔG
(kJ/mol)
Ea
(kJ/mol) S*
ΔH
(kJ/mol)
ΔS
(kJ/mol)
ΔG
(kJ/mol)
Ea
kJ/mol S*
308 -14.16 0.0431 -25.92 0.929 -1.198 -0.413 0.0083 -2.677 0.179 -0.987
328 -0.59 0.0088 -2.991 0.256 -0.869 -0.215 0.0078 -2.333 0.093 -1.107
348 -0.19 0.0077 -2.292 0.834 -1.042 -0.21 0.0077 -2.322 0.091 -1.105
368 -0.18 0.0077 -2.289 0.357 -0.649 -0.262 0.0079 -2.425 0.114 -1.071
388 -0.16 0.0076 -2.254 0.107 -1.072 -0.209 0.0077 -2.313 0.090 -1.118
4. CONCLUSION The results obtained showed that the efficiency of
HCl activated OSP, PSP, for the removal of colour
pigments and other minor impurities from palm oil is
feasible. The findings suggest that the adsorbents
(PSP) treated with 5 M HCl displayed higher percen-
tage bleaching efficiency (99.68) at 368 K while the
experimental data conform to Freundlich isotherm
follow by Langmuir isotherm in PSP. The thermo-
dynamic studies indicate the process to be spontane-
ous and feasible as a result of the negative values of
change in Gibb‟s free energy (∆Go)
REFERENCES Achife, J. and Ibemesi, J (1989). “Applicability of Freun-
dlich and Langmuir Adsorption Isotherms in Bleaching
of Rubber and Melon Seed Oils”. Journal of the Ameri-
can Oil Chemists‟ Society, 66:247-252.
Abba, C; Abdoul, W; Gaston, Z; Abdoul, N.R; Devine, B.
N (2018). Bleaching of Neutral Cotton Seed Oil using
Organic Activated Carbon in a Batch System: Kinetics
and Adsorption Isotherms. Processes. 6:22
Adel Abd EL-Razek Mohdaly, Khaled Abd EL-Hameed
Seliem; Abd EL-Moneam Maher Abu EL-Hassan,
Awad Abdel Tawab Mahmoud (2017). Effect of Refin-
ing Process on the Quality Characteristics of Soybean
and Cottonseed Oils. Int. J. Curr. Microbiol. App. Sci
6(1):207-222
Al-zahrani, A.A., Al-shahrani S.S., Al-Tawil Y.A, (2000),
“Study on the activation of Soudi bentonite, part II:
Characterization of the produced active clay and its test
as an adsorption agent”, Engineering Science. 13(2):
193-203.
Basim, A (2011). “Rheology of Sodium and Calcium Ben-
tonite water Dispersions: effect of electrolytes and ag-
ing time”. International Journal of Mineral Processing,
98:208-213
Basiron, Y (1996). Palm oil, In: HM YH, editor. Bailey‟s
industrial oil and fats products. Vol 2. New York: John
Wiley and Sons. 271 -375.
Berbesi R (2006), “Achieving Optimal Bleaching Perfor-
mance”, Oil Mill Gazetteer, 112, 2-6.
Crown Iron Works Company (CIWC), (2008), Oils and
refining. A CPM Company. 35-47.
Dabrowski, A (2001). “Adsorption- from theory to prac-
tice”. Adv. Colloid Interface Sci. 93:135-224.
Diaz, M. I, Suariz, M. B, Prates, S, Marhnpozas, J.M
(2003). “Characterization and acid activation of Portu-
guese Special Clays”. Clay minerals. 38:537-549
Diaz F.V. and de Souza S.P., (2001) “Studies on the Acid
Activation of Brazilian Smectitic Clays”. Quim Nova,
24(3):345-353
Didi M.A, Makhoukhi B., Azzouz A., and Villemin D
(2009), “Colza Oil Bleaching Through Optimized Acid
Activation of Bentonite: A comparative study”. Applied
Clay Science, 42:336–344.
Dubinin, M.M (1960). “The Potential Theory of Adsorp-
tion of Gases and Vapour for Adsorbents with Energet-
ically Non-uniform Surface”, Chem. Rev.60:235-266.
Egbuna, S.O, Ugadu, E, Ujam, A (2014). “Effects of Ther-
mal Activation on The Physicochemical Properties of
Natural White Clay as a Local Adsorbent”. International
Journal of Enginnering Science Invention. 3:37-48.
Ejikeme E.M., Egbuna S.O and Ejikeme P.C.N (2013),
“Optimal bleaching performance of activated Ngwu-
langwu clay, International Journal of Engineering and
Innovative Technology, 3(5):13-19.
European Bentonite Association (EUBA), (2011), Ben-
tonite, Industrial Minerals Association-Europe
Farihahusnah H., Mohamed K.A., and Wan Mohd Ashri
Wan Daud (2011). “Textural characteristics, surface
chemistry and activation of bleaching earth”: A review,
Chemical Engineering Journal, 170:90–106.
Foletto, E.L., Colazzo, G.C., Volzone, C. and Porto, L. M
(2011), “Sunflower oil bleaching by adsorption onto ac-
id-activated bentonite”. Brazilian Journal of Chemical
Engineering, 28(01):169 – 174
Foo, K.Y, Hameed, B.H (2010). “Insight into the modeling
of adsorption Isotherm systems”. Review Chemical En-
gineering Journal, 156:2-10.
Gunay, A., Arslankaya, E.,Tosun, I (2007). “Lead removal
from aqueous solution by natural and pretreated clinop-
tilolite adsorption equilibrium and kinectics”. J. Hazard
Mater.146:362-371
Hassan, M.S., and Abdel-Khalek, N.A., (1998), “Beneficia-
tion and application of an Egyptian Bentonite”, Applied
Clay Science, 13:99-115

Jeje et. al.: Nigerian Journal of Materials Science and Engineering (NJMSE), Vol. 8:57 - 66 (2018)
66 Copyright Reserved © NJMSE, 2018
Hobson, J.P (1969). “Physical adsorption isotherms extend-
ing from ultra-high vacuum to vapour pressure”. J.
Phys.Chem. 73:2720-2727.
Hoffmann G (1989). “The chemistry and technology of
edible oils and fats and their high fat Products”. Aca-
demic Press Inc. London 164-167
Horsfall,M.J, Ayebaemi, I. S (2005). “Equilibrium Sorption
of Al3+
, Co2+
and Ag+ in Aqueous Solutions by Fluted
Pumpkin” (Telfairia Occidentalis HOOK f) Waste bio-
mass. Acta Chim. Slov. 52:174-181
Jalani, B.S, Rajanaidu, N (2000). Lipid Technol; 12 5 -8
Kheok S.C, Lim, E.E (1982). “Mechanism of palm oil
bleaching by montmorillonite clay activated at various
concentrations”. J. Amer. Oil. Chem. Soc. 59:129-131
Lin, J., Zhao, G (2016). Preparation and Characterization of
High Surface Area Activated Carbon Fibers from Lig-
nin. Polymers 8:369
Lugolobi, F (2016). bleaching Edible Oils Using Clay from
Kangole, Morofo District, North Eastern Uganda. J.
Anal. Bioanal. Tech. 7:320
Madya D. R, Noor Azian Morad, Madya Mustafa Kamal,
ABD Aziz, Rehani Binti Mohd. Zin (2006).”Process
design in degumming and bleaching of palm oil”. Cen-
tre for Lipids Engineering and Applied Research Uni-
versity Technology. Malaysia.
Makhoukhi B., Didi M.A., Villemin D., and Azzouz A.,
(2009), “Acid activation of Bentonite for use as a vegeta-
ble oil bleaching agent”. Grasas y Aceites, 60(4):343-349.
Nadezda, S., Mihovil, L., Jelena, L., Jelena, P., Miljana, M.,
Biljana, B., Radosavljevic-Mihajlovic (2011). “Characte-
rization of bentonite clay from “Greda” deposit”.
Processing and Application of Ceramics, 5(2):97-101
Pantzaris, T.P (1995). Pocket book of palm oil uses. Palm
oil Research Institute of Malaysia. Kaula Lumphur.
Malaysia 158.
Pesquera, C, Gonzalez, F, Benito, J, Blanco, C, Mendioroz,
S, Pajares, J (1992). “Passivation of a montmorillonite
by the silica created in acid activation” .Journal of Ma-
terial Chemistry. 2:907-911
Proctor, A. Brooks D.D (2005). Adsorptive separation of
oils. Bailey‟s Industrial oil and Fat products. John Wi-
ley and Sons 6th Ed.
Rohani, B.M.Z; Madia, N.A.M; Madya, M.K.A (2006).
Process design in degumming and bleaching of Palm
Oil. University Technologi Malaysia
Sabah, E., Celik, M.S (2005). “Sepiolite and effective bleach-
ing adsorbent for the physical refining of degummed rape-
seed oil”. J. Am. Oil. Chem. Soc. 82: 911-916.
Usman, M. A., Oribayo, O., and Adebayo, A. A (2013),
“Bleaching of Palm Oil by Activated Local Bentonite
and Kaolin Clay from Afashio, Edo-Nigeria”, Chemical
and Process Engineering Research, 10:1-12.