adsorption of cesium on clay minerals - usgs · pdf fileadsorption of cesium on clay minerals...
TRANSCRIPT
Adsorption of Cesium on Clay Minerals
GEOLOGICAL SURVEY BULLETIN 1140-A


Adsorption of Cesium on Clay MineralsBy J. S. WAHLBERG and M. J. FISHMAN
ION EXCHANGE ON MINERAL MATERIALS
GEOLOGICAL SURVEY BULLETIN 1140-A
UNITED STATES GOVERNMENT PRINTING OFFICE, WASHINGTON : 1962

UNITED STATES DEPARTMENT OF THE INTERIOR
STEWART L. UDALL, Secretary
GEOLOGICAL SURVEY
Thomas B. Nolan, Director
For sale by the Superintendent of Documents, U.S. Government Printing Office Washington 25, D.C.
CONTENTS
PageAbstract________________________________________________________ AlIntroduction._____________________________________________________ 1
Scope of investigation..________________________________________ 2Experimental work._______________________________________________ 3
Description of clays__________________________________________ 3Experimental techniques.______________________________________ 4Discussion of results.__________________________________________ 5
Conclusions._ ___-___-_-_-___________________________--______-----_ 10Future work._____________________________________________________ 11References cited.__________________________________________________ 30
ILLUSTRATIONS
FIGURE 1-18. Adsorption of cesium on 1. Sodium montmorillonite No. 11__________________- A122. Sodium montmorillonite No. 21___________________ 123. Sodium kaolinite No. 4_________________________. 134. Sodium halloysite No. 12________________________ 135. Sodium illite No. 35__________._.____._.____- 146. Potassium montmorillonite No. ll____________--_- 147. Potassium montmorillonite No. 21_____________-_- 158. Potassium kaolinite No. 4______________________ 159. Potassium halloysite No. 12____________________._ 16
10. Potassium illite No. 35---_____--.___________-_ 1611. Magnesium montmorillonite No. 11______________- 1712. Magnesium montmorillonite No. 21 _______________ 1713. Magnesium kaolinite No. 4______________________... 1814. Magnesium halloysite No. 12_____________________ 1815. Calcium montmorillonite No. ll______________-__- 1916. Calcium montmorillonite No. 21__________________ 1917. Calcium kaolinite No. 4__ _______________________ 2018. Calcium halloysite No. 12___________________-_-_. 20
19-36. Limiting value of distribution coefficient 19. SodiummontmorilloniteNo.il____________-_--- 2120. Sodium montmorillonite No. 21_________________ 2121. Sodium kaolinite No. 4________________________._ 2222. Sodium halloysite No. 12-_________________--_--_ 2223. Sodium illite No. 35_-__-__________________--_-_- 2324. Potassium montmorillonite No. 11_______________- 2325. Potassium montmorillonite No. 21_.______-_-__-__ 2426. Potassium kaolinite No. 4______________________ 24
ni

IV CONTENTS
FIGURE 19-36. Limiting value of distribution coefficient Continued page27. Potassium halloysite No. 12______________________ 2528. Potassium illite No. 35_-________________________ 2529. Magnesium montmorillonite No. ll_-_____________ 2630. Magnesium montmorillonite No. 21 _______________ 2631. Magnesium kaolinite No. 4_ _____________________ 2732. Magnesium halloysite No. 12___________________ 2733. Calcium montmorillonite No. 11____________._____ 2834. Calcium montmorillonite No. 21__________-_____._ 2835. Calcium kaolinite No. 4_______________________ 2936. Calcium halloysite No. 12_______.._-_-_________ 29

ION EXCHANGE ON MINERAL MATERIALS
ADSORPTION OF CESIUM ON CLAY MINERALS
By J. S. WAHLBERG and M. J. FISHMAN
ABSTRACT
A study was made of the exchange adsorption of cesium on the clay minerals kaolinite, halloysite, montmorillonite, and "illite." The amount of cesium adsorbed by clay minerals was measured in equilibrium solutions in which the cesium concentration ranged from 10"1 to 10~10 N, and either sodium, potassium, calcium, or magnesium ions were present in various concentrations. The results obtained in these experiments were used to calculate the distribution coefficients for the adsorption of cesium on clay minerals.
At very low cesium concentrations and for a constant concentration of the cation competing with cesium for adsorption sites, the distribution coefficients were found to be independent of the cesium concentration. The logarithm of this limiting value of the distribution coefficient was found to be a linear function of the logarithm of concentration of the competing cation. At higher cesium concentrations, the distribution coefficients were found to depend on both the cesium concentration and the nature and concentration of the competing cation.
INTRODUCTION
In the past decade (1950-60), radioactive materials have been produced and used in ever increasing quantities. It is unavoidable that some of these materials will be released to the environment where they can affect the quality of the water resources of the Nation. To evaluate the changes in quality of water caused by radioactive materials, an understanding of the various interactions between these materials and the environment is necessary. The factors that control the distribution of minor elements released during chemical weather ing of rocks and soils also control the distribution of radioactive elements in natural water. Therefore, the U.S. Geological Survey has begun a study of some physicochemical reactions that may have significant effects upon the transport and dispersal of radioactivity by water.
Water contacts many ion-exchange substances in the course of its movement on and beneath the surface of the earth. Clay minerals are the most common and widespread of these substances. Clay
Ai

A2 ION EXCHANGE ON MINERAL MATERIALS
minerals constitute a sizable fraction of the suspended-sediment load carried by many streams and of the bed material of many streams and lakes. They are also associated with many rocks that are im portant aquifers. Exchange of ions in solution for those on natural ion exchangers will play an extremely important role in controlling the concentrations of radioactive substances in water and the rate of movement and dispersal of such substances in the environment.
Ion-exchange reactions occurring between solutions of the more important radioactive substances and various clay minerals were chosen for early investigation. This report describes the progress to date in the study of the exchange of cesium for the more common cations found on clay minerals. Studies of other elements will be published in Geological Survey bulletins.
This work was done under the supervision of F. B. Barker, project chief.
SCOPE OP INVESTIGATION
The equilibria between cations adsorbed on clay minerals and cations in solution have been the subject of many investigations. The results of these investigations, however, do not provide sufficient knowledge of ion-exchange reactions between the clays and cations in dilute solutions. The concentrations studied by most investigators were in a range much greater than the amounts of radioactive cations that are considered hazardous in water supplies. The experimental techniques used in some of the investigations were questionable.
Many of the equations that have been used to describe cation- exchange equilibria are unsatisfactory. These equations have been based on empirical adsorption isotherms (Langmuir, 1918; and Wiegner and Jenny, 1927), the law of mass action (Kerr, 1928; and Vanselow, 1932), and theoretical kinetic considerations (Gapon, 1933; Jenny, 1936; and Davis, 1945). The equations have proved inade quate for several reasons. The use of adsorption isotherms involves the assumption that the ions are adsorbed in a monolayer at the clay surface even though the thermal energy of the cations is usually sufficient to cause a diffused double layer to form. Also, the arbi trary constants assumed for these equations cannot be related to properties of the clays. The equations based on the law of mass action or on kinetic considerations take into account the concentra tion and valence of the cations; however, these equations cannot be used to predict the effects of the nature of the clay or the other properties of the cations on the exchange equilibrium.
Careful consideration was given to the choice of the first cation to be studied in this investigation. Cesium seemed best suited for the proposed study for two reasons: its chemistry is simpler than that of other elements given consideration, and a rapid and reliable

ADSORPTION OF CESIUM ON CLAY MINERALS A3
method for determining exchange capacity using radiocesium is available (Beetem and Janzer, written communication; and Frysinger and Thomas, 1955). The exchange adsorption of cesium was studied at cesium concentrations between 10" 1 and approximately 10~10 N in the presence of competing cations concentrations of 0.27V, 0.1 Af, 0.02A7", 0.01 N, and 0.002A7". The ions used to compete with cesium for adsorption by the clay minerals were sodium, potassium, calcium, and magnesium. These ions were chosen mainly because they are the most abundant cations in natural water; however, their use also provides a means of studying the effect of size and valence of the competing cation on the exchange adsorption of cesium.
EXPERIMENTAL WORK
DESCRIPTION OP CLAYS
The five clays used in this study were the American Petroleum Institute standards kaolinite No. 4, halloysite No. 12b, "illite" No. 35, montmorillonite No. 11, and montmorillonite No. 21. These clays represent three major groups of clay minerals: the kaolinite group, the "illite" group, and the montmorillonite group.
Kaolinite No. 4 is obtained from pits near Macon, Ga. The exchange capacity of this clay is approximately 10 milliequivalents per 100 grams of its weight after drying at 105° C. The exchange capacity of kaolinite can be attributed to the dissociation of structural hydroxyl groups at the surface of the crystals and to broken bonds at the edges of the clay particles (Grim, 1953, p. 132-133).
Halloysite No. 12b is obtained from deposits near Bedford, Ind. This clay has an exchange capacity of approximately 19 milliequiva lents per 100 grams of its weight after drying at 105° C. The exchange capacity of halloysite, like that of kaolinite, can be attributed to the dissociation of structural hydroxyl groups at the surface of the crystals and to broken bonds at the edges of the clay particles (Grim, 1953, p. 132-133).
"Illite" No. 35, obtained from deposits found near Fithian, 111., has an exchange capacity of approximately 15 milliequivalents per 100 grams of its weight after drying at 105° C. Its exchange capacity can be attributed to isomorphous substitutions in the crystal lattice and to broken bonds at the edges of the clay particles (Grim, 1953, p. 132-133).
Montmorillonite No. 11 is obtained from deposits located at Santa Rita, N. Mex. This clay has an exchange capacity of approximately 116 milliequivalents per 100 grams of its weight after drying at 105°C. Montmorillonite No. 21 is obtained from deposits found near Burns, Miss. This clay has an exchange capacity of approximately 130 milliequivalents per 100 grams of its weight after drying at 105°C.
A4 ION EXCHANGE ON MINERAL MATERIALS
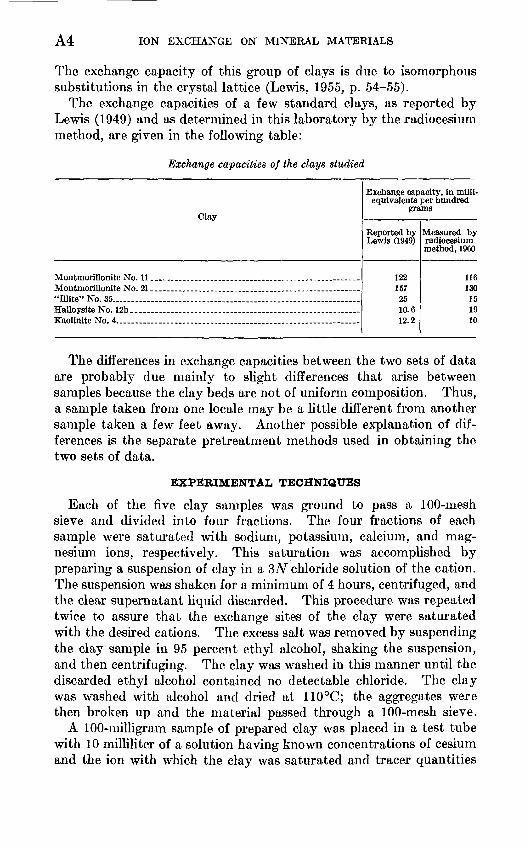
The exchange capacity of this group of clays is due to isomorphous substitutions in the crystal lattice (Lewis, 1955, p. 54-55).
The exchange capacities of a few standard clays, as reported by Lewis (1949) and as determined in this laboratory by the radiocesium method, are given in the following table:
Exchange capacities of the clays studied
Clay
Montmorillonite No. 21. ____________________________"Hlite" No. 35..... . _ . .__...___..__._.___._._____..._.._.-_.._ ..-HalloysiteNo.l2b_. - -.. .._.__ .._-_._...__..__. --Kaolinite No. 4. ____ .... _____ . __ . __ . ___ .... _ . ____ ...
Exchange capacity, in milli- equivalents per hundred
grams
Reported by Lewis (1949)
122 157 25 10.6 12.2
Measured by radiocesium method, 1960
116 130 15 19 10
The differences in exchange capacities between the two sets of data are probably due mainly to slight differences that arise between samples because the clay beds are not of uniform composition. Thus, a sample taken from one locale may be a little different from another sample taken a few feet away. Another possible explanation of dif ferences is the separate pretreatment methods used in obtaining the two sets of data.
EXPERIMENTAL TECHNIQUES
Each of the five clay samples was ground to pass a 100-mesh sieve and divided into four fractions. The four fractions of each sample were saturated with sodium, potassium, calcium, and mag nesium ions, respectively. This saturation was accomplished by preparing a suspension of clay in a 3N chloride solution of the cation. The suspension was shaken for a minimum of 4 hours, centrifuged, and the clear supernatant liquid discarded. This procedure was repeated twice to assure that the exchange sites of the clay were saturated with the desired cations. The excess salt was removed by suspending the clay sample in 95 percent ethyl alcohol, shaking the suspension, and then centrifuging. The clay was washed in this manner until the discarded ethyl alcohol contained no detectable chloride. The clay was washed with alcohol and dried at 110°C; the aggregates were then broken up and the material passed through a 100-mesh sieve.
A 100-milligram sample of prepared clay was placed in a test tube with 10 milliliter of a solution having known concentrations of cesium and the ion with which the clay was saturated and tracer quantities
ADSORPTION OF CESIUM ON CLAY MINERALS A5
of cesium-137. After the suspension had been shaken for 12 hours, equilibrium was assumed to have been obtained and the suspension was centrifuged until the supernatant liquid was clear. To obtain a clear solution, however, some of the suspensions of sodium-clay had to be filtered through a molecular membrane filter having 0.5-micron pores. The clay samples that adsorbed only a small amount of cesium were washed with 95 percent ethyl alcohol until the discarded alcohol contained no detectable chloride. The count rate of the radioactive cesium adsorbed on the clay was determined by using a gamma-scintillation counter. This count rate was compared with that of the tagged cesium solution used for equilibration. The clay samples that had adsorbed large amounts of radioactive cesium were discarded, and the clear supernatant solution was analyzed. The count rate of the cesium-137 in an aliquot of this solution was deter mined using the gamma-scintillation counter and compared with the count rate of the original cesium solution. These results were used to calculate the fraction of the total cesium that had been adsorbed by the clay. The equilibrium concentration of the ion competing with cesium for adsorption sites on the clay was calculated by adding, on an equivalent basis, the amount of cesium adsorbed to the amount of the competing ion originally present in the solution.
DISCUSSION OF RESULTS
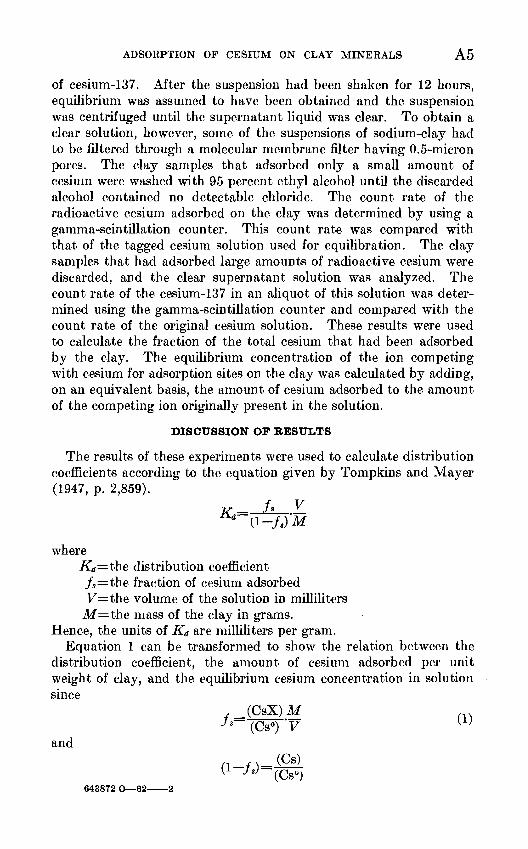
The results of these experiments were used to calculate distribution coefficients according to the equation given by Tompkins and Mayer (1947, p. 2,859).
I- / v'
whereKd=ihe distribution coefficient /s=the fraction of cesium adsorbed y=the volume of the solution in milliliters M=the mass of the clay in grams.
Hence, the units of K& are milliliters per gram.Equation 1 can be transformed to show the relation between the
distribution coefficient, the amount of cesium adsorbed per unit weight of clay, and the equilibrium cesium concentration in solution since
(CsX)MJs (Cs°) 'V ( '
and
-s (Csc )
643872 O 62 2

A6 ION EXCHANGE ON MINERAL MATERIALS
so that
tf- (Cs)
where(CsX) = the amount of cesium adsorbed per unit weight of clay (Cs°) = the concentration of cesium in the original solution (Cs)=the concentration of cesium in the equilibrium solution.
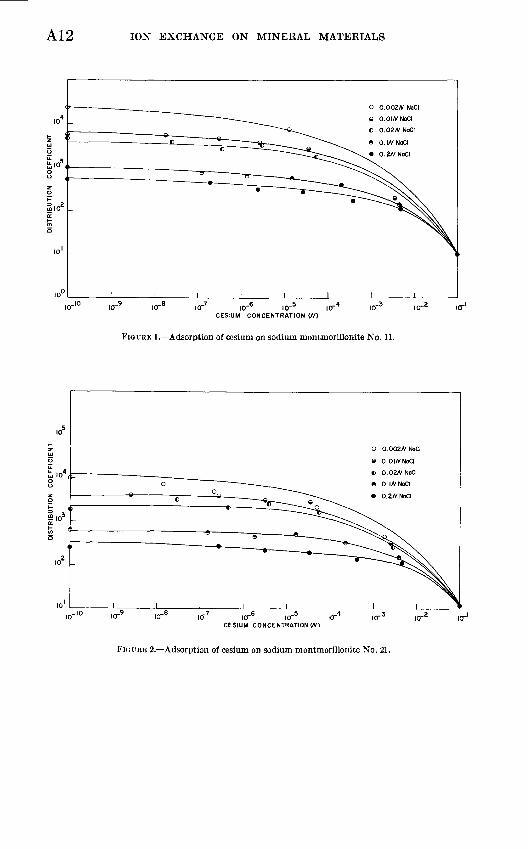
Graphs of the results of these experiments are presented in figures 1 through 18. These graphs show the relations between the distribution coefficients and the cesium concentrations at the different concentra tions of the competing cation. The relations characteristic of one competing cation and one clay are shown on each figure.
The graphs show that each distribution coefficient corresponding to a given clay and concentration of competing cation approaches a constant value at very low cesium concentrations. This can be explained by considering the exchange equilibrium between cesium at low concentrations and sodium. Assuming that cesium ions are adsorbed at only one type exchange site, the mass-action equation for this reaction is
[NaX] + [Cs+];=±[CsX] + [Na+], where
[NaX] = the activity of the adsorbed sodium [CsX]=the activity of the adsorbed cesium [Na+]=the activity of sodium in the equilibrium solution [Cs+] = the activity of cesium in the equilibrium solution.
The equilibrium constant for this reaction is
_[CsX][Na+] AeQ~[NaX][Cs+]' w
It is known that [Cs+] = (Cs+)7cs ; [Na+] = (Na+)7Na ; [CsX] = (CsX)7CsX ; and [NaX] = (NaX)7NaX in which 7 is the activity co efficient, the quantities in parentheses represent concentrations, and those in brackets represent activities. In the low range of cesium concentration, the ionic strength of the solution is determined mainly by the sodium chloride concentration, which is essentially constant for a particular curve. Under these conditions the activity coeffi cients for Cs+ and Na+ will be constant; thus
[Cs+]=a(Cs+) and
[Na+]=6(Na+).

ADSORPTION OF CESIUM ON CLAY MINERALS A7
In this low range of cesium concentration, the amount of cesium adsorbed should be very small and the amount of sodium adsorbed should be essentially equal to the exchange capacity of the clay. Subject to these conditions, the activity coefficients of the adsorbed ions may be expected to be constant. Hence,
[CsX]=c(CsX) and
[NaX]=d(NaX).
Inserting these quantities into the equation for the equilibrium constant
_c(CsX)6(Na+)AeQ d(NaX)a(Cs+)' w
and since a, b, c, and d are constants
(Na+)~~(NaX) (Cs+)
Combining the equations for KA and Kr (equations 2 and 5)
Inasmuch as K', (NaX), and (Na+) are constant for a particular sodium concentration and very low cesium concentrations, KA also should be constant.
At cesium concentrations above 10~6 N, the value of the distribu tion coefficient decreases with an increase in cesium concentration. At these higher cesium concentrations the curves showing the rela tionship between the distribution coefficient and the cesium concen tration tend to converge. The slopes and convergence of these curves at high cesium concentrations can be explained by considering again equation 2
(CsX) A* (Cs+)'
When the concentration of cesium in solution far exceeds that of the competing cation, the concentration of cesium adsorbed approaches the exchange capacity of the clay; thus, when (Cs+)»(Na+),
^ Q
where Q is the cation exchange capacity. Under such conditions the plot of log Kd versus log (Cs+) should asymptotically approach a

A8 ION EXCHANGE ON MINERAL MATERIALS
straight line having a slope of 1 and an intercept of log Q; therefore, the lines should converge.
The graphs in figures 1 through 18, which show the relations be tween the distribution coefficients and the cesium concentrations, indicate that the value of a distribution coefficient, at a particular cesium concentration, depends on the type of clay mineral as well as the nature and concentration of the competing cation.
The graphs in figures 19 through 36 show the relations between the limiting values of the distribution coefficients, as the cesium con centration becomes small, and the concentrations of the ions competing with cesium for exchange sites on the clay. These limiting values of the distribution coefficient were taken from the graphs in figures 1 through 18 at the point on the curves corresponding to an equilibrium cesium concentration of 10~ 1(W. The logarithmic plots of the limiting values of Kd against concentrations of the competing cations were straight lines. This can be explained by considering equation 6
(NaX)
At low cesium concentrations when Kf and (NaX) are constant, Kd should be inversely proportional to the sodium concentration, (Na). The log-log plot, therefore, should be a straight line with slope of 1. When potassium is the competing cation, the same argument applies. The equation corresponding to equation 6 when calcium is the com peting cation is
j, r==- (CaX2)-and the slope of the line should be 0.5, as is also true when magnesium is the competing cation.
The slopes of the curves plotted in figures 19 through 36 agree fairly well with these predictions. All the curves, however, have a somewhat smaller slope than that predicted except the curve for sodium halloysite, which has too great a slope. There are several pos sible explanations for the departure of the slope of these curves from the theoretical slope. If a small amount of cesium is adsorbed, inde pendent of the concentration of the competing cation, either by physical adsorption, adsorption at a second type of exchange site, or some other mechanism, then, with an increase in the concentration of the competing cation, the limiting value of the distribution coefficient would not decrease as rapidly as the theory predicts. Another pos sible explanation for the failure of the curves to follow the theoretical slope is that the separation of the clay particles from the solution was not quite complete. Because the clay would be flocculated at

ADSORPTION OF CESIUM ON CLAY MINERALS A9
high salt concentrations, clay particles would be expected to remain suspended in the solution after centrifuging only when the concen trations of both cesium and the competing cation are low. Owing to the cesium absorbed on the clay, the presence of even a small amount of clay in the solution would cause the measured value of the distribu tion coefficient to be lower than the true value.
The smallest values for the distribution coefficient were found for the adsorption of cesium on kaolinite. The distribution coefficient at a cesium concentration of Q.QlN was about the same for each of the competing cations. In these experiments, the effect of the competing cations on the adsorption of cesium was compared on a basis of the normality rather than the molarity of the solution. Hence, the apparent effect of the valence of the competing cations was reduced.
At extremely low cesium concentrations, the distribution coeffi cient for cesium on kaolinite depended strongly on the competing ca tion used. At the highest concentration of the competing cations (0.2A/), the value of the distribution coefficient was smaller when either sodium or potassium was the competing ion than when either calcium or magnesium was the competing cation. From the value of the distribution coefficient under these conditions, the relative ability of these cations to compete with cesium for adsorption sites on kaolinite is Na=K>Ca>Mg. At the same cesium concentration, but at the lowest concentration of the competing cations (0.002AT), the relative ability of the cations to compete with cesium is Ca =Mg>K=Na. Even if the effects of these cations are compared on a basis of equal molarity rather than equal normality, the rela tive order of the cations in this series remains unchanged. These results are difficult to interpret in terms of the normal lyotropic series, which would predict that the relative ability of these cations to compete with cesium would be Ca>Mg>K>Na.
With higher concentrations of cesium, the largest values for the distribution coefficient were found for the adsorption of cesium on the two montmorillonite clays. At the highest concentrations of the com peting cations, the relative ability of the cations to compete with ce sium for adsorption on montmorillonite No. 11 was K>Ca=Mg>Na. At the lowest concentration of the competing cations, the order of ability was K>Ca>Mg>Na. The relative ability of these cations to compete with cesium for adsorption on montmorillonite No. 21, at the highest concentration of the competing cation, was K>Ca>Mg>Na and at the lowest concentration of the competing cation the order was K=Mg>Ca>Na. Except for the displacement of potassium, the order of replacement ability is about what would be expected from consideration of the size and valence of the cations. The strong ability of potassium to compete with cesium for adsorption on montmoril-

A10 ION EXCHANGE ON MINERAL MATERIALS
lonite is not surprising, because expanding-lattice clay minerals, like montmorillonite, tend to fix potassium in a nonexchangeable form.
At extremely low cesium concentrations and at the highest concen trations of the competing cations, the relative ability of the cations to compete with cesium for adsorption on montmorillonite No. 11 was found to be K>Na>Ca>Mg. Paradoxically, almost a complete re versal of the relative ability of the cations to compete with cesium for adsorption sites on the clay was observed at the lowest concentration of the competing cations; the order of replacement ability was Ca>Mg>K>Na.
The values of the distribution coefficients for the adsorption of cesium on "illite," at high cesium concentrations, were about the same as those for kaolinite. At low cesium concentrations, however, the distribution coefficients for adsorption of cesium on "illite" were much larger than those for kaolinite. Potassium was found to be much more effective than sodium in competing with cesium for adsorption by "illite." This is probably due to fixation of potassium in a manner similar to that described for the montmorillonite clays.
At high cesium concentrations, the distribution coefficients for the adsorption of cesium on halloysite were about the same as those for the adsorption of cesium on kaolinite. These results should be ex pected because of the similarity between kaolinite and halloysite. At low cesium concentrations, the distribution coefficients for cesium ad sorption on these two clays were very different, except when potassium was the competing cation. The highest distribution coefficient for the adsorption of cesium on kaolinite in the presence of either potassium or sodium was 700. The highest distribution coefficient for the ad sorption of cesium on halloysite in the presence of potassium was 400; when sodium was the competing cation, however, the highest value of the distribution coefficient was 150,000, the highest distribution coef ficient observed in any of these experiments. These results indicate that halloysite is very effective in adsorbing cesium from extremely dilute cesium solutions.
CONCLUSIONS
The logarithm of the distribution coefficient for the adsorption of cesium on a particular clay mineral, at very low cesium concentrations, is an approximately linear function of the logarithm of the concentra tion of the ion competing with cesium for adsorption by the clay mineral. This observation indicates that the distribution coefficient may be very useful for predicting the movement of radio-active cesium transported by water, particularly if similar results are obtained for more complex systems.

ADSORPTION OF CESIUM ON CLAY MINERALS All
The results also indicate that cesium ions may be expected to move the shortest distances through soils and clays in which sodium is the predominant exchangeable cation.
FUTURE WORK
Studies of the sorption by clay minerals of various other radio active nuclides from solutions of sodium, potassium, magnesium, and calcium ions will be made in the future. The goals of these studies will be (1) an equation that will explain the adsorption by clay minerals of these and other cations and (2) a better understanding of the role of ion exchange in controlling the occurrence and distribution of trace elements in natural water.
Further work may show why some, systems do not follow a simple equilibrium law. Additional work with very dilute solutions of cesium may indicate whether the apparent fixation of cesium by clays stems from a mechanism other than ion exchange or whether the fixation is a direct consequence of the chemistry of dilute cesium solutions. The degree of irreversibility of the fixation will also be investigated.
A12 ION EXCHANGE ON MINERAL MATERIALS
O 0.002/V NoCI
O O.OI/VNoCI
C 0.02/VNoCI
« 0. WNoCI
0.2/VNaCI
IQT 10 10 \<T CESIUM CONCENTRATION (AO
FIGURE 1. Adsorption of cesium on sodium montmorillonite No. 11.
O 0.002/VNaCI
» 0 OI/VNaCI
C 0.02/VNaCI
e O.l/VNaCi
O.Z/VNaCI
icr7 IOT" 10-" icr"CESIUM CONCENTRATIONS)
FIGURE 2. Adsorption of cesium on sodium montmorillonite No. 21.

ADSORPTION OF CESIUM ON CLAY MINERALS A13
iio2 .
O 0.002/VNaCI
e o.o w NaCiC 0.02/V NoCI
e o.i/VNaCi 0.2/VNaCI
r7 io-6 ,o-5CESIUM CONCENTRATIONS)
FIGURE 3. Adsorption of cesium on sodium kaolonite No. 4.
O 0.002/VNaCI
» O.OI/VNaCI
C 0.02/VNoCI
e 0. l/V Nacl 0.2/V NaCI
CESIUM CONCENTRATION W)
FIGURE 4. Adsorption of cesium on sodium halloysite No. 12.
643872 O 62 3

A14 ION EXCHANGE ON MINERAL MATERIALS
O 0 002/V NoCI
0 0.01 A' NaCI
C 0.02/V NaCI
9 0. W NaCI
0.2/VNoCI
ICT 10 CESIUM CONCENTRATION (/V)
FIGURE 5. Adsorption of cesium on sodium illite No. 35.
O 0.002/VKCI
e O.OI/VKCIC 0 02/V KCI
e O.I/VKCI 0 2/V KCI
10-' ior" 10" ion- CESIUM CONCENTRATION (/V)
FIGURE 6. Adsorption of cesium on potassium montmorillonite No. 11.

ADSORPTION OF CESIUM ON CLAY MINERALS A15
10 ID" 10- CESIUM CONCENTRATION l/V)
FIGURE 7. Adsorption of cesium on potassium montmorillonite No. 21.
O 0.002/VKCI
O O.OI/V KCI
c o.oa/v KCI O.I/V KCI
0.2/V KCI
io-9
FIGURE 8. Adsorption of cesium on potassium kaolinite No. 4.

A16 ION EXCHANGE ON MINERAL MATERIALS
10 ,r
O 0 OOZ/V KCI
e o.oi/v KCIt> 0.02/V KCI
SOW KCI
0.2/VKCI
ID-' 10" 10",-4 10"
CESIUM CONCENTRATION (/V)
FIGURE 9. Adsorption of cesium on potassium balloysite No. 12.
O O.OOZ/V KCI
e o.oi/v KCI > o.oa/v KCI« O.I/VKCI
0.2/VKCI
10"' 10-° IO"3 10"" CESIUM CONCENTRATION (/V)
FIGURE 10. Adsorption of cesium on potassium illite No. 35.

ADSORPTION OF CESIUM ON CLAY MINERALS A17
O 0.002/VM9CI2
O 0.01/V MgCI 2
« 0.02/V MgCI2
« 0.1/V MgCI 2
0.2/VMgCI2
CESIUM CONCENTRATION (/V)
FIGURE 11. Adsorption of cesium on magnesium montmorillonite No. 11.
CESIUM CONCETRATION (/V)
FIGURE 12. Adsorption of cesium on magnesium montmorillonite No. 21.

A18 ION EXCHANGE ON MINERAL MATERIALS
O 0 002/V MgCI
O 0 OI/V MgCI2
> 0.02/V MgClz
SOW MgCla
0.2/VMgCla
FIGURE 13. Adsorption of cesium on magnesium kaolinite No. 4.
O 0.002/VMgCI2
O 0 OI/VMgCI 2
C 0. 03/V MgClj
e 0. 1/VMgCljj
O.a/VMgCI,
CESIUM CONCENTRATION (/V)
FIGURE 14. Adsorption of cesium on magnesium halloysite No. 12

ADSORPTION OF CESIUM ON CLAY MINERALS A19
O 0.002/VCaCI2
O O.OI/VCaCI2
> 0.02/VCaCfe
» 0 I/V CoClj
0.2/VCoCI2
CESIUM CONCENTRATION (/V)
FIGURE 15. Adsorption of cesium on calcium montmorillonite No. 11.
O 0.002/V CaClj
O O.OI/V CaCI 2
> 0.02/V CaCI2
O O.I/VCaCIi,
0.2/V CaCI2
CESIUM CONCENTRATION (/V)
FIGURE 16. Adsorption of cesium on calcium montmorillonite No. 21.

A20 ION EXCHANGE ON MINERAL MATERIALS
O 0.002/VCoCI2
O 0.0W CoCI2
C 0.02/V CoCI2
e 0.1/V CoCI 2
0.2/V CoCI2
icrlc ,cr9 ID" IOT"
CESIUM CONCENTRATION (/V)
FIGURE 17. Adsorption of cesium on calcium kaolinite No. 4.
O 0.002ft CoCI2
O O.OI/VCaCI2
« 0.02/VCaCl2
e O.I/VCaClj
0.2/V CaCI2
10 10 CESIUM CONCENTRATION W)
FIGURE 18. Adsorption of cesium on calcium halloysite No. 12.

ADSORPTION OF CESIUM ON CLAY MINERALS A21
IOZ
SODIUM CONCENTRATION (/V)
FIGURE 19. Limiting value of distribution coefficient (sodium mont- morillonite No. 11).
SODIUM CONCENTRATION (#)
FIGURE 20. Limiting value of distribution coefficient (sodium mont- morillonite No. 21).

A22 ION EXCHANGE ON MINERAL MATERIALS
SODIUM CONCENTRATIONS)
FIGURE 21. Limiting value of distribution coefficient (sodium kaolinite No. 4).
SODIUM CONCENTRATION (#)
FIGURE 22. Limiting value of distribution coefficient (sodium halloysite No. 12).

ADSORPTION OF CESIUM ON CLAY MINERALS A23
I05
SODIUM CONCENTRATION W)
FIGURE 23. Limiting value of distribution coefficient (sodium illite No. 35).
5 io3
POTASSIUM CONCENTRATION (AT)
FIGURE 24. Limiting value of distribution coefficient (potassium mont- morillonite No. 11)

A24 ION EXCHANGE ON MINERAL MATERIALS
POTASSIUM CONCENTRATION (/V)
FIGURE 25. Limiting value of distribution coefficient (potassium mont- morillonite No. 21).
POTASSIUM CONCENTRATION (/V)
FIGURE 26. Limiting value of distribution coefficient (potassium kao- linite No. 12).

ADSORPTION OF CESIUM ON CLAY MINERALS A25
POTASSIUM CONCENTRATION {*)
FIGURE 27. Limiting value of distribution coefficient (potassium halloy- site No. 12).
io3
« z 5KT
to-" 10-' io- 1 10"POTASSIUM CONCENTRATION (*)
FJGUKE 28. Limiting value of distribution coefficient (potassium illite No. 35).

A26 ION EXCHANGE ON MINERAL MATERIALS
10*
MAGNESIUM CONCENTRATION t/V)
FIGUKE 29. Limiting value of distribution coefficient (magnesium mont- morillonite No. 11).
MAGNESIUM CONCENTRATION (AO
FIGURE 30. Limiting value of distribution coefficient (magnesium mont- morillonite No. 21).

ADSORPTION OF CESIUM ON CLAY MINERALS A27
MAGNESIUM CONCENTRATION W)
FIGURE 31. Limiting value of distribution coefficient (magnesium kao- linite No. 4).
MAGNESIUM CONCENTRATION t/V)
FIGUBK 32. Limiting value of distribution coefficient (magnesium halloy- site No. 12).

A28 ION EXCHANGE ON MINERAL MATERIALS
CALCIUM CONCENTRATION (AO
FIGURE 33. Limiting value of distribution coefficient (calcium mont- morillonite No. 11).
CALCIUM CONCENTRATION </V)
FIGURE 34. Limiting value of distribution coefficient (calcium mont- morillonite No. 21).

ADSORPTION OF CESIUM ON CLAY MINERALS A29
CALCIUM CONCENTRATIONS)
FIGUEE 35. Limiting value of distribution coefficient (calcium kaolinitc No. 4).
CALCIUM CONCENTRATION </V)
FIGUEE 30. Limiting value of distribution coefficient (calcium halloy- site No. 12).

A30 ION EXCHANGE ON MINERAL MATERIALS
REFERENCES CITED
Davis, L. E., 1945, Simple kinetics theory of ionic exchange for ions of unequalcharge: Jour. Phys. Chemistry, v. 49, p. 473-479.
Frysinger, Galen, and Thomas, H. C., 1955, A method for the determinationthe of cation exchange capacity of clay minerals and soils, in Milligan, W. O.,ed., Clay and clay minerals: Natl. Research Council Pub. 395, p. 239-245.
Gapon, E. N., 1933, Theory of exchange adsorption in soils: Jour. Gen. Chem.,U.S.S.R., v. 3, p. 144-152.
Grim, R. E., 1953, Clay mineralogy: New York, McGraw-Hill Book Co. Inc.,384 p.
Jenny, H., 1936, Simple kinetic theory of ionic exchange. 1. Ions of equal valency:Jour. Phys. Chemistry, v. 40, p. 501-517.
Kerr, H. W., 1928, The nature of base-exchange and soil activity: Jour. Am. Soc.Agron., v. 20, p. 309-335.
Langmuir, I., 1918, The adsorption of bases on planes of surfaces of glass, mica,and platinum: Jour. Am. Chem. Soc., v. 40, p. 1361-1403.
Lewis, D. R., 1949, Analytical data on reference clay minerals, in ReferenceClay Minerals: Am. Petroleum Inst. Research Proj. 49, New York, ColumbiaUniversity Press, p. 92-97.
Lewis, D. R., 1955, Ion exchange reactions of clays: in Pash, J. A., and Turner,M. D., ed., Clays and Clay Technology, California Dept. Nat. ResourcesBull. 169, p. 54-55.
Tompkins, E. R., and Mayesr, S. W., 1947, Equilibrium of rare earth complexeson exchange resins: Jour. Am. Chem. Soc., v. 69, p. 2859.
Vanselow, A. P., 1932, Equilibria of the base-exchange reactions of bentonites,permutities, soil colloids, and zeolites: Soil Sci., v. 33, p. 95-113.
Wiegner, V. G., and Jenny, H., 1927, Uber Basengustavsch and Permutiten:Kolloid-Zeitschr., v. 43, p. 268-272.
U.S. GOVERNMENT PRINTING OFFICE : 1962 0 643872


