adsorption of single-ring model naphthenic acid from oil ... · intra-particle diffusion rate...
TRANSCRIPT
Adsorption of Single-ring Model Naphthenic Acid from Oil Sands Tailings Pond Water Using Petroleum Coke-
Derived Activated Carbon
by
Bithun Sarkar
A thesis submitted in conformity with the requirements for the degree of Master of Applied Science
Department of Chemical Engineering and Applied Chemistry University of Toronto
© Copyright by Bithun Sarkar 2013

ii
Adsorption of Single-ring Model Naphthenic Acid from Oil Sands
Tailings Pond Water Using Petroleum Coke-Derived Activated
Carbon
Bithun Sarkar
Master of Applied Science
Department of Chemical Engineering and Applied Chemistry
University of Toronto
2013
ABSTRACT
Petroleum coke-derived activated carbons were prepared and used for the adsorptive removal of
a single-ring naphthenic acid (NA) from synthetic oil sands tailings pond water (TPW). The
overall adsorption process was found to be intra-particle diffusion-controlled. The Weber-Morris
intra-particle diffusion rate constants decreased from 7.43 to 1.23 mg/g min0.5
after activated
carbon was post-oxidized with oxygen, suggesting a hindering effect of oxygen surface groups.
The Freundlich model fit of the equilibrium adsorption isotherms and the small negative ΔHo
pointed to a physisorption-dominated process and the importance of specific surface area. It was
estimated that about 2.7 g/L of basic CO2-activated carbon is needed to reduce NA concentration
from 120 mg/L to 2.5 mg/L (~98% removal) in synthetic TPW. However, equilibrium adsorption
capacity was found to vary significantly after oxygen or nitrogen groups were introduced onto
the surface. Therefore, there is a potential for enhanced adsorption by chemical functionalization
of carbon.

iii
Acknowledgements
I would like to express my deepest gratitude to my thesis supervisor Professor Charles Q. Jia for
providing consistent guidance, support, supervision and financial support throughout my
research. I have thoroughly enjoyed the challenging research environment fostered at the Green
Technology Group.
I would also like extend my sincere appreciation to the rest of my committee members,
Professors Don W. Kirk and Edgar Acosta, for their valuable suggestions and feedbacks to my
research.
Professor Shitang Tong has been one of the most resourceful individuals that I have met during
my graduate studies. I would like thank him for all his advices and for performing the post-
treatment of activated carbon with gaseous ammonia. A special thanks to Dr. Eric Morris, who
has been a mentor when I first started at the Green Tech. lab. I would like to express my most
sincere thanks to Siyu (Jois) Xie, who had been an outstanding summer research assistant, and
made many contributions to this work.
Special thanks to John Caguiat, Derek Huynh and Jocelyn Zuliani for their contribution to this
research project; Rose Balazs and Dan Mathers of the Analest Facility (U of T) for sharing their
expertise on FTIR spectroscopy. I would like to thank the rest of the Green Technology Group
for their companionship over the last twenty months.
Finally, I would like to dedicate this work to an old friend of mine.
iv
TABLE OF CONTENTS
CHAPTER 1 INTRODUCTION………………….…………………………..………1
1.1 Background and Motivation………………………….………………..….......1
1.1.1 The oil sands industry……………………………………...…………....1
1.1.2 Oil sand naphthenic acids……………………………………………….3
1.1.3 Adsorption of naphthenic acids by activated carbon………………........4
1.2 Research Objectives…………………...………..……………………….…......6
CHAPTER 2 OIL SANDS NAPHTHENIC ACIDS AND ACTIVATED
CARBON: A LITERATURE REVIEW……………..…….................8
2.1 Oil Sands Naphthenic Acids…………………………………………..….........8
2.1.1 Origin………………………………………………………………........8
2.1.2 Structure and classification………………………………………….......8
2.1.3 Mobility and toxicity………………………………………………......10
2.1.4 Chemical properties………………………………………………........11
2.1.5 Analytical techniques for detection and quantification………………..12
2.1.6 Remediation techniques………………………………………………..14
2.2 Activated Carbon……..…………………………………………………........15
2.2.1 Applications as an adsorbent…………………………………………..15
2.2.2 Precursor materials for activated carbon production……………..........17
2.2.2.1 Oil sands petroleum coke………………………………............18
2.2.3 Activated carbon production processes…………………………….......19
2.2.3.1 Physical activation……………………………………………..20
2.2.3.2 Chemical activation………………………………………........21
2.2.3.3 Post-modification of activated carbon……………………........22
2.2.3.4 Factors influencing the physical and chemical properties
of activated carbon………………………………………......…23
CHAPTER 3 THEORETICAL OVERVIEW OF ADSORPTION……………….25
3.1 Physisorption vs. Chemisorption.……………………………..………….......25
3.2 Adsorption Kinetics……………………………………………………….......26
3.2.1 Empirical models……………………………………………………....26
3.2.1.1 Pseudo-first order model……………………………………….26
3.2.1.2 Pseudo-second order model……………………………………27
3.2.1.3 Elovich model………………………………………………….28
3.2.2 Mechanistic models…………………………………………………….28
3.2.2.1 Weber-Morris intraparticle diffusion model…………………...30
3.3 Equilibrium Adsorption Isotherms………………………………………….30

v
3.3.1 Langmuir model………………………………………………………..31
3.3.2 Freundlich model……………………………………………………….32
3.3.3 Temkin model…………………………………………………….……33
CHAPTER 4 EXPERIMENTAL METHODOLOGY…......………………...…….34
4.1 Preparation of Activated Carbon……………………………........................34
4.1.1 Materials and instruments……………………………………………...35
4.1.2 Physical activation of delayed petroleum coke………………………...36
4.1.2.1 CO2 activation………………………………………………….36
4.1.2.2 Steam activation……………………………………………......37
4.1.3 Post-treatment of petroleum coke-derived activated carbon…………..39
4.1.3.1 Post-oxidation……………………………………………….....39
4.1.3.2 Post-treatment with gaseous ammonia………………………....41
4.2 Characterization of Activated Carbon………………………........................42
4.2.1 Materials and instruments……………………………………………...42
4.2.2 Pore structure analysis………………………………………………….43
4.2.3 Surface chemistry analysis. ……………………………………….…...44
4.2.3.1 FTIR analysis…………………………………………………...44
4.2.3.2 Boehm titration………………………………………………....44
4.2.3.3 Elemental analysis……………………………………………...46
4.3 Adsorption Study……………………………………………….......................47
4.3.1 Materials and instruments………………………………………….…..47
4.3.2 Model naphthenic acid...…………………………………………….…48
4.3.3 Quantification of the model naphthenic acid and total acid-extractable
organics from aqueous phase…………………………………………..48
4.3.3.1 Sample extraction from aqueous phase……………………..….48
4.3.3.2 FTIR-based quantification…………………………………..….49
4.3.4 Batch-type adsorption kinetics study……………………………..……51
4.3.5 Equilibrium adsorption (isotherm) study…………………………..…..52
4.3.6 Adsorption data quality…….……………………………………..……54
CHAPTER 5 RESULTS AND DISCUSSIONS……..…...………………...….……56
5.1 Characterization of Activated Carbon…………………………………...….56 5.1.1 Pore structure analysis……………………………………………….…56
5.1.2 Surface chemistry analysis………………………………………….….58
5.1.2.1 FTIR analysis……………………………………………….….58
5.1.2.2 Boehm titration……………………………………….………..61
5.1.2.3 Elemental analysis……………………………………….……..62
5.2 Adsorption Study…………………………………………………………...…65 5.2.1 Adsorption kinetics…………………………….……………………….65
5.2.2.1 Effect of pore structure………….…….…………………...…...67
5.2.2.2 Effect of initial adsorbate concentration…………………….….72

vi
5.2.2.3 Effect of temperature…………………………………………..75
5.2.2.4 Effect of surface functional groups……………………………77
5.3.2 Equilibrium adsorption study……………………………………….…82
5.3.2.1 Equilibrium adsorption isotherms……………………………...82
5.3.2.2 Effect of surface functional groups………………………….…85
5.3.2.3 Thermodynamic analysis of the model naphthenic acid
adsorption…………………………………………………..….88
5.3.2.4 Equilibrium adsorption of total acid-extractable organics
From real tailings pond water………….……………………....92
CHAPTER 6 CONCLUSIONS AND RECOMMENDATIONS……………….…95
6.1 Conclusions………………………………………………………….….......…95
6.2 Recommendations………………….……………………………….…….......99
REFERENCES………………………………………………………….……………….…101
APPENDICES ………………………………………………………….………………..…111

vii
LIST OF FIGURES
Figure 2-1: Examples of acyclic, monocyclic, and bicyclic naphthenic acid structure......…9
Figure 3-1: Schematic representation of a three-step conceptual model for solid-liquid
adsorption process……………………………………………………………..29
Figure 4-1: Schematic diagram of the experimental apparatus used for CO2-activation….37
Figure 4-2: Schematic diagram of the experimental apparatus used for steam
activation......…………………………………………………………………..38
Figure 4-3: Schematic diagram of the post-oxidation process with humidified-oxygen…..40
Figure 4-4: Experimental flow diagram of the adsorption study………………………….53
Figure 5-1: FTIR spectra of petroleum coke-derived activated carbon adsorbents….…….59
Figure 5-2: FTIR spectrum of ammonia post-treated CO2-activated carbon………………60
Figure 5-3: Amount of surface oxygen groups on activation carbon adsorbents….……….61
Figure 5-4: Elemental ‘organic’ oxygen content of activated carbon adsorbents…..……...63
Figure 5-5: The effect of shaking speed on the model naphthenic acid adsorption………..66
Figure 5-6: Time-dependent adsorption of mNA on adsorbents of different porosity…….67
Figure 5-7: Correlation between mesoporous volume fraction and pseudo-2nd
order rate
constant…………………………………………………………………….….70
Figure 5-8: Molecular dimensions of the model naphthenic acid………………………….71
Figure 5-9: Time-dependent adsorption of mNA onto CO2-ADC-6h with different
initial concentrations………………………………………….………….……72
Figure 5-10: Initial rate of adsorption as a function of initial mNA concentration…………73
Figure 5-11: Effect of temperature on time-dependent mNA adsorption…………..………75
Figure 5-12: Arrhenius plot of mNA adsorption……………………………………………76
Figure 5-13: Time-dependent adsorption of mNA onto adsorbent of different surface
functionalities…………………………………………………………….……77
Figure 5-14: Weber-Morris intraparticle diffusion plots of mNA adsorption onto surface
oxidized activated carbons…………………………………….………………78
Figure 5-15: Model naphthenic acid adsorption isotherms…………………………………83

viii
Figure 5-16: Adsorption isotherms reflecting the effect of adsorbent surface
functionalities…………………………………..……………………………...87
Figure 5-17: Plot of ln (Kc) versus 1/T for the estimation of thermodynamic
parameters………………………………………………………………...…...91
Figure 5-18: Adsorption isotherms of TAOs and mNA onto CO2-ADC-9h-pNH3………..93

ix
LIST OF TABLES
Table 3-1: Linearized forms of adsorption isotherm model………………………………33
Table 4-1: Adsorbent nomenclature……….........................................................................34
Table 4-2: Materials used in activated carbon production………......................................35
Table 4-3: Instruments and equipment used in activated carbon production………..........35
Table 4-4: Treatment conditions for physical activations..……….....................................39
Table 4-5: Experimental conditions for the post-treatments of activated carbon...............41
Table 4-6: Materials used for activated carbon characterization….....................................42
Table 4-7: Instruments and equipment used for activated carbon characterization............42
Table 4-8: Materials used for the adsorption study…………...….....................................47
Table 4-9: Instruments and equipment used for the adsorption study................................47
Table 4-10: Adsorption kinetic data quality for ‘effect of surface functional groups’
study…………………………………………………………………………...54
Table 4-11: Equilibrium adsorption data quality……………………...................................55
Table 5-1: Physical pore properties of activated carbon adsorbents...................................56
Table 5-2: Amount of surface oxygen groups on activated carbon adsorbents...................62
Table 5-3: Elemental analysis of activated carbons.............................................................64
Table 5-4: Empirical kinetic model parameters from the ‘effect of pore structure’
study...................................................................................................................69
Table 5-5: Correlation between adsorption pore properties and pseudo-2nd
order rate
parameters...........................................................................................................70
Table 5-6: Effect of initial mNA concentration on initial rate of adsorption……..............73
Table 5-7: Effect of temperature on pseudo-2nd
order rate constant...................................76
Table 5-8: Weber-Morris intraparticle diffusion parameters………………..……………79

x
Table 5-9: Correlation between adsorbent surface chemistry and Weber-Morris rate
parameters……………………………………………………………………..80
Table 5-10: Adsorption isotherm model parameters for mNA adsorption…………………84
Table 5-11: Relationship between mesoporous SSA and equilibrium adsorbed quantity… 85
Table 5-12: Effect of surface functional groups on the equilibrium adsorption of mNA…..86
Table 5-13: Effect of temperature on equilibrium constant for mNA adsorption………….89
Table 5-14: Thermodynamic parameters for the mNA adsorption onto activated carbon…91
Table 5-15: Equilibrium adsorption of TAOs and mNA onto CO2-ADC-9h-pNH3….…...93

xi
APPENDICES
Appendix A: Naphthenic acid quantification data…………………………………………..111
Appendix B: Nitrogen isotherms for adsorbent pore structure analysis…….……………….114
Appendix C: Adsorption kinetics data…………………………………….………………...115
Appendix D: Adsorption isotherm data…………………………………….……………….121

1
CHAPTER 1 INTRODUCTION
1.1 Background and Motivation
1.1.1 The Oil Sands Industry
The oil sands deposits of Northern Alberta, Canada are estimated to constitute world’s largest
bitumen reserve, containing approximately 1.7 trillion barrels of bitumen [28]. These deposits
are primarily composed of silica sand, clay minerals, water and bitumen. Bitumen and the
mineral solids have composition ranges of 6-14 wt% and 80-85 wt%, respectively, with water
making up the rest of the balance [85]. Bitumen is a viscous form of petroleum that can be
extracted from the oil sands ore and then chemically processed into synthetic crude oil (SCO).
The ore also contains a wide range of organic compounds with broad molecular weight range
[85]. These compounds are mostly hydrocarbons with different molecular structures (i.e.,
paraffinic, olefinic and aromatic) and organic acids (i.e., carboxylic and sulphonic acid) [74].
Raw bitumen can be recovered from the ore by either in-situ techniques that utilize steam
treatment or by a combination of surface mining and extraction methods. In the past, the latter
has been widely employed by companies such as Suncor Energy and Syncrude Canada Ltd.
Three successive steps may be used to describe the production of synthetic crude oil from
bitumen using this method: (1) mining of the bituminous ore, (2) extraction of bitumen from the
mineral solids, and (3) upgrading of bitumen into lighter fractions to produce SCO. The synthetic
crude oil is then distributed to oil refineries for further purification [85]. Although this method is
very efficient in separating bitumen from the ore, it produces large volumes of overburden
materials also known as tailings [85].

2
The Canadian oil sands industry is rapidly expanding to meet the increasing global and Canadian
energy demand. Paslawski et al. (2009) reported a cumulative production of 1.1 million barrels
of synthetic crude oil per day from bituminous ore by Canadian oil sands companies [72].
Despite the economic benefits of the oil sands development, the industry faces some major
challenges due to the negative environmental impacts caused by its mining, extraction, and
upgrading operations.
The management of tailings has been one of the major issues with the oil sands operations.
Currently, the oil sands companies hold regulatory permits for water diversion from nearby
sources with maximum volume set forth by governmental officials. In 2006, Syncrude diverted
approximately 33.9 million cubic metres of Athabasca River water [85]. A major portion of the
water is required for the bitumen extraction step, which utilizes an alkaline hot water extraction
process for bitumen recovery [9, 16, 26]. After extraction, the process water and the tailings
consisting of sand slurry, clay minerals, residual bitumen, and leached organic and inorganic
components of the ore are stored in containment facilities known as tailings ponds [26]. These
ponds were formerly excavated mine pits. Oil sands tailings ponds are often described as holding
basins that allow solids to settle, resulting in an overlaying water layer. This water is most
commonly known as oil sands tailings pond water (TPW). A fraction of the water is recycled for
process operations [26]. Tailings pond water has been proven to be toxic to a variety of
organisms, and thereby cannot be released into the environment. Currently, a zero discharge
policy implemented by the government prohibits the release of TPW into the environment [76].
The volume of tailings pond water is increasing with the production of the synthetic crude oil
from bitumen. According to Small (2011), a slurry waste volume of more than 4 x 10⁸ m
3 is
stored in the tailings ponds throughout the Athabasca region of Alberta. It is evident that the

3
increasing volume of oil sands tailings pond water is a major environmental concern. Thereby,
effective remediation and reclamation of the tailings ponds are vital for the sustainable
development of the Canadian oil sands.
1.1.2 Oil Sands Naphthenic Acids
Naphthenic acids (NAs) are naturally occurring constituents of bituminous oil sands deposits,
originating from depositional and post-depositional environments [9, 71, 85]. They are
solubilized from the ore during the bitumen extraction step, and released into the tailings pond
water. NAs have been defined as complex mixtures of alkyl-substituted acyclic and
cycloaliphatic carboxylic acids. They have the general chemical formula, CnH2n+zO2, where n
specifies the number of carbon atoms and z is zero or a negative even integer, indicative of
hydrogen deficiency due to the presence of ring structure [8, 9, 16, 26,76]. Oil sands NAs
typically have molecular weight greater than 120 g/mol.
Naphthenic acids are proven to be one of main toxic components of tailings pond water,
responsible for causing acute and chronic toxicity within microorganisms [8, 9, 16, 26, 28, 76].
Due to their water solubility, they are particularly harmful to aquatic wildlife [9]. Naphthenic
acids concentration greater than 2.5 ppm is toxic to fish species [9]. The concentration of NAs in
tailings pond water ranges from 20-120 ppm, whereas the concentration in Athabasca River is
typically less than 0.01 ppm [8, 9, 16, 26, 28, 76]. Potential leaching of naphthenic acids into the
nearby environment is a concern, and consequently there is a strong environmental incentive
behind the removal of these compounds from tailings pond water.
Naphthenic acids are also natural surfactants, comprised of polar hydrophilic head groups
(containing oxygen heteroatoms) and non-polar hydrophobic tail groups (carbon chain) [9, 38,

4
42]. This property allows the compounds to stabilize residual bitumen-in-water emulsions by
reducing interfacial surface tension, limiting the potential recovery of residual bitumen from
tailings ponds [38]. NAs also diminish the settling properties of fine clay minerals through
surface activities, which leads to slower settling rates of the minerals [38]. This effect is
undesirable for water reclamation.
It is apparent that naphthenic acids contribute to the environmental burden of oil sands
operations and diminish the reclamation and remediation efforts of tailings ponds. Therefore, the
removal of these compounds from oil sands tailings pond water must be investigated.
1.1.3 Adsorption of Naphthenic Acids by Activated Carbon
Biodegradation, ozonation, photocatalytic degradation and adsorption by various media have
been among some of the techniques investigated for naphthenic acids removal from tailings pond
water [8, 9, 10, 28, 30, 36, 57]. Removal of contaminants by adsorption is a well-developed
wastewater treatment technology. Activated carbon is one of the most commonly used
adsorbents for wastewater treatment. Due to intricate porosity and high specific surface area,
activated carbon possesses high adsorption capacity for contaminant species. The removal of
naphthenic acids by activated carbon adsorption is a promising solution to the problem presented
in this study. However, commercially produced activated carbon can be expensive. The
treatment of tailings pond water using commercially activated carbon may not be an
economically feasible alternative.
Oil sands petroleum coke (PC) is a well-known waste-product of the bitumen upgrading process.
It is a carbonaceous solid (80-85 wt% carbon) produced during a de-carbonization step to

5
convert heavy petroleum residues to synthetic crude oil [49, 71]. Although petroleum coke is a
potential combustible fuel source, due to its high sulphur content (6-7 wt%), combustion would
invariably produce large quantities of sulphur dioxide (SO2), which is not environmentally
feasible [49]. Consequently, petroleum coke has been accumulating as a by-product in oil sands
industry for many years. The Energy Resources Conservation Board of Canada has reported a
petroleum coke production rate of 20,000 tonnes/day in 2009, with an estimated increase to
about 40,000 tonnes/day by 2010 [4].
Recently, researchers have investigated the potential of petroleum coke as a precursor for
activated carbon [4, 49, 71]. Raw coke is non-porous and consequently has very low specific
surface area (~0.15 m2/g) [26]. However, studies have been indicated that petroleum coke can be
activated (thermally treated with the presence of a reagent) to produce activated carbon with high
specific surface area (~500-1500 m2/g) [4, 49, 71, 85]. High specific surface area generally
results in high adsorption capacity for contaminants. In their work, Yuan (2010) and Awoyemi
(2011) demonstrated the effectiveness of petroleum coke-derived activated carbon for the
removal of polycyclic aromatic hydrocarbons.
There is a strong environmental driving force behind the removal of naphthenic acids from
tailings pond water. Petroleum coke is vastly abundant, and presents itself as an effective
activated carbon precursor. This research thesis investigates the adsorptive removal of
naphthenic acids from oil sands tailings pond water by petroleum coke-derived activated carbon.

6
1.2 Research Objectives
The ultimate research goal was to investigate the adsorptive removal of naphthenic acids from
tailings pond water by petroleum coke-derived activated carbon. It should be noted that a model
naphthenic acid was used for most of the investigation. This is so that the non-competitive
adsorption process could be elucidated by establishing a baseline understanding of a single
naphthenic acid species before undertaking more complex naphthenic acid mixtures. The
following research objectives were investigated to answer the corresponding research questions.
Synthesize activated carbon from petroleum coke by various activation methods to
enhance the adsorption capacity of adsorbents; characterize the physical and chemical
properties of the newly synthesized activated carbons;
1. How do different activation methods affect the physical pore properties of the
adsorbents?
2. How would surface oxidation and basic surface treatment alter the chemical
surface functionalities of the adsorbents?
Perform batch-type time-dependent adsorption studies with the petroleum coke-derived
activated carbons to investigate the adsorption kinetics of the model naphthenic acid;
1. Which kinetic rate models best represent the experimental data?
2. How do the specific surface area and the pore size distribution of activated carbon
influence the rate constant?
3. What are the effects of acidic surface functionalities of adsorbents on the rate
parameters?

7
4. What is the rate-controlling step of the adsorption process?
Investigate the equilibrium adsorption of the model naphthenic acid;
1. Which adsorption isotherm model best describes the experimental data?
2. How does the activated carbon pore structure influence the equilibrium adsorption
capacity?
3. What are the effects acidic and basic surface functionalities on the equilibrium
adsorption capacity?
Investigate the equilibrium adsorption of total acid-extractable organics (complex
naphthenic acid mixtures) from tailings pond water using petroleum coke-derived
activated carbon.
1. Under the same conditions, how do the adsorption of total acid-extractable
organics compare to that of the model naphthenic acid? What are the
implications?
8
CHAPTER 2 OIL SANDS NAPHTHENIC ACIDS AND ACTIVATED CARBON:
A LITERTURE REVIEW
2.1 Oil Sands Naphthenic Acids
2.1.1 Origin
Recall from the first chapter that naphthenic acids (NAs) are one of the natural components
found in bituminous oil sands deposits. Although the oil sands industry has been moving towards
using an in-situ steam-assisted gravity drainage (SAGD) process for bitumen recovery, surface
mining/extraction methods have been more commonly employed by companies over the last few
decades [85]. The latter method has been argued to be the more efficient of the two, but it also
produces the greater amount of overburden materials [85]. In this method, bitumen is recovered
from mined ore using an alkaline hot water extraction process [26]. The resulting tailings from
the extraction process are then stored in oil sands tailings ponds containing slurry of sand, silt,
clay, organic and inorganic components of bitumen and residual bitumen. It is during this
extraction step that naphthenic acids find their way into the tailings ponds water [16, 17, 28].
2.1.2 Structure and Classification
Naphthenic acids are a complex group of alkyl-substituted acyclic and cycloaliphatic carboxylic
acids with the general chemical formula CnH2n+zO2, where n indicates the total number of carbon
atoms and z (either zero or a negative even integer) represents hydrogen deficiency in a
compound due to presence of ring structure [17, 28, 47, 85]. The magnitude of z value divided
by two indicates the number of rings present in a compound. Figure 2-1 displays the chemical
structures of a few naphthenic acids with different z values.

9
Z = 0
Z = -2
Z = -4
Figure 2-1: Examples of acyclic (z= 0), monocyclic (z= -2) and bicyclic (z= -4) naphthenic acid
structures

10
Recent advances in analytical tools revealed that the naphthenic acids classified by the formula
CnH2n+zO2 can undergo mild oxidation in tailings ponds to form ‘oxygenated’ or ‘oxy-naphthenic
acids’ with the formula CnH2n+zOx, where x = 2-5 [26]. Han et al., (2009) detected mono- and
di-oxy naphthenic acids (i.e., CnH2n+zO3 and CnH2n+zO4) in Syncrude tailings pond water [28].
According to Whitby (2010), NAs found in oil sands deposits may also contain pyrrole,
thiophene and phenol groups [77]. Hence, unique classification of these carboxylic acids is rather
difficult, in that, the term ‘naphthenic acid’ has become somewhat ambiguous. As of recent
years, the NAs represented by the formula CnH2n+zO2 have been referred to as ‘classical’ NAs
[26]. The variability in the chemical structures of NAs also presents a large challenge in the
quantification and characterization of the compounds [71].
2.1.3 Mobility and Toxicity
The pH of oil sands tailings ponds water typically ranges between 8-9. Zubot (2010) reported the
average pH of Syncrude TPW to be around 8.5. This is mainly due to the use of caustic solution
in the bitumen extraction process. The solubility of naphthenic acids in TPW is pH dependent –
where the dissociation constants of NAs generally range between 10-5
and 10-6
(pka = 5-6) [17].
Hence, NAs are readily soluble in TPW, where they exist as naphthenate salts (most commonly
as sodium and calcium naphthenates) [85]. The water solubility favours the transport of NAs in
surface water and groundwater, which would allow for the uptake by plants and animals [71].
Toxicological research has proven NAs to be the main components of TPW which are
responsible for acute and chronic toxicity in a variety of organisms such as fish, amphibians,
zooplankton and some mammals (rats and guinea pigs) [71, 77]. In order to emphasize the
degree of toxicity found in tailings pond water, Clemente and Fedorak (2005) reported

11
naphthenic acids concentration greater than 2.5-5 ppm to be toxic to fish species, where the
concentration of NAs in tailings ponds water ranges between 20-120 ppm [8, 17]. In comparison,
the Athabasca River (a nearby freshwater source) has a NAs concentration of less than 0.01 ppm
[66]. Although the toxicity imposed by NAs are species specific, and the level of toxicity varies
with structural composition, the leaching of TPW into groundwater and nearby fresh water
sources can have dangerous environmental consequences [17, 40].
2.1.4 Chemical Properties
Naphthenic acids are also surfactants or surface-active agents. They contain polar (hydrophilic)
head groups comprised of oxygen heteroatoms and non-polar (hydrophobic) tail groups
comprised of long carbon chains [17, 38, 42]. This unique characteristic allows these molecules
to partition to both oil and water phase simultaneously. By reducing the interfacial surface
tension, NAs can stabilize residual bitumen-in-water emulsions in tailings ponds, limiting the
potential for residual bitumen recovery from TPW [42]. Furthermore, NAs also diminish the
settling properties of fine clay minerals in tailings ponds water through surface activities, which
leads to slower settling rate [38]. Jiang et al., (2011) demonstrated that the addition of sodium
naphthenate to synthetic TPW hinders the settling properties of kaolinite, which is one of the
most predominant clay mineral in TPW.
Recent studies have indicated that recycling NA-containing TPW for process operations may
lead to corrosion of process equipment [17, 71]. Although the corrosion mechanism is not well
understood, it has been theorized to involve chelation of metal ions by carboxylate ions
(naphthenates), which subsequently leads to the formation of hydrogen gas [17]. Corrosion may
lead to equipment failure, and consequently raises safety and economic concerns.

12
In summary, naphthenic acids contribute to the environmental and economic burden of oil sands
operations. The removal of these compounds is not only vital to the reclamation and remediation
efforts of tailings ponds, but also to the sustainable and economically feasible development of
Canadian oil sands resources.
2.1.5 Analytical Techniques for Detection and Quantification
Due to the range of structural variability, accurate quantification and characterization of oil sands
naphthenic acids have been a challenge. A number of analytical techniques have been developed
for the purpose. Some are solely used to determine the total NAs concentration from aqueous
phase while others can reveal information in regards to structural composition.
A Fourier-transform infrared (FTIR) spectroscopy-based method developed by researchers at
Syncrude Ltd. has been used most commonly for detecting and quantifying NAs [39]. The
detection is based on infrared (IR) absorbance of carboxylic acids in organic liquid phase. For
this reason, NAs are extracted into an organic phase from acidified aqueous phase using
dichloromethane [81]. In liquid or solid state, most carboxylic acids exist as hydrogen-bonded
dimers. However, in dilute solutions, equilibrium exists between the acid monomers and dimers
[66]. The absorbance peak heights of the monomeric and dimeric forms are measured at
wavenumbers 1743 and 1704 cm-1
, respectively [17, 77]. The combined peak height is directly
proportional to NAs concentration. Hence, NAs concentration of an unknown sample is
determined by comparing the combined absorbance peak height of the sample to those in a
calibration curve obtained from the FTIR analyses of solutions prepared from commercially
available NAs [17].

13
Due to the robustness and the cost-effectiveness of the FTIR technique, it has been utilized
extensively in the oil sands industry and in the scientific community [17, 66, 77]. However, the
technique has certain limitations. Since the detection method is based on the IR absorbance of all
carboxylic acids in a solution, the technique cannot differentiate between different naphthenic
acid species. In other words, it only measures the total NAs concentration without revealing any
information about the structural composition. For the same reason, the technique cannot
differentiate between classical, oxy- and unconventional naphthenic acids with phenol, thiophene
and pyrrole groups. Recently, the term ‘total acid-extractable organics’ or TAOs has been used to
describe the organic acids detected and quantified by this technique from TPW [26, 70, 86]. The
detection limit of NAs/TAOs for this method is typically around 1 ppm [16].
Gas chromatography coupled with mass spectroscopy (GC-MS) has also been used to quantify
and characterize NAs. This method requires a pre-derivatization step to yield t-butyldimethylsilyl
esters of naphthenic acids, which are then analyzed by GC-MS [16, 17, 31, 45]. The detection
limit of this method has been reported to 0.01 ppm [16]. However, the method assumes complete
derivatization of NAs by derivatizing agent, which may not always be the case.
Several high performance liquid chromatography (HPLC) -based methods have been developed
for quantifying NAs. Yen et al., (2004) developed a HPLC method where NAs are derivatized to
2-nitrophenylhydrazides. The derivatized compounds are detected using a UV-Vis diode array
detector. The detection limit of this method was 5 ppm [81]. Complete derivatization is also
assumed in this method.
For some areas of research and analyses, it is not sufficient to only determine the total
naphthenic acids concentration but also important to know the molecular structures and

14
compositions of NAs in a mixture (i.e., toxicological research). For the latter purpose, mass
spectroscopy (MS) and its derivatives provide the best information [17]. Recent technological
advances allow for the usage of sophisticated tools such as HPLC coupled with high-resolution
mass spectrometer (HRMS) or tandem mass spectrometer (i.e., quadruple time-of-flight MS) for
compositional analyses of NAs [8, 28]. However, these instruments can often be very expensive
and difficult to use, and consequently unsuitable for every day laboratorial use.
For determining the total concentration of NAs/TAOs or the concentration of a single (surrogate)
NA in a solution, the FTIR method is still one of the most common and robust analytical
techniques.
2.1.6 Remediation Techniques
Effective remediation of naphthenic acids is vital to the reclamation efforts of oil sands tailings
ponds. Biodegradation, photocatalytic degradation, ozonation, nanofiltration, sequestration using
cyclodextrin-based polymers and adsorption by various media are some of the techniques
investigated and reported in the literature for NAs remediation from TPW [17, 20, 40, 47, 48,
70].
Microbial degradation of NAs typically produces CO2, fragmented organic compounds and water
[40]. However, the extent of degradation is dependent on the molecular weight and the chemical
structure of the compounds. Scott et al., (2005) reported that the low molecular weight NAs are
more susceptible to biodegradation than high molecular weight NAs. It has also been suggested
that the rate of biodegradation is primarily affected by the chemical structures of NAs, where the
more recalcitrant NAs are the ones with higher degrees of aliphatic chains, methyl-substituted

15
cycloalkane rings and increased cyclicity [40]. The effectiveness of photocatalytic degradation is
also limited due to its dependency on the molecular weights and cyclicity of the compounds [20,
40]. The ozonation of naphthenic acids does not lead to complete degradation, and consequently
results in formation of several by-products such as aldehydes, ketones and peroxides and other
carboxylic constituents [40]. Some of these by-products may even be more hazardous than the
original compounds.
Adsorption is one of the most effective methods for remediating wastewater due to its high
contaminant removal efficiency [4]. Persistent contaminants can be fully removed, rather than
breaking down into smaller and potentially more harmful fragments as is with the remediation
techniques described above [5]. A few studies have investigated the effectiveness of organic rich
soil, zeolites, raw petroleum coke, cyclodextrin-based polymers and activated carbon as
adsorbents for NAs removal [36, 47, 48, 57, 70, 85, 86]. One of the main advantages of using
activated carbon is that its physical and chemical properties can be tailored to target specific
species of contaminant; thereby increasing the overall adsorption affinity of the adsorbent for the
contaminants. Mohamed et al., (2010) reported that the sorption capacity of granular activated
carbon (GAC) for NAs is much greater than polymeric sorbents. Wu et al., (2001) demonstrated
enhanced adsorption of carboxylic acid-based surfactants when using activated carbon.
Nonetheless, the full potential of activated carbon for oil sands naphthenic acids removal has yet
to be investigated and exploited thoroughly.

16
2.2 Activated Carbon (AC)
The term “activated carbon” refers to a wide range of processed amorphous carbonaceous
materials with a highly developed porosity and an extended internal specific surface area (SSA).
The latter typically ranges between 300-3000 m2/g [4, 6, 7]. AC is generally obtained by
combustion, partial combustion, or thermal decomposition of a variety of organic precursor
materials with high carbon content (i.e., coconut shells, wood, peat, and bituminous coal) [7, 71].
The resulting porous carbon materials have a wide range of applications. Activated carbon is
commonly used as an adsorbent in industrial and environmental applications. Current research
has demonstrated the potential for acting as a catalyst support medium in catalytic processes or
as an energy storage device in electrochemical double layer capacitors (EDLC) as well [4].
2.2.1 Applications of an Adsorbent
Historically, activated carbon has been used for drinking water prolongation and odour removal
purposes [6]. The First World War marks the starting point of activated carbon development and
production as an adsorbent for aqueous and vapour phase treatments [71]. Presently, activated
carbon is extensively used as an adsorbent in industrial and environmental remediation
applications such as removal of pollutants from groundwater and industrial wastewater,
hazardous gas scrubbing from industrial waste streams, and volatile organic compound capture
from contaminated sites [4, 6, 7, 49, 71]. Due to its high specific surface area (SSA), activated
carbon has high adsorption capacity for a wide range of adsorbates [6, 7].
Liquid phase contaminant removal by activated carbon adsorption has gained much attention
over the last few decades. Numerous publications can be found in the literature involving heavy

17
metal immobilization and subsequent removal by activated carbon [1, 2, 43, 61]. Ramana et al.,
(2010) reported effective removal of Cu2+
, Cd2+
, Pb2+
, and Zn2+
ions from aqueous solution using
activated carbon derived from agricultural solid waste. Activated carbon has also been used to
remove polycyclic aromatic hydrocarbons (PAHs) from wastewater. Valderrama et al., (2008)
and Yuan et al., (2010) are among some of the researchers who investigated PAHs adsorption by
activated carbon.
Studies have shown that activated carbon is also effective in removing surfactants from aqueous
phase [75, 78]. Activated carbon has high adsorption affinity for surfactants due to the strong
hydrophobic interaction between the AC surface and the non-polar carbon chain of the
surfactants [75]. Both Pendleton et al., (2001) and Ihara (1992) demonstrated effective removal
of anionic surfactants by activated carbon adsorption.
2.2.2 Precursor Materials for Activated Carbon Production
Since activated carbon is non-graphitic in structure, almost any carbonaceous material can be
converted into activated carbon [6]. However, it is generally desirable to use inexpensive and
abundant raw materials with high carbon content and low inorganic content for the production of
activated carbon [6, 7]. Inorganic materials are non-porous, and their presence reduces the total
SSA and the adsorption capacity of an adsorbent [6]. Readily available materials such as wood,
lignocellulosic biomass, peat, lignite, coconut shells, and different grades of bituminous coals
have been among some of the most commonly used AC precursors [4, 7]. Due to the increase in
activated carbon production, there is a high demand for inexpensive and abundant raw materials.
Hence, alternative sources of activated carbon have been explored in recent years. Oil sands

18
petroleum coke, a carbonaceous waste-product of the oil sands upgrading process, has gained
much attention as an activated carbon precursor [4, 49, 70, 71, 72, 85, 86].
2.2.2.1 Oil Sands Petroleum Coke
Oil sands petroleum coke is a well-known carbonaceous by-product of the bitumen upgrading
process [49]. Heavy petroleum residues must be broken down or ‘cracked’ into smaller units to
produce synthetic crude oil. The carbon rejection process utilized to produce lighter petroleum
fractions is known as ‘coking’ [71]. Petroleum coke (PC) is typically produced through either
dealkylation or dehydrogenation reactions during thermal cracking [71]. Coke composition often
varies because the hydrocarbon composition of petroleum itself is variable depending on
geographical location of the oilfield. Operational parameters of the coking process also affect the
morphology and the chemical/structural composition of petroleum coke. Oil sands companies
often use different coking techniques [71]. Suncor Energy’s coking process produces ‘delayed’
petroleum coke, which has a sponge-like structure. In contrast, Syncrude’s coke is known as
‘fluid’ coke, and it has highly-graphitized layers and often described to have an onion-like
structure [4, 49, 71].
Despite the variability in the production process, petroleum coke typically has a high carbon
content of 80-85 wt% [6]. It cannot be used as a combustible fuel source like conventional coal
due to its high sulphur content (~6-7%) [71]. Small (2011) estimated a cumulative annual
production of over 5 million tonnes of petroleum coke by Suncor Energy Inc. and Syncrude
Canada Ltd. Many years of stockpiling has led to substantial accumulation of the coke product at
the upgrading facilities.
19
Current research has indicated that oil sands petroleum coke can be readily utilized as a
precursor for activated carbon production [4, 13, 19, 49, 50, 68, 70, 71, 72, 82]. Activated carbon
with high specific surface area (SSA) is achievable through both the physical and chemical
activation of petroleum coke. With respect to the former, Awoyemi (2011) and Small (2012)
prepared activated carbon (SSA~500 m2/g) from oil sands petroleum coke using carbon dioxide
and steam-based physical activation methods and used them for liquid phase treatments. Yuan et
al., (2010) reported effective removal of polycyclic aromatic hydrocarbons using KOH-activated
petroleum coke (SSA~1900 m2/g) from aqueous phase. Bratu (2008) and Morris (2012) studied
gas-phase mercury vapour removal using petroleum coke-derived activated carbon.
2.2.3 Activated Carbon Production Processes
Activated carbon is prepared by altering the internal structure of precursor materials to develop
high porosity, which results in high specific surface area. According to Bansal (2005), the
preparation of activated carbon involves two basic steps: (1) thermal carbonization of raw
material in inert atmosphere and (2) activation of carbonized char by an activating agent. During
the carbonization step, non-carbon elements such as oxygen, nitrogen, hydrogen and sulphur are
removed from the precursor material as gaseous products due to pyrolytic decomposition [6, 7].
The remaining carbon atoms then randomly reorient themselves into stacks of cross-linked
aromatic sheets, consequently forming irregular interstices or pores between the sheets [4, 49,
71]. These pores are often blocked or filled by decomposed carbon products, resulting in low
surface area. Hence, an activation process is utilized to remove the disorganized carbons and
further extend and develop the porous structure [7, 71]. Consequently, the choice of activating
agent affects the total pore volume and the pore size distribution of activated carbon. Sing et al.,

20
(1985) of IUPAC divided the pore network of activated carbon into three distinct categories:
micropores (pore diameter < 2 nm), mesopores (2 nm <pore diameter < 50 nm), and macropores
(pore diameter > 50 nm). Factors influencing the porosity of activated carbon will be discussed
later in section 2.2.3.4.
Although there are many ways of producing activated carbon, and hundreds of publications can
be found in the literature, all activation methods can be clearly defined into two types: physical
and chemical activation [6].
2.2.3.1 Physical Activation
In physical activation, the first step is the thermal carbonization of raw material to remove
volatile components and produce a char rich in carbon [6]. During the second step (activation),
the pores created during carbonization are further developed by selective oxidation of the
carbonized products at high temperatures (~800-1000 oC) [4]. The activating agents (typically
oxidizing gases) react with the most reactive atoms in the carbon skeleton, removing some of the
internal surface mass from the solid and opening up previously blocked pores [6]. This leads to
the development of intricate pore structure and high SSA. In laboratorial settings, the two steps
(carbonization and activation) are often carried out simultaneously in heating furnace or
temperature-controlled fixed-bed reactors [4, 49]. The most commonly used activating agents for
physical activation are steam, carbon dioxide, and air. The rate of reactivity of the reagents can
be summarized in the following trend: O2> H2O > CO2 [71]. Despite its high reactivity, oxygen
is not generally used for activation. This is because physical activation with oxygen is an
exothermic reaction, and the carbon burn-off is often difficult to control [71]. Steam and carbon

21
dioxide activation both follow endothermic gasification reactions. The chemical reactions and
their respective heat of reactions are listed below [6]-
Steam Activation: C(s) + H2O(g) H2(g) + CO(g) ΔH = + 132 kJ mol-1
(2.1)
CO2 Activation: C(s) + CO2(g) 2CO(g) ΔH = + 159 kJ mol-1
(2.2)
Selection of an activating agent depends on the final application of activated carbon. Both Small
(2011) and Pastor-Villegas et al., (2001) found that steam-activated carbon generally displays
higher total pore volume and SSA than CO2-activated carbon. Steam activation typically
produces a homogenous pore size distribution, developing mostly micropores [6]. Micropores
are major contributors of total pore volume and specific surface area. CO2 activation can produce
an appreciable amount of mesopores as well as micropores [54]. Water molecules are a lot
smaller in dimension than carbon dioxide molecules. Hence, it is much easier for the former to
diffuse into the carbon pore structure, which leads to the development of more micropores [54].
2.2.3.2 Chemical Activation
Chemical activation is typically carried out in a single carbonization step [6]. The precursor
material is initially impregnated with a concentrated dehydrating reagent (activating agent) and
then heated up to a temperature between 500-800 oC in inert atmosphere for carbonization [6,
71]. Some of common activating agents for chemical activation include zinc chloride (ZnCl2),
phosphoric acid (H3PO4), potassium hydroxide (KOH), sulphuric acid (H2SO4), and ferric
chloride (FeCl3) [6, 71]. The activating agents dehydrate the raw material. Heat treatment of the
impregnated material results in charring and aromatization of the carbon structure [32]. Any

22
remaining activating agents are removed by water or acid washing [71]. According to Hsu and
Teng (2000), chemical activation leads to the creation of activated carbon structure with higher
SSA than physical activation.
Some activating agents are known to produce a certain type of pore size distribution. For
example, it has been suggested by Yang (2003) that KOH activation generates mostly
microporous activated carbon, where ZnCl2 primarily produces mesoporous activated carbon.
The effectiveness of chemical activation is dependent on the impregnation ratio (ratio of
activating agent to raw material) as well as the carbonization and activation temperature [71].
Chemical activation requires a lower temperature range (~500-800 oC) and generally results in
higher SSA in comparison to physical activation. However, the corrosive nature of the chemical
activating agents has negative environmental impacts and often limits its application [4].
2.2.3.3 Post-modification of Activated Carbon
Activated carbon is often post-modified using various methods to produce desired functionalities
for its final application [14]. Although post-modification influences the physical properties of
activated carbon to an extent, the treatments are generally utilized to introduce different chemical
functional groups on the carbon surface. Presence of certain surface functional groups (SFGs) on
activated carbon can enhance the adsorption affinity and capacity for corresponding groups of
adsorbates.
Selection of post-treatment methods depends on the final application of activated carbon.
Przepiorski et al., (2003) reported that post-modified activated carbon with increased basicity
enhances the adsorption of acidic pollutants. Introducing nitrogen-based surface functional

23
groups onto the surface of activated carbon can increase its basicity [58]. One of the common
post-treatment methods used for this purpose is thermal treatment of activated carbon in gaseous
ammonia environment at a temperature between (500-800 oC) [44, 58]. This treatment typically
introduces nitrogen-based SFGs such as –NH2, –CN, pyridinic, pyrrolic, and quaternary nitrogen
on the carbon surface [58].
Post-oxidation of activated carbon is another common post-treatment method. In contrast to the
ammonia treatment, post-oxidation introduces acidic surface functional groups such as lactonic,
phenolic, carboxylic, and anhydride groups [11]. Awoyemi (2011) studied the effect of post-
oxidized activated carbon on aqueous phase polycyclic aromatic hydrocarbon (PAH) adsorption.
Post-oxidation is typically carried out by mild heat treatment of activated carbon in oxygen-rich
environment [4, 33].
2.2.3.4 Factors Influencing the Physical and Chemical Properties of AC
Aside from the precursor material and the activation method (physical vs. chemical), several
other factors such as the activating agent, the activation temperature, the rate of heating, and the
reaction time also affect the physical and the chemical properties of activated carbon. Generally,
the specific surface area (SSA) increases with activation temperature and the reaction time, but at
the cost of product yield [4]. However, too high of a reaction temperature can lead to burn-off
between the walls of adjacent micropores, thereby increasing number of meso- and macropores
and reducing the total SSA [71]. During a SO2-activation of petroleum coke, Morris (2012)
found an optimal reaction temperature that yields the maximum SSA. The rate of heating also
affects the physical properties of activated carbon. According to Bansal et al., (1988), precursor
materials undergo a softening period before it begins to harden and shrink. A slow heating rate
24
results in a denser char, but at the cost of limited volatilization [7]. A slow heating rate is also
known to favour the formation of micropores [71].
Controlling the pore size distribution of activated carbon can be important for its final
application. Template methods using zeolites or silica are often used to control the pore size
distribution [4]. These methods usually involve carbonization of raw material in the nano-space
of a template and subsequent liberation of the resultant activated carbon from the template [4].
Fuertes et al., (2004) used meso-structure silica template to synthesize mesoporous activated
carbon.
Chemical properties such as the surface functional group (SFG) content and the point of zero
charge (pzc) are primarily dependent on the nature of activating agents. For example, physical
activation with sulphur dioxide (SO2) leads to an increase of sulphur-based SFGs [49]. Post-
modification with different reagents could also lead to alternation of the surface chemical
properties. Ammonia-treated activated carbon exhibits alkaline characteristics, whereas post-
oxidized activated carbon has acidic characteristics [33, 58].
25
CHAPTER 3 THEORETICAL OVERVIEW OF ADSORPTION
Adsorption is a process by which atoms, ion, biomolecules or molecules of gas, liquid or
dissolved solids adhere to the surface of a liquid or solid [4]. The species adsorbing to a surface
are known as adsorbates, while surface species are known as adsorbents. The nature of an
adsorption process can be categorized into two types: physisorption (physical adsorption) and
chemisorption (chemical adsorption).
3.1 Physisorption vs. Chemisorption
The distinction between the adsorption processes arises from different forces of attraction that
exist between the adsorbate and the adsorbent surface [1]. In physisorption, the forces involved
are intermolecular (i.e., van der Waals forces and hydrogen bonding), and there is no significant
change in the electronic orbital patterns of the adsorbate and the adsorbent species [3]. The
amount of energy released from physical adsorption is of the order of the enthalpy of
condensation. Atkins and Paula (2002) reported the enthalpy changes of physisorption process to
be ~20 kJ/mol or less. In contrast, chemisorption involves the formation of chemical (covalent)
bonds between the adsorbate and the adsorbent surface, the same kind as those operating in
formation of chemical compounds [4]. Consequently, the energy of adsorption is much higher
than that of physisorption, ranging between 40-200 kJ/mol [3, 12, 64]. In physisorption, the
adsorbed species are chemically identical with those in the fluid phase; hence the process is said
to be reversible. However, in chemisorption, the chemical nature of the adsorbate may be altered,
and the adsorption process may not be reversible. According to Everett (1971), in physisorption,
molecules can adsorb in excess to adsorbates that are in direct contact with the surface. This

26
results in multilayer adsorption. In contrast, the chemically-bonded adsorbates in chemisorption
generally form a uniform monolayer [21].
3.2 Adsorption Kinetics
Mathematical expressions or models are often formulated and utilized to understand and predict
the kinetics of an adsorption process. Numerous empirical and mechanistic kinetic models exist
in literature for liquid-solid adsorption system. Generally, empirical models are not derived from
first principles. Unlike mechanistic models, they do not offer very much insight into the
mechanism of adsorption. Nonetheless, these models provide a good understanding of adsorption
kinetics from a macroscopic perspective, and the model parameters (rate constants) can be used
for designing adsorption process. Three most commonly used empirical models cited in literature
for liquid-solid adsorption system are described below.
3.2.1 Empirical Models
3.2.1.1 Pseudo-first Order Model
The pseudo-first order model of Lagergren is described by the following equation [29, 59, 79,
83]-
where k1 is the pseudo-first order rate constant (min-1
); qe and qt are the amount of solute
adsorbed at equilibrium and at time, t, respectively (mg/g). Integrating equation 3.1 for the
boundary conditions t = 0 to t = t and qt = 0 to qt = qt yields the following expression-
27
The rate constant, k1 and the calculated qe value can be obtained by the linear regression of log
(qe – qt) vs. time. Ho and Mckay (1999) analyzed kinetic data from various adsorption studies
and found that the pseudo-first order model mostly applicable for the initial stage of the
adsorption but not whole range of reaction times. This phenomenon was also observed by Zhang
et al., (2010).
3.2.1.2 Pseudo-second Order Model
Yalcin (2004) and Zhang (2010) used the pseudo-second order model for surfactant adsorption.
According to Ho and McKay (1999), the differential form of the model can be expressed by the
following equation-
where k2 is the pseudo-second order rate constant (g/mg min). Integrating equation 3.3 with the
same boundary conditions as described for the pseudo-first order model yields-
The pseudo second order rate constant, k2 and the amount of solute adsorbed at equilibrium, qe
can obtained by the linear regression of equation 3.4. Taking the limit as time approaches zero,
an additional parameter, ho, is defined as the initial rate of adsorption (mg/g min) [29, 39]. ho is
defined by the following expression [29]-
28
3.2.1.3 Elovich Model
Elovich model is another empirical model expressed by the Elovich equation [35]-
where α is the initial adsorption rate (mg/g min) and β is the desorption constant. Equation 3.6
can be simplified by assuming αβt >> t, and by applying the boundary conditions qt = 0 at t = 0
and qt = qt at t = t the equation becomes-
Elovich constants α and β can be obtained by the linear regression of equation 3.7.
3.2.2 Mechanistic Models
It is important to understand the adsorption mechanism of a process in order to identify the rate-
limiting step. The mechanism of a solid-liquid adsorption process has been generally described
by the three following consecutive steps [59, 79]-
1) Film or external diffusion: represents the transport of the adsorbate molecules from the
bulk liquid phase to the exterior surface of the adsorbent.
2) Internal pore diffusion: involves the transport of the adsorbate molecules from the
external surface to the interior pore structure of the adsorbent.
29
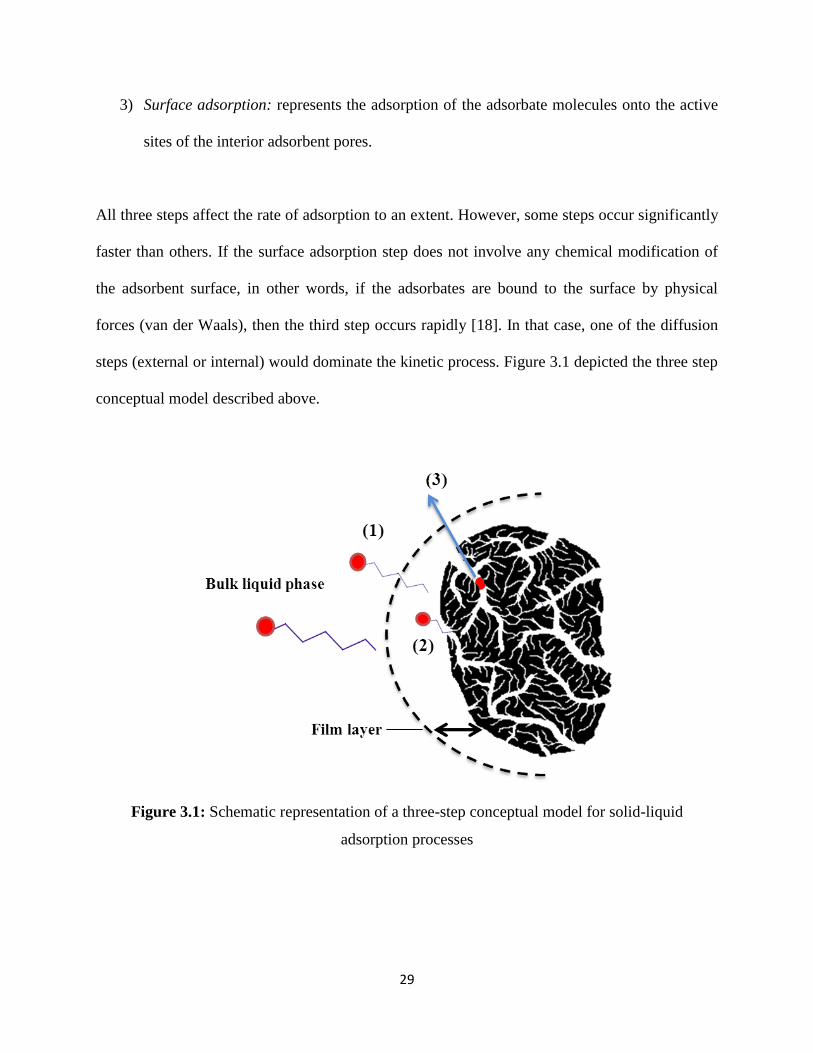
3) Surface adsorption: represents the adsorption of the adsorbate molecules onto the active
sites of the interior adsorbent pores.
All three steps affect the rate of adsorption to an extent. However, some steps occur significantly
faster than others. If the surface adsorption step does not involve any chemical modification of
the adsorbent surface, in other words, if the adsorbates are bound to the surface by physical
forces (van der Waals), then the third step occurs rapidly [18]. In that case, one of the diffusion
steps (external or internal) would dominate the kinetic process. Figure 3.1 depicted the three step
conceptual model described above.
Figure 3.1: Schematic representation of a three-step conceptual model for solid-liquid
adsorption processes

30
3.2.2.1 Weber-Morris Intraparticle Diffusion Model
The Weber-Morris (W-M) intraparticle diffusion model is often used to determine the
intraparticle or internal diffusional rate constant of an adsorption process. The model is described
by the following equation [35, 59, 79]-
where qt is the amount of solute adsorbed (mg/g) at time, t; kid is the intraparticle diffusion rate
constant (mg/g/min0.5
) and C (mg/g) is a constant that reflects the extent of boundary layer
effects [79]. The model parameters are obtained by plotting qt vs. t0.5
. If a process is entirely
internal diffusion-controlled, then the y-intercept passes through the origin [59, 79]. However,
these plots often tend to be double-natured, consisting an initial curved portion and a final linear
portion. The initial curved portion represents the effect of external or film diffusion whereas the
final linear portion reflects the effect of internal pore diffusion [79]. The rate constant kid is the
slope of the linear portion of a W-M plot. The constant, C, is determined from the y-intercept of
the linear portion of the plot, and its magnitude reflects the boundary (film) layer effects [59, 79].
3.3 Equilibrium Adsorption Isotherms
In an adsorption process, there is a defined distribution of adsorbates between the fluid phase and
the adsorbent surface at equilibrium. An adsorption isotherm is a functional expression relating
the amount of solute adsorbed on an adsorbent at equilibrium, qe (mg/g), to the equilibrium
solute concentration in the fluid phase, Ce (mg/L), at a fixed temperature [4]. In other words,
equilibrium adsorption can be described by mathematical isotherm equations or models whose

31
parameters express the surface properties and affinity of an adsorbent at a fixed temperature [3].
Adsorption isotherms are often used to compare the adsorption capacities of different adsorbents
for a particular adsorbate species. Experimentally, qe and Ce values for an isotherm can be
obtained in two ways: (1) by adding a fixed adsorbent dosage to a series of solutions of varied
initial concentrations, or (2) by fixing the initial adsorbate concentration for a series of solutions
while varying the adsorbent dosage to the solutions. The following sections describe some of the
most commonly used and cited isotherm models in literature [3, 59, 79, 83].
3.3.1 Langmuir Model
The Langmuir model is a theoretical equilibrium isotherm model, initially developed for relating
the amount of gas adsorbed on a surface to the pressure of the gas. However, due to its simplicity
and its fundamental concept, the model has been widely applied for liquid phase adsorption [3,
83]. The Langmuir model is generally expressed by the following equation-
where qe is the amount of adsorbed solute on adsorbent surface at equilibrium (mg/g); Ce is the
equilibrium solute concentration in the solution phase (mg/L); qm is the Langmuir adsorption
capacity (mg/g); and kl is the affinity coefficient (L/mg) related to the energy of adsorption. The
key assumptions underlying the Langmuir isotherm model are listed below [3, 4]:
(1) Energetically equivalent active sites – the energy of adsorption has a homogeneous
distribution for all active sites,
(2) Monolayer coverage – each active site can only hold one adsorbate molecule,

32
(3) No interaction between adsorbed molecules.
The Langmuir equation is said to have a fundamental thermodynamic basis as it effectively
reduces to Henry’s Law at dilute adsorbate concentrations [3]. The linearized form of equation
3.9 is listed in Table 3-1.
3.3.2 Freundlich Model
The Freundlich model, an empirical isotherm model, is expressed by the following equation-
where kF is the Freundlich constant related to the adsorption capacity [(mg/g)(L/mg)1/n
] and 1/n
is reflects the intensity of adsorption. The model was derived by assuming that the adsorption
sites have an exponentially decaying energy distribution [3]. In other words, the model assumes
that the adsorbent surface is energetically heterogeneous. This assumption suggests a multilayer
adsorption process (i.e., free adsorbates can stack themselves onto adsorbate-adsorbent
monolayer). Many studies have proven the Freundlich model to be a good fit for experimental
data for rough (heterogeneous) surfaces [4, 59]. Unlike the Langmuir model, the Freundlich
model does not reduce to Henry’s Law at dilute solute concentrations. Consequently, it is
criticized for lacking a fundamental thermodynamics [3].

33
3.3.3 Temkin Model
According to the Temkin model, the heat of adsorption decays linearly rather than
logarithmically as implied by the Freundlich model. The Temkin isotherm is expressed as [3, 4]-
where RT/bT = B, which is the Temkin constant related to the heat of adsorption (J/mol); AT is
the equilibrium binding constant corresponding to the maximum binding energy (L/g); R is the
universal gas constant (8.3145 J/mol K) and T is the absolute solution temperature (K). The
linearized form of this isotherm equation is listed in Table 3-1.
Table 3-1: Linearized forms of adsorption isotherm models
Isotherm Models Linearized Isotherm Equations
Langmuir Model
Freundlich Model
Temkin Model

34
CHAPTER 4 EXPERIMENTAL METHODOLOGY
4.1 Preparation of Activated Carbon
The activated carbons used in this study were all synthesized from ‘delayed’ petroleum coke
provided by Suncor Energy. The nomenclature and brief descriptions of the adsorbents are listed
in Table 4-1. Some of the activation procedures and post-treatments were carried out by other
researchers from the Green Technology Group (U of Toronto). These adsorbents are denoted by
the (*) symbol in Table 4-1. The experimental details of the activation and the post-treatment
procedures are thoroughly discussed in the later sub-sections.
Table 4-1: Adsorbent nomenclature
Adsorbent Precursor
Material Description
CO2-ADC-6h Delayed coke CO2-activated delayed coke (reaction time = 6 hrs)
Steam-ADC-3h Delayed coke Steam-activated delayed coke
CO2-ADC-9h * Delayed coke CO2-activated delayed coke (reaction time = 9 hrs)
CO2-ADC-9h-pAir * Delayed coke Post-treated CO2-ADC-9h with air
CO2-ADC-9h-pO2 * Delayed coke Post-treated CO2-ADC-9h with humidified-oxygen
CO2-ADC-9h-pNH3 * Delayed coke Post-treated CO2-ADC-9h with gaseous ammonia
CAC Charcoal Commercially available steam-activated carbon
(Calgon - BPL)
* Adsorbents prepared by other researchers from the Green Technology Group (U of Toronto)

35
4.1.1 Materials and Instruments
The materials and the instruments used for activated carbon production are listed in Table 4-2
and 4-3, respectively.
Table 4-2: Materials used in activated carbon production
Materials Specification Supplier
N2 (gas) 99.99% BOC Gas Ltd.
CO2 (gas) 99.99% BOC Gas Ltd.
O2 (gas) 99.99% BOC Gas Ltd.
NH3 (gas) 99.99% BOC Gas Ltd.
Delayed Petroleum Coke Particle size range: 106-150 µm Suncor Energy Inc.
Table 4-3: Instruments and equipment used in activated carbon production
Instrument Specification Manufacturer
Mass flow controller GFC17 Aalborg
Quartz tube reactor 3/4 ” O.D MIE machine shop, U of Toronto
Split tube furnace VST 12/600 Carbolite
Drying oven 615 F Fisher Scientific
Sieves American standard testing VWR
Weighing balance 1702, analytical balance Sartorius
Muffle furnace M-62700 Barnstead Thermolyne
36
4.1.2. Physical Activation of Delayed Petroleum Coke
4.1.2.1 CO2 Activation
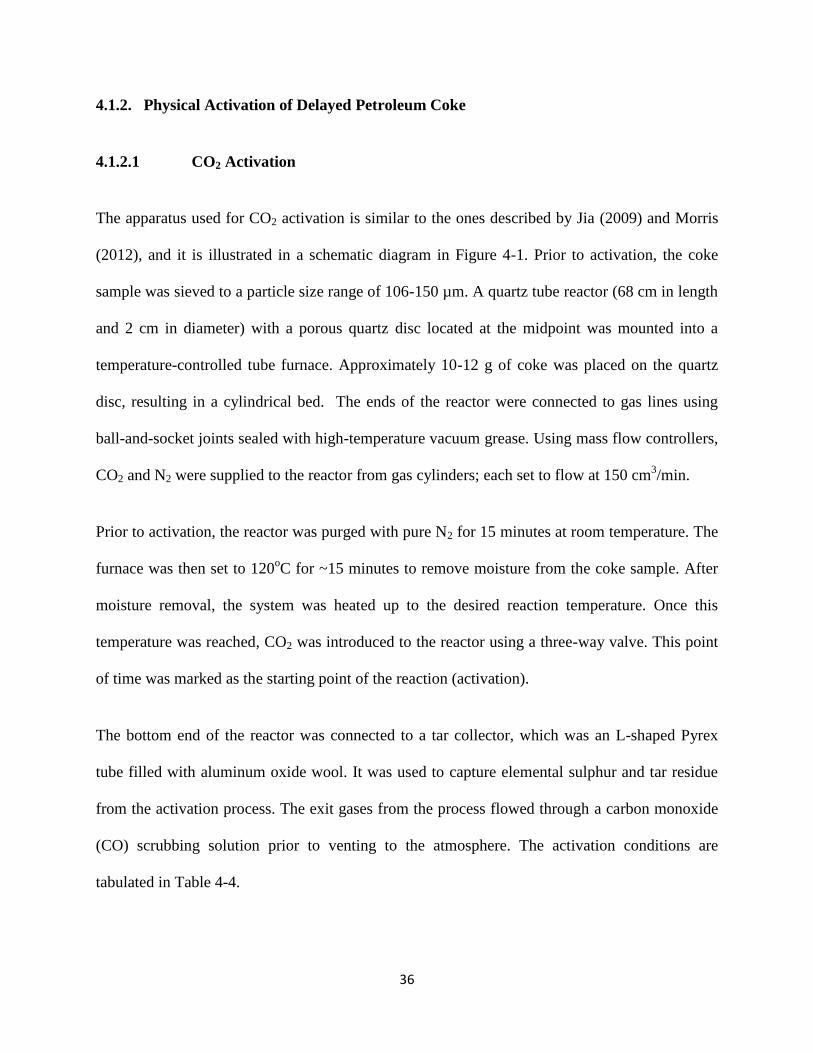
The apparatus used for CO2 activation is similar to the ones described by Jia (2009) and Morris
(2012), and it is illustrated in a schematic diagram in Figure 4-1. Prior to activation, the coke
sample was sieved to a particle size range of 106-150 µm. A quartz tube reactor (68 cm in length
and 2 cm in diameter) with a porous quartz disc located at the midpoint was mounted into a
temperature-controlled tube furnace. Approximately 10-12 g of coke was placed on the quartz
disc, resulting in a cylindrical bed. The ends of the reactor were connected to gas lines using
ball-and-socket joints sealed with high-temperature vacuum grease. Using mass flow controllers,
CO2 and N2 were supplied to the reactor from gas cylinders; each set to flow at 150 cm3/min.
Prior to activation, the reactor was purged with pure N2 for 15 minutes at room temperature. The
furnace was then set to 120oC for ~15 minutes to remove moisture from the coke sample. After
moisture removal, the system was heated up to the desired reaction temperature. Once this
temperature was reached, CO2 was introduced to the reactor using a three-way valve. This point
of time was marked as the starting point of the reaction (activation).
The bottom end of the reactor was connected to a tar collector, which was an L-shaped Pyrex
tube filled with aluminum oxide wool. It was used to capture elemental sulphur and tar residue
from the activation process. The exit gases from the process flowed through a carbon monoxide
(CO) scrubbing solution prior to venting to the atmosphere. The activation conditions are
tabulated in Table 4-4.

37
Figure 4-1: Schematic diagram of the experimental apparatus used for CO2 activation
4.1.2.2 Steam Activation
The experimental set-up for steam activation (Figure 4-2) was similar to the one for CO2
activation. In steam activation, a steam-generating apparatus replaced the CO2 gas tank. Steam
was generated using a hot plate and an Erlenmeyer flask filled with distilled water. Glass beads
were placed in the flask for effective and steady production of steam. The flask was connected to
the reactor using a stainless steel pipe. The pipe was carefully wrapped with heating tape to
prevent the condensation of steam. A three-way valve and a steam by-pass valve were used to
control the flow of steam into the reactor. Similar to CO2 activation, the system was first purged
with N2, and moisture was removed from the coke sample prior to introducing steam.

38
Figure 4-2: Schematic diagram of the experimental apparatus used for steam activation
Steam was introduced into the reactor once the temperature and the steam production had
stabilized. Due to the presence of sulphur in delayed coke, a small amount of hydrogen sulphide
(H2S) gas was produced during the activation. A sodium hydroxide solution was used to scrub
H2S. The off-gases passed through a carbon monoxide scrubber subsequently before venting.
The treatment conditions for steam activation are also summarized in Table 4-4.

39
Table 4-4: Treatment conditions for physical activation
Adsorbent
Initial
particle size
range, (µm)
Temperature,
(oC)
Reaction
Time, (hr)
Gaseous
Environment
Flow Rate,
(cm3/min)
CO2-ADC-6h 106-150 900 6 100% CO2 150
Steam-ADC 106-150 850 3 100% Steam -
CO2-ADC-9h 106-150 900 9 100% CO2 150
4.1.3 Post-treatment of Petroleum Coke-derived Activated Carbon
4.1.3.1 Post-oxidation
The petroleum coke-derived activated carbons were further modified by post-treatments. Post-
oxidative treatments were carried out in two different gaseous environments: humidified air and
humidified oxygen. For air post-oxidation, the activated carbon sample was thinly spread on a
watch glass and placed inside a muffle furnace, which contained a beaker of distilled water for
the purpose of humidification. The furnace door was kept open to allow air diffusion in and out
of the oxidation chamber. The beaker was refilled frequently to avoid complete evaporation of
water.
As described by Huynh (2012), post-oxidation with humidified-oxygen was carried out using an
experimental set-up similar to that of CO2 activation (Figure 4-3). Oxygen was humidified by
passing through an Erlenmeyer flask filled with distilled water. Since the reaction between
oxygen and activated carbon is an exothermic one, too high of a reaction temperature would

40
completely combust the carbon sample. Hence, the reaction temperature and the heating rate
were carefully controlled.
Figure 4-3: Schematic diagram of the post-oxidation process with humidified-oxygen
A thermocouple placed directly inside the reactor was used to monitor the temperature. The
following heating steps were executed in sequence for this treatment:
Heating the reactor to 230 oC at a rate 5
oC/min and maintaining for 40 minutes
Increasing temperature to 235 oC at a rate 0.5
oC/min and maintaining for 40 minutes
Increasing temperature to 240 oC at a rate 0.5
oC/min and maintaining for 135 minutes
Increasing temperature to 245 oC at a rate 0.5
oC/min and maintaining for 135 minutes
The conditions for both post-oxidative treatments are summarized in Table 4-5.

41
4.1.3.2 Post-treatment with Gaseous Ammonia
The CO2-ADC-9h sample was post-treated with gaseous ammonia to introduce nitrogen-based
basic surface functional groups. This process involved thermal treatment of the activated carbon
sample in an ammonia-rich nitrogen environment. The experimental apparatus was similar to
that of the CO2 activation. Here, NH3 replaced the CO2 gas tank, and additional scrubbing
solutions were utilized for scrubbing outlet gases. The reactor temperature was elevated to 850oC
with a N2 flow rate of 80 cm3/min. Once the temperature had stabilized, ammonia was
introduced to the system. During the activation process, a 4:1 ratio of nitrogen to ammonia flow
rate was maintained. The detailed experimental conditions are summarized in Table 4-5. In
addition to the CO scrubber, a hydrogen cyanide (HCN) and an ammonia (NH3) scrubber were
placed at the outlet gas stream for safety reasons.
Table 4-5: Experimental conditions for the post-treatments of activated carbon
Adsorbent Temperature,
(oC)
Reaction
Time, (hr)
Gaseous
Environment
Flow Rate,
(cm3/min)
CO2-ADC-9h-pAir 250 12 Air (~21% O2) -
CO2-ADC-9h-pO2 240-260 ~6 97% O2
+3% H2O 130-150
CO2-ADC-9h-pNH3 850 2 20% NH3
+80% N2 100

42
4.2 Characterization of Activated Carbon
4.2.1 Materials and Instruments
The materials and instruments used for activated carbon characterization are listed in Table 4-6
and 4-7, respectively.
Table 4-6: Materials used for activated carbon characterization
Materials Specification Supplier
N2 (gas) 99.99% BOC Gas Ltd.
N2 (liquid) - MSE Dept, U of Toronto
KBr Analytical grade BDH Chemicals
NaOH 0.1M Standard solution Sigma-Aldrich
HCl 0.1M Standard solution Sigma-Aldrich
Phenolphthalein indicator 0.375% in methanol Sigma-Aldrich
NaHCO3 Analytical grade Sigma-Aldrich
Na2CO3 Analytical grade ACP Chemicals
Table 4-7: Instruments and equipment used for activated carbon characterization
Instrument Specification Manufacturer
SSA analyzer Autosorb 1 Quantachrome Instruments
Elemental analyzer CE-440 Exeter Analytical
FTIR spectrometer Spectrum-BX; Spectrum-One Perkin Elmer
Water bath shaker SW22 Julabo USA, Inc.
Weighing balance 1702, analytical balance Sartorius
FTIR pellet die - Chemistry Shop, U of Toronto
Plastic syringe Luer-Lok 10 mL BD Falcon
Syringe filter 0.45 µm polysulphone membrane Acrodisc, Pall Corp.

43
4.2.2 Pore Structure Analysis
The pore structure of activated carbon was analyzed by manipulating nitrogen adsorption and
desorption (physisorption) isotherms at 77K using Quantachrome Autosorb-1-C specific surface
area analyzer. These isotherms were constructed by plotting the volume of N2 adsorbed on the
carbon sample against the relative pressure, P/Po (the ratio of the adsorbate pressure in the
sample cell to the vapour pressure of the adsorbate). For this study, the total pore volume and the
pore size distribution were determined by using the quenched solid density functional theory
(QSDFT). The QSDFT method is one of the more accurate techniques for pore size distribution
of amorphous carbons because it takes into account for physical and chemical heterogeneity [51,
60]. All samples were outgassed at 200 oC for 2 hours to remove moisture and volatile organics
prior to analysis. Forty adsorption points between relative pressures (P/Po) of 0.025 and 0.995
were obtained from the instrument and analyzed using QSDFT, which was available as an
analysis kernel within the Quantachrome ASiQwin software. The analysis kernel assumed slit-
shaped micropores (<2 nm) and cylindrical mesopores.
The specific surface area (SSA) was determined using a three-point Brauner-Emmitt-Teller or
BET method, which applies the BET equation on the linear region of an adsorption curve. Some
researchers have reported that BET-derived SSA may not be very accurate for highly
microporous adsorbents [63]. For this reason, the SSA obtained in this study is referred to as
‘apparent’ BET SSA. The theories behind physisorption analytical methods are discussed
thoroughly by Sing et al., (1985) in an IUPAC report.

44
4.2.3 Surface Chemistry Analysis
4.2.3.1 FTIR Analysis
The chemical functional groups on the activated carbon surface were qualitatively analyzed
using Fourier-Transform Infrared (FTIR) spectroscopy. Prior to analysis, the activated carbon
samples were oven-dried at 110 oC for 18 hours to remove moisture content. FTIR spectra were
obtained within a frequency band range of 4000-400 cm-1
. Finely powdered potassium bromide
(KBr) was used as reference in a KBr/carbon pellet with a mass ratio of 200:1. The samples were
purged with dry air for 4 minutes in the instrument chamber prior to the runs. The Spectrum
5.0.1 software was used in conjunction with the instrument. The software parameters were set to
carry out 64 co-added scans at a resolution of 4 cm-1
. All samples except for CO2-ADC-9h-pNH3
were analyzed using a Perkin-Elmer Spectrum-BX spectrometer. CO2-ADC-9h-pNH3 was
analyzed using a Perkin-Elmer Spectrum-One spectrometer.
4.2.3.2 Boehm Titration
The surface oxygen groups of the post-oxidized activated carbon samples were quantitatively
determined by Boehm titration, a method pioneered by HP Boehm (1994). The method works on
the principle that the oxygen-based functional groups on the carbon surface have different
acidities and can be neutralized by bases of different strengths [25, 52]. A series of back
titrations was performed to determine the concentrations of carboxylic, lactonic, and phenolic
functional groups on activated carbon surfaces. The experimental details are described in the
following paragraph.
45
In separate flasks, approximately 300 mg of activated carbon samples were suspended in 25 mL
standard solutions of each NaOH, Na2CO3, and NaHCO3 (0.1 mol/L each). The solutions were
then shaken in a temperature-controlled water bath shaker for 24 hours at 25oC with a shaking
speed of 200 rpm. The spent adsorbents were removed from the solutions by centrifugation and
subsequent filtration. 50 mL of 0.1 mol/L HCl standard solution was added to 15 mL aliquot of
each of the three filtrates. The Na2CO3 and NaHCO3 filtrates were heated for about 5 minutes to
remove dissolved atmospheric CO2. A few (3-4) drops of phenolphthalein indicator solution
were added to each of the three filtrates. 0.1 mol/L of NaOH standard solution was used to titrate
each solution until the colour turned faint pink. The following equation was used to determine
the amount of acidic groups present on the carbon surface [25] –
where [B] and VB are the concentration and the volume of the reaction base mixed with the
carbon sample; nSFG (mmol/g) represents the amount of surface functional group that reacts with
the reaction base during the mixing step; m is the mass of carbon and Va is the volume of aliquot
taken from the filtrates;. [HCl] and VHCl are the concentration and the volume of HCl standard
solution; [NaOH] and VNaOH are the concentration of the volume of NaOH standard solution. The
molar ratio (nHCl/nB) accounts for the calculations of monoprotic vs. diprotic bases.
NaHCO3 can only neutralize carboxylic groups, where Na2CO3 can neutralize both lactonic and
carboxylic groups. NaOH, the strongest base of three, can neutralize all the acidic functional
groups (carboxylic, lactonic, and phenolic groups). Hence, the following set of equations can be
used to determine the surface concentrations of the three acidic functional groups-
46
4.2.3.3 Elemental Analysis
Elemental analysis of the activated carbon samples was carried out using Exeter Analytical CE-
440 elemental analyzer. CO2-ADC-9h and the post-oxidized samples were analyzed for their
elemental oxygen content. CO2-ADC-9h-pNH3 and CO2-ADC-9h were analyzed for their
nitrogen content to evaluate the effect of ammonia post-treatment.
Prior to the analyses, all samples were oven-dried at 110 oC for 12 hours to remove moisture
content. Standard samples were used to calibrate the instrument. The oxygen content was
measured by pyrolysis at high temperature in presence of platinized carbon [22]. Carbon dioxide
formed from the elemental oxygen was detected and measured by high-precision thermal
conductivity detector. For nitrogen analysis, the samples were combusted in pure oxygen at high
temperature. The nitrogen-based combustion products (N oxides and NO2) were then measured
by the detector, yielding the elemental nitrogen content [22]. Triplicate samples of each
adsorbent were run to ensure good precision. Due to the nature of detection, inorganic oxygen
groups were not accounted for. For this reason, the oxygen content determined using this method
is referred to as ‘organic oxygen’. It should be noted that the FTIR and the elemental analysis of
the adsorbents were generously carried out by other researchers from the Green Technology
Group (U of Toronto).
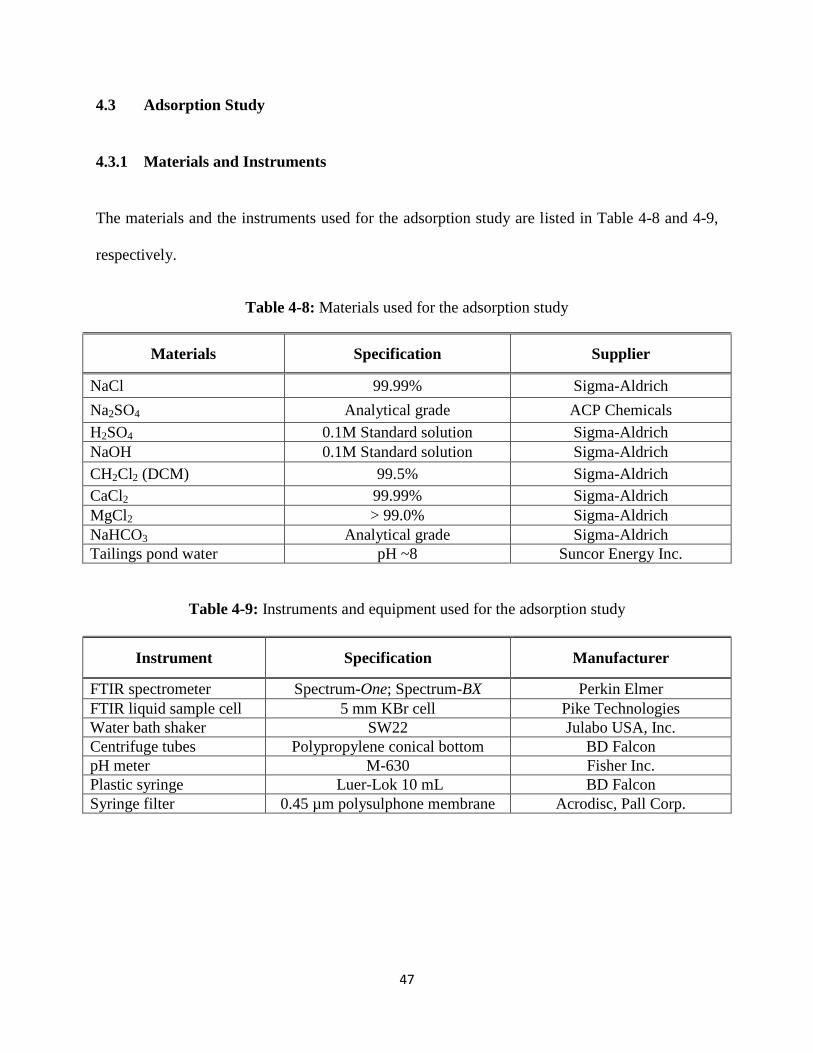
47
4.3 Adsorption Study
4.3.1 Materials and Instruments
The materials and the instruments used for the adsorption study are listed in Table 4-8 and 4-9,
respectively.
Table 4-8: Materials used for the adsorption study
Materials Specification Supplier
NaCl 99.99% Sigma-Aldrich
Na2SO4 Analytical grade ACP Chemicals
H2SO4 0.1M Standard solution Sigma-Aldrich
NaOH 0.1M Standard solution Sigma-Aldrich
CH2Cl2 (DCM) 99.5% Sigma-Aldrich
CaCl2 99.99% Sigma-Aldrich
MgCl2 > 99.0% Sigma-Aldrich
NaHCO3 Analytical grade Sigma-Aldrich
Tailings pond water pH ~8 Suncor Energy Inc.
Table 4-9: Instruments and equipment used for the adsorption study
Instrument Specification Manufacturer
FTIR spectrometer Spectrum-One; Spectrum-BX Perkin Elmer
FTIR liquid sample cell 5 mm KBr cell Pike Technologies
Water bath shaker SW22 Julabo USA, Inc.
Centrifuge tubes Polypropylene conical bottom BD Falcon
pH meter M-630 Fisher Inc.
Plastic syringe Luer-Lok 10 mL BD Falcon
Syringe filter 0.45 µm polysulphone membrane Acrodisc, Pall Corp.
48
4.3.2 Model Naphthenic Acid
A single-ring model naphthenic acid (trans-4-pentylcyclohexane carboxylic acid; MW = 198.30
g/mol; C12, z = -2) was used for majority of the kinetic and equilibrium study to understand the
fundamentals behind non-competitive adsorption process. Consequently, synthetic tailings pond
water (STPW) solution was prepared for the adsorption study by dissolving 25 mmol/L NaCl, 15
mmol/L NaHCO3, 2 mmol Na2SO4, 0.3 mmol/L CaCl2, and 0.3 mmol/L of MgCl2 in de-ionized
water. The pH of the solution was adjusted to 8.5 using NaOH (0.1M) to match the pH of real
tailings pond water. The chemical composition of STPW solution was directly adopted from
Kiran et al., (2011). An equilibrium adsorption study with real tailings pond water (provided by
Suncor Energy) was also performed to evaluate the adsorption capacity of activated carbon for
total acid-extractable organics (TAOs).
4.3.3 Quantification of Model Naphthenic Acid and Total Acid-extractable Organics
A Fourier-Transform infrared (FTIR) spectroscopy-based technique was utilized to quantify the
model naphthenic acid (mNA) in aqueous phase. The technique was developed by researchers at
Syncrude Canada Ltd., and the experimental details have been described in the open literature
[30, 39, 66, 81]. The two major steps – sample extraction from aqueous phase and FTIR
quantification – involving this method are described in the following sections.
4.3.3.1 Sample Extraction from Aqueous Phase
Prior to the FTIR analysis, the model naphthenic acid was extracted from its initial aqueous
phase to an organic phase. This was performed by liquid-liquid extraction with dichloromethane
(DCM) as the solvent. Prior to extraction, the mNA molecules were converted to their non-ionic

49
form by acidify the aqueous solution to a pH below 2 with concentrated H2SO4 solution. In
STPW solution, the molecules exist in their salt (ionic) form because the pH of STPW is higher
than the pKa of the mNA (~5.2). Therefore, extraction without acidification would lead to loss of
mNA molecules to the aqueous layer. Using a separatory funnel, each acidified sample was
extracted twice with DCM in a 2:1 by volume of sample to solvent ratio. The combined DCM
extracts containing the naphthenic acid was evaporated to dryness under air flow. The residue
was reconstituted with 6 mL of DCM. This concentrated solution of mNA in DCM was then
transferred into a 20 mL glass vial and stored at 0 oC until the FTIR analysis.
4.3.3.2 FTIR-based Quantification
The majority of the FTIR quantification of model naphthenic acid was performed using a Perkin
Elmer Spectrum-BX spectrometer with a sealed KBr liquid sample cell (pathlength = 5 mm). Due
to a malfunction of the BX spectrometer, a second Perkin Elmer spectrometer (Spectrum-One)
was utilized for the later segment of the study. The conditions and the software for the analyses
were kept the same for the both instruments for consistency.
Both instruments were operated in the absorbance mode. The spectra were acquired within a
frequency band range of 4000-400 cm-1
and processed using the Spectrum 5.0.1 software. The
analysis chamber was purged with dry air for ~ 4 minutes before each run. The background
spectrum of dichloromethane (DCM) was obtained prior to sample analysis. For each spectrum
(including the background), 64 co-added scans were performed. The resolution of the instrument
was set to 4 cm-1
.
50
Carboxylic acids have signature C=O absorbance peaks in the wavelength regions of 1740-1750
cm-1
and 1700-1715 cm-1
, representing monomer and dimer absorption respectively [10]. The
absorbance peak heights at 1743 cm-1
(monomer) and 1704 cm-1
(dimer) were measured and
summed. The baseline used for peak height measurement was from 1850 to 1660 cm-1
. The
concentration of an unknown mNA sample was determined by comparing its combined peak
heights (monomer and dimer) to a calibration curve. The calibration curve was prepared as
follows: a stock solution of model naphthenic acid was prepared in DCM. The aliquots of this
solution were diluted with DCM to yield calibration standards with concentrations ranging
between 0.5 to 300 ppm mNA to a final volume of 6 mL. The calibration standards were
analyzed using the FTIR method described above. Their combined peak heights (at 1743 and
1704 cm-1
) were then plotted against the known concentrations to construct the calibration curve.
Two calibration curves were used in this study, corresponding to the two spectrometers. The
detection limit of the spectrometers was experimentally determined to be approximately 1.0 ppm.
These calibration curves can be found in Appendix A.
Control tests were performed to determine the mNA recovery from aqueous phase by liquid-
liquid extraction. The mNA recovery was calculated using equation 4.6. During the adsorption
study, the aqueous mNA samples were syringe-filtered with membrane filters to remove spent
activated carbon. This step was accounted for during the recovery control tests.
The recovery efficiency was determined to be 84.3 ± 2.6 % based on a total of 5 samples. The
loss of the model naphthenic acid might be attributed to the following factors: losses at the

51
interfacial emulsion layer between the organic and the aqueous phase during extraction, losses
due to micro-filtration with membrane filters, and losses due to evaporation of mNA molecules
during the solvent-drying step. The recovery efficiency was plotted against the initial sample
concentrations (Appendix A). The result suggests that the recovery was likely independent of the
initial concentrations. To account for the losses, a correction factor (~15%) was incorporated into
all adsorption calculations.
Total acid-extractable organics or TAOs (complex naphthenic acid mixtures) were also
quantified using the FTIR method described above. The same calibration curve as above was
used to determine the concentrations of TAOs. This is justifiable because the FTIR quantification
of carboxylic acids is solely based on the infrared absorbance of the CO double bonds, which is
proportional to the concentration of total carboxylic acids in a sample, regardless of the type of
acids.
4.3.4 Batch-type Adsorption Kinetics Study
For the kinetic experiments, stock solution of the model naphthenic acid was prepared in
synthetic tailings pond water (STPW). 40 mL of the solution was introduced into a series of 50
mL polypropylene centrifuge vials, which were utilized as batch-type reactors. 10 mg of
activated carbon was added to each of these vials. The vials were placed in a temperature-
controlled water bath shaker at 200 rpm. This was experimentally determined to be the shaking
speed at which the mass transfer resistance due to external diffusion was minimized (See Section
5.2.1 for details). All of the kinetic experiments were conducted at 25 oC except during the
‘effect of temperature’ study. At pre-set time intervals, the sample vials were removed from the
shaker. The spent adsorbent particles were removed by syringe filtration using polysulphone

52
membrane filters (pore diameter = 0.45 µm). The additional time required to remove adsorbent
from the solutions was accounted for in the kinetic calculations. The concentrations of the
filtered sample solutions were determined by the FTIR technique described in the previous
section. For a given experiment, each sample would serve as a data point on a concentration
versus time graph. Figure 4-4 illustrates a schematic flow diagram of the experimental details of
the adsorption study.
4.3.5 Adsorption Equilibrium (Isotherm) Study
The equilibrium adsorption study had a similar experimental protocol to that of the kinetic study.
Stock solutions of desired mNA concentrations were prepared in STPW. The data points for
adsorption isotherms were obtained by fixing the initial mNA concentration of each sample
constant while varying the adsorbent dosage (ranging between 2-30 mg). 40 mL of stock solution
was placed into a series of 50 mL polypropylene centrifuge vials. Adsorbent dosage of
increasing mass (2-30 mg) was then introduced into each sample vial. The vials were placed in
the water bath shaker at 25 oC, and the adsorption process was allowed to reach equilibrium. The
equilibration time was determined from preliminary experiments: 18 hours for commercially
activated carbon (CAC) and 20 hours for activated delayed coke (ADC). Spent adsorbents were
removed by syringe filtration, and the concentration of the remaining solution was determined by
the FTIR method.

53
Figure 4-4: Experimental flow diagram of the adsorption study
An equilibrium study was also performed with real tailings pond water provided by Suncor
Energy to investigate the equilibrium adsorption of total acid-extractable organics (TAOs). The
pond water was syringe-filtered to remove larger solid particles prior to the adsorption. The
experiment was carried out in a similar manner as described above. The amount of solute
adsorbed onto the adsorbent surface at equilibrium (qe) was calculated using the following
equation-

54
where qe is the amount of the mNA or TAOs adsorbed at equilibrium (mg/g); Co and Ce are the
initial and equilibrium aqueous concentration of the adsorbate (mg/L), respectively; V is the
volume of the aqueous sample (L); and m is the mass of adsorbent dosage (g).
4.3.6 Adsorption Data Quality
To ensure good repeatability of the adsorption data, a few kinetic and equilibrium experiments
were repeated. The concentration values from the replicate runs, the standard deviation and the
% relative standard deviation are summarized in this section. Table 4-10 displays these values
for a kinetic study that was performed to investigate the effects of surface functionalities on the
mNA adsorption using CO2-ADC-9h.
Table 4-10: Adsorption kinetics data quality for “effect of surface functional groups” study
Aqueous Phase mNA Concentration, Ct (mg/L)
Time
(min) Run 1 Run 2 Run 3 Average
Standard
Deviation % R.S.D
9 27.0 24.1 25.4 25.5 1.2 4.56
24 21.4 21.9 22.1 21.8 0.32 1.47
48 19.3 18.9 18.7 18.9 0.26 1.36
*Conditions: Solution volume = 40 mL; Solution pH = 8.5; Temperature = 25oC; Shaking speed = 200
rpm; Initial mNA concentration = 33mg/L; CO2-ADC-9h dosage = 10 mg
To obtain thermodynamic parameters for adsorption, an equilibrium adsorption study was carried
out to investigate the effect of temperature on the model naphthenic acid adsorption. For each
temperature value, three runs were performed to determine the equilibrium solution

55
concentration of the model naphthenic acid. Table 4-11 lists the concentration values from the
replicate runs, the standard deviation and the % relative standard deviation.
Table 4-11: Equilibrium adsorption data quality
Equilibrium Solution Concentration of mNA
(mg/L)
Temp., oC
Run 1 Run 2 Run 3 Average Standard
Deviation % R.S.D
22 11.2 9.0 12.5 10.9 1.4 13.3
40 13.0 12.3 12.3 12.6 0.33 2.62
60 20.4 19.2 19.2 19.6 0.57 2.91
* Conditions: Solution volume = 40 mL; pH = 8.5; Shaking speed = 200 rpm.
Initial mNA concentration (Co) = 51 mg/L; CO2-ADC-6h dosage = 30 mg.
Triplicate samples were run for the first FTIR calibration curve and duplicate samples were run
for the second calibration curve. The FTIR absorbance data along with the standard deviation for
each run are summarized in Appendix A.

56
CHAPTER 5 RESULTS AND DISCUSSION
5.1 Characterization of Activated Carbon
5.1.1 Pore Structure Analysis
The physical properties of the activated carbon adsorbents were investigated by porous structure
analysis. The graphical representations of N2 adsorption isotherms for the adsorbents can be
found in Appendix B. The physical pore properties deduced from the isotherm data are
summarized in Table 5-1.
Table 5-1: Physical pore properties of activated carbon adsorbents
Adsorbent
Apparent
SSABET SSAMESO VMIC VMESO VTOT
VF, MIC
VF,MESO
(m2/g) (m
2/g) (cm
3/g) (cm
3/g) (cm
3/g)
Steam-ADC-3h 408 85 0.135 0.046 0.181 0.75 0.25
CO2-ADC-6h 276 92 0.080 0.083 0.163 0.49 0.51
CO2-ADC-9h 405 134 0.100 0.202 0.302 0.33 0.67
CO2-ADC-9h-pAir 295 100 0.073 0.185 0.258 0.28 0.72
CO2-ADC-9h-pO2 300 116 0.067 0.212 0.279 0.24 0.76
CO2-ADC-9h-pNH3 305 130 0.077 0.136 0.213 0.36 0.64
CAC 1120 213 0.308 0.230 0.538 0.57 0.43
* SSA = Specific surface area; SSAMESO = Mesopore SSA; VMIC = Micropore volume; VMESO =
Mesopore volume; VTOT = Total pore volume, VF = Volume fraction.

57
As listed in Table 5-1, upon increasing the activation time from 6 to 9 hours, most of the porous
properties of the CO2-activated delayed coke increased. Both the microporosity and
mesoporosity increased with activation time, resulting in higher total pore volume and SSA. Guo
et al., (2009) observed a similar trend for CO2 activation of coconut shell-based AC precursor.
The specific surface area generally increases with activation time as the porous structure is
developed further. However, at a given temperature, there exist an optimal activation time for a
maximum SSA, beyond which the SSA will start to decrease [27, 49]. This is because prolonged
activation time leads to the enlargement of pre-existing micropores and possible destruction of
mesopores. This would result in a lower SSA and total pore volume [27].
Although Steam-ADC-3h and CO2-ADC-9h have similar apparent BET SSA, their pore size
distributions are considerably different. The mesoporous volume fractions of Steam-ADC-3h and
CO2-ADC-9h were 0.25 and 0.67, respectively. The microporous volume fraction of Steam-
ADC-3h was 0.75 whereas for CO2-ADC-9h, it was only 0.33. This may be due to the fact that
water molecules have a smaller dimension than carbon dioxide molecules, and the reaction
between the water molecules and the carbon skeleton creates smaller (micro) pores comparing to
the reaction between CO2 and carbon [54].
All the post-modified CO2-ADC-9h samples exhibit lower specific surface area and lower total
pore volume than the parent adsorbent. According to Awoyemi (2011), surface oxidation of
activated carbon could have both positive and negative effects on the pore structure. The reaction
between oxygen and the carbon skeleton could result in the formation of new micropores,
thereby increasing the SSA. However, the same reaction could lead to the enlargement and
possible destruction of pre-existing pores, and consequently decreasing the total SSA and pore
58
volume [4]. Pre-existing pores can also be blocked by newly formed oxygen-based surface
functional groups. This would similarly reduce the SSA and the pore volume. For both the
surface-oxidized adsorbents (CO2-ADC-9h-pAir and CO2-ADC-9h-pO2), a decrease in the SSA
and the total pore volume is observed.
Similar trends are observed for ammonia post-treated activated carbon. The decrease in the SSA
and the total pore volume of the sample are presumably due to enlargement of pre-existing
micropores and mesopores. Upon the ammonia post-treatment, the micropore and the mesopore
volume of the CO2-ADC-9h decreased from 0.100 to 0.077 cm3/g and from 0.202 to 0.136
cm3/g, respectively. Nitrogen-based functional groups may contribute to this effect by blocking
the pores. The commercially activated carbon (CAC) displayed the highest SSA (1120 m2/g) and
the total pore volume (0.538 cm3/g) among all the adsorbents.
5.1.2 Surface Chemistry Analysis
5.1.2.1 FTIR Analysis
The surface functional groups of the petroleum coke-derived activated carbon samples were
qualitatively analyzed by solid-state FTIR spectroscopy. The FTIR spectra of all the petroleum
coke-derived activated carbons (with the exception of CO2-ADC-9h-pNH3) are depicted in
Figure 5-1. The FTIR spectrum of ammonia post-treated activated carbon (CO2-ADC-9h-pNH3)
is illustrated in Figure 5-2.

59
Figure 5-1: FTIR spectra of petroleum coke-derived activated carbon adsorbents
All the FTIR spectra in Figure 5-1 show transmittance peaks in very similar regions. The broad
peak between 3600-3150 cm-1
is attributed to the O−H stretching vibration, which suggests the
presence of hydroxyl, phenol, and carboxyl groups on the carbon surface [55]. The peak centred
around 1750-1600 cm-1
is most likely due to the oscillation of C=O bonds associated with
carbonyl, lactonic and carboxylic groups. The sharp peak between 1450-1370 cm-1
may be
caused by the bending vibrations of –CH3 bonds, which suggests the presence of methyl groups
on the adsorbent surface [4]. The peak around 1300-1100 cm-1
is associated with the stretching
vibration of C−O bonds of lactonic, carboxylic and anhydride groups. The weak bands between
900-550 cm-1
are due to the out-of-plane bending vibrations of =(C−H) bonds of aromatic rings
[55].
45
50
55
60
65
70
01000200030004000
Tra
nsm
itta
nce
, (%
)
Wavenumber, (cm-1)
Steam-ADC-3h
CO2-ADC-6h
CO2-ADC-9h
CO2-ADC-9h-pAir
CO2-ADC-9h-pO2

60
In summary, the spectral analysis of Figure 5-1 suggests the presence of oxygen-based surface
functionalities such as carboxylic, lactonic, and phenolic groups on the activated carbon surface.
The FTIR spectrum in Figure 5-2 illustrates the effect of gaseous ammonia post-treatment on
CO2-activated carbon. According to Przepiorski et al. (2004), ammonia decomposes at high
temperature to form radicals such as NH2, NH and H, which could react with the carbon surface
to form nitrogen-based functional groups such as –NH2, −CN, pyridinic, pyrrolic and quaternary
nitrogen [58].
Figure 5-2: FTIR spectrum of ammonia post-treated CO2-activated carbon
In Figure 5-2, the peak between 2400-2250 cm-1
suggests the infrared absorption of nitrile
(−C≡N) groups. The presence of C−N stretching vibrations (1350-1000 cm-1
) and the N−H
bending vibrations (~1550 cm-1
), coupled with C=O stretches (1615 cm-1
) indicate the formation
of amide functional groups on the adsorbent surface. Przepiorski et al., (2004) also reported the
presence of amide groups on the surface of gaseous ammonia-treated activated carbon. The
59.5
60
60.5
61
61.5
62
05001000150020002500300035004000
Tra
nsm
itta
nce
, (%
)
Wavenumber, (cm-1)

61
stretching vibration of N−H bonds (~3400 cm-1
) and the out-of-plane bending vibrations of N−H
bonds (~800 cm-1
) in combination with C−N stretching vibrations (1350-1000 cm-1
) suggest the
presence of amine groups [55]. The peak around 1690-1640 cm-1
implies the presence of
possible imine groups. In summary, the spectral analysis of the ammonia post-treated activated
carbon strongly suggests the development of nitrogen-based surface functionalities.
5.1.2.2 Boehm Titration
The results obtained from the Boehm titrations are graphically represented in Figure 5-2, and
numerically summarized in Table 5-2. Titrations were performed with the CO2-ADC-9h, CO2-
ADC-9h-pAir, and CO2-ADC-9h-pO2 samples to investigate the effects of post-oxidation.
Figure 5-3: Amount of surface oxygen groups on activated carbon adsorbents
The Boehm titration results were consistent with the findings from the FTIR analysis, verifying
the presence of phenolic, carboxylic, and lactonic (mmol/g of adsorbent) groups on activated
0.0
0.5
1.0
1.5
2.0
2.5
3.0
3.5
CO2-ADC-9h CO2-ADC-9h-pAir CO2-ADC-9h-pO2
Am
ou
nt
of
Su
rface
Oxygen
Gro
up
s, (
mm
ol/
g)
Activated Carbon Adsorbents
Phenolic
Carboxylic
Lactonic
Total

62
carbon surface. The results show that the effect of surface oxidation was most pronounced for
humidified-oxygen treated activated carbon. The total amount of surface oxygen groups was the
highest for CO2-ADC-9h-pO2, followed by CO2-ADC-9h-pAir and CO2-ADC-9h. This indicates
that humidified-oxygen is more effective in oxidizing adsorbent surface than humidified-air. This
was expected because the humidified-oxygen stream had a higher oxygen composition (97% O2
+ 3% H2O) than humidified-air (~21% O2). Figure 5-3 shows that the amount of carboxylic and
lactonic groups on the adsorbents increased with increasing degree of oxidation (CO2-ADC-9h <
CO2-ADC-9h-pAir < CO2-ADC-9h-pO2).
Table 5-2: Amount of surface oxygen groups on activated carbon adsorbents
Adsorbent
Acidic Surface Oxygen Groups (mmol/g)
Carboxylic Lactonic Phenolic Total
CO2-ADC-9h 0.020 0.472 0.136 0.62
CO2-ADC-9h-pAir 0.061 0.906 0.088 1.05
CO2-ADC-9h-pO2 1.416 1.433 0.226 3.07
5.1.2.3 Elemental Analysis
Elemental analysis was performed on CO2-ADC-9h and the two post-oxidized AC samples
(CO2-ADC-9h-pAir and CO2-ADC-9h-pO2) to determine their elemental oxygen content. The
results are graphically presented in Figure 5-4, and summarized in Table 5-3. The oxygen
content obtained from the Exeter Analytical CE-440 elemental analyzer is referred to as
‘organic’ oxygen because the method of detection does not account for inorganic oxygen species.

63
The nitrogen content of CO2-ADC-9h and CO2-ADC-9h-pNH3 were obtained to evaluate the
effects of gaseous ammonia post-treatment. These results are tabulated in Table 5-3.
Figure 5-4: Elemental ‘organic’ oxygen content of activated carbon adsorbents
Figure 5-4 displays the following trend in the ‘organic’ oxygen content of the adsorbents: CO2-
ADC-9h-pO2 > CO2-ADC-9h-pAir > CO2-ADC-9h. It is apparent that the oxygen content of the
adsorbents increased with increasing degree of surface oxidation. These results are consistent
with the Boehm titration data. This further supports the conclusion that the humidified-oxygen
treatment was more effective at oxidizing activated carbon than humidified-air.
As listed in Table 5-3, the nitrogen content of activated carbon increased by 10% (from 1.11 to
1.23 wt%) after post-treatment with gaseous ammonia at 850 oC for 2 hours. This observation is
in good accordance with the qualitative FTIR analysis of CO2-ADC-9h-pNH3, which indicated
the development of nitrogen-based surface functionalities.
1.5 3.5
10.1
0
2
4
6
8
10
12
CO2-ADC-9h CO2-ADC-9h-pAir CO2-ADC-9h-pO2
Ele
men
tal
'Org
an
ic'
Ox
ygen
Co
nte
nt,
(%
)
Activated Carbon Adsorbents

64
Table 5-3: Elemental analysis of activated carbon
Adsorbent Oxygen (wt%) Nitrogen (wt%)
CO2-ADC-9h 1.53 ± 0.26 1.11 ± 0.02
CO2-ADC-9h-pAir 3.50 ± 0.39 n/m
CO2-ADC-9h-pO2 10.1 ± 0.27 n/m
CO2-ADC-9h-pNH3 n/m 1.23 ± 0.23
* n/m = not measured.

65
5.2 ADSORPTION STUDY
5.2.1 Adsorption Kinetics
One of the main objectives of the kinetic study was to investigate the effects of adsorbent and
solution properties on adsorption rate parameters. Kinetic models that best describe the
experimental mNA adsorption data were identified. Experiments were designed and performed
to answer some of the following research questions-
What is the effect of shaking speed? At what shaking speed would the mass transfer
resistance due to external diffusion be minimized?
Which kinetic model best fits the experimental data? What are the implications?
How do the adsorbent pore structure and surface functionalities affect rate parameters?
What is the rate-limiting step in the adsorption process?
What are the effects of initial adsorbate concentration and temperature?
The first step of an adsorption process in a solid-liquid system is the external diffusion of
adsorbate molecules from bulk liquid phase through a stagnant film layer to the external surface
of the adsorbent (Figure 3-1). The shaking or the mixing speed within a system has a
considerable impact on the external diffusion of adsorbate species [67, 84]. Figure 5-5 illustrates
the effect of shaking speed on the model naphthenic acid adsorption (% adsorbed) from aqueous
phase. After 40 minutes, without shaking, the mNA adsorption was quite low for CO2-ADC-6h
(8%). However, the figure shows an increase in adsorption with increasing shaking speed until a
plateau is reached around 175-200 rpm. Increasing the shaking speed reduces the film
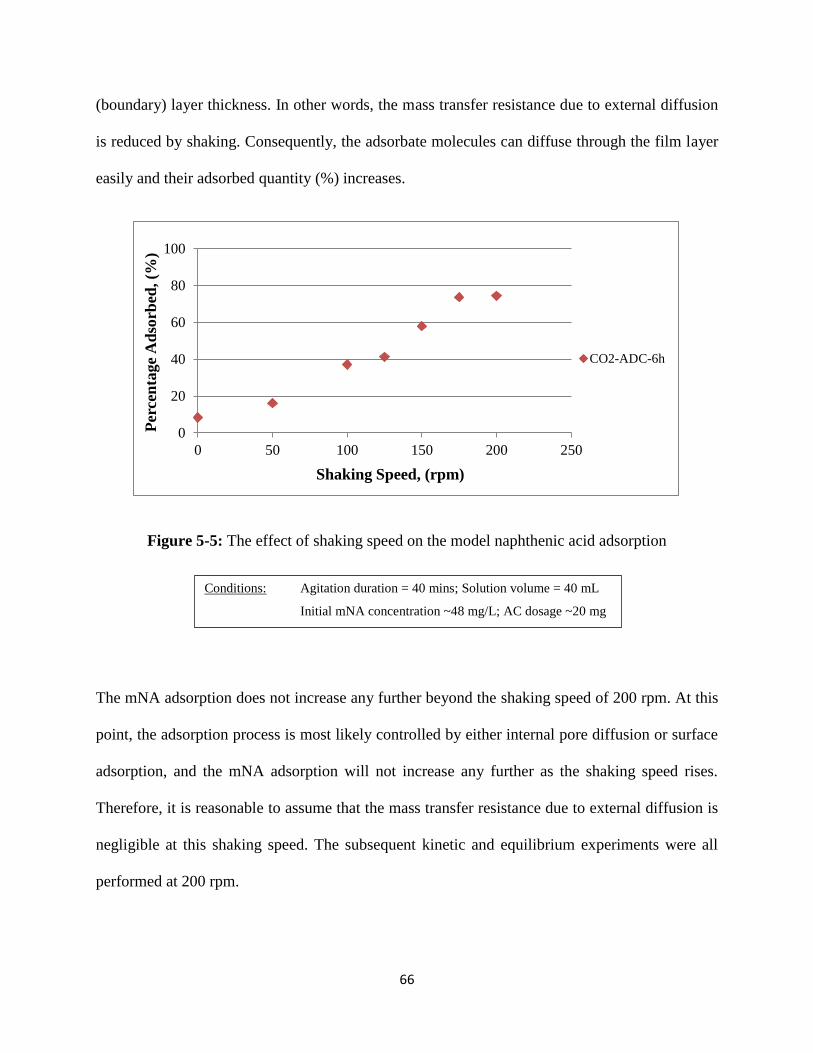
66
(boundary) layer thickness. In other words, the mass transfer resistance due to external diffusion
is reduced by shaking. Consequently, the adsorbate molecules can diffuse through the film layer
easily and their adsorbed quantity (%) increases.
Figure 5-5: The effect of shaking speed on the model naphthenic acid adsorption
The mNA adsorption does not increase any further beyond the shaking speed of 200 rpm. At this
point, the adsorption process is most likely controlled by either internal pore diffusion or surface
adsorption, and the mNA adsorption will not increase any further as the shaking speed rises.
Therefore, it is reasonable to assume that the mass transfer resistance due to external diffusion is
negligible at this shaking speed. The subsequent kinetic and equilibrium experiments were all
performed at 200 rpm.
0
20
40
60
80
100
0 50 100 150 200 250
Per
cen
tage
Ad
sorb
ed, (%
)
Shaking Speed, (rpm)
CO2-ADC-6h
Conditions: Agitation duration = 40 mins; Solution volume = 40 mL
Initial mNA concentration ~48 mg/L; AC dosage ~20 mg

67
5.2.1.1 Effect of Pore Structure
To investigate the effect of adsorbent pore structure on the model naphthenic acid adsorption
kinetics, three adsorbents (CO2-ADC-6h, Steam-ADC-3h, and CAC) with contrastingly different
porosity were used. Figure 5-6 illustrates the time-dependent adsorption of the mNA onto the
three adsorbents. The raw adsorption data for this study can be found in Appendix C, along with
kinetic model fitting graphs.
Figure 5-6: Time-dependent adsorption of mNA onto adsorbents of different porosity
As illustrated in Figure 5-6, CAC had the highest amount of mNA adsorbed after ~ 95 minutes,
followed by CO2-ADC-6h and Steam-ADC-3h (~270, 200, and 160 mg/g, respectively). To fully
understand the effect of pore structure on mNA adsorption kinetics, the kinetic data was
0
50
100
150
200
250
300
0 20 40 60 80 100
Am
ou
nt
Ad
sorb
ed, q
t (m
g/g
)
Time, (min)
CO2-ADC-6h CO2-ADC-6h pseudo-2nd order
Steam-ADC-3h Steam-ADC-3h pseudo-2nd oder
CAC CAC pseudo-2nd order
Conditions: Solution volume = 40 mL; pH = 8.5; Temperature = 25oC.
Shaking speed = 200 rpm.
Initial mNA concentration ~92mg/L; Adsorbent dosage ~10 mg.

68
formulated into several kinetic models, and the model parameters such as the rate constant and
the equilibrium adsorbed quantity were obtained. These parameters were then used as a basis for
comparing the performance of the different adsorbents. More specifically, the kinetic parameters
were correlated with adsorbent pore properties to understand the effect of pore structure. Table
5-4 summarizes the model parameters for the pseudo-first order, pseudo-second order, and
Elovich models and the correlation coefficients.
From the correlation coefficients of the models in Table 5-4, it is evident that the pseudo-second
order rate model exhibits the best fit for the experimental data for all three adsorbents. The
model-predicted adsorbed quantities are depicted by the dashed lines in Figure 5-6. The dashed-
fits indicate a good correlation between the model and the experimental data. Previously, Zubot
(2010) demonstrated that the adsorption kinetics of naphthenic acid mixture onto Syncrude
petroleum coke also follow the pseudo-second order model.
Thereby, the pseudo-second order rate parameters were used to investigate the effect of pore
structure on adsorption kinetics. From here on, this will be the only empirical model used to
report kinetic data.

69
Table 5-4: Empirical kinetic model parameters from the ‘Effect of Pore Structure’ study
Activated Carbon Adsorbents
Kinetic Models CAC CO2-ADC-6h Steam-ADC-3h
Pseudo-2nd Order
k2 (g/mg min) 5.62E-04 9.68E-04 8.14E-05
qe,2 (mg/g) 286 208 238
r2 0.999 0.998 0.975
Pseudo-1st Order
k1 (min-1
) 9.67E-03 2.05E-02 2.46E-02
qe,1 (mg/g) 165 113 180
qe,exp (mg/g) 339 221 174
r2 0.624 0.765 0.975
Elovich Model
β (g/mg) 2.40E-02 4.36E-02 1.97E-02
α (mg/g min) 290 1.5E+03 10
r2 0.855 0.931 0.974
Table 5-5 compares the adsorbent pore properties with the pseudo-2nd
order rate parameters. No
distinct trend is observed between the apparent BET SSA and the pseudo-second order rate
constant (k2). This is also true for the case of the total pore volume and the rate constant. CO2-
ADC-6h exhibits the highest rate constant even though it has the smallest apparent BET SSA.
However, among the three adsorbents, CO2-ADC-6h has the highest mesoporous volume
fraction, followed by CAC and Steam-ADC-3h. A careful examination of the mesoporous
volume fraction and the rate constant reveals a positive correlation between the two.

70
Table 5-5: Correlations between adsorbent pore properties and pseudo-2nd
order rate parameters
Adsorbent Porous Properties
Pseudo-second Order
Rate Parameters
Adsorbent
Apparent
SSABET,
(m2/g)
Total
Pore
Volume
(cm3/g)
Mesopore
Volume
Fraction
Micropore
Volume
Fraction
Rate
constant,
k2 (g/mg
min)
Equilibrium
Adsorbed
Amount, qe
(mg/g)
CO2-ADC-6h 276 0.163 0.51 0.49 9.68E-04 208
Steam-ADC-3h 408 0.181 0.25 0.75 8.14E-05 238
CAC 1120 0.538 0.47 0.53 5.62E-04 286
Figure 5-7 further illustrates the positive correlation between the rate constant and the
mesoporous volume fraction of the adsorbents.
Figure 5-7: Correlation between mesoporous volume fraction and pseudo-2nd
order rate constant
This observation may be rationalized by the following set of arguments. Mesopore diameters are
between 2 and 50 nm while micropore diameters are below 2 nm. The model naphthenic acid
(trans-4-pentylcyclohexane carboxylic acid) has the following approximate dimensions (Figure
5-8).
0.0E+00
3.0E-04
6.0E-04
9.0E-04
1.2E-03
0.20 0.30 0.40 0.50 0.60
Pse
ud
o-2
nd O
rder
Rate
Con
stan
t, k
2 (
g/m
g m
in)
Mesoporous Volume Fraction
CO2-ADC-6h
Steam-ADC-3h
CAC

71
Figure 5-8: Molecular dimensions of the model naphthenic acid [9]
It is apparent that the mNA molecules will not be able to diffuse into micropores with diameter
smaller than ~0.25 nm due to physical constraint. Even for micropores with diameters greater
than 0.25 nm, it would be rather difficult for the molecules to diffuse into these pores because
their steric orientation has to be perfectly aligned with the pore geometry. In contrast, the
diffusion and subsequent adsorption into the mesopores would be conceivably easier due to the
wider pore diameter. For this reason, the adsorbent with highest mesoporous volume fraction
(CO2-ADC-6h) exhibits the highest rate constant, and the adsorbent with the highest
microporous volume fraction (Steam-ADC-3h) exhibits the lowest rate constant.
0.22 nm
1.14 nm
0.25 nm
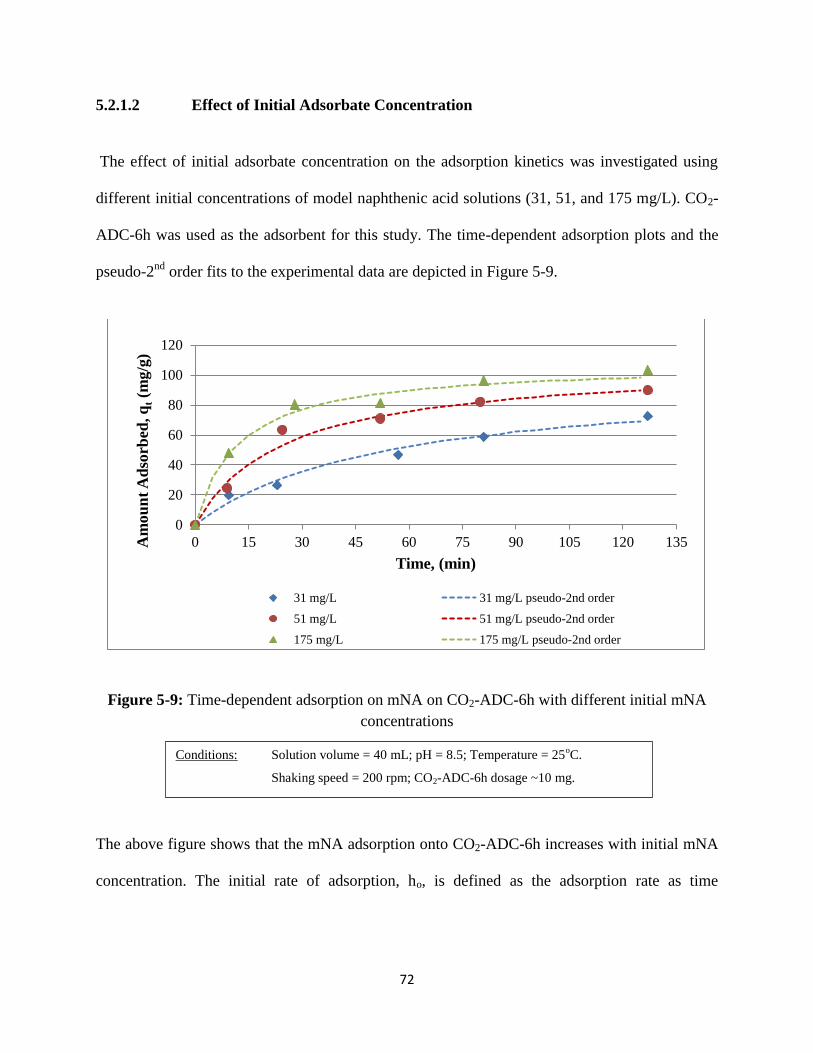
72
5.2.1.2 Effect of Initial Adsorbate Concentration
The effect of initial adsorbate concentration on the adsorption kinetics was investigated using
different initial concentrations of model naphthenic acid solutions (31, 51, and 175 mg/L). CO2-
ADC-6h was used as the adsorbent for this study. The time-dependent adsorption plots and the
pseudo-2nd
order fits to the experimental data are depicted in Figure 5-9.
Figure 5-9: Time-dependent adsorption on mNA on CO2-ADC-6h with different initial mNA
concentrations
The above figure shows that the mNA adsorption onto CO2-ADC-6h increases with initial mNA
concentration. The initial rate of adsorption, ho, is defined as the adsorption rate as time
0
20
40
60
80
100
120
0 15 30 45 60 75 90 105 120 135Am
ou
nt
Ad
sorb
ed, q
t (m
g/g
)
Time, (min)
31 mg/L 31 mg/L pseudo-2nd order
51 mg/L 51 mg/L pseudo-2nd order
175 mg/L 175 mg/L pseudo-2nd order
Conditions: Solution volume = 40 mL; pH = 8.5; Temperature = 25oC.
Shaking speed = 200 rpm; CO2-ADC-6h dosage ~10 mg.
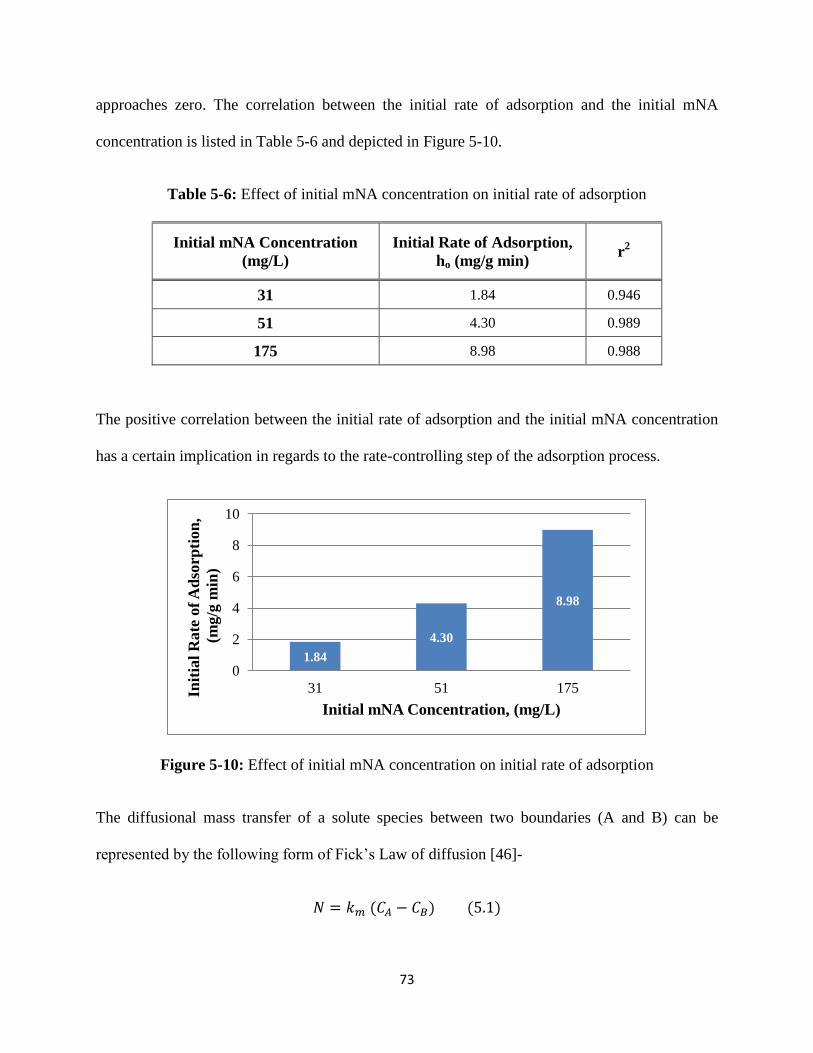
73
approaches zero. The correlation between the initial rate of adsorption and the initial mNA
concentration is listed in Table 5-6 and depicted in Figure 5-10.
Table 5-6: Effect of initial mNA concentration on initial rate of adsorption
Initial mNA Concentration
(mg/L)
Initial Rate of Adsorption,
ho (mg/g min) r
2
31 1.84 0.946
51 4.30 0.989
175 8.98 0.988
The positive correlation between the initial rate of adsorption and the initial mNA concentration
has a certain implication in regards to the rate-controlling step of the adsorption process.
Figure 5-10: Effect of initial mNA concentration on initial rate of adsorption
The diffusional mass transfer of a solute species between two boundaries (A and B) can be
represented by the following form of Fick’s Law of diffusion [46]-
1.84
4.30
8.98
0
2
4
6
8
10
31 51 175Init
ial
Rate
of
Ad
sorp
tion
,
(m
g/g
min
)
Initial mNA Concentration, (mg/L)

74
where N is the mass flux of the solute; km is mass transfer coefficient related to the diffusivity
coefficient; CA and CB are the concentrations of the solute at boundaries A and B, respectively.
This concept could be readily applied for the case of the model naphthenic acid (mNA) diffusion
from the exterior surface of an activated carbon particle to the active sites through the internal
pores. Since the effects of external diffusion were minimized by appropriate shaking, the
concentration gradient between the bulk liquid and the exterior surface of the adsorbent is
practically zero. Hence, CA, in this case, is Cbulk, which is the initial mNA concentration in the
bulk liquid phase. In this scenario, CB, is the adsorbate concentration on the active sites.
At time = 0, CB would essentially be zero. Thereby, the rate of mass transfer through the internal
pores becomes the initial rate of mass transfer (adsorption). At this point, equation 5.1 takes the
following form-
where ho is the previously defined initial rate of adsorption (mg/g min), and Cbulk (mg/L) is the
initial bulk phase mNA concentration. A diffusion-controlled process should display a similar
positive correlation between ho and Cbulk.
The results summarized in Table 5-6 and Figure 5-10 display a positive correlation between the
initial rate of adsorption and the initial mNA concentration. This suggests that the adsorption of
the model naphthenic acid is presumably an intraparticle diffusion-controlled process. The
positive correlation between the initial rate of adsorption and the initial mNA concentration is
not exactly linear. This is because the interfacial surface area that the adsorbate molecules have

75
to diffuse through is not constant; rather it varies with pore diameter. Consequently, the positive
correlation is not perfectly linear.
5.2.1.3 Effect of Temperature
The effect of temperature on the mNA adsorption kinetics was investigated using CO2-ADC-9h.
The graphical representation of the experimental data (Figure 5-14) shows a slight increase in
mNA adsorption with temperature, but the results are not very conclusive. However, Table 5-9
shows that the pseudo-2nd
order rate constant increases with increasing temperature.
Figure 5-11: Effect of temperature on time-dependent mNA adsorption
An Arrhenius plot was generated using the linearized form of equation 5-3 [46]. Ea is the
activation energy of the adsorption process; R is the universal gas constant (8.3145 J/mol K) and
T is the temperature. The pseudo-second order rate constant was used for k value of equation.
0
15
30
45
60
75
0 10 20 30 40 50 60
Ad
sorb
ed A
mou
nt,
qt (m
g/g
)
Time, (min)
25 degrees C 50 degrees C 75 degrees C
Conditions: Solution volume = 40 mL; pH = 8.5; Shaking speed = 200 rpm.
CO2-ADC-9h dosage ~10 mg; Initial mNA concentration ~ 51 mg/L

76
Table 5-7: Effect of temperature on pseudo-second order rate constant
Temperature
(oC)
Pseudo-2nd
Order Rate
Constant, k2 (g/mg min) r
2
25 5.51E-04 0.996
50 7.12E-04 0.995
75 8.63E-04 0.991
Figure 5-12 displays the Arrhenius plot of the model naphthenic acid adsorption. The apparent
activation energy of the adsorption process (Ea,app) was obtained from the slope of the Arrhenius
plot, and the pre-exponential factor (A) was obtained from the y-intercept. The values of Ea,app
and A were calculated to be ~7.7 kJ/mol and 0.013, respectively. The magnitude of activation
energy often gives an idea about an adsorption process. Diffusion-controlled kinetic processes
are typically known to have relatively small activation energy [64]. In contrast, high values of
activation energy generally suggest surface adsorption-controlled adsorption process [12, 64].
Figure 5-12: Arrhenius plot of the mNA adsorption
y = -930.11x - 4.38
R² = 0.998
-7.6
-7.4
-7.2
-7
0.0028 0.003 0.0032 0.0034
ln (
k2)
1/T, (K-1)
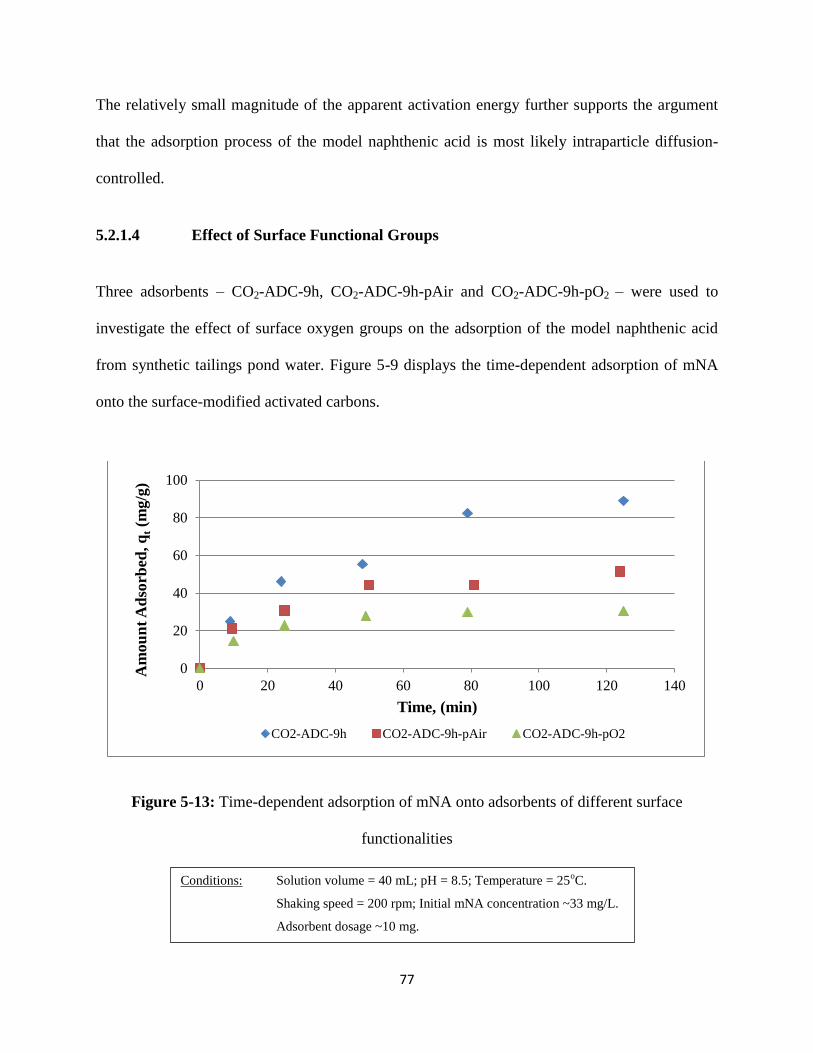
77
The relatively small magnitude of the apparent activation energy further supports the argument
that the adsorption process of the model naphthenic acid is most likely intraparticle diffusion-
controlled.
5.2.1.4 Effect of Surface Functional Groups
Three adsorbents – CO2-ADC-9h, CO2-ADC-9h-pAir and CO2-ADC-9h-pO2 – were used to
investigate the effect of surface oxygen groups on the adsorption of the model naphthenic acid
from synthetic tailings pond water. Figure 5-9 displays the time-dependent adsorption of mNA
onto the surface-modified activated carbons.
Figure 5-13: Time-dependent adsorption of mNA onto adsorbents of different surface
functionalities
0
20
40
60
80
100
0 20 40 60 80 100 120 140
Am
ou
nt
Ad
sorb
ed, q
t (m
g/g
)
Time, (min)
CO2-ADC-9h CO2-ADC-9h-pAir CO2-ADC-9h-pO2
Conditions: Solution volume = 40 mL; pH = 8.5; Temperature = 25oC.
Shaking speed = 200 rpm; Initial mNA concentration ~33 mg/L.
Adsorbent dosage ~10 mg.

78
Figure 5-13 shows that after about 125 minutes, CO2-ADC-9h had the highest mNA adsorption,
followed by CO2-ADC-9h-pAir and CO2-ADC-9h-pO2, respectively. This trend suggests that
activated carbon’s affinity for the model naphthenic acid decreases with increasing degree of
surface oxidation.
The Weber-Morris (W-M) intraparticle diffusion model was used to interpret the experimental
data from this study. The W-M intraparticle diffusion plots are depicted in Figure 5-14.
Figure 5-14: Weber-Morris intraparticle diffusion plots of mNA adsorption onto surface-
oxidized activated carbons
The intraparticle diffusion rate constant, kid, is the slope of the linear portion of the Weber-
Morris plot. If the extrapolation of the straight line passes through the origin (i.e., y-intercept =
0), then the adsorption process is said to be solely intraparticle (internal) diffusion-controlled
[79]. However, many researchers have reported double-natured W-M plots, displaying a curved
initial portion followed by a linear portion [59, 79]. The initial portion represents the film layer
0
20
40
60
80
100
0 2 4 6 8 10 12Qu
an
tity
Ad
sorb
ed, q
t (m
g/g
)
Time0.5, (min0.5)
CO2-ADC-9h CO2-ADC-9h-pAir CO2-ADC-9h-pO2
y = 3.06 x + 18
y = 1.23 x + 18
y = 7.43 x + 8.9

79
effects due to external diffusion, while the linear portion represents the intraparticle or internal
pore diffusion. The y-intercept of the linear portion, C, reflects the magnitude of the film layer
effect. When C is zero, there is essentially no film layer effect. However, the film layer effect
becomes more significant as C increases. In Figure 5-14, the initial data points reflecting external
diffusion were omitted from the W-M plots, because they were not used for the straight-line
fittings of the linear portions. The intraparticle diffusion rate constants and the C values obtained
from the W-M plots are summarized in Table 5-8.
Table 5-8: Weber-Morris intraparticle diffusion rate parameters
Adsorbent
Intraparticle Diffusion
Rate Constant,
kid (mg/g min0.5
)
Weber-Morris
Constant, C
(mg/g)
r2
CO2-ADC-9h 7.43 8.9 0.929
CO2-ADC-9h-pAir 3.06 18 0.865
CO2-ADC-9h-pO2 1.23 18 0.844
The intraparticle diffusion rate constants in Table 5-8 decreased in the following in the order:
CO2-ADC-9h-pO2 < CO2-ADC-9h-pAir < CO2-ADC-9h. This elucidates that the mass transfer
resistance through the internal pores increased with surface oxidation. The values of the W-M
constant (C) for the adsorbents were above zero, suggesting that the external film diffusion still
has some effects on the initial diffusion process. However, the relatively small values of C imply
that the mass transfer resistance due to external diffusion was not substantial. This was expected
because the effect of external film diffusion was previously minimized by adjusting the shaking
speed. The higher C values of CO2-ADC-9h-pO2 and CO2-ADC-9h-pAir imply a greater
boundary layer effect for surface-oxidized adsorbents. The surface chemistry data of the

80
adsorbents were compared to the intraparticle rate parameters to fully understand the effect of
surface oxygen groups on adsorption kinetics (Table 5-9).
Table 5-9: Correlations between adsorbent surface chemistry and Weber-Morris rate parameters
Adsorbent
Total Surface
Oxygen Group
(Boehm Titration),
(mmol/g)
‘Organic’
Elemental
Oxygen
(wt%)
Intraparticle
Diffusion Rate
Constant,
kid (mg/g min0.5
)
W-M
Constant,
C, (mg/g)
CO2-ADC-9h 0.63 1.53 7.43 8.9
CO2-ADC-9h-pAir 1.05 3.50 3.06 18
CO2-ADC-9h-pO2 3.07 10.1 1.23 18
Table 5-9 exhibits a decreasing trend in the intraparticle diffusion (ID) rate constant with the
increasing oxygen surface groups of the adsorbents. The same trend is also observed between the
ID rate constant and the ‘organic’ oxygen content of the adsorbents. This suggests that the
adsorption kinetics of model naphthenic acid is adversely affected by the introduction of surface
oxygen groups.
Surface oxidation introduces oxygen functionalities such as carboxylic, lactonic and phenolic
groups on activated carbon surface as demonstrated by Boehm titration. The presence of these
functionalities presumably induces steric hindrance, limiting the adsorbate diffusion into the
internal pores. Consequently, higher surface oxygen content results in lower intraparticle
diffusion rate constant. Secondly, the oxygen heteroatoms on the activated carbon surface are
electron-rich. The same is also true for the oxygen atoms of the model naphthenic acid.
Therefore, electrostatic repulsion may occur between the oxygen groups on the carbon surface
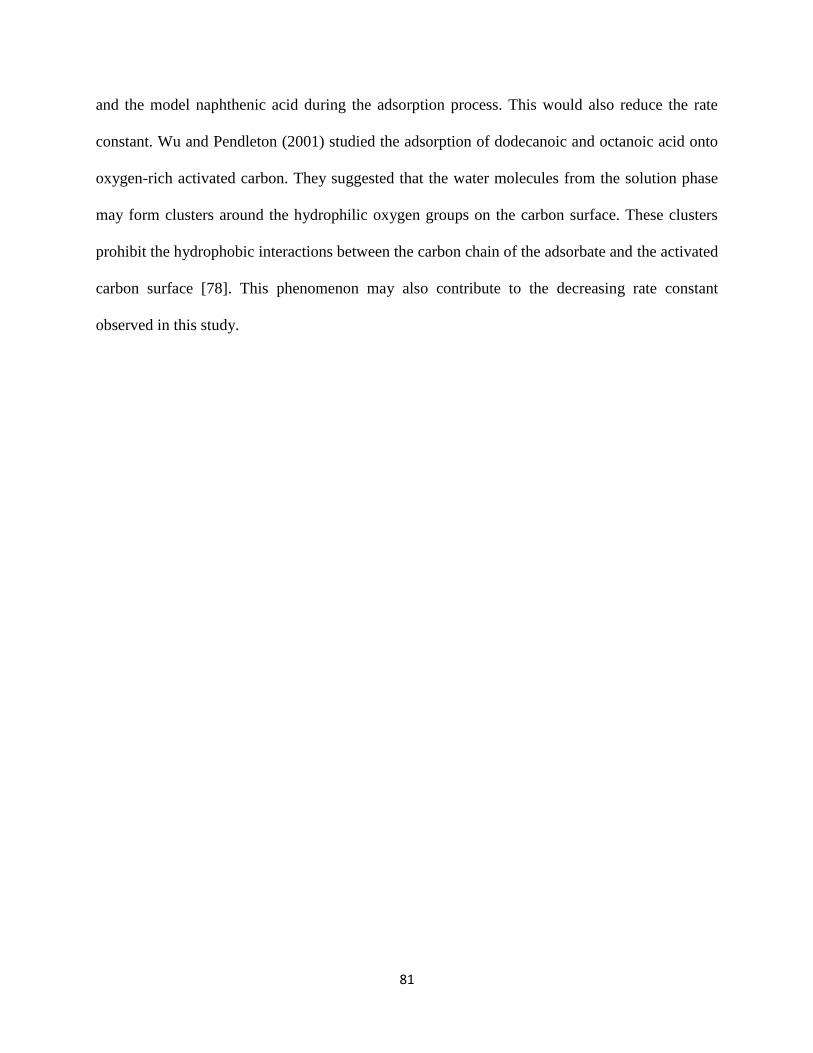
81
and the model naphthenic acid during the adsorption process. This would also reduce the rate
constant. Wu and Pendleton (2001) studied the adsorption of dodecanoic and octanoic acid onto
oxygen-rich activated carbon. They suggested that the water molecules from the solution phase
may form clusters around the hydrophilic oxygen groups on the carbon surface. These clusters
prohibit the hydrophobic interactions between the carbon chain of the adsorbate and the activated
carbon surface [78]. This phenomenon may also contribute to the decreasing rate constant
observed in this study.

82
5.2.2 Equilibrium Adsorption Study
The equilibrium adsorption experiments were performed by fixing the initial adsorbate
concentration constant while varying the adsorbent dosage. The equilibration time for the
experiments was determined from preliminary experiments: 18 hours for the commercially
activated carbon (CAC) and 20 hours for the petroleum coke-derived activated carbons. The
experimental data was formulated into several isotherm models to determine the best model fit.
The effect of surface functional groups on the equilibrium adsorption of the model naphthenic
acid was investigated. A thermodynamic analysis was carried out to understand the nature of the
mNA adsorption. The equilibrium adsorption of NA-type total acid-extractable organics (TAOs)
from real tailings pond water was also investigated.
5.2.2.1 Equilibrium Adsorption Isotherms
CAC, Steam-ADC-3h, and CO2-ADC-6h were used to determine the isotherm model that best
represented the equilibrium adsorption data. The adsorption isotherms are depicted in Figure 5-
15. The experimental data was formulated into the Langmuir, Freundlich and Temkin isotherm
models. The model parameters are summarized in Table 5-10. The raw data can be found in
Appendix D along with isotherm model fitting graphs.
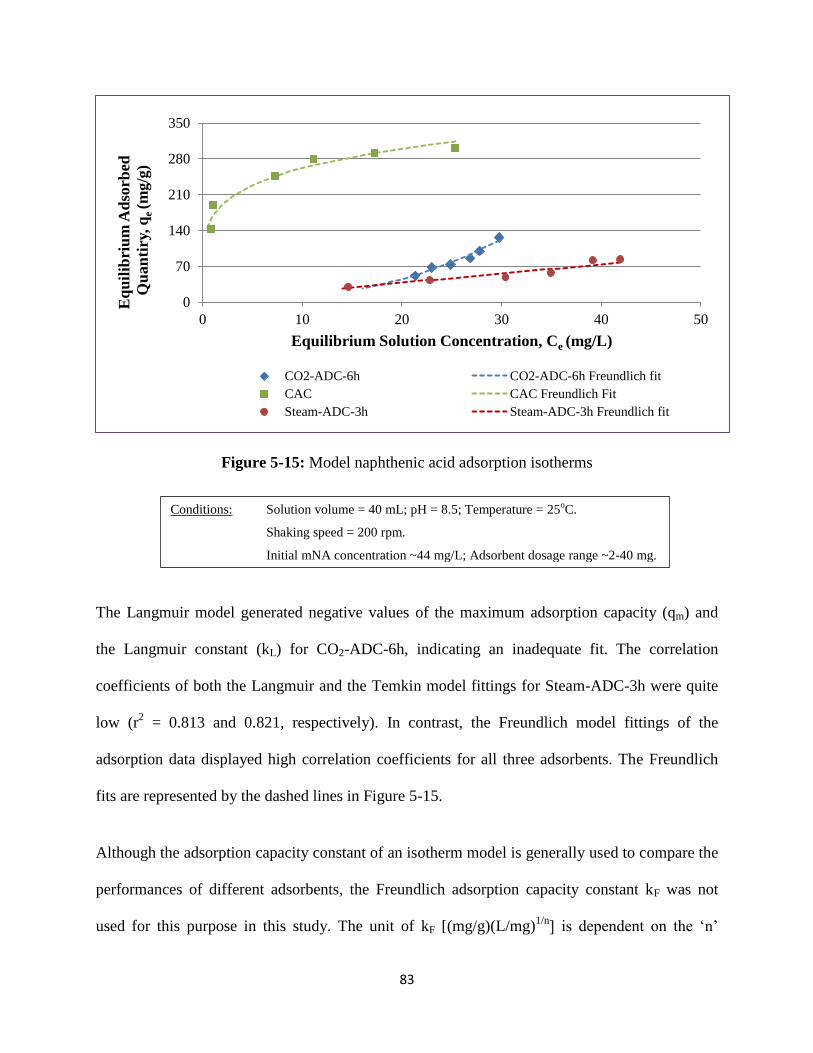
83
Figure 5-15: Model naphthenic acid adsorption isotherms
The Langmuir model generated negative values of the maximum adsorption capacity (qm) and
the Langmuir constant (kL) for CO2-ADC-6h, indicating an inadequate fit. The correlation
coefficients of both the Langmuir and the Temkin model fittings for Steam-ADC-3h were quite
low (r2 = 0.813 and 0.821, respectively). In contrast, the Freundlich model fittings of the
adsorption data displayed high correlation coefficients for all three adsorbents. The Freundlich
fits are represented by the dashed lines in Figure 5-15.
Although the adsorption capacity constant of an isotherm model is generally used to compare the
performances of different adsorbents, the Freundlich adsorption capacity constant kF was not
used for this purpose in this study. The unit of kF [(mg/g)(L/mg)1/n
] is dependent on the ‘n’
0
70
140
210
280
350
0 10 20 30 40 50
Eq
uil
ibri
um
Ad
sorb
ed
Qu
an
tiry
, q
e (m
g/g
)
Equilibrium Solution Concentration, Ce (mg/L)
CO2-ADC-6h CO2-ADC-6h Freundlich fit
CAC CAC Freundlich Fit
Steam-ADC-3h Steam-ADC-3h Freundlich fit
Conditions: Solution volume = 40 mL; pH = 8.5; Temperature = 25oC.
Shaking speed = 200 rpm.
Initial mNA concentration ~44 mg/L; Adsorbent dosage range ~2-40 mg.

84
values. Since the ‘n’ values of the adsorbents are quite different (Table 5-10), the units of kF will
vary for the adsorbents. Hence, kF is not an adequate comparative basis. Instead the equilibrium
adsorption quantity (qe) at a fixed equilibrium solution concentration was used for comparing the
performances of the adsorbents.
Table 5-10: Adsorption isotherm model parameters for mNA adsorption
Activated Carbon Adsorbents
Isotherm Models CAC CO2-ADC-6h Steam-ADC-3h
Langmuir
qm, (mg/g) 313 -53.5 152
kL, (L/mg) 0.84 -0.02 0.02
r2 0.998 0.926 0.813
Freundlich
kF, (mg/g)(L/mg)1/n
167 0.026 2.15
n 5.10 0.40 1.04
r2 0.925 0.967 0.916
Temkin
B, (J/mol) 43 205 49
AT, (L/g) 50 0.06 0.11
r2 0.957 0.925 0.821
The adsorption isotherms in Figure 5-15 show that the commercially activated carbon (CAC) had
the highest equilibrium adsorbed quantity for any given solution concentration, followed by
CO2-ADC-6h and Steam-ADC-3h, respectively. In Table 5-11, a positive correlation is observed
between the mesoporous SSA of the adsorbents and the equilibrium adsorbed quantity. This
seems to suggest that the pore size distribution may play a role in equilibrium adsorption of the
85
model naphthenic acid. However, the lesser adsorption onto petroleum coke-derived activated
carbon may also be caused by poor wettability of these adsorbents.
Table 5-11: Relationship between mesoporous SSA and equilibrium adsorbed quantity
Adsorbents Mesoporous SSA,
(m2/g)
Equilibrium Adsorbed Quantity,
qe (mg/g) [at Ce=20 mg/L]
CAC 213 300
CO2-ADC-6h 92 45
Steam-ADC-3h 85 25
5.2.2.2 Effect of Surface Functional Groups
CO2-ADC-9h and the three post-treated activated carbons were used to determine the effect of
surface functional groups on the model naphthenic acid adsorption. The adsorption isotherms are
depicted in Figure 5-16.
Among the four adsorbents, the surface-oxidized activated carbons (CO2-ADC-9h-pAir and
CO2-ADC-9h-pO2) exhibited the lowest equilibrium adsorption of the model NA. Between CO2-
ADC-9h and CO2-ADC-9h-pNH3, the latter displayed a higher mNA adsorption at equilibrium.
Figure 5-16 also displays the Freundlich model fits for the adsorbents.

86
Figure 5-16: Adsorption isotherms reflecting the effect of adsorbent surface functional groups
Table 5-12: Effect of surface functional groups on the equilibrium adsorption of mNA
Adsorbents
Acidic Surface
Oxygen Group,
(mmol/g)
Elemental
Oxygen Content,
(wt%)
Equilibrium Adsorbed
Quantity (mg/g), [at Ce = 20 mg/L]
CO2-ADC-9h 0.62 1.53 63
CO2-ADC-9h-pAir 1.05 3.50 52
CO2-ADC-9h-pO2 3.07 10.1 34
CO2-ADC-9h-pNH3 n/m n/m 102
*n/m= not measured
0
20
40
60
80
100
120
0 5 10 15 20 25 30 35
Eq
uil
ibri
um
Ad
sorb
ed
Qu
an
tity
, q
e (
mg/g
)
Equilibrium Solution Concentration, Ce (mg/L)
CO2-ADC-9h CO2-ADC-9h Freundlich fit
CO2-ADC-9h-pAir CO2-ADC-9h-pAir Freundlich fit
CO2-ADC-9h-pO2 CO2-ADC-9h-pO2 Freundlich fit
CO2-ADC-9h-pNH3 CO2-ADC-9h-pNH3 Freundlich fit
R2 = 0.912
Conditions: Solution volume = 40 mL; pH = 8.5; Temperature = 25oC.
Shaking speed = 200 rpm.
Initial mNA concentration ~33 mg/L; Adsorbent dosage range ~3-22 mg.
R2
= 0.905 R
2
= 0.948
R2
= 0.992

87
As listed in Table 5-12, both of the surface-oxidized activated carbons exhibits lower equilibrium
adsorbed quantity of mNA than their parent adsorbent (CO2-ADC-9h). This implies that surface
oxidation of the adsorbents has an adverse effect on the equilibrium adsorption of the model NA.
As the amount of acidic surface oxygen group and the elemental oxygen content of the
adsorbents increased, the equilibrium adsorbed mNA quantity decreased (Table 5-12).
As suggested in Section 5.2.1.4, the development of oxygen functionalities on activated carbon
surface may induce steric hindrance, which limits the diffusion of the adsorbate molecules into
the adsorbent pores. This may be one of the reasons why lower equilibrium adsorption was
observed for the surface-oxidized adsorbents. Secondly, the oxygen-rich adsorbent surfaces will
most likely be negatively charged. Thereby, electrostatic repulsion between the oxygen
functionalities of the adsorbents and the oxygen groups of the adsorbate molecules is expected.
This effect will also prohibit the diffusion and the subsequent adsorption process [78]. Finally,
the polar water molecules in the solution phase typically have a high affinity for hydrophilic
oxygen functionalities. This could lead to the formation of ‘water clusters’ surrounding the
oxygen functionalities of the adsorbents, which would reduce the hydrophobic interactions
between the activated carbon surface and the carbon chain of the adsorbate [78]. This could also
contribute to the low equilibrium adsorption onto the surface-oxidized activated carbons.
For any given equilibrium solution concentration (Ce), the equilibrium adsorbed mNA quantity
(qt) was the highest for the gaseous ammonia post-treated activated carbon (CO2-ADC-9h-
pNH3). At Ce = 20 mg/L, the equilibrium adsorbed mNA quantity was 102 mg/g for CO2-ADC-
9h-pNH3 and 63 mg/g for CO2-ADC-9h. The adsorption capacity of the adsorbent was evidently
enhanced upon gaseous ammonia treatment. FTIR analysis of CO2-ADC-9h-pNH3 surface
revealed the development nitrogen-based functional groups (amine, amide and nitrile). This

88
finding was consistent with the elemental analysis data, which showed a 10% increase in the
elemental nitrogen content after post-treatment. Due to the presence of basic surface groups, the
surface of the adsorbent is expected to be positively charged when submerged in the STPW
solution. The interaction between the positively charged adsorbent surface and the negatively
charged naphthenate molecules is suspected to enhance the equilibrium adsorption. This suggests
that chemisorption most likely plays a role in the adsorption process between basic adsorbents
and the model naphthenic acid.
From the Freundlich fit of the adsorption isotherm, it was calculated that 2.7 g/L of CO2-ADC-
9h-pNH3 would be needed to reduce mNA concentration in STPW from 120 mg/L to 2.5 mg/L
(~98 % removal). Lowering the pH of the tailings pond water solution could increase the
adsorption of mNA onto basic adsorbents. At low pH values, the solution will have more protons
to donate to the adsorbent surface, making it more positively charged. This would enhance the
adsorption of the model naphthenic acid.
5.2.2.3 Thermodynamic Analysis of the mNA Adsorption
Thermodynamic parameters such as the change in Gibbs free energy, enthalpy, entropy and
equilibrium constant often provide a good understanding about the nature of an adsorption
process. The thermodynamic equilibrium constant (Kc) for an adsorption process is defined as
follows [84]-
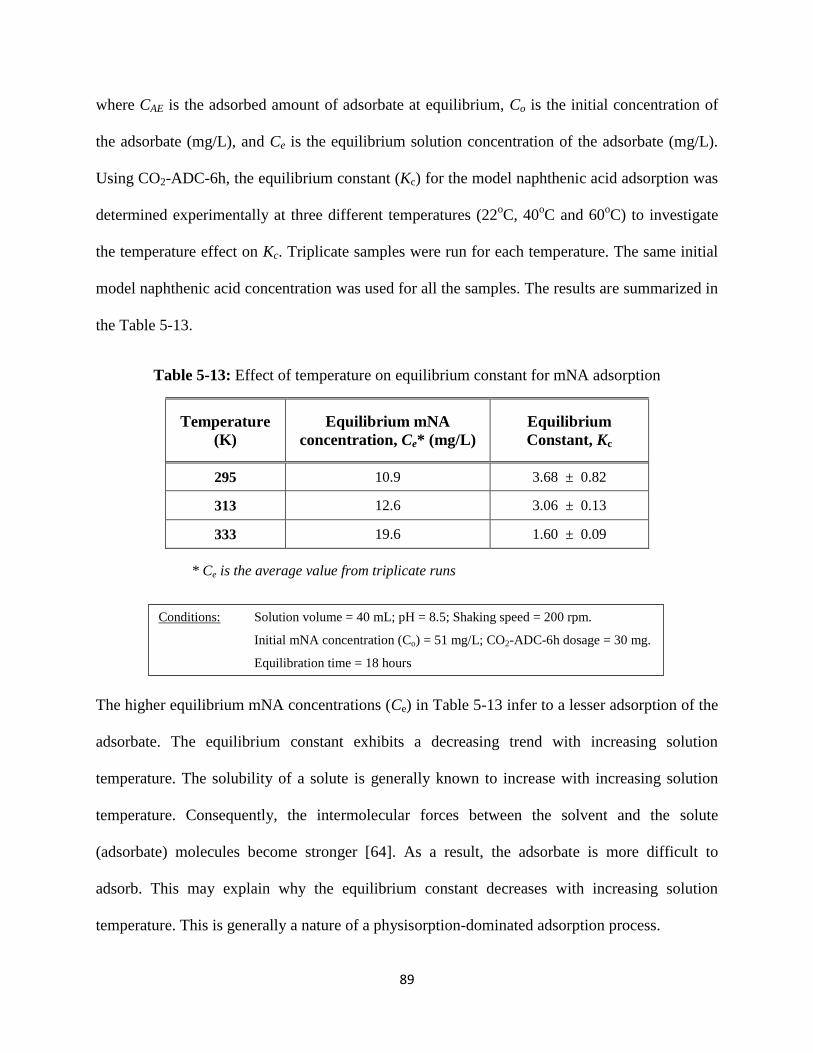
89
where CAE is the adsorbed amount of adsorbate at equilibrium, Co is the initial concentration of
the adsorbate (mg/L), and Ce is the equilibrium solution concentration of the adsorbate (mg/L).
Using CO2-ADC-6h, the equilibrium constant (Kc) for the model naphthenic acid adsorption was
determined experimentally at three different temperatures (22oC, 40
oC and 60
oC) to investigate
the temperature effect on Kc. Triplicate samples were run for each temperature. The same initial
model naphthenic acid concentration was used for all the samples. The results are summarized in
the Table 5-13.
Table 5-13: Effect of temperature on equilibrium constant for mNA adsorption
Temperature
(K)
Equilibrium mNA
concentration, Ce* (mg/L)
Equilibrium
Constant, Kc
295 10.9 3.68 ± 0.82
313 12.6 3.06 ± 0.13
333 19.6 1.60 ± 0.09
* Ce is the average value from triplicate runs
The higher equilibrium mNA concentrations (Ce) in Table 5-13 infer to a lesser adsorption of the
adsorbate. The equilibrium constant exhibits a decreasing trend with increasing solution
temperature. The solubility of a solute is generally known to increase with increasing solution
temperature. Consequently, the intermolecular forces between the solvent and the solute
(adsorbate) molecules become stronger [64]. As a result, the adsorbate is more difficult to
adsorb. This may explain why the equilibrium constant decreases with increasing solution
temperature. This is generally a nature of a physisorption-dominated adsorption process.
Conditions: Solution volume = 40 mL; pH = 8.5; Shaking speed = 200 rpm.
Initial mNA concentration (Co) = 51 mg/L; CO2-ADC-6h dosage = 30 mg.
Equilibration time = 18 hours

90
The change in Gibbs free energy is defined as follows [73]-
where ΔGo is the change in Gibbs free energy at standard conditions (J/mol), R is the universal
gas constant (8.3145 J/mol K), T is the temperature (K) and QR is the reaction quotient. At
equilibrium, ΔG = 0 and the reaction quotient becomes the equilibrium constant (QR = Kc). By
applying these conditions to equation 5.5, the following expression can be obtained-
The change in Gibbs free energy can also be defined in terms the change in enthalpy and entropy
[73]-
The following expression can be obtained by substituting equation 5.6 into equation 5.7-
where ΔHo is the change in enthalpy (kJ/mol) and ΔS
o is the change in entropy (J/mol K) at
standard conditions. Figure 5-17 displays a plot of ln Kc versus 1/T. The slope and the y-intercept
were used to determine the values of ΔHo and ΔS
o. The ΔG
o values for corresponding
temperatures were then calculated using equation 5.7. The thermodynamic parameters are
summarized in Table 5-14.
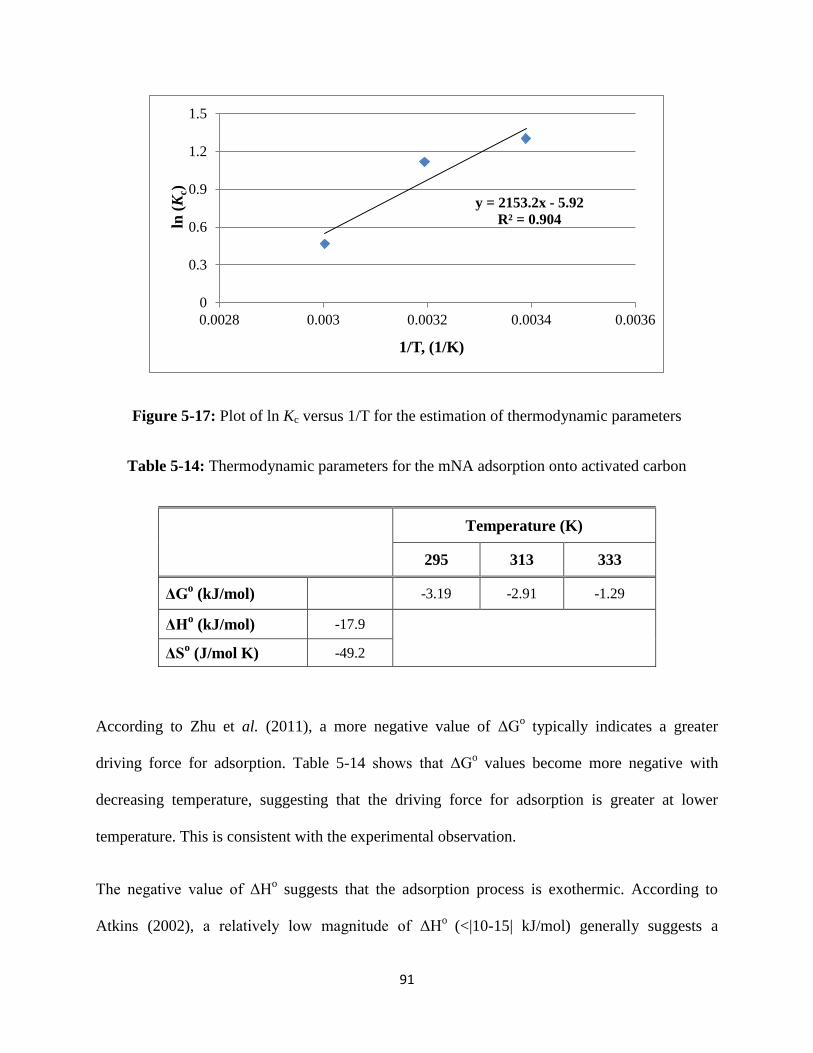
91
Figure 5-17: Plot of ln Kc versus 1/T for the estimation of thermodynamic parameters
Table 5-14: Thermodynamic parameters for the mNA adsorption onto activated carbon
Temperature (K)
295 313 333
ΔGo (kJ/mol)
-3.19 -2.91 -1.29
ΔHo (kJ/mol) -17.9
ΔSo (J/mol K) -49.2
According to Zhu et al. (2011), a more negative value of ΔGo typically indicates a greater
driving force for adsorption. Table 5-14 shows that ΔGo values become more negative with
decreasing temperature, suggesting that the driving force for adsorption is greater at lower
temperature. This is consistent with the experimental observation.
The negative value of ΔHo suggests that the adsorption process is exothermic. According to
Atkins (2002), a relatively low magnitude of ΔHo
(<|10-15| kJ/mol) generally suggests a
y = 2153.2x - 5.92
R² = 0.904
0
0.3
0.6
0.9
1.2
1.5
0.0028 0.003 0.0032 0.0034 0.0036
ln (
Kc)
1/T, (1/K)

92
physisorption-dominated process while chemisorption is reflected by relatively high magnitudes
of enthalpy of adsorption (>|20|kJ/mol) [3]. Based on the enthalpy value obtained for the model
naphthenic acid adsorption (-17.9 kJ/mol), a physisorption-dominated process may be suggested
for adsorption onto CO2-activated petroleum coke.
Due to the mNA adsorption, the disorder or the randomness at the solid-liquid interface
decreases from the initial state. This explains why a negative ΔSo
value is observed at the solid-
liquid interface upon adsorption.
5.2.2.4 Equilibrium Adsorption of TAOs from Real Tailings Pond Water
The equilibrium adsorption of NA-type total acid-extractable organics (TAOs) from ‘real’
tailings pond water (RTPW) was investigated. TAOs are complex naphthenic acid mixtures
quantified by FTIR spectroscopy. The tailings pond water was provided by Suncor Energy.
Figure 5-18 displays the isotherms for the TAOs adsorption from RTPW and the mNA
adsorption from synthetic tailings pond water (STPW). CO2-ADC-9h-pNH3 was used as the
adsorbent for both experiments.
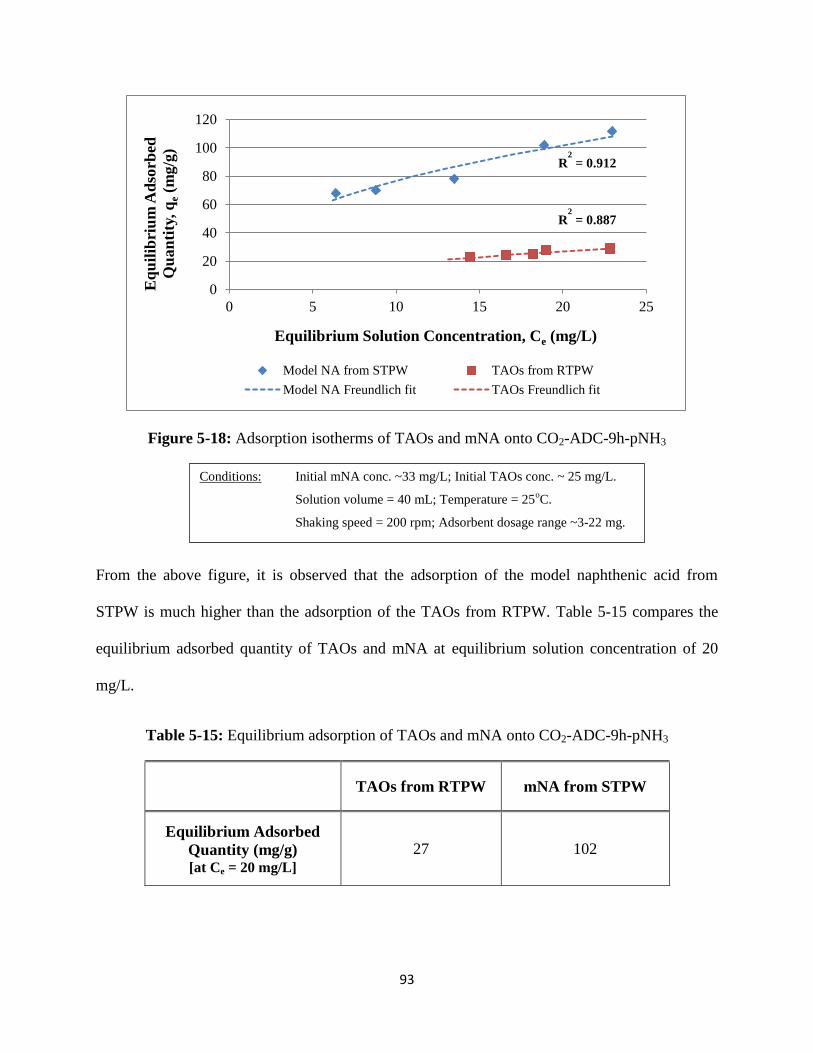
93
Figure 5-18: Adsorption isotherms of TAOs and mNA onto CO2-ADC-9h-pNH3
From the above figure, it is observed that the adsorption of the model naphthenic acid from
STPW is much higher than the adsorption of the TAOs from RTPW. Table 5-15 compares the
equilibrium adsorbed quantity of TAOs and mNA at equilibrium solution concentration of 20
mg/L.
Table 5-15: Equilibrium adsorption of TAOs and mNA onto CO2-ADC-9h-pNH3
TAOs from RTPW mNA from STPW
Equilibrium Adsorbed
Quantity (mg/g) [at Ce = 20 mg/L]
27 102
0
20
40
60
80
100
120
0 5 10 15 20 25
Eq
uil
ibri
um
Ad
sorb
ed
Qu
an
tity
, q
e (
mg/g
)
Equilibrium Solution Concentration, Ce (mg/L)
Model NA from STPW TAOs from RTPW
Model NA Freundlich fit TAOs Freundlich fit
Conditions: Initial mNA conc. ~33 mg/L; Initial TAOs conc. ~ 25 mg/L.
Solution volume = 40 mL; Temperature = 25oC.
Shaking speed = 200 rpm; Adsorbent dosage range ~3-22 mg.
R2
= 0.912
R2
= 0.887

94
The above results show that under the same experimental conditions, the equilibrium adsorbed
quantity of NA-type total acid-extractable organics (TAOs) from real TPW was only 26% of that
of the model NA from synthetic TPW. There may be two reasons for this observation.
Firstly, the real tailing pond water is known to contain a wide range of chemical compounds.
Zubot (2010) reported the presence of a wide variety of polycyclic aromatic hydrocarbons such
as naphthalene, fluorene, anthracene, and pyrene in Syncrude tailings pond water. In a separate
study, Small (2011) reported the presence of the following trace metals in tailings pond water:
Al, Ni, Mo, Mn, Cu, Pb and V. It is highly probable that these other chemicals present in RTPW
will compete with TAOs (complex naphthenic acids mixture) for the active sites of activated
carbon. This would consequently reduce the amount of active site available for the TAOs
adsorption, and thereby reducing the overall adsorption of TAOs. However, this is not the case
for the model naphthenic acid adsorption since the synthetic tailings pond water did not contain
those other chemicals. This may explain why the model naphthenic adsorption from STPW is
greater than the adsorption of the TAOs from RTPW using the same adsorbent.
Secondly, the naphthenic acids present in the real tailing ponds water may be larger in
dimensions in comparison to the model acid. Zubot (2010) characterized the structures of the
naphthenic acids found in real tailings pond water and concluded that most of the NA molecules
in real tailings pond water have carbon numbers between 12 to16 and z values between -2 to -6
(1 to 3 ring structures). Hence, it is conceivable that the larger naphthenic acid molecules in the
real tailing pond water may not be able to diffuse into the smaller pores that are accessible to the
model naphthenic acid. This could also contribute to the lesser adsorption of the TAOs observed
in this study.

95
CHAPTER 6 CONCLUSIONS AND RECOMMENDATIONS
6.1 Conclusions
In this study, the adsorptive removal of a model naphthenic acid and total acid-extractable
organics from oil sands tailings pond water was investigated using petroleum coke-derived
activated carbon. The adsorbents were produced from Suncor ‘delayed’ coke by several
activation methods. A significant portion of this research study was dedicated to understanding
the effects of the adsorbent pore structure and surface functionalities on the model naphthenic
acid adsorption by means of a kinetic and an equilibrium study. The conclusions drawn from
these studies are summarized below-
Activated Carbon Synthesis and Characterization:
1. The steam-activated carbon exhibited a high microporous volume (75%), whereas the
CO2-activated carbons (CO2-ADC-6h and CO2-ADC-9h) displayed high mesoporous
volume (51% and 67%, respectively). This trend in the pore size distribution was most
likely influenced by the difference in the size of the reagent molecules between H2O and
CO2.
2. The specific surface area and the total pore volume of CO2-activated carbon increased
with activation time. CO2-ADC-6h had a SSA of 276 m2/g, while CO2-ADC-9h had a
SSA of 405 m2/g.
3. The post-oxidative treatment of activated carbon introduced acidic oxygen
functionalities on the adsorbent surface. Carboxylic, lactonic, and phenolic groups were
detected on the post-oxidized adsorbent and quantified by Boehm titration. The results
were consistent with the findings from FTIR surface analysis of the adsorbents. As

96
expected, oxidation with an oxygen-rich stream was more effective than oxidation with
air.
4. Post-treatment with gaseous ammonia introduced basic nitrogen groups on the activated
carbon surface. FTIR analysis indicated the presence of nitrile, amine and amide groups
on the ammonia-treated activated carbon. Elemental analysis of the adsorbent displayed a
10% increase in the elemental nitrogen content after post-treatment with ammonia.
Adsorption Kinetics:
A batch-type kinetic study was performed with only the model naphthenic acid. The key findings
are highlighted below-
1. The experimental kinetic data was best represented by the empirical pseudo-2nd
order rate
model. Positive correlation was observed between the pseudo-2nd
order rate constant and
the mesoporous volume fraction of the adsorbents. Given the molecular dimensions of
the model acid (1.2x0.25x0.25 nm), it was expected that the diffusion of the adsorbate
molecules through mesopores would be conceivably easier than the diffusion through
micropores.
2. The rate-controlling step is most likely the intraparticle diffusive transport of naphthenic
acid. Key evidences include the relatively low value of the apparent activation energy
(7.7 kJ/mol) and the observed positive correlation between the initial rate of adsorption
and the initial bulk concentration of the adsorbate.
3. The ‘effect of surface functional groups’ study revealed a negative correlation between
the surface oxygen content of the adsorbents and the model naphthenic acid adsorption
rates. The Weber-Morris intraparticle diffusion rate model was used to interpret the
97
experimental data. The intraparticle diffusion rate constants decreased with increasing
adsorbent surface oxygen content. The steric hindrance and electrostatic repulsion caused
by the oxygen functionalities presumably limits diffusive mass transfer.
Equilibrium Adsorption Study:
1. The model naphthenic acid equilibrium adsorption data was best represented by the
Freundlich isotherm model, which generally indicates heterogeneity of adsorbent
surface and multilayer adsorption, suggesting a major role of physisorption. For given
equilibrium concentration of the adsorbate in water, a positive correlation between the
equilibrium adsorbed quantity of mNA and the adsorbent mesoporous SSA was
observed.
2. A negative correlation between the equilibrium adsorbed quantity and the adsorbent
surface oxygen content suggested that acidic oxygen functional groups had
diminishing effects on the equilibrium adsorption of the model naphthenic acid. This
was most likely due to the steric hindrance and electrostatic repulsion caused by the
oxygen-based surface functional groups.
3. Among the four adsorbents used in the ‘effect of surface functionalities’ study, the
ammonia post-treated activated carbon displayed the highest equilibrium adsorbed
mNA quantity. The expected charge-based interaction between the model naphthenic
acid and the basic nitrogen functional groups on the adsorbent surface may have
caused the high equilibrium adsorption. Consequently, there is a potential for
chemisorption in naphthenic acid adsorption with chemically-modified activated
carbons.

98
4. There was a negative temperature dependence of adsorption equilibrium constant of
the model naphthenic acid - a character of physisorption. The thermodynamic
analysis on CO2-activated coke revealed negative ΔHo and ΔS
o, which indicates an
exothermic process and a decrease in system randomness. Consequently, the removal
of naphthenic acid with CO2-activated coke is likely dominated by physisorption.
5. Using the ammonia post-treated activated carbon, the adsorption of NA-type total
acid-extractable organics (TAOs) from real tailings pond water was compared to that
from the synthetic tailings pond water. The adsorption amount from the latter was
greater. This observation may suggest the competitive adsorption between NA-type
organics and other organics in tailings pond water. Another possibility that needs
verification is that in tailings pond water the NA-type TAOs consist of mainly
naphthenic acids larger than the model naphthenic acid. It is anticipated that the
intraparticle diffusion and the subsequent adsorption of these larger naphthenic acids
might have been hindered due to physical constraints resulting from their larger size.

99
6.2 Recommendations
1. The FTIR technique for naphthenic acid detection cannot differentiate between different
naphthenic acid species. This is not an issue when working with a single naphthenic acid
species (i.e., model naphthenic acid). However, when the studying the adsorption of
complex naphthenic acid mixtures from tailings pond water, it would be beneficial to
employ an instrument that can both characterize and quantify different naphthenic acids
species (i.e., GC-MS or HPLC-MS). Information about the adsorption of different
naphthenic acid species would allow one to better design and tailor the activated carbon
adsorbents.
2. The kinetic study demonstrated that mesopores are favourable for the model naphthenic
acid adsorption. Zubot’s work (2011) suggested that majority of the naphthenic acid
species in tailing pond water have carbon numbers between 12 and 16 and z values
between -2 and -6. This implies that most of the naphthenic acid species in tailing pond
water are either larger than or just as large as the model acid used in this study. Hence,
the use of highly microporous activated carbon for adsorption should be avoided.
Techniques that produce mostly mesoporous adsorbents should be investigated.
3. The point of zero charge (pzc) of the surface-modified activated carbons could be
obtained to better understand the interactions between the surface functionalities of
activated carbon and naphthenic acid. Increasing the adsorbent basicity had a positive
effect on the equilibrium adsorption of naphthenic acid. It would be worth awhile to
investigate more efficient ways to introduce basic functionalities on activated carbon
surface.

100
4. Adsorption of surfactants is influenced by the surface charge of adsorbents, and the
surface charge of an adsorbent is pH-dependent. Hence, the effect of pH on adsorption
should be investigated.
5. Tailings pond water is known to contain a large quantity of fine clay minerals (i.e.,
kaolinite). The effects of these minerals on naphthenic acid adsorption should also be
investigated.
6. The tailings pond water should be analyzed for other chemical groups (i.e., heavy metals,
total organic carbons) before and after the adsorption process. With this information, it
would easier to understand the competitive adsorption between naphthenic acids and
other chemical species. Chemicals leached from petroleum coke-derived activated carbon
could also be detected from such analysis.
7. The toxicity of naphthenic acids is known to vary with their chemical structure. It would
be beneficial to target the naphthenic acid species that are most suspected for causing the
toxicity.

101
REFERENCES
[1] Amuda, O. S., Giwa, A. A., & Bello, I. A. (2007). Removal of heavy metal from industrial
wastewater using modified activated coconut shell carbon. Biochemical Engineering
Journal, 36(2), 174-181. doi: 10.1016/j.bej.2007.02.013
[2] Anirudhan, T. S., & Sreekumari, S. S. (2011). Adsorptive removal of heavy metal ions from
industrial effluents using activated carbon derived from waste coconut buttons. Journal of
Environmental Sciences, 23(12), 1989-1998. doi: 10.1016/S1001-0742(10)60515-3
[3] Atkins, P. W. (2002). In DePaula J. (Ed.), Physical chemistry (7th ed. ed.). New York:
Freeman.
[4] Awoyemi, A. (2011). Understanding the adsorption of polycyclic aromatic hydrocarbons
from aqueous phase onto activated carbon. Master of Applied Science Thesis, University of
Toronto
[5] Bandosz, T. J. (1999). Effect of pore structure and surface chemistry of virgin activated
carbons on removal of hydrogen sulfide. Carbon, 37(3), 483-491. doi: 10.1016/S0008-
6223(98)00217-6
[6] Bandosz, T. J. (2006). In edited by Teresa J. Bandosz. (Ed.), Activated carbon surfaces in
environmental remediation / Amsterdam ;London : Elsevier, 2006.
[7] Bansal, R. C., Goyal, M. (2005), Activated carbon adsorption. New York: Taylor and
Francis, 2005.
[8] Bataineh, M., Scott, A. C., Fedorak, P. M., & Martin, J. W. (2006). Capillary HPLC/QTOF-
MS for characterizing complex naphthenic acid mixtures and their microbial transformation.
Analytical Chemistry, 78(24), 8354-8361. doi: 10.1021/ac061562p

102
[9] Baumeister, U., Hartung, H., & Jaskólski, M. (1982). The crystal and molecular structure of
the nematogenic compound 4′-cyanophenyl-4-n-pentylcyclohexanoate. Crystal Research
and Technology, 17(2), 153-160.
[10] Biryukova, O. V., Fedorak, P. M., & Quideau, S. A. (2007). Biodegradation of naphthenic
acids by rhizosphere microorganisms. Chemosphere, 67(10), 2058-2064. doi:
10.1016/j.chemosphere.2006.11.063
[11 Boehm, H. P. (1994). Some aspects of the surface chemistry of carbon blacks and other
carbons. Carbon, 32(5), 759-769. doi: 10.1016/0008-6223(94)90031-0
[12] Boparai, H. K., Joseph, M., & O’Carroll, D. M. (2011). Kinetics and thermodynamics of
cadmium ion removal by adsorption onto nano zerovalent iron particles. Journal of
Hazardous Materials, 186(1), 458-465. doi: 10.1016/j.jhazmat.2010.11.029
[13] Bratu, M. (2008). Activation of fluid coke for mercury removal from gases. (M.Sc.,
University of Alberta (Canada)). ProQuest Dissertations and Theses, . (304409210).
[14] Cansado, I. P. P., Mourão, P. A. M., Falcão, A. I., Carrott, M. M. L. R., & Carrott, P. J. M.
(2012). The influence of the activated carbon post-treatment on the phenolic compounds
removal. Fuel Processing Technology, 103(0), 64-70. doi: 10.1016/j.fuproc.2011.10.015
[15] Chakraborty, A., Deva, D., Sharma, A., & Verma, N. (2011). Adsorbents based on carbon
microfibers and carbon nanofibers for the removal of phenol and lead from water. Journal
of Colloid and Interface Science, 359(1), 228-239. doi: 10.1016/j.jcis.2011.03.057
[16] Clemente, J. S., & Fedorak, P. M. (2004). Evaluation of the analyses of tert-
butyldimethylsilyl derivatives of naphthenic acids by gas chromatography-electron impact
mass spectrometry. Journal of Chromatography A, 1047(1), 117-128. doi:
10.1016/j.chroma.2004.06.065
[17] Clemente, J. S., & Fedorak, P. M. (2005). A review of the occurrence, analyses, toxicity,
and biodegradation of naphthenic acids. Chemosphere, 60(5), 585-600. doi:
10.1016/j.chemosphere.2005.02.065
103
[18] Crank, J. (1964). The mathematics of diffusion. Oxford, Clarendon Press [1964].
[19] DiPanfilo, R., & Egiebor, N. O. (1996). Activated carbon production from synthetic crude
coke. Fuel Processing Technology, 46(3), 157-169. doi: 10.1016/0378-3820(95)00054-2
[20] Drzewicz, P., Afzal, A., El-Din, M. G., & Martin, J. W. (2010). Degradation of a model
naphthenic acid, cyclohexanoic acid, by vacuum UV (172 nm) and UV (254 nm)/H2O2. The
Journal of Physical Chemistry A, 114(45), 12067-12074. doi: 10.1021/jp105727s
[21] Everett, D. H. (1971). Manual of symbols and terminology for physicochemical quantities
and units. Butterworths and Pure and Applied Chemistry, 21(1)
[22] Exeter Analytical Inc. (2005). CE-440 elemental analyzer manual;
http://www.eai1.com/theory.htm.
[23] Fuertes, A. B., & Alvarez, S. (2004). Graphitic mesoporous carbons synthesised through
mesostructured silica templates. Carbon, 42(15), 3049-3055. doi:
10.1016/j.carbon.2004.06.020
[24] Gamal El-Din, M., Fu, H., Wang, N., Chelme-Ayala, P., Pérez-Estrada, L., Drzewicz, P., . . .
Smith, D. W. (2011). Naphthenic acids speciation and removal during petroleum-coke
adsorption and ozonation of oil sands process-affected water. Science of the Total
Environment, 409(23), 5119-5125. doi: 10.1016/j.scitotenv.2011.08.033
[25] Goertzen, S. L., Thériault, K. D., Oickle, A. M., Tarasuk, A. C., & Andreas, H. A. (2010).
Standardization of the boehm titration. part I. CO2 expulsion and endpoint determination.
Carbon, 48(4), 1252-1261. doi: 10.1016/j.carbon.2009.11.050
[26] Grewer, D. M., Young, R. F., Whittal, R. M., & Fedorak, P. M. (2010). Naphthenic acids
and other acid-extractables in water samples from alberta: What is being measured? Science
of the Total Environment, 408(23), 5997-6010. doi: 10.1016/j.scitotenv.2010.08.013

104
[27] Guo, S., Peng, J., Li, W., Yang, K., Zhang, L., Zhang, S., & Xia, H. (2009). Effects of CO2
activation on porous structures of coconut shell-based activated carbons. Applied Surface
Science, 255(20), 8443-8449. doi: 10.1016/j.apsusc.2009.05.150
[28] Han, X., MacKinnon, M. D., & Martin, J. W. (2009). Estimating the in situ biodegradation
of naphthenic acids in oil sands process waters by HPLC/HRMS. Chemosphere, 76(1), 63-
70. doi: 10.1016/j.chemosphere.2009.02.026
[29] Ho, Y. S., & McKay, G. (1999). Pseudo-second order model for sorption processes. Process
Biochemistry, 34(5), 451-465. doi: 10.1016/S0032-9592(98)00112-5
[30] Holowenko, F. M., MacKinnon, M. D., & Fedorak, P. M. (2001). Naphthenic acids and
surrogate naphthenic acids in methanogenic microcosms. Water Research, 35(11), 2595-
2606. doi: 10.1016/S0043-1354(00)00558-3
[31] Holowenko, F. M., MacKinnon, M. D., & Fedorak, P. M. (2002). Characterization of
naphthenic acids in oil sands wastewaters by gas chromatography-mass spectrometry. Water
Research, 36(11), 2843-2855. doi: 10.1016/S0043-1354(01)00492-4
[32] Hsu, L., & Teng, H. (2000). Influence of different chemical reagents on the preparation of
activated carbons from bituminous coal. Fuel Processing Technology, 64(1-3), 155-166.
doi: 10.1016/S0378-3820(00)00071-0
[33] Huynh, D. (2012). The fate of sulphur and vanadium in oil-sands petroleum coke during
physical activation and while in contact with tailings pond water. Masters of Engineering
Thesis, University of Toronto
[34] Ihara, Y. (1992). Adsorption of anionic surfactants and related compounds from aqueous
solution onto activated carbon and synthetic adsorbent. Journal of Applied Polymer Science,
44(10), 1837-1840. doi: 10.1002/app.1992.070441017
[35] İnci, İ., Bayazit, Ş. S., & Uslu, H. (2011). Investigation of adsorption equilibrium and
kinetics of propionic acid and glyoxylic acid from aqueous solution by alumina. Journal of
Chemical & Engineering Data, 56(8), 3301-3308. doi: 10.1021/je2000765

105
[36] Janfada, A., Headley, J. V., Peru, K. M., & Barbour, S. L. (2006). A laboratory evaluation
of the sorption of oil sands naphthenic acids on organic rich soils. Journal of Environmental
Science and Health, Part A, 41(6), 985-997. doi: 10.1080/10934520600620105
[37] Jia, C. Q. (2009). Activated carbon from Suncor delayed coke. Reporting Period #1,
September 1st to 15th, 2009
[38] Jiang, T., Hirasaki, G. J., Miller, C. A., & Ng, S. (2011). Wettability alteration of clay in
solid-stabilized emulsions. Energy & Fuels, 25(6), 2551-2558. doi: 10.1021/ef2000079
[39] Jivraj, M., MacKinnon, M. D., & Fung, B. (1996). Naphthenic acid extraction and
quantitative analysis with FT-IR spectroscopy. Syncrude Canada Ltd. Report,
[40] Kannel, P. R., & Gan, T. Y. (2012). Naphthenic acids degradation and toxicity mitigation in
tailings wastewater systems and aquatic environments: A review. Journal of Environmental
Science and Health, Part A, 47(1), 1-21. doi: 10.1080/10934529.2012.629574
[41] Kavanagh, R. J., Burnison, B. K., Frank, R. A., Solomon, K. R., & Van Der Kraak, G.
(2009). Detecting oil sands process-affected waters in the alberta oil sands region using
synchronous fluorescence spectroscopy. Chemosphere, 76(1), 120-126. doi:
10.1016/j.chemosphere.2009.02.007
[42] Kiran, S. K., Ng, S., & Acosta, E. J. (2011). Impact of asphaltenes and naphthenic
amphiphiles on the phase behavior of Solvent−Bitumen−Water systems. Energy Fuels,
25(5), 2223-2231. doi: 10.1021/ef1016285
[43] Machida, M., Amano, Y., & Aikawa, M. (2011). Adsorptive removal of heavy metal ions by
activated carbons. Carbon, 49(10), 3393-3393. doi: 10.1016/j.carbon.2011.04.011
[44] Mangun, C. L., DeBarr, J. A., & Economy, J. (2001). Adsorption of sulfur dioxide on
ammonia-treated activated carbon fibers. Carbon, 39(11), 1689-1696. doi: 10.1016/S0008-
6223(00)00300-6

106
[45] Merlin, M., Guigard, S. E., & Fedorak, P. M. (2007). Detecting naphthenic acids in waters
by gas chromatography-mass spectrometry. Journal of Chromatography A, 1140(1-2), 225-
229. doi: 10.1016/j.chroma.2006.11.089
[46] Missen, R. W. (1999). In Mims C. A., Saville B. A. (Eds.), Introduction to chemical
reaction engineering and kinetics. New York: Wiley.
[47] Mohamed, M. H., Wilson, L. D., Headley, J. V., & Peru, K. M. (2008). Screening of oil
sands naphthenic acids by UV-vis absorption and fluorescence emission spectrophotometry.
Journal of Environmental Science and Health, Part A, 43(14), 1700-1705. doi:
10.1080/10934520802330255
[48] Mohamed, M. H., Wilson, L. D., Headley, J. V., & Peru, K. M. (2010). Sequestration of
naphthenic acids from aqueous solution using β-cyclodextrin-based polyurethanes. Physical
Chemistry Chemical Physics, 13(3), 1112-1122. doi: 10.1039/c0cp00421a
[49] Morris, E. A. (2012). Modification of carbonaceous materials with sulfer and its impact on
mercury capture and sorbent regeneration. Doctor of Philosophy Thesis, University of
Toronto
[50] Morris, E. A., Choi, R., & Jia, C. Q. (2012). Sulfur dioxide as an activating agent for sulfur-
impregnated activated carbon produced from dense petroleum coke. Journal of Sulfur
Chemistry, , 1-12. doi: 10.1080/17415993.2012.739622
[51] Neimark, A. V., Lin, Y., Ravikovitch, P. I., & Thommes, M. (2009). Quenched solid density
functional theory and pore size analysis of micro-mesoporous carbons. Carbon, 47(7), 1617-
1628. doi: 10.1016/j.carbon.2009.01.050
[52] Oickle, A. M., Goertzen, S. L., Hopper, K. R., Abdalla, Y. O., & Andreas, H. A. (2010).
Standardization of the boehm titration: Part II. method of agitation, effect of filtering and
dilute titrant. Carbon, 48(12), 3313-3322. doi: 10.1016/j.carbon.2010.05.004
107
[53] Pastor-Villegas, J., & Durán-Valle, C. J. (2002). Pore structure of activated carbons
prepared by carbon dioxide and steam activation at different temperatures from extracted
rockrose. Carbon, 40(3), 397-402. doi: 10.1016/S0008-6223(01)00118-X
[54] Patrick, J. W. (1994). In Patrick J. W. (Ed.), Porosity in carbons characterization and
applications. London: E. Arnold.
[55] Pavia, D., Lampman, G., Kriz, G., & Vyvyan, J. (2009). Introduction to spectroscopy (4th
Edition ed.) Brooks/Cole.
[56] Pendleton, P., Wu, S., & Badalyan, A. (2002). Activated carbon oxygen content influence
on water and surfactant adsorption RID B-2148-2010. Journal of Colloid and Interface
Science, 246(2), 235-240. doi: 10.1006/jcis.2001.8052
[57] Peng, J., Headley, J. V., & Barbour, S. L. (2002). Adsorption of single-ring model
naphthenic acids on soils. Canadian Geotechnical Journal, 39(6), 1419-1426.
[58] Przepiórski, J., Skrodzewicz, M., & Morawski, A. W. (2004). High temperature ammonia
treatment of activated carbon for enhancement of CO2 adsorption. Applied Surface Science,
225(1-4), 235-242. doi: 10.1016/j.apsusc.2003.10.006
[59] Qu, Y., Zhang, C., Li, F., Bo, X., Liu, G., & Zhou, Q. (2009). Equilibrium and kinetics
study on the adsorption of perfluorooctanoic acid from aqueous solution onto powdered
activated carbon. Journal of Hazardous Materials, 169(1-3), 146-152. doi:
10.1016/j.jhazmat.2009.03.063
[60] Quantachrome Instruments. (2008). AUTOSORB-1 AS1Win version 1.5X operating
manual., 101.
[61] Ramana, D. K. V., Jamuna, K., Satyanarayana, B., Venkateswarlu, B., Rao, M. M., &
Seshaiah, K. (2010). Removal of heavy metals from aqueous solutions using activated
carbon prepared from cicer arietinum. Toxicological and Environ Chemistry, 92(8), 1447-
1460. doi: 10.1080/02772241003614312

108
[62] Rogers, V. V., Liber, K., & MacKinnon, M. D. (2002). Isolation and characterization of
naphthenic acids from athabasca oil sands tailings pond water. Chemosphere, 48(5), 519-
527. doi: 10.1016/S0045-6535(02)00133-9
[63] Rouquerol, J., Llewllyn, P., & Rouquerol, F. (2007). Is the BET equation applicable to
microporous adsorbents. Studies in Surface Science and Catalysis, 160, 49-56.
[64] Saha, P., & Chowdhury, S. (2011). Insight into adsorption thermodynamics. In M. Tadashi
(Ed.), Thermodynamics (pp. Chapter 16) InTech.
[65] Scott, A. C., Mackinnon, M. D., & Fedorak, P. M. (2005). Naphthenic acids in athabasca oil
sands tailings waters are less biodegradable than commercial naphthenic acids.
Environmental Science & Technology, 39(21), 8388-8394. doi: 10.1021/es051003k
[66] Scott, A. C., Young, R. F., & Fedorak, P. M. (2008). Comparison of GC–MS and FTIR
methods for quantifying naphthenic acids in water samples. Chemosphere, 73(8), 1258-
1264. doi: 10.1016/j.chemosphere.2008.07.024
[67] Seader, J. D., Henley, E. J. (2005), Separation process principles (2nd ed. ed.). Chichester:
John Wiley & Sons.
[68] Shawwa, A. R., Smith, D. W., & Sego, D. C. (2001). Color and chlorinated organics
removal from pulp mills wastewater using activated petroleum coke. Water Research, 35(3),
745-749. doi: 10.1016/S0043-1354(00)00322-5
[69] Sing, K., Everett, D. H., Haul, R., Moscou, L., Pierotti, R. A., Rouquerol, J., &
Siemieniewska, T. (1985). Reporting physisorption data for gas/solid systems with special
reference to the determination of surface area and porosity (recommendations 1984). Pure
and Applied Chemistry, 57(4), 603-619. doi: doi: 10.1351/pac198557040603
[70] Small, C., Ulrich, A., & Hashisho, Z. (2012). Adsorption of acid extractable oil sands
tailings organics onto raw and activated oil sands coke. Journal of Environmental
Engineering, 138(8), 833-840. doi: 10.1061/(ASCE)EE.1943-7870.0000543

109
[71] Small, C. C. (2011). Activation of delayed and fluid petroleum coke for adsorption and
removal of naphthenic acids from oil sands tailings pond water. Master of Science Thesis,
University of Alberta
[72] Small, C. C., Hashisho, Z., & Ulrich, A. C. (2012). Preparation and characterization of
activated carbon from oil sands coke. Fuel, 92(1), 69-76. doi: 10.1016/j.fuel.2011.07.017
[73] Smith, J. M., & Abbott, M. (2001). In Van Ness H. C. (Ed.), Introduction to chemical
engineering thermodynamics (7th ed. ed.). New York: McGraw-Hill.
[74] Strausz, O. P. (1977). The chemistry of alberta oil sand bitumen. Chemical Institute of
Canada and American Chemical Society Joint Confernece, Montreal,
[75] Valderrama, C., Gamisans, X., de las Heras, X., Farran, A., & Cortina, J. L. (2008).
Sorption kinetics of polycyclic aromatic hydrocarbons removal using granular activated
carbon: Intraparticle diffusion coefficients. Journal of Hazardous Materials, 157(2-3), 386-
396. doi: 10.1016/j.jhazmat.2007.12.119
[76] Wang, X., & Kasperski, K. L. (2010). Analysis of naphthenic acids in aqueous solution
using HPLC-MS/MS. Analytical Methods, 2(11), 1715-1722.
[77] Whitby, C. (2010). Chapter 3 - Microbial naphthenic acid degradation. Advances in applied
microbiology (pp. 93-125) Academic Press. doi: 10.1016/S0065-2164(10)70003-4
[78] Wu, S. H., & Pendleton, P. (2001). Adsorption of anionic surfactant by activated carbon:
Effect of surface chemistry, ionic strength, and hydrophobicity. Journal of Colloid and
Interface Science, 243(2), 306-315. doi: 10.1006/jcis.2001.7905
[79] Yalçin, M., Gürses, A., Doğar, Ç., & Sözbilir, M. (2005). The adsorption kinetics of
cethyltrimethylammonium bromide (CTAB) onto powdered active carbon. Adsorption,
10(4), 339-348. doi: 10.1007/s10450-005-4819-9
[80] Yang, R. T. (2003). Adsorbents : Fundamentals and applications. Hoboken, NJ: Wiley-
Interscience.

110
[81] Yen, T., Marsh, W. P., MacKinnon, M. D., & Fedorak, P. M. (2004). Measuring naphthenic
acids concentrations in aqueous environmental samples by liquid chromatography. Journal
of Chromatography A, 1033(1), 83-90. doi: 10.1016/j.chroma.2004.01.030
[82] Yuan, M., Tong, S., Zhao, S., & Jia, C. Q. (2010). Adsorption of polycyclic aromatic
hydrocarbons from water using petroleum coke-derived porous carbon. Journal of
Hazardous Materials, 181(1-3), 1115-1120. doi: 10.1016/j.jhazmat.2010.05.130
[83] Zhang, Y., Shi, W., Zhou, H., Fu, X., & Chen, X. (2010). Kinetic and thermodynamic
studies on the adsorption of anionic surfactant on quaternary ammonium cationic cellulose.
Water Environment Research, 82(6), 567-573.
[84] Zhu, H., Yang, X., Mao, Y., Chen, Y., Long, X., & Yuan, W. (2011). Adsorption of EDTA
on activated carbon from aqueous solutions. Journal of Hazardous Materials, 185(2-3),
951-957. doi: 10.1016/j.jhazmat.2010.09.112
[85] Zubot, W. A. (2010). Removal of naphthenic acids from oil sands process water using
petroleum coke. Master of Science Thesis, University of Alberta
[86] Zubot, W., MacKinnon, M. D., Chelme-Ayala, P., Smith, D. W., & Gamal El-Din, M.
(2012). Petroleum coke adsorption as a water management option for oil sands process-
affected water. Science of the Total Environment, 427–428(0), 364-372. doi:
10.1016/j.scitotenv.2012.04.024

111
APPENDIX A: Naphthenic acid quantification data
Table A1: mNA calibration data for Spectrum-BX Perkin Elmer FTIR spectrometer
Combined Monomer and Dimer Peak Height, (a.u.)
Concentration,
(mg/L) Run 1 Run 2 Run 3 Mean
Standard
Deviation
1 0.0019 0.0016 0.0027 0.0021 0.0005
5 0.0040 0.0040 - 0.0040 0.0000
10 0.0092 0.0099 0.0102 0.0098 0.0004
15 0.0186 0.0179 0.0215 0.0193 0.0016
20 0.0237 0.0249 0.0247 0.0244 0.0005
25 0.0335 0.0339 0.0321 0.0332 0.0008
50 0.0691 0.0703 0.0672 0.0689 0.0013
100 0.1258 0.1275 0.1277 0.1270 0.0009
150 0.2070 0.2075 0.2109 0.2085 0.0017
200 0.2823 0.2822 0.2794 0.2813 0.0013
250 0.3627 0.3624 0.3695 0.3649 0.0033
300 0.4402 0.4397 0.4384 0.4394 0.0008
Figure A1: FTIR calibration curve of mNA with Spectrum-BX spectrometer
y = 0.0015x - 0.0051
R² = 0.997
0.00
0.10
0.20
0.30
0.40
0.50
0 50 100 150 200 250 300 350
Co
mb
ind
Mon
om
er a
nd
Dim
er
Pea
k H
eigh
t, (
a.u
)
mNA Concentration in dichloromethane, (mg/L)

112
Table A2: mNA calibration data for Spectrum-One Perkin Elmer FTIR spectrometer
Combined Monomer and
Dimer Peak Height, (a.u.)
Concentration,
(mg/L) Run 1 Run 2 Standard Deviation
50 0.0490 0.0463 0.0013
100 0.1523 0.1484 0.0019
150 0.2060 0.2101 0.0021
200 0.2700 0.2697 0.0002
250 0.3424 0.3416 0.0004
Figure A2: FTIR calibration curve of mNA with Spectrum-One spectrometer
y = 0.0015x - 0.0087
R² = 0.989
0
0.1
0.2
0.3
0.4
0 50 100 150 200 250 300
Com
bin
d M
on
om
er a
nd
Dim
er
Pea
k H
eigh
t, (
a.u
)
mNA Concentration in dichloromethane, (mg/L)
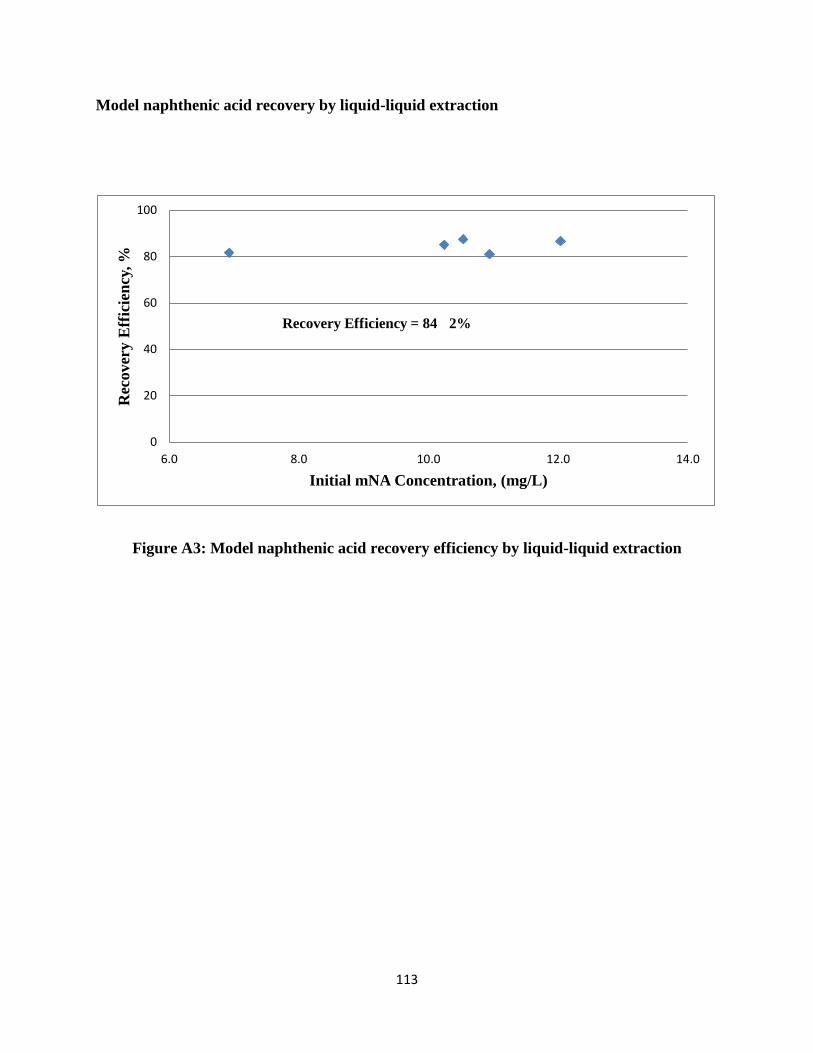
113
Model naphthenic acid recovery by liquid-liquid extraction
Figure A3: Model naphthenic acid recovery efficiency by liquid-liquid extraction
0
20
40
60
80
100
6.0 8.0 10.0 12.0 14.0
Rec
ov
ery E
ffic
ien
cy, %
Initial mNA Concentration, (mg/L)
Recovery Efficiency = 84
2%
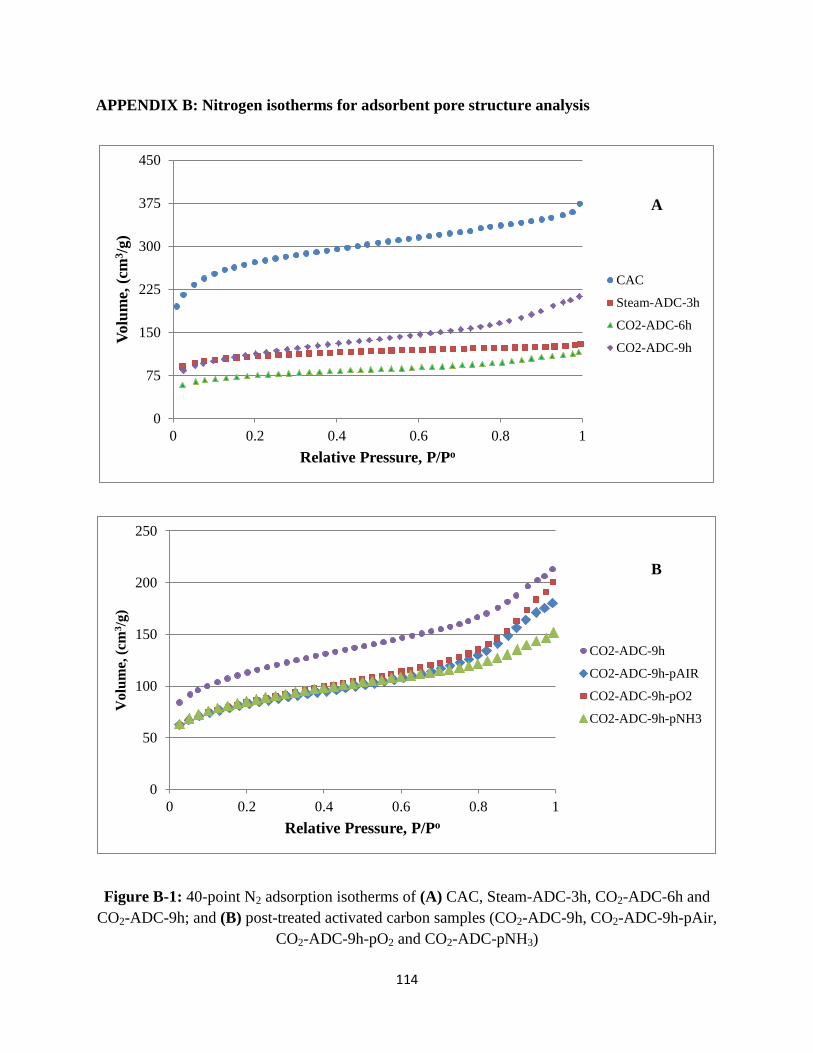
114
APPENDIX B: Nitrogen isotherms for adsorbent pore structure analysis
Figure B-1: 40-point N2 adsorption isotherms of (A) CAC, Steam-ADC-3h, CO2-ADC-6h and
CO2-ADC-9h; and (B) post-treated activated carbon samples (CO2-ADC-9h, CO2-ADC-9h-pAir,
CO2-ADC-9h-pO2 and CO2-ADC-pNH3)
0
75
150
225
300
375
450
0 0.2 0.4 0.6 0.8 1
Volu
me,
(cm
3/g
)
Relative Pressure, P/Po
CAC
Steam-ADC-3h
CO2-ADC-6h
CO2-ADC-9h
A
0
50
100
150
200
250
0 0.2 0.4 0.6 0.8 1
Volu
me, (c
m3/g
)
Relative Pressure, P/Po
CO2-ADC-9h
CO2-ADC-9h-pAIR
CO2-ADC-9h-pO2
CO2-ADC-9h-pNH3
B

115
APPENDIX C: Adsorption Kinetics Data
Table C-1: Effect of shaking speed on model NA adsorption on two different adsorbents
Using CAC
Using CO2-ADC-9h
Shaking Speed
(rpm)
mNA Concentration
after 40 mins (mg/L)
mNA Adsorbed
(%)
mNA Concentration
after 40 mins (mg/L)
mNA Adsorbed
(%)
0 44.87 31.5 44.71 8.3
50 32.15 50.9 40.89 16.1
75 24.90 62.0 n/m n/m
100 16.87 74.3 30.68 37.1
125 12.95 80.2 28.68 41.2
150 7.79 88.1 20.47 58.0
175 1.51 97.7 12.84 73.7
200 1.26 98.1 12.43 74.5
*n/m = not measured.
Conditions: Agitation duration = 40 mins; Solution volume = 40 mL; Solution pH = 8.5; Temperature = 25oC
For CAC: Initial mNA concentration ~66 mg/L; Adsorbent dosage ~20 mg
For CO2-ADC-9h: Initial mNA concentration ~48 mg/L; Adsorbent dosage ~20 mg

116
Table C-2: Time-dependent model NA adsorption data for the ‘Effect of Pore Structure’ study
Using CO2-ADC-6h Using Steam-ADC-3h
Using CAC
Time,
(min)
Aqueous Phase
Concentration,
Ct (mg/L)
Amount
Adsorbed, qt
(mg/g)
Time,
(min)
Aqueous
Phase
Concentration,
Ct (mg/L)
Amount
Adsorbed, qt
(mg/g)
Time,
(min)
Aqueous Phase
Concentration,
Ct (mg/L)
Amount
Adsorbed, qt
(mg/g)
0 91.8 0.0 0 91.8 0.0 0 91.8 0.0
10 56.0 143.4 9 82.1 38.9 9 54.5 149.3
19 48.7 172.3 19 76.9 59.8 19 36.8 220.2
40 47.8 176.2 40 65.0 107.3 40 30.5 245.3
60 43.9 191.9 59 62.1 119.0 59 25.1 266.8
95 41.9 199.6 95 52.1 158.7 98 24.7 268.7
Conditions: Solution volume = 40 mL; Solution pH = 8.5; Temperature = 25oC; Shaking speed = 200 rpm
Initial mNA concentration ~92mg/L; Adsorbent dosage ~10 mg

117
Sample kinetic model fits for ‘Effect of Pore Structure’ study using CO2-ADC-6h data
Figure C-1: Kinetic model fits for mNA adsorption on CO2-ADC-6h: (A) pseudo-2nd
order fit, (B) pseudo-1st order fit, and (C) Elvoich
model fit
y = 0.0048x + 0.0238
R² = 0.9984
0
0.1
0.2
0.3
0.4
0.5
0.6
0 20 40 60 80 100
t/q
t, (
min
g/m
g)
Time, (min)
CO2-ADC-6h pseudo-2nd order fit
Linear (CO2-ADC-6h pseudo-2nd order fit)
y = -0.0089x + 2.0536
R² = 0.7652
0
0.5
1
1.5
2
2.5
0 20 40 60 80 100
log
(qe-q
t)
Time, (min)
CO2-ADC-6h pseudo-1st order fit
Linear (CO2-ADC-6h pseudo-1st order fit)
y = 22.948x + 96.346
R² = 0.9311
0
50
100
150
200
250
0 1 2 3 4 5
qt,
(m
g/g
)
Ln(t)
CO2-ADC-6h Elovich fit Linear (CO2-ADC-6h Elovich fit)
B
C
A

118
Table C-3: Time-dependent model NA adsorption data for the ‘Effect of Surface Functional Groups’ study
Using CO2-ADC-9h
Using CO2-ADC-9h-pAir
Using CO2-ADC-9h-pO2
Time,
(min)
Aqueous Phase
Concentration,
Ct (mg/L)
Amount
Adsorbed, qt
(mg/g)
Time,
(min)
Aqueous Phase
Concentration,
Ct (mg/L)
Amount
Adsorbed, qt
(mg/g)
Time,
(min)
Aqueous Phase
Concentration,
Ct (mg/L)
Amount
Adsorbed, qt
(mg/g)
0 33.2 0.0 0 33.2 0.0 0 33.2 0.0
9 27.0 24.9 10 27.9 21.1 10 29.5 14.7
24 21.4 46.0 25 25.8 30.7 25 26.2 22.7
48 19.3 55.2 50 22.1 44.3 49 27.4 28.0
79 12.6 82.4 81 22.0 44.3 79 25.7 29.7
125 10.4 88.9 124 20.5 51.3 125 25.6 30.6
Conditions: Solution volume = 40 mL; Solution pH = 8.5; Temperature = 25oC; Shaking speed = 200 rpm
Initial mNA concentration ~33mg/L; Adsorbent dosage ~10 mg
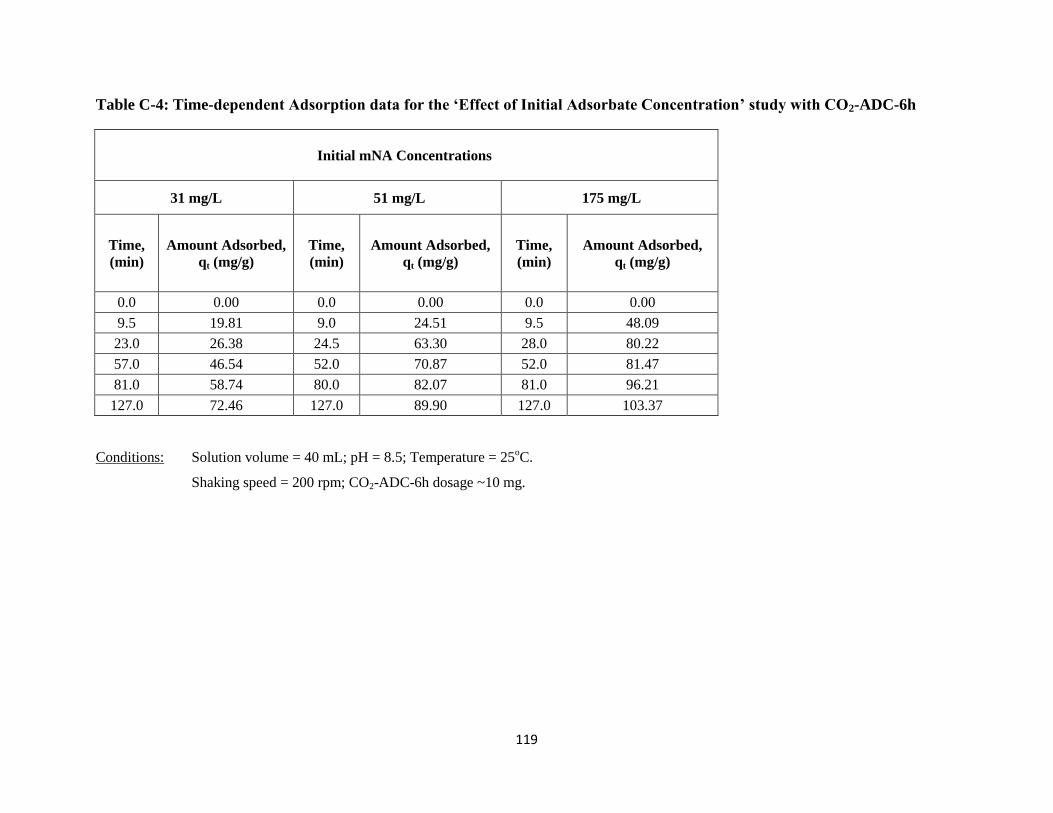
119
Table C-4: Time-dependent Adsorption data for the ‘Effect of Initial Adsorbate Concentration’ study with CO2-ADC-6h
Initial mNA Concentrations
31 mg/L 51 mg/L 175 mg/L
Time,
(min)
Amount Adsorbed,
qt (mg/g)
Time,
(min)
Amount Adsorbed,
qt (mg/g)
Time,
(min)
Amount Adsorbed,
qt (mg/g)
0.0 0.00 0.0 0.00 0.0 0.00
9.5 19.81 9.0 24.51 9.5 48.09
23.0 26.38 24.5 63.30 28.0 80.22
57.0 46.54 52.0 70.87 52.0 81.47
81.0 58.74 80.0 82.07 81.0 96.21
127.0 72.46 127.0 89.90 127.0 103.37
Conditions: Solution volume = 40 mL; pH = 8.5; Temperature = 25oC.
Shaking speed = 200 rpm; CO2-ADC-6h dosage ~10 mg.

120
Table C-5: Adsorption data for the ‘Effect of Temperature’ on adsorption kinetics
Temperature, oC
25 oC 50
oC 75
oC
Time,
(min)
Amount Adsorbed,
qt (mg/g)
Time,
(min)
Amount Adsorbed,
qt (mg/g)
Time,
(min)
Amount Adsorbed,
qt (mg/g)
0 0.0 0 0.0 0 0.0
9 21.7 9 29.3 9 27.1
25 44.4 25 45.1 25 51.2
56 57.4 55 60.6 55 62.8
Conditions: Solution volume = 40 mL; pH = 8.5; Shaking speed = 200 rpm.
CO2-ADC-9h dosage ~10 mg; Initial mNA concentration ~ 51 mg/L

121
APPENDIX D: Adsorption Isotherm Data
Table D-1: Equilibrium adsorption data for the ‘Effect of Pore Structure’ study
Activated Carbon Adsorbents
CO2-ADC-6h CAC Steam-ADC-3h
Equilibrium
Solution Conc.,
Ce (mg/L)
Equilibrium
Adsorbed Quantity,
qe (mg/g)
Equilibrium
Solution Conc.,
Ce (mg/L)
Equilibrium
Adsorbed Quantity,
qe (mg/g)
Equilibrium
Solution Conc.,
Ce (mg/L)
Equilibrium
Adsorbed Quantity,
qe (mg/g)
29.8 126.3 25.4 301.1 41.9 84.0
27.8 100.1 17.3 291.2 39.2 81.8
26.9 85.9 11.1 280.1 34.9 57.1
24.9 73.4 7.3 245.7 30.4 48.5
23.0 67.6 1.1 190.2 22.8 43.1
21.3 51.6 0.9 143.5 14.6 29.7
Conditions: Solution volume = 40 mL; pH = 8.5; Temperature = 25oC.
Shaking speed = 200 rpm.
Initial mNA concentration ~44 mg/L; Adsorbent dosage range ~2-40 mg.

122
Sample isotherm model fits for ‘Effect of Pore Structure’ study using CO2-ADC-6h data
Figure D-1: Isotherm model fits for mNA adsorption on CO2-ADC-6h: (A) Langmuir fit, (B) Freundlich fit, and (C) Temkin fit
y = -0.0187x + 0.799
R² = 0.926
0.1
0.2
0.3
0.4
0.5
20 22 24 26 28 30 32
Ce/
qe,
(g
/L)
Ce, (mg/L)
CO2-ADC-6h Langmuir fit
Linear (CO2-ADC-6h Langmuir fit)
y = 2.488x - 3.660
R² = 0.967
3.0
3.5
4.0
4.5
5.0
3.00 3.10 3.20 3.30 3.40 3.50
Ln
(q
e)
Ln (Ce)
CO2-ADC-6h Freundlich fit
Linear (CO2-ADC-6h Freundlich fit)
y = 204.7x - 5789
R² = 0.925
0
40
80
120
160
3.00 3.10 3.20 3.30 3.40 3.50
qe,
(m
g/g
)
Ln (Ce)
CO2-ADC-6h Temkin fit Linear (CO2-ADC-6h Temkin fit)
A B
C

123
Table D-2: Equilibrium adsorption data for the ‘Effect of Surface Functional Groups’ study
Activated Carbon Adsorbents
CO2-ADC-9h CO2-ADC-9h-pAir CO2-ADC-9h-pO2 CO2-ADC-9h-pNH3
Equilibrium
Solution
Conc., Ce
(mg/L)
Equilibrium
Adsorbed
Quantity,
qe (mg/g)
Equilibrium
Solution
Conc., Ce
(mg/L)
Equilibrium
Adsorbed
Quantity,
qe (mg/g)
Equilibrium
Solution
Conc., Ce
(mg/L)
Equilibrium
Adsorbed
Quantity,
qe (mg/g)
Equilibrium
Solution
Conc., Ce
(mg/L)
Equilibrium
Adsorbed
Quantity,
qe (mg/g)
20.9 66.7 27.6 60.4 29.2 41.1 23.0 111.7
17.8 61.6 23.6 53.1 27.1 39.1 18.9 102.0
14.5 57.6 19.5 51.8 23.3 37.0 13.5 78.1
11.1 56.7 16.5 47.6 20.9 35.0 8.8 70.0
5.7 51.4 14.2 40.2 18.6 32.8 6.4 67.8
Conditions: Solution volume = 40 mL; pH = 8.5; Temperature = 25oC.
Shaking speed = 200 rpm.
Initial mNA concentration ~33 mg/L; Adsorbent dosage range ~3-22 mg.
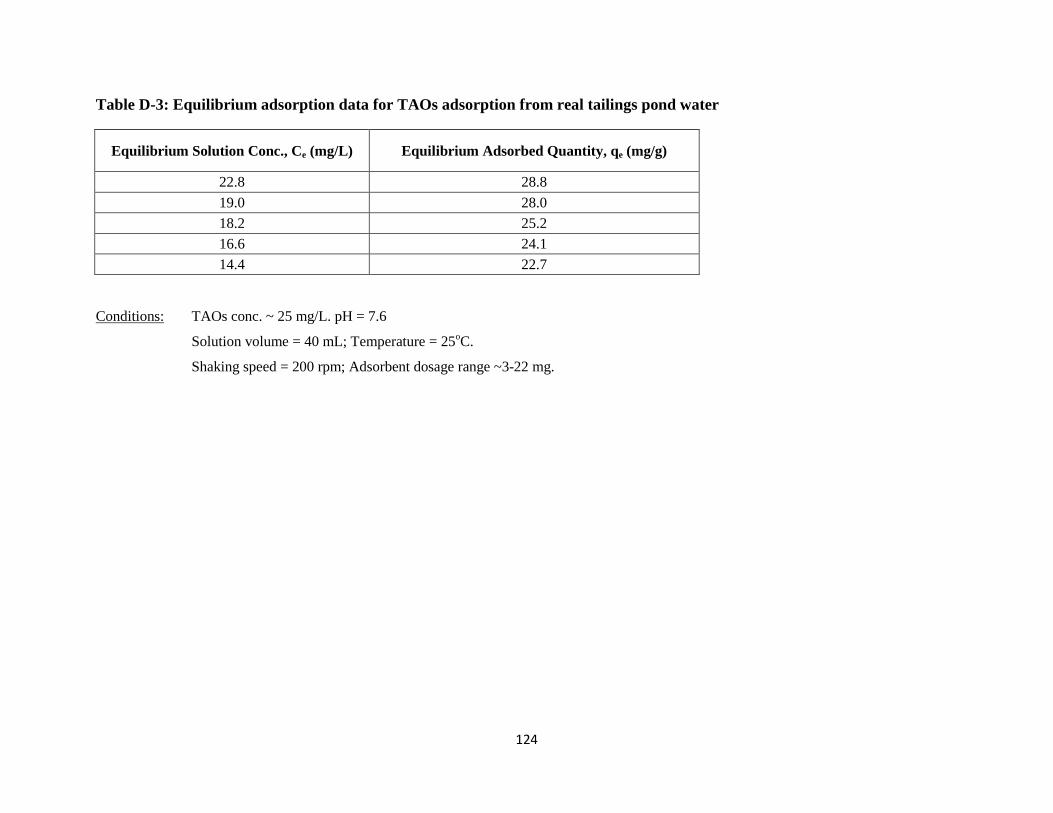
124
Table D-3: Equilibrium adsorption data for TAOs adsorption from real tailings pond water
Equilibrium Solution Conc., Ce (mg/L) Equilibrium Adsorbed Quantity, qe (mg/g)
22.8 28.8
19.0 28.0
18.2 25.2
16.6 24.1
14.4 22.7
Conditions: TAOs conc. ~ 25 mg/L. pH = 7.6
Solution volume = 40 mL; Temperature = 25oC.
Shaking speed = 200 rpm; Adsorbent dosage range ~3-22 mg.