adsorptive stripping differential pulse voltammetry determination of rivastigmine at graphene...
TRANSCRIPT
Journal of Electroanalytical Chemistry 757 (2015) 150–158
Contents lists available at ScienceDirect
Journal of Electroanalytical Chemistry
j ourna l homepage: www.e lsev ie r .com/ locate / jeac
Adsorptive stripping differential pulse voltammetry determination ofrivastigmine at graphene nanosheet-gold nanoparticle/carbon paste electrode
Pramod K. Kalambate a, Madan R. Biradar a, Shashi P. Karna b, Ashwini K. Srivastava a,⁎a Department of Chemistry, University of Mumbai, Vidyanagari, Santacruz (East), Mumbai 400 098, Indiab U.S. Army Research Laboratory, Weapons and Materials Research Directorate, ATTN: RDRL-WM, Aberdeen Proving Ground, MD21005-5069, USA
⁎ Corresponding author.E-mail addresses: [email protected], akschb
http://dx.doi.org/10.1016/j.jelechem.2015.09.0271572-6657/© 2015 Elsevier B.V. All rights reserved.
a b s t r a c t
a r t i c l e i n f oArticle history:Received 1 July 2015Received in revised form 20 August 2015Accepted 18 September 2015Available online 25 September 2015
Keywords:RivastigmineGrapheneGold nanoparticlesAdsorptive stripping voltammetry
The study of graphene nanosheet (GNS)–gold nanoparticle (AuNP)–carbon paste electrode (GNS–AuNP–CPE) asan electrochemical sensor for the determination of rivastigmine (RIV) in pharmaceuticals formulations, bloodserum, and urine samples is presented. The GNS–AuNP composite is prepared by in situ simultaneous reductionof graphene oxide and chloroauric acid using sodiumborohydride as a reducing agent. The GNS–AuNP compositewas characterized by X-ray diffraction, UV–Vis spectroscopy, and scanning electronmicroscopy. Electrochemicalcharacterization of the GNS–AuNP–CPE electrode surfacewas carried out by cyclic voltammetry, electrochemicalimpedance spectroscopy, chronocoulometry, and adsorptive stripping differential pulse voltammetry. This studyshows that oxidation of rivastigmine is facilitated at the GNS–AuNP–CPE electrode and remarkably increase incurrent compared to the bare electrode due to enhanced adsorption of the former on electrode surface. Underthe optimized conditions, the peak current (Ip) is found to be proportional to the RIV concentration in therange of 2.0 × 10⁻⁷–6.0 × 10⁻⁴ M with a detection limit of 5.3 × 10⁻⁸ M. The proposed sensor shows a veryhigh level of sensitivity, selectivity, and a very good reproducibility for RIV determination. A good recoverylevel obtained for real samples suggests practical utility of the GNS–AuNP–CPE as an effective and reliable elec-trochemical sensor for RIV detection.
© 2015 Elsevier B.V. All rights reserved.
1. Introduction
Rivastigmine (Exelon), chemically known as (S)-N-ethyl-N-methyl-3-[(1-dimethylamino) ethyl]-phenyl carbamate hydrogen tartrate(RIV) is an acetylcholine esterase inhibitor of the carbamate type ap-proved for the treatment of Alzheimer's disease [1], which is a progres-sive, degenerative brain disorder that affects reason, judgment andmemory. Over a period, people with Alzheimer's disease lose their abil-ity to think and reason clearly, judge situations, solve problems, concen-trate, remember useful information, take care of themselves, and evenspeak [2,3]. People with mild Alzheimer's disease usually require closesupervision and help with everyday tasks; and those with severe dis-ease can do little on their own and require complete full-time care.Alzheimer's disease severely impacts the quality of life of the patient,their family and caregivers.
Currently, there is no cure for Alzheimer's disease but some drugsare used to keep symptoms from getting worse for a limited time [4].Drug treatments include rivastigmine (Exelon), donepezil (Aricept),Rivamer and galantamine (Reminyl). These drugs affect the level of aneurotransmitter in the brain called acetylcholine. Rivastigmine (RIV)is one of the most widely used reversible cholinesterase inhibitor for
[email protected] (A.K. Srivastava).
treatment of Alzheimer's disease. However, an overdose is toxic andleads to several side effects viz., chest pain or discomfort, increasedsweating, increased watering of the mouth, slow or shallow breathing,nausea, dizziness, severe vomiting, pale or blue lips, light headedness,stomach pain, and trouble sleeping etc. It is thus necessary to developa fast, sensitive, and cost-effectivemethod to determineRIV level in var-ious samples, viz.; pharmaceutical formulations, blood serum, and urinesamples.
Currently used analytical methods for determination of RIV includeliquid chromatography–tandem mass spectrometry (LC–MS/MS) [5,6],high performance thin layer chromatography (HPTLC) [7], headspacesolid-phase microextraction (HS-SPME), capillary gas chromatography–mass spectrometry (GC–MS) [8], miniaturized membrane sensor [9],spectrophotometric and spectrodensitometric methods [10]. However,most of these methods are lengthy, expensive, require complicated pro-cedure and expert knowledge and often need the pretreatment stepthatmake themunsuitable for routine analysis. Electrochemicalmethodsare used extensively due to their simplicity, low cost, and relatively shortanalysis time.
Over the past two decades, chemically modified electrodes (CMEs)have attracted broad interest in biological and pharmaceutical sensingdevelopment due to low background current, wide range of potentialwindow, easy surface renewal, lower detection limit, and low cost.Due to these advantages, the electrochemical sensing using CMEs have

151P.K. Kalambate et al. / Journal of Electroanalytical Chemistry 757 (2015) 150–158
been successfully used in determination of various organic [11–17] aswell as inorganic [18,19] species.
Graphene, a two dimensional one atom thick nanomaterialconsisting of sp2 hybridized carbon, has attracted tremendous attentiondue to its unique properties, such as high surface area, excellent electri-cal conductivity, and good electrocatalytic activity [20,21]. Because ofthese properties graphene has been used as an ideal electrode materialin supercapacitors [22,23], field effect transistors [24], and chem/biosensors [25,26]. The introduction ofmetal nanoparticles into the disper-sion of graphene sheets also helps inhibit the aggregation of graphenesheets and result in mechanically jammed exfoliated graphene agglom-erate with very high surface area. At the same time, AuNP have beenwidely used in electrochemical detection because they enhance theelectrode conductivity and facilitate electron transfer by virtue of quan-tum size effects [27,28].
Rivastigmine is an electroactive compound which can be oxidizedelectrochemically. Consequently the development and application ofelectrochemical sensors and methods for the determination ofrivastigmine have received considerable interest in the past few years[29,30]. In this paper we report the application of a graphene-goldnanoparticle-carbon paste electrode (GNS–AuNP–CPE) for sensitive de-termination of RIV in pharmaceutical formulations, urine and bloodserum sampleswith adsorptive stripping differential pulse voltammetry(AdSDPV). The GNS–AuNP composite was synthesized in two steps. Inthe first step graphene oxide was prepared by modified Hummersmethod. In the second step, graphene oxide and chloroauric acid weresimultaneously reduced using sodium borohydride to form grapheneand gold nanoparticles. The characterization of composite was carriedout by various techniques viz.; X-ray diffraction (XRD), UV–Visiblespectroscopy, scanning electron microscopy (SEM), and energy disper-sive X-ray spectroscopy (EDX). The GNS–AuNP modified carbon pasteelectrode was used for the determination of RIV employing AdSDPV. Inaddition, the electrochemical characterization was performed using cy-clic voltammetry (CV), electrochemical impedance spectroscopy (EIS),and chronocoulometry (CC). By employing AdSDPV, determination ofRIV is carried out in pharmaceutical formulations, blood serum, andurine samples. To the best of our knowledge only two voltammetricmethods have been reported for determination of RIV [29,30].
2. Experimental
2.1. Materials
All chemicals used were of analytical reagent grade and used with-out any further purification. Rivastigmine hydrogen tartrate (≥98%)was obtained from Sigma-Aldrich, USA. Graphite powder (99.5%, parti-cle size b50 μm) and chloroauric acid were purchased from SD Fine-Chem Ltd. and used as received. Mineral oil (IR spectroscopy grade)was procured from Sigma-Aldrich, USA. Potassium permaganate(≥99.0%), sodium nitrate (≥99.0%), and sodium borohydride (99%)were procured from Sigma-Aldrich, USA. Double distilled water wasused throughout the study. Rivamer 1.5 and Rivamer 3.0 tablets wereobtained from local drug stores. Human blood serum and urine samplesare obtained from Local Pathology Lab, Mumbai, India. The supportingelectrolyte used throughout the analysis was phosphate buffer solution(PBS; 0.1 M pH 7.0). The pH of the buffer solutions were adjusted with1MNaOH and 0.5MHCl. The stock solution (8 × 10⁻³ M RIV) was pre-pared in phosphate pH 7 (0.1 M) buffer and stored under refrigeration.The working standard solutions were prepared using serial dilutions ofstock standard solution using phosphate pH 7.0. All electrochemicalmeasurements were carried out at room temperature (24 ± 2 °C).
2.2. Apparatus
All voltammetric measurements were performed using an AutolabPGSTATE 30 equipped with USB electrochemical interface using GPES
software, version 4.9.005 and frequency response analyzer, software ver-sion 2.0 respectively. Conventional three-electrode system employing, amodified carbon paste electrode as working electrode, platinum wireand Ag/AgCl (sat. KCl) as counter and reference electrodes, respectivelywas used for measurements. Scanning electron microscopy was per-formed on FEI Quanta-200. The pH measurements were done by usingELICO LI 120 pH meter. X-ray diffraction analysis was carried out on anX-ray diffractometer (Shimadzu 7000S, Shimadzu Analytical, Japan)equipped with CuKα radiation (λ=0.154 nm). The UV–Visible spectro-scopic studywas carried out on a ShimadzuUV-2450 spectrophotometerwith samples in a quartz cuvette operated from200 to 800 nm. Themag-netic stirrer used for stripping analysis was REMI 1 MLH. The MettlerToledo (AB 204) balance was used for weighting solid materials.
2.3. Synthesis of graphene-gold nanoparticles (GNS–AuNP) composite
Graphite oxide was prepared from natural graphite by modifiedHummers method [31]. 2.0 g of graphite was mixed with 96.0 ml con-centrated H2SO4 acid and 1.0 g NaNO3 in ice bath for half an hourusing a magnetic stirrer. A 6.0 g of KMnO4 was slowly added (smallamount at each time) into the mixture within 1 h while keeping thetemperature of the mixture not exceeding 5 °C. Then the mixture washeated up to 60 °C and was maintained at 60 °C for 30 min. It wasfollowed by addition of 150.0 ml of double distilled water into the mix-ture and heating was continued for additional 30 min at the same tem-perature. Finally, the oxidation reaction was terminated by the additionof 240.0 ml of double distilled water and 10.0 ml 30% H2O2 solution.Then the mixture was filtered and the product was washed severaltimes with 10% hydrochloric acid followed by double distilled waterand dried in a vacuum oven for 24 h. 100 mg of dried graphite oxidewas measured using an analytical balance. It was dispersed in100.0 ml of double distilled and sonicated for 1 h. The formation ofgraphene oxide (GO) took place at this step. GO dispersion (1 mg/ml)prepared in above step was transferred to a 500 ml round bottomflask and chloroauric acid (1 × 10⁻³ M, 25ml) was added to the disper-sion. Now, the solution containing both GO and chloroauric acid wastreated with 1.5 g of sodium borohydride. The solution was heated to95 °C for 12 h. The solution was filtered and residue was first washedwith ethanol for several times then with double distilled water. The res-idue was dried at 60 °C for 12 h. This composite mainly contains goldnanoparticles and graphene. The graphenewas synthesized by samepro-cedure using sodium borohydride as a reducing agent. The illustration ofthe preparation procedure for GNS–AuNP nanocomposites is shown inScheme 1. It is shown in Scheme 1 that graphite oxide has intercalatedoxygen's; the exfoliation of graphite oxide gives graphene oxide. Themajor difference between graphite oxide and graphene oxide is the num-ber of layers. Graphite oxide is amultilayer systemand in graphene oxidea few layer flakes and monolayer flakes can be found.
2.4. Preparation of the GNS–AuNP modified carbon paste electrode (GNS–AuNP–CPE)
The carbon paste electrode (CPE) was prepared with composition of70:30 (graphite:mineral oil) using mortar and pestle. The paste wasthen homogenized for 24 h. The paste was filled in Teflon micropipettetip and silver wire was dissected for an electrical contact. Fresh elec-trode surface was obtained by squeezing out paste from the micropi-pette tip and scrapping off the surface against butter paper untilsurface had a shiny appearance. GNS–AuNP–CPEwasprepared by incor-porating GNS–AuNP in to graphite and mineral oil with varying ratio ofGNS–AuNP composite from 1 to 12%. Best results were obtained when10% of GNS–AuNP composite (Fig. S1) was used along with graphiteand mineral oil. Therefore, optimized electrode with composition of60:10:30 (graphite powder:GNS–AuNP:mineral oil) was used for deter-mination of RIV. For comparison, a bare CPE and GNS–CPE were alsoprepared by the same procedure.

Scheme 1. Illustration of the preparation procedure for GNS–AuNP nanocomposites.
152 P.K. Kalambate et al. / Journal of Electroanalytical Chemistry 757 (2015) 150–158
2.5. Experimental procedure
Adsorptive stripping differential pulse voltammetry (AdSDPV) wasused to record the voltammograms. For AdSDPV, appropriate quantityof stock standard solution of RIV was taken in to 25 ml volumetric
Fig. 1. Representative XRD patterns for (A) GNS; (B) GNS–AuNP comp
flask and diluted up to the mark with phosphate buffer, pH 7.0. The so-lution was then added to the electrochemical cell where the measure-ments were carried out. No oxygen interference was found in theanodic window, thus, no deaeration was carried out. A magnetic stirrerwasused to facilitate accumulation of RIV on to the electrode surface. An
osite; UV–Vis spectra for (C) GNS and (D) GNS–AuNP composite.

Fig. 2. SEM images for (A) GNS; (B) GNS–AuNP composite.
153P.K. Kalambate et al. / Journal of Electroanalytical Chemistry 757 (2015) 150–158
accumulation potential of 0.6 V with accumulation time of 60 s, wasemployed for RIV determination, while the solution was stirred at250 rpm. The stirring was then stopped, and after 15 s the voltammo-gram was recorded by scanning potential towards positive directionfrom 0.55 V to 1.25 V using differential pulse voltammetry employinga step potential of 5 mV andmodulation amplitude of 50mV. The cyclicvoltammetric experimentswere carried out by sweeping potential from0.5 to 1.4 V.
2.6. Treatment and determination of samples
Determination of RIV was carried out in pharmaceutical formula-tions, blood serum, and urine samples. The Rivamer capsules containing1.5 mg and 3.0 mg of RIVwere obtained from local drug store. Five cap-suleswere selected randomly, ground, andmixed. An appropriate quan-tity was weighed, sonicated for 30 min and filtered through Whatmanfilter paper No. 1. All samples were diluted to 100 ml with phosphatebuffer pH 7.0. Quantitative determination was carried out by standardaddition method. Recovery tests were carried out by spiking standardsolutions of RIV in to pharmaceutical formulations. The blood serumand urine samples were obtained from local pathology laboratory andstored under refrigeration. Both samples were prepared by adding50 μl of sample and diluted to 25 ml with phosphate buffer pH 7.0. Nopretreatment step was carried out for both the samples. Samplescleaningwere carried out by filtering through 0.22 μm PVDF syringe fil-ter (Millex, Millipore Corporation). Electrochemical determination ofRIV was done by using DPV by spiking standard solutions of RIV tourine and serum samples.
Fig. 3. EDX spectra for (A) GNS;
3. Results and discussion
3.1. XRD and UV–Vis spectroscopy
The XRD patterns of GNS and GNS–AuNP are shown in Fig. 1(A) and(B). Graphene exhibit (Fig. 1(A)) the characteristics diffraction peaks at25.6° and 43.5°. The two diffraction peaks in this pattern can be indexedto the (002) and (111) reflection. On the other hand, AuNPs give fivepeaks (Fig. 1(B)) at 38.11°, 43.80°, 64.50°, 77.50°, and 81.66° which cor-respond to (111), (200), (220), (311) and (222) planes [32], respectively.Hence, XRD pattern of GNS–AuNP confirmed formation of gold nanopar-ticles and graphene successively. UV–Vis absorption spectra of GNS andGNS–AuNP are shown in Fig. 1(C) and (D). GNS exhibits absorptionband at 271 nm [33]. This band is due to absorption of an aromatic л sys-tem in the graphitic structure. Compositematerial shows two absorptionbands at 271 nm and 540 nm, respectively (Fig. 1(D)). The band at271 nm is due to GNS and 540 nm is due to AuNPs [32] which furtherconfirms the formation of GNS and AuNP in the composite material.
3.2. SEM and EDX study
The surface morphology of the as prepared material was studied bymeans of SEM (Fig. 2). It can be seen that graphene (Fig. 2(A)) showssheet like structure and composite (Fig. 2(B)) shows that gold nanopar-ticle are uniformly coated on the graphene sheets. An EDX result of GNS(Fig. 3(A)) shows elemental peak for carbon at 0.24 keV confirming for-mation of graphene. However, no additional peaks were found ingraphene which confirms complete reduction of graphene oxide to
(B) GNS–AuNP composite.
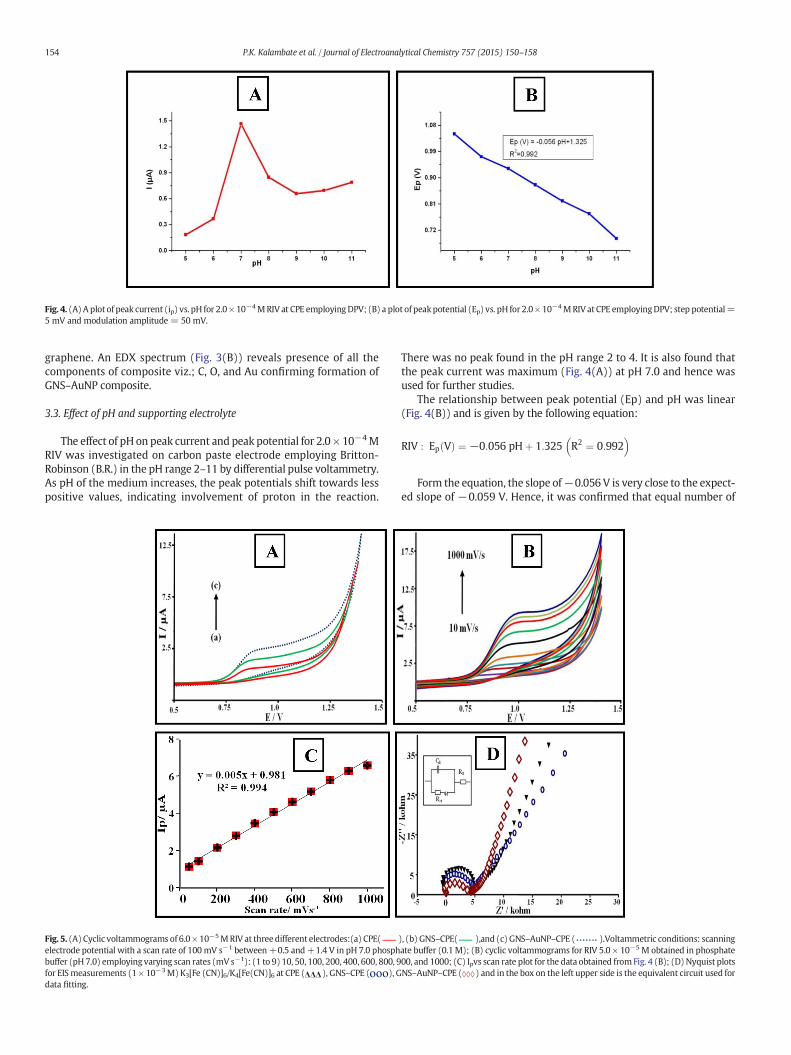
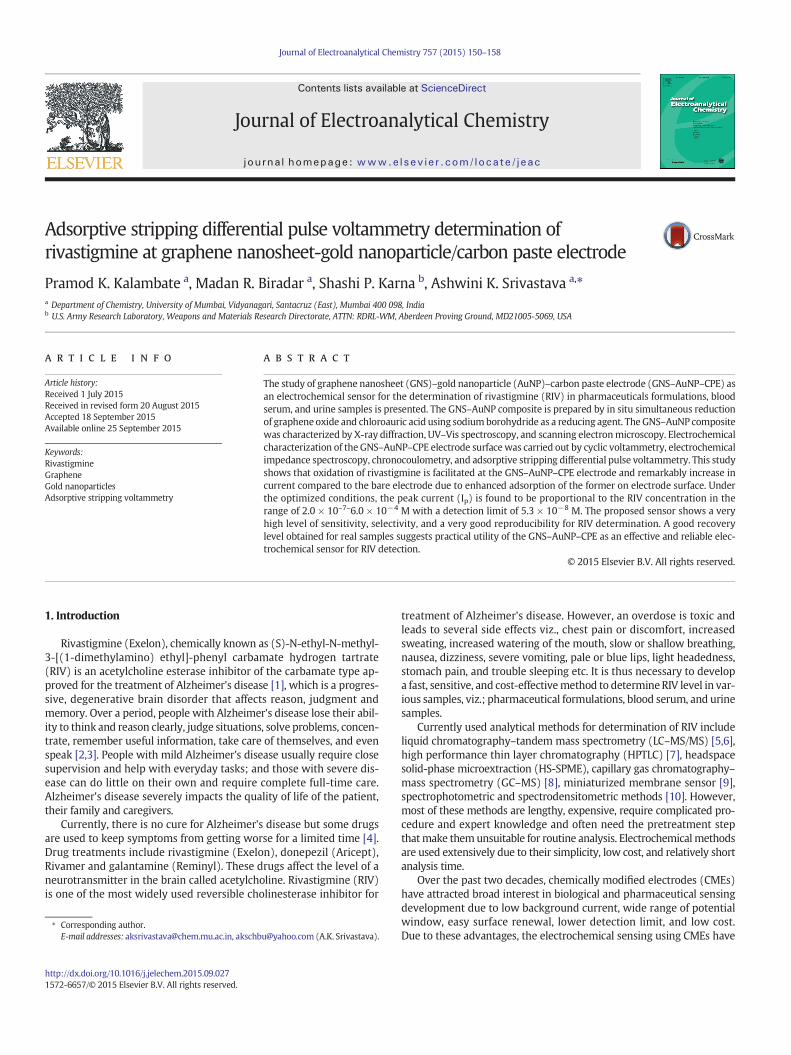
Fig. 4. (A) A plot of peak current (ip) vs. pH for 2.0 × 10⁻⁴MRIV at CPE employingDPV; (B) a plot of peakpotential (Ep) vs. pH for 2.0× 10⁻⁴MRIV at CPE employingDPV; step potential=5 mV and modulation amplitude = 50 mV.
154 P.K. Kalambate et al. / Journal of Electroanalytical Chemistry 757 (2015) 150–158
graphene. An EDX spectrum (Fig. 3(B)) reveals presence of all thecomponents of composite viz.; C, O, and Au confirming formation ofGNS–AuNP composite.
3.3. Effect of pH and supporting electrolyte
The effect of pH on peak current and peak potential for 2.0 × 10⁻⁴MRIV was investigated on carbon paste electrode employing Britton-Robinson (B.R.) in the pH range 2–11 by differential pulse voltammetry.As pH of the medium increases, the peak potentials shift towards lesspositive values, indicating involvement of proton in the reaction.
Fig. 5. (A) Cyclic voltammograms of 6.0 × 10⁻⁵MRIV at three different electrodes:(a) CPE(electrode potential with a scan rate of 100mV s−1 between+0.5 and+1.4 V in pH 7.0 phosphbuffer (pH 7.0) employing varying scan rates (mV s−1): (1 to 9) 10, 50, 100, 200, 400, 600, 800, 9for EISmeasurements (1 × 10⁻³M) K3[Fe (CN)]6/K4[Fe(CN)]6 at CPE ( ), GNS–CPE ( ), Gdata fitting.
There was no peak found in the pH range 2 to 4. It is also found thatthe peak current was maximum (Fig. 4(A)) at pH 7.0 and hence wasused for further studies.
The relationship between peak potential (Ep) and pH was linear(Fig. 4(B)) and is given by the following equation:
RIV : Ep Vð Þ ¼ −0:056 pHþ 1:325 R2 ¼ 0:992� �
Form the equation, the slope of−0.056 V is very close to the expect-ed slope of −0.059 V. Hence, it was confirmed that equal number of
), (b) GNS–CPE( ),and (c) GNS–AuNP–CPE ( ).Voltammetric conditions: scanningate buffer (0.1M); (B) cyclic voltammograms for RIV 5.0 × 10⁻⁵ M obtained in phosphate00, and 1000; (C) Ipvs scan rate plot for the data obtained fromFig. 4 (B); (D) Nyquist plotsNS–AuNP–CPE ( ) and in the box on the left upper side is the equivalent circuit used for
155P.K. Kalambate et al. / Journal of Electroanalytical Chemistry 757 (2015) 150–158
protons and electrons are involved in the oxidation of RIV. Additionalsupporting electrolytes including phosphate, tris, HEPES, and citrate-phosphate were studied at pH 7.0 in order to find out best supportingelectrolyte suitable for RIV using differential pulse voltammetry. Thebest response, in terms of peak current and peak shape was obtainedwhenphosphate pH7.0 (0.1M)was employed (Fig. S2). Hence, selectedfor further studies.
3.4. Effect of modifier
The modifier played a very important role in oxidation peak currentof RIV. The effect of the amount of GNS–AuNP as amodifier was studiedby varying its composition in the range of 1–12%with respect to graph-ite. The peak current increases until 10% loading of the modifier; afterwhich it saturates. Therefore, 10% modifier loading was used for thepreparation of the modified GNS–AuNP–CPE. For comparison, CPE andGNS–CPE were also prepared by the same procedure.
3.5. Cyclic voltammetry
The area of the electrodes was calculated by cyclic voltammetryusing Randles-Sevcik formula (1) in 1 mM K3Fe(CN)6/K4Fe(CN)6.
Ipa¼2:69 x 105n3=2A D1=2υ1=2C ð1Þ
Where, Ipa (A) is the anodic peak current, n is electron transfer num-ber, A (cm2) is surface area of the electrode, D (cm2 s−1) is diffusion co-efficient, ʋ (V s−1) is scan rate, and C (mol cm−3) is the concentration ofK3Fe(CN)6/K4Fe(CN)6. For 1 mMK3Fe(CN)6/K4Fe(CN)6 in the 1M KNO3
electrolyte, n= 1 and D= 7.6 × 10⁻⁶ cm2 s−1. The electrochemical re-sponse signal (Fig. S3) of 1 mM K3[Fe(CN)]6/K4[Fe(CN)]6 is significantlyenhanced at GNS–AuNP–CPE which reflects the improvement of boththe shape of redox peak and the magnitude of the peak current Ip.Thus, the sensitivity increases on employingGNS–AuNP–CPE. The calcu-lated surface area is 0.013 cm2, 0.034 cm2 and 0.070 cm2, respectivelyfor CPE, GNS–CPE and GNS–AuNP–CPE. In case of GNS–AuNP–CPE the
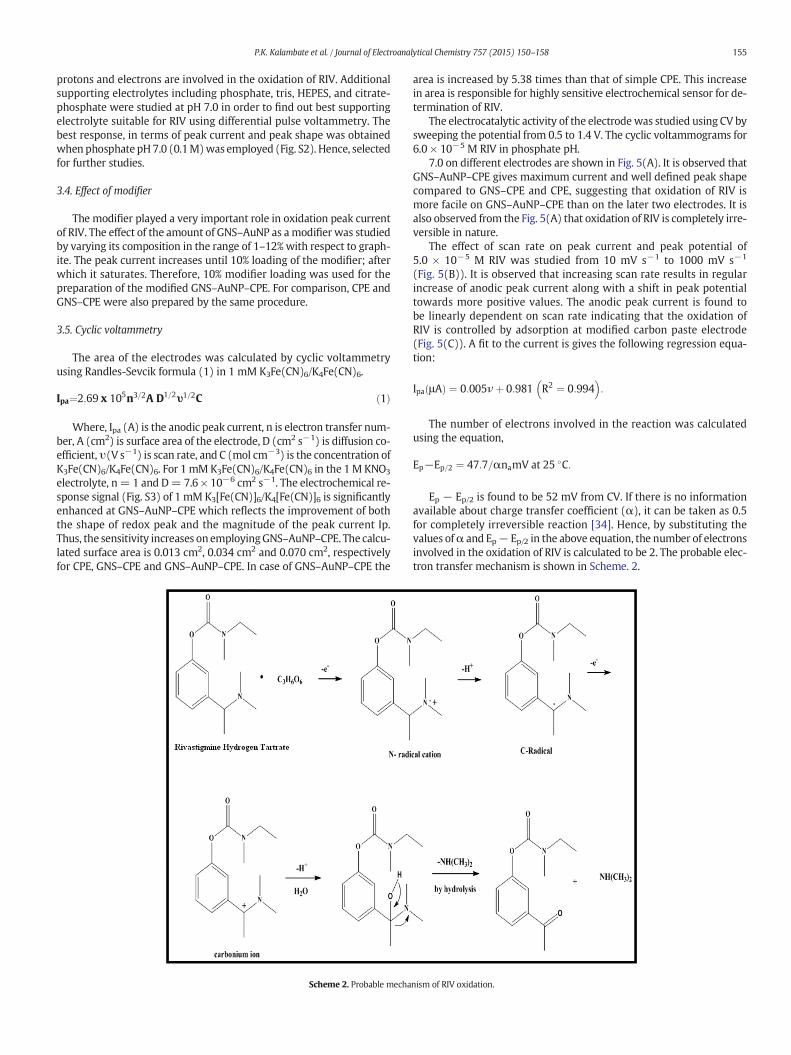
Scheme 2. Probable mecha
area is increased by 5.38 times than that of simple CPE. This increasein area is responsible for highly sensitive electrochemical sensor for de-termination of RIV.
The electrocatalytic activity of the electrodewas studied using CV bysweeping the potential from 0.5 to 1.4 V. The cyclic voltammograms for6.0 × 10−5 M RIV in phosphate pH.
7.0 on different electrodes are shown in Fig. 5(A). It is observed thatGNS–AuNP–CPE gives maximum current and well defined peak shapecompared to GNS–CPE and CPE, suggesting that oxidation of RIV ismore facile on GNS–AuNP–CPE than on the later two electrodes. It isalso observed from the Fig. 5(A) that oxidation of RIV is completely irre-versible in nature.
The effect of scan rate on peak current and peak potential of5.0 × 10−5 M RIV was studied from 10 mV s−1 to 1000 mV s−1
(Fig. 5(B)). It is observed that increasing scan rate results in regularincrease of anodic peak current along with a shift in peak potentialtowards more positive values. The anodic peak current is found tobe linearly dependent on scan rate indicating that the oxidation ofRIV is controlled by adsorption at modified carbon paste electrode(Fig. 5(C)). A fit to the current is gives the following regression equa-tion:
Ipa μAð Þ ¼ 0:005νþ 0:981 R2 ¼ 0:994� �
:
The number of electrons involved in the reaction was calculatedusing the equation,
Ep−Ep=2 ¼ 47:7=αnamV at 25 �C:
Ep − Ep/2 is found to be 52 mV from CV. If there is no informationavailable about charge transfer coefficient (α), it can be taken as 0.5for completely irreversible reaction [34]. Hence, by substituting thevalues ofα and Ep− Ep/2 in the above equation, the number of electronsinvolved in the oxidation of RIV is calculated to be 2. The probable elec-tron transfer mechanism is shown in Scheme. 2.
nism of RIV oxidation.
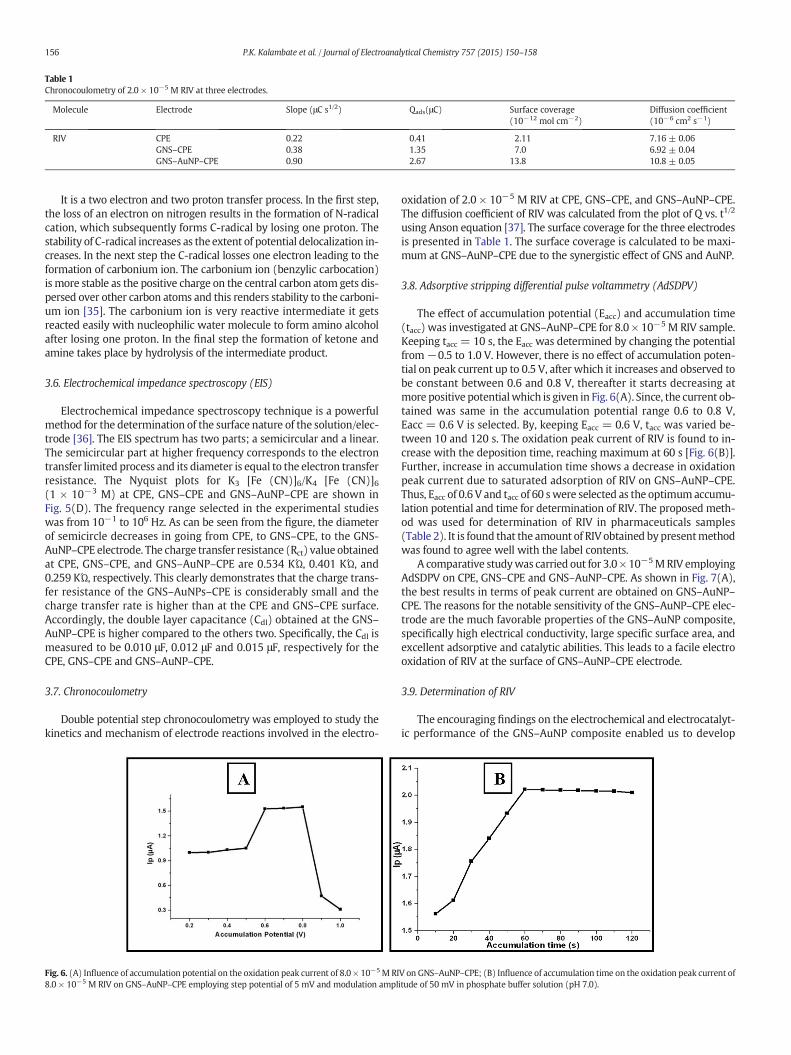
Table 1Chronocoulometry of 2.0 × 10⁻⁵ M RIV at three electrodes.
Molecule Electrode Slope (μC s1/2) Qads(μC) Surface coverage(10−12 mol cm−2)
Diffusion coefficient(10−6 cm2 s−1)
RIV CPE 0.22 0.41 2.11 7.16 ± 0.06GNS–CPE 0.38 1.35 7.0 6.92 ± 0.04GNS–AuNP–CPE 0.90 2.67 13.8 10.8 ± 0.05
156 P.K. Kalambate et al. / Journal of Electroanalytical Chemistry 757 (2015) 150–158
It is a two electron and two proton transfer process. In the first step,the loss of an electron on nitrogen results in the formation of N-radicalcation, which subsequently forms C-radical by losing one proton. Thestability of C-radical increases as the extent of potential delocalization in-creases. In the next step the C-radical losses one electron leading to theformation of carbonium ion. The carbonium ion (benzylic carbocation)is more stable as the positive charge on the central carbon atom gets dis-persed over other carbon atoms and this renders stability to the carboni-um ion [35]. The carbonium ion is very reactive intermediate it getsreacted easily with nucleophilic water molecule to form amino alcoholafter losing one proton. In the final step the formation of ketone andamine takes place by hydrolysis of the intermediate product.
3.6. Electrochemical impedance spectroscopy (EIS)
Electrochemical impedance spectroscopy technique is a powerfulmethod for the determination of the surface nature of the solution/elec-trode [36]. The EIS spectrum has two parts; a semicircular and a linear.The semicircular part at higher frequency corresponds to the electrontransfer limited process and its diameter is equal to the electron transferresistance. The Nyquist plots for K3 [Fe (CN)]6/K4 [Fe (CN)]6(1 × 10⁻³ M) at CPE, GNS–CPE and GNS–AuNP–CPE are shown inFig. 5(D). The frequency range selected in the experimental studieswas from 10−1 to 106 Hz. As can be seen from the figure, the diameterof semicircle decreases in going from CPE, to GNS–CPE, to the GNS-AuNP–CPE electrode. The charge transfer resistance (Rct) value obtainedat CPE, GNS–CPE, and GNS–AuNP–CPE are 0.534 KΏ, 0.401 KΏ, and0.259 KΏ, respectively. This clearly demonstrates that the charge trans-fer resistance of the GNS–AuNPs–CPE is considerably small and thecharge transfer rate is higher than at the CPE and GNS–CPE surface.Accordingly, the double layer capacitance (Cdl) obtained at the GNS–AuNP–CPE is higher compared to the others two. Specifically, the Cdl ismeasured to be 0.010 μF, 0.012 μF and 0.015 μF, respectively for theCPE, GNS–CPE and GNS–AuNP–CPE.
3.7. Chronocoulometry
Double potential step chronocoulometry was employed to study thekinetics and mechanism of electrode reactions involved in the electro-
Fig. 6. (A) Influence of accumulation potential on the oxidation peak current of 8.0 × 10⁻⁵ M RI8.0 × 10−5 M RIV on GNS–AuNP–CPE employing step potential of 5 mV and modulation ampl
oxidation of 2.0 × 10⁻⁵ M RIV at CPE, GNS–CPE, and GNS–AuNP–CPE.The diffusion coefficient of RIV was calculated from the plot of Q vs. t1/2
using Anson equation [37]. The surface coverage for the three electrodesis presented in Table 1. The surface coverage is calculated to be maxi-mum at GNS–AuNP–CPE due to the synergistic effect of GNS and AuNP.
3.8. Adsorptive stripping differential pulse voltammetry (AdSDPV)
The effect of accumulation potential (Eacc) and accumulation time(tacc) was investigated at GNS–AuNP–CPE for 8.0 × 10⁻⁵ M RIV sample.Keeping tacc = 10 s, the Eacc was determined by changing the potentialfrom−0.5 to 1.0 V. However, there is no effect of accumulation poten-tial on peak current up to 0.5 V, after which it increases and observed tobe constant between 0.6 and 0.8 V, thereafter it starts decreasing atmore positive potentialwhich is given in Fig. 6(A). Since, the current ob-tained was same in the accumulation potential range 0.6 to 0.8 V,Eacc = 0.6 V is selected. By, keeping Eacc = 0.6 V, tacc was varied be-tween 10 and 120 s. The oxidation peak current of RIV is found to in-crease with the deposition time, reaching maximum at 60 s [Fig. 6(B)].Further, increase in accumulation time shows a decrease in oxidationpeak current due to saturated adsorption of RIV on GNS–AuNP–CPE.Thus, Eacc of 0.6 V and tacc of 60 swere selected as the optimumaccumu-lation potential and time for determination of RIV. The proposed meth-od was used for determination of RIV in pharmaceuticals samples(Table 2). It is found that the amount of RIV obtained by presentmethodwas found to agree well with the label contents.
A comparative studywas carried out for 3.0 × 10⁻⁵MRIV employingAdSDPV on CPE, GNS–CPE and GNS–AuNP–CPE. As shown in Fig. 7(A),the best results in terms of peak current are obtained on GNS–AuNP–CPE. The reasons for the notable sensitivity of the GNS–AuNP–CPE elec-trode are the much favorable properties of the GNS–AuNP composite,specifically high electrical conductivity, large specific surface area, andexcellent adsorptive and catalytic abilities. This leads to a facile electrooxidation of RIV at the surface of GNS–AuNP–CPE electrode.
3.9. Determination of RIV
The encouraging findings on the electrochemical and electrocatalyt-ic performance of the GNS–AuNP composite enabled us to develop
V on GNS–AuNP–CPE; (B) Influence of accumulation time on the oxidation peak current ofitude of 50 mV in phosphate buffer solution (pH 7.0).
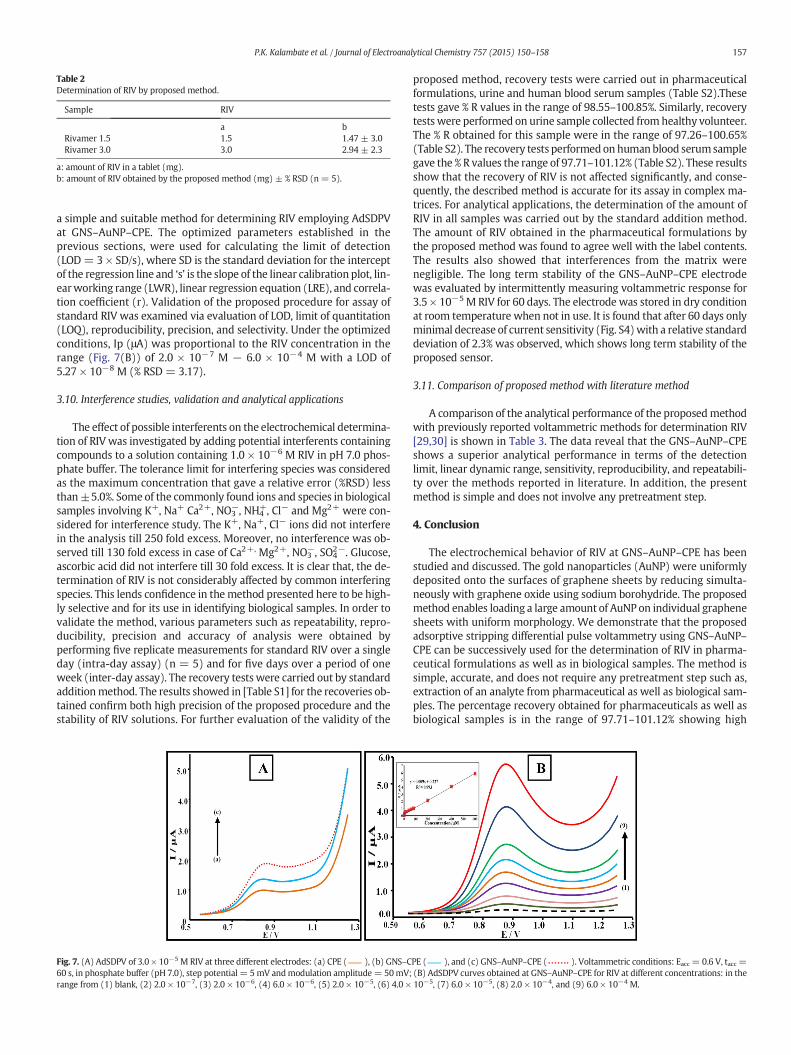
Table 2Determination of RIV by proposed method.
Sample RIV
a bRivamer 1.5 1.5 1.47 ± 3.0Rivamer 3.0 3.0 2.94 ± 2.3
a: amount of RIV in a tablet (mg).b: amount of RIV obtained by the proposed method (mg) ± % RSD (n = 5).
157P.K. Kalambate et al. / Journal of Electroanalytical Chemistry 757 (2015) 150–158
a simple and suitable method for determining RIV employing AdSDPVat GNS–AuNP–CPE. The optimized parameters established in theprevious sections, were used for calculating the limit of detection(LOD= 3 × SD/s), where SD is the standard deviation for the interceptof the regression line and ‘s’ is the slope of the linear calibration plot, lin-earworking range (LWR), linear regression equation (LRE), and correla-tion coefficient (r). Validation of the proposed procedure for assay ofstandard RIV was examined via evaluation of LOD, limit of quantitation(LOQ), reproducibility, precision, and selectivity. Under the optimizedconditions, Ip (μA) was proportional to the RIV concentration in therange (Fig. 7(B)) of 2.0 × 10⁻⁷ M − 6.0 × 10⁻⁴ M with a LOD of5.27 × 10−8 M (% RSD = 3.17).
3.10. Interference studies, validation and analytical applications
The effect of possible interferents on the electrochemical determina-tion of RIVwas investigated by adding potential interferents containingcompounds to a solution containing 1.0 × 10⁻⁶ M RIV in pH 7.0 phos-phate buffer. The tolerance limit for interfering species was consideredas the maximum concentration that gave a relative error (%RSD) lessthan±5.0%. Some of the commonly found ions and species in biologicalsamples involving K+, Na+ Ca2+, NO3
−, NH4+, Cl− and Mg2+ were con-
sidered for interference study. The K+, Na+, Cl− ions did not interferein the analysis till 250 fold excess. Moreover, no interference was ob-served till 130 fold excess in case of Ca2+, Mg2+, NO3
−, SO42−. Glucose,
ascorbic acid did not interfere till 30 fold excess. It is clear that, the de-termination of RIV is not considerably affected by common interferingspecies. This lends confidence in themethod presented here to be high-ly selective and for its use in identifying biological samples. In order tovalidate the method, various parameters such as repeatability, repro-ducibility, precision and accuracy of analysis were obtained byperforming five replicate measurements for standard RIV over a singleday (intra-day assay) (n = 5) and for five days over a period of oneweek (inter-day assay). The recovery tests were carried out by standardadditionmethod. The results showed in [Table S1] for the recoveries ob-tained confirm both high precision of the proposed procedure and thestability of RIV solutions. For further evaluation of the validity of the
Fig. 7. (A) AdSDPV of 3.0 × 10⁻⁵ M RIV at three different electrodes: (a) CPE ( ), (b) GNS–C60 s, in phosphate buffer (pH 7.0), step potential = 5mV andmodulation amplitude= 50mV;range from (1) blank, (2) 2.0 × 10⁻⁷, (3) 2.0 × 10⁻⁶, (4) 6.0 × 10⁻⁶, (5) 2.0 × 10⁻⁵, (6) 4.0 ×
proposed method, recovery tests were carried out in pharmaceuticalformulations, urine and human blood serum samples (Table S2).Thesetests gave % R values in the range of 98.55–100.85%. Similarly, recoverytests were performed on urine sample collected fromhealthy volunteer.The % R obtained for this sample were in the range of 97.26–100.65%(Table S2). The recovery tests performedonhumanblood serumsamplegave the % R values the range of 97.71–101.12% (Table S2). These resultsshow that the recovery of RIV is not affected significantly, and conse-quently, the described method is accurate for its assay in complex ma-trices. For analytical applications, the determination of the amount ofRIV in all samples was carried out by the standard addition method.The amount of RIV obtained in the pharmaceutical formulations bythe proposed method was found to agree well with the label contents.The results also showed that interferences from the matrix werenegligible. The long term stability of the GNS–AuNP–CPE electrodewas evaluated by intermittently measuring voltammetric response for3.5 × 10−5 M RIV for 60 days. The electrode was stored in dry conditionat room temperature when not in use. It is found that after 60 days onlyminimal decrease of current sensitivity (Fig. S4)with a relative standarddeviation of 2.3% was observed, which shows long term stability of theproposed sensor.
3.11. Comparison of proposed method with literature method
A comparison of the analytical performance of the proposedmethodwith previously reported voltammetric methods for determination RIV[29,30] is shown in Table 3. The data reveal that the GNS–AuNP–CPEshows a superior analytical performance in terms of the detectionlimit, linear dynamic range, sensitivity, reproducibility, and repeatabili-ty over the methods reported in literature. In addition, the presentmethod is simple and does not involve any pretreatment step.
4. Conclusion
The electrochemical behavior of RIV at GNS–AuNP–CPE has beenstudied and discussed. The gold nanoparticles (AuNP) were uniformlydeposited onto the surfaces of graphene sheets by reducing simulta-neously with graphene oxide using sodium borohydride. The proposedmethod enables loading a large amount of AuNP on individual graphenesheets with uniform morphology. We demonstrate that the proposedadsorptive stripping differential pulse voltammetry using GNS–AuNP–CPE can be successively used for the determination of RIV in pharma-ceutical formulations as well as in biological samples. The method issimple, accurate, and does not require any pretreatment step such as,extraction of an analyte from pharmaceutical as well as biological sam-ples. The percentage recovery obtained for pharmaceuticals as well asbiological samples is in the range of 97.71–101.12% showing high
PE ( ), and (c) GNS–AuNP–CPE ( ). Voltammetric conditions: Eacc = 0.6 V, tacc =(B) AdSDPV curves obtained at GNS–AuNP–CPE for RIV at different concentrations: in the10−5, (7) 6.0 × 10⁻⁵, (8) 2.0 × 10⁻⁴, and (9) 6.0 × 10⁻⁴ M.
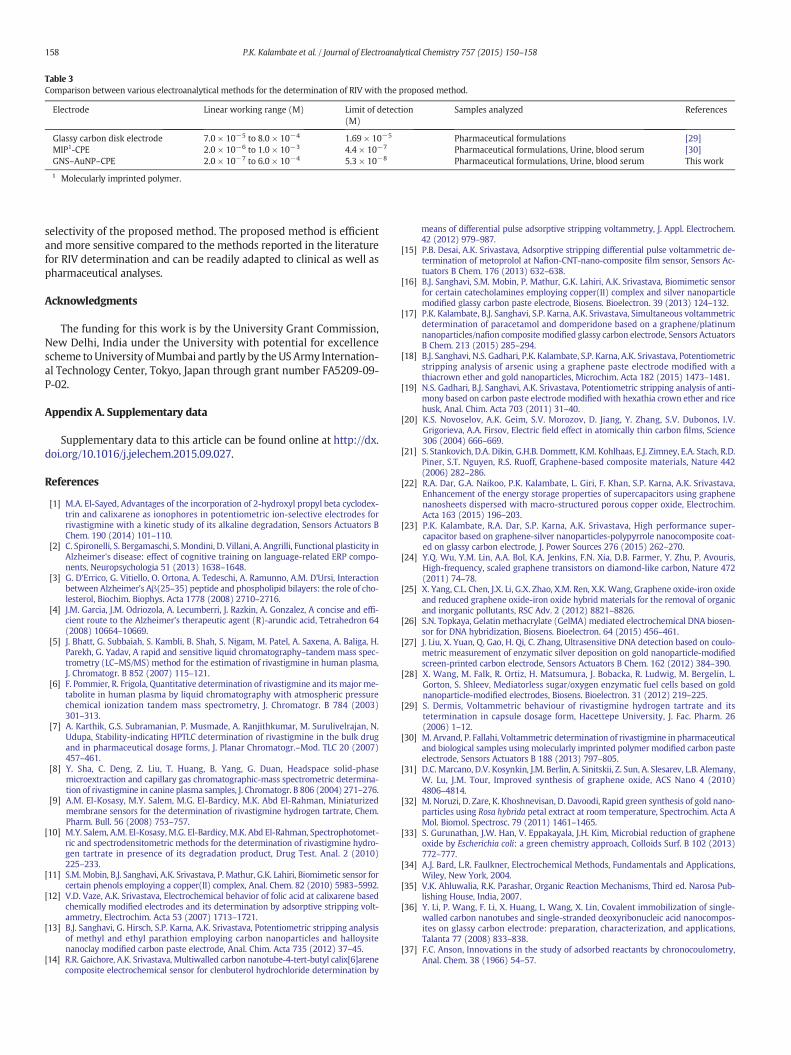
Table 3Comparison between various electroanalytical methods for the determination of RIV with the proposed method.
Electrode Linear working range (M) Limit of detection(M)
Samples analyzed References
Glassy carbon disk electrode 7.0 × 10⁻⁵ to 8.0 × 10⁻⁴ 1.69 × 10⁻⁵ Pharmaceutical formulations [29]MIP1-CPE 2.0 × 10⁻⁶ to 1.0 × 10⁻³ 4.4 × 10⁻⁷ Pharmaceutical formulations, Urine, blood serum [30]GNS–AuNP–CPE 2.0 × 10⁻⁷ to 6.0 × 10⁻⁴ 5.3 × 10⁻⁸ Pharmaceutical formulations, Urine, blood serum This work
1 Molecularly imprinted polymer.
158 P.K. Kalambate et al. / Journal of Electroanalytical Chemistry 757 (2015) 150–158
selectivity of the proposed method. The proposed method is efficientand more sensitive compared to the methods reported in the literaturefor RIV determination and can be readily adapted to clinical as well aspharmaceutical analyses.
Acknowledgments
The funding for this work is by the University Grant Commission,New Delhi, India under the University with potential for excellencescheme toUniversity ofMumbai and partly by theUS Army Internation-al Technology Center, Tokyo, Japan through grant number FA5209-09-P-02.
Appendix A. Supplementary data
Supplementary data to this article can be found online at http://dx.doi.org/10.1016/j.jelechem.2015.09.027.
References
[1] M.A. El-Sayed, Advantages of the incorporation of 2-hydroxyl propyl beta cyclodex-trin and calixarene as ionophores in potentiometric ion-selective electrodes forrivastigmine with a kinetic study of its alkaline degradation, Sensors Actuators BChem. 190 (2014) 101–110.
[2] C. Spironelli, S. Bergamaschi, S. Mondini, D. Villani, A. Angrilli, Functional plasticity inAlzheimer's disease: effect of cognitive training on language-related ERP compo-nents, Neuropsychologia 51 (2013) 1638–1648.
[3] G. D'Errico, G. Vitiello, O. Ortona, A. Tedeschi, A. Ramunno, A.M. D'Ursi, Interactionbetween Alzheimer's Aβ(25–35) peptide and phospholipid bilayers: the role of cho-lesterol, Biochim. Biophys. Acta 1778 (2008) 2710–2716.
[4] J.M. Garcia, J.M. Odriozola, A. Lecumberri, J. Razkin, A. Gonzalez, A concise and effi-cient route to the Alzheimer's therapeutic agent (R)-arundic acid, Tetrahedron 64(2008) 10664–10669.
[5] J. Bhatt, G. Subbaiah, S. Kambli, B. Shah, S. Nigam, M. Patel, A. Saxena, A. Baliga, H.Parekh, G. Yadav, A rapid and sensitive liquid chromatography–tandem mass spec-trometry (LC–MS/MS) method for the estimation of rivastigmine in human plasma,J. Chromatogr. B 852 (2007) 115–121.
[6] F. Pommier, R. Frigola, Quantitative determination of rivastigmine and its major me-tabolite in human plasma by liquid chromatography with atmospheric pressurechemical ionization tandem mass spectrometry, J. Chromatogr. B 784 (2003)301–313.
[7] A. Karthik, G.S. Subramanian, P. Musmade, A. Ranjithkumar, M. Surulivelrajan, N.Udupa, Stability-indicating HPTLC determination of rivastigmine in the bulk drugand in pharmaceutical dosage forms, J. Planar Chromatogr.–Mod. TLC 20 (2007)457–461.
[8] Y. Sha, C. Deng, Z. Liu, T. Huang, B. Yang, G. Duan, Headspace solid-phasemicroextraction and capillary gas chromatographic-mass spectrometric determina-tion of rivastigmine in canine plasma samples, J. Chromatogr. B 806 (2004) 271–276.
[9] A.M. El-Kosasy, M.Y. Salem, M.G. El-Bardicy, M.K. Abd El-Rahman, Miniaturizedmembrane sensors for the determination of rivastigmine hydrogen tartrate, Chem.Pharm. Bull. 56 (2008) 753–757.
[10] M.Y. Salem, A.M. El-Kosasy,M.G. El-Bardicy,M.K. Abd El-Rahman, Spectrophotomet-ric and spectrodensitometric methods for the determination of rivastigmine hydro-gen tartrate in presence of its degradation product, Drug Test. Anal. 2 (2010)225–233.
[11] S.M. Mobin, B.J. Sanghavi, A.K. Srivastava, P. Mathur, G.K. Lahiri, Biomimetic sensor forcertain phenols employing a copper(II) complex, Anal. Chem. 82 (2010) 5983–5992.
[12] V.D. Vaze, A.K. Srivastava, Electrochemical behavior of folic acid at calixarene basedchemically modified electrodes and its determination by adsorptive stripping volt-ammetry, Electrochim. Acta 53 (2007) 1713–1721.
[13] B.J. Sanghavi, G. Hirsch, S.P. Karna, A.K. Srivastava, Potentiometric stripping analysisof methyl and ethyl parathion employing carbon nanoparticles and halloysitenanoclay modified carbon paste electrode, Anal. Chim. Acta 735 (2012) 37–45.
[14] R.R. Gaichore, A.K. Srivastava, Multiwalled carbon nanotube-4-tert-butyl calix[6]arenecomposite electrochemical sensor for clenbuterol hydrochloride determination by
means of differential pulse adsorptive stripping voltammetry, J. Appl. Electrochem.42 (2012) 979–987.
[15] P.B. Desai, A.K. Srivastava, Adsorptive stripping differential pulse voltammetric de-termination of metoprolol at Nafion-CNT-nano-composite film sensor, Sensors Ac-tuators B Chem. 176 (2013) 632–638.
[16] B.J. Sanghavi, S.M. Mobin, P. Mathur, G.K. Lahiri, A.K. Srivastava, Biomimetic sensorfor certain catecholamines employing copper(II) complex and silver nanoparticlemodified glassy carbon paste electrode, Biosens. Bioelectron. 39 (2013) 124–132.
[17] P.K. Kalambate, B.J. Sanghavi, S.P. Karna, A.K. Srivastava, Simultaneous voltammetricdetermination of paracetamol and domperidone based on a graphene/platinumnanoparticles/nafion composite modified glassy carbon electrode, Sensors ActuatorsB Chem. 213 (2015) 285–294.
[18] B.J. Sanghavi, N.S. Gadhari, P.K. Kalambate, S.P. Karna, A.K. Srivastava, Potentiometricstripping analysis of arsenic using a graphene paste electrode modified with athiacrown ether and gold nanoparticles, Microchim. Acta 182 (2015) 1473–1481.
[19] N.S. Gadhari, B.J. Sanghavi, A.K. Srivastava, Potentiometric stripping analysis of anti-mony based on carbon paste electrodemodified with hexathia crown ether and ricehusk, Anal. Chim. Acta 703 (2011) 31–40.
[20] K.S. Novoselov, A.K. Geim, S.V. Morozov, D. Jiang, Y. Zhang, S.V. Dubonos, I.V.Grigorieva, A.A. Firsov, Electric field effect in atomically thin carbon films, Science306 (2004) 666–669.
[21] S. Stankovich, D.A. Dikin, G.H.B. Dommett, K.M. Kohlhaas, E.J. Zimney, E.A. Stach, R.D.Piner, S.T. Nguyen, R.S. Ruoff, Graphene-based composite materials, Nature 442(2006) 282–286.
[22] R.A. Dar, G.A. Naikoo, P.K. Kalambate, L. Giri, F. Khan, S.P. Karna, A.K. Srivastava,Enhancement of the energy storage properties of supercapacitors using graphenenanosheets dispersed with macro-structured porous copper oxide, Electrochim.Acta 163 (2015) 196–203.
[23] P.K. Kalambate, R.A. Dar, S.P. Karna, A.K. Srivastava, High performance super-capacitor based on graphene-silver nanoparticles-polypyrrole nanocomposite coat-ed on glassy carbon electrode, J. Power Sources 276 (2015) 262–270.
[24] Y.Q. Wu, Y.M. Lin, A.A. Bol, K.A. Jenkins, F.N. Xia, D.B. Farmer, Y. Zhu, P. Avouris,High-frequency, scaled graphene transistors on diamond-like carbon, Nature 472(2011) 74–78.
[25] X. Yang, C.L. Chen, J.X. Li, G.X. Zhao, X.M. Ren, X.K. Wang, Graphene oxide-iron oxideand reduced graphene oxide-iron oxide hybrid materials for the removal of organicand inorganic pollutants, RSC Adv. 2 (2012) 8821–8826.
[26] S.N. Topkaya, Gelatin methacrylate (GelMA) mediated electrochemical DNA biosen-sor for DNA hybridization, Biosens. Bioelectron. 64 (2015) 456–461.
[27] J. Liu, X. Yuan, Q. Gao, H. Qi, C. Zhang, Ultrasensitive DNA detection based on coulo-metric measurement of enzymatic silver deposition on gold nanoparticle-modifiedscreen-printed carbon electrode, Sensors Actuators B Chem. 162 (2012) 384–390.
[28] X. Wang, M. Falk, R. Ortiz, H. Matsumura, J. Bobacka, R. Ludwig, M. Bergelin, L.Gorton, S. Shleev, Mediatorless sugar/oxygen enzymatic fuel cells based on goldnanoparticle-modified electrodes, Biosens. Bioelectron. 31 (2012) 219–225.
[29] S. Dermis, Voltammetric behaviour of rivastigmine hydrogen tartrate and itstetermination in capsule dosage form, Hacettepe University, J. Fac. Pharm. 26(2006) 1–12.
[30] M. Arvand, P. Fallahi, Voltammetric determination of rivastigmine in pharmaceuticaland biological samples using molecularly imprinted polymer modified carbon pasteelectrode, Sensors Actuators B 188 (2013) 797–805.
[31] D.C. Marcano, D.V. Kosynkin, J.M. Berlin, A. Sinitskii, Z. Sun, A. Slesarev, L.B. Alemany,W. Lu, J.M. Tour, Improved synthesis of graphene oxide, ACS Nano 4 (2010)4806–4814.
[32] M. Noruzi, D. Zare, K. Khoshnevisan, D. Davoodi, Rapid green synthesis of gold nano-particles using Rosa hybrida petal extract at room temperature, Spectrochim. Acta AMol. Biomol. Spectrosc. 79 (2011) 1461–1465.
[33] S. Gurunathan, J.W. Han, V. Eppakayala, J.H. Kim, Microbial reduction of grapheneoxide by Escherichia coli: a green chemistry approach, Colloids Surf. B 102 (2013)772–777.
[34] A.J. Bard, L.R. Faulkner, Electrochemical Methods, Fundamentals and Applications,Wiley, New York, 2004.
[35] V.K. Ahluwalia, R.K. Parashar, Organic Reaction Mechanisms, Third ed. Narosa Pub-lishing House, India, 2007.
[36] Y. Li, P. Wang, F. Li, X. Huang, L. Wang, X. Lin, Covalent immobilization of single-walled carbon nanotubes and single-stranded deoxyribonucleic acid nanocompos-ites on glassy carbon electrode: preparation, characterization, and applications,Talanta 77 (2008) 833–838.
[37] F.C. Anson, Innovations in the study of adsorbed reactants by chronocoulometry,Anal. Chem. 38 (1966) 54–57.