adsorptive stripping square-wave voltammetric behavior of the enzyme adenosine deaminase
TRANSCRIPT

Electroanalysis, 4 (1992) 347-354
Adsorptive Stripping Sq uare-Wave Voltam metric Behavior of the Enzyme Adenosine Deaminase
Juana Rodriguez Flores' and Jose Maria F m a n d e z Aluarez Departamento de Quimica Analitica Urzivmsidad de Castilla-La Mancba, 13071 Ciudad Real, Spairr Received I January 24, I 9 9 I .
Tecnologi'a de Alimentos, Facesltud de Qui'micm,
ABSTRACT
The adsorptive stripping voltammetric behavior of adenosine deaminase has been studied by both square-wave and differential pulse modes, leading to analytical methodologies for its determination in aqueous samples. The application of a square-wave mode for the stripping of adsorbed adenosine deaminase has proved to be much more sensitive, yielding signals 50 times larger than those obtained by applying a differential pulse scan. The precision obtained for both voltammetric methods? at a con- centration level as low as 8 ppb of the enzyme, n7as shown to be 2.47% (r.s.d~, n = 7) and 2.28% (r.s.d., n = 7) , respectively.
KEY WORDS: Adenosine deaminase, adsorptive stripping voltammetry.
INTRODUCTION
Adenosine deaminase (ADA) is a globular enzyme o f molecular weight 33,500 [ 1 j that catalyzes the dcamination of adenosine to inosine. This reaction goes to completion in a few minutes at room temperature in phosphate buffer pH 7.4. This enzyme is present in a great number o f mammalian tissues, with the highest activities in the intesti- nal mucose 121. It is predominantly localized in the q- tosolic fraction of the cells [3] .
Elevated enzyme levels can be detected in sera of patients suffering from liver cirrhosis [4]. When the level of this enzyme decreases to very low values in children, an excess of adenosine is produced. 'This fact implies a corre- sponding decrease in the synthesis of lymphocytes which causes a severe combined immunodeficiency disease (SCID) [5].
The immune response is ahered in many forms of neoplasia or in immune-suppressed patients [6-81 and, accordingly, there is considerable interest in this enzyme.
Assay methods commonly used include the u1' mea- surement of adenosine and inosine at 265 nm [c)], and the measurement o f the ammonia produced in the enzyrnatic reaction by means of the Berthelot-reaction [lo], arnmo- nia-sensitive electrodes 11 1 j or the KAUPH-dependent glu- tamate dehydrogenase reaction [ 121.
The W method can detect approximately 1 Unit per litre (U/l) ofADA in serum. For the whole blood of normal children, a mean value of 93, 1 -+ 20.1 (11 = 35) IJ/I,
'To whom correspondence should be addressed
0 1992 VCH Publishers, Inc.
corresponding to 0.695 & 0.165 U per g hemoglobin, was found.
Greater detectability could be achieved by a 14C- labelled adenosine radiochemical method, but this ap- proach has severe interferences from degradation produc- tions [3]. Resides, the application of this methodology would require restrictive radiological safety precautions and it is not easily automated.
Adsorptive stripping voltammetry has been proved to be a useful technique for the study and determination of a series of molecules of biological importance [ 131. Recently two other enzymes have been studied by Smyh et al. [ 14, 151 by differential pulse adsorptive stripping volrammetry (DPAdSV). They could follow the immunochemical reac- tion [ 141 and the stability of chemically modified enzymes [ 15 I. Square wave voltammetry (SWV) has been succesfully applied to the study of the bovine serum albumin (BSA) [16] and to the detection of IgG and IgA after a chromato- graphic separation [ 171.
In this paper we report the comparative voltammetric study of the enzyme adenosine deaminase hy using two sensitive techniques-differential pulse (DP) and square wave ( SW)-where the compound is preconcentrated at the static mercury drop electrode (SMDE) h y adsorption.
EXPERIMENTAL Materials lzll reagents were of analytical reagent grade. Solutions for voltammetry were prepared in de-ionized m7ater that was produced by passing distilled water through a Millipore
1040-0397/92/$3.50 + .25 347

348 Rodriguez Flores et al.
Milli-0 water nurification svstem. A 0.1 M stock solution of Procedure %
phosphate buffer, pH 8.0, was prepared using Suprapure grade potassium dihydrogen orthophosphate and dipotas- sium hydrogen orthophosphate. This was diluted I + 4 with Milli-Q purified water and used throughout the volt- ammetric investigations.
Adenosine deaminase enzyme was obtained from Roehringer and was used without further purification
Apparatus Voltammograms were obtained by using a Princeton Ap- plied Research (PAR, Princeton, NJ. USA) Model 384B po- larographic analyzer combined with a PAR model 303A static mercury drop electrode (SMDE), a PAR Model 305 magnetic stirrer, a Tandon computer using the 384B Soft- ware, and an Epson FX 850 recorder.
For all voltammetric investigations, 2.0 nil of the support- ing electrolyte solution (0.1 M potassium phosphate buffer, pH 8.0) were made up to 10.0 ml with Milli-Q water a i d purged with oxygen-free nitrogren for 8 min (and for 2 min in subsequent runs). The required accumulation po- tential (Eacc) + 0.125 V, was then applied to the electrode for the selected accumulation time (t,,,), while the solution waq stirred at 400 rev. min-'. After a 20 s rest period, a differential pulse or square wave scan was initiated in the negative direction.
RESIJLZY AND DISCUSSION
The preconcentration of adenosine deaminase at the SkIDE and the application of a subsequent DP potential scan in the negative-going direction gave rise to a stripping
FIGURE 1 Differential pulse (A) and square wave (B) adsorptive stripping voltammograms from a solution contain- ing 8 ppb of adenosine deaminase. Accumulation time: 120 s (curves 1). Curves 0 correspond to the direct re- sponses (ta,, = 0 s). Other conditions as under Experimental.
i
100 n A T
0 . 3 0.4 0.5 0.6 0.7 0.3 0 . 3 0.4 0.5 0.6 0.7 0.8
-E / il (vs. A g / A g C l / K C l sat. )
Voltammetric Behavior of Adenosine Deaminase 349
peak (Figure 1). As can be seen in Figure 1, a large response is obtained after only 120 s of accumulation time for an assayed concentration of8 ppb of the molecule. On the contrary, the solutionphase response (direct re- sponse, t,,, = 0 s) shows no reduction peak at all as expected for such a low concentration. These facts indicate that the enzyme undergoes an adsorptive preconcen- tration at the mercury electrode. This adsorption feature is not affected by performing the preconcentration in open circuit conditions, which seems to prove that the molecule does not form a mercury salt with the electrode material through any of the multiple sulphydvl moieties present in the molecule [ 181. Nevertheless, the disulfide linkages formed between the cysteine aminoacids of the enzyme are reducible at tlie mercury electrode. This mechanism has long been known [19, 201.
In Figure 1 it can readily be seen that a square wave form applied to the stripping of the adsorbate yields a larger analytical signal (EP = - 0.58 V, curve B), compared with applying a differential pulse wave form (E,, =
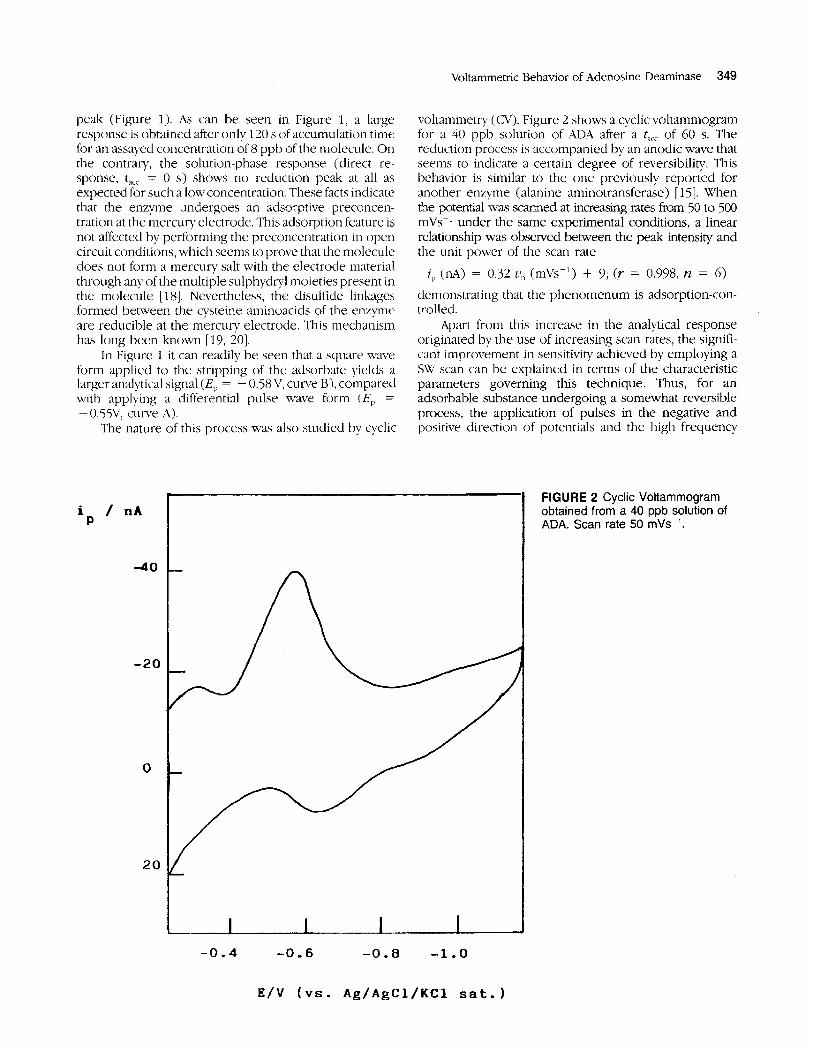
- 0.5%': C U W ~ A). The iiature of this process was also studied by cyclic
i / n A P
4 0
-20
0
20
voltammetry ( ( 3 1 ) . Figure 2 shows a cyclic voltammogram for a 40 ppb solution of ADA after a tact of 60 s. The reduction process is accompanied by an anodic wave that seems to indicate a certain degree of reversibility This behavior is similar to the one previously reported for another enzyme (alanine aminotransferase) [ 151. When the potential was scanned at increasing rates from 50 to 500 mVs-' under the same experimental conditions, a linear relationship was observed between the peak intensity and the unit power of tlie scan rate
i, (la) = 0.32 z j b (mL's-') + 9; (r . = 0.998, n = 6) demonstrating that the plienomenum is adsorption-con- trolled.
Apart from this increase in the analytical response originated by the use of increasing scan rates, the signifi- cant improvement in sensitivity achieved by employing a SW scan can be cxplained in terms of the characteristic parameters governing this technique. Thus, for an adsorbable substance undergoing a somewhat reversible process, the application of pulses in the negative and positive direction of potentials and the high frequency
- I I I I -0 .4 -0.6 -0.8 -1.0
FIGURE 2 Cyclic Voltammogram obtained from a 40 ppb solution of ADA. Scan rate 50 mVs '.
E / V ( v s . Ag/AgCl/KC1 sat.)

350 Kodriguez Flores et al.
with which they are repeated, results in a better signal compared to the responses obtained when using a differ- ential pulse.
Preliminary studies, concerning the influence of both tlie pH and the ionic strength of the supporting electrolyte, were conducted. Since the enzymatic activity of ADA is optimum in the pH interval between 6.0 and 9.0 [21], only buffer solutions with pHs within these limits were used. Best signals were obtained for pH of 8.0. The ionic strength of the phosphate buffer pH 8.0 wac then varied from 0.01 to 0.10. A low ionic strength (i.e., 0.02) was seen to yield tlie largest response as expected in adsorptive phenomena.
Experiments were carried out in order to find the best conditions for the adsorption step. Thus, several pre- concentration-stripping voltammograms were completed for accumulation potentials varying from + 0.3V to - 0.3 V and a L,,, of 60 s. The reduction peaks obtained with a DP scan under the conditions mentioned in the Experimental section showed maximum intensities for accumulation potentials in the positive region, whereas a drastic de- crease of the peaks was observed as soon as the E,,, was given negative v~lues. The electrostatic interaction be- tween the electrode and the molecule plays a dominating role in the overall adsorption process. The fact that the best adsorption is achieved at a positively charged electrode is indicative at least, of a partially negative domain of the niolecule adsorbing onto the electrode. This negative moiety would. logically, suffer a repulsion from a nega- tively charged electrode, which also was found expcri- mentally. The stripping signal became negligible when the accumulation step was carried out at negative potentials, virtually disappearing for E,,, = - 0.3 V. An E,,., of 0.1 25 V was chosen as optimum for future studies.
Attempts to carry out a poteiitiostatic coulometry in order to elucidate the number of electrons involved in the reduction process, failed because of the strong adsorption of the niolecule onto the mercury; this implies that the coulometry is being done on a modified electrode surface leading to erroneous calculations.
Differential Pulse Adsorptive Stripping Voltam met y Experiments carried out for different pulse amplitudes (25 to 200 mV) demonstrated that there is a linear relationship hetween peak intensip, i,, and the applied pulse as ex- pressed by the following equation
i, (nA) = 3.90 AE ( i V > - 81 This equation holds for values between 25 and 150 niV. However, the half-height peak width for the latter in- creased somewhat and a pulse amplitude of 100 mV was used hereafter.
The stripping signal was seen to increase with increas- ing electrode area. Since the level of noise that accompa- nied the use of a large electrode surface was not significant, the remainder of the studywas carried out using the largest electrode area (0.025 cm') which provided the most sensi- tive signal and best signal-to-noise ratio.
The influence of the scan rate on the analytical signal was studied under two viewpoints. Firstly, the scan incre-
ment, AT, was varied from 2 m\r to 8 mL7 for a given sampling time (trirop = 0.4 s constant). These results are compiled in Table 1. Secondly, values of 0.3,0.4, and 0.6 s were checked for tdrvp (mantaining As constant at a value of 2 mV).
For a fixed sampling time of 0.4 s, an increase of the scan increment from 2 to 8 mV resulted in broader peaks. Thus, the half-height peak width, for a scan incre- ment of 8 mV is 3.22 times larger than h e corresponding width for 2 mV. Conversely, the peak intensity for a scan increment of 2 m V is 2.66 times larger than the peak intensity obtained for a 8 mV scan increment.
On the other hand, given a value of 2 mV for the scan increment, the variation o f the sampling time (tdnJp) from 0.2 to 0.6 s produced a decrease in the stripping signal clue to the corresponding decrease in the resulting scan rate. The peak width remains essentially unaltered.
Best signals, as a compromise hetween these two factors, were achieved for a scan rate o f 5 m\[s- ' obtained with As = 2mV and td,,,,, = 0.4 s. These values have been adopted as optimum for the remainder of the study.
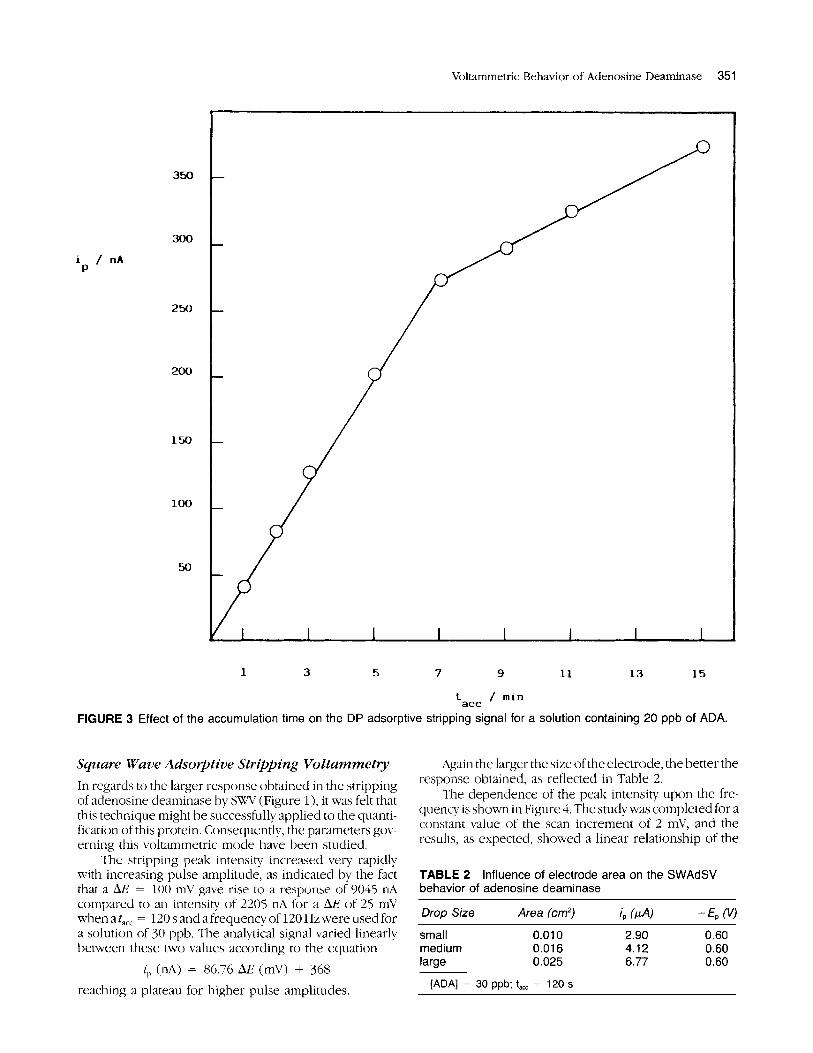
Successive voltamniogranis were recorded from a solution containing 20 ppb of .MIA under the above described conditions for illcreasing accumulation times. The resulting peaks showed a linear relationship between their peak intensity and the accumulation time up to 420 s (n = 5, r = 0.998) with a slope of 0.62 n A - l (Figure 3) . Far from reaching a saturation of the electrode area, the peak intensity continued to increase but with a smaller slope (0.21 IL~s - ' ) . This finding is in good agreement with the assumption of a predominant role exerted by the electrostatic interactions in the adsorption process as earlier discussed. Thus, when a certain coverage of the electrode is reached, interactions among the molecules in the adsorbed state become noticeable. The peak potentials undergo a small displacement towards more positive po- tentials as an indication of the need o f a lower energy to attain the stripping of the adsorbate from the electrode. A calibration graph was constructed by using a t,,, of 180 s, which is not too high and at the same time well within the linear range ofthe accuniulation time study, which yielded a linear response between 6 and 38 ppb of the analyte with a slope of 5.23 nA n8-l nil and a correlation coefficient of 0.993 ( n = 7).
The reproducibility of the stripping signal expressed in terms of the relative standard deviation for seven measurements carried out at a concentration level of 8 ppb was 2.28%.
TABLE 1 of adenosine deaminase
Influence of scan rate on the DPAdSV behavior
A s (mV) V (mV/.s) AW,!2 (mv) i, (nA) -€, (V)
2 5 46.03 188.2 0.564 4 10 63.53 111.8 0.550 6 15 127.04 94.1 0.543 8 20 148.24 70.6 0.529
[ADA] = 30 ppb; t,,,, 0.4 s
Voltammetric Behavior of Adenosine Deaminase 351
i / nA P
350 -
300
250 -
700
150 -
loo -
1 3 5 7 9 11 13 15
tact 1 min FIGURE 3 Effect of the accumulation time on the DP adsorptive stripping signal for a solution containing 20 ppb of ADA.
Square Wave Adsorptive Stripping Vo ltam me try In regards to the larger response obtained in the stripping of adenosine deaminase by SVCV (Figure l), it was felt that this technique might he successfully applied to the quanti- fication of this protein. Consequently, the parameters gov- erning this voltammetric mode have been studied.
The stripping peak intensity increased very rapidly with increasing pulse amplitude, as indicated by the fact that a AE = 100 mV gave rise to a response o f 9045 nA compared to an intensity of 2205 nA for a AE of 25 mV when a tacc = 120 s and a frequency of 120 I Izwere used for a solution of 30 ppb. The analytical signal varied linearly between these two values according to the equation
z , , (nA) = 86.76 AE (mV) + 368 reaching a plateau for higher pulse amplitudes.
,%gain the larger the s i x of the electrode, the better the response obtained, as reflected in Table 2
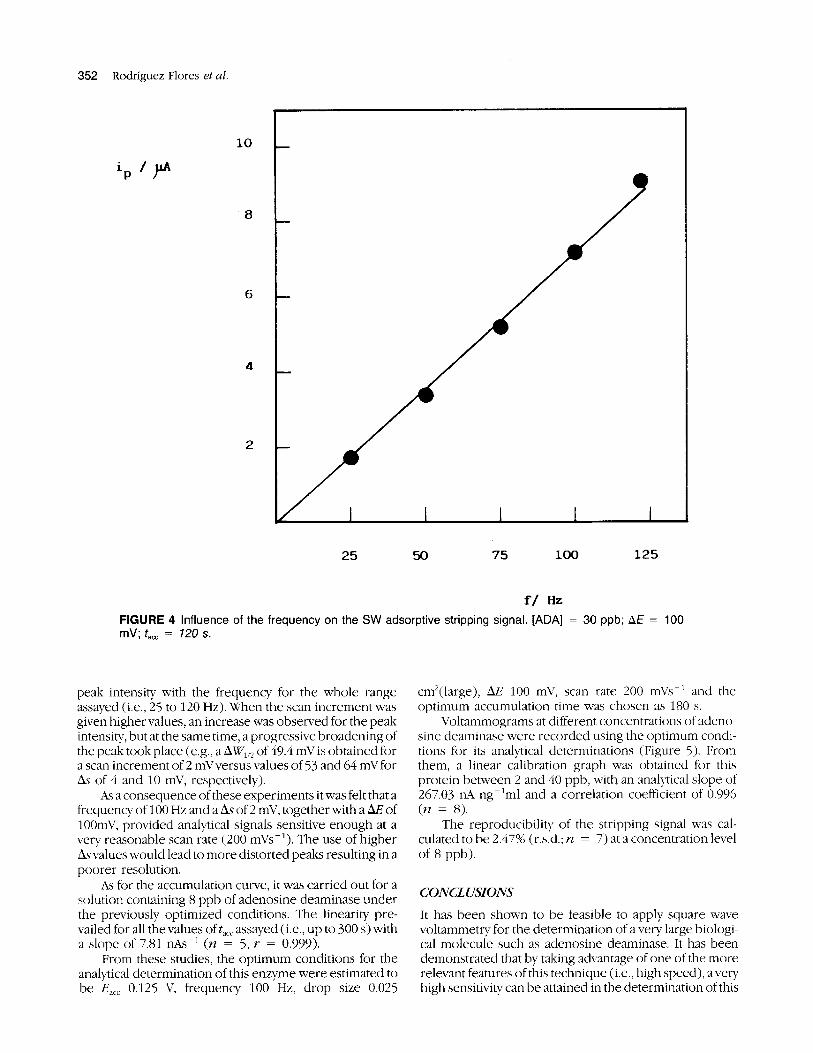
The dependence of the peak intensity upon the fre- queiicy is shown in Figure 4. The study was completed for a constant value of the scan increment of 2 mV, and the results, as expected, showed a linear relationship of the
TABLE 2 Influence of electrode area on the SWAdSV behavior of adenosine deaminase
Drop Size Area (cm') i P (PA) -4 (V)
small 0.01 0 2.90 0.60 medium 0.016 4.12 0.60 large 0.025 6.77 0.60
[ADA] = 30 ppb; t, = 120 s
352 Rodriguez Flores et al.
10
iP /P 8
6
4
2
25 50 75 100 125
f/ Hz FIGURE 4 Influence of the frequency on the SW adsorptive stripping signal. [ADA] = 30 ppb; BE = 100 mV; t,,, = 120 s.
peak intensity with the frequency for the hole range assayed (i.e., 25 to 120 Hz). When the scan increment was given higher values, an increase was observed for the peak intensity, but at the same time, a progressive broadening of the peak tookplace (e.g., a of 49.4 niV is obtained for a scan increment of 2 mVversus values of 53 and 64 mV for AT of 4 and 10 mV, respectively).
hs a consequence of these experiments it was felt that a frequency of 100 Hz and a AT of 2 niV, together with a AE of 100niV, provided analytical signals sensitive enough at a very reasonable scan rate (200 nnVs-’). The use of higher Ayvalues would lead to more distorted peaks resulting in a poorer resolution.
As for the accumulation curve, it was carried out for a solution containing 8 ppb of adenosine deaminase under the previously optimized conditions. The linearity pre- vailed for all the values oft,,, assayed ( i e , up to 300 s) with a slope of 7.81 nA-’ (n = 5, r = 0.999).
From these studies, the optimum conditions for the analytical determination of this enzyme were estimated to be E,,, 0.125 V, frequency 100 Hz, drop size 0.025
cm’(large), & 100 mV, scan rate 200 mVs-’ and the optimum accumulation time was chosen as 180 s.
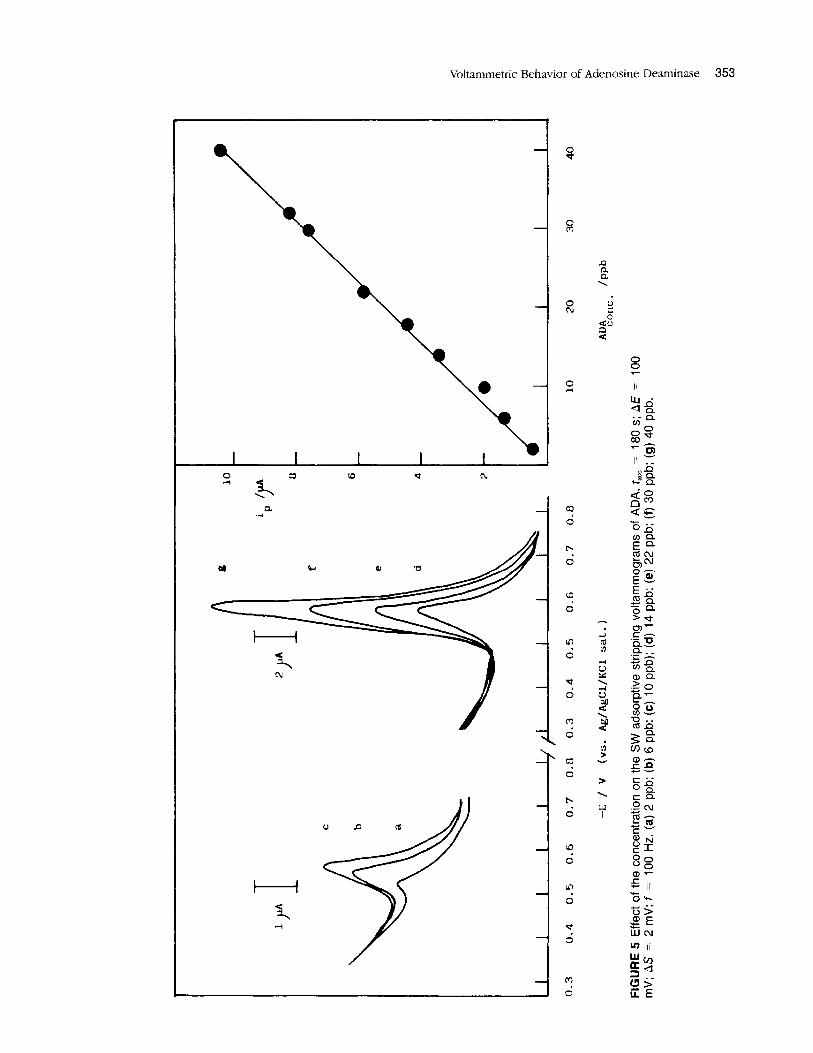
Voltammograms at different concentrations of adeno- sine deaminase were recorded using the optimum condi- tions for its analytical determinations (Figure 5) . From them, a linear calibration graph was obtained for this protein between 2 and 40 ppb, with an analytical slope of 267.03 nA ng-lnil and a correlation coefficient of 0.996 (n = 8).
The reproducibility of the stripping signal was cal- culated to be 2.47% (,rs,d,; n = 7) at a concentration level o f 8 ppb).
CONCLUSIONS 1 9 uare wave It has been shown to be feasible to applj -q
voltammetry for the determination of a very large biologi- cal molecule such as adenosine deaminase. It has been demonstrated that by taking advantage of one of the more relevant features of this technique (i.e., high speed), a very high sensitivity can be attained in the determination of this
PA I
0.3
0
.4
0.5
0.6
0.7
0.0
0.3
0
.4
0.5
0.6
0.7
0.8
10
20
30
40
/P?b
ADtonc.
-E /
\I
(vs.
Ag/
AgCl/KC1 sa
t.)
FIG
UR
E 5
Effe
ct o
f th
e co
ncen
tratio
n on
the
SW
ads
orpt
ive
strip
ping
vol
tam
mog
ram
s of
AD
A.
t,, =
18
0 s;
A€
= 1
00
mV
; AS
= 2 rn
V; f
= 1
00 H
z. (
a) 2
ppb
; (b
) 6 p
pb; (
c) 1
0 pp
b); (
d) 1
4 pp
b; (e
) 22
ppb
; (f)
30 p
pb; (
9) 4
0 pp
b.
354 Rodriguez Flores et al.
enzyme with a great economy of time. It has been proven in the CV study that the high scan rate is not the only factor responsible for the excellent sensitivity reached by SW. A limit of quantification of 2 ppb was found, which lowers by three orders of magnitude the previous limits for other proteins. The high sensitivity obtained could prove useful in the determination of real samples, keeping in mind the possible interferences caused by other proteins.
We would like to thank Dr A. Cubero and Dr. M. Ros for helpful biological information.
REFERYLVCES 1. A. Coddington, Biochina. Biophys. Acta 99 ( 1965) 442. 2 . J. E. Seegmiller, L. Thompson, 13. Bluestein, R. Willis, S.
Matsumoto, and D. Carlson, ‘Xucleotides and Nucleosides Metaholism and Lyniphocite function,” in E. W. Gelfand and H. M. Dosch (eds.), Biological Bases of I~i~irzzkrzodeficienc, Raven Press, New York (19801, pp 251-268.
3. M. H. van der Weydcn and L. Bailey. Clin. Chirn. Acta 82 (1978) 179.
4. G. C. Secchi, A. Rezzonico, and K, Gewasini, Emyinol. Bid. CIin 8 (1967) 67.
j. 1). XJ . Martin and E. W. Gelfand, Annu. Ref Riochern. 50 (1981) 845.
6. G. Dinescu-Romalo, C. Mihia, and L. Mad, f&ue ROUi7L.
Biochern. 14 (1977) 161. 7. H. Keogh. J. Pauly, G. Tritsch,A. Mittelman, and G. P. Murphy,
J. Surg Oncol8 11976) 417. 8. H. M. Kakkar,,/. Biol. Chem. 167 (1947) 461. 9. H. Klenow, Biochem. ./. 50 (1952) 404.
10. 0. E. Hjemddh~-Monst-n, D. S. I~apastatiiopoulos, and G. A. Rechnitz, Anul. Chim. Actu 88 (1977) 253.
11. G. Ellis and D. M. Goldberg,]. J&. Clirz. Med. 76(1970) 507. 12. F.Heinz,S. Reckel,R. Pilz,andJ. R. Kalden,~ra~~me25(19XO)
50. 13. J. Wing in A. J. Bard (Ed.) Elec~~ana l j i t i cu lChem~t~ i vol16,
Marcell Dekker, New- York, 1989, p. 39. 14. P. Carthy, R. O’Kennedy, E. Lorenzo Abaci. J. M. Fernandez
Alvarez, J. Rodriguez Flores, M. R. Smyth, and K. Tipton, ArzuZ))st 115 (1990) 617.
15 J, %I, Fernandez Alvarez, C. O’Fagain, R. O’Kennedy, C. G. Kiln. and M. R. Smyth, Anal. C h m . 6% (1990) 1022,
16. C. Marin, E. Gonzalez, F. Pariente, E. Lorenzo, and J. Rodriguez, Electroanulym 3 (191) 405.
17. L. Q. Zhang and P. E. Sturrock, Ekctroanalysis 2 (1W) 289. 18. D. i\. Wiginton: D. J. Kaplan, J. C. States, A. L. keson, C. M.
Perme. I. J. Bilyk. A. J. Vaugh, D. I.. lat ier, andJ. J. Hutton, BiocbeinisD>~ 25 (1986) 8234.
19. 1. Kolrhoff and C. Bari1um.J. Am. C h m . SOC. 6.3 (1941) 520. 20, 3%. T. Stankovich and A. J. Hard, J . Electroanal. Chenz. 75
21. F. Heinz and S. Keckel. iLlelhods of Erzz?,mutic A n a l ~ ~ k 7 (1 977) 687.
( 1985) 110.