adsorptive stripping tensammetry of motor oils in aqueous solutions
TRANSCRIPT

Electroanalysis, 5( 1993) 17 1 - 176
Adsorptive Stripping Tensammetry of Motor Oils in Aqueous Solutions
Martin Kovuc, Robert Kalvodu, ' Ladislav Novotny, and Antonin Bwkd 'I :NESCO Laborator)! of Enz iirorznzental Electrochemistqi at the J . Hq!rous@ Institute of Physical C'henzistqi and Electrochenzistql?: Czechosloz tak Acadevqr of Sciences, Prague 8, Dolejskoi )a 3, Czechosloz iakia -'Department of Auialyrical Chernisrq, Charles liniz )ersiy, Prague 2, Albwtou 2030, Czechoslovakia Keceii led Octolw 14, 1 90 1.
ABSTRACT Adsorptive stripping tensammetry at a lianging mercury drop electrode is described for aqueous solutions of various m o t ~ r oils. The method can be used for the determination of oils in polluted waters in the concentration range from 0.4-0.8 t o 3.5-7 ppm, dependent on the type of oil. Distinction bemeen "pure" and "used" motor oil is made.
KEY WORDS: Adsorptive stripping tensammetry, Motor oils
INTRODUCTION
Petroleum components and motor oils represent a group o f very frequent water pollutants. For the determination of these compounds in waters, spectropliotonietric and chromatographic methods are predominantly used. However, electrochemical methods can also serve for these purposes. The published polarographic determi- nations of petroleum components in water are based on their surface properties. Some of these articles deal with the influence of petroleum and its fractions on the po- larographic maxima with the aim of their determination in sea water [ 1,2]. Attention was focused on water-solu- ble substances obtained by shaking petroleum, heating oils, etc., with water. Crude oil-type substances dissolved in water can also be determined using polarographic methods, especially when combined with previous ad- sorptive accumulation of the substances on the surface of a hanging mercury drop electrode [the adsorptive stripping tensammetry (AdST) method]. The desorption peak is then measured in base electrolyte solutions con- taining NaOH or KF [3,4]. Water pollution with petro- leum can be measured at concentrations from 0.1-0.2 to 10 mg/L depending on the quality of the oil and with diesel oil at concentrations from 30-50 ug/L to 0.5 mg/ L. The content of crude oil-type substances in water can also be determined by electrocapillary measurements [ 51 relative to the dropping mercury electrode (DME) drop time on potential. These substances can be present in emulsions which yield a tensammetric peak, usually of a very sharp shape. The height of these peaks exhibits a
time dependence on the change in the emulsion stabil- ity. Emulsions of motor and vegetable oils were studied using oscillographic polarography with alternating cur- rent [GI: these oils could be identified in their mixtures, as the peak potential for every type of oil is typical. De- terminations are possible in the concentration range from 0.5-100 mg/L (dependent on the type of oil).
The object of the present work is to study the be- havior of aqueous extracts of motor oils using AdST and to propose a method for their determination in waters, where they can occur as pollutants. On the other hand, the parameters of the tensammetric peaks are used for distinguishing various sorts of these oils.
EXl'EHMEhTXL Equipment A polarographic analyzer (Model PA 3; Laboratorni Pris- troje, Prague) was used for fast scan differential pulse voltammetry (DPV) for this method, five polarization pulses of 50 mV amplitude per second were applied to the mercury electrode. A static mercury drop electrode (from the same source) was used in the hanging mer- cury drop electrode mode, with a Ag/AgCl reference electrode.
Chemicals The motor oil samples were obtained from gasoline sup- pliers or motorcar/air craft workshops. The KC1 sup- porting electrolyte was prepared from the reagent-grade
'To whom correspondence should be addressed
0 1993 VCH Publishers, Inc 1040-0397/93/$5.00 + .25 171

I h A l
10
8
6
4
2
0
FIGURE 1. The dependence of the peak height of transformer oil in 1 M KCI-relative dilution 0.1 17 on Eacc for a 60 s accumulation time.
substance lyhich was first heated for 2 hours t o 650°C to destroy any surface active organic compounds pres- ent. Solutions were prepared from redistilled water in quartz.
t+epamtion qf Whttr- Sumple.< Contuining 12.10tor Oils. Five grams o f o i l were shaken vigorously for 1 hour with 100 nil o f redistilled water. The water extract was used in the experimental work after standing 2 days when no opalescence was observed.
Method of Measurement For recording tensammetric curves, 0-6 ml o f the sani- p k (saturated motoT oil solution in water) was pipetted into the polarographic cell containing 15 ml 1 M KCI, and the solution mas deaerated with nitrogen. The hang- ing mercu? drop electrode was then formed and po- larized t o a voltage, E',cc, at which the adsorptive accu- mulation proceeded and the DPV tensammetric curve was recorded afternard (after a 10 second rest period). The adsorptive accumulation was carried out either in quiet or in stirred solution. The concentration of the samples is expressed in "relative dilution." This term denotes the relation of the volume of the added saturated solution
i
E FIGURE 2. Tensammetric curves of motor oil M5AD in 1 M KCI. E,,, = -0.6 V versus Ag/AgCI, t,,, = 90 s, concentration of the sample-relative dilution: (1) 0, (2) 0.062, (3) 0.118, (4) 0.167, (5) 0.211, and (6) 0.250.
of oi l in water to the total volume of the analyzed sam- ple: the relative dilution thus gives the dilution o f the saturated o i l solution.
RESULTS AND DISCUSSION
To establish the optimal conditions, the niost suitable accumulation potential E,,,, was established by examin- ing the dependence o f ip on E.,,,; an example is given in Figure 1. Also, the effect of the accumulation time t,tc, was studied and the dependence of ic, on concentration was established. For effective accumulation, I or 2 min- utes were appropriate; at longer t,,,, the ir value reached the limitation as the surface of the electrode was covered with the adsorbate.
All types o f examined mineral oils gave one or more mostly blunt tensammetric peaks in the potential region from -0.6--1.3 \' [Ag/AgCI] in 1 M KCI solution (Fig- ures 2 and 3). In some cases, two or even more peaks were observed on the curve. This can be caused by the fact that mineral oils are mixtures of different hydrocar- bon components frequently containing some additives, which cause subsequent desorption of previously accu- mulated compounds to occur. Differences in the peak height can be caused, in this case, by different adsorb- ability o f these compounds, by mutually influencing the
Adsorptive Stripping Tensammetr\- o f Motor Oils in Aqueous Solutions 173
1 I A \
4
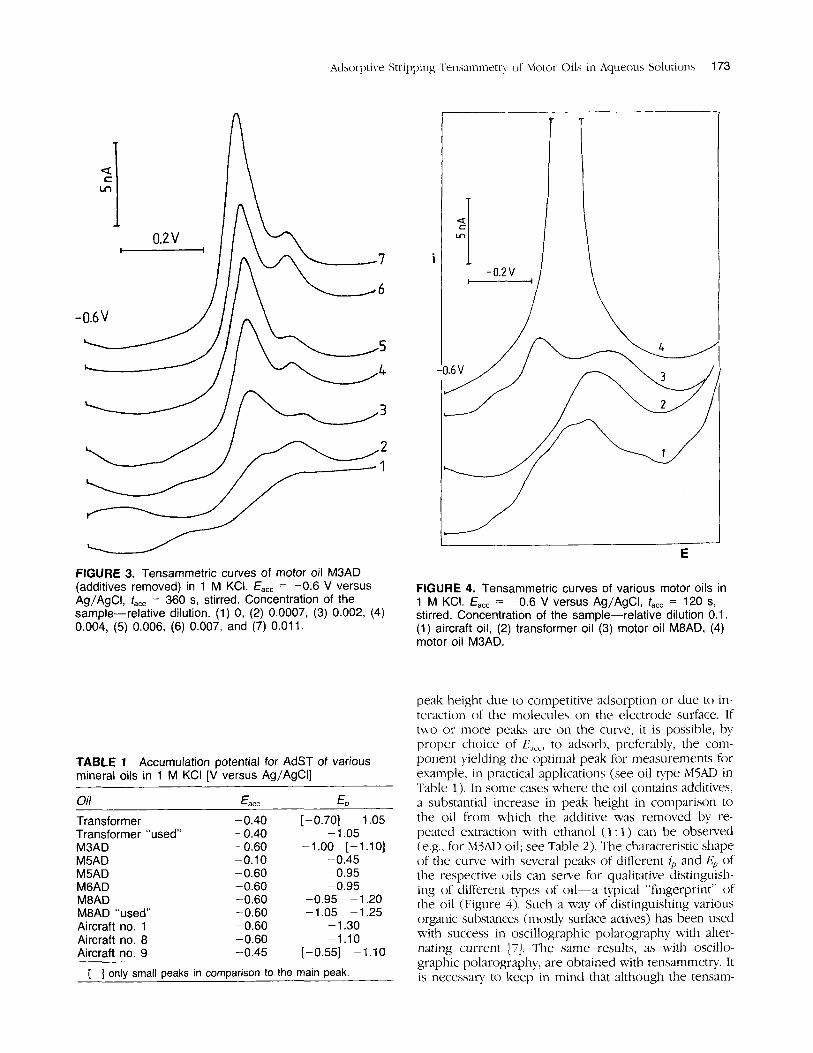
FIGURE 3. Tensammetric curves of motor oil MBAD (additives removed) in 1 M KCI. Eacc = -0.6 V versus Ag/AgCI, fa,, = 360 s, stirred. Concentration of the sample-relative dilution. (1) 0, (2) 0.0007, (3) 0.002, (4) 0.004, (5) 0.006, (6) 0.007, and (7) 0.011.
TABLE 1 Accumulation potential for AdST of various mineral oils in 1 M KCI [V versus Ag/AgCI]
Oil Eacc EP
M3AD -0.60 -1.00 [-1.101
Transformer -0.40 [-0.701 -1.05 Transformer “used” -0.40 - 1.05
M5AD -0.10 -0.45 M5AD -0.60 -0.95 M6AD -0.60 -0.95 M8AD -0.60 -0.95 -1.20 M8AD “used” -0.60 -1.05 -1.25 Aircraft no. 1 -0.60 -1.30 Aircraft no. 8 -0.60 -1.10 Aircraft no. 9 -0.45 [-0.551 -1.10
[ ] only small peaks in comparison to the main peak.
I E
FIGURE 4. Tensammetric curves of various motor oils in 1 M KCI. Eacc = -0.6 V versus Ag/AgCI, fa,, = 120 s, stirred. Concentration of the sample-relative dilution 0.1. (1) aircraft oil, (2) transformer oil (3) motor oil M8AD, (4) motor oil M3AD.
peak height due to competitive adsorption or due to in- teraction of the molecules on the electrode surface. If two or more peaks are o n tlie curve, it is possible, by proper choice of E,,,, to adsorb, preferably, the com- ponent yielding the optimal peak for measurements for example, in practical applications (see oil type M5AD in Table 1). In some cases where the oil contains additives, a substantial increase in peak height in comparison to the oil from which the additive was removed by re- peated extraction with ethanol (1 : 1) can be observed ( e g , for M3AD oil; see Table 2 ) . The characteristic shape of the curve with several peaks of different ip and Ep of tlie respective oils can serve for qualitative distinguish- ing of different types of oil-a typical “fingerprint” of the oil (Figure 4). Such a way of distinguishing various organic substances (mostly surface actives) has been used with success in oscillographic polarography with alter- nating current [7]. The same results, as with oscillo- graphic polarography, are obtained with tensammetry. It is necessary to keep in mind that although the tensam-

174 KO\ ac <’I a f
TABLE 2 Characteristics of calibration straight-line regressions equation y = a + bx, where y is the peak height in nA, x is concentration in relative dilution, t,,, = 60 s, stirred.
Oil sx SY r n Transformer “pure” -2.17+ 15.41 x 0.09 3.39 0.9635 6 Transformer “used” - 1.08+ 105.28~ 0.07 8.12 0.961 7 5 M3AD - 20.90 + 1230.01 x 0.03 16.72 0.981 7 16 M3AD without additives -3.44+ 152.57~ 0.09 13.23 0.9998 5
0.08 37.15 0.9864 10 M5AD -0.56+ 448.18~ M8AD “pure” -0.14+ 40 .57~ 0.10 4.30 0.9973 8 M8AD “used” -1.21+ 102.02x 0.04 4.59 0.9979 5 Aircraft no. 9 -0.15+ 8 . 4 8 ~ 0.08 0.71 0.9824 8
t,,, = 180 s, unstirred M6AD -2.27+ 57.57x 0.07 3.18 0.9952 5
t,,, = 90 s, unstirred
.. . . . . . . . . . . . . . . . . . . . . . . . . . . . . . . . . . . . . . . . . . . . . . . . . . . . . . . . . . . . . . . . . .
M5AD -5.06+ 379.63~ 0.05 18.50 0.9938 6 E,,, = -0.6 V -47.71 + 8750.1 2x 0.01 31.43 0.9317 6 E,,, = -0.1 V
metric peaks ;ire well reproducible often of charxter- istic shape for the respective cotinpoiitid, the!. are sen- sitive to the presence o f other surface-acti\ e compouincls; that means t h t the cunes c m then change their t!pical shnpe. This ixohlcm is under fiirther studJr.
On examining “pure” ancl “used” oils. i t n.as 01)- s e n d that the shnpe o f the cume changed in such ;I way that one peak increased n.hile the other one dccreasecl depending on the st;ite o f the oil ~ised 21s engine lubri- cant (see F.‘igure 5 ). I’erhaps this phenomenon could be used in the ev:iluation o f the state of the oil during the work of the motor engine, as chemical changes i n the c( )mpt )s it ic) t i ( I f the oi I ()ccu r depencii ng o n the c o i ~ red mileage. 7‘his effect is under stud!., :IS the possiI>ility o f diagnosis of the use of the motor oil could have ilnpor- tatit economic coiiseq~ieiiccs.
The \dues ofE,, given in Table 1 are, of co~irse, coin- centration dependent, as is usual with tensammetric peaks. In the concentration range from 0.062-0.250 o f relative dilution, the E/, \ d u e lmics from 5-30 in\’ i n the direc- tion to positive or negdtive potential ~ i l u e s (oil IZlSAl), h l shn ) . With the transformer oil, ;I linear shift to nega- tive potential values \vas o h s e n d . As the peak potential is a function o f the surhce concentration on the elec- trode surface. the El, is also dependent on [,,<‘.
The height o f the tensammetric peak is. in general, concentration dependeilt and follows, in principle, the course o f the xisorption isotherm. For anal>Tical pur- poses, the linear part can be exploited. In the case of mineral oils in aqueous solutions, this linear region is i n the concentration range from 0.040-0.350 o f the rel- ative dilution, nhich means, at the rtssumed solubili~~ value of 10 t o 20 ppnn o f oil in water, that the coilcentration ranges from 0.+-0.8 to 3.5-7.0 ppm, dependent on the hpe o f oil. I n the following, the procedure for oil de- tcrmin:ition i n polluted water is 6’ ’n’en.
Detemiiiiatioii of iniizctzll oil itz u1ater. Five ml of analyzed water :ire added to 5 nil of 2 M KCI in the po- larographic vessel (this relation can be adjusted if nec-
i
L / / I
E
FIGURE 5. Distinction of “used” oil from “pure” oil of the M8AD type in 1 M KCI. E,,, = -0.6 V; tact = 180 S ; stirred; concentration-relative dilution 0.21 0. (1) 1 M KCI, (2) “pure” oil, (3) “used” oil after 60.000 Km.
essrin) and the solution is deaerated (argon is prefera- ble). The accumulation is performed on a new drop o f the HMDE at E.,,, = -0.6 V and t‘,,, = 60-120 seconds under stirring of the solution. Aftenvard, the stirring is stopped, and after a 10 second rest period, the cathodic DPV c u n e is recorded. For quantitative evaluation, it is

Adsorptive Stripping Tensammetn of Motor Oils in Aqueous Solutions 175
n
FIGURE 6. Tensammetric curves of emulsions of various types of motor oils (0.2 g of oil in 100 ml of 0.5 M KCI). E,,, given in the figure, t,,, = 30 s. (1) motor oil M5AD, (2) transformer oil, (3) aircraft oil no. 9, (4) aircraft oil 171). 3.
advantageous to know of the source or the product pro- ducing pollution of the water sample and the prepara- tion o f the standard saturated o i l solution in water from this known oil source. LJsing this standard solution, a calibration plot is constructed by measuring the peak heights after stepwise additions of 0.5 ml standard oil solution t o 15 nil of 1 M KCI in the vessel. The standard addition method can also be used provided the peak heights follow the linear part of the calibration plot. The solubility o f the oil in water can be estimated by nieans o f extraction methods. For transformer oil, we have thus estimated the solubility value of 20.5 ppiii. The pub- lished values for the oil solubility in water are in the range around 20 ppm [S]. To obtain the oi l concentra- tion o f the sample, the relative dilution value is then (in the case of the known oil solubility in water) multiplied by this value. The standard solutions can also be pre- pared by dissolution of 5-10 mg of oil in 1 L of water by vigorously shaking the solution [ 2 ] . It should be em-
phasized that strict purity conditions must be guaran- teed. This also means that the supporting electrolyte (1 M KCI) niust be checked to be sure that there are no traces of surface-active compounds present which could cause deformations on the curve or the presence of a peak.
As a practical example, the analysis of water con- taining transformer oil can be mentioned. At an accident in an electric transformer system, the transformer oil polluted water. This water was purified by means of a special filtration procedure. The remaining oil in the water was estimated: values from 1-7 ppm were found, which are under the maximum allowed [ lo ppm].
The precision of the method was estimated with the solution of transformer oil in waters (relative dilution 0.1 5 ) by six successive measurements, yielding a mean current 14.8 nA, a range of 14.5-15.2 nA, and a relative standard deviation of 1.4%. With motor oils M3AD (rel- ative dilution 0.009) and M5AD (relative dilution 0 .25) the standard deviation was 6.0% and 8.5%, respectively.
Characteristics of cd~ibratiO11 straight-line regres- sions are given in Table 2. From this table, a variability in the slope iJc value of various types of oil is evident. A similar case is with the “pure” and “used” oil or with oi l after removal of the additives. The mentioned slope value is a measure of the sensitivity which is, at tensam- metric measurements, dependent on the adsorptivity of the compound on the electrode surface. As mentioned in [9,10], the adsorption coefficient p of the compound in the used electrolyte solution must have a value of ca. 10’ L/mol if the surface-active compound has to be ac- cumulated on the electrode t o increase the sensitivity of the tensammetric analysis by AdST. Compounds having adsorption coefficients = >1 x 10’ to 5 x 10⁴ L/mol [ 1 1,121 are strongly adsorbable.
Novotny derived [ 131 for the concentration depen- dence of the voltammetric signal, in the region of Small concentration levels, the equation
and thus, for the slope i/c,
i/c = k 2 E p 6 - k,V%$c’ ( 2 ) where k2 and k, are proportionality constants and V‘& denotes the maximum coverage of the electrode. The slope i/c can be considered therefore as a function of the adsorption coefficient
i/c = f / P / ( 3 ) and the adsorptivity expressed by the slope as a param- eter typical for the respective oil. This means that for qualitative dislinguisliing between various types of oil, eventual estimation of the degree of their wearout can serve not only the typical shape of the curve but the cal- culated slope value.
The relative high values of the standard deviation Sx (Table 1) can be caused by the fact that the adsorption process, in contrast to faradaic ones, exhibits changes on the curve o f the supporting electrolyte in the region of

the peak at ven sinall concentrations of the surfactant. This also unfiworably influences the detection limit.
The Behavior of Emulsions of Motor Oils in Water Solutions
0.2 g o f oil in 100 nil 0. j M KC1 lvas vigorously mixed in an ultrasonic tank for 20 minutes. This t:mu~sion was pipetted in amounts from 0.1-0.5 ml into 50 ml 0.5 M KCI in the polarographic vessel. After the accumulation at E,,, = 0 V and t‘,,, = 30 seconds, the curve from 0 V to negative potential values n a s recorded. Aircraft o i l nos. 8 and 9 yielded an ad- sorption peak at --0.1 V and a desorption peak at -0.95 V, the transformer oi l had peaks at -0.55 and -0.90 V, \vhile with the o i l h13AD, a blunt peak at -0.4 V ap- peared. The reproducibility of the peak high nieasure- ment 1 ~ 4 s estimated hy nine measurements of emulsions containing 0.2 g o f transformer oil in 100 nil o f 0.5 hf KCI solution, the standard deviation being 2.4%. Thus, various ypes o f oils in emulsions yielded qualitatively different curves; this is in accordance with previoiis mea- surements o f emulsions o f vegetable oils using oscillo- graphic polarography with alternating current [6]. This measurement proved that AdST-DPV is a convenient method for stud!, o f the behavior o f emulsions, mainly o f their stabilit\-. The proceeded degradation of the emulsion Ilas. as :i consequence, a decrease o f the peak.
I-’repnmtioii cf emislsions.
CONCLUSIONS
The adsorptive :iccumulation of motor oils [and other types of oil ( b ) ] on the surface of the mercun. electrode from their water solutions enables a simple anti sensitive voltammetric cletermination o f oils in waters. Waters are frequentl!. polluted with motor o i l due t o industrial or traffic accidents, careless nianipulation with lubricants in large car parks, etc. This method can be used not only for environmental pollution control but also in some im clustrial applications, where traces of oil in water must he identified. The determination o f traces o f turbine oil in water in steam generators in power plants is under study. Preliminan experiments have demonstrated that on the basis o f thc: characteristic shape of‘ the tensam- metric c u n e , it is possible to distinguish different types of motor oils :ind estimate the state o f the o i l used as engine lubricant. I n principle, tensamnietric measure- ments are based on nonselective measurements o f
changes o f the interface activity of aqueous solutions, which may lead t o difficulties in cases where a sample t o be analyzed contains more than one surface-active substance. Therefore, the matrix effect is very important. Special attention to this problem will be given in the future on the determination o f oil pollution o f soil. Some improvements in the selectivity of the method can result from the supplementary study of the potential-depen- dent electrocapillar?. activity [ 51 which corresponds to the electrosorption characteristics of the system considered.
APPENDIX
Classification of the motor oils Oil Classification Classification
M3AD Madit Spec. sc/cs 10 W/30 API* SAE**
M5AD Mogul Spec. SC/CH 10 w/30 MbAD SC/CH 3 0 MHAD Mogul Super SI)/CH 15 W/50 *AI’I. American I’etroleum Institute **S.@, Socier! o f Automot ive Eiigirieers
REFERENCES
1
2
3
4
5
6
7
8 7
10 11
12
13
Z. Kozarac, n. Cosovic, and M. Hranica../ EI~C~I-OUTZUI. Clwrn. 66 (1976) 75. V. Zuric, H. Cosovic, and Z. Kozsrac, ,/. Elcctroarzal. C h r i . 78 (1977) 113. K. Kalvoda and L. Novotny, Vodrii bospodur.w.i I I ( 1984) 291. R. Kdvoda :and I*. No\utny, CoN Czechoslo~ lac. C h r i . Coi~itri. 5 1 ( 1986) 1587.
51 (1986) 1595. K. Kalvoda, Actu Chini. Acad. Sci. Iliitzg. .i2 (1962) 294. K. Krrlvuda , 1 kchziqiies y f Oscillograpbic PoIurogvcp/?)~, E 1 - sevier, Amsterdam, 1965, p. 153. K. Kalvoda, Coll. Czechosloiac. Chem. Conirrz. 25 ( 1960) 3071. A. Grunwald, Vodtzi Ifospodarsti,i 4B (1978) 105. K. Kralvoda, Aria/. Chin?. Actu 1.38 (1982) 11. K. Kalvoda, Avlaf. Chim Actu 162 (1984) 197. L. Novotny, I . Snioler, and J. Kuta, Coll. Czechosloriuc. Clxnz. Co:onim 48 (1983) 964 50, (1985) 2525. 13. Hehr zand hl. Ihgowska,]. Electvoarial. Cheirz. 82 (197’)
L. Novotny, New Trends in Anal]jtical Chenzistq3 (in Czech- oslovakian), I. Zyka, Ed., Publishers o f Technical Literature, Prague, 1989, p. 56.
L. Novotny and K. Kalvoda, Coll Czechoslorac. Cht.rl?. C0~72111
317.