adult literacy education study—revised december … · study the status of adult literacy...
TRANSCRIPT

Adult Literacy Education Study
State of
Washington
November 14, 2008(Revised December 2008)

BERK & ASSOCIATES120 Lakeside Ave, Ste 200Seattle, Washington 98122206/324-8760www.berkandassociates.com
Founded in 1988, we are an interdisciplinary strategy and analysis firm pro-viding integrated, creative and analytically rigorous approaches to complex policy and planning decisions. Our team of strategic planners, policy and financial analysts, economists, cartographers, information designers and facilitators work together to bring new ideas, clarity, and robust frameworks to the development of analytically-based and action-oriented plans.
“Helping Communities and Organizations Create Their Best Futures”
Principals: Bonnie Berk and Michael HodginsProject Manager: Julia BoschProject Team: Jennice Hyden, Malia Langworthy, Erik Rundell, Julia Warth
Annie Pennucci, Senior Research Associate
ADULT LITERACY EDUCATION IN WASHINGTON STATE
EXECUTIVE SUMMARY INTRODUCTION The Washington State Institute for Public Policy contracted with Berk & Associates to conduct a study of adult literacy rates and programs in Washington State, in response to a 2008 legislative directive “to study the status of adult literacy education in Washington.” The study includes “an analysis of literacy rates by county; a review of the research literature; a description of literacy-related services provided by state agencies and community-based organizations; and an analysis of characteristics of persons receiving those services” (ESHB 2687, 2008).
DEFINITION OF LITERACY Literacy encompasses the skills of reading, writing, speaking in English, computing, and solving problems. The current federal definition of literacy is stated in the Adult Literacy and Family Education Act (ALFEA):
An individual's ability to read, write, speak in English, compute, and solve problems at levels of proficiency necessary to function on the job, in the family of the individual and in society.
There are a variety of tools to measure and terms to describe these literacy levels. Literacy is measured along a spectrum of proficiency levels, rather than as discrete measurements of “literate” and “illiterate.”
LITERACY IN WASHINGTON STATE: POPULATION ESTIMATES In Washington, between 10% and 15% of the adult population (approximately 370,000 to 555,000 adults age 16 and older) were estimated to have the lowest level of literacy between 1990 and 1992. In 2006, almost half a million Washingtonians over the age of 25 lacked high school credentials, and 5% of the state’s total population, or approximately 268,853 people, were English language learners. A higher percentage of the populations in the Central Washington counties of Franklin, Yakima, Adams, and Grant have lower levels of literacy and high school graduation rates and higher numbers of English language learners.
Low levels of literacy are associated with lower levels of income and employment and higher levels of poverty. Characteristics over-represented in adults identified with lower levels of literacy include lacking a high school diploma, being foreign born, and having multiple disabilities.
Key findings pertaining to the characteristics of adults struggling with literacy are highlighted below.
• Older students (age 18 and over) in Washington’s K–12 school system have lower than average academic achievement than those who graduate earlier.
• TANF recipients have lower than average high school graduation rates, but the majority tested above the lowest two levels of literacy.
• Washington’s incarcerated population has lower than average literacy rates.

Adult Literacy Education in Washington State Executive Summary
November 14, 2008 (Revised December 2008) Page ii
• Approximately 13% of Washington’s population is made up of immigrants and refugees, nearly half of whom are English language learners.
ADULT LITERACY AND BASIC SKILLS EDUCATION PROGRAMS IN WASHINGTON STATE
Types of Programs
In Washington State, adult literacy education is generally provided as a component of adult basic skills education, which is organized into the following three types of instruction:
• Adult Basic Education (ABE) instruction is “designed for adults who lack competence in reading, writing, speaking, problem solving or computation at a level necessary to function in society, on a job or in the family” (National Reporting System for Adult Education, 2001). ABE learners participate in programs to acquire basic literacy and numeracy skills.
• Adult Secondary Education (ASE/GED) instruction is “designed to help adults who have some literacy skills and can function in everyday life, but are not proficient or do not have a certificate of graduation or its equivalent from a secondary school” (National Reporting System for Adult Education, 2001). Typically, these learners attend ASE classes to obtain a GED or adult high school credential.
• English as a Second Language (ESL) instruction is “designed to help adults who are limited English proficient achieve competence in the English language” (National Reporting System for Adult Education, 2001).
Geographic Distribution and Types of Providers
This study identifies 114 providers and 202 programs of adult basic skills education in Washington State. These providers serve a total of 57,474 students. There are four main provider types:
• Community and Technical Colleges (CTCs). Washington State’s community and technical colleges serve 86% of the adult basic skills population. The 34 community and technical colleges offer a wide variety of programs in ABE, ESL, GED, Family Literacy, and Integrated Basic Education and Skills Training (I-BEST).
• Community-Based Organizations (CBOs). 68 CBOs provide adult basic skills education; of those, 12 receive state funding. These SBCTC-funded CBOs serve 4% of the adult basic skills population. CBOs tend to serve more specific populations and offer a smaller spectrum of instructional programs than the community and technical colleges; however, CBOs also provide other auxiliary services, such as transportation or daycare, that the CTCs do not provide.
• Department of Corrections (DOC) contracts with the State Board of Community and Technical Colleges (SBCTC) to provide adult basic skills programs in prison. Ten percent of the adult basic skills population (5,952 incarcerated individuals) receive these educational services.
• Regional Entities, such as libraries and local workforce councils, also provide adult basic skills services, often in partnership with local community and technical colleges.
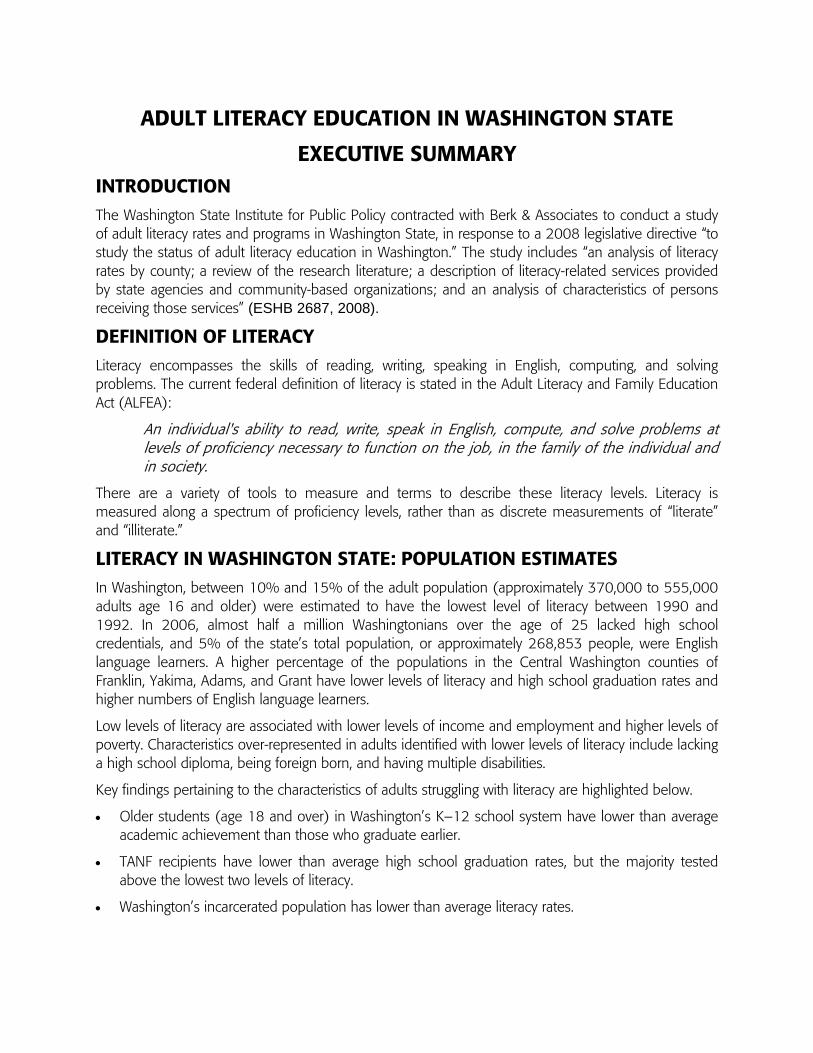
Exhibit ES-1 displays the geographic distribution of literacy-related programs in Washington State. Of the 39 counties in Washington, 31 have programs. There are large rural areas of the state that do not have programs, and many of the rural programs are located in the more urbanized areas of rural counties.
Adult Literacy Education in Washington State Executive Summary
November 14, 2008 (Revised December 2008) Page iii
Exhibit ES-1 Distribution of Adult Basic Skills Programs in Washington State, 2008
Source: Berk & Associates, 2008
Characteristics of Washington’s Adult Basic Skills Students
In 2007–08 school year, there were 51,522 federally reportable adult basic skills students in Washington State. Federally reportable students are those who have met the federal reporting requirements, which include having at least 12 hours of attendance, recorded demographic information, an educational literacy goal, and a Comprehensive Adult Student Assessment Systems (CASAS) pre-test with a score in the federal eligibility range. There were also 5,952 federally reportable incarcerated individuals enrolled in adult basic skills instruction in Washington prisons, in addition to the above mentioned 51,522. The majority of students (61%) in adult basic skills programs are in an ESL program. Of those in ABE or ESL programs, about 60% or more enter at the middle literacy levels. Most basic skills students are over 25 years old, with the largest percentage in the 25 to 44 year old age group. This is especially the case for those in an ESL program, where 25- to 44-year-olds make up 53% of all ESL students. Minorities make up the majority of students (63%) in adult basic skills programs statewide.

Adult Literacy Education in Washington State Executive Summary
November 14, 2008 (Revised December 2008) Page iv
COMPARATIVE SURVEY OF FOUR STATES To gain an understanding of statewide approaches to adult basic skills education in other parts of the country, a survey of four states (Illinois, Massachusetts, North Carolina, and Oregon) was conducted. The four states were selected for study based on several factors, including recommendations from SBCTC staff and national experts in the field; similar demographics to Washington in terms of educational achievement and/or English language proficiency; geographic diversity; and a diversity of provider types.
Key trends across these four states include the following:
• Structuring adult basic skills education within the context of real life and career ladders. Adult literacy programs generally focus on how to ensure successful transitions to post-secondary education and employment. Washington is viewed as a leader in this area, according to those interviewed.
• Better data allows states to focus on outcomes. Providers are becoming more sophisticated in collecting data and web technologies are facilitating more efficient reporting. States are using these data to target strong and weak programs, identify best practices, and allocate funding to get the most out of scarce dollars.
• The quality of instruction varies widely among providers in a state network. Many states are trying to ensure that their programs offer a consistent standard of instruction, and states are using a variety of approaches to set standards. Washington has developed State Adult Learning Standards for ABE and ESL programs.
GAP ANALYSIS This descriptive comparison between estimated potential demand and the existing supply of adult basic skills education services indicates that the number of adults who could benefit from literacy education exceeds the total number of students currently enrolled in the state’s CTC and CBO education system. Exhibit ES-2 presents estimates of quantifying that difference, using different measures of “low literacy” presented in this study. The difference ranges between approximately 312,000 to almost 1.3 million adults.
Exhibit ES-2 Estimates of Gap by Low Level Literacy Measure
Source: NALS 1992, PSU 1996, ACS 2006, Berk & Associates 2008
Gaps in the geographic location of programs present significant accessibility problems. The location of program sites is heavily concentrated in the Puget Sound region and is sparse in rural areas, whereas literacy indicators estimate need throughout the state, and in central Washington in particular. The presence of an adult education site is not the only accessibility issue experienced by adult learners.
Measure of Low Level LiteracyEstimated Number of "Low
Literacy" WA AdultsGap: Difference between Estimated
Number & Current Students(1990-1992) Level 1 370,000 - 550,000 312,256 - 497,526(1990-1992) Level 1 and 2 1,147,000 -1,332,000 1,089,526 - 1,274,526(2006) Lack of High School Diploma 467,600 410,126

Adult Literacy Education in Washington State Executive Summary
November 14, 2008 (Revised December 2008) Page v
Other supporting services, such as financial aid and auxiliary services, were identified by stakeholders as ways to provide opportunities for adult learners to access adult education services consistently.


ADULT LITERACY EDUCATION IN WASHINGTON STATE
Contents
1.0 Introduction ................................................................................................................................... 1
1.1 Purpose and Focus of This Study .................................................................................................................... 1
1.2 Study Methodology ............................................................................................................................................... 1
1.3 Study Components ............................................................................................................................................... 2
2.0 Definition of Literacy ................................................................................................................... 3
2.1 Literature Review: The Evolving Definition of Literacy ............................................................................. 3
2.2 Definition of Literacy for This Study ................................................................................................................ 5
2.3 Measuring Literacy: Identifying Literacy Types and Levels ..................................................................... 6
3.0 Description of Literacy in Washington State ....................................................................... 11
3.1 National Overview: Literacy in the U.S. ........................................................................................................12
3.2 Literacy in Washington .......................................................................................................................................14
3.3 Populations of Interest .......................................................................................................................................21
3.4 Key Findings: Literacy in Washington State ................................................................................................35
4.0 Adult Literacy and Basic Education Programs: Inventory and Description ................. 36
4.1 Overview of Programs, Providers, and Funding .......................................................................................36
4.2 Landscape of Literacy-Related Programs in Washington ......................................................................38
4.3 Students Enrolled in Basic Skills Education Programs in Washington State ..................................40
4.4 Provider and Program Descriptions ..............................................................................................................43

5.0 Comparative Survey of Four States ....................................................................................... 48
5.1 Introduction and Methodology .......................................................................................................................48
5.2 Key Trends and Innovative Approaches Across the States ..................................................................48
5.3 Overview of States Surveyed...........................................................................................................................51
6.0 Gap Analysis: The Supply and Demand for Literacy Education ...................................... 52
6.1 Population Size: Total Students Served Is Less Than Total Demand ...............................................52
6.2 Geographic Distribution of Programs: Concentrated in Urban Areas ...............................................52
6.3 Potential Gaps Identified by Stakeholders ..................................................................................................55
6.4 Summary: Access to Adult Education Programs ......................................................................................56
7.0 Conclusion ................................................................................................................................... 57
7.1 Summary: Snapshot of Washington Literacy Estimates and Literacy Education ..........................57
7.2 Areas for Further Research ...............................................................................................................................57

List of Exhibits
Exhibit 1 Overview of Federal Literacy Legislation and Action ................................................................................. 3
Exhibit 2 Literacy Levels: Measurements, Descriptions, and Linkages ................................................................ 8
Exhibit 3 National Assessment of Adult Literacy (NAAL) Results, 2003 ............................................................12
Exhibit 4 Characteristics Overrepresented in the Below Basic Literacy Level, 2003 NAAL.........................13
Exhibit 5 Washington and U.S. National Adult Literacy Survey Results, 1992 .................................................14
Exhibit 6 Characteristics Overrepresented in (Lowest) Literacy Level 1, NALS 1992 ..................................15
Exhibit 7 Proxy Literacy Estimates by County, 1990 .................................................................................................17
Exhibit 8 Educational Attainment by County, 2000 ...................................................................................................18
Exhibit 9 Educational Attainment for Population 25 Years and Over, 2006 ...................................................19
Exhibit 10 Percentage of Population That Are English Language Learners, 2000 .........................................20
Exhibit 11 Percentage of Students Meeting WASL Standards, 2007 ..................................................................22
Exhibit 12 Students Age 18 and Older: Number of Students Passing WASL Standard, by Subgroup, 2007 ............................................................................................................................................................................................22
Exhibit 13 Students Age 18 and Older: Percentage of Students Passing WASL Standard, by Subgroup, 2007 ............................................................................................................................................................................................23
Exhibit 14 NAAL Average Scores by Age Obtained High School Diploma/GED, 2003 ...............................24
Exhibit 15 TANF Clients’ CASAS Assessment Scores, 2007 ...................................................................................26
Exhibit 16 TANF ELL Clients’ CASAS Reading and Listening Diagnostic Test Scores, 2007 .......................27
Exhibit 17 Percentage of NAAL Test Takers Receiving Public Assistance, by Literacy Level .......................27
Exhibit 18 Incarcerated Population in Adult Basic Skills Programs, 2007–2008 ...........................................28
Exhibit 19 Percentage of Foreign-Born Population by County, 2000 .................................................................30
Exhibit 20 Percentage of Foreign Born by Counties With Populations Greater Than 65,000, 2006 .....31
Exhibit 21 Comparison of Age in Washington and Foreign-Born Populations, 2006 ...................................32
Exhibit 22 Refugee Arrival Totals for Top U.S. Resettlement States, 1983–2007 .........................................32
Exhibit 23 Country of Origin for Refugee Arrivals in Washington, 2006–2007 ..............................................33
Exhibit 24 Percentage of Foreign-Born High School Graduates by County, 2006 ........................................34
Exhibit 25 Distribution of Adult Basic Skills Programs in Washington State, 2008 ........................................39
Exhibit 26 CASAS Assessment Entry Levels for Basic Skills Students, 2007–2008 ......................................41
Exhibit 27 Basic Skills Program Level by Age, 2007–2008 ...................................................................................41
Exhibit 28 Basic Skills Program Students by Level and Ethnicity, 2007–2008 ...............................................42
Exhibit 29 Demographic Statistics for Selected States ..............................................................................................48
Exhibit 30 Program Features of States ............................................................................................................................51

Exhibit 34 Estimates of Gap by Low Level Literacy Measure .................................................................................52
Exhibit 31 Distribution of Adult Basic Skills Programs in Washington State, 2008 ........................................53
Exhibit 32 County Population High School Attainment, 2000 ..............................................................................54
Exhibit 33 Literacy Proxy Indicators: Summary Table ................................................................................................54

Adult Literacy Education in Washington State
November 14, 2008 (Revised December 2008) Page 1
1.0 INTRODUCTION
1.1 Purpose and Focus of This Study
The Washington State Institute for Public Policy contracted with Berk & Associates to conduct a study of adult literacy rates and programs in Washington State, in response to a 2008 legislative directive “to study the status of adult literacy education in Washington.” The study includes “an analysis of literacy rates by county; a review of the research literature; a description of literacy-related services provided by state agencies and community-based organizations; and an analysis of characteristics of persons receiving those services” (ESHB 2687, 2008).
Purpose. Literacy encompasses a broad range of skill sets adults need to function effectively in the work, civic, and social spheres of society. Measuring literacy is complex and subject to significant data limitations. The purpose of this study is to provide an overview and current status assessment of adult literacy education in Washington to the state legislature.
1.2 Study Methodology
This description of adult literacy education in Washington was informed by the following data sources:
• Literature review. To gain a comprehensive understanding of the definition and measurement of literacy and the provision of adult literacy education programs, a thorough review of the policy and academic literature was conducted, including: policy reports, academic research, assessment surveys and studies, strategic plans, annual reports, and internal documents from government agencies at the state and national level, research institutes and think tanks, and nonprofit organizations.
• Interviews. Working closely and collaboratively with the State Board of Community and Technical Colleges (SBCTC) Office of Adult Basic Education, a list of stakeholders and experts was identified for interviews regarding literacy measurement and service provision. Interviews were conducted with 25 experts and stakeholders from around the state and country. For a list of stakeholders and experts interviewed, see Attachment A. For a list of interview protocols, see Attachment B.
• Data collection and analysis. Demographic and literacy data were collected from the following sources: U.S. Census, American Community Survey, U.S. Department of Health and Human Services Office of Refugee Resettlement, Portland State University, and five Washington State agencies (SBCTC, the Department of Social and Health Services (DSHS), the Office of Financial Management (OFM), the Office of the Superintendent of Public Instruction (OSPI), and the Department of Corrections (DOC)).
• Comparative state survey. Adult literacy and basic education systems were examined in four states (Massachusetts, Oregon, North Carolina, and Illinois) via telephone interviews with state directors and internet research to identify current practices, service delivery models, and innovative programs in use across the country. State directors were given the opportunity to review their state section to ensure accuracy.
• Program gap analysis. Potential gaps in adult literacy education were identified through a comparison of estimated demand, based on the description of adult literacy rates in Washington in section 3.0, and estimated supply, based on the program inventory and description in section 4.0. In addition, interviews with Washington State adult literacy providers informed the identification of particular gaps in service.

Adult Literacy Education in Washington State
November 14, 2008 (Revised December 2008) Page 2
1.3 Study Components
This study reviews adult literacy rates and adult literacy education in Washington State. It includes the following sections:
• Section 2.0 defines what literacy is and identifies levels of literacy, as measured by specific assessment tools.
• Section 3.0 describes literacy rates in Washington by county and four populations of interest: students age 18 and older enrolled in the K–12 system; clients of the Temporary Assistance for Needy Families (TANF) Program; incarcerated individuals under the supervision of the Department of Corrections; and immigrants and refugees.
• Section 4.0 presents a comprehensive inventory of adult literacy programs in Washington to identify providers, services offered, and describe the students served.
• Section 5.0 reviews adult basic education programs in four other states to identify innovative programs and to compare them with Washington’s system.
• Section 6.0 analyzes the current system of adult literacy education in Washington and identifies potential geographic and programmatic gaps in services.
• Section 7.0 summarizes the key trends and policy implications with regard to adult literacy rates and programs in Washington State and identifies areas for further research.

Adult Literacy Education in Washington State
November 14, 2008 (Revised December 2008) Page 3
2.0 DEFINITION OF LITERACY In order to identify populations in Washington struggling with literacy, this section first defines “literacy.” While there is still no single, agreed-upon definition of literacy in the literature, there is consensus that literacy encompasses a broad spectrum of skills needed to function in today’s society.
2.1 Literature Review: The Evolving Definition of Literacy
The definition of literacy has evolved from an absolute, static definition of literacy to a context-specific, multi-dimensional definition. In its most simplistic and original form, literacy means the ability to read and write. However, as literacy has become more context specific, the ability to read and write has taken on more functional qualifiers, such as reading “with meaning” and writing “for purpose.”
Two Definitions of Literacy: Absolute and Relative
In the 20th century, two definitions of literacy were prevalent in the literature: the absolute and the relative.
Absolute definition and measurement. The absolute definition of literacy determines an individual’s literacy status by grade level. This definition lends itself neatly to assessment and policy, with its clear-cut “literate” or “not literate” classifications (Quigley, 1997). “For several decades literacy had been defined as a spectrum number of grade levels achieved in formal schooling, varying from 4th to 8th grade” (Cook, 1978 as quoted in Cervero, 1985).
From 1930 to 1970, the U.S. Census used grade level completion as the sole measure of literacy or “functional illiteracy” (Sticht, NCSALL, 2002). There were no other national-level assessments of literacy rates in the adult population, making the U.S. Census the only available data from which to formulate policy.
Relativist definition and measurement. The relativist definition uses an individual’s ability to complete reading and writing tasks in a specific cultural or social context as indication of literacy. This definition provides for a fluid range of literacy classifications and emphasizes the importance of the relevancy of an individual’s skills and education to the needs of everyday life. An individual is deemed literate “when he has acquired the knowledge and skills in reading and writing which enable him to engage effectively in all those activities in which literacy is normally assumed in his culture or group.” (Gray, UNESCO 1956 as quoted in Cervero 1985). This broader concept of literacy became the basis for the definition of literacy in the latter half of the 20th century.
National Legislation and the Evolving Definition of Literacy
Defining literacy in the context of economic and societal participation. Earlier, “absolute” notions of literacy defined it as an individual problem, with little bearing on the nation or economy as a whole. During the 20th century, literacy came to be seen as a national concern that affected the productivity and competitiveness of the American workforce (NCES, 2001). The growing link between literacy and economic and societal participation is apparent in the evolution of federal legislation regarding literacy over a 40-year period from 1964 to 2003, an overview of which is presented in Exhibit 1.
Exhibit 1 Overview of Federal Literacy Legislation and Action
1964 Economic Opportunity Act Created an Adult Basic Education Program for

Adult Literacy Education in Washington State
November 14, 2008 (Revised December 2008) Page 4
workforce participation
1978 Amendment to Adult Education Act Allowed for use of competency-based instead of grade-level assessment
1991 Adult Literacy Act Defined literacy broadly to include participation in workforce, society, and as a means to achieve one’s goals
1993 National Adult Literacy Survey (NALS)
First national assessment of adult literacy, which defined and tested three types of literacy: prose, document, and quantitative
1998 Workforce Investment Act Most current legislation with literacy definition
2003 National Adult Assessment of Literacy (NAAL)
National survey that follows up on the adult literacy progress since the NALS
Source: Berk & Associates, 2008
The War on Poverty of the 1960s helped bring Adult Basic Education to the foreground of the national discussion (Sticht, NCSALL, 2002) by pointing to the relationship between literacy and an individual’s work capacity. The Economic Opportunity Act of 1964 included an Adult Basic Education Program meant to provide adults with the literacy skills necessary to participate in the workforce. The program was administered by the Office of Economic Opportunity.
In 1966, with the Economic Opportunity Act up for renewal, the Adult Basic Education Program was changed to the Adult Education Act, and its administration was placed under the auspices of the Office of Education rather than the Office of Economic Opportunity.
A 1978 amendment to the Adult Education Act allowed for a competency-based assessment of literacy to be used, rather than one based on grade-level, to accommodate adults who have completed high school but still function at too low a level to participate fully in society (Sticht, NCSALL, 2002).

Adult Literacy Education in Washington State
November 14, 2008 (Revised December 2008) Page 5
The National Literacy Act of 1991 was the culmination of policy activity in the late 1980s, and subsequent enrollment in adult basic skills education increased. The National Literacy Act defined literacy as:
An individual’s ability to read, write, speak in English, compute and solve problems at levels of proficiency necessary to function on the job, in the family of the individual and in society, to achieve one’s goals, and to develop one’s knowledge and potential (NCES, 2001).
In 1988, Congress tasked the Department of Education with conducting a survey of the literacy skills of American adults. The National Adult Literacy Survey (NALS), conducted in 1992, became the first assessment of the adult population as a whole (NCES, 2001). In 2003, the National Adult Assessment of Literacy (NAAL), a follow up to the NALS, was conducted. Together, these two nationwide surveys provide the most comprehensive and comparable data and indicators of adult literacy in the U.S. The assessment methodologies and results of both the NALS and the NAAL will be explored more in section 3.0.
The definition of literacy used as the basis for the 1992 NALS and 2003 NAAL reflects the language used in the National Literacy Act of 1991:
The ability to use printed and written information to function in society, to achieve one’s goals, and to develop one’s knowledge and potential.
The WorkForce Investment Act of 1998 included the Adult Education and Family Literacy Act. This act replaced the freestanding National Literacy Act of 1991 and is the most current national legislation. The definition of literacy given in the Adult Education and Family Literacy Act is provided below and will be used throughout this study.
2.2 Definition of Literacy for This Study
For the purposes of this study, literacy is defined by the current federal legislative definition and the closely related definition used by the Washington State Board of Community and Technical Colleges (SBCTC).
According to the Adult Literacy and Family Education Act (ALFEA), which is also referenced as Title II of the Workforce Investment Act of 1998, literacy is:
An individual's ability to read, write, speak in English, compute, and solve problems at levels of proficiency necessary to function on the job, in the family of the individual and in society.
The SBCTC defines literacy as:
The ability to speak, read, and write in the English language, compute, solve problems, and relate effectively with others in order to exercise the rights and responsibilities of a family member, worker, community member.
Both definitions link literacy to functionality in the workplace and the community with the training, such as adult basic skills education, needed for that functionality.
Adult Literacy Education in Washington State
November 14, 2008 (Revised December 2008) Page 6
2.3 Measuring Literacy: Identifying Literacy Types and Levels
Multiple Types of “Literacies”
The definitions of literacy from the NALS, NAAL, Workforce Investment Act, and the SBCTC all indicate that there are multiple “literacies” needed to function in society. While there is consensus that multiple “literacies” exist, there are several variations on the kinds of skills literacy encompasses.
Types of literacy identified by national assessments. A common scale of literacy in use today comes from the NALS and NAAL assessments:
• Prose literacy is the knowledge and skills needed to understand and use information from continuous texts, such as instructional materials, news stories, and editorials.
• Document literacy is the knowledge and skills to understand and use information from noncontinuous texts, such as job applications, maps, and drug and food labels.
• Quantitative literacy is the knowledge and skills required to perform computations using numbers embedded in printed materials, such as balancing a checkbook and determining a tip (NAAL, 2007 and CASAS). Depending on the measurement tool or source, this may also be known be known as “numeracy.” 1
Types of literacy identified by SBCTC. The SBCTC identifies four skill areas called Equipped for the Future (EFF) Standards for adult literacy and lifelong learning:
• Communication standards include the abilities to read with understanding, convey ideas in writing, speak so others can understand, listen actively, and observe critically.
• Lifelong Learning standards include the abilities to use information and communications technology, learn through research, reflect and evaluate, and take responsibility for learning.
• Decision-making standards include the abilities to use mathematics in problem-solving, solve problems and make decisions, and plan.
• Interpersonal standards include the abilities to guide others, resolve conflict and negotiate, advocate and influence, and cooperate with others.
These Washington State standards include the skills identified by the prose, document, and quantitative literacy skills outlined in the NALS and NAAL but go beyond and include a more expansive set of skills needed to function effectively in the workplace. Given the contextual definition of literacy in use today, there is not a clear distinction between literacy skills and more general adult basic skills.
Measuring Literacy: Proficiency Levels
Literacy is measured along a spectrum of proficiency levels. There are a variety of tools to measure and terms to describe these literacy levels. Exhibit 2 outlines the proficiency measures used to describe literacy in this study and demonstrates linkages between these different measurement scales. The text box below describes commonly used terms related to literacy that are not part of the current working definition.
1 Numeracy is another term associated with quantitative/mathematical skills needed to function in today’s society. Depending on the assessment tool or source, numeracy and quantitative literacy may be (1) synonymous, or (2) closely related but distinct terms. This distinction is beyond the scope of this study.

Adult Literacy Education in Washington State
November 14, 2008 (Revised December 2008) Page 7
“Illiterate,” “Nonliterate,” and “Preliterate.” The term “illiterate” is not used within any of the literacy scales identified or in the current literature. Illiterate is considered a misleading, and some would say pejorative, term that does not clearly disgintuish between different levels of literacy. The terms “nonliterate” and “preliterate,” on the other hand, are used generally to describe societies and individuals within those societies without a written language. “Nonliterate” is also used to describe individuals with low levels of English as a second language proficiency.

Adult Literacy Education in Washington State
November 14, 2008 (Revised December 2008) Page 8
Exhibit 2 Literacy Levels: Measurements, Descriptions, and Linkages
Source: SBCTC, NALS, NAAL, Berk & Associates, 2008
Adult Literacy Education in Washington State
November 14, 2008 (Revised December 2008) Page 9
Each measurement scale presented in Exhibit 2 is described in greater detail below.
• Years of schooling. The measure of years of schooling is a familiar, albeit imperfect, frame of reference that roughly approximates the kind of skills associated with literacy levels. Having less than a high school degree is a rough indicator that a person may not have a skill set that allows him/her to fully function in society. However, having completed high school or General Education Development Certificate (GED) does not necessarily indicate higher levels of literacy. This proxy indicator is only used when other, more accurate data, are not available.
• Adult Basic Education (ABE) level and English as a Second Language (ESL) level. The U.S. Department of Education (DOE) divides the adult literacy skills of reading, writing, and math into six levels of adult basic education (ABE) and English as a second language (ESL) education, as a part of the National Reporting System (NRS). The NRS was authorized through the Workforce Investment Act and was created to enhance accountability for all federally funded adult education programs. Exhibit 2 lists the NRS and Washington State level designations. Placement in a level is determined by the test scores from one of the following DOE-approved assessment tools: Comprehensive Adult Student Assessment Systems (CASAS) and Test for Adult Basic Education (TABE).
Washington State agencies use the CASAS testing tool to assess literacy, in part because it is approved by the DOE for assessment of both native and non-native English speakers. CASAS identifies five levels of adult basic skills (A through E). The normal range for these federally approved tests is 153-256. Both CASAS levels and scaled score correspond directly to the ABE and ESL levels, which can be seen in Attachment C.
• Description of skills. These descriptions are based on the federal definitions of basic skills and were developed by members from the SBCTC Office of Adult Basic Education and professional adult educators throughout Washington in September 2008 to explain the kinds of skills associated with ABE and ESL levels to the state legislature.
• National Adult Literacy Survey (NALS). The NALS was a one-time national and state survey conducted in 1992. The NALS measured document, prose, and quantitative literacy on a point scale of 1–500. From that point scale, five levels of literacy are identified (1 through 5). Levels 1 and 2 are often reported together, and are considered “low levels” of literacy.
• National Adult Assessment of Literacy (NAAL). The NAAL survey is the 2003 follow up to the NALS. The NAAL likewise measured document, prose, and quantitative literacy, using a point scale of 1–500. The NAAL also identifies four descriptive levels of literacy (Below Basic through Proficient), and the point scores associated with these levels differ slightly by type of literacy, as indicated by overlapping levels in Exhibit 2. In addition, the NAAL introduced the term Nonliterate in English to describe the population scoring at the bottom 3% of Below Basic.

Adult Literacy Education in Washington State
November 14, 2008 (Revised December 2008) Page 10
Exhibit 2 demonstrates two key points:
• Levels of literacy are not consistent across measurement tools. Among the tools, level dividing points, descriptive terms, and scales differ. For example, the “low level” of literacy for the NALS scale includes Levels 1 and 2 which extend into ABE levels characterized as a “middle level” of literacy. These dividing points are somewhat arbitrary and are rough approximations.
• The NALS and NAAL scales encompass the entire spectrum of literacy. These measurement tools were designed to measure the literacy rates of a representative sample of all adults in the U.S., whereas ABE and ESL levels only describe literacy in so far as they pertain to educational curriculum associated with adult basic skills education.
Literacy is a nuanced and complex construct that lacks both a standard of measurement and a common vocabulary to describe proficiency levels. Given this complexity, this study will use precise language that corresponds to a particular assessment tool to describe the literacy levels in Washington State.

Adult Literacy Education in Washington State
November 14, 2008 (Revised December 2008) Page 11
3.0 DESCRIPTION OF LITERACY IN WASHINGTON STATE This section estimates adult literacy rates for the United States, Washington State, and Washington counties in order to assess current need and demand for adult literacy and basic education services. The section is organized as follows:
• An overview of literacy nationally. The 2003 NAAL provides the most recent national measurement of literacy for U.S. adults.
• Estimates of literacy in Washington State. A 1992 statewide survey and three proxy indicators based on U.S. Census data are used to estimate literacy rates at the state and county level. Demographic attributes of people with low levels of literacy are also described.
• Descriptions of populations of interest. Four populations with lower–than-average literacy levels were examined to estimate the size of the population in Washington, identify basic demographic characteristics, and approximate literacy rates. In addition, key findings from national studies and assessments are included to provide comparisons between the national and state-specific population. Populations studied are:
o Students age 18 and over enrolled in K–12 schools; o Clients served by the Department of Social and Health Services (DSHS) through the
Temporary Assistance for Needy Families (TANF) Program; o Incarcerated individuals under the supervision of the Department of Corrections (DOC); o Immigrants and refugees.
For an explanation of the data sources and methodology used in measuring literacy, see Attachment D.

Adult Literacy Education in Washington State
November 14, 2008 (Revised December 2008) Page 12
3.1 National Overview: Literacy in the U.S.
The 2003 NAAL provides a snapshot of literacy rates in the U.S. in 2003 and is a useful benchmark from which to base analysis of Washington State’s adult literacy.
Exhibit 3 presents the percentage of adult Americans that fall into each of four NAAL literacy proficiency levels, categorized by prose, document, and quantitative literacy. Prose literacy measures the ability to read continuous text, while document literacy measures the skills to read documents, such as schedules, forms, and labels. Quantitative literacy measures basic skills to use and compute numbers embedded in text, such as balancing a checkbook.
Exhibit 3 shows that between 14% and 22% of U.S. adults scored in the Below Basic Level of literacy. This means, for example, 14% of Americans might be able to locate information in common, prose text, but cannot fully read and understand that text. Combining the Below Basic and Basic Levels, these NAAL results demonstrate that 55% of adults surveyed could at most perform simple everyday quantitative literacy activities (one-step math problems), 43% of adults could perform at most simple prose literacy activities (read and understand a short text), and 34% of adults could perform at most simple document literacy activities (read and understand a simple document or form).
Exhibit 3 National Assessment of Adult Literacy (NAAL) Results, 2003
Source: NAAL, 2003 and Berk & Associates, 2008
Key Characteristics of the Population with Low Literacy Skills
Exhibit 4 highlights characteristics that are overrepresented in the Below Basic level compared with the NAAL survey sample as whole. As reflected in the Exhibit, 55% of the population at the Below Basic level did not graduate from high school, compared with just 15% of the all adults surveyed. Also overrepresented in the Below Basic Level were non-English speakers prior to school, people with multiple disabilities, people of color, and adults over the age of 65 years. The NAAL survey also found
14%
29%
44%
12%
22%
53%
13%
22%
33% 33%
13% 13%
0%
10%
20%
30%
40%
50%
60%
Below Basic Basic Intermediate Proficient
Prose
Document
Quantitative

Adult Literacy Education in Washington State
November 14, 2008 (Revised December 2008) Page 13
that educational attainment, earnings, and percentage of people with employed full-time increased with each level of literacy.
Exhibit 4 Characteristics Overrepresented in the Below Basic Literacy Level, 2003 NAAL
Source: NAAL, 2003 and Berk & Associates, 2008
Learning Disabilities and Literacy. A positive correlation between learning disabilities and lower levels of literacy is suggested in much of the literature and literacy assessments. However, a lack of data, especially given the incidence of undiagnosed disabilities, makes such claims difficult to prove. According to the 2003 NAAL, 6% of adults surveyed reported a learning disability, and these adults had, on average, lower prose, document, and quantitative literacy scores. More than half of adults identified with a learning disability were in the Below Basic and Basic levels in prose (58%), document (52%), and quantitative (70%) literacy. No Washington-specific data are available on this topic.
55%
44%
20%
26%
21%
39%
15%13% 12%
15%
9%12%
0%
10%
20%
30%
40%
50%
60%
No HS Graduation No English Priorto School
MultipleDisabilities
Over 65 Years Black Hispanic
Below Basic
NAAL Sample

Adult Literacy Education in Washington State
November 14, 2008 (Revised December 2008) Page 14
Literacy in Washington
1992 State Adult Literacy Survey (SALS)
The 1992 SALS is the only statewide survey of literacy rates conducted in Washington State. In the survey more than 1,200 adults (age 16 and older) were randomly selected to represent the adult population of the state as a whole (approximately 3.7 million). Exhibit 5 presents a comparison of statewide and national averages of proficiency across the prose, document, and quantitative categories of the NALS, as a percentage of the population. In Washington, the average prose, document and quantitative proficiencies of adults are higher than the nationwide averages. In particular, the percentage of Washington adults scoring in Level 1 is around 10% less than the national average. Approximately 10% to 11%2 of adults (370,000–407,000) in Washington scored at the lowest level (Level 1) of prose, document, and quantitative literacy. An additional 21% to 25% performed at the second lowest level of proficiency (Level 2). Added together, the SALS estimates that between 31% and 36% of adults (or approximately 1.1 to 1.3 million) in Washington performed at the lowest levels of literacy (Levels 1 and 2).
Exhibit 5 Washington and U.S. National Adult Literacy Survey Results, 1992
Source: Jenkins and Kirsch, Adult Literacy in Washington: Results of the National Adult Literacy Survey, 1994, National
Institute for Literacy, The State of Literacy In America: Estimates at the Local, State, and National Levels, 1998, and Berk &
Associates, 2008
Characteristics of Washington’s Level 1 literacy population. Exhibit 6 highlights demographic characteristics that are overrepresented in the Level 1 category and summarizes the performance of particular demographic groups. Characteristics overrepresented among the surveyed adults at Level 1 literacy in Washington include being born outside the U.S. (51%), not graduating from high school (49%), and having multiple disabilities (29–31%).
2 These ranges indicate differences between document, prose, and quantitative literacy scores.
11%
40%
23%
5%
22%25%
4%
16%
32%
27%
0%
5%
10%
15%
20%
25%
30%
35%
40%
45%
Level 1 Level 2 Level 3 Level 4 Level 5
Washington
Nationwide

Adult Literacy Education in Washington State
November 14, 2008 (Revised December 2008) Page 15
Exhibit 6 Characteristics Overrepresented in (Lowest) Literacy Level 1, NALS 1992
Source: Jenkins and Kirsch, Adult Literacy in Washington: Results of the National Adult Literacy Survey, 1994
Washington’s literacy rates by demographic characteristics. Other key trends identified from the SALS include the following.
• In Washington State there is no difference between genders, but age is a factor. The performance results for men and women in Washington did not differ on any of the literacy scales. Adults in the oldest age cohort had lower average scores in the document, prose, and quantitative literacy categories than younger adults.
• Earnings are correlated with literacy. Across the document, prose, and quantitative literacy categories, Washington adults with proficiencies in Level 1 reported median weekly earnings of $220 to $262. In contrast, respondents in Level 3 earned $373 to $388, while those in Level 5 earned between $580 and $657 per week.
• Literacy is also related to employment and poverty. Among unemployed adults, 43% to 59% performed in Level 1 and 2, in contrast to 22% to 30% of employed adults. Between 18% and 21% of Washington residents designated as either poor or near poor demonstrated skills in Level 1 on each literacy scale. In contrast, only 6% to 8% of those designated not poor performed in this level.
Differences between Washington and national results. Most of the key characteristics of those performing in the lowest literacy levels in Washington are similar to those of the nation (in 1992). A few areas of difference include the rate of high school completion and gender differences. Nationwide, 38% of those who scored in the Prose Level 1 category completed high school compared with 51% in Washington. Adults in the general population of Washington had completed more years of schooling, on average, than adults in the nation (National Adult Literacy Survey, Adult Literacy in Washington, 1994). Nationwide, men scored higher than women in both the quantitative and document categories. In Washington, men and women showed no significant difference.
51%49%
11%
16%
9%
29-31%
0%
10%
20%
30%
40%
50%
60%
Born Outside U.S. No HS Graduation Multiple Disabilities
Level 1
WA population

Adult Literacy Education in Washington State
November 14, 2008 (Revised December 2008) Page 16
Proxy Indicators for Literacy
In addition to a literacy assessment, demographic characteristics, which are more readily available, are used below as proxy measure for literacy levels. Demographic information is not an exact indicator of literacy, but it is useful in identifying potential areas and populations prone to low levels of literacy.
Proxy Estimates
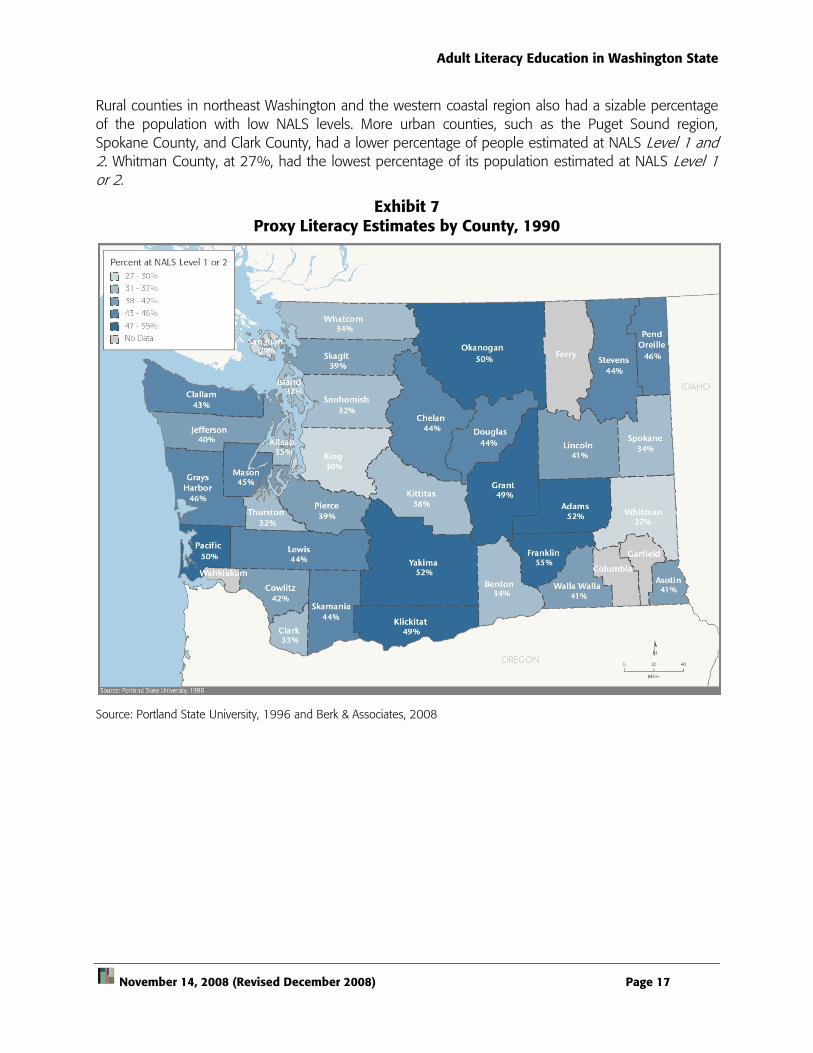
The Portland State University (PSU) estimates of literacy presented below are derived from 1990 U.S. Census demographic data; those data are used to approximate the NALS five-level literacy scale. In Washington, 15% of the adult population was estimated at Level 1 literacy, and a total of 35% of the adult population was estimated at Levels 1 or 2. Exhibit 7 displays the percentage of the county population with a low proficiency level, those at Levels 1 or 2. People at the lower range of Level 1 or 2 can perform simple tasks using uncomplicated documents, and those at the higher range can integrate pieces of information in text together. Using this measure, rural counties in central Washington had a higher percentage of people at NALS Level 1 or 2. Franklin County had the highest percentage of its population estimated at NALS Level 1 or 2 at 55%.
Adult Literacy Education in Washington State
November 14, 2008 (Revised December 2008) Page 17
Rural counties in northeast Washington and the western coastal region also had a sizable percentage of the population with low NALS levels. More urban counties, such as the Puget Sound region, Spokane County, and Clark County, had a lower percentage of people estimated at NALS Level 1 and 2. Whitman County, at 27%, had the lowest percentage of its population estimated at NALS Level 1 or 2.
Exhibit 7 Proxy Literacy Estimates by County, 1990
Source: Portland State University, 1996 and Berk & Associates, 2008

Adult Literacy Education in Washington State
November 14, 2008 (Revised December 2008) Page 18
Educational Attainment
A high school diploma or equivalent was used as one proxy measure of adult literacy. In Washington State, 87% of the population had a high school diploma or equivalent in 2000. Exhibit 8 depicts the percentage of the population 25 years and over with a high school diploma or equivalent and shows that there is substantial variation across the state. The pattern in educational attainment is similar to that of the PSU proxy estimates, partly because the proxy estimates included 1990 educational attainment from the U.S. Census. Counties with the lowest percentage of high school graduates include Adams (63%), Franklin (64%), and Yakima (69%). Counties with a higher than average percentage of high school graduates include Whitman (93%), Jefferson (92%), Kitsap (91%), King (90%), and Thurston (90%).
Exhibit 8 Educational Attainment by County, 2000
Source: U.S. Census, 2000 and Berk & Associates, 2008

Adult Literacy Education in Washington State
November 14, 2008 (Revised December 2008) Page 19
Exhibit 9 lists high school attainment for counties available in the 2006 American Community Survey (ACS). Compared with the 2000 Census figures, the 2006 figures are similar.
Exhibit 9 Educational Attainment for Population 25 Years and Over, 2006
Source: U.S. Census American Community Survey, 2006, and Berk & Associates, 2008
County Total 25 Years
and Over 25 Years and Over
High School Graduates Percent 25 Years and Over
High School Graduates
Washington 4,253,582 3,785,982 89.0%Benton 102,360 88,380 86.3%Chelan 45,916 38,775 84.4%Clallam 51,489 46,997 91.3%Clark 268,750 238,419 88.7%Cowlitz 66,051 56,907 86.2%Franklin 37,286 25,903 69.5%Grant 48,801 35,535 72.8%Grays Harbor 48,716 40,918 84.0%Island 55,098 51,739 93.9%King 1,273,966 1,170,367 91.9%Kitsap 160,371 148,755 92.8%Lewis 49,250 41,944 85.2%Pierce 500,164 446,558 89.3%Skagit 76,697 64,805 84.5%Snohomish 441,732 397,690 90.0%Spokane 292,391 266,437 91.1%Thurston 157,183 145,543 92.6%Whatcom 118,073 104,600 88.6%Yakima 138,916 96,844 69.7%

Adult Literacy Education in Washington State
November 14, 2008 (Revised December 2008) Page 20
English Proficiency
In 2006, roughly 8% of the statewide population had limited English proficiency according to the American Community Survey, up from 5% in 2000. This population is referred to as English language learners (ELL). Because 2006 ACS data for the ELL population is only available for four counties in Washington, 2000 Census data are used to illustrate the concentration of ELL adults by county.
Exhibit 10 displays the percentage of Washington’s ELL population, which is reported for ages 5 and up. The counties with sizable ELL populations include Franklin (25%), Adams (23%), Yakima (16%), and Grant (16%). The ACS also reports that out of Washington’s 2,471,912 households, approximately 17% (424,755 households) speak a language other than English at home. In addition, 4% (or 104,121) of Washington’s households are considered “linguistically isolated,” meaning that all household members 14 years and older have at least some difficulty with English.
Exhibit 10 Percentage of Population That Are English Language Learners, 2000
Source: U.S. Census, 2000 and Berk & Associates, 2008
Adult Literacy Education in Washington State
November 14, 2008 (Revised December 2008) Page 21
3.2 Populations of Interest
This section summarizes data that describe subpopulations of adults with lower than average literacy levels, including the following:
• Students age 18 and over enrolled in K–12
• TANF/Workfirst clients
• Incarcerated adults
• Immigrants and refugees
Students Age 18 and Over Enrolled in K–12
Demographics
Population size. The population of students age 18 and older enrolled in K–12 schools is very small: just 1,568 students in the 2006–07 school year, according to OSPI data. This group of students makes up 0.16% of all 1,003,559 students enrolled in grades K–12 and 0.48% of the 328,979 students enrolled in grades 9–12.
Geographic location. Of the 295 school districts in Washington, 190 reported the enrollment of students age 18 and older in 2007; 152 of those school districts reported 10 or fewer students age 18 and older. Seattle Public School District has the greatest number of students age 18 and older enrolled in K–12, equaling 151 students or 0.33% of its total student enrollment. Bridgeport School District had the largest percentage of students age 18 and older at 1.5% of its total enrollment of 733 students. For a complete list by district, see Attachment E.
Literacy Rate Estimates
Washington Assessment of Student Learning. 2007 WASL results were analyzed to approximate literacy rates for students 18 and over enrolled in K–12, as seen in Exhibit 11. In comparison to all 10th graders taking the WASL, a considerably lower percentage of students age 18 and older met WASL standards in all three test categories. The difference was largest in math, with a 37% difference between students age 18 and older and 10th graders.

Adult Literacy Education in Washington State
November 14, 2008 (Revised December 2008) Page 22
Exhibit 11 Percentage of Students Meeting WASL Standards, 2007
Source: OSPI and WSIPP, 2008 and Berk & Associates, 2008
Note: These percentages are based on available test data as reported by OSPI. For students age 18 and older, 1,001 reading test scores, 1,030 writing scores, and 1,316 math scores were available for the analysis.
Exhibit 12 and Exhibit 13 examine WASL scores for subgroups within the population of students 18 and older. A smaller percentage of special education, bilingual, and migrant students age 18 and over met WASL requirements for reading, writing, and math than students age 18 and over as a whole. Bilingual students make up between 36% and 46% of all students age 18 and over that took the WASL. In contrast, special education students made up only between 11% to 12%, and migrant students made up between 9% and 10% of students age 18 and older. A greater percentage of female students passed the reading (45%) and writing (49%) WASL tests, while a greater percentage of male students (16%) met the standards for the math test. Of students age 18 and older that took the WASL tests, approximately 40–43% were female and 57–60% were male.
Exhibit 12 Students Age 18 and Older: Number of Students Passing WASL Standard,
by Subgroup, 2007
Source: OSPI, WSIPP, 2008 and Berk & Associates, 2008
Note: The categories of gender, special education, bilingual, and migrant overlap; the sum of the subgroups is greater than the total number of students age 18 and older who took the WASL.
80.8%83.9%
50.4%44.7% 46.3%
13.1%
0.0%
10.0%
20.0%
30.0%
40.0%
50.0%
60.0%
70.0%
80.0%
90.0%
Reading Writing Math
10th graders
18 and Older K-12 Students
Tested Met Standard Tested Met Standard Tested Met Standard18 and Older Students Tested 1,001 447 1,030 477 1,316 173
Female Students 419 189 414 201 566 56 Male Students 582 258 616 276 750 117 Special Education Students 121 43 114 46 152 8 Bilingual Students 458 140 466 111 476 52 Migrant Students 101 30 104 26 113 8
Reading Writing Math

Adult Literacy Education in Washington State
November 14, 2008 (Revised December 2008) Page 23
Exhibit 13 Students Age 18 and Older: Percentage of Students Passing WASL Standard,
by Subgroup, 2007
Source: WSIPP, OSPI, and Berk & Associates, 2008
45.1%48.6%
9.9%
44.3% 44.8%
15.6%
35.5%
40.4%
5.3%
30.6%
23.8%
10.9%
29.7%
25.0%
7.1%
44.7% 46.3%
13.1%
0.0%
10.0%
20.0%
30.0%
40.0%
50.0%
60.0%
Reading Writing Math
Female Students Male StudentsSpecial Education StudentsBilingual StudentsMigrant Students18 and Older K-12 Students

Adult Literacy Education in Washington State
November 14, 2008 (Revised December 2008) Page 24
National Assessment for Adult Literacy. According to 2003 NAAL test results, adults who obtained a high school diploma or GED at an age older than 19 years, on average, had lower levels of prose, document, and quantitative literacy, as seen in Exhibit 14. Adults who obtained a high school diploma or GED by the age of 19 are considered to have started school at a “traditional” age (between 4 and 6 years) and have completed their schooling uninterrupted. This group, on average, tested at the Intermediate level for prose, document, and quantitative literacy. Adults who obtained a high school diploma or GED at the age of 20 years or older tested at the Basic level for prose and quantitative literacy. For document literacy, adults who obtained a high school diploma or GED between the ages 20 and 24 tested, on average, just above the Intermediate (250-334) level dividing point, while adults over 25 tested just below in the Basic level (226-275).
Exhibit 14 NAAL Average Scores by Age Obtained High School Diploma/GED, 2003
Source: NAAL, 2003 and Berk & Associates, 2008
290 283297
252 251 257256244
266
0
50
100
150
200
250
300
350
Prose Document Quantitative
19 or Younger 20-24 25 or Older

Adult Literacy Education in Washington State
November 14, 2008 (Revised December 2008) Page 25
TANF/Workfirst Clients
WorkFirst is Washington State’s welfare reform program designed to help adults in low income families go to work. The program is administered through partnerships among six state agencies: SBCTC, DSHS, the Department of Community, Trade, and Economic Development (CTED), the Employment Security Department (ESD), the Department for Early Learning, and OFM (which acts as an oversight agency).
Demographics
Population size. In Washington, 33,526 adults received a TANF grant in June 2007,3 according to DSHS. This group makes up 0.5% of Washington’s total population of 6,587,600 (OFM, 2008).
Geographic location. Of the 39 counties in Washington, Cowlitz and Yakima had the greatest percentage of TANF recipients, 1% and 1.2%, respectively, in June 2007. San Juan and Garfield counties had the lowest percentage of TANF recipients, with only 0.06% and 0.13% of their populations receiving TANF grants. King, Pierce, Spokane, and Yakima counties had the highest total number of clients. Attachment F lists TANF clients by county.
Gender. Statewide, substantially more women (83%) receive TANF than men (17%).
Race. Adams, Franklin, Yakima, and King are the only counties with more than 50% non-white TANF recipients. On average, 60% of TANF recipients statewide are white adults, 14% black adults, 12% Hispanic adults, 5% Native American adults, 4% Asian/Pacific Islander adults; 7% were unknown.
King and Pierce Counties had the highest concentration of black adults receiving aid in the state, with black adults making up 35% and 25% of their respective TANF recipients. Adams, Franklin, and Yakima counties had the highest concentration of Hispanic adults receiving aid with Hispanic adults making up 70%, 53%, and 41% of their respective TANF recipients.
Language. Of the 33,526 adults receiving a TANF grant, 2,419 (9.2%) speak a primary language other than English. Counties with a high percentage of TANF clients whose first language is not English include King (16%), Franklin (13.3%), and Adams (12.2%).
Literacy Rate Estimates
Educational attainment. Of TANF clients in Washington State in June 2007, 22,033, or 65.7%, are high school graduates. This rate is lower than the statewide high school completion rate of 89%. Counties with the lowest percentage of TANF clients with a high school degree include Franklin (45%), Adams (47%), and Yakima (50%). For a listing of all counties, see Attachment F. According to OFM data from May 2006 and June 2008, nearly one-fifth of TANF clients participated in some post-secondary education, and about 10% reported having a post-secondary degree or certificate.
CASAS test. In July 2006, WorkFirst implemented a new policy of providing each adult client with a comprehensive evaluation to assess job readiness and barriers to gainful employment and to determine an appropriate pathway through the program. Part of the assessment includes the CASAS reading and math skills test or, for English language learner (ELL) clients, the CASAS Reading and Listening Diagnostic Test. Of non-ELL clients, OFM reports that almost 50% did not complete the CASAS test; however, OFM found that the composition of clients along the dimensions of race,
3 Data is collected monthly for TANF populations.
Adult Literacy Education in Washington State
November 14, 2008 (Revised December 2008) Page 26
ethnicity, and educational attainment does not vary greatly between the test completers and non-completers.
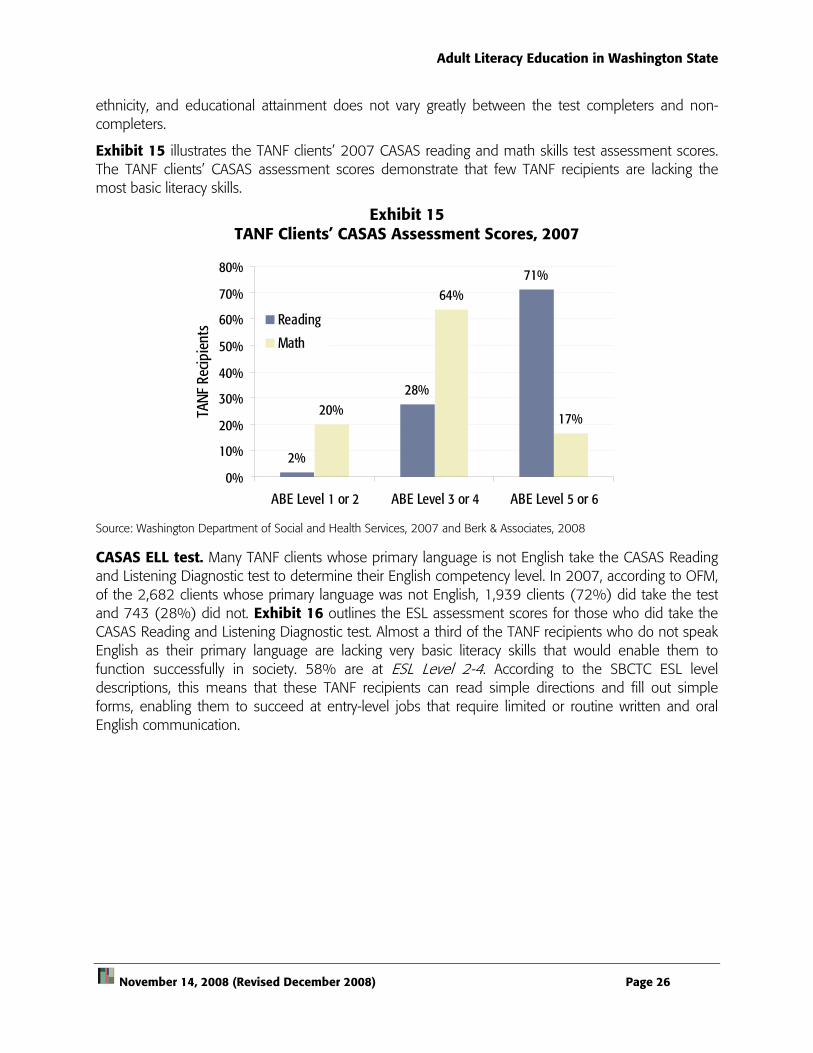
Exhibit 15 illustrates the TANF clients’ 2007 CASAS reading and math skills test assessment scores. The TANF clients’ CASAS assessment scores demonstrate that few TANF recipients are lacking the most basic literacy skills.
Exhibit 15 TANF Clients’ CASAS Assessment Scores, 2007
Source: Washington Department of Social and Health Services, 2007 and Berk & Associates, 2008
CASAS ELL test. Many TANF clients whose primary language is not English take the CASAS Reading and Listening Diagnostic test to determine their English competency level. In 2007, according to OFM, of the 2,682 clients whose primary language was not English, 1,939 clients (72%) did take the test and 743 (28%) did not. Exhibit 16 outlines the ESL assessment scores for those who did take the CASAS Reading and Listening Diagnostic test. Almost a third of the TANF recipients who do not speak English as their primary language are lacking very basic literacy skills that would enable them to function successfully in society. 58% are at ESL Level 2-4. According to the SBCTC ESL level descriptions, this means that these TANF recipients can read simple directions and fill out simple forms, enabling them to succeed at entry-level jobs that require limited or routine written and oral English communication.
2%
28%
71%
20%
64%
17%
0%
10%
20%
30%
40%
50%
60%
70%
80%
ABE Level 1 or 2 ABE Level 3 or 4 ABE Level 5 or 6
TANF
Rec
ipie
nts Reading
Math

Adult Literacy Education in Washington State
November 14, 2008 (Revised December 2008) Page 27
Exhibit 16 TANF ELL Clients’ CASAS Reading and Listening Diagnostic Test Scores, 2007
Source: Washington Department of Social and Health Services and Berk & Associates, 2008.
National Data
The NAAL tracks literacy assessment scores of those who are currently participating in public assistance, those who participated in public assistance in the past, and those who have never received public assistance. Exhibit 17 shows that higher literacy levels are associated with less frequent reliance on public assistance.
Exhibit 17 Percentage of NAAL Test Takers Receiving Public Assistance, by Literacy Level
Source: NAAL, 2003 Berk & Associates, 2008
30%
58%
12%
0%
10%
20%
30%
40%
50%
60%
70%
ESL Level 1 ESL Level 2-4 ESL Level 5-6
TANF
Rec
ipie
nts
Prose Doc. Quant. Prose Doc. Quant. Prose Doc. Quant. Prose Doc. Quant.Currently receiving public assistance 4% 4% 4% 3% 3% 2% 1% 2% 1% 0.5% 0.5% 0.5%
Have received public assistance 10% 11% 13% 11% 10% 10% 8% 8% 6% 3% 4% 2%
Never received public assistance 86% 86% 83% 86% 87% 89% 91% 91% 93% 97% 96% 98%
Below Basic Basic Intermediate Proficient

Adult Literacy Education in Washington State
November 14, 2008 (Revised December 2008) Page 28
Incarcerated Individuals
Literacy Rate Estimates
CASAS test. Every offender entering the correctional system is required to take a CASAS appraisal/locator test to determine his or her educational functioning level eligibility for basic skills educational services. The Department of Corrections contracts with the SBCTC to provide adult basic education services for the incarcerated population.
During the 2007–08 school year, 5,952 incarcerated offenders were enrolled in adult basic education programs. Exhibit 18 shows the number of offenders in ABE and ESL programs and at what level they entered. The vast majority of offenders in adult basic skills programs, 94%, were in an ABE program. Only 6% were in an ESL program. This is in contrast to adult basic skills students across the state where 61% are in ESL programs. The majority of incarcerated individuals in ABE programs entered at the middle levels, Levels 3 and 4, meaning they can handle the basic math, reading, and writing tasks useful in daily activities. Approximately 26% of incarcerated individuals started at the lowest ABE levels, Levels 1 and 2, compared with only 21% for ABE students in the community and technical college system as a whole.
Exhibit 18 Incarcerated Population in Adult Basic Skills Programs, 2007–2008
Source: SBCTC and Berk & Associates, 2008
Educational attainment. Using self-reported figures from February and March 2007, 4,784 offenders did not have a high school diploma or GED (30.8% of the incarcerated population).
National Assessment for Adult Literacy Prison Survey. The 2003 NAAL indicates that in comparison with the general household population, incarcerated individuals had, on average, lower prose, document, and quantitative literacy scores. Approximately half of incarcerated individuals were at the Below Basic and Basic literacy level for prose (56%) and document (50%) literacy. The majority (78%) were at Below Basic and Basic quantitative literacy levels. These literacy rates, however, are higher than rates reported from the 1992 NALS.
Program Level of Entry Total Percent of TotalABE Total 5,614 94.3%
ABE Level 1 or 2 1,459 26.0%ABE Level 3 or 4 2,996 53.4%ABE Level 5 or 6 1,159 20.6%
ESL Total 338 5.7%ESL Level 1 20 5.9%ESL Level 2-4 246 72.8%ESL Level 5 or 6 72 21.3%
Total 5,952 100.0%

Adult Literacy Education in Washington State
November 14, 2008 (Revised December 2008) Page 29
Based on self-reported data, 17% of the prison population has a learning disability. Comparatively, 6% of the household population nationwide has a learning disability. This higher incidence of learning disabilities among incarcerated individuals was also reported anecdotally in Washington State in an interview with the SBCTC Correctional Education Director, Kathy Goebel. She noted, however, that learning disabilities are not diagnosed as a part of Correctional Education programming.
Immigrants and Refugees
Demographics
Population size. Immigrants and refugees are the fastest growing segment of Washington State’s population. The U.S. Census uses the term “foreign born” to describe first generation immigrants and refugees. According to the 2000 U.S. Census, there were 614,457 foreign-born individuals in Washington, equaling 10% of the state’s population. In 2006, according to the American Community Survey, the number of foreign-born individuals increased to 793,789 people, or approximately 13% of the population.
Geographic location. Exhibit 19 shows the percentage of foreign-born individuals in 2000 for all Washington’s counties, while Exhibit 20 presents the 2006 ACS data for Washington counties with populations greater than 65,000. Franklin County has the highest percentage of foreign-born individuals at 27%, which is 14 percentage points greater than the state as a whole (13%). Franklin also had the largest ELL population in the state (25%). Foreign-born individuals make up a higher percentage of the population in King (20%), Grant (19%), Yakima (18%), and Snohomish (13%) counties than the state as a whole.

Adult Literacy Education in Washington State
November 14, 2008 (Revised December 2008) Page 30
Exhibit 19 Percentage of Foreign-Born Population by County, 2000
Source: U.S. Census, 2000 and Berk & Associates, 2008

Adult Literacy Education in Washington State
November 14, 2008 (Revised December 2008) Page 31
Exhibit 20 Percentage of Foreign Born by Counties With
Populations Greater Than 65,000, 2006
Source: American Community Survey, 2006 and Berk & Associates, 2008
County Total Population Foreign
Born Percent
Foreign Born Washington 6,261,127 793,789 12.7%Benton 157,777 17,432 11.0%Chelan 69,418 8,333 12.0%Clallam 69,210 2,871 4.1%Clark 408,874 41,730 10.2%Cowlitz 98,397 4,195 4.3%Franklin 65,206 17,443 26.8%Grant 81,326 15,463 19.0%Grays Harbor 68,954 4,461 6.5%Island 77,420 4,988 6.4%King 1,796,729 362,906 20.2%Kitsap 237,932 12,328 5.2%Lewis 71,860 2,722 3.8%Pierce 746,918 68,684 9.2%Skagit 114,167 11,741 10.3%Snohomish 662,285 85,351 12.9%Spokane 431,668 21,457 5.0%Thurston 230,231 14,777 6.4%Whatcom 179,860 21,654 12.0%Yakima 227,879 40,638 17.8%
Foreign Born Population

Adult Literacy Education in Washington State
November 14, 2008 (Revised December 2008) Page 32
Age. Exhibit 21 compares the distribution of age for the foreign-born population in Washington and the state’s entire population. The majority of foreign-born individuals (78%) in Washington State are of working age, between the ages of 18 and 64 years.
Exhibit 21 Comparison of Age in Washington and Foreign-Born Populations, 2006
Source: American Community Survey, 2006 and Berk & Associates, 2008
Refugee arrivals. Washington has consistently ranked among the top states in the U.S. for refugee resettlement. In 2007, Washington ranked sixth in the nation for the number of refugee arrivals, which equals approximately 4.6% of all U.S. refugee arrivals. Exhibit 22 identifies the number of refugee arrivals by top states of resettlement.
Exhibit 22 Refugee Arrival Totals for Top U.S. Resettlement States, 1983–2007
Source: U.S. Department of Health and Human Services, Administration for Children and Families, Office of Refugee Resettlement, 2007 and Berk & Associates, 2008
Since 2006, refugees from 30 countries have arrived in Washington. Exhibit 23 presents the total number of refugees by the top 14 countries of origin. Over half (54%) of refugee arrivals to
23.9%10.3%
64.6%
78.0%
11.5% 11.6%
0%
10%
20%
30%
40%
50%
60%
70%
80%
90%
100%
Washington Foreign Born
65 and Older
18-64
Under 18
2007 2006 1983-2005 1983-2007 California 6,706 5,163 434,348 446,217 Texas 4,401 2,764 103,199 110,364 Minnesota 3,198 4,578 59,878 67,654 New York 2,978 2,303 249,790 255,071 Florida 2,691 2,582 280,364 285,637 Washington 2,216 2,458 89,719 94,393 Total U.S. 48,281 41,053 2,053,984 2,143,318

Adult Literacy Education in Washington State
November 14, 2008 (Revised December 2008) Page 33
Washington came from the former Union of Soviet Socialist Republics (USSR). Refugees from Somalia were the second largest category, accounting for 18% of all refugee arrivals to Washington.
Exhibit 23 Country of Origin for Refugee Arrivals in Washington, 2006–2007
Source: U.S. Department of Health and Human Services, Administration for Children and Families, Office of Refugee Resettlement, 2007 and Berk & Associates, 2008
Note: The 16 countries not included in this exhibit had 16 or less refugees resettle in Washington. Nine of the countries not represented only had one refugee arrival in Washington.
Number of Refugees into Washington 2006-2007USSR 2544Somalia 849Iran 204Burma 194Vietnam 192Ethiopia 163Burundi 117Eritrea 78Sudan 78Thailand 74Cuba 39Iraq 29Afghanistan 25Liberia 23

Adult Literacy Education in Washington State
November 14, 2008 (Revised December 2008) Page 34
Literacy Rate Estimates
English language proficiency. According to ACS data as reported by the Migration Policy Institute, 384,463, or 48%, of the foreign-born population in Washington is considered English language learners. This percentage is up slightly from 45.5% of the foreign language population in 2000.
Educational attainment. The percentage of high school graduates is lower among the foreign-born population (72%) than the state’s population (89%) (Migration Policy Institute). Exhibit 24 presents available 2006 ACS data for Washington’s 19 counties with a population greater than 65,000. All 19 counties’ percentage of foreign-born high school graduates is less than the state’s percentage of high school graduates (89%). Counties with the highest percentage of foreign-born high school graduates include Clallam (87%), Island (84%), and Kitsap (84%). Grant (25%), Yakima (30%), and Franklin (35%) counties have the lowest percentage of foreign-born high school graduates. The counties with the largest percentage difference between their foreign-born and total population with high school degrees are Grant (47%), Chelan (42%), and Yakima (40%).
Exhibit 24 Percentage of Foreign-Born High School Graduates by County, 2006
Source: American Community Survey, 2006 and Berk & Associates, 2008
County
Total 25 Years and
Over
Percent Total High School Graduates
Foreign Born 25 Years and
Over
Percent Foreign Born High School
Graduates Washington 4,253,582 89.0% 634,284 71.8%Benton 102,360 86.3% 13,300 52.7%Chelan 45,916 84.4% 5,771 42.2%Clallam 51,489 91.3% 2,359 87.3%Clark 268,750 88.7% 32,557 71.5%Cowlitz 66,051 86.2% 3,320 60.1%Franklin 37,286 69.5% 12,345 35.3%Grant 48,801 72.8% 10,854 25.4%Grays Harbor 48,716 84.0% 3,167 61.3%Island 55,098 93.9% 4,217 83.8%King 1,273,966 91.9% 294,956 79.7%Kitsap 160,371 92.8% 11,122 83.4%Lewis 49,250 85.2% 2,193 51.3%Pierce 500,164 89.3% 57,184 72.9%Skagit 76,697 84.5% 8,820 52.3%Snohomish 441,732 90.0% 69,037 79.1%Spokane 292,391 91.1% 16,294 80.8%Thurston 157,183 92.6% 13,371 79.5%Whatcom 118,073 88.6% 17,367 78.0%Yakima 138,916 69.7% 30,967 30.2%

Adult Literacy Education in Washington State
November 14, 2008 (Revised December 2008) Page 35
3.3 Key Findings: Literacy in Washington State
Literacy rates for Washington were estimated for two time periods: 1992 and 2000–2006. In 1992, 10% to 11% (or 370,000 to 407,000) of Washingtonians were assessed at the lowest NALS literacy level (Levels 1). According to PSU proxy estimates, the percentage of adults with Level 1 literacy skills is slightly higher at 15%, or approximately 550,000 adults. Characteristics overrepresented in the population at Level 1 literacy in comparison with the state population in order of scale are foreign born (51%), a lack of high school completion (49%), and multiple disabilities (30%).
The 1992 state survey results identified a relationship between employment earnings and poverty. Washington adults with proficiencies in Level 1 reported lower median weekly earnings compared with adults who have higher literacy levels. Unemployed adults had lower literacy levels than employed adults, and individuals who live in poverty had lower literacy skills.
In 2006, 11% of Washington’s population (or approximately 467,600 people) lacked a high school degree. This proxy roughly estimates the number of people who may have lower literacy skills. Counties with the lowest levels of high school completion include Franklin, Adams, Yakima, and Grant. The 2003 NAAL results indicate a link between a high school degree and literacy; of the adults who scored in the Below Basic Level, over half (55%) did not graduate from high school.
The 2000 U.S. Census estimates that 5% of Washington’s population is identified as English language learners. Nearly half of new immigrant and refugees are identified as ELL.
Other findings from this section include the following:
• Older students (age 18 and over) in Washington’s K–12 school system have lower than average academic achievement than those who graduate earlier.
• TANF recipients have lower than average high school graduation rates, but the majority tested above the lowest two ABE levels of literacy.
• Washington’s incarcerated population has lower than average literacy rates.
• Approximately 13% of Washington’s population is made up of immigrants and refugees, nearly half of whom are English language learners.

Adult Literacy Education in Washington State
November 14, 2008 (Revised December 2008) Page 36
4.0 ADULT LITERACY AND BASIC EDUCATION PROGRAMS: INVENTORY AND DESCRIPTION
4.1 Overview of Programs, Providers, and Funding
Types of Instructional Services
Adult literacy education is generally provided as a component of adult basic skills (ABS) education. Adult basic skills education is typically organized into the following three types of instruction based on skill level or language background of learners.
Adult Basic Education (ABE) instruction is “designed for adults who lack competence in reading, writing, speaking, problem solving or computation at a level necessary to function in society, on a job or in the family” (National Reporting System for Adult Education, 2001). ABE learners participate in programs to acquire basic literacy and numeracy skills.
Adult Secondary Education (ASE) instruction is “designed to help adults who have some literacy skills and can function in everyday life, but are not proficient or do not have a certificate of graduation or its equivalent from a secondary school” (National Reporting System for Adult Education, 2001). Typically, these learners attend ASE classes to obtain a GED or adult high school credential.
English as a Second Language (ESL) instruction is “designed to help adults who are limited English proficient achieve competence in the English language” (National Reporting System for Adult Education, 2001).
According to a 2007 national survey conducted by the Educational Testing Service (ETS), 43% of ABS learners participate in ESL, 39% received ABE instruction, and 18% received ASE nationally. In Washington State, 39% receive ABE instruction and 61% receive ESL instruction (according to SBCTC data). ASE students are included in ABE reporting in Washington State.
Types of Providers
Actual adult basic skills instruction is provided by a variety of different entities across the U.S. Most programs fall into one of the following five categories:
• Local Education Agencies (LEA) are typically public schools or school districts. In addition to K–12 education, LEAs provide adult education classes open to all members of the community.
• Community-Based Organizations (CBO) encompass religious and social service groups, libraries, volunteer literacy organizations, literacy coalitions, community action groups, and other kinds of public or private nonprofit groups that provide adult education open to all members of the community.
• Community and Technical Colleges (CTC) are institutions of higher education that offer associates and technical degrees or certificates, such as in mechanical or industrial arts, and applied sciences. These programs are open to all members of the community
• Correctional Institutions include both prisons and jails funded by the state to provide adult basic education services to incarcerated adults.
• Other. Some examples in this category include public or private colleges which are not community colleges, departments of human services, departments of labor, institutions for

Adult Literacy Education in Washington State
November 14, 2008 (Revised December 2008) Page 37
disabled individuals, and other coalitions of providers, which may include more than one of the provider types listed above.
Mix of Providers
National trends. The ETS 2007 national survey revealed that the three largest providers of adult education programs in the United States are LEAs (54%), CBOs (24%), and CTCs (17%). Correctional institutions and “other” providers only offer 2% and 3% of programs, respectively. In terms of adult learners served, LEAs serve 60% of all adult learners, CTCs 27%, and CBOs 8%.
The national survey found no relationship between the type of provider and type of instruction, as providers tend to offer several instructional types. The one exception is correctional facilities, which offered significantly more ABE instruction than ESL or ASE.
Washington State. In Washington State, CTCs provide 38% of programs but serve 85.7% of the population, while CBOs provide 62% of programs and serve only 3.9% of the population. The remaining 10.4% of the population is served by the Department of Corrections, which contracts with the SBCTC to provide services. In contrast to national trends, LEAs play a limited role in adult basic skills education in Washington.
Funding
Federal Funding
All federal funding ($9.1 million in 2008) provided to Washington State for adult basic skills education is distributed by the SBCTC. Title II of the Workforce Investment Act directs how federal dollars are distributed and defines the general goals of adult education programs as:
• Assisting adults to become literate and obtain the knowledge and skills necessary for employment and self-sufficiency;
• Assisting adults who are parents to obtain the educational skills necessary to become full partners in the educational development of their children; and
• Assisting adults in the completion of a secondary school education.
Federal money must be open not only to the CTCs, but also to the CBOs that meet these qualifications throughout the state. Dollar amounts are awarded by the SBCTC in a competitive process.

Adult Literacy Education in Washington State
November 14, 2008 (Revised December 2008) Page 38
Performance accountability. In addition, the federal legislation establishes performance accountability standards organized around “core indicators,” such as improvement in skill levels, postsecondary education enrollment or completion, or a high school diploma or GED. In order to measure and study progress, organizations that receive federal money must assess each student enrolled in a program using a federally approved assessment tool; Washington State uses the CASAS assessment.
State Funding
The SBCTC is also responsible for allocating the state money provided for adult basic skills education. The state legislature provides funds for adult basic skills education, which, like the federal funds, is available to CTCs and CBOs alike. The CBOs that qualify for federal funding and CTCs receive state funds based on their share of clients served. This funding is in addition to the general funding (e.g., per student FTE allocation) provided to Washington CTCs that may be used for adult basic skills education at the institution’s discretion.
Application process. The SBCTC has opted to streamline both the application and reporting processes by subjecting state money to the federal standards and application process. This allows for an organization or community college to submit one application for both federal and state grants. CBOs funded through this process are subject to the federal reporting standards; data are collected by the SBCTC.
Other sources. CBOs also receive funding from various sources, including community grants, fundraising events, and other local government funding. The Department of Corrections receives funding for adult basic skills education provision from the state, which it uses to contract services out to the CTCs. Other regional entities, such as libraries, receive funding from property taxes or local foundations.
4.2 Landscape of Literacy-Related Programs in Washington
Inventory and Distribution
We used four sources to compile a comprehensive list of literacy-related programs in Washington State:
• The Literacy NOW (Network of Washington, a part of Tacoma Community House) student referral list
• The State Board of Community and Technical Colleges provider list, which includes SBCTC-funded community based organizations
• The ProLiteracy Worldwide “Find a Program” web function
• The National Center for Family Literacy “Find a Program” web function
Recommendations were also collected from stakeholders during the interview process of providers not already included on the list.
The resulting list includes 114 providers and 202 programs. Many providers, particularly the community colleges, provide programs at a number of locations in their region; therefore, there are more programs than service providers. Some locations may offer more than one type of service. Partnerships between CTCs and CBOs are also often forged, particularly for family literacy programs.

Adult Literacy Education in Washington State
November 14, 2008 (Revised December 2008) Page 39
Most of these partnered programs were counted for only one partner to avoid double-counting, so the number of programs should be considered conservative. For a list of providers, see Attachment G.
The map below (Exhibit 25) shows the geographic distribution of literacy-related programs in Washington State. A majority of the programs are located in the Puget Sound Region, which also has the highest density of CBOs. Service provision in the more rural areas of the state, particularly the eastern portion, is community college centered, with very few CBOs. Of the 39 counties in Washington, 31 have programs. There are large rural areas of the state that do not have programs, and many of the rural programs that do exist are located in the more urbanized areas of rural counties.
Exhibit 25 Distribution of Adult Basic Skills Programs in Washington State, 2008
Source: Berk & Associates, 2008.

Adult Literacy Education in Washington State
November 14, 2008 (Revised December 2008) Page 40
Adult basic skills education providers in Washington serve 57,474 federally reportable students. CTCs serve 86% of the adult basic skills population. SBCTC-funded CBOs serve 4% of the adult basic skills population. The DOC contracts with the SBCTC to provide adult basic skills programs to 10% of the adult basic skills student population.
4.3 Students Enrolled in Basic Skills Education Programs in Washington State
Demographics
Population size. In the 2007–08 school year, 51,522 federally reportable students participated in basic skills programs in Washington State, excluding incarcerated individuals. Federally reportable students are those who have met the federal reporting requirements, which include having at least 12 hours of attendance, recorded demographic information, an educational literacy goal, and a CASAS pre-test with a score in the federal eligibility range. This number includes students enrolled in CTCs and federally funded CBOs; students enrolled in correctional education are not included because they are described in section 3.0. Students served by programs not SBCTC- or federally-funded are also not included in these figures, as no reported data was available.
The majority of these students (49,273 or 96%), again excluding incarcerated individuals enrolled in adult basic skills, were served at CTCs. Only 2,249 (4%) of these students were served by CBOs. Of all the federally reportable students, 31,501 (61%) are in an English as a second language (ESL) program. The remaining 20,021 students are in adult basic education (ABE) programs.
Geographic location. In the 2007–08 school year, 34 community and technical colleges and 12 community-based organizations served students in basic skills programs. Spokane Falls Community College (Spokane) served the most students, with 3,543 federally reportable students. Highline Community College (Des Moines) ranked second, with 2,946 students.
• ABE students. Spokane Falls Community College also served the most ABE students with 2,772 (76%) of its basic skills students. Other schools’ basic skills programs that serve mainly students in ABE programs include Seattle Vocational Institute with 87%, Bates Technical College (Tacoma) with 83%, Peninsula College (Port Angeles) with 83%, Grays Harbor College (Aberdeen) with 68%, and Lower Columbia College with 68%.
• ESL students. Highline Community College served the most students in ESL programs with 3,263 students, or 86% of its adult basic skill students. Other colleges with more than 75% of basic skills students in ESL programs include Bellevue Community College, Lake Washington Technical College (Kirkland), Edmonds Community College (the only other college to serve more than 2,000 ESL students, with 2,257), North Seattle Community College, Seattle Central Community College, South Seattle Community College, and Cascadia Community College (Bothell).
Age. The majority (70%) of students in basic skills programs are 25 years old or over. This age group accounts for 81% of ESL enrollment, and 52% of ABE enrollment.
Race/ethnicity. In Washington, minorities represent 69% of students enrolled in basic skills programs. Hispanic adults make up the largest share of students in basic skills programs with 21,091 (41%) students. Hispanic adults also made up the largest number of ESL students at 16,536 students, or 52% of total ESL students. White adults made up the largest share of ABE students with 11,332, or 57% of ABE enrollment.

Adult Literacy Education in Washington State
November 14, 2008 (Revised December 2008) Page 41
Literacy Rate Estimates
CASAS test. Students in the adult basic skills programs are required to take a CASAS pre-test to determine their entering educational functioning level. A student’s lowest assessment score determines their level. Exhibit 26 shows the distribution of basic skills students by program and entry level, excluding incarcerated individuals described in Section 3.0. ABE and ESL levels are grouped according to their descriptive “lowest,” “middle,” and “highest” levels identified in section 2.0. The majority of students in both ABE and ESL programs scored in the middle levels. Around 64% of ABE students entered the program at Levels 3 and 4, while 61% of ESL students entered at Levels 2 through 4. A relatively low percentage of students, 21% of ABE students and 8.3% of ESL students, started at the lowest levels of educational functioning.
Exhibit 26 CASAS Assessment Entry Levels for Basic Skills Students, 2007–2008
Source: SBCTC, 2008 and Berk & Associates, 2008
Age and program level. Exhibit 27 lists the percentage of each age group of Washington basic skills students by ABE and ESL level. Students of different age groups are similarly distributed across basic skill levels with the largest percentage in the middle levels. A slightly higher percentage of students age 60 and older are enrolled in lower levels of ABE and ESL than other age groups.
Exhibit 27 Basic Skills Program Level by Age, 2007–2008
Source: SBCTC, 2008 and Berk & Associates, 2008
Race/ethnicity by program level. Exhibit 28 graphs the program level for Washington basic skills students by ethnicity. Hispanic adults make up the largest number of ESL students at each level, followed by Asian-American adults and white adults. White students have the highest number for each ABE program level.
Students Percent of TotalTotal ABE 20,021 38.9%
Level 1-2 4,280 21.4%Level 3-4 12,889 64.4%Level 5-6 2,852 14.2%
Total ESL 31,501 61.1%Level 1 2,612 8.3%Level 2-4 19,227 61.0%Level 5-6 9,662 30.7%
Total 51,522 100.0%
Total 16-18 19-24 25-44 45-59 60 and OlderABE Total 100.0% 14.9% 33.4% 40.8% 9.6% 1.3%
Level 1-2 21.4% 22.3% 22.1% 19.5% 24.7% 27.0%Level 3-4 64.4% 65.0% 65.3% 64.8% 59.3% 56.9%Level 5-6 14.2% 12.8% 12.6% 15.6% 16.1% 16.1%
ESL Total 100.0% 1.4% 17.8% 59.5% 16.6% 4.7%Level 1 8.3% 11.6% 7.3% 6.8% 11.3% 19.7%Level 2-4 61.0% 72.6% 64.9% 59.7% 60.0% 63.5%Level 5-6 30.7% 15.8% 27.8% 33.5% 28.7% 16.8%

Adult Literacy Education in Washington State
November 14, 2008 (Revised December 2008) Page 42
Exhibit 28 Basic Skills Program Students by Level and Ethnicity, 2007–2008
Source: SBCTC, 2008
0
2,000
4,000
6,000
8,000
10,000
ABE Level 1-2 ABE Level 3-4 ABE Level 5-6 ESL Level 1 ESL Level 2-4 ESL Level 5-6
African-American
Asian-American
Hawiian/Pacific Islander
Latino
Native American
White

Adult Literacy Education in Washington State
November 14, 2008 (Revised December 2008) Page 43
4.4 Provider and Program Descriptions
Community and Technical Colleges
There are 34 CTCs in Washington State, all of which provide adult basic skills programs. Each college has the autonomy to tailor its programs to the needs of the local community, so there is a broad range of programs offered. All institutions offer courses in ABE, ASE/GED, and ESL. Individual CTCs may also offer mentoring programs to help with academic transitions, high school completion courses, college prep courses, family literacy programs, and English Language Civics (ESL Citizenship).
The CTCs also partner with various organizations in their region to provide other programs, such as workplace literacy or Even Start (see text box “Program Partnerships” at the end of this section for program descriptions). These organizations do not have to be funded through SBCTC in order to partner with a CTC. Institutions also contract with programs like WorkFirst to provide the ABE and ESL services required by TANF recipients. CTCs also are often the providers of basic skills education at the Employment Security Department’s WorkSource centers.
Goals. All programs at the CTCs are conducted with the goal of transitioning students into college credit courses or higher paying jobs. The skill sets are not separate, but rather are essential to one another, so the focus on educational attainment and higher wages still allows for progress in all areas of a student’s life.
Integrated Basic Education and Skills Training (I-BEST). The I-BEST program combines hands-on job training with ABE or ESL, providing the classroom knowledge necessary to engage in a specific skill. Each class is taught by two instructors: the ABE or ESL instructor and the workforce instructor. This team teaching aims to ensure that the class content is applicable to the learned trade and that the necessary ABE or ESL progress is being made by each student. Programs are offered for a wide range of fields, including medical assistance, manufacturing, commercial driving, early childhood education, general office skills, law enforcement, social services, architecture/engineering, and automotive trades. Each CTC chooses which program best fits the institution’s capacity as well as the interest of the student population.
Piloted in 2004, I-BEST is now available at all 34 CTCs. As of the date of this report, there are currently 112 programs throughout the CTC system, with new ones being added. Some campuses have multiple programs in multiple fields to meet the needs of their student population.
When a student completes an I-BEST program, that student is considered to have acquired the necessary skills to be employed in that specific trade. The SBCTC has set a minimum wage requirement, and CTCs work with local employers to ensure the student receives an appropriate wage. Students may also choose to continue their education, and SBCTC research suggests that I-BEST students are more likely to enroll in college-credit courses than other ABE or ESL students. (SBCTC, Increasing Student Achievement for Basic Skills Students, 2008)
Client characteristics. Since the CTCs serve the vast majority (86%) of adult basic skills students in Washington State, the characteristics of the CTC student population closely match those of the adult basic skills population as a whole. Though the system-wide characteristics mirror those of the state, the type of student enrolled varies widely from CTC to CTC, depending upon region. For example, Yakima Community College serves a predominantly Hispanic adult population (75%), while Clark College serves a predominantly white adult population (52%).

Adult Literacy Education in Washington State
November 14, 2008 (Revised December 2008) Page 44
The Learning Disability Quality Initiative is Washington’s focus for the Quality Initiative, a joint venture including Washington, Alaska, Montana, Oregon, Idaho, and Wyoming. The initiative focuses on program improvement at the local and state level in adult education provision. Washington chose to focus on the instruction of learning disabled students and the creation of a “success pathway.” The program includes free assessments for students, as well as organizational training on identifying and instructing learning-disabled students.
The Universal Design for Learning is a means to provide access to a variety of learner types in the classroom by adapting goals and delivery methods to student needs. The concept is central to SBCTC’s Learning Disability Quality Initiative, which focuses on changing learning strategies for each student until an effective method is found. The U.S. Department of Education also provides Universal Design for Learning grants to institutions. The grant allows instructors to identify learner types among students and access strategies proven to be effective with those learner types.
According to the SBCTC’s The Washington State Plan for Adult and Family Literacy 1999–2004, The National Institute for Literacy estimates that between 50% to 80% of participants in literacy and basic skills programs may have learning disabilities. (See text box below for SBCTC strategies.)
Outcomes and effectiveness indicators. Each student enrolled in a CTC is tested using a CASAS exam upon entry and upon program completion. Progress made is used for reporting in the National Reporting System (NRS) as well as in the Washington Adult Basic Education Reporting System (WABERS). WABERS also tracks demographic data and various other data on students.
SBCTC has developed its own set of reporting standards and tracking methods in addition to those required by the federal government. Because increases in test scores must be quite large to be considered significant for the NRS, SBCTC developed its own Momentum Points system to track the incremental progress made by students. This is a part of the “tipping point” theory, developed by researchers at SBCTC, which states that a year of college (45 credits) and an earned credential is the point at which a student will see a significant increase in wage earning potential. The focus is then placed on transitioning into college credit courses and certificate programs. The CTCs measure program success on the number of level transitions in ABE/ESL, as well as transitions to college credit courses or higher-wage jobs.
Community Based Organizations
CBOs provide a variety of adult basic skills services. They serve a smaller percentage of the population in need than the CTCs but provide vital services that the CTCs may not be able to offer, as well as alternative settings to the traditional classroom for students who prefer or require a different learning environment. CBOs also provide services in geographic regions that may not be reached by the CTC system and frequently partner with the CTCs to adequately cover an area. CBOs are not only eligible for state and federal adult basic skills funding but also receive contracts from state agencies, such as DSHS, to provide the education services required by state programs.
• SBCTC-funded community based organizations. CBOs that receive state funding are subject to the SBCTC accountability and reporting requirements. There are currently 12 organizations funded by the state, and all offer traditional ABE, ESL, or GED courses. Students are assessed using the CASAS exam and reported using WABERS. The CBO class structure tends to be less

Adult Literacy Education in Washington State
November 14, 2008 (Revised December 2008) Page 45
formal than that of a CTC, with smaller groups, alternative instruction methods, such as one-on-tutoring, and more flexible schedules. Like CTCs, funding auxiliary services to enable student attendance is a challenge, since state and federal funds are earmarked for educational services only. However, many CBOs will partner with other local organizations to provide services like daycare.
• Non SBCTC-funded community based organizations. CBOs that are not funded by the state provide a variety of services to diverse populations. This study identified 68 CBOs not currently receiving state funding. Many of the CBOs have specific target populations and skill focus, rather than general adult basic skills education. CBOs that do not receive state funding have more flexibility in the types of services they offer, but funding is still a major issue. Program focus ranges from family literacy to citizenship to ESL. The populations served range from refugees to migrant workers to low-income families. Rather than transitions to post-secondary education, the goal of CBOs is often skills acquisition. According to interviewees, student success if often measured by milestones, such as acquiring a driver’s license or passing the citizenship exam.
Client characteristics. SBCTC-funded CBOs generally serve a similar client population to the CTCs, with 49.2% of the student population between 25-44 years old and approximately 35% Hispanic (data only available for SBCTC-funded CBOs). However, many individual CBOs, including those not funded through SBCTC, focus their programs toward specific populations, such as refugees or Russian-speaking individuals, when there is a great need in their community. Local demographics of the population in need and specialization of CBO programs can affect the client characteristics of any given CBO.
For example, Lutheran Community Services (LCS) in Vancouver, Washington, is funded by the Office of Refugee Resettlement and so serves primarily refugees. The predominant refugee group in the Vancouver area is from the former Soviet Union, so LCS provides counseling and other services in Russian.
It is also common for CBOs that partner with CTCs to serve students who are at the lowest levels and are not ready for the CTC environment. This can include those with learning or developmental disabilities, as well as those who are preliterate. Tacoma Community House provides classes for the lowest level ESL and ABE students until they are ready to move on to Tacoma Community College.

Adult Literacy Education in Washington State
November 14, 2008 (Revised December 2008) Page 46
Department of Corrections
DOC provides ABE, ESL, GED, vocational training, and parenting classes in all of its adult correctional facilities. Prior to 2002, the DOC contracted individually with local community colleges to provide classes in the correctional facilities. In 2002, DOC and SBCTC entered into a single contract to provide the services needed. Currently, 9 CTCs provide education services in the 15 correctional facilities throughout Washington State. Inmates are also allowed on a case-by-case basis to enroll in correspondence classes. Students pay all tuition and fees for correspondence classes. CTC staff then provides limited resources to facilitate the student’s participation in correspondence courses, such as exam proctoring. A greater percentage (57.3%) of the population is between 25–44 years of age than the CTC student population (47.8%). Like the CTCs, the second largest age group is 19–24 years old, at 24.5%.
Regional Entities
Regional entities, such as public library systems, also provide adult basic skills education services. They often develop partnerships with local CTCs to provide these services. In the case of the King County Library System (KCLS), the CTCs provide the teachers for the classes, while KCLS provides the volunteers to facilitate Talk Times, an informal conversation class, and various ESL and job application toolkits that students may access in the libraries or online. KCLS also provides outreach services, and the use of library space increases student’s access to adult basic skills education.
Related Organizations and Partnerships
Other organizations in the state that provide funding or partner for adult basic education but are not necessarily themselves providers include:
• K–12 school districts—provide Even Start programs;
• DSHS refugee and WorkFirst programs—provide funding for various programs at CBOs and CTCs;
• Employment Security Department’s (ESD) WorkSource Centers—partner to provide literacy services at centers or provide referral to CTCs or CBOs that provide services.
The above entities and programs contract with CTCs and CBOs to provide adult basic skills education for their clients. For K–12 Even Start programs, the classes often occur in a school district facility, while refugee or WorkFirst classes will often be held at the CBO or CTC facilities. ESD WorkSource Centers do not all provide adult basic education services; however, those that do contract with a CTC to provide the service at the center itself.
In partnering, organizations aim to increase access to and the capacity of their programs. This allows a more efficient use of each organization’s resources and skills to more effectively serve the population in need.

Adult Literacy Education in Washington State
November 14, 2008 (Revised December 2008) Page 47
Program Partnerships
Workplace Literacy programs use the student’s workplace as the instructional venue in order to provide context for the skills being taught. Lessons are centered on the skills a student needs to be successful in the workplace. This delivery method allows students who would not otherwise be able to take time off work to attend class and access to literacy education.
Even Start is a federally funded program for low-income families that provides family literacy instruction. There are three components to the program: early childhood education, adult education, which includes parenting classes, and parent-child interaction literacy activities. Typically, early childhood and adult education classes are provided simultaneously to alleviate barriers to attendance, followed by the parent-child interaction portion, which includes activities such as reading aloud to one another.

Adult Literacy Education in Washington State
November 14, 2008 (Revised December 2008) Page 48
5.0 COMPARATIVE SURVEY OF FOUR STATES
5.1 Introduction and Methodology
In an effort to gain an understanding of statewide approaches to adult basic skills education in other parts of the country, interviews were conducted with state directors from four states: Illinois, Massachusetts, North Carolina, and Oregon. Department websites and policy reports were also reviewed. The four states were selected for study based on several factors:
• Recommendations from SBCTC staff and national experts in the field;
• Similar demographics to Washington in terms of educational achievement and/or English language proficiency;
• Geographic diversity; and
• Diversity of provider types.
This section summarizes the four states’ approaches to adult basic skills education. In particular, practices related to ESL, program quality, managing young adults in the classroom, and distance learning were considered.
Characteristics of States Surveyed
Exhibit 29 presents an overview of key demographics related to adult basic skills including the percentage of the state adult population at the lowest literacy level, the percentage receiving less than a high school degree, the percentage who have limited English proficiency, the number enrolled in basic skills programs, total state populations, and the percentage of state population in basic skills programs.
Exhibit 29 Demographic Statistics for Selected States, 2006
Source: National Institute for Literacy, The State of Literacy in America, 1998; CAEL and NCHEMS, Adult Learning in Focus: National and State by State Data, 2008; National Commission on Adult Literacy, Reach Higher, America: Overcoming Crisis in the U.S. Workforce, 2008; U.S. Census Bureau, 2007 Population Estimates, and Berk & Associates, 2008
5.2 Key Trends and Innovative Approaches Across the States
Key Trends
The interviews with the four state directors highlighted a number of national trends in adult basic skills administration and policy.
State agencies play a similar administrative role. Adult basic skills programs are administered by a wide variety of state agencies. However, regardless of the agency, each state appears to have limited
State
Percent of Adult Population at Level 1 Literacy
Percent of Adults with Less than a High School Degree
Percent Adults who Speak English Poorly or Not at All
Total Enrolled in Federal Basic Skills Programs
Total State Population
Percent of Population Enrolled
Oregon 15% 11% 5% 21,713 3,747,455 0.006%Massachusetts 16% 9% 5% 23,957 6,449,755 0.004%North Carolina 22% 15% 4% 108,745 9,061,032 0.012%Illinois 20% 12% 6% 109,743 12,852,548 0.009%Washington 15% 10% 5% 52,810 6,468,424 0.008%

Adult Literacy Education in Washington State
November 14, 2008 (Revised December 2008) Page 49
authority over instruction and program management at the provider level. State agencies also appear to play a similar role in program administration including:
o Allocating federal and state funding to adult basic skills education programs;
o Managing reporting and providing technical assistance to providers;
o Developing content standards, tools, and performance measurements;
o Providing professional development opportunities; and
o Establishing partnerships and innovative programs.
Structuring adult basic skills education within the context of real life and career ladders. Programs generally focus on how to ensure successful transitions to post-secondary education and high-demand jobs. Washington is viewed as a leader in this area, according to those interviewed.
Meeting the demand for ESL is a challenge that manifests itself in different ways. In North Carolina and Oregon, recruiting ESL students has been difficult, especially given the recent tightening of immigration policies. In Massachusetts and Illinois, ESL students make up the largest percentage of adults seeking basic education and many more are on wait lists. In Massachusetts, ESL students are overrepresented in basic skills programs and are believed to be filling spots normally occupied by traditional ABE students. In Washington, the lowest level ESL students are considered difficult to reach and serve because their progress is often less than can be reported to the federal government, according to those interviewed.
Better data allow states to focus on outcomes. Providers are becoming more sophisticated in collecting data, and web technologies are facilitating more efficient reporting. States are using these data to target strong and weak programs, identify best practices, and allocate funding to get the most out of scarce dollars. Washington is known for its strong data collection system. In addition to federally required data, Washington CTCs collect additional demographic data through its WABERS system and tracks small increments of student progress using Momentum Points.
The quality of instruction varies widely among providers in a state network. Many states are trying to ensure that their programs offer a more consistent standard of instruction, and they are using a variety of approaches to do this. Washington has developed State Adult Learning Standards for ABE programs.
Innovative Approaches
Meeting the demand for ESL, standardizing the quality of instruction, and ensuring successful transitions are challenges for all states, including Washington, according to those interviewed. The states interviewed offered several promising approaches to these issues that could be considered for Washington’s adult basic skills programs.
ESL
The state interviews uncovered three distinct approaches to increase the quality and availability of ESL programs that have potential applicability in Washington.
• ESL Task Force. Illinois has an ESL Task Force that advises the state office specifically on ESL-related issues. Most recently, the Task Force helped Illinois switch to the Best Plus assessment test by developing competencies and doing pilot testing. Washington does not have a task force
Adult Literacy Education in Washington State
November 14, 2008 (Revised December 2008) Page 50
dedicated to ESL, but has ESL experts from each program that collaborate to create learning standards.
• Native language GED instruction. Illinois and Massachusetts fund several programs that teach GED preparation in students’ native languages, and Massachusetts offers the GED in Spanish. This approach focuses on getting highly educated immigrants the basic credentials they need to be eligible for employment. The programs then teach them the English skills necessary to function at a higher level. Washington has a handful of Spanish GED programs.
• Online ESL instruction. Since 2001, North Carolina has been using online ESL instruction to provide increased access for its hard-to-reach immigrant population. The program, Project IDEAL, offers distance education to ESL and ABE learners. There are 14 programs and over 38 instructors who have been trained thus far. The state has developed two online ESL curricula using English Language Civics funding. There is no statewide online ESL instruction available in Washington.
Program Quality
The following statewide programs address different aspects of program quality, including curriculum, assessment, and development of instructional and management staff.
• Content standards. Massachusetts has developed curriculum frameworks for ABE and ESL instruction with which all programs are expected to comply. The frameworks address the question, "What do adult learners need to know and be able to do to function successfully in their roles as parent/family member, worker, citizen, and life-long learner?" They give teachers a structure from which to develop lesson plans and curricula. Illinois has developed content standards for its ESL programs, and Oregon is in the process of developing content standards. Washington also has content standards and curriculum frameworks.
• Aligning assessment with content frameworks. In partnership with educational researchers at the University of Massachusetts, the state of Massachusetts has developed a new assessment test that aligns with the state’s content frameworks to measure how well the curriculum is being taught. This test can be used to target weak programs for additional technical assistance and reward strong programs. Many of the Washington providers interviewed said that CASAS does not assess the material being taught, and they would prefer a more tailored assessment.
• Professional development. North Carolina has created an extensive online portal, NC Online, through which to deliver training for instructors and managers, provide resources, and enable communication via listserv. While Washington does utilize the web for communicating about professional development, it does not have anything as extensive as NC Online.
Transitions
Every state interviewed mentioned Washington’s success in the area of transitioning adult students to higher education and sustainable careers.
Pathways to Advancement. The goal of Oregon’s two-year-old Pathways to Advancement Initiative is to increase the number of students attaining credentials by using programs designed at the local level and driven by industry needs. These programs have flexible schedules and provide student support. Pathways courses are designed to integrate academic and occupational content. In addition, the program provides advising and tools to help students bridge adult basic skills education to college or a sustainable career. Pathways is as much about professional development as curriculum, as its

Adult Literacy Education in Washington State
November 14, 2008 (Revised December 2008) Page 51
success depends on instructors reaching out to work force centers and career and technical faculty at their institutions. I-BEST is the Washington equivalent to this program.
5.3 Overview of States Surveyed
To easily compare the landscape of adult basic skills programs in the four states and Washington, Exhibit 30 outlines several key program elements.
Exhibit 30 Program Features of States, 2006-2007
Source: Interviews with state directors; National Commission on Adult Literacy, Reach Higher, America: Overcoming Crisis in the U.S. Workforce, 2008 and Berk & Associates, 2008
• The number of students enrolled in each state generally parallels the state population. The number of providers, however, does not appear to follow this pattern. Massachusetts has the second smallest number of students, but the second largest number of providers.
• In Illinois, Massachusetts, and Washington, the largest percentage of students are enrolled in ESL, while in Oregon and North Carolina, the largest percentage are enrolled in ABE.
• Average cost per student in Exhibit 30 is a rough estimate that does not account for the variation in services across states or programs. The statistic suggests that Massachusetts is spending more per student than the other four states.
• Federal funding does not always appear to align with the number of students enrolled as is evidenced by Massachusetts receiving more federal funding than Washington, despite serving fewer students. State funding also appears to vary considerably, with Washington and North Carolina having the highest state match percentages.
For a detailed review of each state’s programs and challenges, see Attachment H.
Illinois North Carolina Massachusetts Oregon Washington
Number of students enrolled in basic skills 109,743 108,745 23,957 21,713 52,810 Number of federally-funded providers 108 84 109 18 46
% of students in ESL 59% 28% 65% 45% 61%
% of students in ABE 22% 56% 35% 46% 39%
% of students in ASE 13% 14% Included in ABE 9% 6%
AssessmentsTABE
BEST Plus
CASAS, TABE WorkKeys
BEST, BEST PlusMAPT
BEST Plus, REEPCASAS
BEST CASAS State Funding(in millions) $34.8 $61.5 $30.1 $19.0 $70.0Federal Funding (in millions) $19.2 $14.3 $8.4 $4.9 $7.4
State Match Percentage 181% 431% 358% 391% 946%

Adult Literacy Education in Washington State
November 14, 2008 (Revised December 2008) Page 52
6.0 GAP ANALYSIS: THE SUPPLY AND DEMAND FOR LITERACY EDUCATION
This section compares the literacy rate findings from section 3.0 with the program inventory and descriptions from section 4.0 to identify potential gaps in the provision of adult literacy and basic education in Washington. This assessment is supplemented with findings from stakeholder interviews that identify hard-to-reach populations and factors that limit program accessibility to potential adult learners. This assessment aims to develop a broad sense of program reach in terms of total population served and geographic distribution and does not address the kinds and quality of services offered.
6.1 Population Size: Total Students Served Is Less Than Total Demand
The population that could benefit from adult basic education programs is larger than the population currently enrolled in adult basic education. In 2007–08, there were 51,522 federally reportable students served by the state’s adult basic skills system, plus the 5,952 incarcerated individuals enrolled in Correctional Education.
All literacy estimates presented in section 3.0 indicate an order-of-magnitude difference between the adult population that could benefit from further adult basic skills education and those currently receiving that education. Exhibit 31 presents estimates of quantifying that difference, using different measures of “low literacy” presented in section 3.0.
Exhibit 31 Estimates of Gap by Low Level Literacy Measure
Source: NALS 1992, PSU 1996, ACS 2006, Berk & Associates 2008
Looking specifically at ESL education, the 2006 ACS reports that 7.6% (486,060) of Washington’s population is designated as English language learners (ELL). While this number includes children, it is also important to note the ACS shows that there are 104,121 “linguistically isolated” households in Washington, which means all household members 14 years and older have at least some difficulty speaking English.
In interviews, staff at the SBCTC’s Office of Adult Education stated that adult basic skills education is only reaching a small portion of the potential population.
6.2 Geographic Distribution of Programs: Concentrated in Urban Areas
The map of program sites for federally funded CBOs and CTCs from section 4.0 is included here again in Exhibit 32 to identify potential geographic gaps in adult education programs. Perhaps most striking in this exhibit is the concentration of CTC and CBO program sites in the Puget Sound region, where the state’s population is also concentrated. In fact, 124 out of the 202 program sites identified (approximately 61%), are located in King, Kitsap, Snohomish, and Pierce Counties. Populations in rural areas appear to have limited access to programs. There are large rural areas of the state that are
Measure of Low Level LiteracyEstimated Number of "Low
Literacy" WA AdultsGap: Difference between Estimated
Number & Current Students(1990-1992) Level 1 370,000 - 550,000 312,256 - 497,526(1990-1992) Level 1 and 2 1,147,000 -1,332,000 1,089,526 - 1,274,526(2006) Lack of High School Diploma 467,600 410,126

Adult Literacy Education in Washington State
November 14, 2008 (Revised December 2008) Page 53
not in close proximity to a program site, and programs in more rural counties tend to be located in more urbanized areas.
Exhibit 32 Distribution of Adult Basic Skills Programs in Washington State, 2008
Source: Berk & Associates, 2008

Adult Literacy Education in Washington State
November 14, 2008 (Revised December 2008) Page 54
Percent Population Estimated
at NALS Level 1-2 (1990-92)Percent LEP
Population (2000)
Percent Populationwith HS Degree
(2000)Adams 52.0% 22.6% 63.0%Franklin 55.0% 25.2% 64.0%Grant 49.0% 15.7% 72.0%Yakima 52.0% 16.2% 69.0%Washington 35.0% 4.9% 87.1%
Eight counties have no adult basic skills education program sites: Columbia, Asotin, Garfield, Whitman, Pend Oreille, Ferry, Kittitas, and Wahkiakum. It should be noted that data for the geographic distribution of programs was based on street addresses; programs may exist in these counties for which no street address was available at the time of this analysis. To estimate demand for these programs, Exhibit 33 presents high school attainment by county, according to the 2000 U.S. Census. The percentage of Washington adults age 25 and older with a high school degree or equivalent equaled 87% in 2000. Only two of the eight counties without adult basic education program sites ranked at or above the state’s percentage. Based on this proxy indicator, over 9,000 adults could potentially benefit from adult basic skills education in counties where no program sites exist.
Exhibit 33 County Population High School Attainment, 2000
Source: U.S. Census, 2000 and Berk & Associates, 2008
Counties with estimated higher percentages of low literacy populations do not have higher concentrations of programs available. A higher percentage of the population in the central Washington counties of Franklin, Yakima, Adams, and Grant demonstrated lower levels of literacy and high school graduation and higher concentrations of English language learners. Exhibit 34 summarizes the proxy indicator measurements for the four counties.
Exhibit 34 Literacy Proxy Indicators: Summary Table
Source: PSU, 1996 and U.S. Census, 2000 and Berk & Associates, 2008
Populationover 25 Years
Percent of Population over 25 Years: HS Degree
Population over 25 Years:
No HS DegreeWhitman 20,070 93% 1,444 Kittitas 19,303 87% 2,471 Asotin 13,619 86% 1,934 Garfield 1,655 84% 258 Wahkiakum 2,715 84% 429 Columbia 2,827 83% 488 Ferry 4,748 83% 823 Pend Oreille 7,995 81% 1,521
9,368

Adult Literacy Education in Washington State
November 14, 2008 (Revised December 2008) Page 55
In the four-county region, 12 adult basic education program sites were identified. Of those, nine sites were the branch and main campuses of three community colleges: Big Bend, Yakima Valley, and Columbia Basin. In the 2007–08 school year, a total of 6,098 students were in basic skills education programs at those community colleges.4 In comparison, the total four-county adult population without a high school diploma equaled 66,162.
6.3 Potential Gaps Identified by Stakeholders
In interviews, CTC and CBO adult basic education service providers in Washington State were asked to identify gaps in services that affected their communities. The following themes emerged regarding hard-to-reach and underserved populations and issues that affect students’ attendance in classes.
Young ABE learners. According to those interviewed, changing demographics and an increase in the number of high school dropouts have created a unique challenge in teaching adult basic skills classes. Younger students often have different learning styles and classroom behaviors that may conflict with those of older students. The Institute of Extended Learning in the Spokane Community College District has addressed this issue by creating a separate class for 18–25 year old ABE/GED students. This population is also viewed as underserved by many service providers. According to SBCTC data on federally reportable students, 32% of ABE learners (or approximately 16,332 students) and 16% of ESL learners (or 8,037 students) are between the ages of 19 and 24 years. They are seen as difficult to reach and engage.
Lowest level learners. The lowest level ABE and ESL students are the most difficult to reach population, according to the stakeholders interviewed. According to SBCTC data on federally reportable students, there are 4,280 lowest level (Levels 1-2) ABE learners (21.4%) and 2,612 lowest level (Level 1) ESL learners (8.3%). These students also present a unique challenge in reporting progress, according to those interviewed, since most of the progress made by students is on a much smaller scale than is federally reportable or even reportable using the Momentum Point system at the state level. Many of these students may also have learning disabilities or be developmentally delayed, requiring resources which organizations may not have the capacity to provide.
Incarcerated individuals. The demand for the Department of Corrections’ Basic Skills Program exceeds the program’s current capacity. According to the DOC, in the week of September 28—October 4, 2008, there were 3,201 incarcerated individuals on the waitlist to enroll in basic skills education. Given this level of demand, wait list priority levels have been established, based on education attainment and age. The first priority group is made up of 139 individuals under the age of 22 years with no verified high school diploma or GED. The second priority group is comprised of 1,339 individuals 22 years and older with no verified high school diploma or GED. The third priority group includes 1,723 individuals that have been referred to the program because of low literacy skills, regardless of high school diploma or GED status.
4 Student enrollment data for the three CBOs were not available.

Adult Literacy Education in Washington State
November 14, 2008 (Revised December 2008) Page 56
Provision of auxiliary services. Auxiliary services, such as childcare, transportation, and job placement, are viewed as helpful in increasing a student’s ability to attend and complete a program. However, providers pointed out the inability to fund such additional services. The issue is twofold: organizations simply do not have enough funds to allocate to special services on the one hand, while on the other, funds are provided for specific programs or services and may not be used for any other service. For example, the King County Library System cannot buy workbooks for its ESL students using library funds because they are considered consumable products and will not be part of the library’s permanent collection. Another service identified frequently by providers was learning disability diagnosis. Most programs do not have the funds to test students for disabilities and cannot customize instruction appropriately for those in need.
6.4 Summary: Access to Adult Education Programs
This descriptive comparison between estimated potential demand and the existing supply of adult basic skills education services indicates that the number of adults who could benefit from literacy education exceeds the total number of students currently enrolled in Washington’s CTC and CBO education system (approximately 312,000 to almost 1.3 million adults).
Gaps in the geographic location of programs present significant accessibility problems. The location of program sites is heavily concentrated in the Puget Sound region and is sparse in rural areas, whereas literacy indicators estimate need throughout the state, and in central Washington in particular. Given that CTCs provide adult basic skills education to the majority of students in the state, this geographic distribution is unlikely to change. This analysis examined only actual program locations; the role of distance and online learning was not explored. Their use to increase the accessibility of adult education programs is an area for further research. The presence of an adult education site, however, does not guarantee accessibility to the adult learner. Other supporting services, such as financial aid and auxiliary services, were identified by stakeholders as ways to provide opportunities for adult learners to access adult education services consistently.

Adult Literacy Education in Washington State
November 14, 2008 (Revised December 2008) Page 57
7.0 CONCLUSION
7.1 Summary: Snapshot of Washington Literacy Estimates and Literacy Education
Literacy encompasses the skills of reading, writing, speaking in English, computing, and solving problems. This broad definition in use today equates being literate to being able to function in the work, family, and civic spheres of society. The multiple skills of literacy are measured by shades of gray along a spectrum, not in the black and white terms of “literate” and “illiterate.”
In Washington, between 10% and 15% of the adult population (approximately 370,000 to 555,000 adults age 16 and older) were estimated to have the lowest level of literacy between 1990 and 1992. In 2006, almost half a million Washingtonians over the age of 25 lacked high school credentials, and 4.9% of the state’s total population was identified as English language learners. These data indicate that a considerable number of adults have low levels of literacy. The policy implications of this finding are significant. Low levels of literacy have been associated with lower levels of income and employment and higher levels of poverty.
In 2007–2008, 57,474 students were served by CTCs, CBOs, the DOC, and regional entities in adult basic skills education programs in 31 of Washington’s 39 counties. The number of program sites is heavily concentrated in the Puget Sound region, while estimated demand for these services is statewide. The central Washington region, in particular, may be underserved. By all estimates, the number of students served by adult literacy and basic skills services is much smaller than the population of adults who could benefit from them.
7.2 Areas for Further Research
Several topics emerged that require research beyond the scope of this project.
Learning disabilities. Information regarding the rate of learning disability among the low-literate population is scarce. Often disabilities are not diagnosed or are self-reported, making a number difficult to determine. The 1992 SALS was the last time Washington State specific data was collected regarding learning disabilities in the adult population. This information was self-reported by interviewees. Most providers in Washington State that were interviewed did not have the resources to diagnose learning disabilities, and thus based information on self-reporting.
Income level. Washington State’s adult basic skills education places an emphasis on workforce skills and obtaining a livable wage for students. Discussion of income level in this study is descriptive, but data was used when available. Aside from TANF clients, student income levels were not available for analysis and a relationship was difficult to assess.
Adult Literacy Education in Washington State
November 14, 2008 (Revised December 2008) Page 58
Cost per student. When asked for an average cost per student in interviews, most providers were unsure of the best way to calculate it. Because of multiple funding sources, different formulas may be used for different programs. The inclusion of overhead, use of volunteer teachers, and donated materials also complicate the cost. The CTCs and SBCTC-funded CBOs use both a competitive grant application process and an FTE formula for funding, but this does not directly translate into cost per student and only applies to state-funds, not other grants or donations.
Distance learning. This study uses a program’s physical location to assess availability, which does not account for potential distance learning options. Most providers interviewed do not provide a distance learning option for ABE or ESL. One notable exception is Big Bend Community College, which has implemented an ESL distance learning program for migrant students so that they can stay connected and enrolled while they are out of the state. Identifying other distance learning programs would help further the understanding of program availability in Washington.