advanced applications r&d doe/nist collaboration. ewing doe... · – coordinate regular...
TRANSCRIPT

Advanced Applications R&D DOE/NIST Collaboration
Paul D. Ewing Oak Ridge National Laboratory
Project Team
DOE/OE Transmission Reliability Program
Jerry FitzPatrick, NIST Allen Goldstein, NIST Joe Gracia, ORNL Terry Jones, ORNL Harold Kirkham, PNNL
Yilu Liu, ORNL/UTK Tom Nelson, NIST Frank Tuffner, PNNL Will Yao, UTK Jeff Zhao, UTK
June 7, 2016 Washington, DC

Project Objective
• Background – Industry dependence on PMUs is expected worldwide as their use increases – More than 20 PMU manufacturers – More than 50 different models of PMU – Recognition that conformance and metrology R&D are necessary
elements for widespread industry acceptance
• Objective – Seek out opportunities for advanced applications R&D collaborations between DOE and NIST – Coordinate regular discussions between DOE labs and NIST – Investigate pressing issues facing PMU users – Identify future PMU-related instrumentation developments – Support the assessment of PMU data quality issues
Looking Back
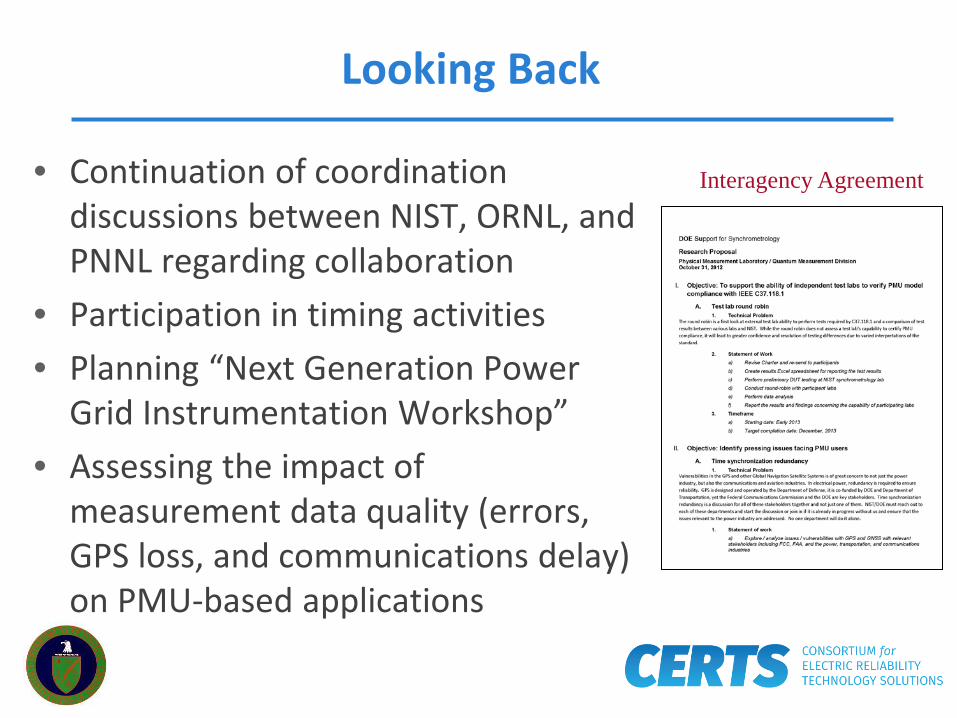
• Continuation of coordination discussions between NIST, ORNL, and PNNL regarding collaboration
• Participation in timing activities • Planning “Next Generation Power
Grid Instrumentation Workshop” • Assessing the impact of
measurement data quality (errors, GPS loss, and communications delay) on PMU-based applications
Interagency Agreement

Participation in Timing Activities
• IEEE P1588 Working Group – updating Precision Timing Protocol (PTP) for applications requiring sub-nanosecond timing
• Time Aware Applications, Computers, and Communication Systems (TAACCS) Group – collection of individuals and organizations interested in addressing unique problems surrounding distributed timing
• Cyber-Physical Systems (CPS) Public Working Group, Timing Section – developing framework for correct timing by construction to allow large scale growth
• Invited talk on timing at I-PCGRID Workshop in San Francisco, March 30 – April 1, 2016

IEEE P1588 Working Group
• Organization – PAR approved on June 14, 2013 • DOE Lab Role – Actively participating in working group
– Hosted August 2015 meeting in Knoxville, TN – Attended January 2016 meeting in Paso Robles, CA – Sitting in on subcommittee telecons – Expecting release of draft standard at end of 2017
• Charter – Issue new edition of IEEE 1588-2008, Standard for a Precision Clock Synchronization Protocol for Networked Measurement and Control Systems

TAACS Group
• Charter – Collection of people from academia, industry, and research labs interested in the unique problems surrounding distributed clock agreement
• Organization – Led by Carnegie Mellon University and NIST
• DOE Lab Role – Participated in writing white paper outlining the need for timing research; group has been quiet of late

CPS Public Working Group – Timing Section
• Charter – Establishing the operational framework element for large scale interaction between cyber-physical systems for timing correction by construction
• Organization – Led by NIST; participants include government, academia, and industry
• DOE Lab Role – Actively participating in timing section Completed draft CPS Framework Public comment period ended
November 2, 2015

Next-Generation Instrumentation Workshop
• Tentative Dates: September 23, 2016 or March 24, 2017
• Tentative Locations: Cincinnati, OH or Gaithersburg, MD • Chair: Yilu Liu, ORNL/UTK • Attendance: Invitation only • Potential agenda topics (sample)
– Digital PMUs/sample value PMUs – Merging units and beyond – Requirements for distribution side vs transmission side – Measurement issues (data rates, delays, latency, limits, etc.) – Utilities’ perspective – Impact of renewables

Assessing Data Quality Issues
• GPS Timing Loss • Impact of Thermal Sensitivity
GPS Timing Loss of FDRs in 2010-2012
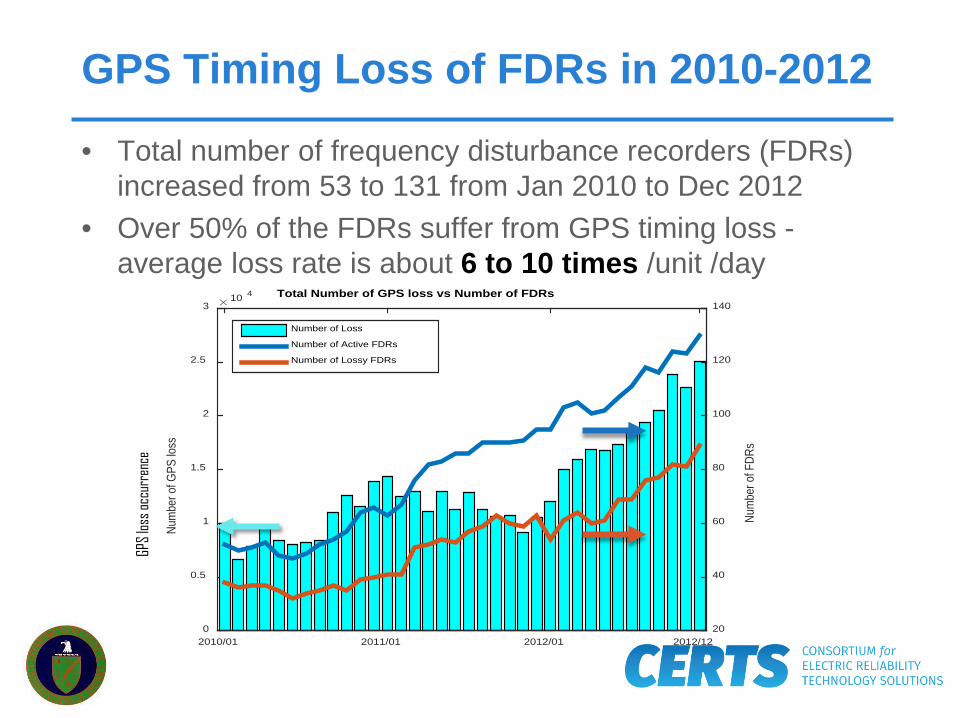
• Total number of frequency disturbance recorders (FDRs) increased from 53 to 131 from Jan 2010 to Dec 2012
• Over 50% of the FDRs suffer from GPS timing loss - average loss rate is about 6 to 10 times /unit /day
2010/01 2011/01 2012/01 2012/12
Num
ber o
f GPS
loss
10 4
0
0.5
1
1.5
2
2.5
3Total Number of GPS loss vs Number of FDRs
Num
ber o
f FDR
s
20
40
60
80
100
120
140
Number of Loss
Number of Active FDRs
Number of Lossy FDRs
GPS l
oss o
ccur
renc
e

GPS Timing Loss of PMUs in 2009-2012
• From 2009 to 2012, synchrophasor units (PMUs) lost GPS signal 5 times per day with average duration of 6.7 seconds per loss
• Yearly data show significant difference in loss number and mean duration (possibly due to new installations) Year Number of PMUs Loss Occurrence
(per unit) Mean Duration (per unit per loss, sec)
2009 26 2320 4.1
2010 34 838 3.9
2011 64 1744 15.4
2012 83 1517 1.7

GPS Timing Loss-Recovery Time • The monthly average number of losses decreases
exponentially as recovery time increases • Most GPS losses recover within 20 minutes • FDRs are set to coast running without GPS for 1 or 2 hours
PMU loss-recovery time
Num
ber o
f los
ses /
mon
th
Loss-recovery time (minute)
FDR loss-recovery time
Num
ber o
f los
ses /
mon
th
Loss- recovery time (minute)

No Significant Spatial Pattern Observed
10 100 1000 10000
Map shows the average GPS losses/month for FDRs from 2010-2012 vs location
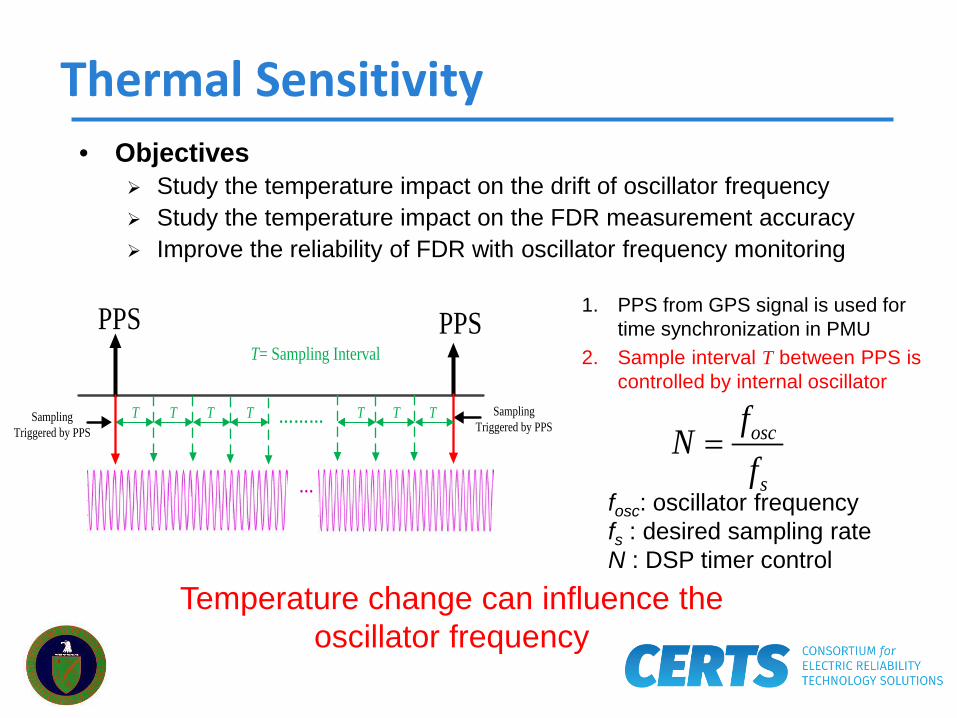
Thermal Sensitivity • Objectives
Study the temperature impact on the drift of oscillator frequency Study the temperature impact on the FDR measurement accuracy Improve the reliability of FDR with oscillator frequency monitoring
PPS
………T T T T
T= Sampling Interval
Sampling Triggered by PPS
T T
PPS
…
Sampling Triggered by PPS
T
1. PPS from GPS signal is used for time synchronization in PMU
2. Sample interval T between PPS is controlled by internal oscillator
Temperature change can influence the oscillator frequency
osc
s
fN
f=
fosc: oscillator frequency fs : desired sampling rate N : DSP timer control
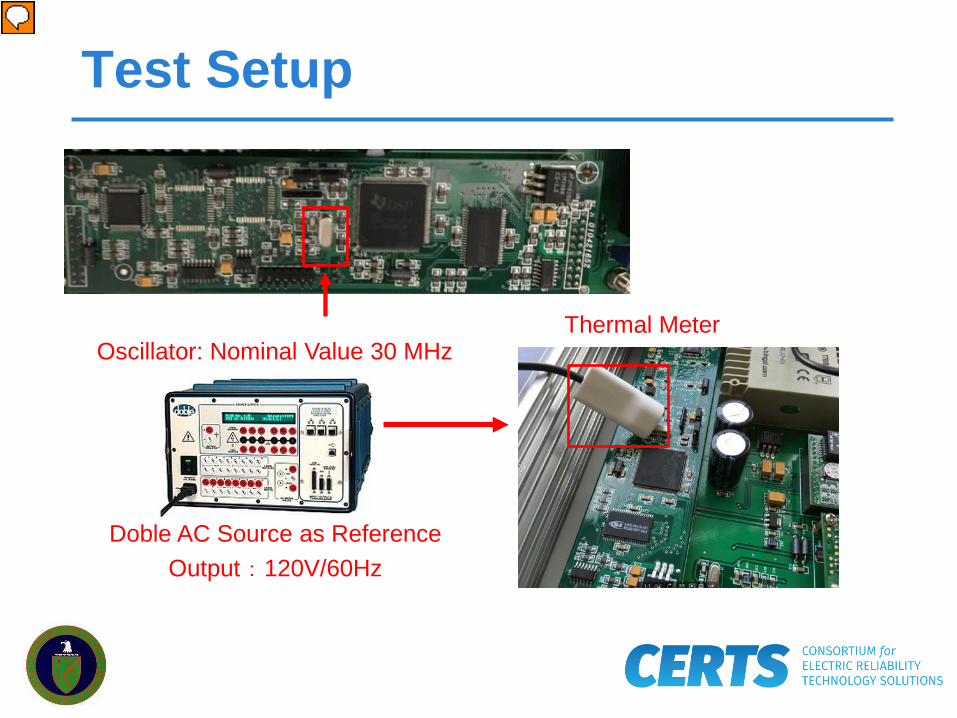
Test Setup
Oscillator: Nominal Value 30 MHz Thermal Meter
Doble AC Source as Reference Output:120V/60Hz

FDR Test Results
Temperature
Frequency
Osc. Frequency
Angle 0 2 4 6 8 10 12 14 16
-0.1
0
0.1
0.2
0.3
0.4
0.5
0.6
0.7
Time(min)
Ang
le (d
egre
e)
0 2 4 6 8 10 12 14 1630.115
30.12
30.125
30.13
30.135
30.14
30.145
30.15
Time(min)
Osc
(MH
z)
0 5 10 1525
30
35
40
45
50
55
Time(min)
Tem
patu
re (C
elsi
us d
egre
e)
0 5 10 1559.9985
59.999
59.9995
60
60.0005
60.001
Time(min)
Freq
uenc
y (H
z)
Normal temperature: 20 – 50°C
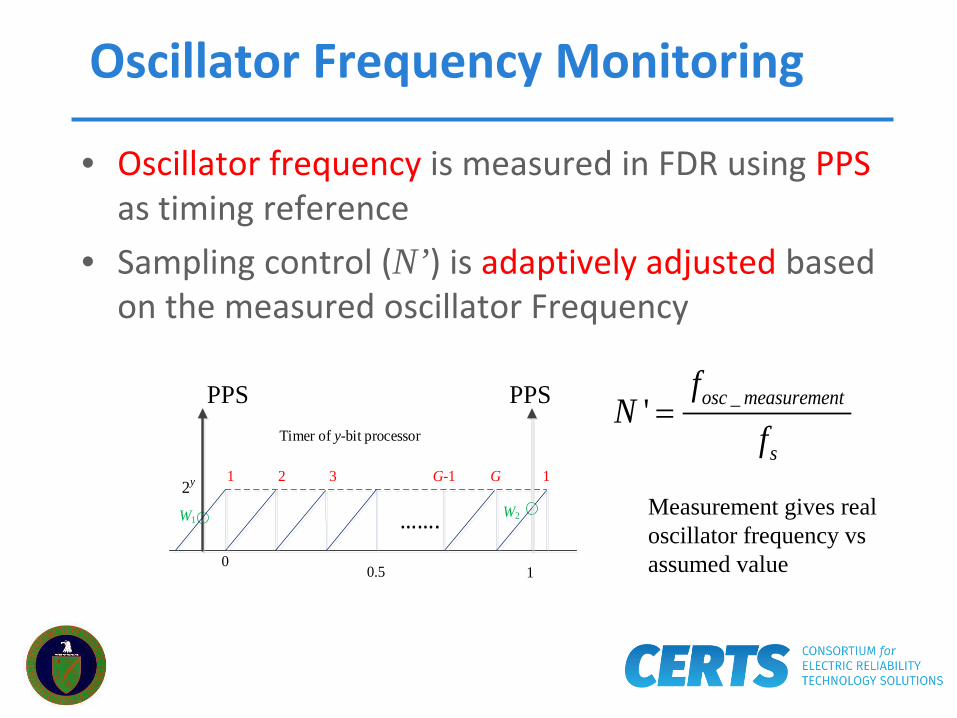
Oscillator Frequency Monitoring
• Oscillator frequency is measured in FDR using PPS as timing reference
• Sampling control (N’) is adaptively adjusted based on the measured oscillator Frequency
PPS PPS
2y
Timer of y-bit processor
…….0
0.5 1
1 2 3 GG-1 1
W2W1
_' osc measurement
s
fN
f=
Measurement gives real oscillator frequency vs assumed value
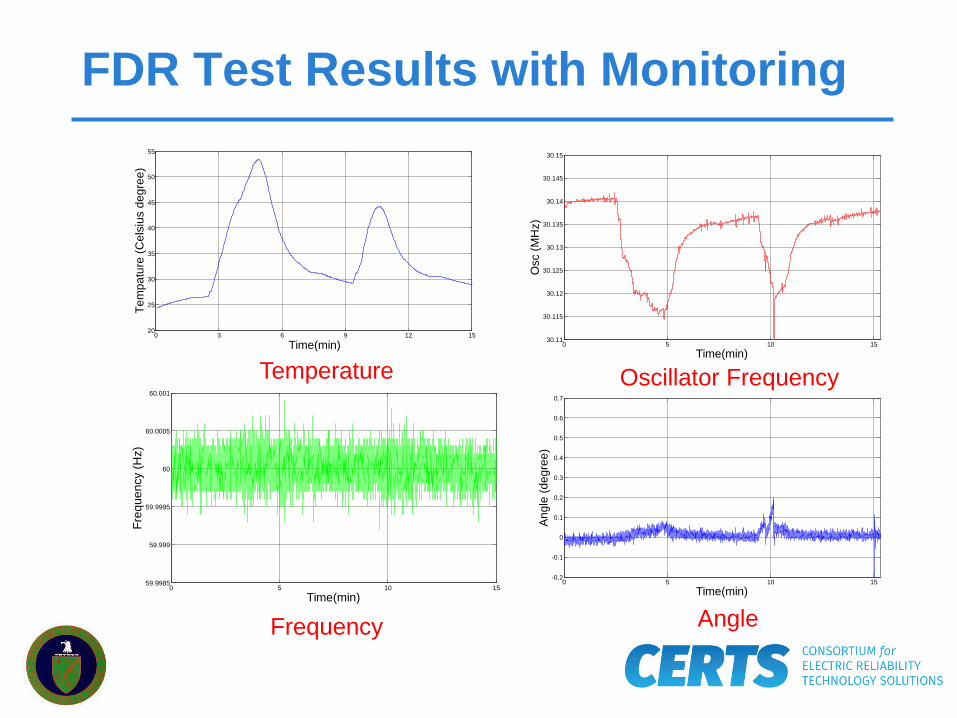
FDR Test Results with Monitoring
Temperature
Frequency
Oscillator Frequency
Angle
0 5 10 1530.11
30.115
30.12
30.125
30.13
30.135
30.14
30.145
30.15
Time(min)
Osc
(MH
z)
0 5 10 15-0.2
-0.1
0
0.1
0.2
0.3
0.4
0.5
0.6
0.7
Time(min)
Ang
le (d
egre
e)
0 5 10 1559.9985
59.999
59.9995
60
60.0005
60.001
Time(min)
Freq
uenc
y (H
z)
0 3 6 9 12 1520
25
30
35
40
45
50
55
Time(min)
Tem
patu
re (C
elsi
us d
egre
e)

Comparison (Frequency)
Frequency Measurement Reliability is Improved
0 5 10 15
59.9988
59.999
59.9992
59.9994
59.9996
59.9998
60
60.0002
60.0004
60.0006
60.0008
Time(min)
Freq
uenc
y (H
z)
without Oscillator frequency monitoringwith Oscillator frequency monitoring

Comparison (Angle)
Angle Measurement Reliability is Improved
0 5 10 15-0.1
0
0.1
0.2
0.3
0.4
0.5
0.6
0.7
Time(min)
Ang
le (d
egre
e)
without Oscillator frequency monitoringwith Oscillator frequency monitoring
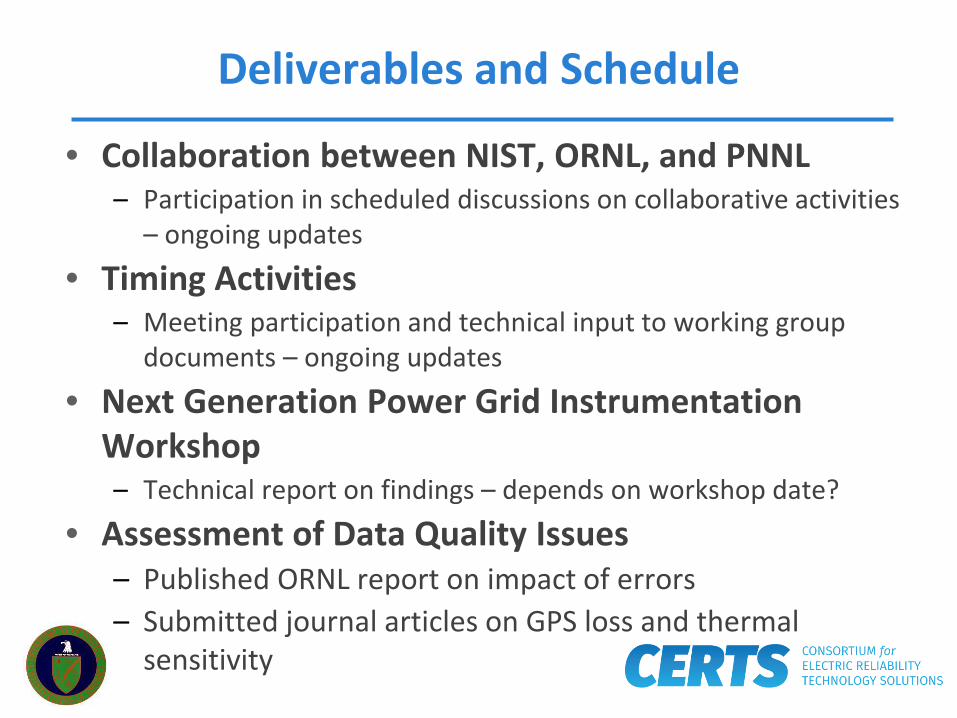
Deliverables and Schedule
• Collaboration between NIST, ORNL, and PNNL – Participation in scheduled discussions on collaborative activities
– ongoing updates
• Timing Activities – Meeting participation and technical input to working group
documents – ongoing updates
• Next Generation Power Grid Instrumentation Workshop – Technical report on findings – depends on workshop date?
• Assessment of Data Quality Issues – Published ORNL report on impact of errors – Submitted journal articles on GPS loss and thermal
sensitivity
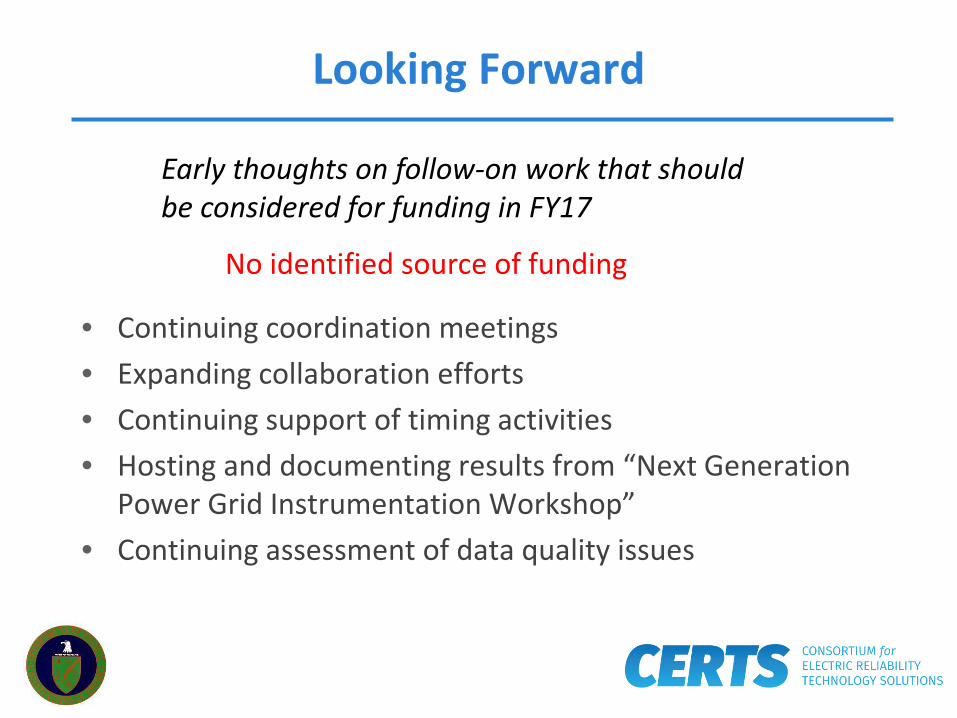
Looking Forward
• Continuing coordination meetings • Expanding collaboration efforts • Continuing support of timing activities • Hosting and documenting results from “Next Generation
Power Grid Instrumentation Workshop” • Continuing assessment of data quality issues
Early thoughts on follow-on work that should be considered for funding in FY17
No identified source of funding