advanced aviation weather forecasts - ll.mit.edu · • wolfson and clark advanced aviation weather...
TRANSCRIPT
• Wolfson and ClarkAdvanced Aviation Weather Forecasts
VOLUME 16, NUMBER 1, 2006 LINCOLN LABORATORY JOURNAL 31
Advanced Aviation Weather ForecastsMarilyn M. Wolfson and David A. Clark
n The U.S. air transportation system faces a continuously growing gap between the demand for air transportation and the capacity to meet that demand. Two key obstacles to bridging this gap are traffic delays due to en route severe-weather conditions and airport weather conditions. Lincoln Laboratory has been addressing these traffic delays and related safety problems under the Federal Aviation Administration’s (FAA) Aviation Weather Research Program. Our research efforts involve real-time prototype forecast systems that provide immediate benefits to the FAA by allowing traffic managers to safely reduce delay. The prototypes also show the way toward bringing innovative applied meteorological research to future FAA operational capabilities. This article describes the recent major accomplishments of the Convective Weather and the Terminal Ceiling and Visibility Product Development Teams, both of which are led by scientists at Lincoln Laboratory.
The ability to provide accurate weather
forecasts to air traffic managers and controllers plays a very important role in assuring that the
nation’s airliner flights will remain safe and on sched-ule. Lincoln Laboratory has been pursuing these goals as part of the Federal Aviation Administration’s (FAA) Aviation Weather Research Program (AWRP) since it began formally in 1997. The AWRP is organized into different collaborative product development teams (PDT), with Lincoln Laboratory taking the lead on the Convective Weather (CW) PDT (led by Marilyn M. Wolfson) and the Terminal Ceiling and Visibility (TC&V) PDT (led by David A. Clark). In this ar-ticle, we provide a summary of our accomplishments on these teams and the operational products that have been developed over the last decade.
Historically, Lincoln Laboratory has been very concerned with weather-related safety in the terminal area, beginning with our work on the Terminal Dop-pler Weather Radar (TDWR) [1], designed to sense hazardous low-altitude wind shear, and continuing with the development of automatic, reliable, real-time wind-shear detection algorithms [2, 3]. By working
with the airport traffic control supervisors at sever-al airports, the FAA recognized the need for a more comprehensive picture of weather in and around the terminal areas. The Integrated Terminal Weather Sys-tem (ITWS) [4] was designed to fill this need, com-bining the wind-shear and gust-front detections from the TDWR with long-range weather radar depictions and storm-motion vectors from the Next-Generation Weather Radars (NEXRAD) associated with the Na-tional Weather Service (NWS), the FAA, and the De-partment of Defense. It became clear that in addition to helping on the safety side, ITWS was actually help-ing manage the tactical maneuvering that results when unforecasted thunderstorms occur. The Corridor Inte-grated Weather System (CIWS) [5] concept explora-tion demonstration was fielded when it became clear that terminal operations in the Northeast actually stretched over several states and covered both en route and terminal airspace in a busy corridor configuration, as shown in Figure 1.
Convective Weather forecasts
Strategic air traffic planning takes place daily in the
• Wolfson and ClarkAdvanced Aviation Weather Forecasts
32 LINCOLN LABORATORY JOURNAL VOLUME 16, NUMBER 1, 2006
50° N
120° W 110° W 100° W 90° W 80° W 70° W
40° N
30° N
Number of aircraft
0 20 40 60 80 100
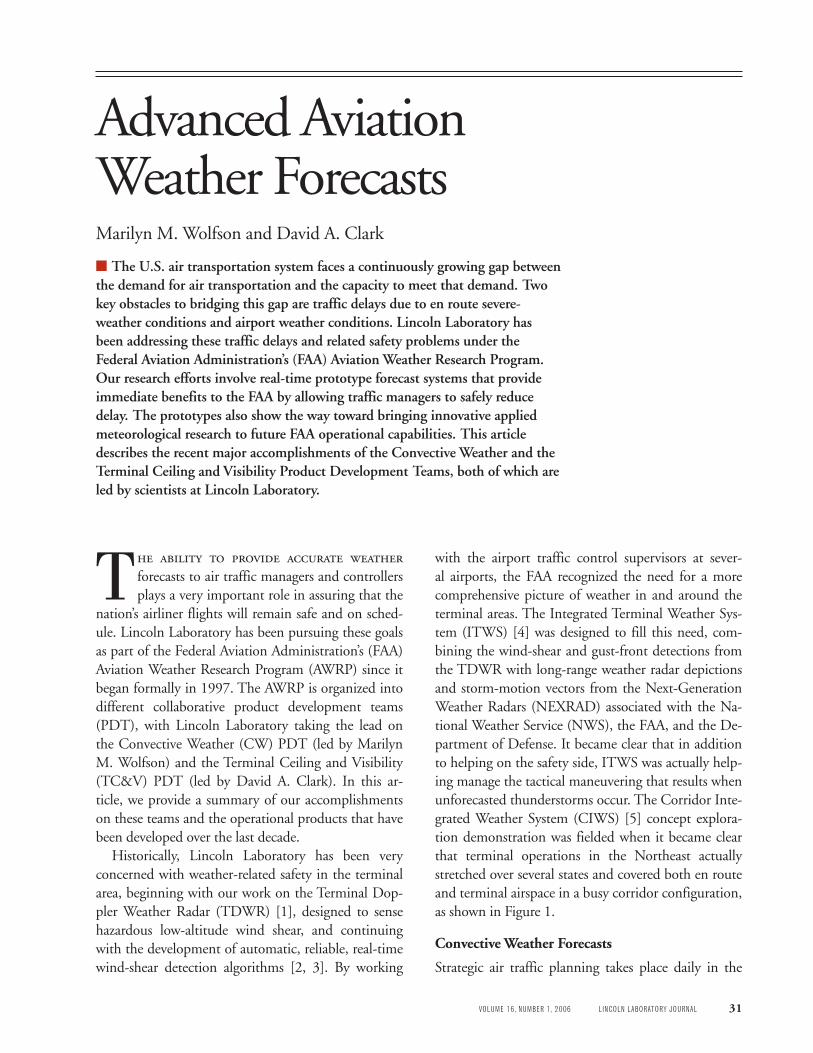
FIGURE 1. Fair-weather air traffic density, illustrating the geographic component of the delay problem. Most of the air traffic occurs primarily in a triangle formed by Chicago, Boston, and Atlanta, with extreme density over New York. The density scale is the number of aircraft en route in a twenty-four-hour period.
National Airspace System (NAS) and two-to-six-hour forecasts are utilized, but these early plans remain unaltered in only the most predictable of convective weather scenarios. More typically, traffic flow manag-ers at the Air Traffic Control System Command Cen-ter and the Air Route Traffic Control Centers (ART-CC) together with airline dispatchers help flights to utilize jet routes that remain available within regions of convection, or facilitate major reroutes around con-vection, according to the available playbook routes. For this tactical routing in the presence of convective weather to work, the FAA recognized that both a pre-cise and a timely shared picture of current weather is required, as well as an accurate, reliable, short-term zero-to-two-hour forecast. Figure 2 illustrates the cru-cial need for such forecasts to help reduce the system-wide and airport-specific delays that are so prevalent in the summer months. This is especially important as the economy grows, traffic demands approach full ca-pacity at the pacing airports, and more jets, including regional jets, seek to utilize the same en route jetways.
In this article we describe the most recent version of the zero-to-two-hour convective weather forecast (CWF) algorithm. Previous versions are currently be-ing utilized in the ITWS (one-hour version [6]) and the CIWS (two-hour version [7, 8]) proof-of-concept demonstrations. Some of this forecast technology is also being utilized in the National Convective Weather Forecast (NCWF) run at the Aviation Weather Center [9], in the NCAR Auto-nowcaster [10], and in various private-vendor forecast systems.
Tactical Zero-to-Two-Hour Convective Weather forecast algorithm
The tactical zero-to-two-hour CWF algorithm is fun-damentally a multiscale storm-tracking algorithm that internally determines the type and strength of existing storms—their motion, their growth and decay trends, and the locations of new storm initiation—and fore-casts their evolution on the basis of models developed from thunderstorm case studies. A schematic over-view of the CWF algorithm processing is presented in
• Wolfson and ClarkAdvanced Aviation Weather Forecasts
VOLUME 16, NUMBER 1, 2006 LINCOLN LABORATORY JOURNAL 33
0
10
20
30
40
50
60
70
Jan Feb Mar Apr May Jun Jul Aug Sep Oct Nov Dec
Tota
l del
ays
(tho
usan
ds)
Convectiveseason
Number of weather delays
Month
2005200420032002
2001200019991998
Causes of NAS delays in 2004
Other 5%
Closed runway 4%Equipment 1%
Volume14%
Weather76%
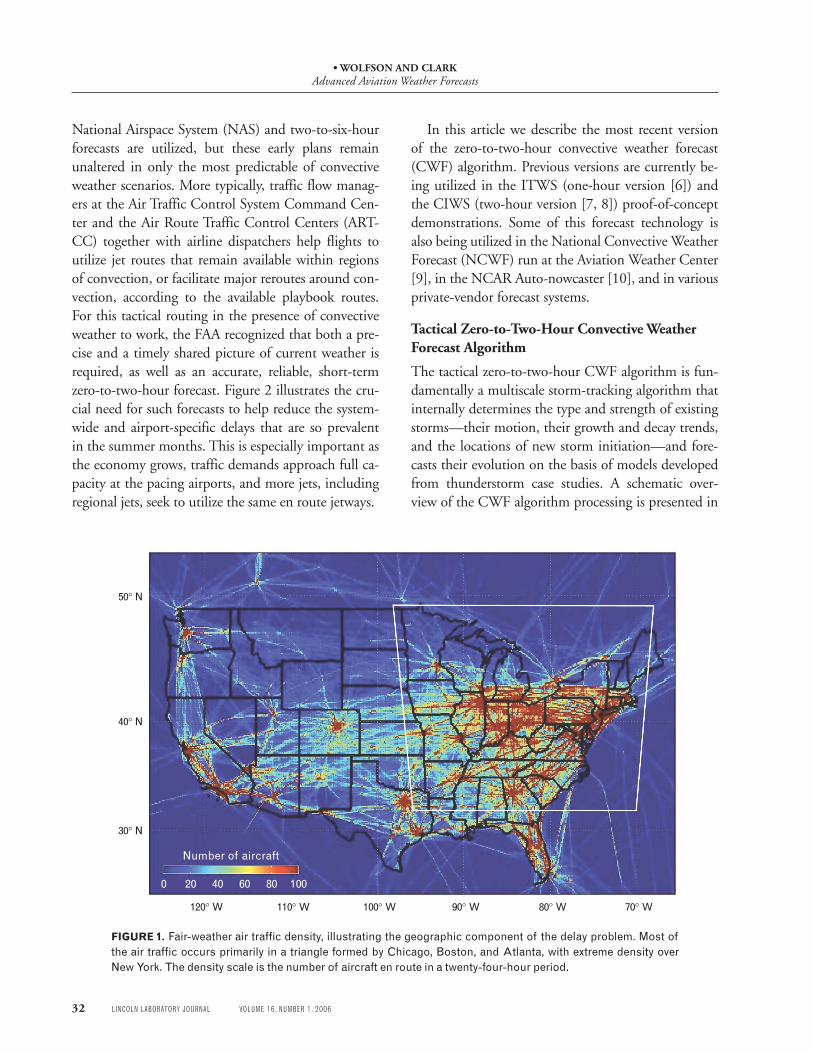
FIGURE 2. Aviation delay problem. Weather delay statistics illustrating (a) causes of National Airspace System (NAS) delays (notice that three-fourths of the aviation delays are due to weather), and (b) the an-nual pattern of weather delays as a function of month of the year for the last eight years. Note that most of weather delays occur during the convective season.
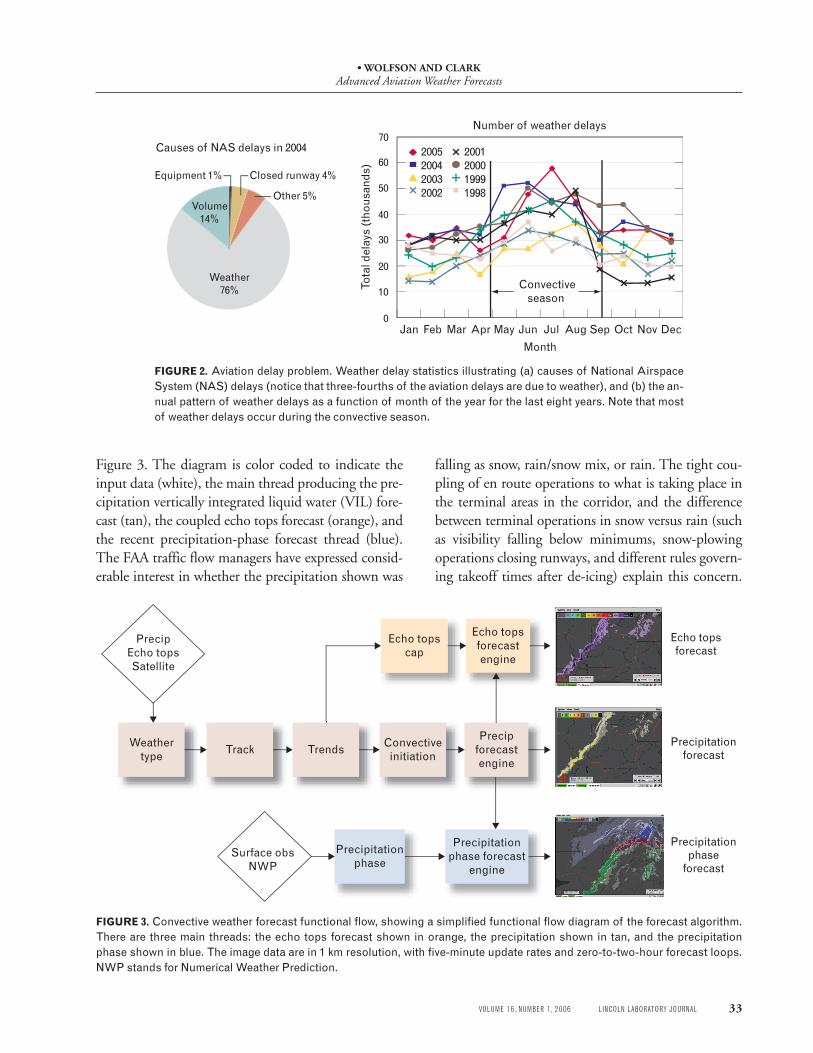
Figure 3. The diagram is color coded to indicate the input data (white), the main thread producing the pre-cipitation vertically integrated liquid water (VIL) fore-cast (tan), the coupled echo tops forecast (orange), and the recent precipitation-phase forecast thread (blue). The FAA traffic flow managers have expressed consid-erable interest in whether the precipitation shown was
falling as snow, rain/snow mix, or rain. The tight cou-pling of en route operations to what is taking place in the terminal areas in the corridor, and the difference between terminal operations in snow versus rain (such as visibility falling below minimums, snow-plowing operations closing runways, and different rules govern-ing takeoff times after de-icing) explain this concern.
FIGURE 3. Convective weather forecast functional flow, showing a simplified functional flow diagram of the forecast algorithm. There are three main threads: the echo tops forecast shown in orange, the precipitation shown in tan, and the precipitation phase shown in blue. The image data are in 1 km resolution, with five-minute update rates and zero-to-two-hour forecast loops. NWP stands for Numerical Weather Prediction.
Echo topsforecast
Precipitationforecast
Precipitationphase
forecast
Echo topscap
Precipitationphase forecast
engine
Precipitationphase
PrecipEcho topsSatellite
Echo topsforecastengine
Weathertype
Track TrendsConvective
initiation
Surface obsNWP
Precipforecastengine
• Wolfson and ClarkAdvanced Aviation Weather Forecasts
34 LINCOLN LABORATORY JOURNAL VOLUME 16, NUMBER 1, 2006
This precipitation-phase forecast has been a collabora-tive development effort between the CW and TC&V teams, and is discussed again later.
Input Data
Currently the algorithm handles input from the NEXRAD, the TDWR, and the Canadian network of pencil-beam radars. The initial work of the Convec-tive team pioneered the use of high-resolution VIL as a more proportionate representation of the convective precipitation hazard to aviation than the previously used quantities such as composite reflectivity [11] or base reflectivity [12]. We also provided an improved, high-resolution version of radar echo tops that has proven extremely important to en route decision mak-ing [13]. The FAA was able to insert the new high-resolution products into the NEXRAD Open Radar Products Generator, thus making them available as
NEXRAD products for potential use in legacy opera-tional NWS and FAA weather systems [14]. Not de-picted in Figure 3 are a series of data-quality editing steps executed to eliminate clutter and point targets in the radar data before algorithm processing occurs. In addition to radar data, geostationary satellite data (visible and infrared bands); surface observations of winds, temperature, and dew point; and numerical weather prediction model data are incorporated into the algorithm.
Weather Type
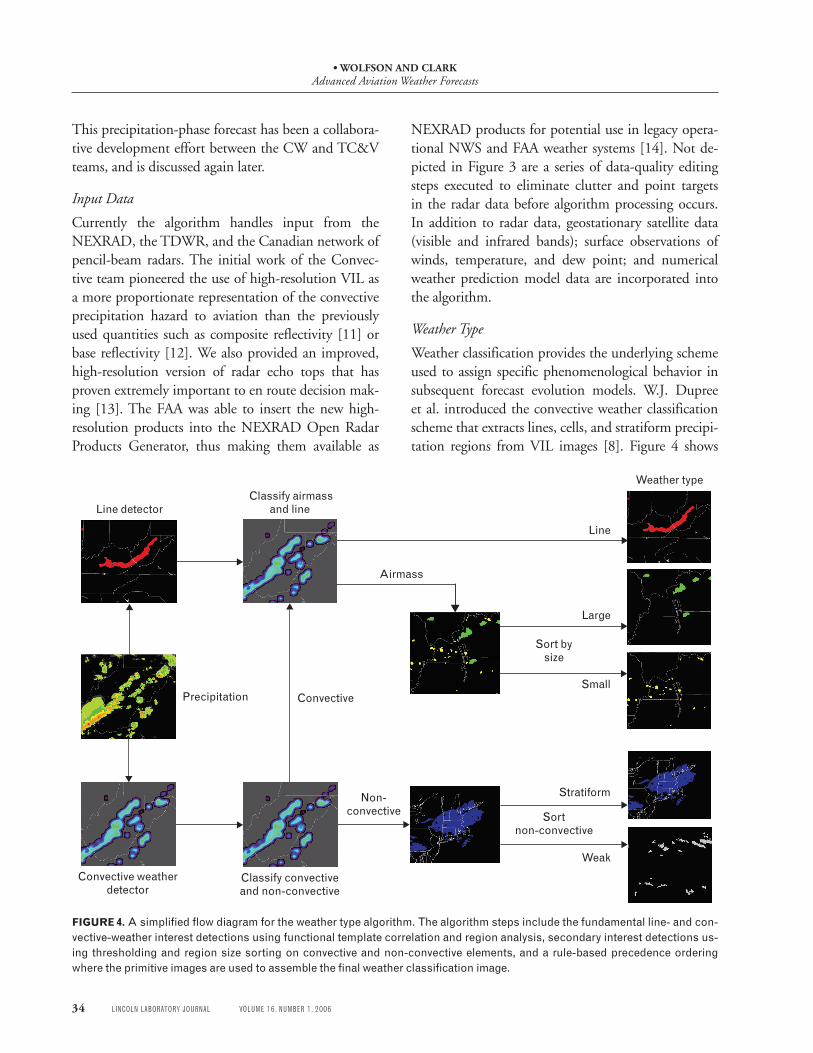
Weather classification provides the underlying scheme used to assign specific phenomenological behavior in subsequent forecast evolution models. W.J. Dupree et al. introduced the convective weather classification scheme that extracts lines, cells, and stratiform precipi-tation regions from VIL images [8]. Figure 4 shows
Convective weatherdetector
Classify convective and non-convective
Sortnon-convective
Line detectorClassify airmass
and line
Weather type
Sort bysize
ConvectivePrecipitation
Airmass
Non-convective
Line
Large
Stratiform
Weak
Small
FIGURE 4. A simplified flow diagram for the weather type algorithm. The algorithm steps include the fundamental line- and con-vective-weather interest detections using functional template correlation and region analysis, secondary interest detections us-ing thresholding and region size sorting on convective and non-convective elements, and a rule-based precedence ordering where the primitive images are used to assemble the final weather classification image.
• Wolfson and ClarkAdvanced Aviation Weather Forecasts
VOLUME 16, NUMBER 1, 2006 LINCOLN LABORATORY JOURNAL 35
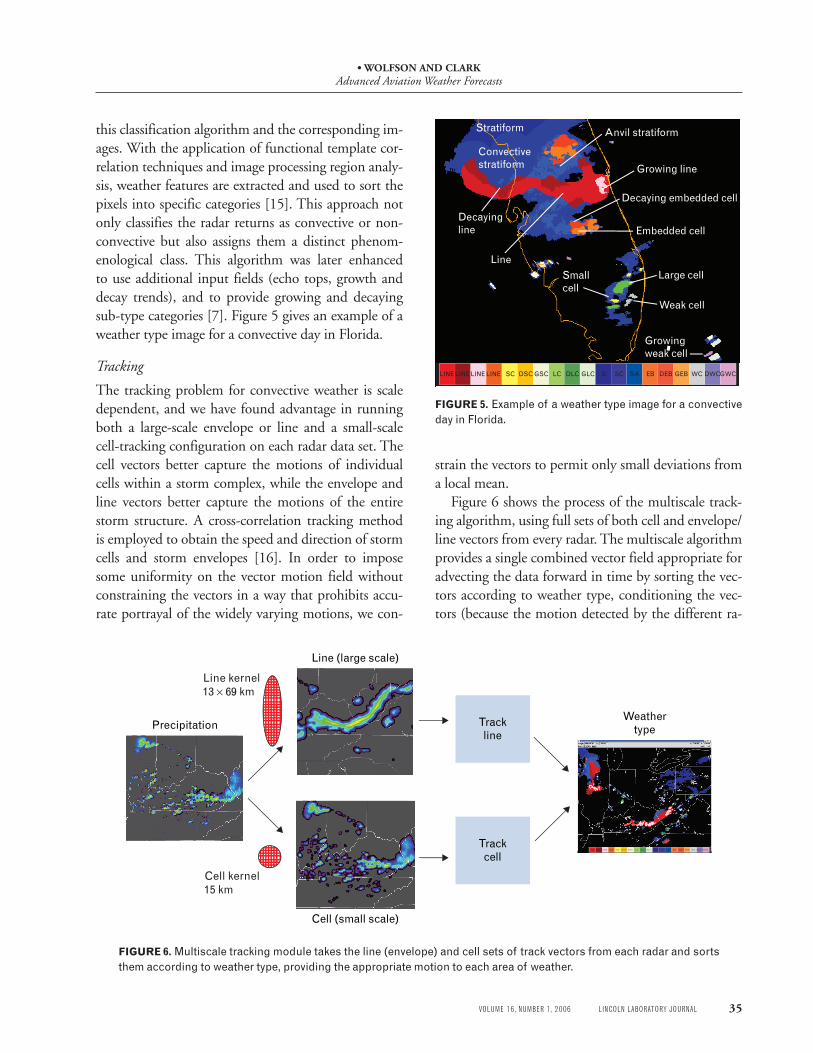
this classification algorithm and the corresponding im-ages. With the application of functional template cor-relation techniques and image processing region analy-sis, weather features are extracted and used to sort the pixels into specific categories [15]. This approach not only classifies the radar returns as convective or non-convective but also assigns them a distinct phenom-enological class. This algorithm was later enhanced to use additional input fields (echo tops, growth and decay trends), and to provide growing and decaying sub-type categories [7]. Figure 5 gives an example of a weather type image for a convective day in Florida.
Tracking
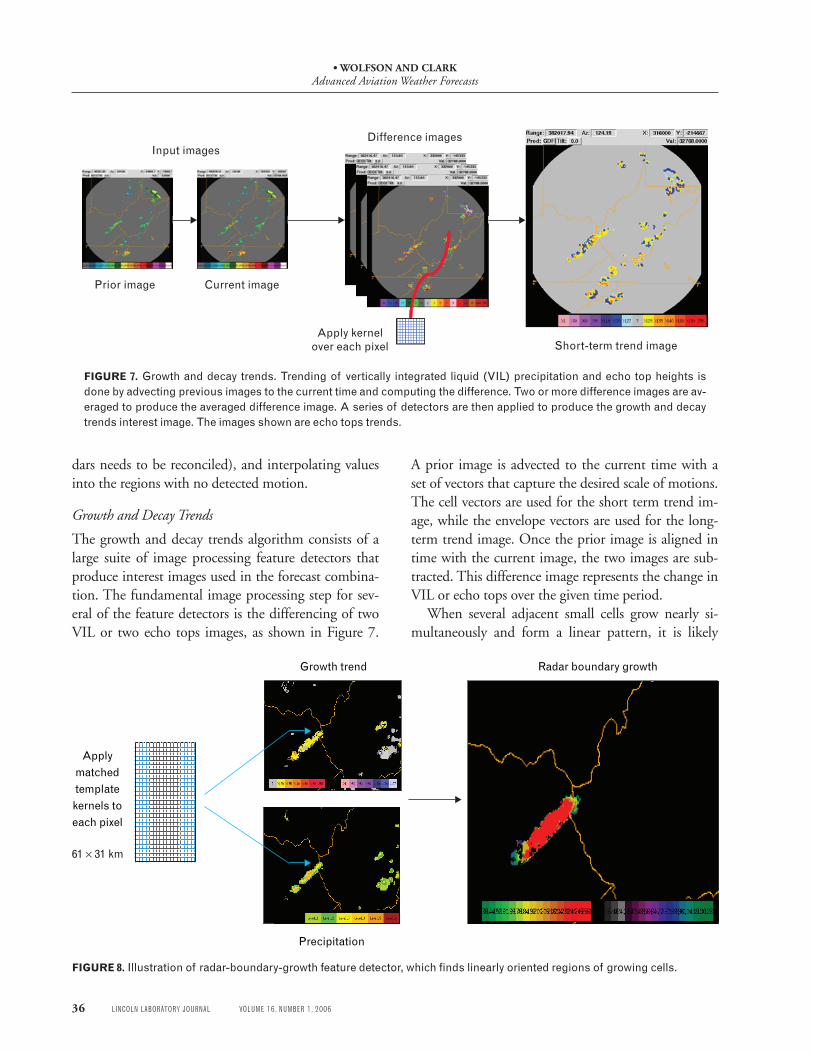
The tracking problem for convective weather is scale dependent, and we have found advantage in running both a large-scale envelope or line and a small-scale cell-tracking configuration on each radar data set. The cell vectors better capture the motions of individual cells within a storm complex, while the envelope and line vectors better capture the motions of the entire storm structure. A cross-correlation tracking method is employed to obtain the speed and direction of storm cells and storm envelopes [16]. In order to impose some uniformity on the vector motion field without constraining the vectors in a way that prohibits accu-rate portrayal of the widely varying motions, we con-
Decayingline
Growing line
Weak cell
Convectivestratiform
Large cellSmallcell
Embedded cell
Anvil stratiform
Growingweak cell
Decaying embedded cell
Stratiform
SC DEBEBSA GWCDWCWCGEBGLCGSCDSCSCLINELINE LINE LINE LC DLC S
Line
FIGURE 5. Example of a weather type image for a convective day in Florida.
Weathertype
Trackline
Trackcell
Precipitation
Cell (small scale)
Line (large scale)
Line kernel13 × 69 km
Cell kernel15 km
SC DEBEBSA GWCDWCWCGEBGLCGSCDSCSCLINELINE LINE LINE LC DLC S
FIGURE 6. Multiscale tracking module takes the line (envelope) and cell sets of track vectors from each radar and sorts them according to weather type, providing the appropriate motion to each area of weather.
strain the vectors to permit only small deviations from a local mean.
Figure 6 shows the process of the multiscale track-ing algorithm, using full sets of both cell and envelope/line vectors from every radar. The multiscale algorithm provides a single combined vector field appropriate for advecting the data forward in time by sorting the vec-tors according to weather type, conditioning the vec-tors (because the motion detected by the different ra-
• Wolfson and ClarkAdvanced Aviation Weather Forecasts
36 LINCOLN LABORATORY JOURNAL VOLUME 16, NUMBER 1, 2006
dars needs to be reconciled), and interpolating values into the regions with no detected motion.
Growth and Decay Trends
The growth and decay trends algorithm consists of a large suite of image processing feature detectors that produce interest images used in the forecast combina-tion. The fundamental image processing step for sev-eral of the feature detectors is the differencing of two VIL or two echo tops images, as shown in Figure 7.
A prior image is advected to the current time with a set of vectors that capture the desired scale of motions. The cell vectors are used for the short term trend im-age, while the envelope vectors are used for the long-term trend image. Once the prior image is aligned in time with the current image, the two images are sub-tracted. This difference image represents the change in VIL or echo tops over the given time period.
When several adjacent small cells grow nearly si-multaneously and form a linear pattern, it is likely
Input images
Prior image Current image
Difference images
Apply kernelover each pixel Short-term trend image
FIGURE 7. Growth and decay trends. Trending of vertically integrated liquid (VIL) precipitation and echo top heights is done by advecting previous images to the current time and computing the difference. Two or more difference images are av-eraged to produce the averaged difference image. A series of detectors are then applied to produce the growth and decay trends interest image. The images shown are echo tops trends.
Precipitation
Growth trend Radar boundary growth
Applymatchedtemplatekernels toeach pixel
61 × 31 km
FIGURE 8. Illustration of radar-boundary-growth feature detector, which finds linearly oriented regions of growing cells.
• Wolfson and ClarkAdvanced Aviation Weather Forecasts
VOLUME 16, NUMBER 1, 2006 LINCOLN LABORATORY JOURNAL 37
there is some surface boundary or frontal forcing taking place. Figure 8 shows this special case, which when observed usually warrants fairly aggressive and rapid growth of the cells into a line storm. By assess-ing the short-term trend and the current VIL images, the boundary growth feature detector returns an in-terest image that represents regions of linearly aligned growth.
Convective Initiation
The initiation of new convection is one of the most difficult challenges in short-term CWF. Because no amount of tracking or trending of the current radar data will help predict new growth, new information sources must be brought to bear on the problem. Nu-merical weather prediction models will some day be the best way to make forecasts, but they suffer at the moment from being computationally demanding and expensive to run with the techniques and resolutions
required, while still providing no improvement in forecast performance over the type of heuristic system described here, at least in the zero-to-two-hour forecast time frame [17]. The visible geostationary satellite data can be very helpful in depicting (in daylight hours) small clouds before they become large thunderstorms, and trends in the infrared bands can pick up the cloud top cooling associated with early storm growth [18]. Also valuable is an indication of where the surface cold and warm fronts are in the atmosphere, since convec-tion tends to organize along these lines [19]. Finally, knowledge of the environmental winds, temperature, moisture, and overall stability is essential in determin-ing whether or not convection will take place.
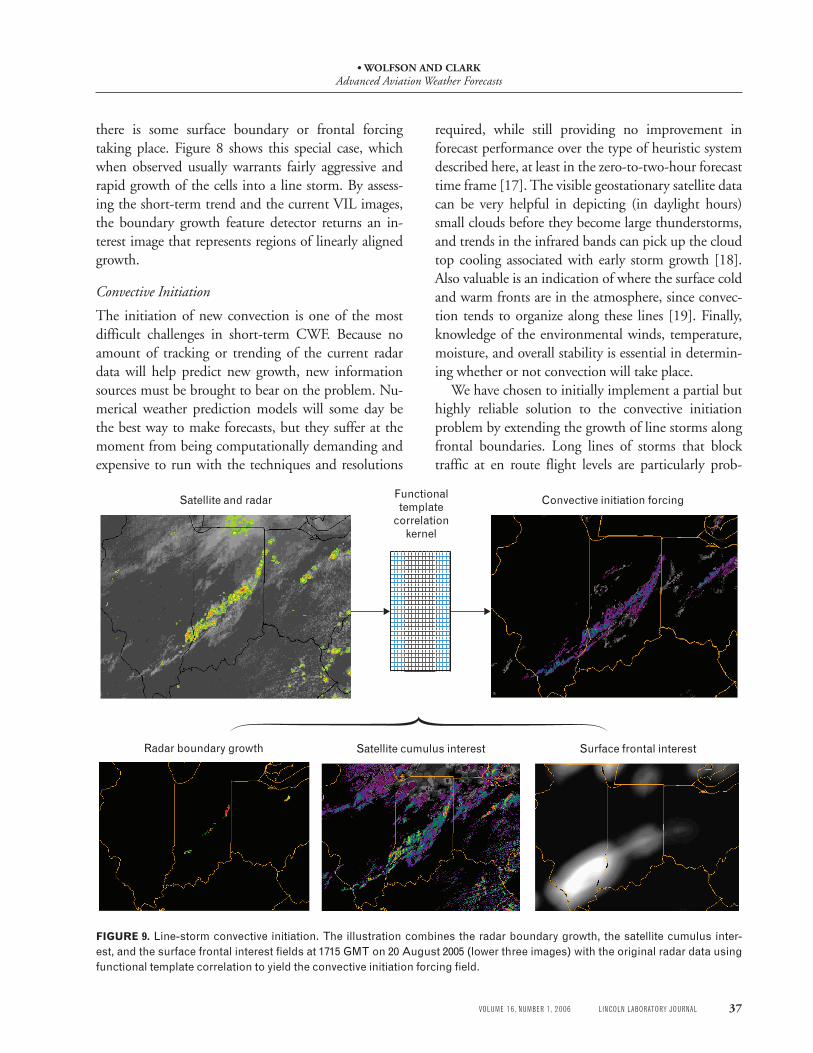
We have chosen to initially implement a partial but highly reliable solution to the convective initiation problem by extending the growth of line storms along frontal boundaries. Long lines of storms that block traffic at en route flight levels are particularly prob-
FIGURE 9. Line-storm convective initiation. The illustration combines the radar boundary growth, the satellite cumulus inter-est, and the surface frontal interest fields at 1715 GMT on 20 August 2005 (lower three images) with the original radar data using functional template correlation to yield the convective initiation forcing field.
Radar boundary growth Satellite cumulus interest Surface frontal interest
Functionaltemplate
correlationkernel
Convective initiation forcingSatellite and radar
• Wolfson and ClarkAdvanced Aviation Weather Forecasts
38 LINCOLN LABORATORY JOURNAL VOLUME 16, NUMBER 1, 2006
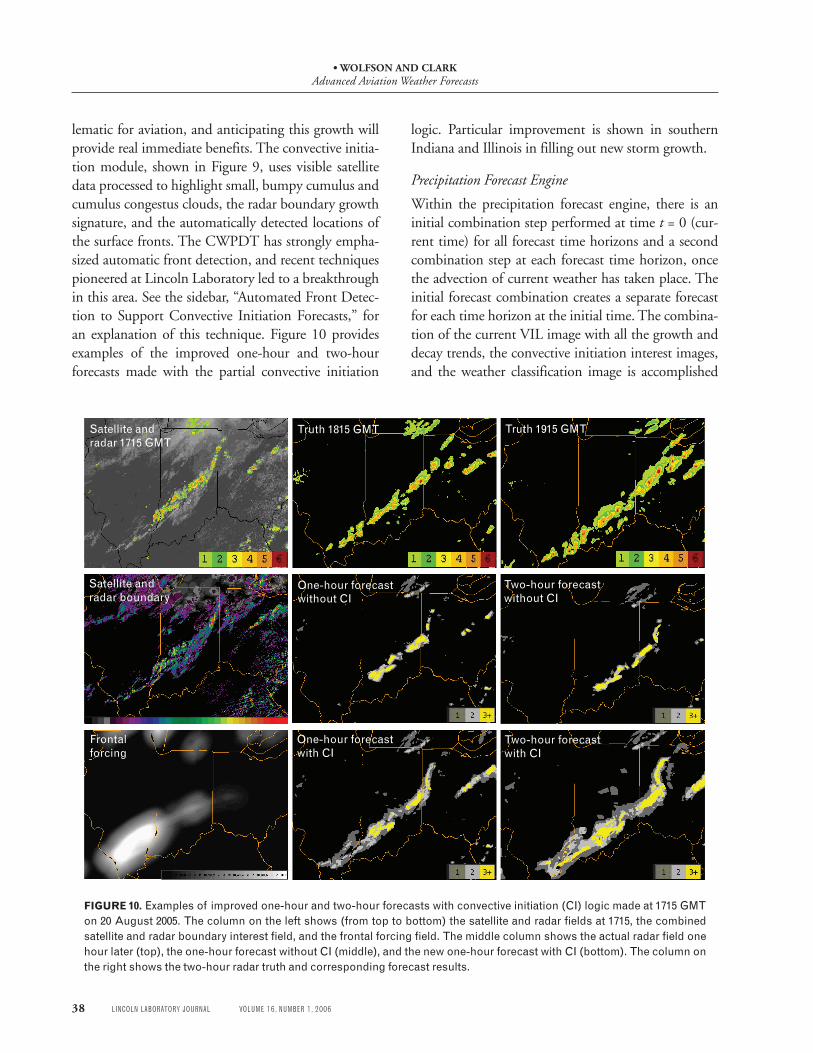
lematic for aviation, and anticipating this growth will provide real immediate benefits. The convective initia-tion module, shown in Figure 9, uses visible satellite data processed to highlight small, bumpy cumulus and cumulus congestus clouds, the radar boundary growth signature, and the automatically detected locations of the surface fronts. The CWPDT has strongly empha-sized automatic front detection, and recent techniques pioneered at Lincoln Laboratory led to a breakthrough in this area. See the sidebar, “Automated Front Detec-tion to Support Convective Initiation Forecasts,” for an explanation of this technique. Figure 10 provides examples of the improved one-hour and two-hour forecasts made with the partial convective initiation
logic. Particular improvement is shown in southern Indiana and Illinois in filling out new storm growth.
Precipitation Forecast Engine
Within the precipitation forecast engine, there is an initial combination step performed at time t = 0 (cur-rent time) for all forecast time horizons and a second combination step at each forecast time horizon, once the advection of current weather has taken place. The initial forecast combination creates a separate forecast for each time horizon at the initial time. The combina-tion of the current VIL image with all the growth and decay trends, the convective initiation interest images, and the weather classification image is accomplished
FIGURE 10. Examples of improved one-hour and two-hour forecasts with convective initiation (CI) logic made at 1715 GMT on 20 August 2005. The column on the left shows (from top to bottom) the satellite and radar fields at 1715, the combined satellite and radar boundary interest field, and the frontal forcing field. The middle column shows the actual radar field one hour later (top), the one-hour forecast without CI (middle), and the new one-hour forecast with CI (bottom). The column on the right shows the two-hour radar truth and corresponding forecast results.
Satellite andradar 1715 GMT
Satellite andradar boundary
Frontalforcing
Truth 1915 GMT
Two-hour forecastwithout CI
Two-hour forecastwith CI
Truth 1815 GMT
One-hour forecastwithout CI
One-hour forecastwith CI
• Wolfson and ClarkAdvanced Aviation Weather Forecasts
VOLUME 16, NUMBER 1, 2006 LINCOLN LABORATORY JOURNAL 39
via one scoring function and one weighting function for each time horizon, weather class, and input inter-est image type. The CWF algorithm models of how storms of each type behave with time, given their mea-sured strength and growth/decay/initiation charac-teristics, are embodied in these scoring functions and weighting functions. The numerical values are based on statistical data from in-house case studies and from thunderstorm evolution behavior documented in the literature.
Following the initial forecast combination, each forecast is advected with the multiscale vectors to its corresponding time horizon. As the storm moves, it may encounter different environmental stability or surface-temperature conditions that can also influence convective growth and decay, so a final forecast combi-nation is also executed. Environmental stability is pro-vided by a combination of a surface-temperature and dew-point analysis and NWS numerical model out-put. At this second combination stage we also apply
spatial and temporal climatological forcing, to match the daily solar cycle and historic patterns and timing of convection over the domain.
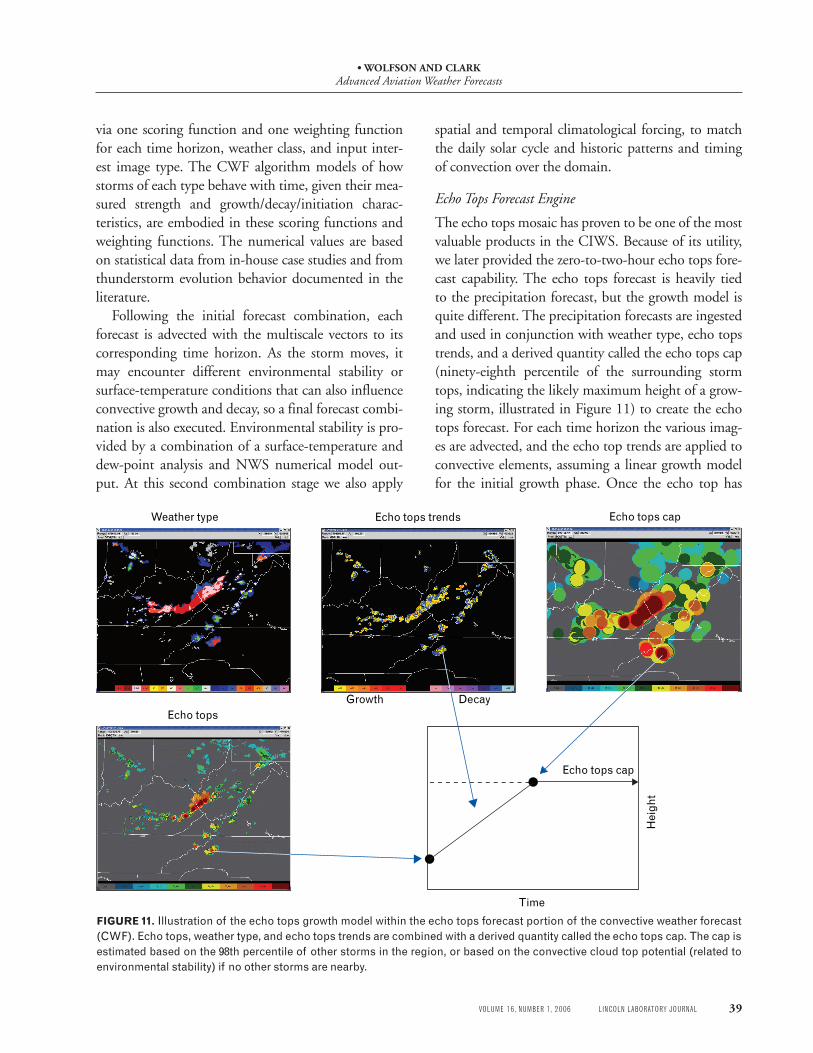
Echo Tops Forecast Engine
The echo tops mosaic has proven to be one of the most valuable products in the CIWS. Because of its utility, we later provided the zero-to-two-hour echo tops fore-cast capability. The echo tops forecast is heavily tied to the precipitation forecast, but the growth model is quite different. The precipitation forecasts are ingested and used in conjunction with weather type, echo tops trends, and a derived quantity called the echo tops cap (ninety-eighth percentile of the surrounding storm tops, indicating the likely maximum height of a grow-ing storm, illustrated in Figure 11) to create the echo tops forecast. For each time horizon the various imag-es are advected, and the echo top trends are applied to convective elements, assuming a linear growth model for the initial growth phase. Once the echo top has
Growth Decay
Hei
ght
Time
Echo tops cap
Echo tops capEcho tops trends
Echo tops
Weather type
FIGURE 11. Illustration of the echo tops growth model within the echo tops forecast portion of the convective weather forecast (CWF). Echo tops, weather type, and echo tops trends are combined with a derived quantity called the echo tops cap. The cap is estimated based on the 98th percentile of other storms in the region, or based on the convective cloud top potential (related to environmental stability) if no other storms are nearby.
• Wolfson and ClarkAdvanced Aviation Weather Forecasts
40 LINCOLN LABORATORY JOURNAL VOLUME 16, NUMBER 1, 2006
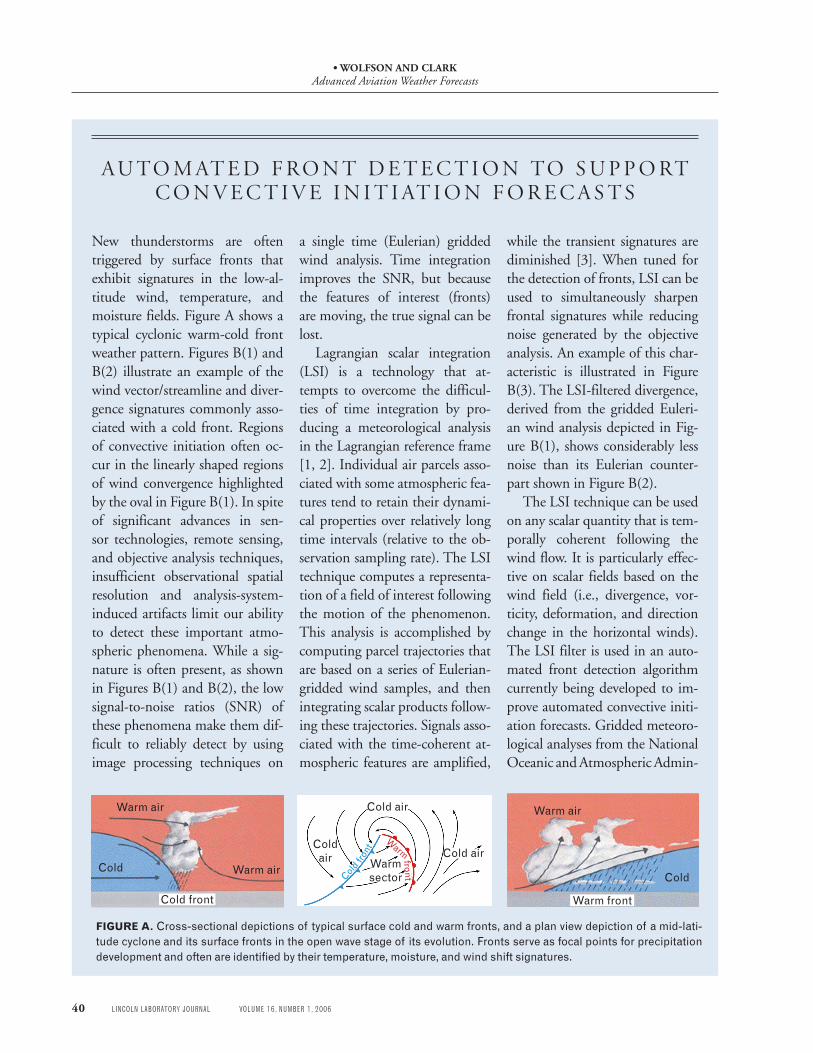
FIGURE A. Cross-sectional depictions of typical surface cold and warm fronts, and a plan view depiction of a mid-lati-tude cyclone and its surface fronts in the open wave stage of its evolution. Fronts serve as focal points for precipitation development and often are identified by their temperature, moisture, and wind shift signatures.
A u to m At e d F ro n t d e t e c t i o n to S u p p o rt c o n v e c t i v e i n i t i At i o n F o r e c A S t S
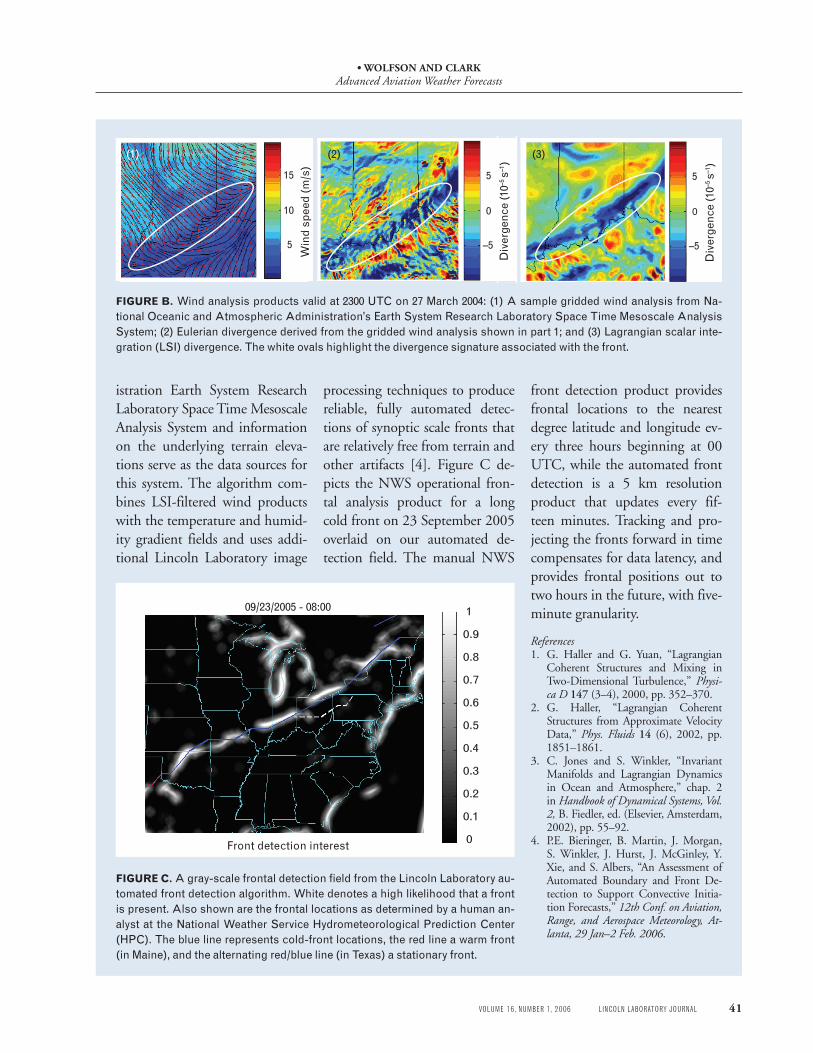
New thunderstorms are often triggered by surface fronts that exhibit signatures in the low-al-titude wind, temperature, and moisture fields. Figure A shows a typical cyclonic warm-cold front weather pattern. Figures B(1) and B(2) illustrate an example of the wind vector/streamline and diver-gence signatures commonly asso-ciated with a cold front. Regions of convective initiation often oc-cur in the linearly shaped regions of wind convergence highlighted by the oval in Figure B(1). In spite of significant advances in sen-sor technologies, remote sensing, and objective analysis techniques, insufficient observational spatial resolution and analysis-system-induced artifacts limit our ability to detect these important atmo-spheric phenomena. While a sig-nature is often present, as shown in Figures B(1) and B(2), the low signal-to-noise ratios (SNR) of these phenomena make them dif-ficult to reliably detect by using image processing techniques on
a single time (Eulerian) gridded wind analysis. Time integration improves the SNR, but because the features of interest (fronts) are moving, the true signal can be lost.
Lagrangian scalar integration (LSI) is a technology that at-tempts to overcome the difficul-ties of time integration by pro-ducing a meteorological analysis in the Lagrangian reference frame [1, 2]. Individual air parcels asso-ciated with some atmospheric fea-tures tend to retain their dynami-cal properties over relatively long time intervals (relative to the ob-servation sampling rate). The LSI technique computes a representa-tion of a field of interest following the motion of the phenomenon. This analysis is accomplished by computing parcel trajectories that are based on a series of Eulerian-gridded wind samples, and then integrating scalar products follow-ing these trajectories. Signals asso-ciated with the time-coherent at-mospheric features are amplified,
while the transient signatures are diminished [3]. When tuned for the detection of fronts, LSI can be used to simultaneously sharpen frontal signatures while reducing noise generated by the objective analysis. An example of this char-acteristic is illustrated in Figure B(3). The LSI-filtered divergence, derived from the gridded Euleri-an wind analysis depicted in Fig-ure B(1), shows considerably less noise than its Eulerian counter-part shown in Figure B(2).
The LSI technique can be used on any scalar quantity that is tem-porally coherent following the wind flow. It is particularly effec-tive on scalar fields based on the wind field (i.e., divergence, vor-ticity, deformation, and direction change in the horizontal winds). The LSI filter is used in an auto-mated front detection algorithm currently being developed to im-prove automated convective initi-ation forecasts. Gridded meteoro-logical analyses from the National Oceanic and Atmospheric Admin-
Coldair Cold air
Cold air
Warmsector
front
Cold
fron
t
Warm
Warm air
Cold
Warm front
Cold Warm air
Warm air
Cold front
• Wolfson and ClarkAdvanced Aviation Weather Forecasts
VOLUME 16, NUMBER 1, 2006 LINCOLN LABORATORY JOURNAL 41
istration Earth System Research Laboratory Space Time Mesoscale Analysis System and information on the underlying terrain eleva-tions serve as the data sources for this system. The algorithm com-bines LSI-filtered wind products with the temperature and humid-ity gradient fields and uses addi-tional Lincoln Laboratory image
processing techniques to produce reliable, fully automated detec-tions of synoptic scale fronts that are relatively free from terrain and other artifacts [4]. Figure C de-picts the NWS operational fron-tal analysis product for a long cold front on 23 September 2005 overlaid on our automated de-tection field. The manual NWS
front detection product provides frontal locations to the nearest degree latitude and longitude ev-ery three hours beginning at 00 UTC, while the automated front detection is a 5 km resolution product that updates every fif-teen minutes. Tracking and pro-jecting the fronts forward in time compensates for data latency, and provides frontal positions out to two hours in the future, with five-minute granularity.
References1. G. Haller and G. Yuan, “Lagrangian
Coherent Structures and Mixing in Two-Dimensional Turbulence,” Physi-ca D 147 (3–4), 2000, pp. 352–370.
2. G. Haller, “Lagrangian Coherent Structures from Approximate Velocity Data,” Phys. Fluids 14 (6), 2002, pp. 1851–1861.
3. C. Jones and S. Winkler, “Invariant Manifolds and Lagrangian Dynamics in Ocean and Atmosphere,” chap. 2 in Handbook of Dynamical Systems, Vol. 2, B. Fiedler, ed. (Elsevier, Amsterdam, 2002), pp. 55–92.
4. P.E. Bieringer, B. Martin, J. Morgan, S. Winkler, J. Hurst, J. McGinley, Y. Xie, and S. Albers, “An Assessment of Automated Boundary and Front De-tection to Support Convective Initia-tion Forecasts,” 12th Conf. on Aviation, Range, and Aerospace Meteorology, At-lanta, 29 Jan–2 Feb. 2006.
15
10
5
Win
d sp
eed
(m/s
)FIGURE B. Wind analysis products valid at 2300 UTC on 27 March 2004: (1) A sample gridded wind analysis from Na-tional Oceanic and Atmospheric Administration’s Earth System Research Laboratory Space Time Mesoscale Analysis System; (2) Eulerian divergence derived from the gridded wind analysis shown in part 1; and (3) Lagrangian scalar inte-gration (LSI) divergence. The white ovals highlight the divergence signature associated with the front.
5
0
–5
Div
erge
nce
(10–5
s–1
)
5
0
–5
Div
erge
nce
(10–5
s–1
)
FIGURE C. A gray-scale frontal detection field from the Lincoln Laboratory au-tomated front detection algorithm. White denotes a high likelihood that a front is present. Also shown are the frontal locations as determined by a human an-alyst at the National Weather Service Hydrometeorological Prediction Center (HPC). The blue line represents cold-front locations, the red line a warm front (in Maine), and the alternating red/blue line (in Texas) a stationary front.
09/23/2005 - 08:00
Front detection interest
1
0
0.1
0.2
0.3
0.4
0.5
0.6
0.7
0.8
0.9
(1) (2) (3)
• Wolfson and ClarkAdvanced Aviation Weather Forecasts
42 LINCOLN LABORATORY JOURNAL VOLUME 16, NUMBER 1, 2006
grown to the echo top cap, the top is held at this level for all future forecast time horizons. For the remaining non-convective weather types, the existing echo tops are advected without change. As a final step, the echo tops forecast is matched to the precipitation forecast via dilation, if necessary.
Precipitation-Phase Forecast Engine
The ability to see a forecast in the winter, and to know whether the precipitation would impact the terminals as snow, rain, or mixed precipitation, turns out to be very important to en route traffic management. Inclu-sion of the surface observations (e.g., winds, pressure, temperature, dew point, and precipitation type) is es-sential to this problem, as it is to the problem of auto-matically detecting the surface fronts and estimating
the environmental stability. Lincoln Laboratory has worked with the FAA to obtain real-time network ac-cess to one-minute-update surface observations from automated surface stations. The ability to forecast the precipitation phase at a terminal is closely related to the ability to forecast the changing visibility condi-tions, and the CW and TC&V teams have worked closely on its development.
Convective Weather Forecast Display
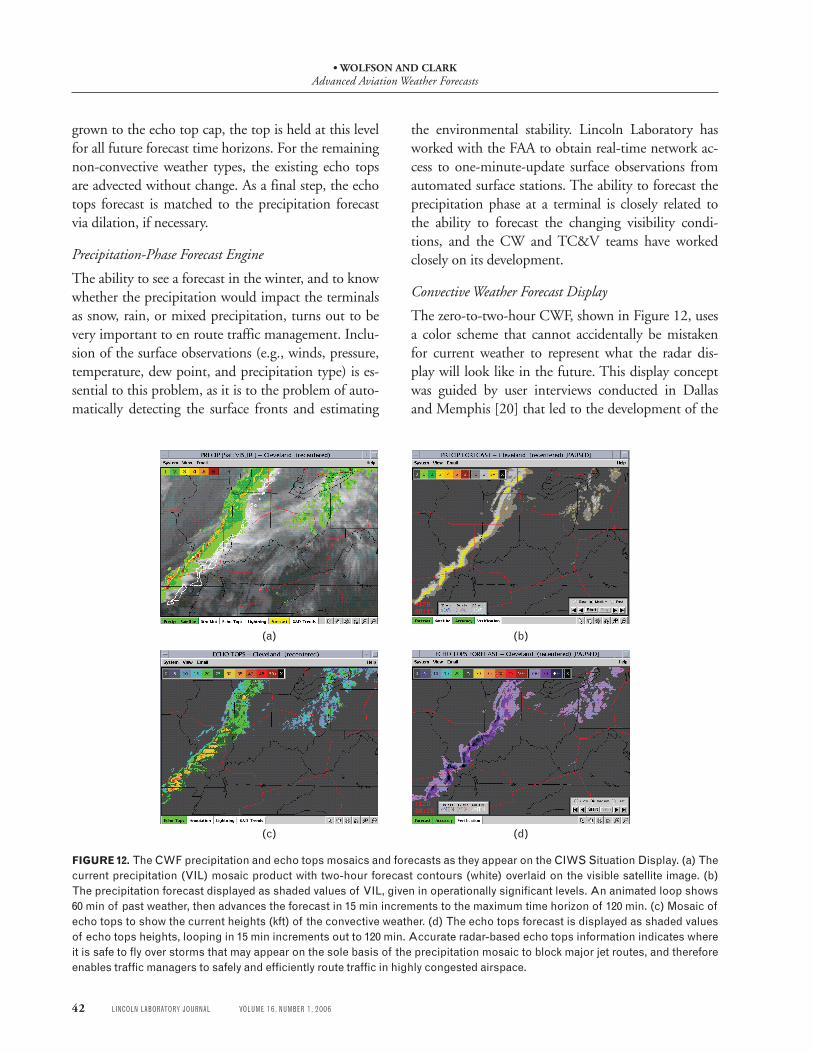
The zero-to-two-hour CWF, shown in Figure 12, uses a color scheme that cannot accidentally be mistaken for current weather to represent what the radar dis-play will look like in the future. This display concept was guided by user interviews conducted in Dallas and Memphis [20] that led to the development of the
(a) (b)
(c) (d)
FIGURE 12. The CWF precipitation and echo tops mosaics and forecasts as they appear on the CIWS Situation Display. (a) The current precipitation (VIL) mosaic product with two-hour forecast contours (white) overlaid on the visible satellite image. (b) The precipitation forecast displayed as shaded values of VIL, given in operationally significant levels. An animated loop shows 60 min of past weather, then advances the forecast in 15 min increments to the maximum time horizon of 120 min. (c) Mosaic of echo tops to show the current heights (kft) of the convective weather. (d) The echo tops forecast is displayed as shaded values of echo tops heights, looping in 15 min increments out to 120 min. Accurate radar-based echo tops information indicates where it is safe to fly over storms that may appear on the sole basis of the precipitation mosaic to block major jet routes, and therefore enables traffic managers to safely and efficiently route traffic in highly congested airspace.
• Wolfson and ClarkAdvanced Aviation Weather Forecasts
VOLUME 16, NUMBER 1, 2006 LINCOLN LABORATORY JOURNAL 43
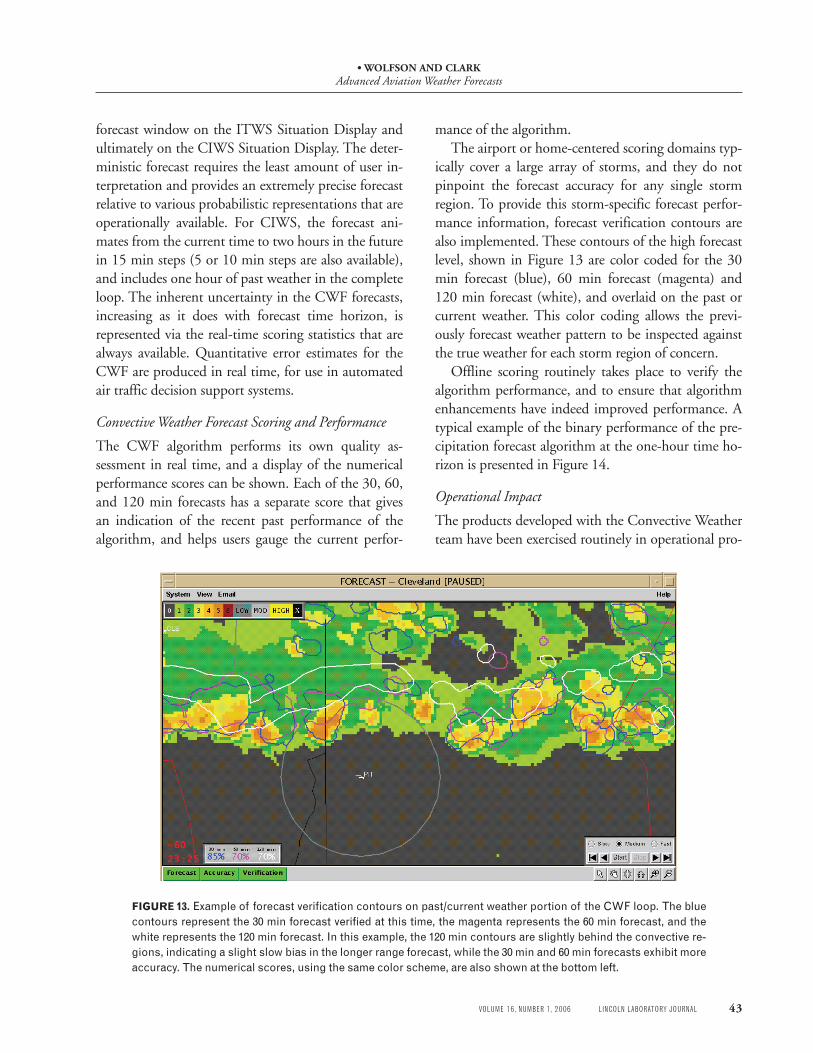
forecast window on the ITWS Situation Display and ultimately on the CIWS Situation Display. The deter-ministic forecast requires the least amount of user in-terpretation and provides an extremely precise forecast relative to various probabilistic representations that are operationally available. For CIWS, the forecast ani-mates from the current time to two hours in the future in 15 min steps (5 or 10 min steps are also available), and includes one hour of past weather in the complete loop. The inherent uncertainty in the CWF forecasts, increasing as it does with forecast time horizon, is represented via the real-time scoring statistics that are always available. Quantitative error estimates for the CWF are produced in real time, for use in automated air traffic decision support systems.
Convective Weather Forecast Scoring and Performance
The CWF algorithm performs its own quality as-sessment in real time, and a display of the numerical performance scores can be shown. Each of the 30, 60, and 120 min forecasts has a separate score that gives an indication of the recent past performance of the algorithm, and helps users gauge the current perfor-
mance of the algorithm.The airport or home-centered scoring domains typ-
ically cover a large array of storms, and they do not pinpoint the forecast accuracy for any single storm region. To provide this storm-specific forecast perfor-mance information, forecast verification contours are also implemented. These contours of the high forecast level, shown in Figure 13 are color coded for the 30 min forecast (blue), 60 min forecast (magenta) and 120 min forecast (white), and overlaid on the past or current weather. This color coding allows the previ-ously forecast weather pattern to be inspected against the true weather for each storm region of concern.
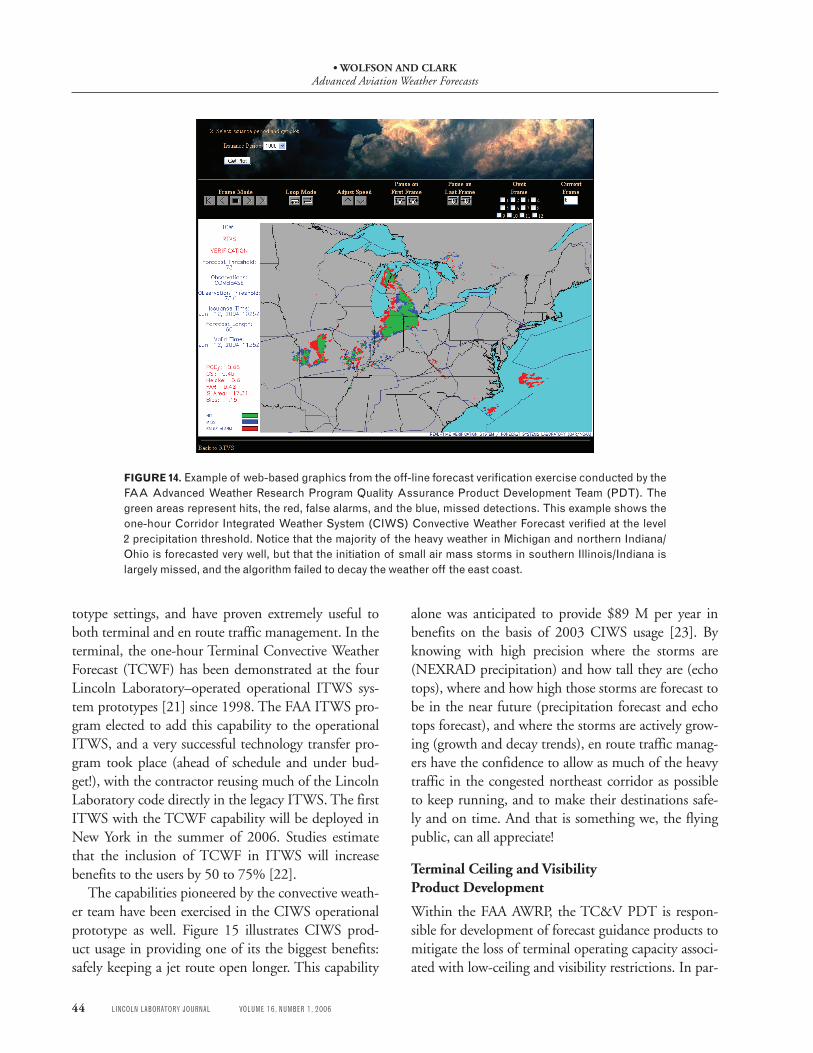
Offline scoring routinely takes place to verify the algorithm performance, and to ensure that algorithm enhancements have indeed improved performance. A typical example of the binary performance of the pre-cipitation forecast algorithm at the one-hour time ho-rizon is presented in Figure 14.
Operational Impact
The products developed with the Convective Weather team have been exercised routinely in operational pro-
FIGURE 13. Example of forecast verification contours on past/current weather portion of the CWF loop. The blue contours represent the 30 min forecast verified at this time, the magenta represents the 60 min forecast, and the white represents the 120 min forecast. In this example, the 120 min contours are slightly behind the convective re-gions, indicating a slight slow bias in the longer range forecast, while the 30 min and 60 min forecasts exhibit more accuracy. The numerical scores, using the same color scheme, are also shown at the bottom left.
• Wolfson and ClarkAdvanced Aviation Weather Forecasts
44 LINCOLN LABORATORY JOURNAL VOLUME 16, NUMBER 1, 2006
FIGURE 14. Example of web-based graphics from the off-line forecast verification exercise conducted by the FAA Advanced Weather Research Program Quality Assurance Product Development Team (PDT). The green areas represent hits, the red, false alarms, and the blue, missed detections. This example shows the one-hour Corridor Integrated Weather System (CIWS) Convective Weather Forecast verified at the level 2 precipitation threshold. Notice that the majority of the heavy weather in Michigan and northern Indiana/Ohio is forecasted very well, but that the initiation of small air mass storms in southern Illinois/Indiana is largely missed, and the algorithm failed to decay the weather off the east coast.
totype settings, and have proven extremely useful to both terminal and en route traffic management. In the terminal, the one-hour Terminal Convective Weather Forecast (TCWF) has been demonstrated at the four Lincoln Laboratory–operated operational ITWS sys-tem prototypes [21] since 1998. The FAA ITWS pro-gram elected to add this capability to the operational ITWS, and a very successful technology transfer pro-gram took place (ahead of schedule and under bud-get!), with the contractor reusing much of the Lincoln Laboratory code directly in the legacy ITWS. The first ITWS with the TCWF capability will be deployed in New York in the summer of 2006. Studies estimate that the inclusion of TCWF in ITWS will increase benefits to the users by 50 to 75% [22].
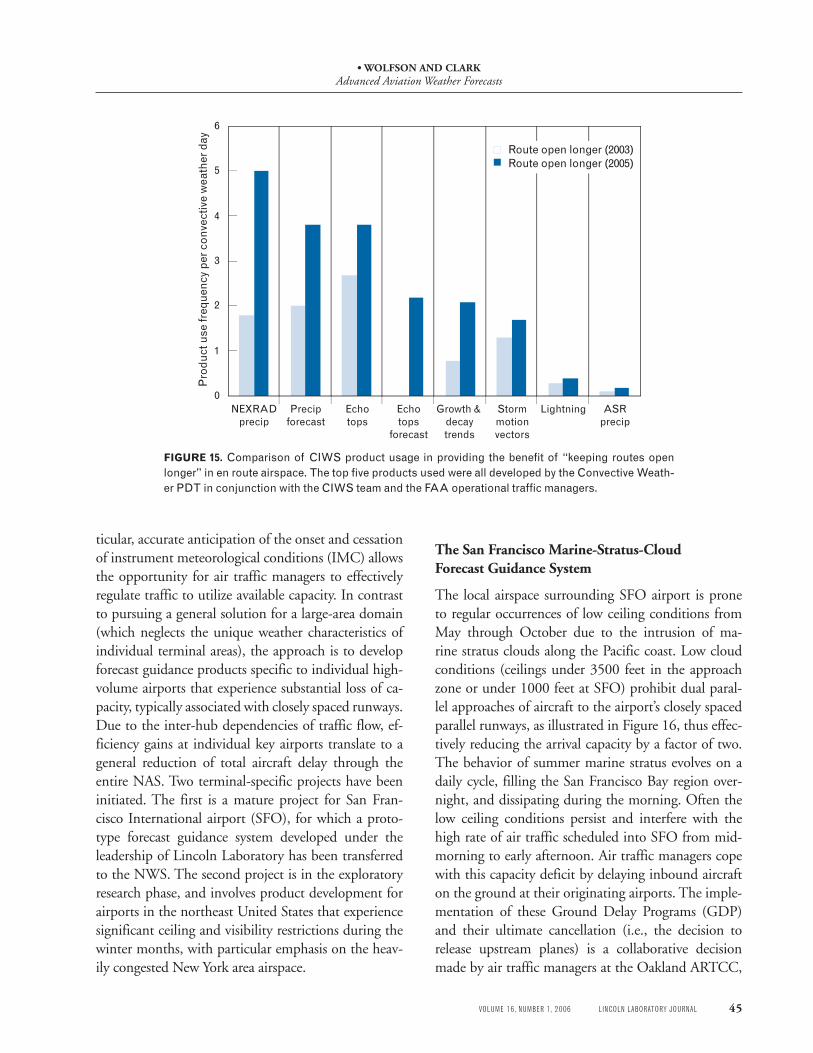
The capabilities pioneered by the convective weath-er team have been exercised in the CIWS operational prototype as well. Figure 15 illustrates CIWS prod-uct usage in providing one of its the biggest benefits: safely keeping a jet route open longer. This capability
alone was anticipated to provide $89 M per year in benefits on the basis of 2003 CIWS usage [23]. By knowing with high precision where the storms are (NEXRAD precipitation) and how tall they are (echo tops), where and how high those storms are forecast to be in the near future (precipitation forecast and echo tops forecast), and where the storms are actively grow-ing (growth and decay trends), en route traffic manag-ers have the confidence to allow as much of the heavy traffic in the congested northeast corridor as possible to keep running, and to make their destinations safe-ly and on time. And that is something we, the flying public, can all appreciate!
Terminal Ceiling and Visibility Product development
Within the FAA AWRP, the TC&V PDT is respon-sible for development of forecast guidance products to mitigate the loss of terminal operating capacity associ-ated with low-ceiling and visibility restrictions. In par-
• Wolfson and ClarkAdvanced Aviation Weather Forecasts
VOLUME 16, NUMBER 1, 2006 LINCOLN LABORATORY JOURNAL 45
0
1
2
3
4
5
6
Pro
duct
use
freq
uenc
y pe
r con
vect
ive
wea
ther
day
NEXRADprecip
Precipforecast
Echotops
Echotops
forecast
Growth & decaytrends
Stormmotionvectors
Lightning ASRprecip
Route open longer (2003)Route open longer (2005)
FIGURE 15. Comparison of CIWS product usage in providing the benefit of “keeping routes open longer” in en route airspace. The top five products used were all developed by the Convective Weath-er PDT in conjunction with the CIWS team and the FAA operational traffic managers.
ticular, accurate anticipation of the onset and cessation of instrument meteorological conditions (IMC) allows the opportunity for air traffic managers to effectively regulate traffic to utilize available capacity. In contrast to pursuing a general solution for a large-area domain (which neglects the unique weather characteristics of individual terminal areas), the approach is to develop forecast guidance products specific to individual high-volume airports that experience substantial loss of ca-pacity, typically associated with closely spaced runways. Due to the inter-hub dependencies of traffic flow, ef-ficiency gains at individual key airports translate to a general reduction of total aircraft delay through the entire NAS. Two terminal-specific projects have been initiated. The first is a mature project for San Fran-cisco International airport (SFO), for which a proto-type forecast guidance system developed under the leadership of Lincoln Laboratory has been transferred to the NWS. The second project is in the exploratory research phase, and involves product development for airports in the northeast United States that experience significant ceiling and visibility restrictions during the winter months, with particular emphasis on the heav-ily congested New York area airspace.
The san francisco Marine-stratus-Cloud forecast Guidance system
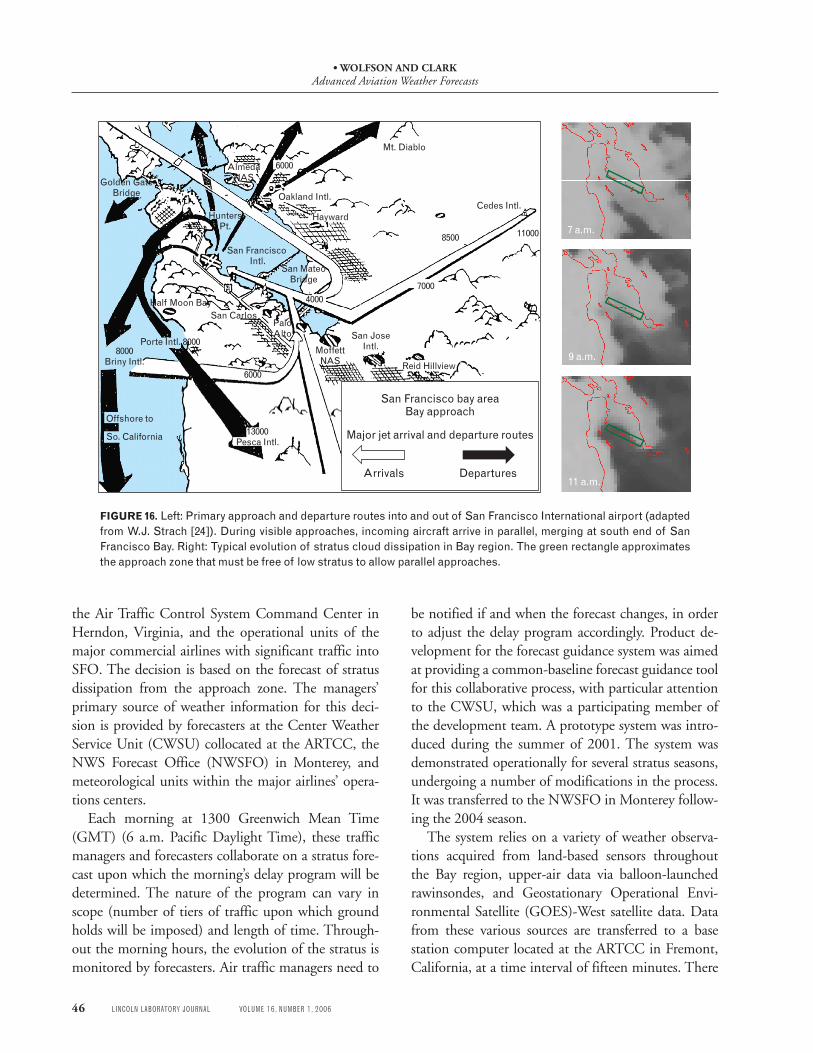
The local airspace surrounding SFO airport is prone to regular occurrences of low ceiling conditions from May through October due to the intrusion of ma-rine stratus clouds along the Pacific coast. Low cloud conditions (ceilings under 3500 feet in the approach zone or under 1000 feet at SFO) prohibit dual paral-lel approaches of aircraft to the airport’s closely spaced parallel runways, as illustrated in Figure 16, thus effec-tively reducing the arrival capacity by a factor of two. The behavior of summer marine stratus evolves on a daily cycle, filling the San Francisco Bay region over-night, and dissipating during the morning. Often the low ceiling conditions persist and interfere with the high rate of air traffic scheduled into SFO from mid-morning to early afternoon. Air traffic managers cope with this capacity deficit by delaying inbound aircraft on the ground at their originating airports. The imple-mentation of these Ground Delay Programs (GDP) and their ultimate cancellation (i.e., the decision to release upstream planes) is a collaborative decision made by air traffic managers at the Oakland ARTCC,
• Wolfson and ClarkAdvanced Aviation Weather Forecasts
46 LINCOLN LABORATORY JOURNAL VOLUME 16, NUMBER 1, 2006
Offshore to
So. California 13000Pesca Intl.
Golden GateBridge
HuntersPt.
6000
Oakland Intl.
Hayward
AlmedaNAS
Mt. Diablo
7000
110008500
Cedes Intl.
San MateoBridge
4000
San Francisco Intl.
San CarlosPaloAlto
8000Briny Intl.
6000
Porte Intl. 8000Moffett
NAS Reid Hillview
San JoseIntl.
Half Moon Bay
San Francisco bay areaBay approach
Major jet arrival and departure routes
Arrivals Departures
7 a.m.
9 a.m.
11 a.m.
FIGURE 16. Left: Primary approach and departure routes into and out of San Francisco International airport (adapted from W.J. Strach [24]). During visible approaches, incoming aircraft arrive in parallel, merging at south end of San Francisco Bay. Right: Typical evolution of stratus cloud dissipation in Bay region. The green rectangle approximates the approach zone that must be free of low stratus to allow parallel approaches.
the Air Traffic Control System Command Center in Herndon, Virginia, and the operational units of the major commercial airlines with significant traffic into SFO. The decision is based on the forecast of stratus dissipation from the approach zone. The managers’ primary source of weather information for this deci-sion is provided by forecasters at the Center Weather Service Unit (CWSU) collocated at the ARTCC, the NWS Forecast Office (NWSFO) in Monterey, and meteorological units within the major airlines’ opera-tions centers.
Each morning at 1300 Greenwich Mean Time (GMT) (6 a.m. Pacific Daylight Time), these traffic managers and forecasters collaborate on a stratus fore-cast upon which the morning’s delay program will be determined. The nature of the program can vary in scope (number of tiers of traffic upon which ground holds will be imposed) and length of time. Through-out the morning hours, the evolution of the stratus is monitored by forecasters. Air traffic managers need to
be notified if and when the forecast changes, in order to adjust the delay program accordingly. Product de-velopment for the forecast guidance system was aimed at providing a common-baseline forecast guidance tool for this collaborative process, with particular attention to the CWSU, which was a participating member of the development team. A prototype system was intro-duced during the summer of 2001. The system was demonstrated operationally for several stratus seasons, undergoing a number of modifications in the process. It was transferred to the NWSFO in Monterey follow-ing the 2004 season.
The system relies on a variety of weather observa-tions acquired from land-based sensors throughout the Bay region, upper-air data via balloon-launched rawinsondes, and Geostationary Operational Envi-ronmental Satellite (GOES)-West satellite data. Data from these various sources are transferred to a base station computer located at the ARTCC in Fremont, California, at a time interval of fifteen minutes. There
• Wolfson and ClarkAdvanced Aviation Weather Forecasts
VOLUME 16, NUMBER 1, 2006 LINCOLN LABORATORY JOURNAL 47
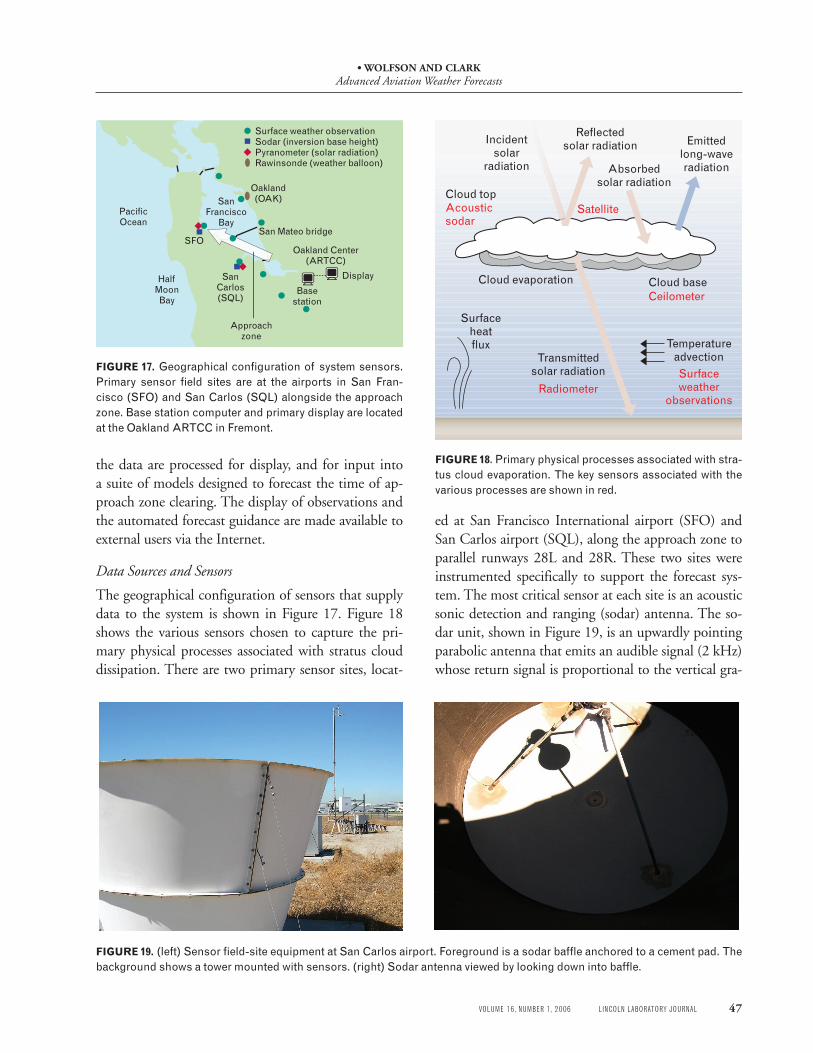
the data are processed for display, and for input into a suite of models designed to forecast the time of ap-proach zone clearing. The display of observations and the automated forecast guidance are made available to external users via the Internet.
Data Sources and Sensors
The geographical configuration of sensors that supply data to the system is shown in Figure 17. Figure 18 shows the various sensors chosen to capture the pri-mary physical processes associated with stratus cloud dissipation. There are two primary sensor sites, locat-
ed at San Francisco International airport (SFO) and San Carlos airport (SQL), along the approach zone to parallel runways 28L and 28R. These two sites were instrumented specifically to support the forecast sys-tem. The most critical sensor at each site is an acoustic sonic detection and ranging (sodar) antenna. The so-dar unit, shown in Figure 19, is an upwardly pointing parabolic antenna that emits an audible signal (2 kHz) whose return signal is proportional to the vertical gra-
PacificOcean
HalfMoonBay
SanFrancisco
Bay
SanCarlos(SQL)
Oakland(OAK)
Oakland Center(ARTCC)
Surface weather observationSodar (inversion base height)Pyranometer (solar radiation)Rawinsonde (weather balloon)
SFOSan Mateo bridge
Approachzone
Basestation
Display
Incidentsolar
radiation Absorbedsolar radiation
Reflectedsolar radiation
Satellite
Emittedlong-waveradiation
Acousticsodar
Cloud top
Cloud evaporation Cloud baseCeilometer
Surfaceheatflux
Transmittedsolar radiation
Radiometer
TemperatureadvectionSurfaceweather
observations
FIGURE 17. Geographical configuration of system sensors. Primary sensor field sites are at the airports in San Fran-cisco (SFO) and San Carlos (SQL) alongside the approach zone. Base station computer and primary display are located at the Oakland ARTCC in Fremont.
FIGURE 18. Primary physical processes associated with stra-tus cloud evaporation. The key sensors associated with the various processes are shown in red.
FIGURE 19. (left) Sensor field-site equipment at San Carlos airport. Foreground is a sodar baffle anchored to a cement pad. The background shows a tower mounted with sensors. (right) Sodar antenna viewed by looking down into baffle.
• Wolfson and ClarkAdvanced Aviation Weather Forecasts
48 LINCOLN LABORATORY JOURNAL VOLUME 16, NUMBER 1, 2006
1200 1300 1400 1500 1600 1700 1800
3000
2000
1000
0
Hei
ght (
ft)
Time (GMT)
SMB CeilingSQL Inversion baseOAK Inversion
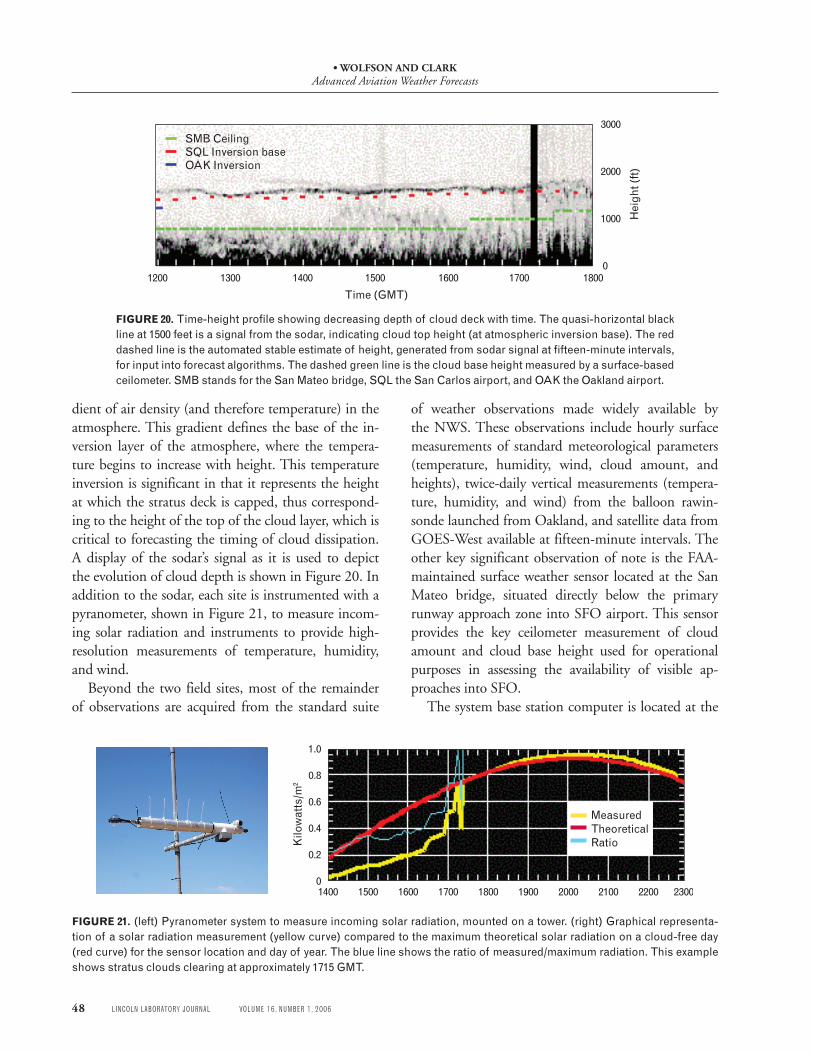
FIGURE 20. Time-height profile showing decreasing depth of cloud deck with time. The quasi-horizontal black line at 1500 feet is a signal from the sodar, indicating cloud top height (at atmospheric inversion base). The red dashed line is the automated stable estimate of height, generated from sodar signal at fifteen-minute intervals, for input into forecast algorithms. The dashed green line is the cloud base height measured by a surface-based ceilometer. SMB stands for the San Mateo bridge, SQL the San Carlos airport, and OAK the Oakland airport.
MeasuredTheoreticalRatioK
ilow
atts
/m2
0
0.2
0.4
0.6
0.8
1.0
1400 16001500 1700 1800 1900 2000 2100 2200 2300
FIGURE 21. (left) Pyranometer system to measure incoming solar radiation, mounted on a tower. (right) Graphical representa-tion of a solar radiation measurement (yellow curve) compared to the maximum theoretical solar radiation on a cloud-free day (red curve) for the sensor location and day of year. The blue line shows the ratio of measured/maximum radiation. This example shows stratus clouds clearing at approximately 1715 GMT.
dient of air density (and therefore temperature) in the atmosphere. This gradient defines the base of the in-version layer of the atmosphere, where the tempera-ture begins to increase with height. This temperature inversion is significant in that it represents the height at which the stratus deck is capped, thus correspond-ing to the height of the top of the cloud layer, which is critical to forecasting the timing of cloud dissipation. A display of the sodar’s signal as it is used to depict the evolution of cloud depth is shown in Figure 20. In addition to the sodar, each site is instrumented with a pyranometer, shown in Figure 21, to measure incom-ing solar radiation and instruments to provide high-resolution measurements of temperature, humidity, and wind.
Beyond the two field sites, most of the remainder of observations are acquired from the standard suite
of weather observations made widely available by the NWS. These observations include hourly surface measurements of standard meteorological parameters (temperature, humidity, wind, cloud amount, and heights), twice-daily vertical measurements (tempera-ture, humidity, and wind) from the balloon rawin-sonde launched from Oakland, and satellite data from GOES-West available at fifteen-minute intervals. The other key significant observation of note is the FAA-maintained surface weather sensor located at the San Mateo bridge, situated directly below the primary runway approach zone into SFO airport. This sensor provides the key ceilometer measurement of cloud amount and cloud base height used for operational purposes in assessing the availability of visible ap-proaches into SFO.
The system base station computer is located at the
• Wolfson and ClarkAdvanced Aviation Weather Forecasts
VOLUME 16, NUMBER 1, 2006 LINCOLN LABORATORY JOURNAL 49
Oakland ARTCC in Fremont, California. It serves the function of collecting and processing data from the variety of sources and generating display products. In additional to providing local display for the CWSU, the base station computer also acts as a web server for delivering the display products to external system us-ers via the Internet.
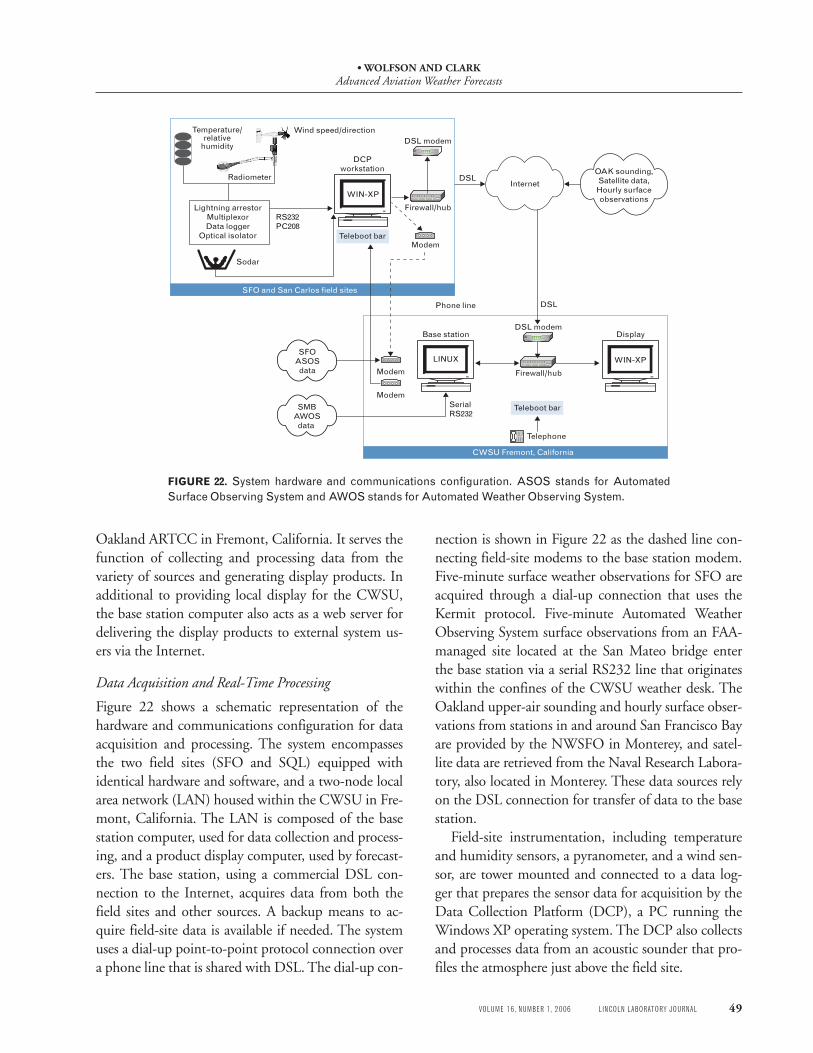
Data Acquisition and Real-Time Processing
Figure 22 shows a schematic representation of the hardware and communications configuration for data acquisition and processing. The system encompasses the two field sites (SFO and SQL) equipped with identical hardware and software, and a two-node local area network (LAN) housed within the CWSU in Fre-mont, California. The LAN is composed of the base station computer, used for data collection and process-ing, and a product display computer, used by forecast-ers. The base station, using a commercial DSL con-nection to the Internet, acquires data from both the field sites and other sources. A backup means to ac-quire field-site data is available if needed. The system uses a dial-up point-to-point protocol connection over a phone line that is shared with DSL. The dial-up con-
nection is shown in Figure 22 as the dashed line con-necting field-site modems to the base station modem. Five-minute surface weather observations for SFO are acquired through a dial-up connection that uses the Kermit protocol. Five-minute Automated Weather Observing System surface observations from an FAA-managed site located at the San Mateo bridge enter the base station via a serial RS232 line that originates within the confines of the CWSU weather desk. The Oakland upper-air sounding and hourly surface obser-vations from stations in and around San Francisco Bay are provided by the NWSFO in Monterey, and satel-lite data are retrieved from the Naval Research Labora-tory, also located in Monterey. These data sources rely on the DSL connection for transfer of data to the base station.
Field-site instrumentation, including temperature and humidity sensors, a pyranometer, and a wind sen-sor, are tower mounted and connected to a data log-ger that prepares the sensor data for acquisition by the Data Collection Platform (DCP), a PC running the Windows XP operating system. The DCP also collects and processes data from an acoustic sounder that pro-files the atmosphere just above the field site.
DSL modem
Firewall/hub
Modem
Telephone
Lightning arrestorMultiplexorData logger
Optical isolator
Wind speed/direction
Radiometer
RS232PC208
Internet
SMBAWOS
data
DSLOAK sounding,Satellite data,Hourly surfaceobservations
Sodar
SFO and San Carlos field sites
DSL
Temperature/relative
humidity
WIN-XP
DisplayBase station
Firewall/hub
DSL modem
Modem
Modem
CWSU Fremont, California
WIN-XP
SerialRS232
LINUX
Phone line
SFOASOS
data
DCPworkstation
Teleboot bar
Teleboot bar
FIGURE 22. System hardware and communications configuration. ASOS stands for Automated Surface Observing System and AWOS stands for Automated Weather Observing System.
• Wolfson and ClarkAdvanced Aviation Weather Forecasts
50 LINCOLN LABORATORY JOURNAL VOLUME 16, NUMBER 1, 2006
Forecast Models
Data collected at the base station computer are sup-plied to four component forecast models, each de-signed to independently provide an estimate of the time at which the approach zone is expected to be sufficiently free of clouds to allow parallel runway ap-proaches into SFO. Individual forecasts from the four component models are combined to yield a single con-sensus forecast. The forecast process is run on a daily schedule, beginning at 0900 GMT each morning (2 a.m. Pacific Daylight Time). The models are initial-ized with new data and run at the top of the hour at 0900, 1100, 1300, 1500, 1600, 1700, and 1800 GMT throughout the morning, as long as clouds are present in the approach zone. Once the approach zone has cleared, the models cease to run.
The four component models consist of three sta-tistically derived forecast models, and a physics-based numerical model:
1. Local Statistical Forecast Model2. Regional Statistical Forecast Model3. Satellite Statistical Forecast Model4. COBEL one-dimensional numerical model.
The models are quasi-independent in that they rely on significantly different data observations as input. The benefits of this are threefold. First, it provides four dif-ferent perspectives on the forecast, allowing the oppor-tunity for either inter-model consistency or variability, which is a useful indicator to the forecaster as to the reliability of the current forecast. Second, the use of a multiple forecast/consensus approach allows the fore-cast system to remain available in the event that one or more data sources become unavailable. The consensus forecast algorithm is designed to effectively combine the available component forecasts by using a weight-ing system that is based on the relative historical per-formance of each forecast model at each model run hour. Third, the consensus approach tends to filter the hour-to-hour variance that is sometimes observed in the individual component forecasts.
Three of the models are derived from nonlinear sta-tistical regression. The Local Model relies heavily on the special sensors at the two field sites, particularly the stratus top height as determined by the sodar, and the solar radiation measured by the pyranometer. The Re-
gional Model uses routinely available regional surface observations from the central California region, and upper air information from the Oakland sounding. The Satellite Model uses visible satellite brightness at key locations (determined through statistical analysis of sectored satellite data), correlated with the ultimate time of cloud dissipation in the approach.
COBEL is the only model among the four compo-nent models that is not statistically derived. It is a very high-resolution one-dimensional (vertical column) physical model of the planetary boundary layer (lowest 1 km of the atmosphere) that simulates the evolution of the cloud dissipation process. It was adapted by the University of Quebec at Montreal [25] from a model developed for forecasting fog behavior in northern France [26]. COBEL is short for the French Couche Brouillard Eau Liquide.
Each model executes at the top of each forecast run hour, provided that its required data are available. Once all of the models have received their data and have executed, the consensus algorithm is prompted to generate a consensus forecast, followed by a post-ing of all forecasts to the user display. The display is refreshed with new forecasts only once per cycle; i.e., the individual models are not allowed to update asyn-chronously to the display within a given hour.
The consensus forecast of approach clearing time is presented in two formats. First is a deterministic fore-cast of the time of clearing. Second is a probabilistic representation indicating the likelihood of clearing prior to key operational target times, namely, 1700, 1800, 1900, and 2000 GMT. These times represent the range of the peak traffic arrival demand into SFO.
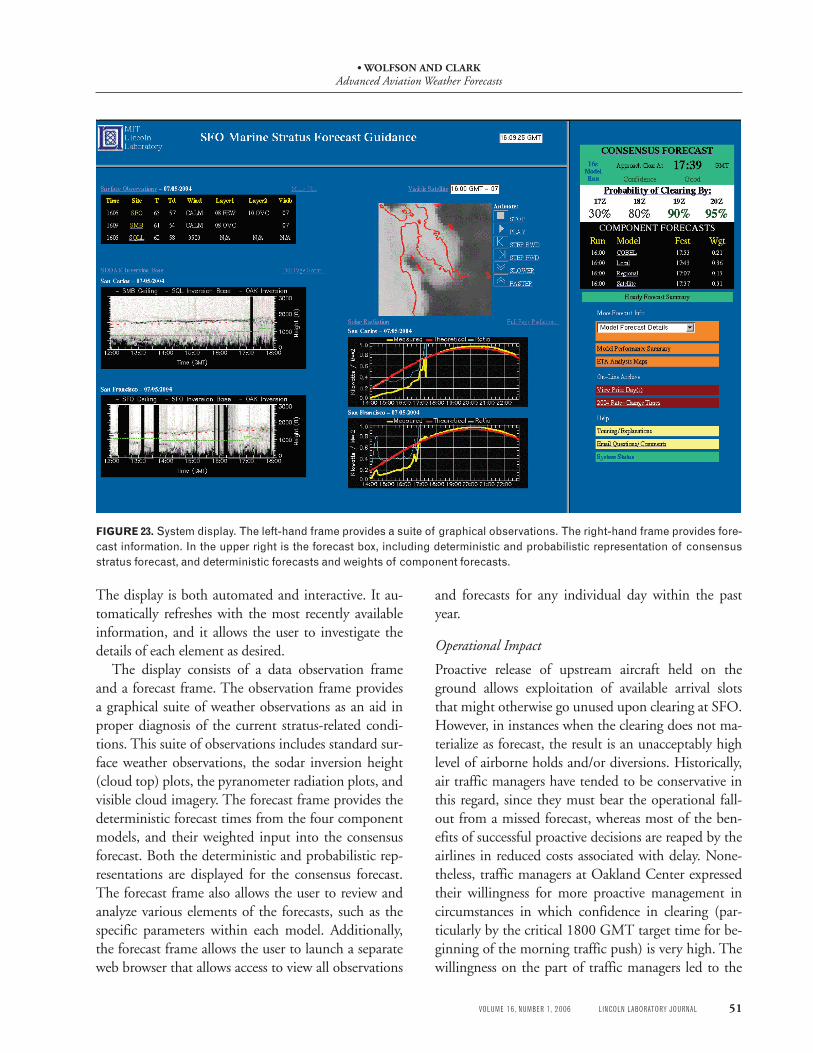
Data and Forecast Display
Figure 23 is an image of the system display, the prima-ry interface for operational users to access observations and model forecasts as an aid toward anticipating the time of stratus dissipation in the approach zone into SFO. The primary display is part of the two-node LAN at the CWSU in Fremont, California. The LAN includes a web server that allows access for external us-ers via the Internet. Key users include the NWSFO in Monterey, and the operational units a major partici-pating commercial airlines, most notably United Air-lines, which has the largest share of traffic into SFO.
• Wolfson and ClarkAdvanced Aviation Weather Forecasts
VOLUME 16, NUMBER 1, 2006 LINCOLN LABORATORY JOURNAL 51
The display is both automated and interactive. It au-tomatically refreshes with the most recently available information, and it allows the user to investigate the details of each element as desired.
The display consists of a data observation frame and a forecast frame. The observation frame provides a graphical suite of weather observations as an aid in proper diagnosis of the current stratus-related condi-tions. This suite of observations includes standard sur-face weather observations, the sodar inversion height (cloud top) plots, the pyranometer radiation plots, and visible cloud imagery. The forecast frame provides the deterministic forecast times from the four component models, and their weighted input into the consensus forecast. Both the deterministic and probabilistic rep-resentations are displayed for the consensus forecast. The forecast frame also allows the user to review and analyze various elements of the forecasts, such as the specific parameters within each model. Additionally, the forecast frame allows the user to launch a separate web browser that allows access to view all observations
and forecasts for any individual day within the past year.
Operational Impact
Proactive release of upstream aircraft held on the ground allows exploitation of available arrival slots that might otherwise go unused upon clearing at SFO. However, in instances when the clearing does not ma-terialize as forecast, the result is an unacceptably high level of airborne holds and/or diversions. Historically, air traffic managers have tended to be conservative in this regard, since they must bear the operational fall-out from a missed forecast, whereas most of the ben-efits of successful proactive decisions are reaped by the airlines in reduced costs associated with delay. None-theless, traffic managers at Oakland Center expressed their willingness for more proactive management in circumstances in which confidence in clearing (par-ticularly by the critical 1800 GMT target time for be-ginning of the morning traffic push) is very high. The willingness on the part of traffic managers led to the
FIGURE 23. System display. The left-hand frame provides a suite of graphical observations. The right-hand frame provides fore-cast information. In the upper right is the forecast box, including deterministic and probabilistic representation of consensus stratus forecast, and deterministic forecasts and weights of component forecasts.
• Wolfson and ClarkAdvanced Aviation Weather Forecasts
52 LINCOLN LABORATORY JOURNAL VOLUME 16, NUMBER 1, 2006
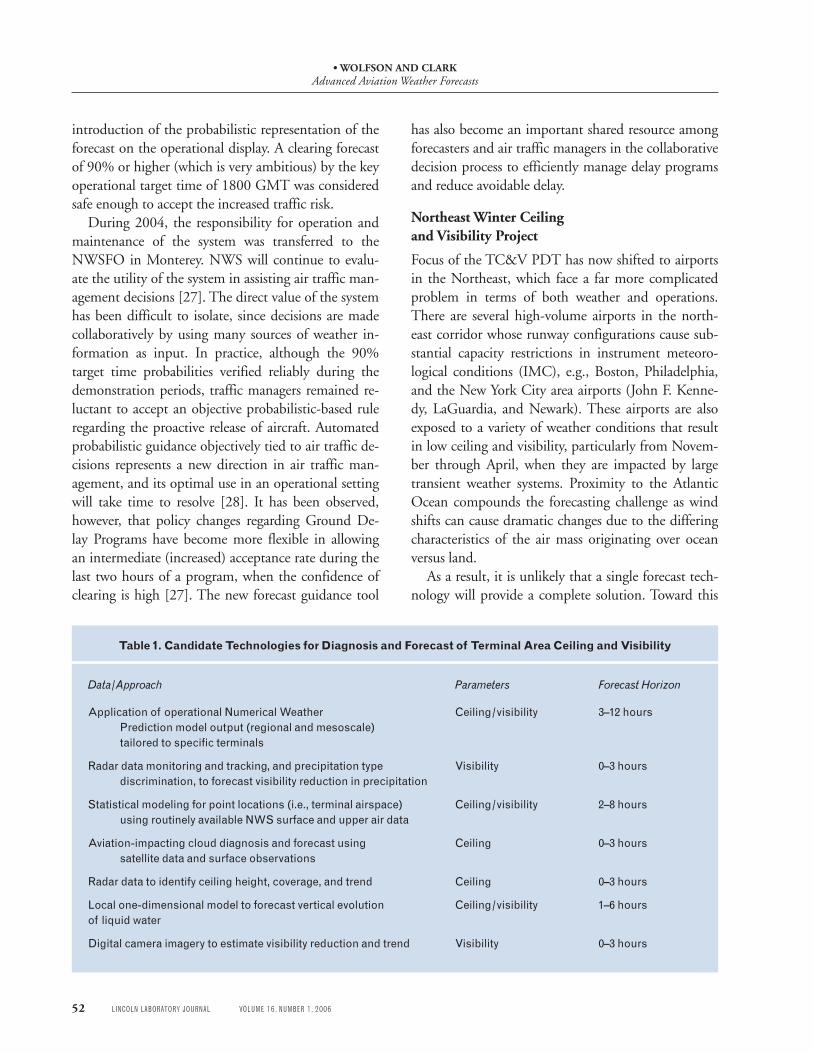
Table 1. Candidate Technologies for Diagnosis and Forecast of Terminal Area Ceiling and Visibility
Data/Approach Parameters ForecastHorizon
Application of operational Numerical Weather Ceiling/visibility 3–12 hours Prediction model output (regional and mesoscale) tailored to specific terminals
Radar data monitoring and tracking, and precipitation type Visibility 0–3 hours discrimination, to forecast visibility reduction in precipitation
Statistical modeling for point locations (i.e., terminal airspace) Ceiling/visibility 2–8 hours using routinely available NWS surface and upper air data
Aviation-impacting cloud diagnosis and forecast using Ceiling 0–3 hours satellite data and surface observations
Radar data to identify ceiling height, coverage, and trend Ceiling 0–3 hours
Local one-dimensional model to forecast vertical evolution Ceiling/visibility 1–6 hours of liquid water
Digital camera imagery to estimate visibility reduction and trend Visibility 0–3 hours
introduction of the probabilistic representation of the forecast on the operational display. A clearing forecast of 90% or higher (which is very ambitious) by the key operational target time of 1800 GMT was considered safe enough to accept the increased traffic risk.
During 2004, the responsibility for operation and maintenance of the system was transferred to the NWSFO in Monterey. NWS will continue to evalu-ate the utility of the system in assisting air traffic man-agement decisions [27]. The direct value of the system has been difficult to isolate, since decisions are made collaboratively by using many sources of weather in-formation as input. In practice, although the 90% target time probabilities verified reliably during the demonstration periods, traffic managers remained re-luctant to accept an objective probabilistic-based rule regarding the proactive release of aircraft. Automated probabilistic guidance objectively tied to air traffic de-cisions represents a new direction in air traffic man-agement, and its optimal use in an operational setting will take time to resolve [28]. It has been observed, however, that policy changes regarding Ground De-lay Programs have become more flexible in allowing an intermediate (increased) acceptance rate during the last two hours of a program, when the confidence of clearing is high [27]. The new forecast guidance tool
has also become an important shared resource among forecasters and air traffic managers in the collaborative decision process to efficiently manage delay programs and reduce avoidable delay.
northeast Winter Ceiling and Visibility Project
Focus of the TC&V PDT has now shifted to airports in the Northeast, which face a far more complicated problem in terms of both weather and operations. There are several high-volume airports in the north-east corridor whose runway configurations cause sub-stantial capacity restrictions in instrument meteoro-logical conditions (IMC), e.g., Boston, Philadelphia, and the New York City area airports (John F. Kenne-dy, LaGuardia, and Newark). These airports are also exposed to a variety of weather conditions that result in low ceiling and visibility, particularly from Novem-ber through April, when they are impacted by large transient weather systems. Proximity to the Atlantic Ocean compounds the forecasting challenge as wind shifts can cause dramatic changes due to the differing characteristics of the air mass originating over ocean versus land.
As a result, it is unlikely that a single forecast tech-nology will provide a complete solution. Toward this
• Wolfson and ClarkAdvanced Aviation Weather Forecasts
VOLUME 16, NUMBER 1, 2006 LINCOLN LABORATORY JOURNAL 53
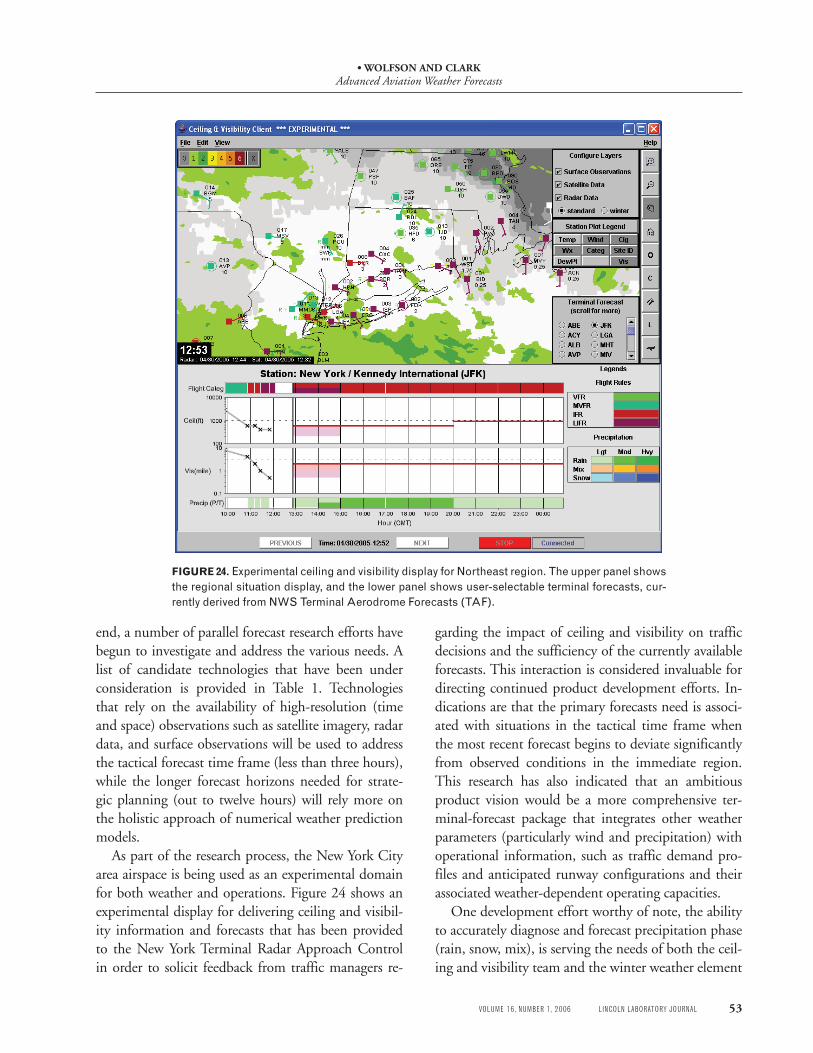
FIGURE 24. Experimental ceiling and visibility display for Northeast region. The upper panel shows the regional situation display, and the lower panel shows user-selectable terminal forecasts, cur-rently derived from NWS Terminal Aerodrome Forecasts (TAF).
end, a number of parallel forecast research efforts have begun to investigate and address the various needs. A list of candidate technologies that have been under consideration is provided in Table 1. Technologies that rely on the availability of high-resolution (time and space) observations such as satellite imagery, radar data, and surface observations will be used to address the tactical forecast time frame (less than three hours), while the longer forecast horizons needed for strate-gic planning (out to twelve hours) will rely more on the holistic approach of numerical weather prediction models.
As part of the research process, the New York City area airspace is being used as an experimental domain for both weather and operations. Figure 24 shows an experimental display for delivering ceiling and visibil-ity information and forecasts that has been provided to the New York Terminal Radar Approach Control in order to solicit feedback from traffic managers re-
garding the impact of ceiling and visibility on traffic decisions and the sufficiency of the currently available forecasts. This interaction is considered invaluable for directing continued product development efforts. In-dications are that the primary forecasts need is associ-ated with situations in the tactical time frame when the most recent forecast begins to deviate significantly from observed conditions in the immediate region. This research has also indicated that an ambitious product vision would be a more comprehensive ter-minal-forecast package that integrates other weather parameters (particularly wind and precipitation) with operational information, such as traffic demand pro-files and anticipated runway configurations and their associated weather-dependent operating capacities.
One development effort worthy of note, the ability to accurately diagnose and forecast precipitation phase (rain, snow, mix), is serving the needs of both the ceil-ing and visibility team and the winter weather element
• Wolfson and ClarkAdvanced Aviation Weather Forecasts
54 LINCOLN LABORATORY JOURNAL VOLUME 16, NUMBER 1, 2006
0100
0400
0700
1300
1600
1900
2200
0100
0400
0700
1000
1300
1600
1900
2200
1000
Vis
ibili
ty (m
iles)
10
8
6
4
2
0
CloudsRainSnow
Hour (Eastern Standard Time)
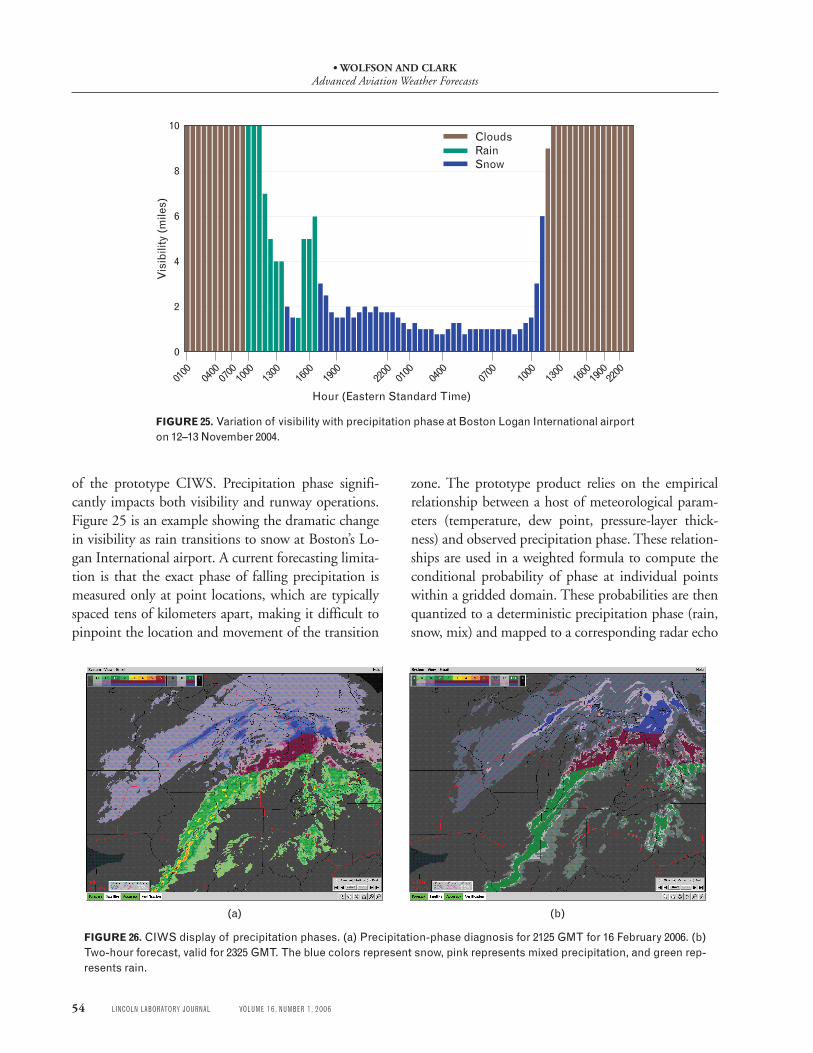
FIGURE 25. Variation of visibility with precipitation phase at Boston Logan International airport on 12–13 November 2004.
of the prototype CIWS. Precipitation phase signifi-cantly impacts both visibility and runway operations. Figure 25 is an example showing the dramatic change in visibility as rain transitions to snow at Boston’s Lo-gan International airport. A current forecasting limita-tion is that the exact phase of falling precipitation is measured only at point locations, which are typically spaced tens of kilometers apart, making it difficult to pinpoint the location and movement of the transition
zone. The prototype product relies on the empirical relationship between a host of meteorological param-eters (temperature, dew point, pressure-layer thick-ness) and observed precipitation phase. These relation-ships are used in a weighted formula to compute the conditional probability of phase at individual points within a gridded domain. These probabilities are then quantized to a deterministic precipitation phase (rain, snow, mix) and mapped to a corresponding radar echo
FIGURE 26. CIWS display of precipitation phases. (a) Precipitation-phase diagnosis for 2125 GMT for 16 February 2006. (b) Two-hour forecast, valid for 2325 GMT. The blue colors represent snow, pink represents mixed precipitation, and green rep-resents rain.
(a) (b)
• Wolfson and ClarkAdvanced Aviation Weather Forecasts
VOLUME 16, NUMBER 1, 2006 LINCOLN LABORATORY JOURNAL 55
image to generate a precipitation-phase diagnosis. Tracking vectors derived from historical trend of the rain/snow transition line within the conditional pre-cipitation-phase field are then applied to generate a forecast map, shown in Figure 26.
The other forecast technologies for Northeast ceil-ing and visibility will continue to be developed in parallel, and integrated to provide a unified source for terminal-based information and forecasts. Ultimately, the vision is to distribute the new technology through a more widely available regional or national platform, such as the proposed national CIWS. The intent would be for the large-area-domain system to provide portals to individual terminals for accessing complete forecast information, of which the ceiling and visibil-ity technology would be an important component.
summary
Recent accomplishments of two product development teams within the FAA’s Aviation Weather Research Program have been described. Development of pro-totype systems have provided immediate benefits in improving traffic flow control efficiency within the National Airspace System, addressing both en route severe weather and capacity restrictive weather at in-dividual airport terminals. This work has been per-formed by the Convective Weather team and the Ter-minal Ceiling and Visibility team.
Convective weather forecast capability has been used in both the ITWS (one-hour forecast) and CIWS (two-hour forecast) proof-of-concept demonstrations, and has proven highly useful in these operational set-tings as an aid to tactical traffic flow management. Keeping in mind the annual air traffic delay statistics curves, we recognize that the CWF technology—as valuable as it may be for making short-term fore-casts—does nothing to solve the national summer-time delay problem if air traffic management decisions are not being made differently as a result. So while a major milestone was reached in 2004 with the trans-fer of the CWF technology to the ITWS program for implementation, work is ongoing to address specific poor-performance scenarios and to further increase the operational utility of the CWF.
Two projects within the Terminal Ceiling and Vis-ibility PDT were described. First was the prototype
system developed to forecast the dissipation of stratus cloud, which restricts the approach capacity to San Francisco International airport. The system was dem-onstrated during four stratus seasons, after which the hardened prototype was transferred to the National Weather Service in 2004. More recent efforts involve the Northeast Winter Ceiling and Visibility Project, which is aimed at forecasts for major northeast corri-dor terminals that suffer significant capacity loss dur-ing low cloud and fog conditions, typically associated with transient weather systems that regularly impact the northeast corridor from November through April. The complexity of both the weather and air traffic management in this highly congested region presents a significant challenge for effective product develop-ment. We will continue to investigate and integrate a number of technologies in order to provide improved forecast information to support the air traffic flow control decision making process.
acknowledgments
The authors wish to recognize participation by team members from various organizations. Significant con-tributions were made by our colleagues at the Na-tional Center for Atmospheric Research (NCAR), the National Oceanic and Atmospheric Administration Earth System Research Laboratory Global Systems Division, San Jose State University, and the University of Quebec at Montreal.
We want to acknowledge our great collaboration with Cindy Mueller of NCAR, who was the alternate lead of the Convective Weather PDT from its incep-tion in 1997 until March 2006, when she left NCAR for other professional pursuits. Our meetings and interactions were always highly productive as well as enjoyable. We would also like to recognize the many contributions by Wes Wilson of NCAR, who led the Ceiling and Visibility PDT for several years and was instrumental in establishing the marine stratus initia-tive for San Francisco.
We also want to especially acknowledge our friend and colleague, Barbara Forman, who passed away in April 2006. Barbara was an integral part of the Con-vective Weather PDT from its beginning until her ill-ness forced her early retirement in 2004. Her legacy to the team is apparent in the work presented here.
• Wolfson and ClarkAdvanced Aviation Weather Forecasts
56 LINCOLN LABORATORY JOURNAL VOLUME 16, NUMBER 1, 2006
r e F e r e n c e S 1 J.E. Evans and D.M. Bernella, “Supporting the Deployment
of the Terminal Doppler Weather Radar (TDWR),” Linc. Lab. J. 7 (2), 1994, pp. 379–398.
2. W.M. Merritt, “Microburst Divergence Detection for Termi-nal Doppler Weather Radar (TDWR),” Lincoln Laboratory Project Report ATC-181 (25 Sept. 1991).
3. S.W. Troxel, R.L. Delanoy, J.P. Morgan, and W.L. Pughe, “Machine Intelligent Gust Front Algorithm for the Terminal Doppler Weather Radar (TDWR) and Integrated Terminal Weather System (ITWS),” AMS Workshop on Wind Shear and Wind Shear Alert Systems, Oklahoma City, Okla., pp. 70–79.
4. J.E. Evans and E.R. Ducot, “The Integrated Terminal Weath-er System (ITWS),” Linc. Lab. J. 7 (2), 1994, pp. 449–474.
5. J.E. Evans and E.R. Ducot, “Corridor Integrated Weather Sys-tem,” in this issue.
6. M. Wolfson, R. Boldi, K. Calden, W. Dupree, B. Forman, R. Johnson, Jr., E. Mann, and C. Wilson, private communica-tion.
7. M.M. Wolfson, B.E. Forman, K.T. Calden, R.A. Boldi, W.J. Dupree, R.J. Johnson, C. Wilson, P.E. Bieringer. E.B. Mann, and J.P. Morgan, “Tactical 0–2 Hour Convective Weather Forecasts For FAA,” 11th Conf. on Aviation, Range, and Aero-space Meteorology, Hyannis, Mass., 4–8 Oct. 2004.
8. W.J. Dupree, M.M. Wolfson, R.J. Johnson, Jr., K.E. Theri-ault, B.E. Forman, B. Boldi, and C.A. Wilson, “Forecasting Convective Weather Using Multi-Scale Detectors and Weath-er Classification—Enhancements to the MIT Lincoln Labo-ratory Terminal Convective Weather Forecast,” 10th Conf. on Aviation, Range, and Aerospace Meteorology, Portland, Oreg., 13–16 May 2002, pp. 132–135.
9. D. Megenhardt, C. Mueller, S. Trier, D. Ahijevych, and N. Rehak, “NCWF-2 Probabilistic Nowcasts,” 11th Conf. on Avi-ation, Range, and Aerospace Meteorology, Hyannis, Mass., 4–8 Oct. 2004.
10. T.R. Saxen, C.K. Mueller, J. Wilson, R. Roberts, E. Nelson, D. Ahijevych, and S. Trier, “Updates to the NCAR Auto-Nowcaster for the 2004 Convective Weather Season,” 11th Conf. on Aviation, Range, and Aerospace Meteorology, Hyannis, Mass., 4–8 Oct. 2004.
11. B.A. Crowe and D.W. Miller, “The Benefits of Using NEXRAD Vertically Integrated Liquid Water as an Aviation Weather Product,” 8th Conf. on Aviation, Range, and Aerospace Meteorology, Dallas, 10–15 Jan. 1999, pp. 168–171.
12. M. Robinson, J.E. Evans, and B.A. Crowe, “En Route Weath-er Depiction Benefits of the NEXRAD Vertically Integrated Liquid Water Product Utilized by the Corridor Integrated Weather System,” 10th Conf. on Aviation, Range, and Aero-space Meteorology, Portland, Oreg., 13–16 May 2002.
13. J.E. Evans, M. Robinson, B. Crowe, D. Klingle-Wilson, and S. Allan, “Reducing Severe Weather Delays in Congested Air-space with Weather Decision Support for Tactical Air Traffic Management,” 5th Eurocon/FAA ATM R&D Seminar, Buda-pest, 23–27 June 2003, http://atm2003.eurocontrol.fr.
14. D.J. Smalley and B.J. Bennett, “Using ORPG to Enhance NEXRAD Products to Support FAA Critical Systems,” 10th Conf. on Aviation, Range, and Aerospace Meteorology, Portland, Oreg., 13–16 May 2002.
15. R.L. Delanoy, J.G. Verly, and D.E. Dudgeon, “Function-al Templates and Their Applications to 3-D Object Recog-nition,” Int. Conf. on Acoustics, Speech, and Signal Processing
(ICAASP) 3, San Francisco, 23–26 Mar. 1992, pp. III-141–144.
16. E.S. Chornoboy, A.M. Matlin, and J.P. Morgan, “Automated Storm Tracking for Terminal Air Traffic Control,” Linc. Lab. J. 7 (2), pp. 427–448.
17. N.A. Crook, J. Sun, and Y.Z. Zhang, “Very Short Range Fore-casting of Precipitation: Comparing NWP and Extrapolation Techniques,” 12th Conf. on Aviation, Range, and Aerospace Me-teorology, Atlanta, Ga., 29 Jan–2 Feb. 2006.
18. W.F. Feltz, K. Bedka, A. Wimmers, M. Pavolonis, S. Bedka, S.A. Ackerman, J.R. Mecikalski, J.J. Murray, and D.B. John-son, “Satellite Derived Products to Enhance Aviation Now-casting of Convection, Turbulence, and Volcanic Ash,” 14th Conf. on Satellite Meteorology and Oceanography, Atlanta, Ga., 28 Jan–3 Feb. 2006.
19. J.W. Wilson and D.L. Megenhardt, “Thunderstorm Initiation, Organization, and Lifetime Associated with Florida Boundary Layer Convergence Lines,” Monthly Weather Rev. 125 (7), pp. 1507–1525.
20. B.E. Forman, M.M. Wolfson, R.G. Hallowell, and M.P. Moore, “Aviation User Needs for Convective Weather Fore-casts,” 8th Conf. on Aviation, Range, and Aerospace Meteorology, Dallas, 10–15 Jan. 1999, pp. 526–530.
21. K.E. Theriault, M.M. Wolfson, W.J. Dupree, B.E. Forman, R.G. Hallowell, R.J. Johnson, Jr., and M.P. Moore, “TCWF Algorithm Assessment—Memphis 2000,” Lincoln Laboratory Project Report ATC-297 (9 July 2001).
22. MCR Federal, Inc., FAA Terminal Convective Weather Fore-cast Benefits Analysis Report, No. TR-7100/029-1.
23. M. Robinson, J. Evans, B. Crowe, D. Klingle-Wilson, and S. Allan, “Corridor Integrated Weather System Operational Ben-efits 2002-3: Initial Estimates of Convective Weather Delay Reduction,” Lincoln Laboratory Project Report ATC-313 (9 Apr. 2004).
24. W.J. Strach, “The Effects of Summer Time Stratus at San Francisco International Airport on the Nationwide Flow of Commercial Airline Traffic,” 1st Aviation Weather Workshop, Kansas City, Mo., 1991.
25. R. Tardif and P. Zwack, “Toward a General Boundary Lay-ers Model for Aviation Weather Forecasting Applications: A Report on COBEL Improvements,” progress report submit-ted by University of Quebec at Montreal to MIT and Lincoln Laboratory under FAA sponsorship.
26. D. Guedalia and T. Bergot, “Numerical Forecasting of Radia-tion Fog. Part II: A Comparison of Model Simulations and Several Observed Fog Events,” Monthly Weather Rev. 122 (6), 1994, 1231–1246.
27. C. Ivaldi, D.A. Clark, and D. Reynolds, “Upgrade and Tech-nology Transfer of the San Francisco Marine Stratus Forecast System to the National Weather Service,” 12th Conf. on Avia-tion, Range, and Aerospace Meteorology, Atlanta, 29 Jan–2 Feb. 2006.
28. J.E. Evans, M.E. Weber, and W.R. Moser, “Integrating Ad-vanced Weather Forecast Technologies into Air Traffic Man-agement Decision Support,” in this issue.
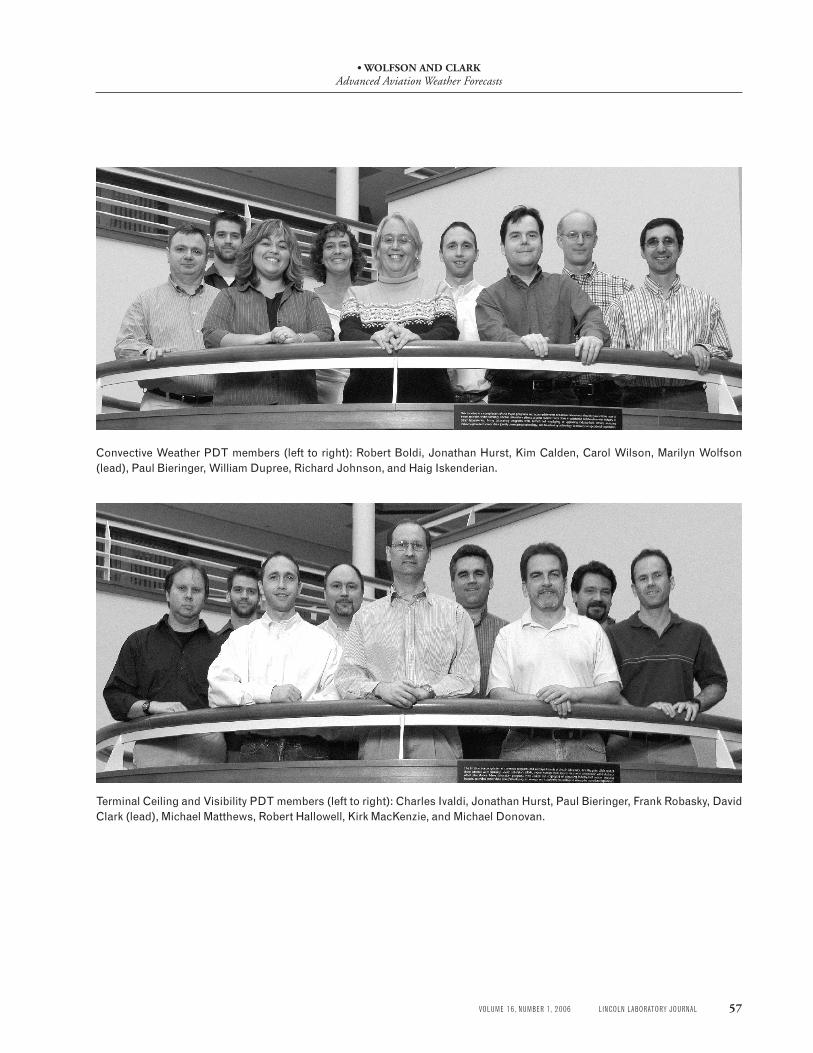
• Wolfson and ClarkAdvanced Aviation Weather Forecasts
VOLUME 16, NUMBER 1, 2006 LINCOLN LABORATORY JOURNAL 57
Terminal Ceiling and Visibility PDT members (left to right): Charles Ivaldi, Jonathan Hurst, Paul Bieringer, Frank Robasky, David Clark (lead), Michael Matthews, Robert Hallowell, Kirk MacKenzie, and Michael Donovan.
Convective Weather PDT members (left to right): Robert Boldi, Jonathan Hurst, Kim Calden, Carol Wilson, Marilyn Wolfson (lead), Paul Bieringer, William Dupree, Richard Johnson, and Haig Iskenderian.
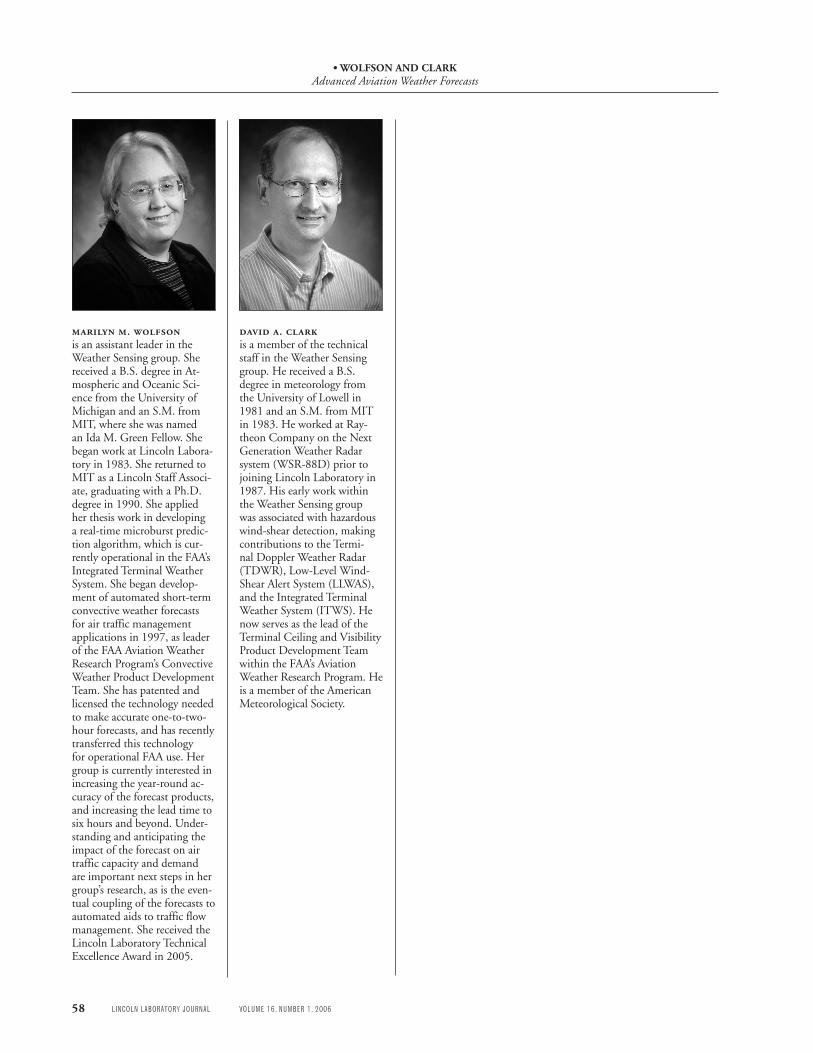
• Wolfson and ClarkAdvanced Aviation Weather Forecasts
58 LINCOLN LABORATORY JOURNAL VOLUME 16, NUMBER 1, 2006
marilyn m. wolfsonis an assistant leader in the Weather Sensing group. She received a B.S. degree in At-mospheric and Oceanic Sci-ence from the University of Michigan and an S.M. from MIT, where she was named an Ida M. Green Fellow. She began work at Lincoln Labora-tory in 1983. She returned to MIT as a Lincoln Staff Associ-ate, graduating with a Ph.D. degree in 1990. She applied her thesis work in developing a real-time microburst predic-tion algorithm, which is cur-rently operational in the FAA’s Integrated Terminal Weather System. She began develop-ment of automated short-term convective weather forecasts for air traffic management applications in 1997, as leader of the FAA Aviation Weather Research Program’s Convective Weather Product Development Team. She has patented and licensed the technology needed to make accurate one-to-two-hour forecasts, and has recently transferred this technology for operational FAA use. Her group is currently interested in increasing the year-round ac-curacy of the forecast products, and increasing the lead time to six hours and beyond. Under-standing and anticipating the impact of the forecast on air traffic capacity and demand are important next steps in her group’s research, as is the even-tual coupling of the forecasts to automated aids to traffic flow management. She received the Lincoln Laboratory Technical Excellence Award in 2005.
david a. clarkis a member of the technical staff in the Weather Sensing group. He received a B.S. degree in meteorology from the University of Lowell in 1981 and an S.M. from MIT in 1983. He worked at Ray-theon Company on the Next Generation Weather Radar system (WSR-88D) prior to joining Lincoln Laboratory in 1987. His early work within the Weather Sensing group was associated with hazardous wind-shear detection, making contributions to the Termi-nal Doppler Weather Radar (TDWR), Low-Level Wind-Shear Alert System (LLWAS), and the Integrated Terminal Weather System (ITWS). He now serves as the lead of the Terminal Ceiling and Visibility Product Development Team within the FAA’s Aviation Weather Research Program. He is a member of the American Meteorological Society.