advanced characterization techniques for sic and pyc ... · scanning electron microscopy ... was...
TRANSCRIPT
Advanced Characterization Techniques for SiC and PyC
Coatings on High-Temperature Reactor Fuel Particles
D. Helary, O. Dugne, Xavier Bourrat
To cite this version:
D. Helary, O. Dugne, Xavier Bourrat. Advanced Characterization Techniques for SiC and PyCCoatings on High-Temperature Reactor Fuel Particles. Journal of Nuclear Materials, Elsevier,2008, 373 (1-3), pp.150-156. <10.1016/j.jnucmat.2007.05.041>. <insu-00159978>
HAL Id: insu-00159978
https://hal-insu.archives-ouvertes.fr/insu-00159978
Submitted on 23 Oct 2007
HAL is a multi-disciplinary open accessarchive for the deposit and dissemination of sci-entific research documents, whether they are pub-lished or not. The documents may come fromteaching and research institutions in France orabroad, or from public or private research centers.
L’archive ouverte pluridisciplinaire HAL, estdestinee au depot et a la diffusion de documentsscientifiques de niveau recherche, publies ou non,emanant des etablissements d’enseignement et derecherche francais ou etrangers, des laboratoirespublics ou prives.
Accepted in Journal of Nuclear Materials
Advanced characterization techniques for SiC and PyC coatings on high-temperature reactor fuel particles D. Hélary a, b, O. Dugneb, and X. Bourrata,c1,2 aLaboratoire des Composites Thermostructuraux (LCTS), UMR CNRS 5801, 3 allée de La Boétie, 33600 Pessac, France bCommissariat à l’Énergie Atomique (CEA) – DEN/VRH/DTEC/SGCS/LMAC, BP 111, 26702 Pierrelatte, France c 1Université d’Orléans, Institut des Sciences de la Terre d’Orléans, UMR 6113, 45067, Orléans, France c2 CNRS/INSU, Institut des Sciences de la Terre d’Orléans, UMR 6113, 45071 Orléans, France
Abstract
Enhancing the safety of high-temperature reactors (HTRs) is based on the quality of the fuel particles, requiring good knowledge of the microstructure of the four-layer particles designed to retain the fission products during irradiation and under accidental conditions. This paper focuses on the intensive research work performed to characterize the micro- and nanostructure of each unirradiated layer (silicon carbide and pyrocarbon coatings). The analytic expertise developed in the 1970s has been recovered and innovative advanced characterization methods have been developed to improve the process parameters and to ensure the production reproducibility of coatings.
1. Introduction
High-temperature reactor (HTR) technology has a long history, having been developed mainly in the 1970s in Europe and in the United States. Today this system has attracted renewed interest due to its inherent safety characteristics and ability to use a high-temperature coolant (helium) capable of producing hydrogen from water. The fuel selected for this concept is a key element and consists in a silicon carbide/pyrocarbon multilayer composite designed to retain all fission products during neutron irradiation but also to withstand the thermal and mechanical stresses arising from high burnup. Under neutron irradiation pyrocarbon undergoes early densification and the coating shrinks. The shrinkage of pyrocarbon on a stable silicon carbide coating induces tangential stress that can be relaxed by irradiation creep and by reorientation of the pyrocarbon crystallites parallel with the coating surface [1]. This leads to significant anisotropy. Irradiation results have shown that PyC failure depends on the original isotropy value. The higher the original isotropy, the less pronounced the anisotropy after irradiation [2]. To achieve a better understanding of the particle behavior in reactor, the initial degree of isotropy of the PyC coatings and initial microstructure of the different layers must be first examined. The SiC layer is expected to have a cubic structure (β-SiC) to compensate for the swelling effect due to irradiation. The SiC grain size is an important parameter to characterize because of its significant effect on the migration of metallic fission products. Grains must be very fine to increase the density of grain boundaries and minimize the release into the coolant circuit. After neutron irradiation apparently 90% of the Ag would be released from a large columnar SiC grain microstructure, whereas only 30% would be released in a smaller SiC grain microstructure [3].
Accepted in Journal of Nuclear Materials
The objective of this work is to recover the analytic expertise developed in the 1970s but also to introduce new characterization methods to investigate the multilayer microstructures prior to irradiation. These characterizations will contribute to the qualification of fuel particles that will be produced in the CEA’s GAIA pilot facility at Cadarache [4].
2. Experimental
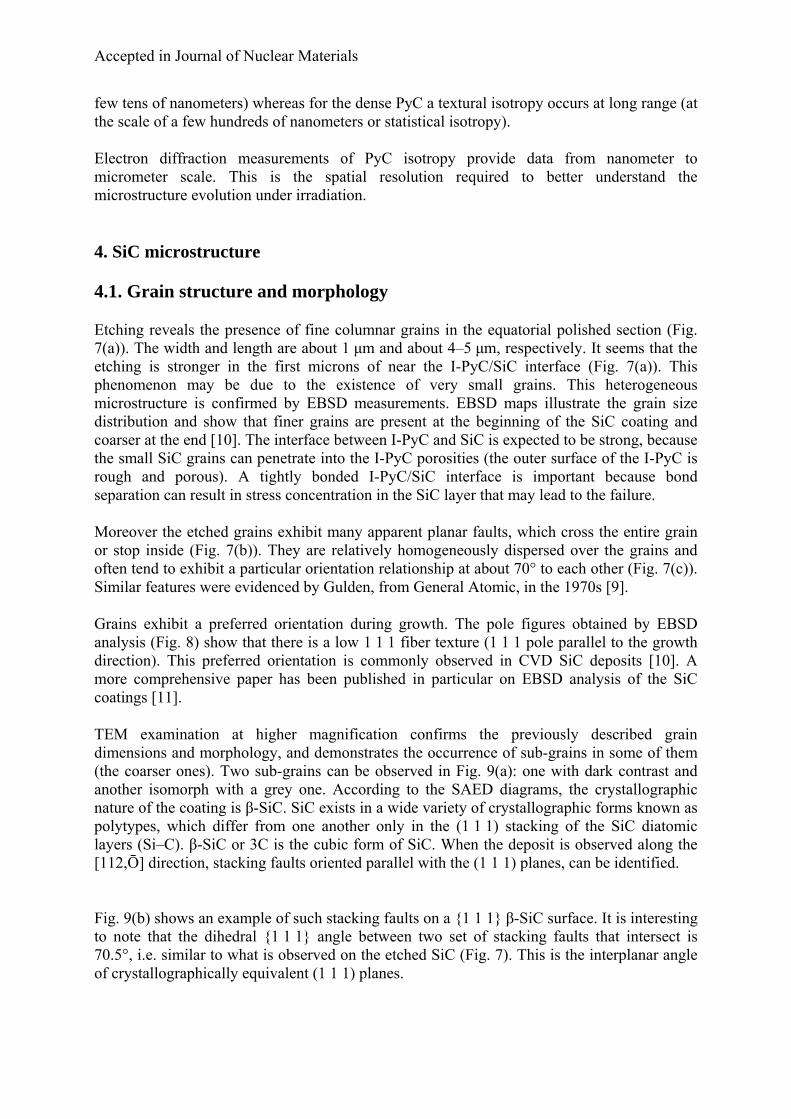
Fuel particles are produced by a fluidized bed Chemical Vapor Deposition (CVD) process according to the original technique conserved, enhanced and currently investigated by the CEA in Grenoble using simulated coated particles with ZrO2–Y2O3 kernels and a three fluidized bed furnace. A typical coated particle cross-section is shown in Fig. 1. The kernel is coated by a low density pyrocarbon layer (buffer) and three successive dense layers: an inner dense pyrocarbon layer (I-PyC), a silicon carbide (SiC) layer and an outer dense pyrocarbon layer (O-PyC).
The gas precursors consist of C2H2 for the buffer, C3H6 or C2H2/C3H6 for the dense PyC, and CH3SiCl3 (MTS) for the SiC. The coatings are deposited at a temperature of 1300–1400 °C for PyC and 1500–1600 °C for SiC.
Scanning electron microscopy (SEM) observations were carried out using a Hitachi 4500 equipped with a field emission gun. A JEOL 840ALGS microscope equipped with an EBSD-HKL device was used for electron backscattered diffraction (EBSD). Murakami etching (aqueous solution of NaOH and potassium ferricyanide) was used to reveal microstructural details. Thin slices prepared conventionally by mechanical thinning and ion milling were analyzed by transmission electron microscopy (TEM) as well as by the focused ion beam (FIB) technique. The thin specimens were examined at 300 keV with a Philips CM30ST and at 200 keV with a JEOL 2010F field emission gun equipped with a Gatan imaging filter (GIF). Raman analyses were performed using a Jobin Yvon Labram HR microspectrometer equipped with a 632.8 nm laser. The lateral resolution was about 1 μm, and the detection limits were 0.1 at.% for C and about 1 at.% for Si.
3. PyC microstructure
3.1. General morphology
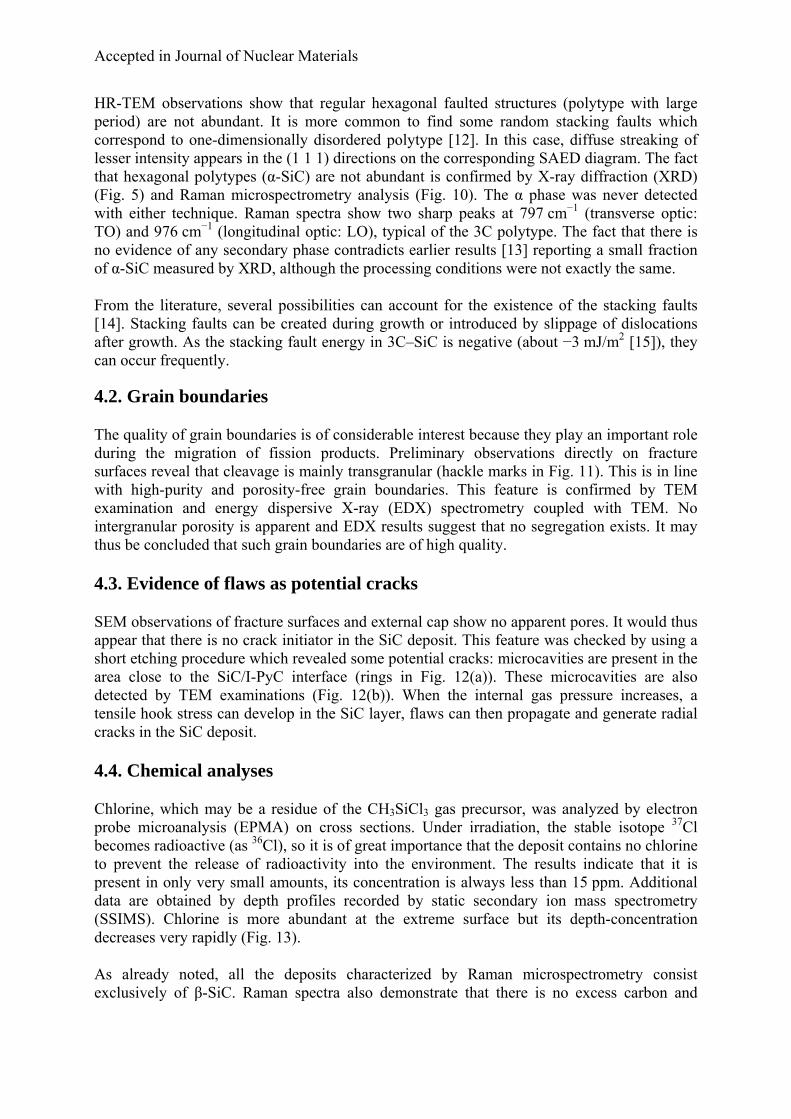
The buffer and dense PyC texture observed by SEM on fracture surfaces is shown in Fig. 2 The buffer is constituted by concentric growth features (spheroids) 300–400 nm in diameter (Fig. 2(a)). A heterogeneous distribution of large cavities is evidenced. Dense PyC is composed of agglomerated spheroids (Fig. 2(b)) about 400 nm in diameter, typical of reactions in the gas phase (homogeneous growth) [5]. On the fracture surfaces, PyC deposited directly on the surface (heterogeneous growth), can also be distinguished between the agglomerates (Fig. 2(b)).
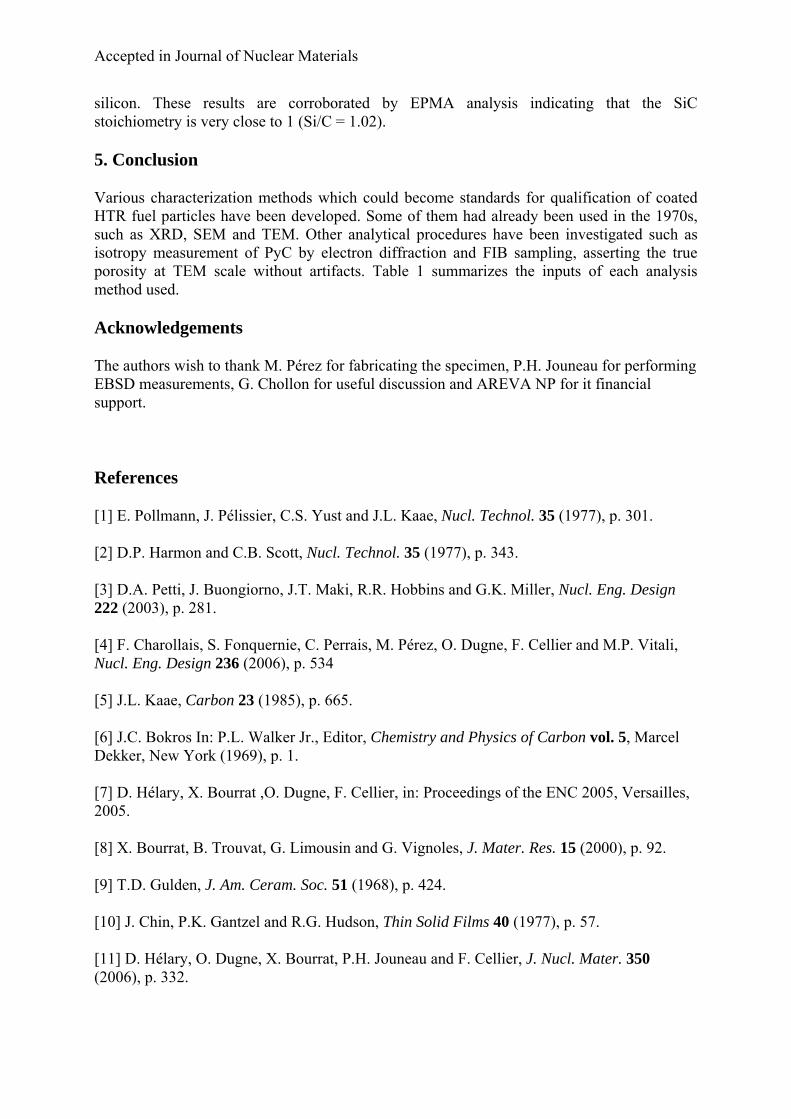
Murakami chemical etching evidences the main features of the PyC microstructures. The texture of carbon spheroids is clearly visible on a polished and etched cross-section of dense PyC (Fig. 3). They exhibit an onion-like texture with concentric carbon layers. Etching occurs preferentially in regions corresponding to direct PyC coating on the surface. In these regions, the deposit is not concentric (anisotropic fraction or ‘layered’ carbon).
Accepted in Journal of Nuclear Materials
3.2. Structure of carbon layers
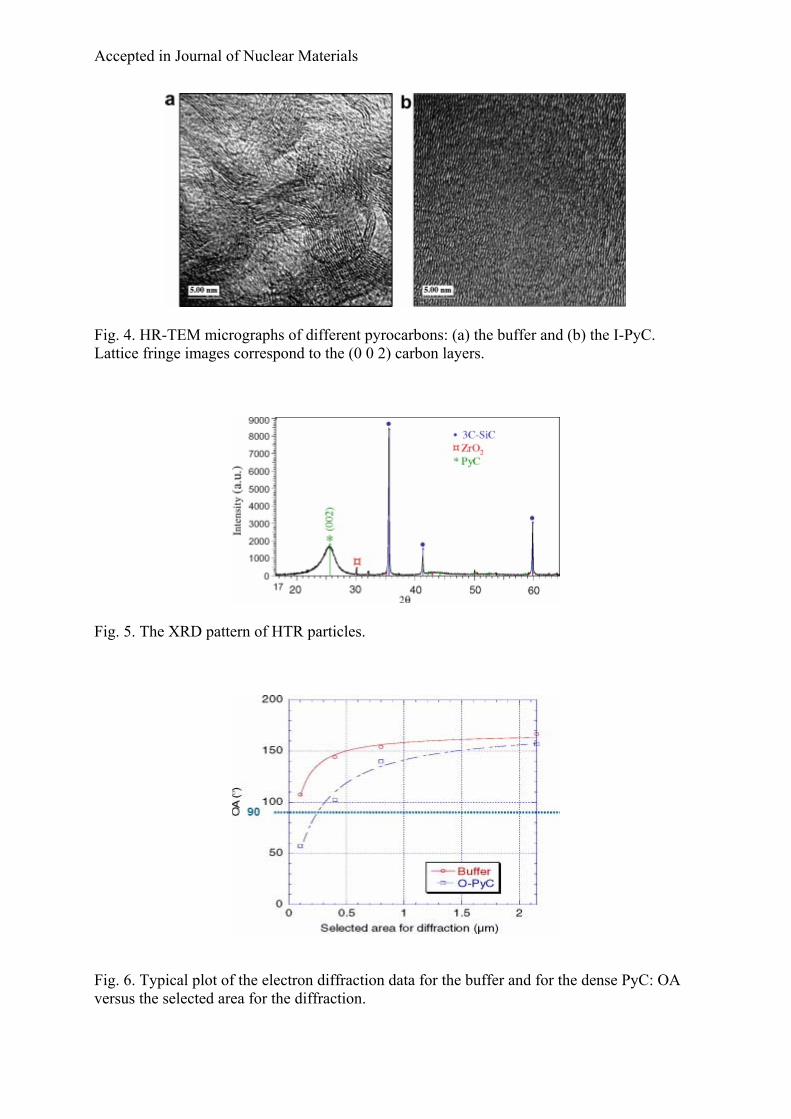
The structures of the buffer and dense PyC observed by High-Resolution TEM (HR-TEM) are totally different. The buffer is composed of randomly oriented piles of long carbon layers (Fig. 4(a)). This nanostructure is known to favor low density via significant inter-layer porosity. Carbon layers deposited in the case of I-PyC are shorter and arranged in compact piles (Fig. 4(b)). These observations are consistent with data from the literature. In the 1970s, Pollman et al. [1] reported on the state of the art of TEM analysis, and noted that three different structural arrangements (referred to as ‘tangled fiber’, ‘mosaic’ and ‘layered’) can occur in PyC. A comparison of this classification well described in [1] with observations made in the present study indicates a ‘tangled fiber’ structure in the buffer and a ‘mosaic’ structure in the dense PyC.
The apparent crystallite size (Lc) and d0 0 2-spacing were obtained using X-ray diffraction. The Scherrer relation and Bragg’s law were used respectively to determine Lc and d0 0 2-spacing. The particles were measured directly (all particles are in the same plane). For Cu Kα radiation, the attenuation of the incident beam is about 98% at the outer surface of the I-PyC layer (SiC is a stronger X-ray attenuator). This indicates a preponderant contribution of O-PyC to the (0 0 2) diffraction peak (Fig. 5). Therefore, calculations can only be made for the O-PyC layer. Lc is about 30 Å; this result is very similar to that reported in the 1970s for ‘mosaic’ structure [1]. d0 0 2 is about 3.47 Å and is typical of turbostratic pyrocarbons.
3.3. PyC isotropy
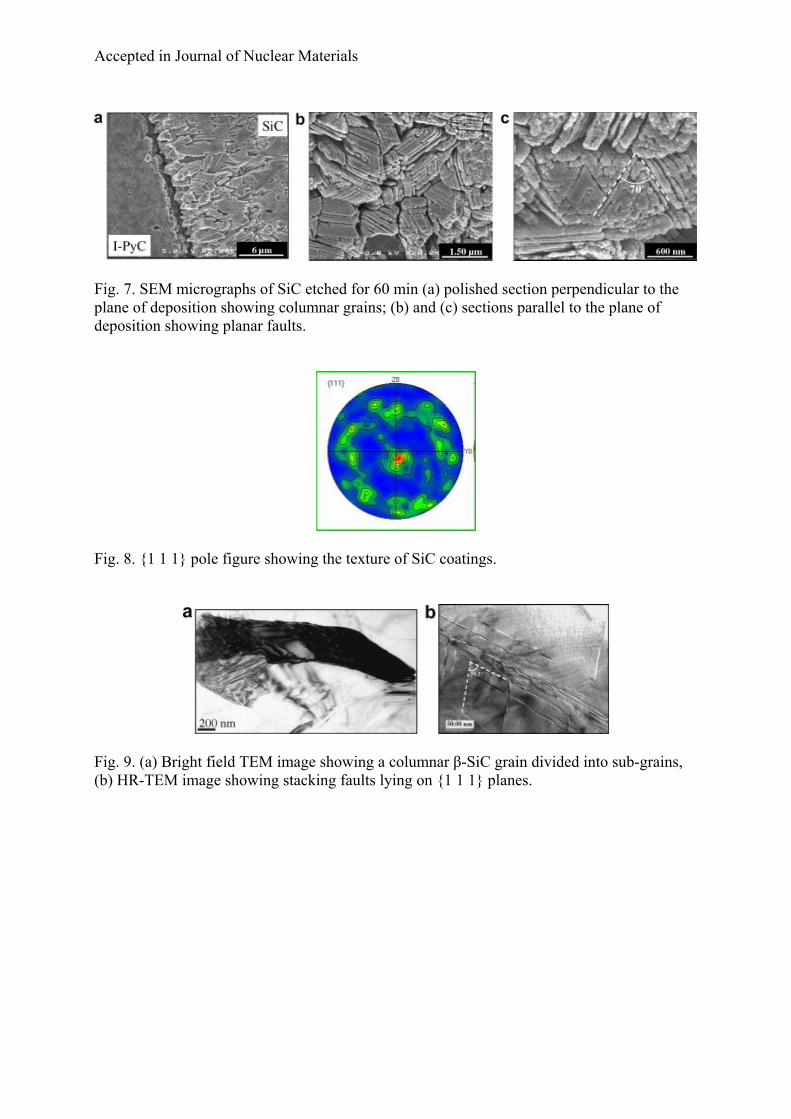
As indicated in the introduction, the PyC coatings must be isotropic. One way of measuring the isotropy is to use TEM coupled with selected area electron diffraction (SAED). The procedure is briefly described here, and a more complete description is mentioned in a previous paper [7]. This technique has already been developed to measure the high anisotropy of PyC in carbon/carbon composites [8] and has been recently adapted for low textured PyC.
A diffraction pattern is recorded on the desired area of the material and the 0 0 2-plane diffraction is analyzed. Patterns are obtained on larger and larger areas with four aperture diameters: 0.1, 0.4, 0.8 and 2.15 μm. The diffraction patterns show the disorientation of the carbon layers around the anisotropy plane. For perfectly isotropic PyC, the pattern is characterized by a uniform Debye-Scherrer 0 0 2-ring. In the case of a well organized PyC, the pattern exhibits two 0 0 2 arcs which appear perpendicular to the anisotropy plane (carbon layers parallel with the anisotropy plane). The pattern is processed using image analysis software developed in the laboratory. After correction for the film response and for the background, the program performs an azimuthal scan. The intensity distribution is then fitted by two Gaussian curves and the opening angle (OA) is given as the mean value of the two widths at half maximum. This angle is a clear quantitative indicator of isotropy in PyC compared to other methods commonly used and which are based on 0 0 2 dark field images. The higher the OA value, the better the isotropy. An OA value of 90° can be considered to indicate the beginning of an isotropic coating.
An example of the results obtained from such measurements is presented in Fig. 6. Data corresponding to a buffer and an O-PyC layer can be distinguished on the plot. These curves show that PyC isotropy is a scale function of the material. The isotropy thresholds are not the same for the buffer and the dense PyC. The buffer has a structural isotropy (at the scale of a
Accepted in Journal of Nuclear Materials
few tens of nanometers) whereas for the dense PyC a textural isotropy occurs at long range (at the scale of a few hundreds of nanometers or statistical isotropy).
Electron diffraction measurements of PyC isotropy provide data from nanometer to micrometer scale. This is the spatial resolution required to better understand the microstructure evolution under irradiation.
4. SiC microstructure
4.1. Grain structure and morphology
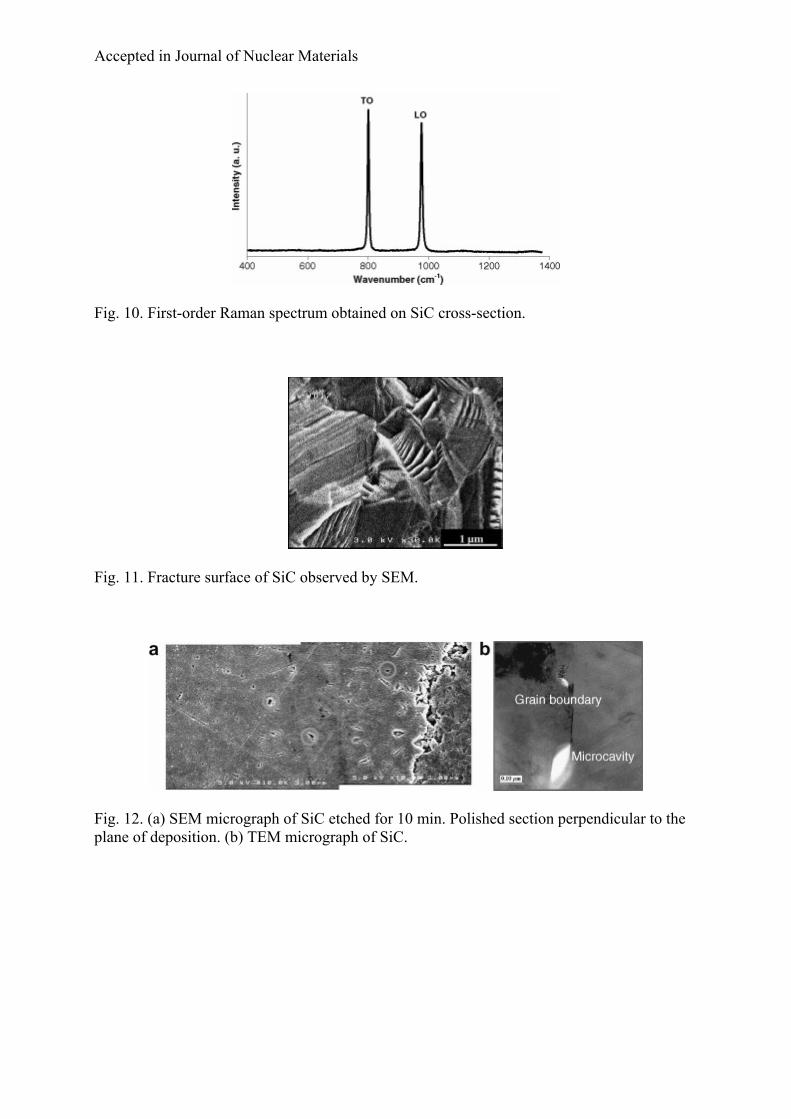
Etching reveals the presence of fine columnar grains in the equatorial polished section (Fig. 7(a)). The width and length are about 1 μm and about 4–5 μm, respectively. It seems that the etching is stronger in the first microns of near the I-PyC/SiC interface (Fig. 7(a)). This phenomenon may be due to the existence of very small grains. This heterogeneous microstructure is confirmed by EBSD measurements. EBSD maps illustrate the grain size distribution and show that finer grains are present at the beginning of the SiC coating and coarser at the end [10]. The interface between I-PyC and SiC is expected to be strong, because the small SiC grains can penetrate into the I-PyC porosities (the outer surface of the I-PyC is rough and porous). A tightly bonded I-PyC/SiC interface is important because bond separation can result in stress concentration in the SiC layer that may lead to the failure.
Moreover the etched grains exhibit many apparent planar faults, which cross the entire grain or stop inside (Fig. 7(b)). They are relatively homogeneously dispersed over the grains and often tend to exhibit a particular orientation relationship at about 70° to each other (Fig. 7(c)). Similar features were evidenced by Gulden, from General Atomic, in the 1970s [9].
Grains exhibit a preferred orientation during growth. The pole figures obtained by EBSD analysis (Fig. 8) show that there is a low 1 1 1 fiber texture (1 1 1 pole parallel to the growth direction). This preferred orientation is commonly observed in CVD SiC deposits [10]. A more comprehensive paper has been published in particular on EBSD analysis of the SiC coatings [11].
TEM examination at higher magnification confirms the previously described grain dimensions and morphology, and demonstrates the occurrence of sub-grains in some of them (the coarser ones). Two sub-grains can be observed in Fig. 9(a): one with dark contrast and another isomorph with a grey one. According to the SAED diagrams, the crystallographic nature of the coating is β-SiC. SiC exists in a wide variety of crystallographic forms known as polytypes, which differ from one another only in the (1 1 1) stacking of the SiC diatomic layers (Si–C). β-SiC or 3C is the cubic form of SiC. When the deposit is observed along the [112,Ō] direction, stacking faults oriented parallel with the (1 1 1) planes, can be identified.
Fig. 9(b) shows an example of such stacking faults on a {1 1 1} β-SiC surface. It is interesting to note that the dihedral {1 1 1} angle between two set of stacking faults that intersect is 70.5°, i.e. similar to what is observed on the etched SiC (Fig. 7). This is the interplanar angle of crystallographically equivalent (1 1 1) planes.
Accepted in Journal of Nuclear Materials
HR-TEM observations show that regular hexagonal faulted structures (polytype with large period) are not abundant. It is more common to find some random stacking faults which correspond to one-dimensionally disordered polytype [12]. In this case, diffuse streaking of lesser intensity appears in the (1 1 1) directions on the corresponding SAED diagram. The fact that hexagonal polytypes (α-SiC) are not abundant is confirmed by X-ray diffraction (XRD) (Fig. 5) and Raman microspectrometry analysis (Fig. 10). The α phase was never detected with either technique. Raman spectra show two sharp peaks at 797 cm−1 (transverse optic: TO) and 976 cm−1 (longitudinal optic: LO), typical of the 3C polytype. The fact that there is no evidence of any secondary phase contradicts earlier results [13] reporting a small fraction of α-SiC measured by XRD, although the processing conditions were not exactly the same.
From the literature, several possibilities can account for the existence of the stacking faults [14]. Stacking faults can be created during growth or introduced by slippage of dislocations after growth. As the stacking fault energy in 3C–SiC is negative (about −3 mJ/m2 [15]), they can occur frequently.
4.2. Grain boundaries
The quality of grain boundaries is of considerable interest because they play an important role during the migration of fission products. Preliminary observations directly on fracture surfaces reveal that cleavage is mainly transgranular (hackle marks in Fig. 11). This is in line with high-purity and porosity-free grain boundaries. This feature is confirmed by TEM examination and energy dispersive X-ray (EDX) spectrometry coupled with TEM. No intergranular porosity is apparent and EDX results suggest that no segregation exists. It may thus be concluded that such grain boundaries are of high quality.
4.3. Evidence of flaws as potential cracks
SEM observations of fracture surfaces and external cap show no apparent pores. It would thus appear that there is no crack initiator in the SiC deposit. This feature was checked by using a short etching procedure which revealed some potential cracks: microcavities are present in the area close to the SiC/I-PyC interface (rings in Fig. 12(a)). These microcavities are also detected by TEM examinations (Fig. 12(b)). When the internal gas pressure increases, a tensile hook stress can develop in the SiC layer, flaws can then propagate and generate radial cracks in the SiC deposit.
4.4. Chemical analyses
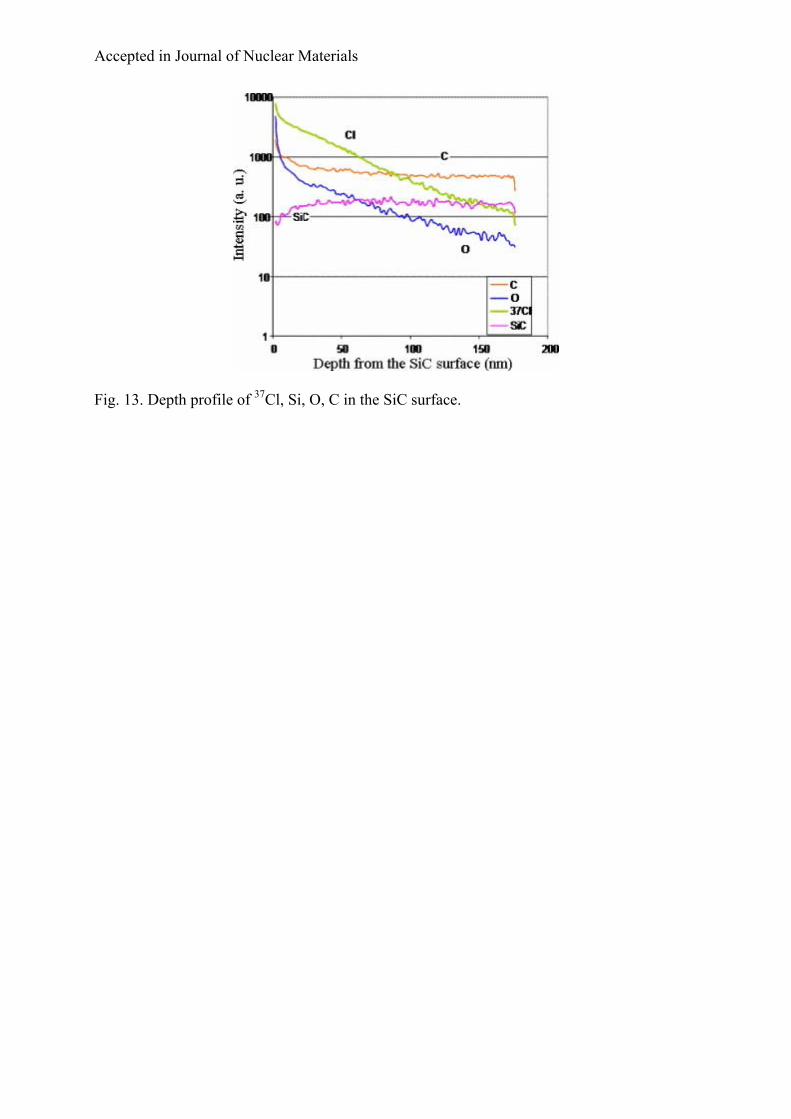
Chlorine, which may be a residue of the CH3SiCl3 gas precursor, was analyzed by electron probe microanalysis (EPMA) on cross sections. Under irradiation, the stable isotope 37Cl becomes radioactive (as 36Cl), so it is of great importance that the deposit contains no chlorine to prevent the release of radioactivity into the environment. The results indicate that it is present in only very small amounts, its concentration is always less than 15 ppm. Additional data are obtained by depth profiles recorded by static secondary ion mass spectrometry (SSIMS). Chlorine is more abundant at the extreme surface but its depth-concentration decreases very rapidly (Fig. 13).
As already noted, all the deposits characterized by Raman microspectrometry consist exclusively of β-SiC. Raman spectra also demonstrate that there is no excess carbon and
Accepted in Journal of Nuclear Materials
silicon. These results are corroborated by EPMA analysis indicating that the SiC stoichiometry is very close to 1 (Si/C = 1.02).
5. Conclusion
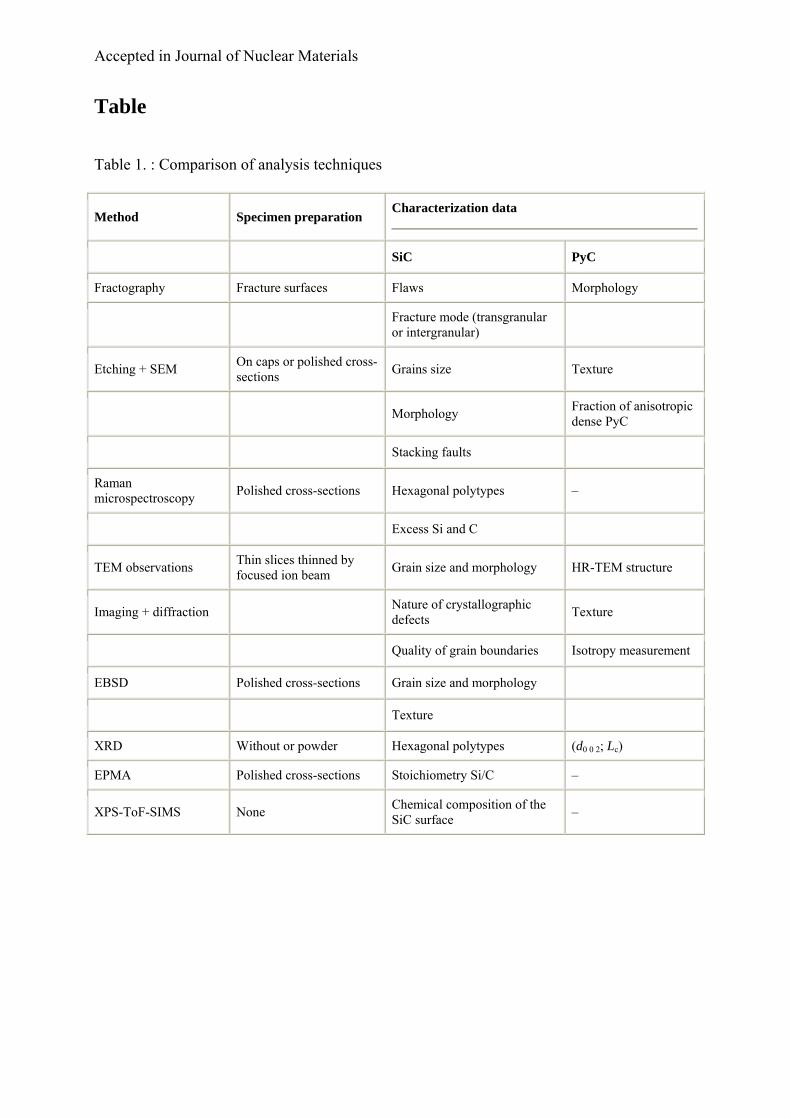
Various characterization methods which could become standards for qualification of coated HTR fuel particles have been developed. Some of them had already been used in the 1970s, such as XRD, SEM and TEM. Other analytical procedures have been investigated such as isotropy measurement of PyC by electron diffraction and FIB sampling, asserting the true porosity at TEM scale without artifacts. Table 1 summarizes the inputs of each analysis method used.
Acknowledgements
The authors wish to thank M. Pérez for fabricating the specimen, P.H. Jouneau for performing EBSD measurements, G. Chollon for useful discussion and AREVA NP for it financial support.
References
[1] E. Pollmann, J. Pélissier, C.S. Yust and J.L. Kaae, Nucl. Technol. 35 (1977), p. 301.
[2] D.P. Harmon and C.B. Scott, Nucl. Technol. 35 (1977), p. 343.
[3] D.A. Petti, J. Buongiorno, J.T. Maki, R.R. Hobbins and G.K. Miller, Nucl. Eng. Design 222 (2003), p. 281.
[4] F. Charollais, S. Fonquernie, C. Perrais, M. Pérez, O. Dugne, F. Cellier and M.P. Vitali, Nucl. Eng. Design 236 (2006), p. 534
[5] J.L. Kaae, Carbon 23 (1985), p. 665.
[6] J.C. Bokros In: P.L. Walker Jr., Editor, Chemistry and Physics of Carbon vol. 5, Marcel Dekker, New York (1969), p. 1.
[7] D. Hélary, X. Bourrat ,O. Dugne, F. Cellier, in: Proceedings of the ENC 2005, Versailles, 2005.
[8] X. Bourrat, B. Trouvat, G. Limousin and G. Vignoles, J. Mater. Res. 15 (2000), p. 92.
[9] T.D. Gulden, J. Am. Ceram. Soc. 51 (1968), p. 424.
[10] J. Chin, P.K. Gantzel and R.G. Hudson, Thin Solid Films 40 (1977), p. 57.
[11] D. Hélary, O. Dugne, X. Bourrat, P.H. Jouneau and F. Cellier, J. Nucl. Mater. 350 (2006), p. 332.

Accepted in Journal of Nuclear Materials
[12] S. Schamm, A. Mazel, D. Dorignac and J. Sévely, Microsc. Microanal. Microstruct. 2 (1991), p. 59.
[13] G. Uny, J.P. Morlevat, CEA internal Report DMECN/DMG/SEM Compte-rendu n°107, 1976.
[14] C. Ragaru, Études par microscopie électronique en transmission de la transformation de phase β-SiC → α-SiC par maclage, PhD thesis, Université de Nantes, 1997.
[15] H. Iwata, Mater. Sci. Forum 389–393 (2002), p. 439.
Accepted in Journal of Nuclear Materials
Figures
Fig. 1. Particle cross-section showing the kernel, the buffer, the inner PyC (I-PyC), the SiC and the outer PyC (O-PyC).
Fig. 2. Fracture surfaces observed by SEM of (a) the buffer and (b) the dense I-PyC.
Fig. 3. Polished and etched cross-section of the dense I-PyC observed by SEM.
Accepted in Journal of Nuclear Materials
Fig. 4. HR-TEM micrographs of different pyrocarbons: (a) the buffer and (b) the I-PyC. Lattice fringe images correspond to the (0 0 2) carbon layers.
Fig. 5. The XRD pattern of HTR particles.
Fig. 6. Typical plot of the electron diffraction data for the buffer and for the dense PyC: OA versus the selected area for the diffraction.
Accepted in Journal of Nuclear Materials
Fig. 7. SEM micrographs of SiC etched for 60 min (a) polished section perpendicular to the plane of deposition showing columnar grains; (b) and (c) sections parallel to the plane of deposition showing planar faults.
Fig. 8. {1 1 1} pole figure showing the texture of SiC coatings.
Fig. 9. (a) Bright field TEM image showing a columnar β-SiC grain divided into sub-grains, (b) HR-TEM image showing stacking faults lying on {1 1 1} planes.
Accepted in Journal of Nuclear Materials
Fig. 10. First-order Raman spectrum obtained on SiC cross-section.
Fig. 11. Fracture surface of SiC observed by SEM.
Fig. 12. (a) SEM micrograph of SiC etched for 10 min. Polished section perpendicular to the plane of deposition. (b) TEM micrograph of SiC.
Accepted in Journal of Nuclear Materials
Fig. 13. Depth profile of 37Cl, Si, O, C in the SiC surface.
Accepted in Journal of Nuclear Materials
Table
Table 1. : Comparison of analysis techniques
Method Specimen preparation Characterization data
SiC PyC
Fractography Fracture surfaces Flaws Morphology
Fracture mode (transgranular or intergranular)
Etching + SEM On caps or polished cross-sections Grains size Texture
Morphology Fraction of anisotropic dense PyC
Stacking faults
Raman microspectroscopy Polished cross-sections Hexagonal polytypes –
Excess Si and C
TEM observations Thin slices thinned by focused ion beam Grain size and morphology HR-TEM structure
Imaging + diffraction Nature of crystallographic defects Texture
Quality of grain boundaries Isotropy measurement
EBSD Polished cross-sections Grain size and morphology
Texture
XRD Without or powder Hexagonal polytypes (d0 0 2; Lc)
EPMA Polished cross-sections Stoichiometry Si/C –
XPS-ToF-SIMS None Chemical composition of the SiC surface –