advanced distribution management system testbed development · 2020-01-24 · 2017 adms program...
TRANSCRIPT
2017 ADMS ProgramSteering Committee Meeting
Advanced Distribution Management System Testbed DevelopmentMurali Baggu, Manager Annabelle Pratt, Principal EngineerEnergy Systems Optimization and ControlNREL Power Systems Engineering Center
October 11, 2017

ADMS Testbed Development
Objectives & Outcomes
Life-cycle Funding Summary ($K)
Objective: Establish a national, vendor-neutral Advanced
Distribution Management System (ADMS) testbed to
accelerate industry development and adoption of ADMS
capabilities for the next decade and beyond.
Outcome: The testbed will enable utility partners, vendors,
and researchers to evaluate existing and future ADMS use
cases in a test setting that provides a realistic combination of
multiple utility management systems and field equipment.
The project will work closely with an Industry Steering Group
to ensure that electric utility needs are met and use cases
are realistic and valuable.
2
FY16,
authorized
FY17,
authorized
FY18,
requested
Out-year(s)
1.5M 1.2M 1.8M NA
Technical Scope
➢ Model large scale distribution systems for evaluating
ADMS applications
➢ Integrate distribution system hardware in ESIF to
simulations for PHIL experimentation
➢ Develop advanced visualization capability to analyze
the results for mock utility distribution system
➢ Use case 0: Volt-VAR Optimization with PV Inverters,
Use case 2: Data remediation/Model Improvement needs,
Use case 3: Integrated application demonstration
IEEE8500u:Power
1640000 1660000 1680000 1700000 1720000 1740000
X
12240000
12260000
12280000
12300000Y
Substation
Inv 1&2
Voltage Regulator
Capacitor Bank
PV Inverter
Legend
Recloser
OMS
DERMS
A
So wareSimula on
kWPower-Hardware-in-the-loop
ControllerHardware-in-the-
loop
Realis cU lity
Communica on
Integra onTes ng
3
• Project context
• Project status
o Task 1: IAB update
o Task 2: Use cases
o Task 3 and 4: Use case 0
o Task 3 and 5: Test bed and visualization capabilities for use case 1
o Task 6: Project management and budget update
• FY 2018 plan
o Use case 1 Execution
o Use case 2 Design
• Tech transfer activities
Presentation outline
4
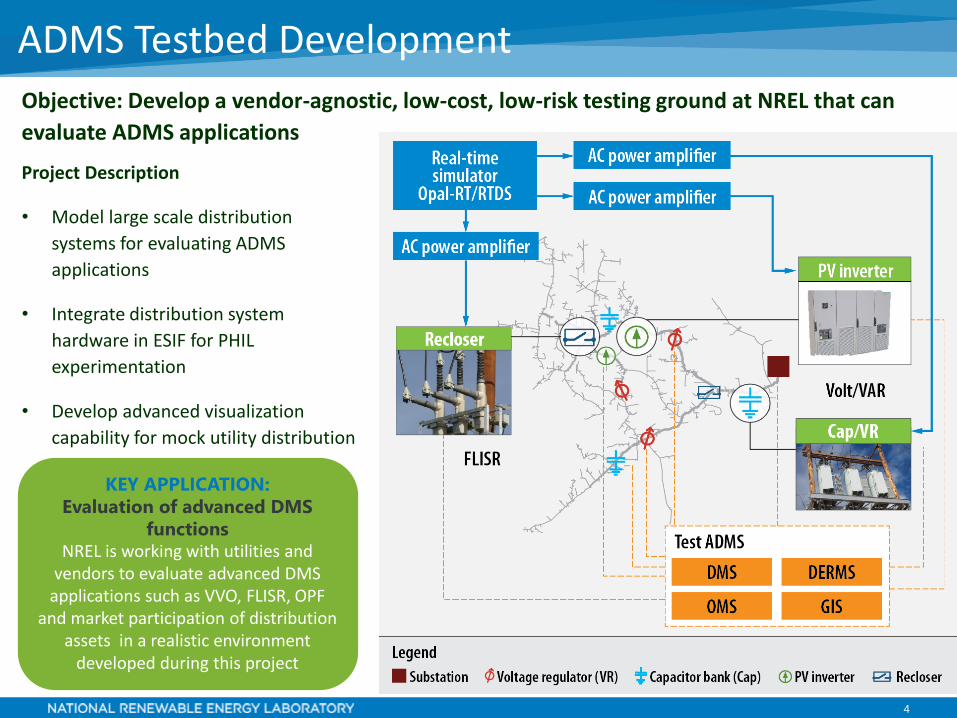
Project Description
• Model large scale distribution
systems for evaluating ADMS
applications
• Integrate distribution system
hardware in ESIF for PHIL
experimentation
• Develop advanced visualization
capability for mock utility distribution
system operator’s control room.
ADMS Testbed Development
KEY APPLICATION:
Evaluation of advanced DMS
functionsNREL is working with utilities and
vendors to evaluate advanced DMS applications such as VVO, FLISR, OPF
and market participation of distribution assets in a realistic environment
developed during this project
Objective: Develop a vendor-agnostic, low-cost, low-risk testing ground at NREL that can
evaluate ADMS applications
5
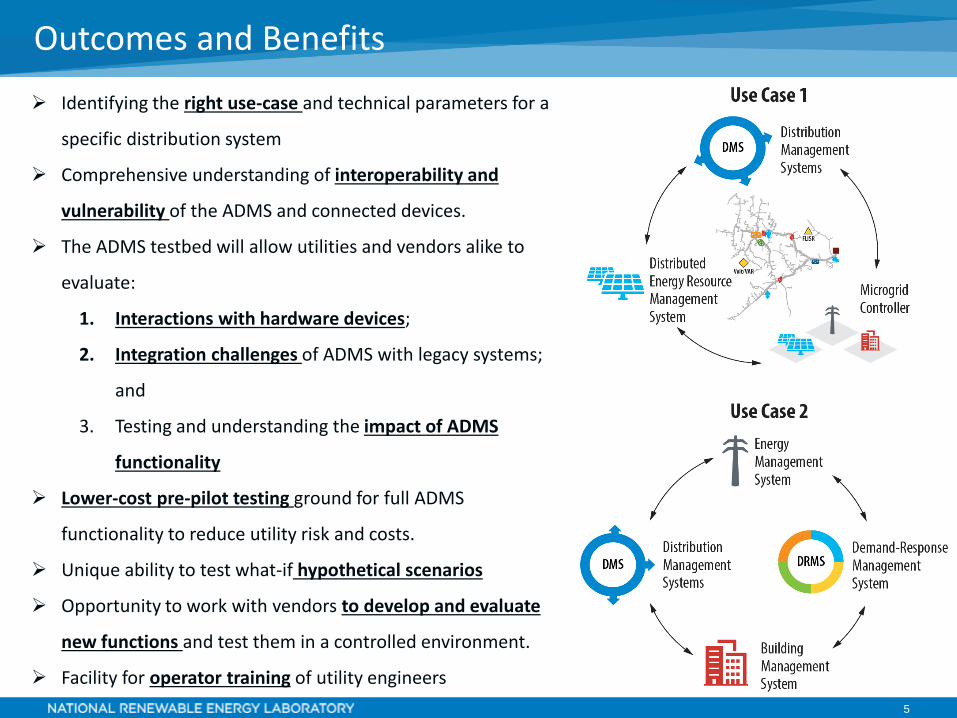
Outcomes and Benefits
➢ Identifying the right use-case and technical parameters for a
specific distribution system
➢ Comprehensive understanding of interoperability and
vulnerability of the ADMS and connected devices.
➢ The ADMS testbed will allow utilities and vendors alike to
evaluate:
1. Interactions with hardware devices;
2. Integration challenges of ADMS with legacy systems;
and
3. Testing and understanding the impact of ADMS
functionality
➢ Lower-cost pre-pilot testing ground for full ADMS
functionality to reduce utility risk and costs.
➢ Unique ability to test what-if hypothetical scenarios
➢ Opportunity to work with vendors to develop and evaluate
new functions and test them in a controlled environment.
➢ Facility for operator training of utility engineers

6
Overall Project Timeline and Key Tasks
04/ 16- 04/17 04/ 17- 04/18 04/ 18- 04/19
Significant Milestones Date
Develop a testbed for ADMS using intrinsic DMS power flow. 04/15/2017
Develop a test plan specifying tests to be conducted in Year 2. 04/15/2017
7
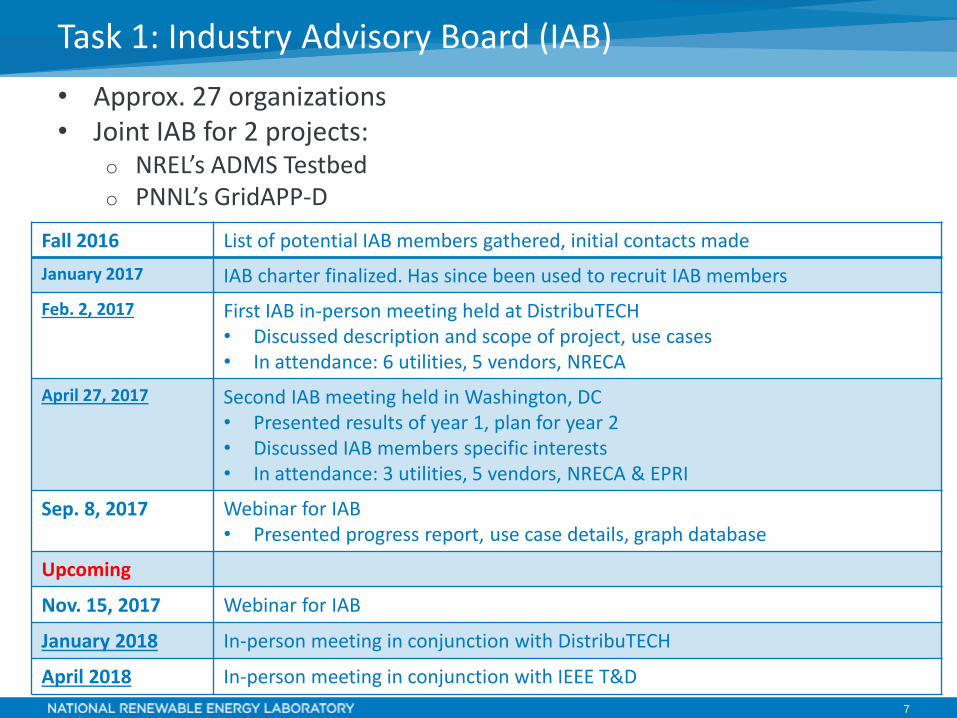
Task 1: Industry Advisory Board (IAB)
• Approx. 27 organizations• Joint IAB for 2 projects:
o NREL’s ADMS Testbedo PNNL’s GridAPP-D
Fall 2016 List of potential IAB members gathered, initial contacts made
January 2017 IAB charter finalized. Has since been used to recruit IAB members
Feb. 2, 2017 First IAB in-person meeting held at DistribuTECH• Discussed description and scope of project, use cases• In attendance: 6 utilities, 5 vendors, NRECA
April 27, 2017 Second IAB meeting held in Washington, DC• Presented results of year 1, plan for year 2• Discussed IAB members specific interests• In attendance: 3 utilities, 5 vendors, NRECA & EPRI
Sep. 8, 2017 Webinar for IAB• Presented progress report, use case details, graph database
Upcoming
Nov. 15, 2017 Webinar for IAB
January 2018 In-person meeting in conjunction with DistribuTECH
April 2018 In-person meeting in conjunction with IEEE T&D
8
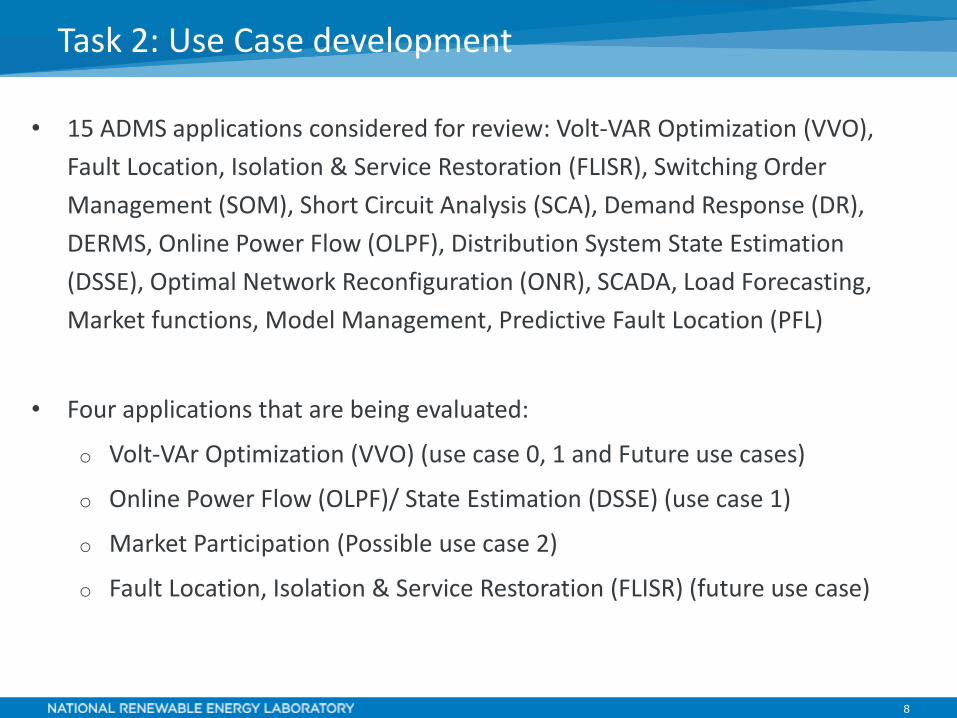
• 15 ADMS applications considered for review: Volt-VAR Optimization (VVO),
Fault Location, Isolation & Service Restoration (FLISR), Switching Order
Management (SOM), Short Circuit Analysis (SCA), Demand Response (DR),
DERMS, Online Power Flow (OLPF), Distribution System State Estimation
(DSSE), Optimal Network Reconfiguration (ONR), SCADA, Load Forecasting,
Market functions, Model Management, Predictive Fault Location (PFL)
• Four applications that are being evaluated:
o Volt-VAr Optimization (VVO) (use case 0, 1 and Future use cases)
o Online Power Flow (OLPF)/ State Estimation (DSSE) (use case 1)
o Market Participation (Possible use case 2)
o Fault Location, Isolation & Service Restoration (FLISR) (future use case)
Task 2: Use Case development

Year 1 results: Task 3 and 4 : Execution
of Use Case 0 - Volt-VAR Use Case
Evaluation on ADMS Testbed
Murali Baggu

10
Duke, NREL, & GE: Advanced Inverters and ADMS for Hi-Pen PV
Simulation (5MW PV 2mi out on 5MW peak rural feeder)• Simulation using actual DMS system deployed at Duke (via
GE’s eTerra Distribution Operations Training System (DOTS))
• GE has enabled faster than real-time time series analysis and supports advanced inverter modeling through Python (py4etd)
• Simulation of:• Baseline: PV active power only• Local Control: PV Volt/VAr modes• Central control: DMS-based IVVC application
Summary: Detailed system modeling, combined with Power-Hardware-in-the-Loop verification to compare local vs. centralized management of voltage with utility-scale inverters in Duke territory
ADMS Testbed: Power Hardware-in-the-Loop (PHIL) in ESIF• Co-simulation with DOTS to capture entire feeder• Validate simulations: actual hardware at power• 500 kVA advanced inverter
11
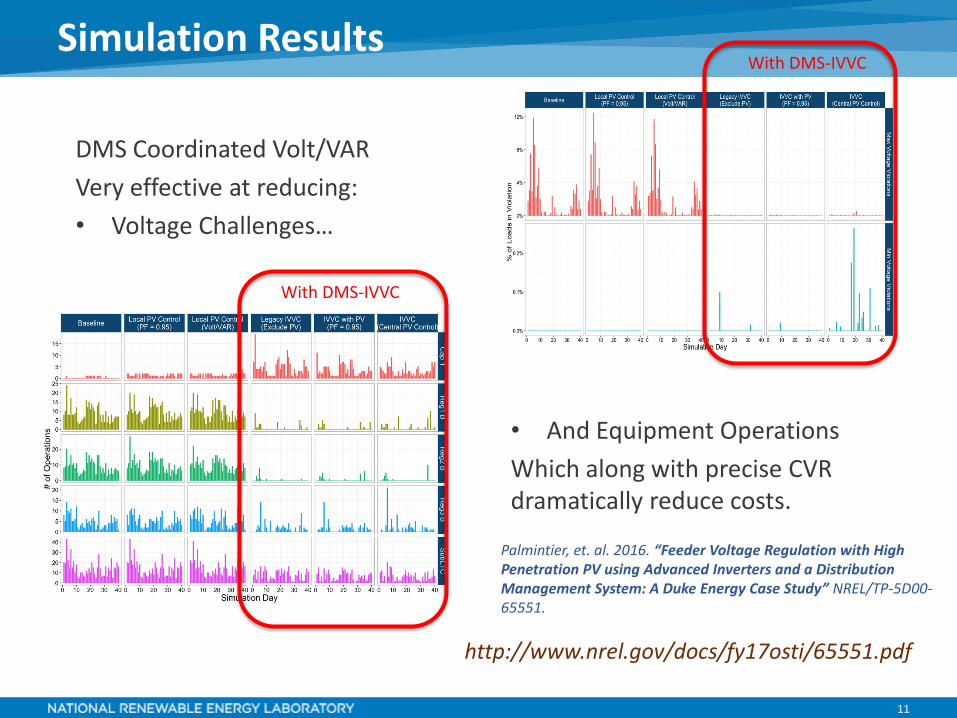
Simulation Results
DMS Coordinated Volt/VAR
Very effective at reducing:
• Voltage Challenges…
• And Equipment Operations
Which along with precise CVR dramatically reduce costs.
Palmintier, et. al. 2016. “Feeder Voltage Regulation with High Penetration PV using Advanced Inverters and a Distribution Management System: A Duke Energy Case Study” NREL/TP-5D00-65551.
With DMS-IVVC
With DMS-IVVC
http://www.nrel.gov/docs/fy17osti/65551.pdf
12
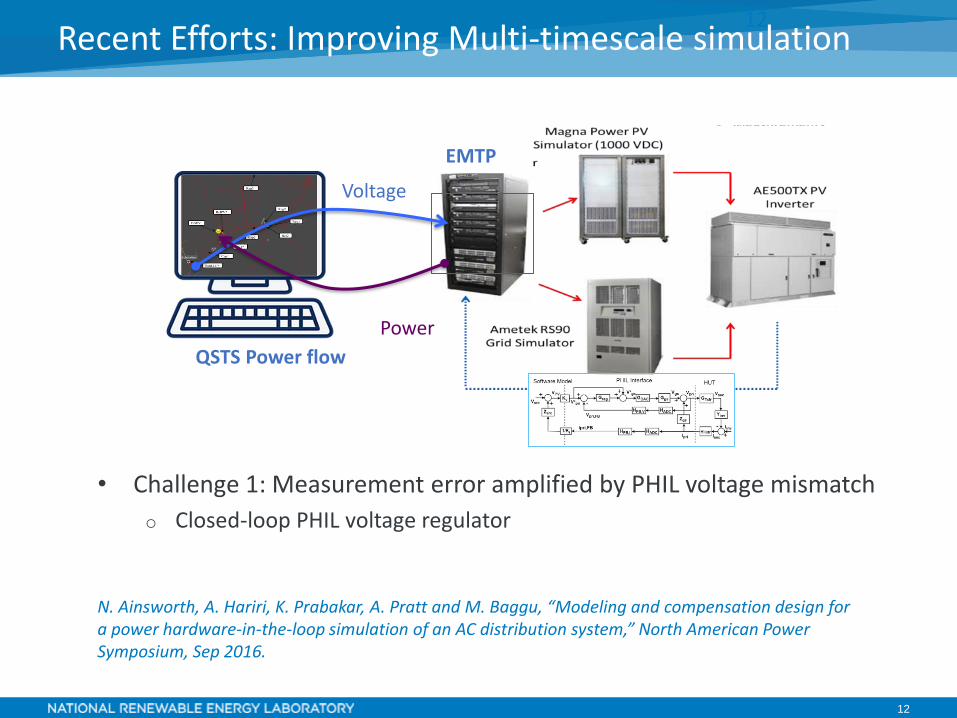
Recent Efforts: Improving Multi-timescale simulation12
N. Ainsworth, A. Hariri, K. Prabakar, A. Pratt and M. Baggu, “Modeling and compensation design for a power hardware-in-the-loop simulation of an AC distribution system,” North American Power Symposium, Sep 2016.
QSTS Power flow
EMTP
Power
Voltage
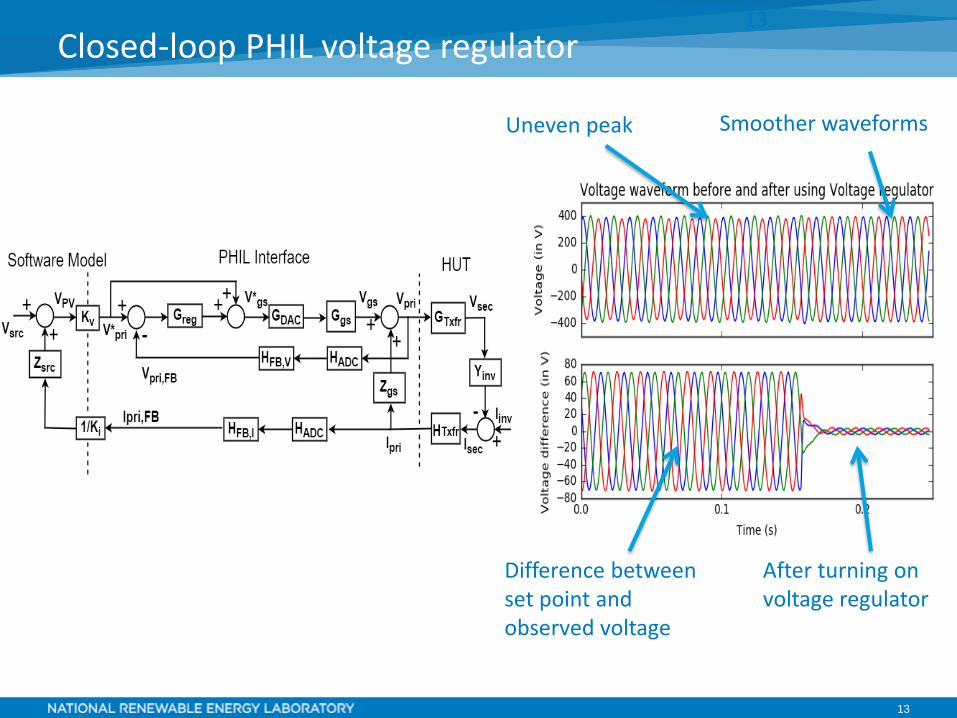
• Challenge 1: Measurement error amplified by PHIL voltage mismatch
o Closed-loop PHIL voltage regulator
4
Fig. 3. PV simulator response to RTS PV model under step variations inirradiance
of a PHIL could be attributed to inherent non-idealities in theinterface such as time delays, hardware bandwidth limitations,measurement noise, and harmonic distortions [17]. For thisreason, the choice of the proper PHIL interface algorithm iscrucial for the stability and accuracy of the experiment [17].
A detailed frequency domain analysis was performed toassess thestability of thePHIL setup and maintain theaccuracyof the results. The stability concerns were due to the commu-nication time delay and the measurement noise. In addition,the uncompensated PHIL loop was found to have poor ACvoltage tracking that was causing some inaccuracy betweenthe commanded voltage control signal and the voltage repli-cated at the terminals of the grid simulator. The implementedinterface for the PHIL setup is a modified form of a voltage-type ideal transformer model (VITM). The uncompensatedVITM was found to be unstable and inaccurate. Therefore, theconventional VITM interface wasmodified by adding avoltageregulation feedback loop and feedback compensators for thecurrent loop to maintain accuracy and stability. Fig. 4 showsthe PHIL voltage and current closed-loop feedback dynamicmodel including the proposed regulator and compensators(Gr eg, HF B ,V and HF B ,I ).
Fig. 4. Frequency-domain block diagram of the PHIL setup voltage andcurrent control loop
As shown in Fig. 4, the network model is represented by aThevenin equivalent following (3) where Zsr c is the equivalentimpedance seen by the PV system and Vpv and I pv are the
voltage and current outputs of the grid-tied PV system. Thedigital-to-analog and analog-to-digital interfaces of the RTS(GD A C and HA D C ) are modeled as unity gain and a timedelay, ∆ t , that represents the communication delay of theclosed-loop, i.e. GD A C = 1 and HA D C = e− s∆ t .
Vpv = Vsr c + Zsr cI pv (3)
Ggs is the transfer function representing the response ofthe grid simulator. Ggs given in (4) was obtained in [18]through intensive experimentation to characterize the behaviorof the grid simulator. In (4), f gs = 1950H z and Tgs = 50µs.The grid simulator also has an output filer represented by animpedance, Zgs, which contributes to some voltage rise at theAC terminals and leads to the poor voltage tracking. Zgs wasestimated experimentally.
Ggs =1
s2⇡ f g s
+ 1e− sTg s (4)
The HUT is made up of the interface transformer and theinverter. The transformer is a 187V |480V rated, wye-wyeconnected transformer. The primary side (rated at 480V ) isconnected to the grid simulator, while the secondary side (ratedat 187V ) is connected to the inverter AC side. GT x f r andHT x f r are modeled as ideal transformation ratio according to(5).
GT x f r = HT x f r =187
480(5)
The inverter is modeled as a current source with a delta-connected AC filer impedance, Yi n v , connected to the sec-ondary side of the transformer. Yi n v is given in (6).
Yi n v =
2
4− 2
Z i n v
1Z i n v
1Z i n v
1Z i n v
− 2Z i n v
1Z i n v
1Z i n v
1Z i n v
− 2Z i n v
3
5 (6)
Where Z i n v = Ri n v + 1sC i n v
.According to [17], the open-loop response of a conventional
VITM in (7) is stable when |k v k − 1
i Z s r c ( j ! )
Z L ( j ! )| < 18! . How-
ever, when considering the grid simulator response delay andimpedance, the open-loop response of the uncompensated (i.e.HF B ,V = HF B ,I = 1 and Gr eg = 0) takes the form presentedin (8).
TOL ,con v =kv k− 1
i Zsr c
ZL
es∆ t (7)
Where ∆ t is the RTS communication delay.
TOL ,un com p =kv k− 1
i Zsr c
(ZL + Zgs)( s2⇡ f g s
+ 1)es(∆ t + Tg s ) (8)
The open-loop response of the uncompensated PHIL setuphas a negative gain margin as shown in Fig. 5 which leads toan unstable system. The instabili ty was also detected experi-mentally when the protection devices tripped as the experimentwent unstable. Therefore, feedback compensators (HF B ,V andHF B ,I ) were added. The feedback compensators are used tofilter out parasitic high frequency noise and introduce a gainrolloff at high frequencies to make sure that the PHIL time
13
Closed-loop PHIL voltage regulator13
Uneven peak
Difference between set point and observed voltage
Smoother waveforms
After turning on voltage regulator

14
14
QSTS Power flow
EMTP
Voltage
Power
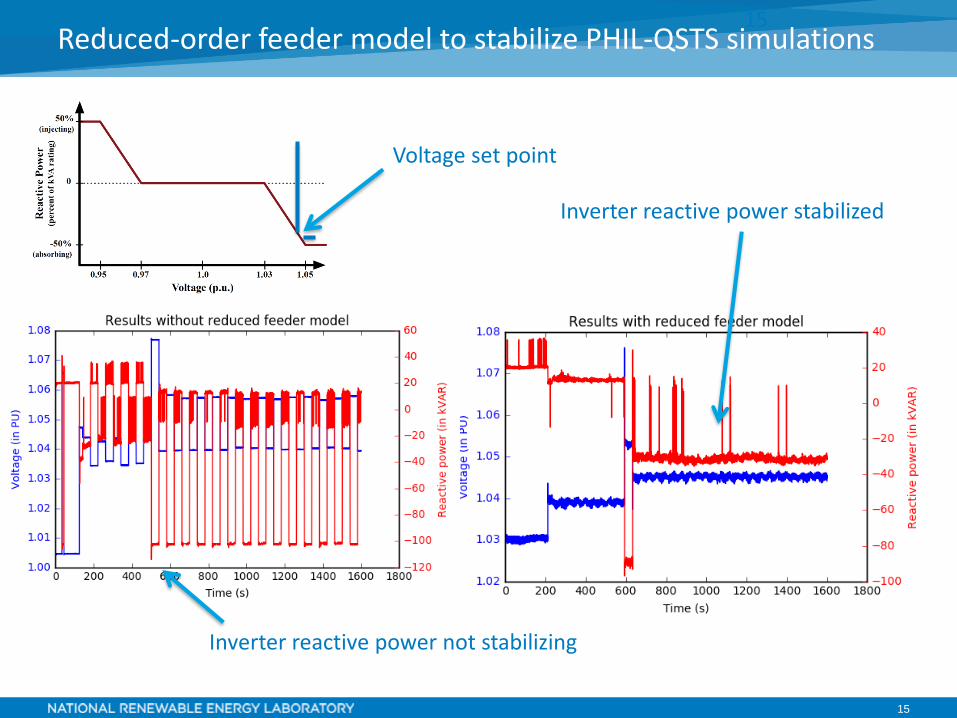
• Challenge 2: Large-scale QSTS grid simulation may too slow for faster PHIL-QSTS interactions.
o Reduced-order feeder model
Recent Efforts: Improving Multi-timescale simulation
A. Hariri, B. Palmintier, K. Prabakar, I. Mendoza, M. Baggu, and O. Faruque, “Multi-Rate Co-simulation with Power Hardware-in-the-Loop for Dynamic Analysis of Distribution Networks with Photovoltaic Systems,” IEEE Transactions on Industrial Electronics, In Preparation.
15
Reduced-order feeder model to stabilize PHIL-QSTS simulations 15
Inverter reactive power stabilized
Voltage set point
Inverter reactive power not stabilizing

16
Summary
• Steps were taken to stabilize DMS-in-the-loop simulations (DIL)
o Voltage regulator added
o Reduced-order feeder model built, added and tested for stable operation of DIL
• The modified DMS-in-the-loop was tested for three different operating modes of AE 500 PV inverter
• Results show stable and appropriate VAR injection by the inverter
• PHIL capability to connect to DMS systems developed
16

ADMS Testbed: Task 3 and 5: Use Case 1 and Capabilities
Annabelle Pratt and Murali Baggu, NREL
18
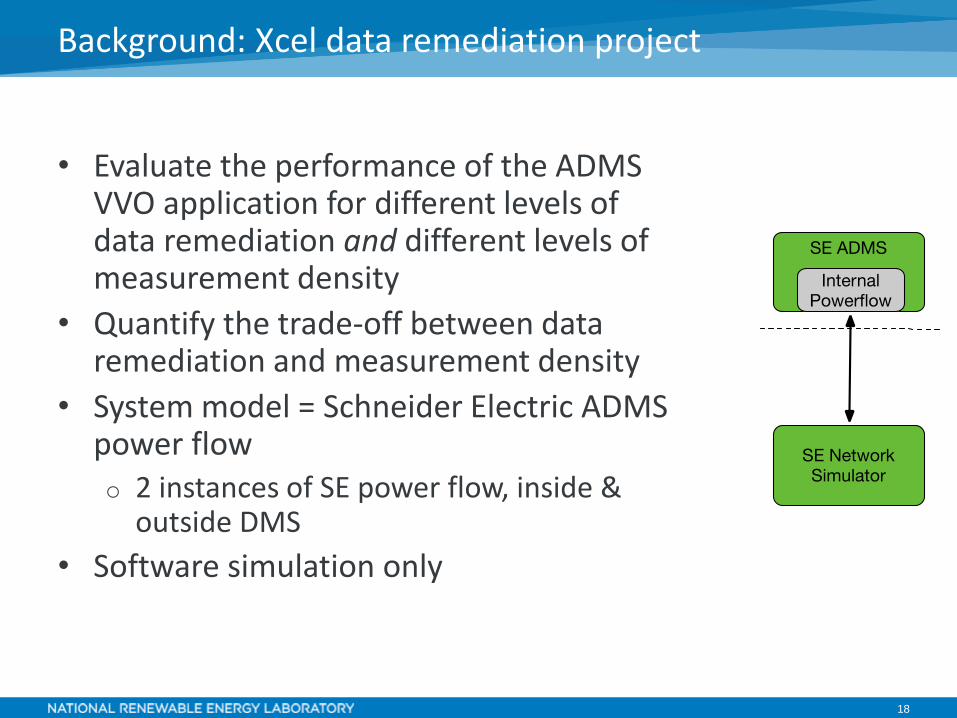
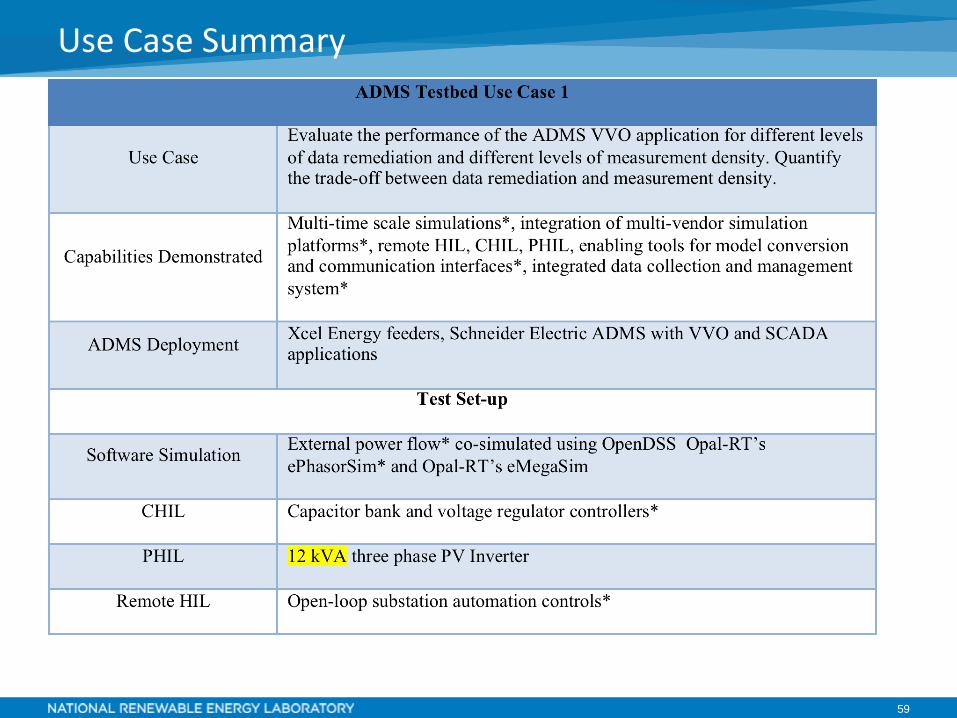
• Evaluate the performance of the ADMS VVO application for different levels of data remediation and different levels of measurement density
• Quantify the trade-off between data remediation and measurement density
• System model = Schneider Electric ADMS power flowo 2 instances of SE power flow, inside &
outside DMS
• Software simulation only
Background: Xcel data remediation project

19
• Evaluate the performance of the ADMS VVO application for different levels of data remediation and different levels of measurement density
• Quantify the trade-off between data remediation and measurement density
• Uses ADMS testbed to model systemo External system model
o OpenDSS and ePhasorSim
• PHIL and CHIL simulationo Realistic utility protocols
ADMS test bed Use Case 1
20
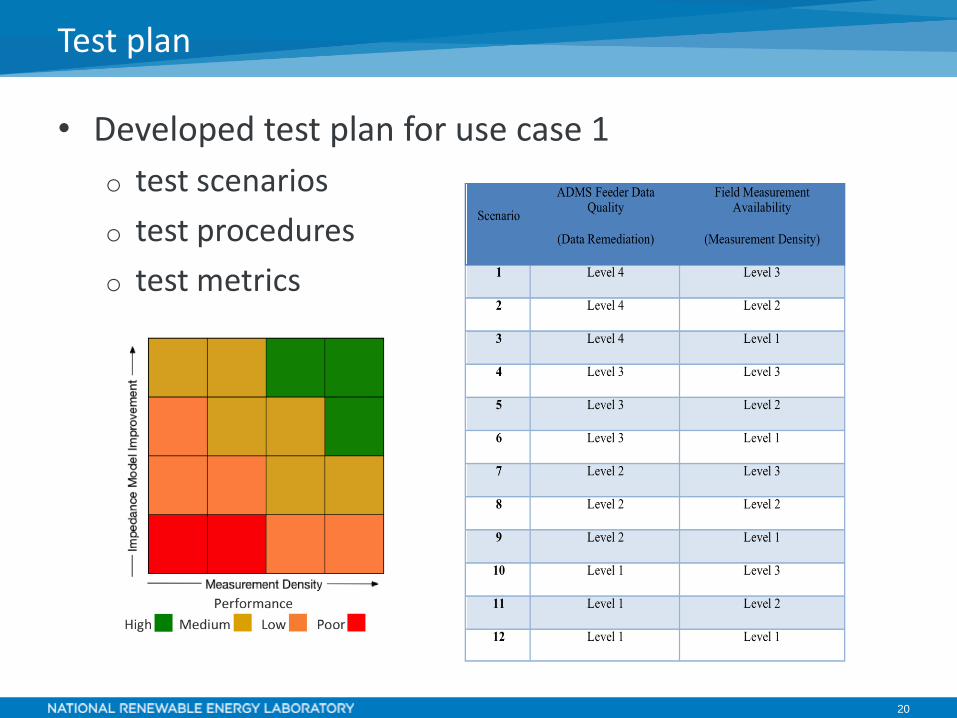
Test plan
• Developed test plan for use case 1
o test scenarios
o test procedures
o test metrics

21
• Aim to measure performance difference when lower quality model data is used
• Proposed primary test metric: deviation of voltages at all the distribution network nodes from the operational objective
o May update as VVO function is better understood
Test metrics
22
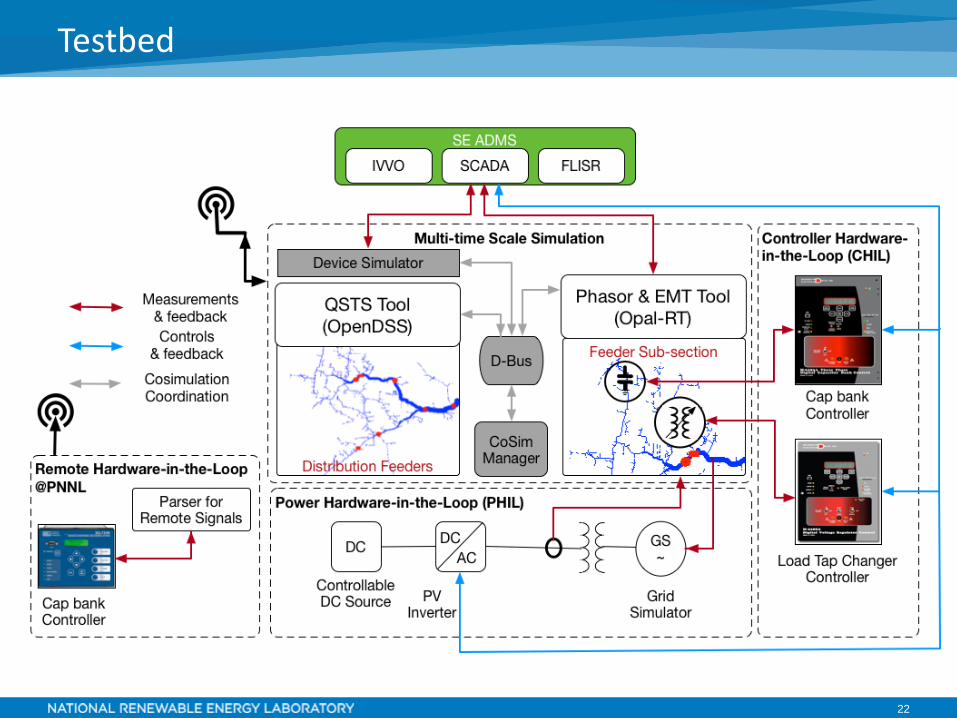
Testbed
23
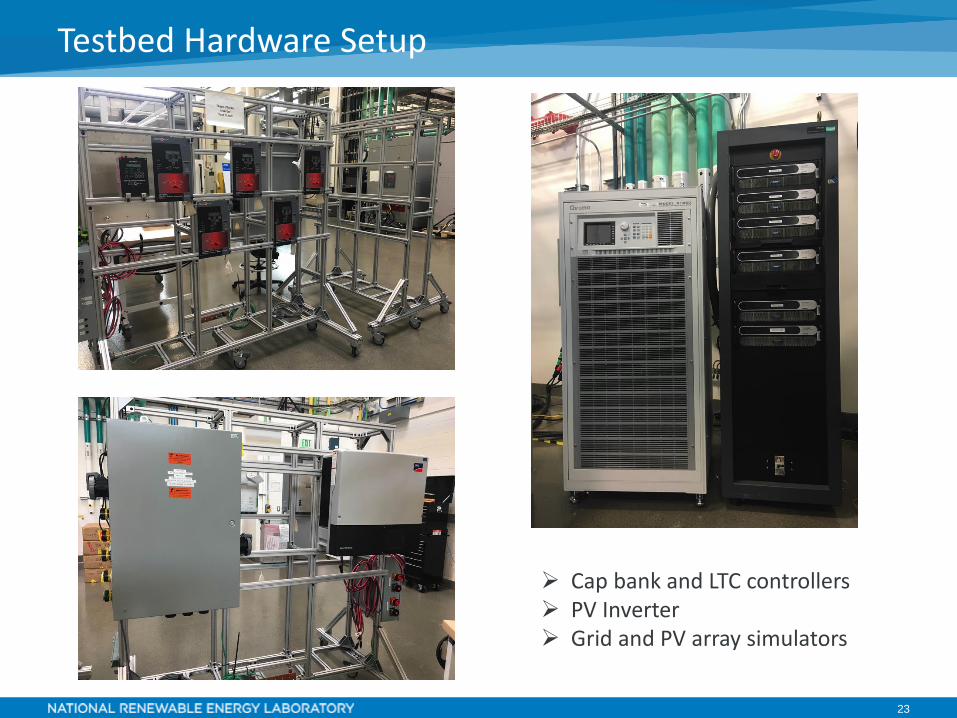
Testbed Hardware Setup
➢ Cap bank and LTC controllers➢ PV Inverter➢ Grid and PV array simulators
24
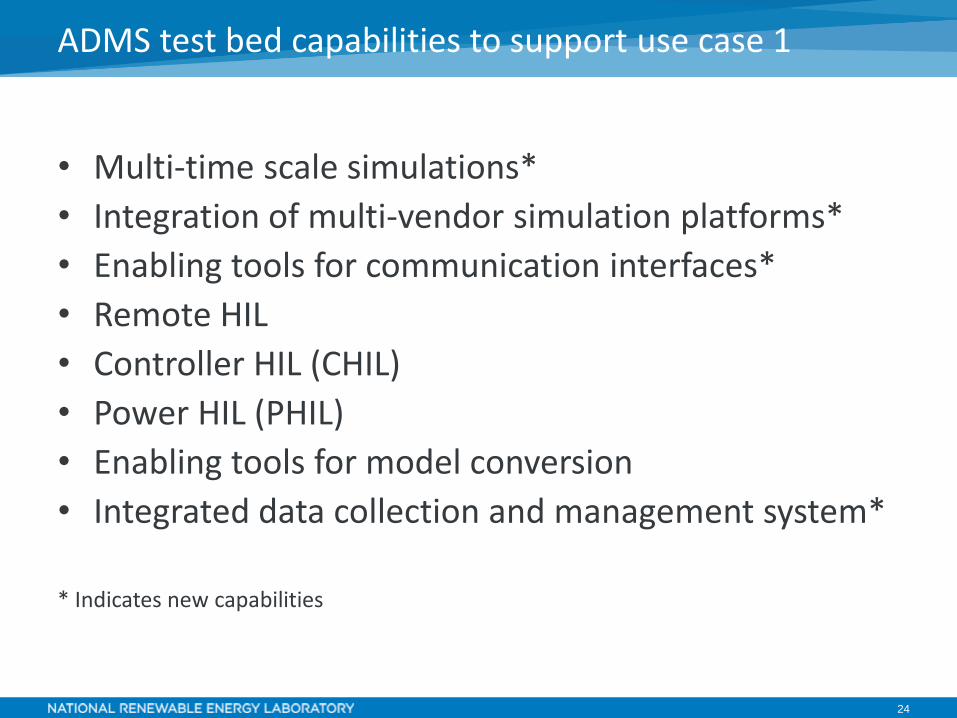
• Multi-time scale simulations*
• Integration of multi-vendor simulation platforms*
• Enabling tools for communication interfaces*
• Remote HIL
• Controller HIL (CHIL)
• Power HIL (PHIL)
• Enabling tools for model conversion
• Integrated data collection and management system*
* Indicates new capabilities
ADMS test bed capabilities to support use case 1
25
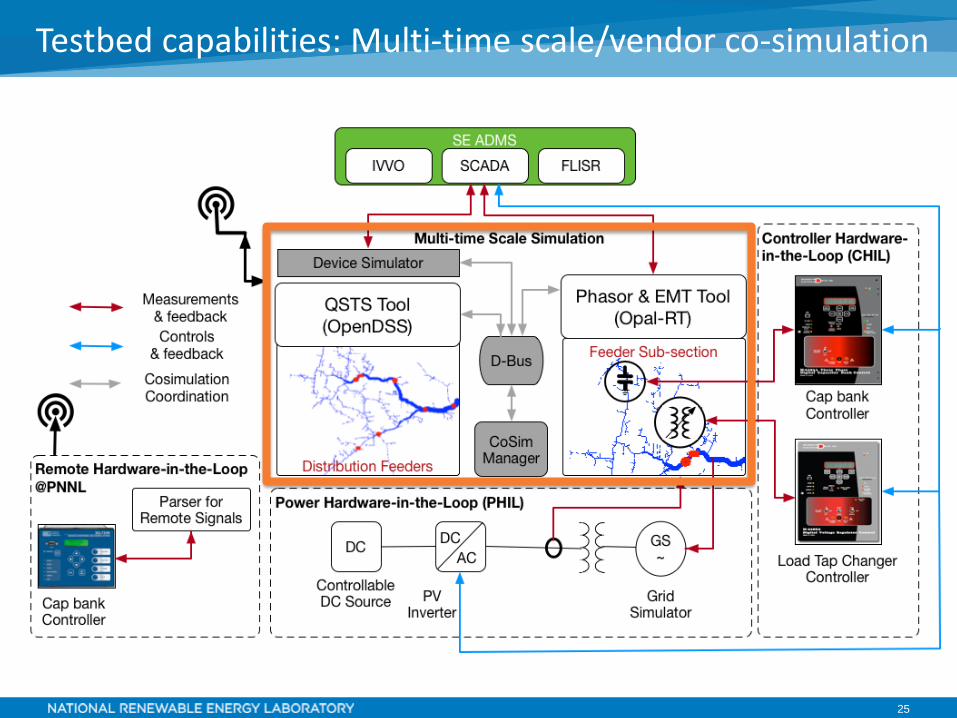
Testbed capabilities: Multi-time scale/vendor co-simulation

26
Co-Simulation Manager
• Coordinate simulation across multiple platforms
Data Bus Architecture (D-bus)
• Exchange data/control setpoints between platforms
• EPRI cost-share contribution
• Specification developed by EPRI and accepted by team
Device Simulators
• Enable OpenDSS to interface with SCADA through DNP3
• Under development by EPRI
• Meters, cap bank controller, PV inverter
Testbed capabilities: Multi-time scale/vendor co-simulation
27
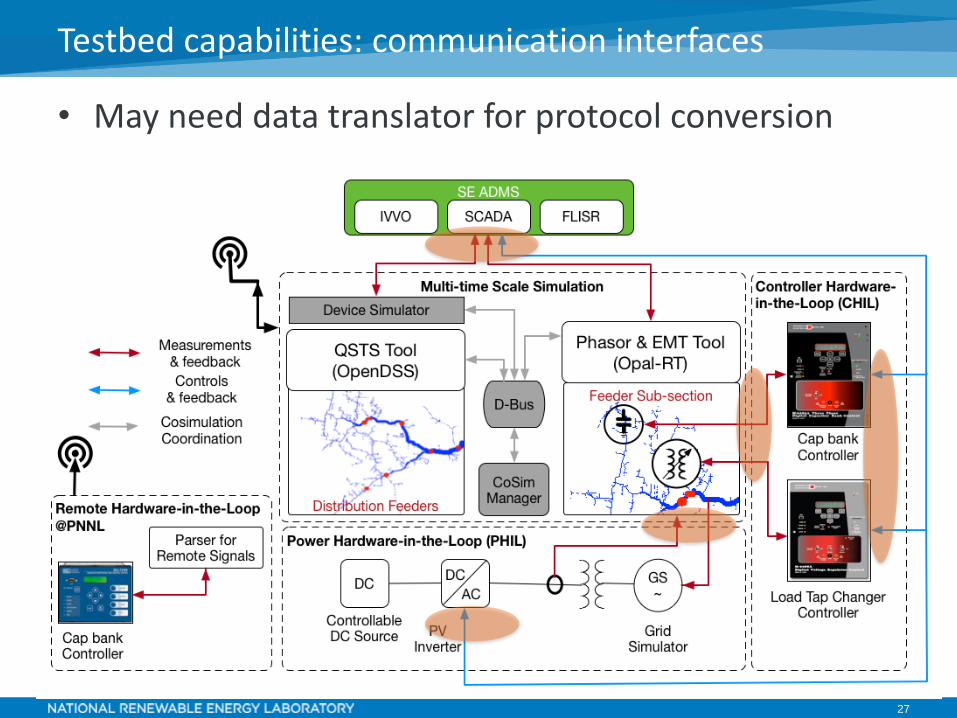
Testbed capabilities: communication interfaces
• May need data translator for protocol conversion
28
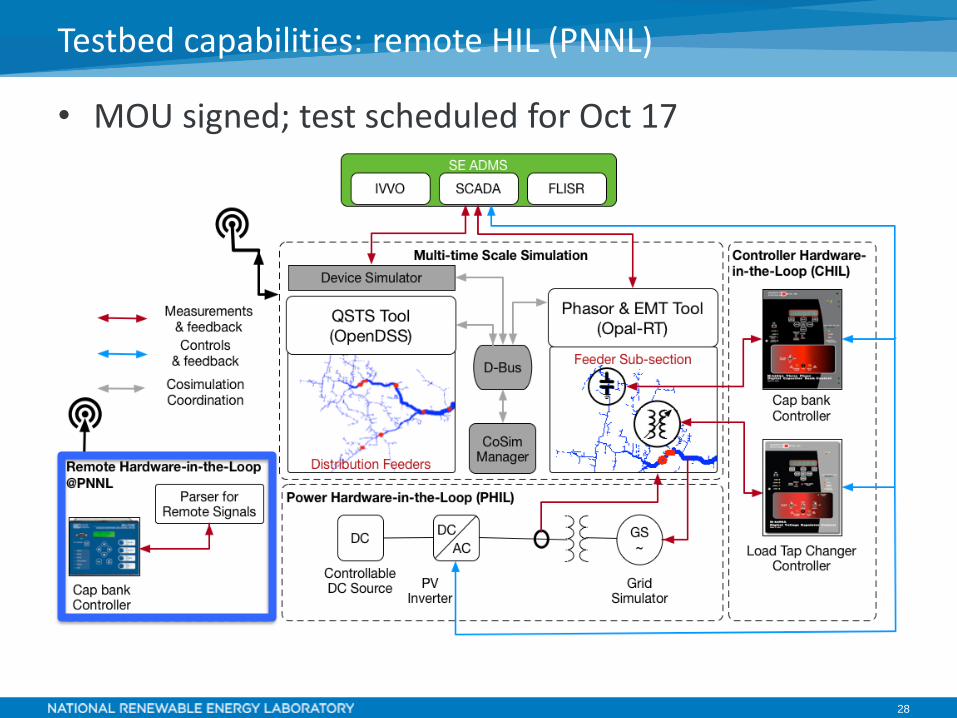
Testbed capabilities: remote HIL (PNNL)
• MOU signed; test scheduled for Oct 17
29
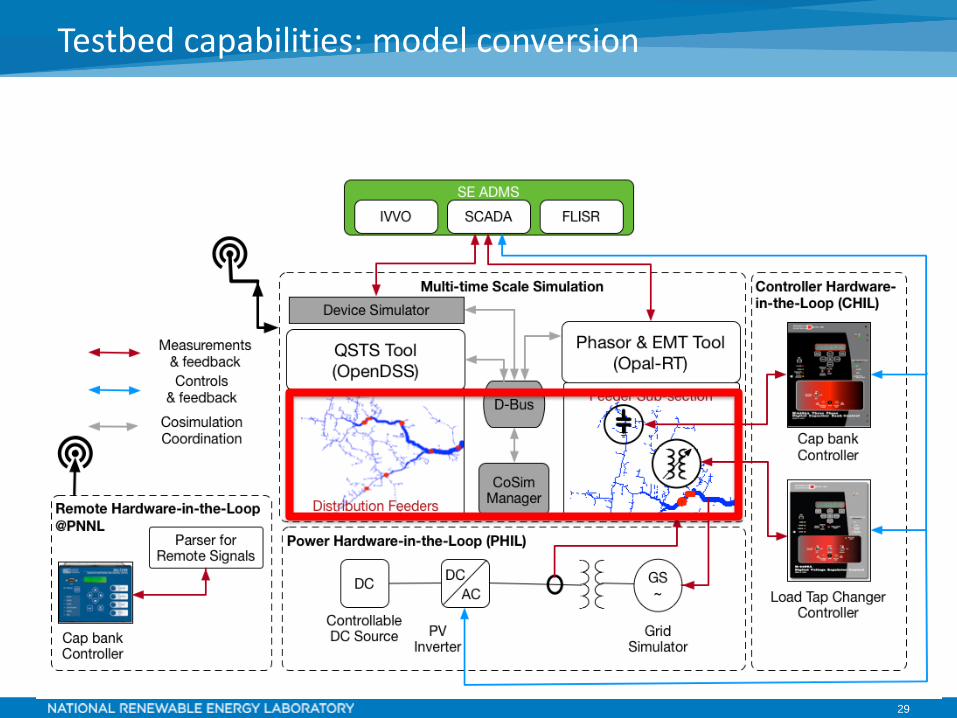
Testbed capabilities: model conversion

30
• Utility models to OpenDSS
o Existing suite of conversion tools at NREL
o GridLAB-D/SynerGee to OpenDSS
o SynerGEE/CYME to GridLAB-D
o CIM to OpenDSS– Received example SE CIM file and evaluating tool
• OpenDSS to ePhasorSim
o Developed as part of project
o Tested on EPRI K1 & J1 feeders
Testbed capabilities: model conversion
31
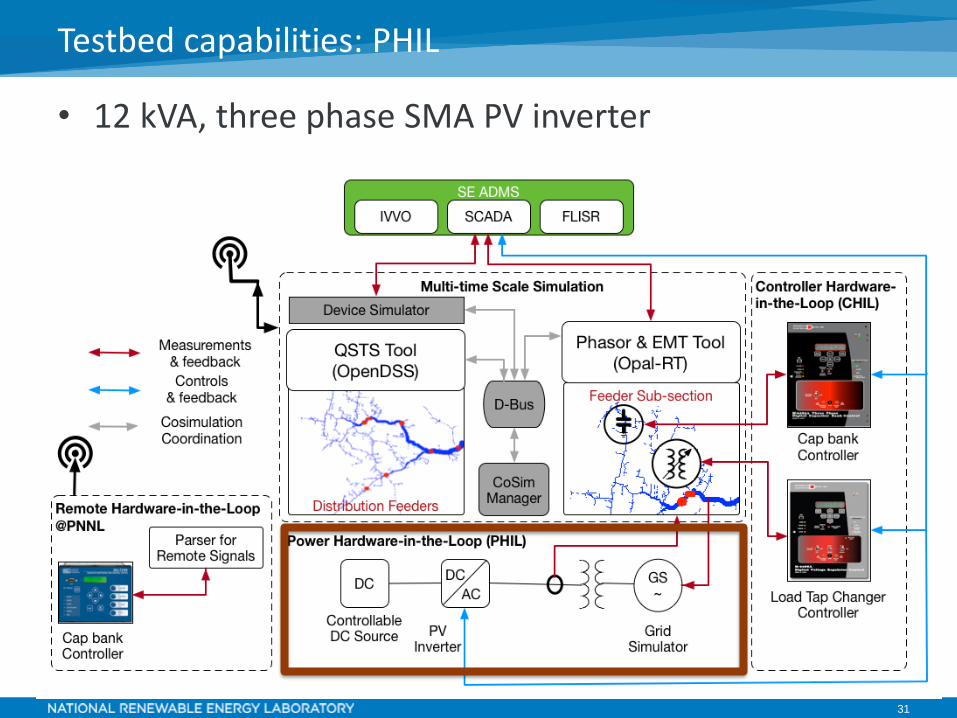
Testbed capabilities: PHIL
• 12 kVA, three phase SMA PV inverter
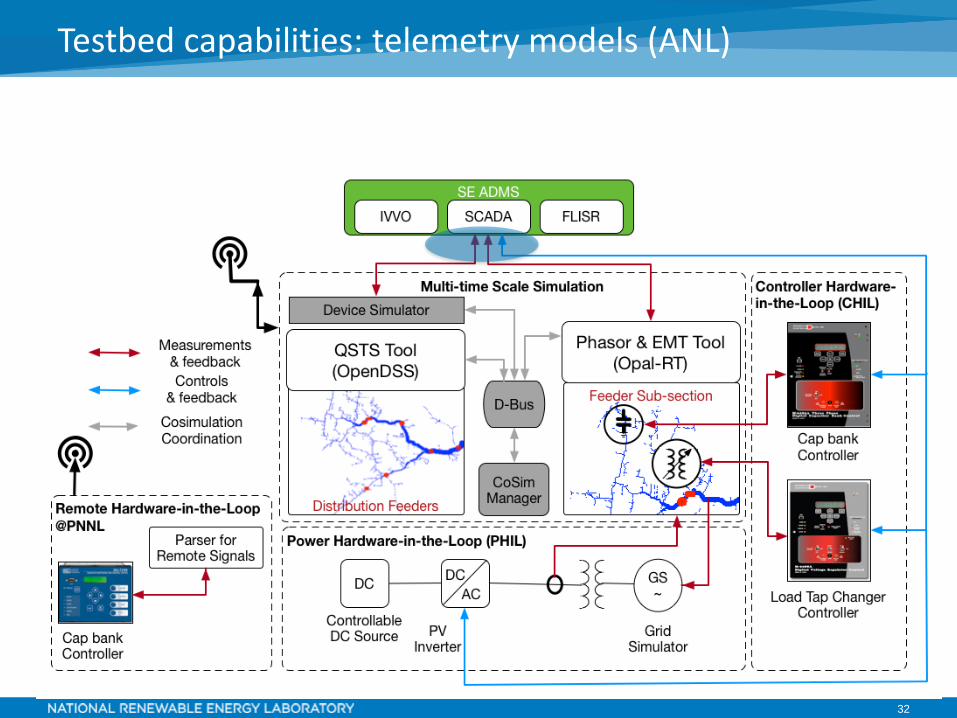
32
Testbed capabilities: telemetry models (ANL)
33
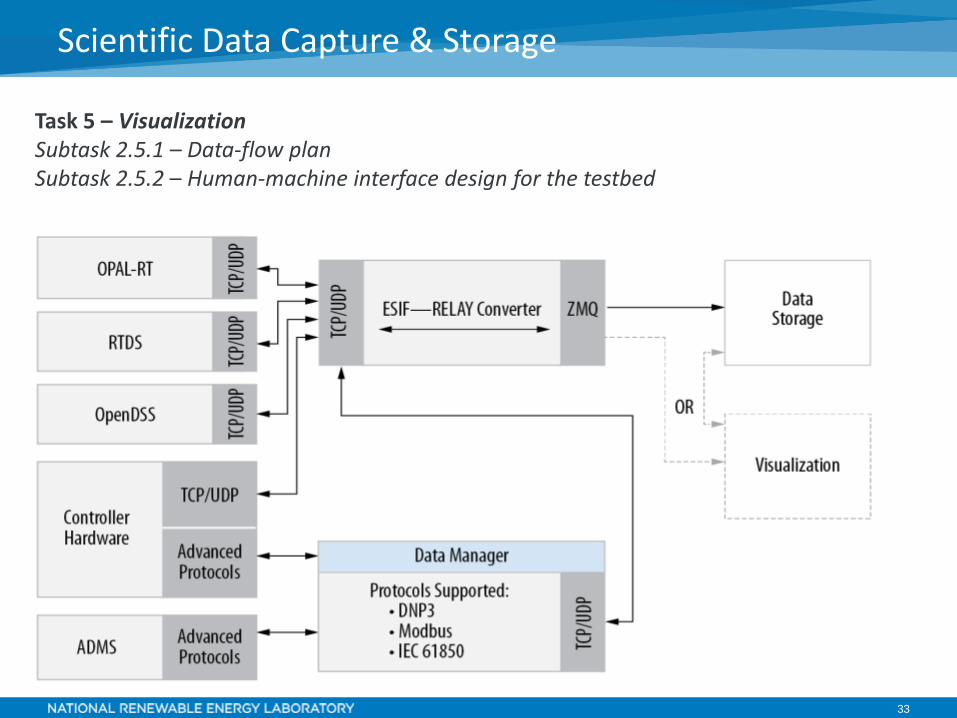
Scientific Data Capture & Storage
Task 5 – VisualizationSubtask 2.5.1 – Data-flow planSubtask 2.5.2 – Human-machine interface design for the testbed

34
Visualization

35
Summary
• ADMS test bed has been architected
• Progress is being made on capabilities by all partners
• Use case 1 has been defined and test plan developed
35
Task 6: Project Management: Unanticipated challenges,
lessons learned
• Subcontract process took far longer than anticipated causing
significant delays in execution of use case 1
o This includes technical scope and legal reviews
o Was able to get one of the subcontractors on board in FY16 but could
only get the other two by FY17
• Software licensing wasn’t trivial; we need more dedicated support
to enable the needed functionality
36
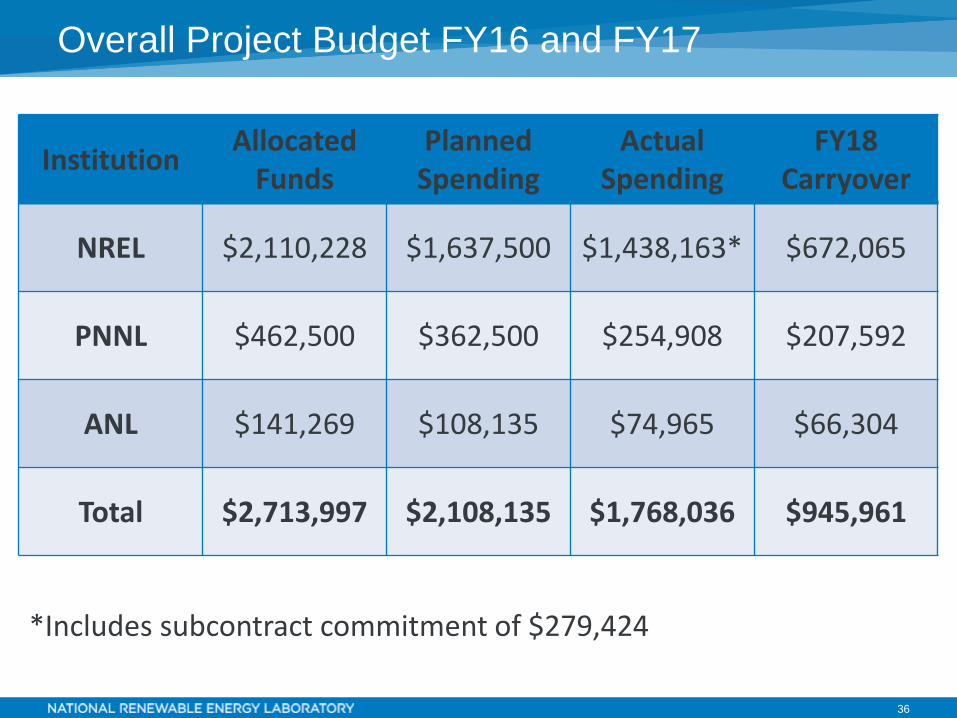
Overall Project Budget FY16 and FY17
InstitutionAllocated
FundsPlanned
SpendingActual
SpendingFY18
Carryover
NREL $2,110,228 $1,637,500 $1,438,163* $672,065
PNNL $462,500 $362,500 $254,908 $207,592
ANL $141,269 $108,135 $74,965 $66,304
Total $2,713,997 $2,108,135 $1,768,036 $945,961
*Includes subcontract commitment of $279,424

FY18+ Plans
Murali Baggu
38
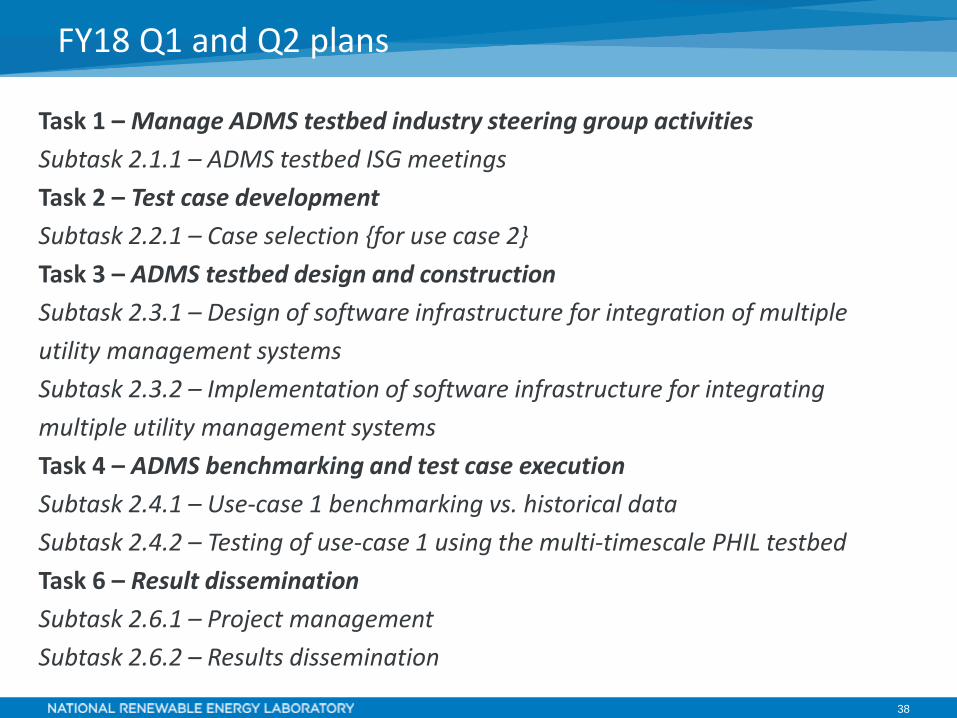
FY18 Q1 and Q2 plans
Task 1 – Manage ADMS testbed industry steering group activities
Subtask 2.1.1 – ADMS testbed ISG meetings
Task 2 – Test case development
Subtask 2.2.1 – Case selection {for use case 2}
Task 3 – ADMS testbed design and construction
Subtask 2.3.1 – Design of software infrastructure for integration of multiple
utility management systems
Subtask 2.3.2 – Implementation of software infrastructure for integrating
multiple utility management systems
Task 4 – ADMS benchmarking and test case execution
Subtask 2.4.1 – Use-case 1 benchmarking vs. historical data
Subtask 2.4.2 – Testing of use-case 1 using the multi-timescale PHIL testbed
Task 6 – Result dissemination
Subtask 2.6.1 – Project management
Subtask 2.6.2 – Results dissemination
39
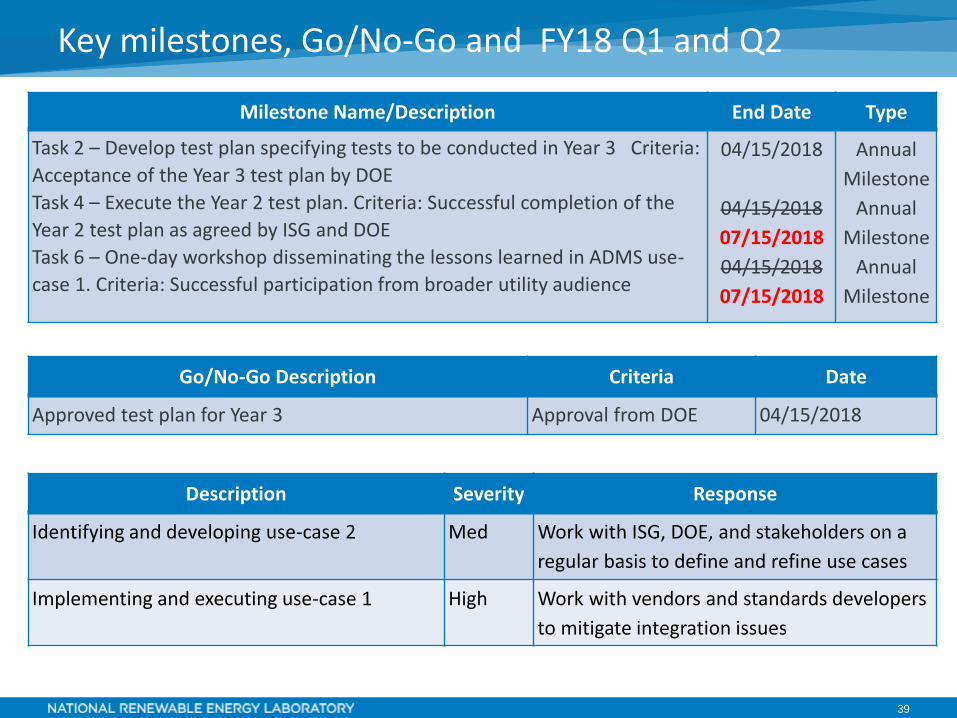
Key milestones, Go/No-Go and FY18 Q1 and Q2
Milestone Name/Description End Date Type
Task 2 – Develop test plan specifying tests to be conducted in Year 3 Criteria:
Acceptance of the Year 3 test plan by DOE
Task 4 – Execute the Year 2 test plan. Criteria: Successful completion of the
Year 2 test plan as agreed by ISG and DOE
Task 6 – One-day workshop disseminating the lessons learned in ADMS use-
case 1. Criteria: Successful participation from broader utility audience
04/15/2018
04/15/2018
07/15/2018
04/15/2018
07/15/2018
Annual
Milestone
Annual
Milestone
Annual
Milestone
Go/No-Go Description Criteria Date
Approved test plan for Year 3 Approval from DOE 04/15/2018
Description Severity Response
Identifying and developing use-case 2 Med Work with ISG, DOE, and stakeholders on a
regular basis to define and refine use cases
Implementing and executing use-case 1 High Work with vendors and standards developers
to mitigate integration issues
40
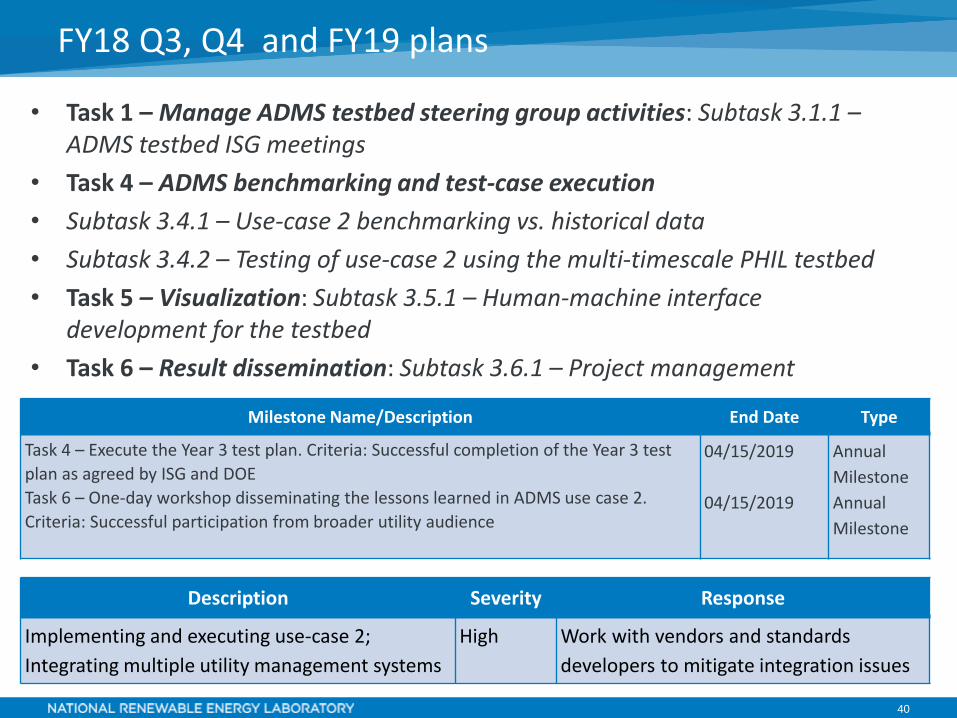
• Task 1 – Manage ADMS testbed steering group activities: Subtask 3.1.1 –ADMS testbed ISG meetings
• Task 4 – ADMS benchmarking and test-case execution
• Subtask 3.4.1 – Use-case 2 benchmarking vs. historical data
• Subtask 3.4.2 – Testing of use-case 2 using the multi-timescale PHIL testbed
• Task 5 – Visualization: Subtask 3.5.1 – Human-machine interface development for the testbed
• Task 6 – Result dissemination: Subtask 3.6.1 – Project management
FY18 Q3, Q4 and FY19 plans
Milestone Name/Description End Date Type
Task 4 – Execute the Year 3 test plan. Criteria: Successful completion of the Year 3 test
plan as agreed by ISG and DOE
Task 6 – One-day workshop disseminating the lessons learned in ADMS use case 2.
Criteria: Successful participation from broader utility audience
04/15/2019
04/15/2019
Annual
Milestone
Annual
Milestone
Description Severity Response
Implementing and executing use-case 2;
Integrating multiple utility management systems
High Work with vendors and standards
developers to mitigate integration issues

41
➢ NREL is collaborating with Xcel Energy and Schneider Electric to evaluate the need for model improvement for its ADMS deployment
➢ Xcel Energy is pursuing grid modernization across its operational territory, starting with feeders in Colorado
➢ The insights gained from the NREL project is expected to inform and reduce costs for Xcel Energy’s approach to ADMS deployment in Colorado and beyond
➢ The ADMS Testbed team is actively pursuing a collaboration with Austin Energy and other DERMS vendors to identify a use case for Year 3.
➢ Use case 2 is targeted at improving the testbed capabilities to evaluate ADMS applications that integrate other utility management systems (DERMS)
➢ Working with Austin Energy to identify specific performance metrics for use case 2
➢ Other utilities will be consulted for potential use cases
➢ DERMS vendor to be identified after finalizing utility participation
Tech Transfer Activities: Industry Collaborations
42
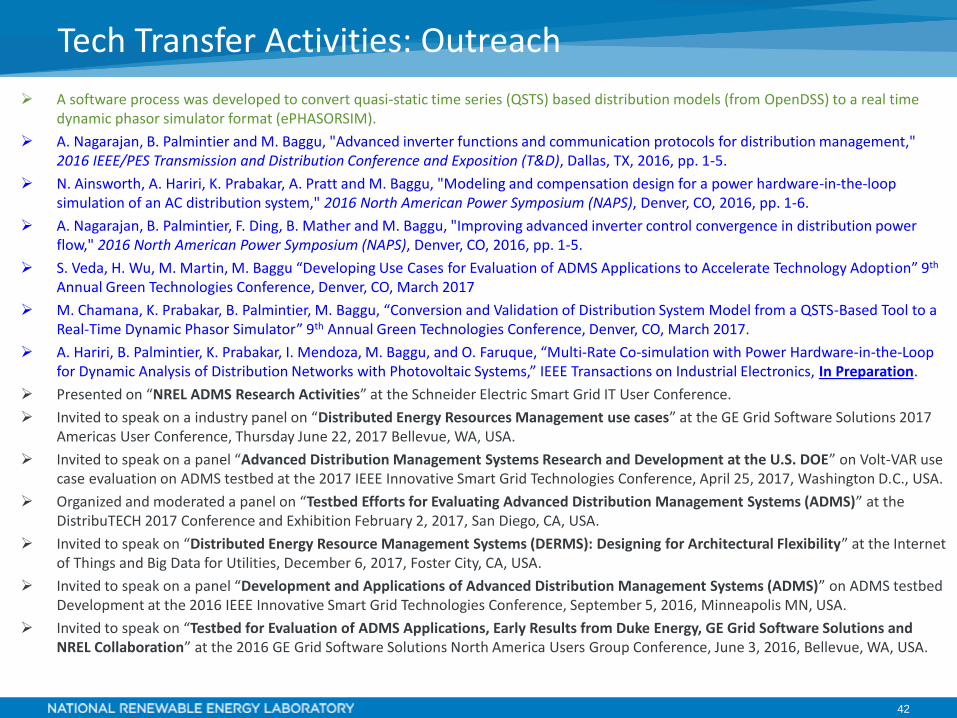
➢ A software process was developed to convert quasi-static time series (QSTS) based distribution models (from OpenDSS) to a real time dynamic phasor simulator format (ePHASORSIM).
➢ A. Nagarajan, B. Palmintier and M. Baggu, "Advanced inverter functions and communication protocols for distribution management," 2016 IEEE/PES Transmission and Distribution Conference and Exposition (T&D), Dallas, TX, 2016, pp. 1-5.
➢ N. Ainsworth, A. Hariri, K. Prabakar, A. Pratt and M. Baggu, "Modeling and compensation design for a power hardware-in-the-loop simulation of an AC distribution system," 2016 North American Power Symposium (NAPS), Denver, CO, 2016, pp. 1-6.
➢ A. Nagarajan, B. Palmintier, F. Ding, B. Mather and M. Baggu, "Improving advanced inverter control convergence in distribution power flow," 2016 North American Power Symposium (NAPS), Denver, CO, 2016, pp. 1-5.
➢ S. Veda, H. Wu, M. Martin, M. Baggu “Developing Use Cases for Evaluation of ADMS Applications to Accelerate Technology Adoption” 9th
Annual Green Technologies Conference, Denver, CO, March 2017
➢ M. Chamana, K. Prabakar, B. Palmintier, M. Baggu, “Conversion and Validation of Distribution System Model from a QSTS-Based Tool to a Real-Time Dynamic Phasor Simulator” 9th Annual Green Technologies Conference, Denver, CO, March 2017.
➢ A. Hariri, B. Palmintier, K. Prabakar, I. Mendoza, M. Baggu, and O. Faruque, “Multi-Rate Co-simulation with Power Hardware-in-the-Loop for Dynamic Analysis of Distribution Networks with Photovoltaic Systems,” IEEE Transactions on Industrial Electronics, In Preparation.
➢ Presented on “NREL ADMS Research Activities” at the Schneider Electric Smart Grid IT User Conference.
➢ Invited to speak on a industry panel on “Distributed Energy Resources Management use cases” at the GE Grid Software Solutions 2017 Americas User Conference, Thursday June 22, 2017 Bellevue, WA, USA.
➢ Invited to speak on a panel “Advanced Distribution Management Systems Research and Development at the U.S. DOE” on Volt-VAR use case evaluation on ADMS testbed at the 2017 IEEE Innovative Smart Grid Technologies Conference, April 25, 2017, Washington D.C., USA.
➢ Organized and moderated a panel on “Testbed Efforts for Evaluating Advanced Distribution Management Systems (ADMS)” at the DistribuTECH 2017 Conference and Exhibition February 2, 2017, San Diego, CA, USA.
➢ Invited to speak on “Distributed Energy Resource Management Systems (DERMS): Designing for Architectural Flexibility” at the Internet of Things and Big Data for Utilities, December 6, 2017, Foster City, CA, USA.
➢ Invited to speak on a panel “Development and Applications of Advanced Distribution Management Systems (ADMS)” on ADMS testbed Development at the 2016 IEEE Innovative Smart Grid Technologies Conference, September 5, 2016, Minneapolis MN, USA.
➢ Invited to speak on “Testbed for Evaluation of ADMS Applications, Early Results from Duke Energy, GE Grid Software Solutions and NREL Collaboration” at the 2016 GE Grid Software Solutions North America Users Group Conference, June 3, 2016, Bellevue, WA, USA.
Tech Transfer Activities: Outreach

Questions?
Murali Baggu ([email protected])
Annabelle Pratt ([email protected])
*This work was supported by U.S. Department of Energy Office of Electricity Delivery and Energy Reliability ADMS Program through
the ADMS Testbed development Funding at NREL

44
Back-up Slides
45
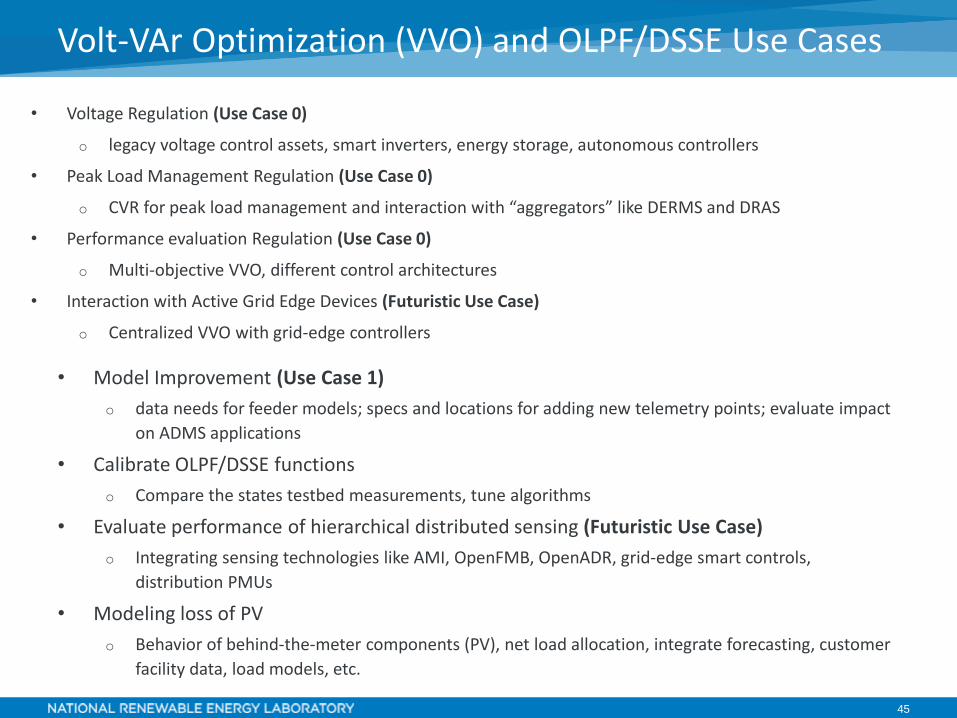
• Voltage Regulation (Use Case 0)
o legacy voltage control assets, smart inverters, energy storage, autonomous controllers
• Peak Load Management Regulation (Use Case 0)
o CVR for peak load management and interaction with “aggregators” like DERMS and DRAS
• Performance evaluation Regulation (Use Case 0)
o Multi-objective VVO, different control architectures
• Interaction with Active Grid Edge Devices (Futuristic Use Case)
o Centralized VVO with grid-edge controllers
Volt-VAr Optimization (VVO) and OLPF/DSSE Use Cases
• Model Improvement (Use Case 1)
o data needs for feeder models; specs and locations for adding new telemetry points; evaluate impact
on ADMS applications
• Calibrate OLPF/DSSE functions
o Compare the states testbed measurements, tune algorithms
• Evaluate performance of hierarchical distributed sensing (Futuristic Use Case)
o Integrating sensing technologies like AMI, OpenFMB, OpenADR, grid-edge smart controls,
distribution PMUs
• Modeling loss of PV
o Behavior of behind-the-meter components (PV), net load allocation, integrate forecasting, customer
facility data, load models, etc.

46
Market Participation and FLISR Use Cases
• High Penetration of DERs: Upstream & downstream DERs; line loading before and after
fault; intermittency & visibility challenges
• Interaction with Microgrids: Impact of temporary fault, black start, need for direct comm
• Very High Loading Conditions: Unnecessary backup feeder trip, Use of load forecasting
• Multiple Simultaneous Faults: Thunderstorms leading to multiple faults, feeder re-tripping
& lockouts
• Widespread Outages: Uncertain distribution configurations, comm status and feeder
outages
• Maintaining power quality while providing bulk
grid services
• Distribution System Operations (DSOs) providing
market functions
• Estimating available capacity for bidding in energy
markets
• Integrated DERMS and DMS operations for grid
services

47
Test cases
• Inverter operating ato Unity power
factor
o 0.95 power factor
o Volt-VAR mode
47
• Maximum reactive power 500 kVAR
• A Volt-VAR curve is programmed and activated in AE500 during VVAR mode test.
• The three different modes operated in a stable fashion.

48
Unity power factor48

49
490.95 power factor

50
50Volt-VAR mode
51
ADMS Testbed Capability Development

52
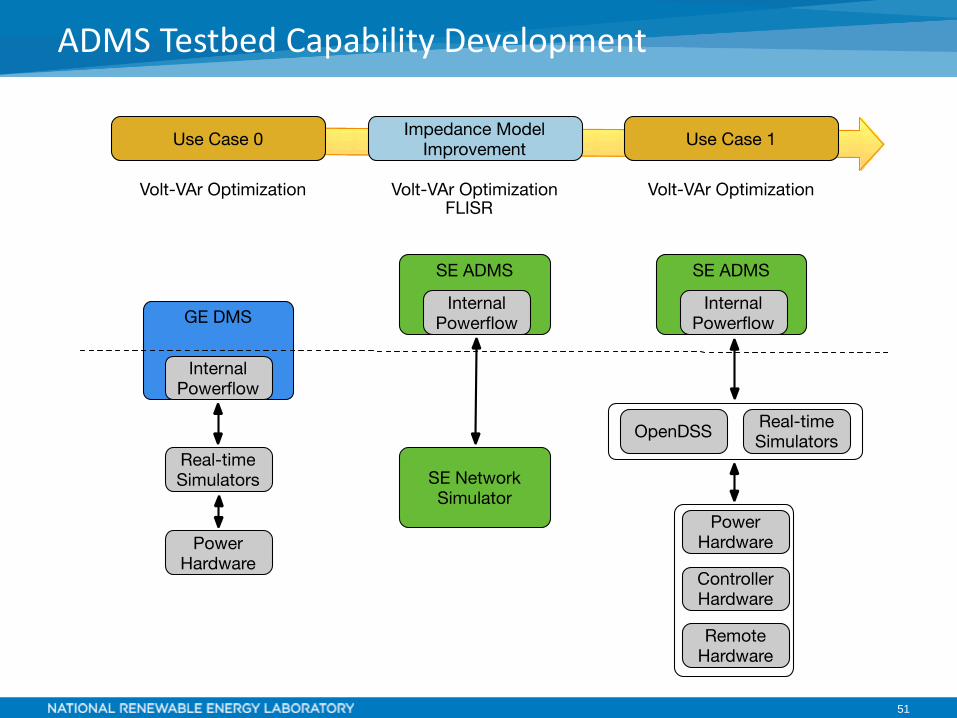
ADMS Testbed Capability Development

53
Functional Specifications
➢ ADMS
➢ A supervisory control and data
acquisition (SCADA) interface,
and
➢ Other utility management
systems
Year 1: Internal Power Flow
Solver implementation
Year 2: multi-timescale software
model evaluation
Year 3: Integrated application
demonstration

54
Software Simulation
• Full-scale distribution systemo Multiple feeders
o Substation details
o Connections to Bulk system
• Segmented into multiple toolso OpenDSS (QSTS)
o ePhasorSim (ms)
o RTDS/eMegaSim (EMTP)
• Utility/SCADA commso Mimic actual ADMS
connections
• Flexible timing:o Real-time (with HIL)
o Faster than real-time (QSTS)
54
55
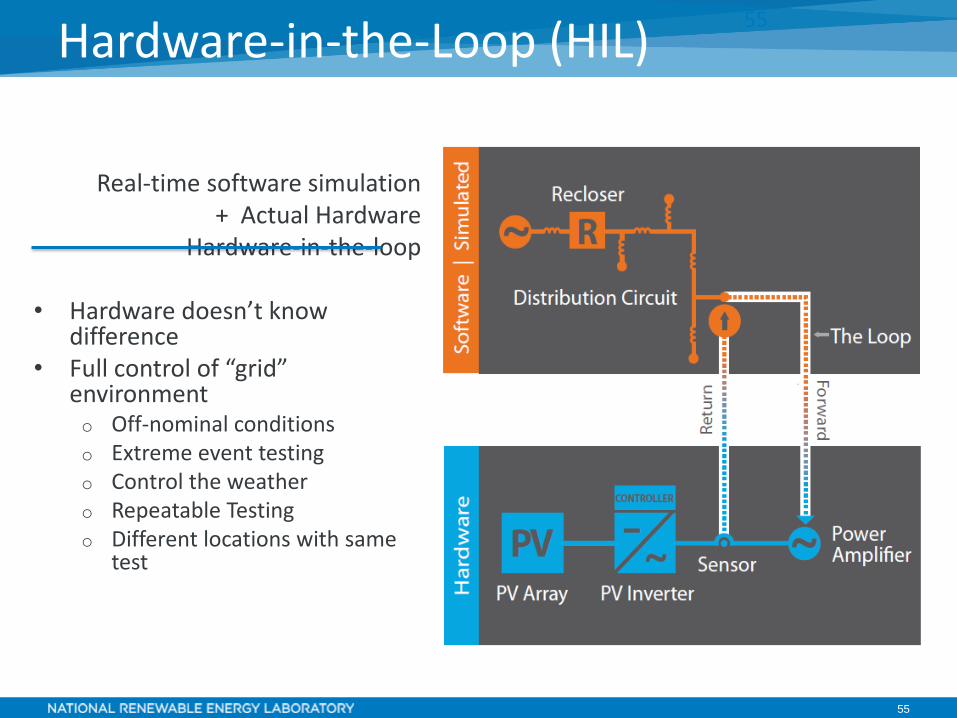
Hardware-in-the-Loop (HIL)
Real-time software simulation+ Actual Hardware
Hardware-in-the-loop
• Hardware doesn’t know difference
• Full control of “grid” environmento Off-nominal conditionso Extreme event testingo Control the weathero Repeatable Testingo Different locations with same
test
55
56
56
A
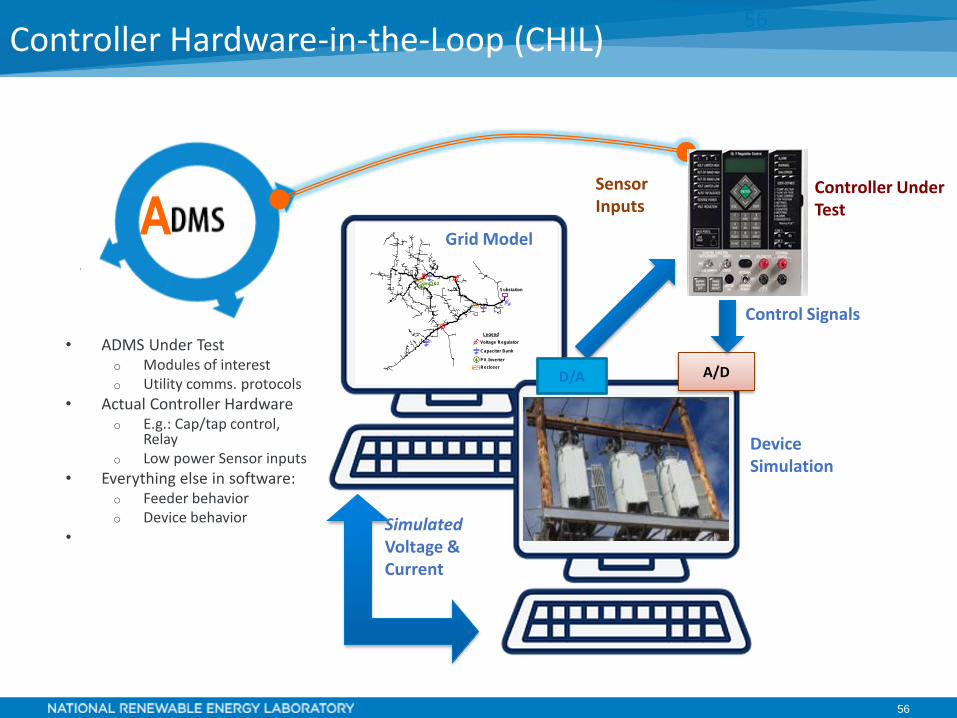
Controller Hardware-in-the-Loop (CHIL)
• ADMS Under Testo Modules of interesto Utility comms. protocols
• Actual Controller Hardwareo E.g.: Cap/tap control,
Relayo Low power Sensor inputs
• Everything else in software:o Feeder behavioro Device behavior
•
IEEE8500u:Power
1640000 1660000 1680000 1700000 1720000 1740000
X
12240000
12260000
12280000
12300000Y
Substation
Inv 1&2
Voltage Regulator
Capacitor Bank
PV Inverter
Legend
Recloser
A/D
Sensor Inputs
Control Signals
D/A
Device Simulation
Grid Model
Controller Under Test
SimulatedVoltage &Current
57
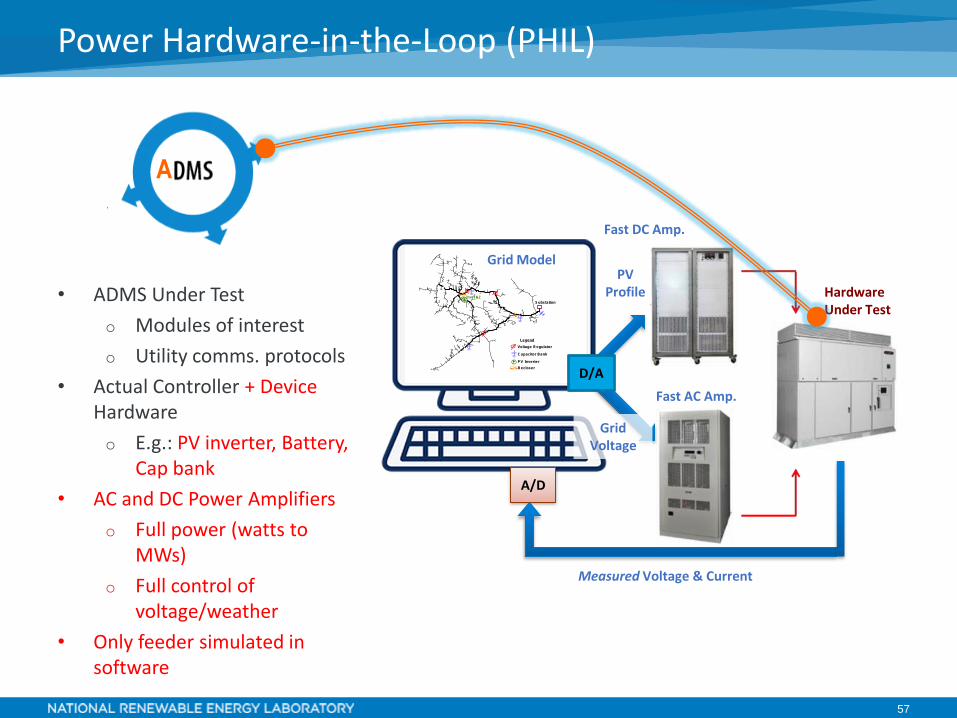
Power Hardware-in-the-Loop (PHIL)
• ADMS Under Test
o Modules of interest
o Utility comms. protocols
• Actual Controller + DeviceHardware
o E.g.: PV inverter, Battery, Cap bank
• AC and DC Power Amplifiers
o Full power (watts to MWs)
o Full control of voltage/weather
• Only feeder simulated in software
IEEE8500u:Power
1640000 1660000 1680000 1700000 1720000 1740000
X
12240000
12260000
12280000
12300000Y
Substation
Inv 1&2
Voltage Regulator
Capacitor Bank
PV Inverter
Legend
Recloser
A/D
Grid Model
D/A
PV Profile
GridVoltage
Fast DC Amp.
Fast AC Amp.
Hardware Under Test
Measured Voltage & Current
A

58
Managing multiple data streams
• ADMS Communications Under Testo Utility protocolso Delays/losses to simulate
real networks
• Simulation Coordinationo Virtual representation of
physical connectionso As fast as possible
• Data Acquisitiono Separate from ADMS:
validation and consistencyo Research-grade sensors
58
Data
acq
uis
ition
SC
AD
A
Analysis & Visualization
NREL test bed
Utility Enterprise Integration bus or other interface?
DMS
OthersFLISRVVO
Data
tran
sla
tor O
R p
ass th
roug
h
Opal-RT
ePhasorSim
eMegaSim
RTDS
RSCAD
Sim. Com. link
Asset Com. link
OpenDSS
InterfaceInterface
Po
wer
hard
ware
Grid
Simulator
E.g., protection
equipment
E.g., Cap
Bank
Grid
Simulator
Legend
Data acquisition
Analog
Communications
Simulation coordination
JSON
UDP/T
CP
UDP/TC
P
DERMS
ADMS under test
EMS?
BMS
MC
OMS MC DERMS
No
n-A
DM
S c
ontr
olle
r h
ard
ware Cap.
bank
ctrl.er
MC
BMS
EMS?
DERMS
Bulk market,
transmission
system,
building, etc.
58
ADMS
Software Simulation
PHIL
CH
IL Uti
lity
Co
mm
s(S
CA
DA
, etc
.)
59
Use Case Summary

60
Communications
SCADA Remote HIL
• Power Hardware
Testbed capabilities: interfaces
61
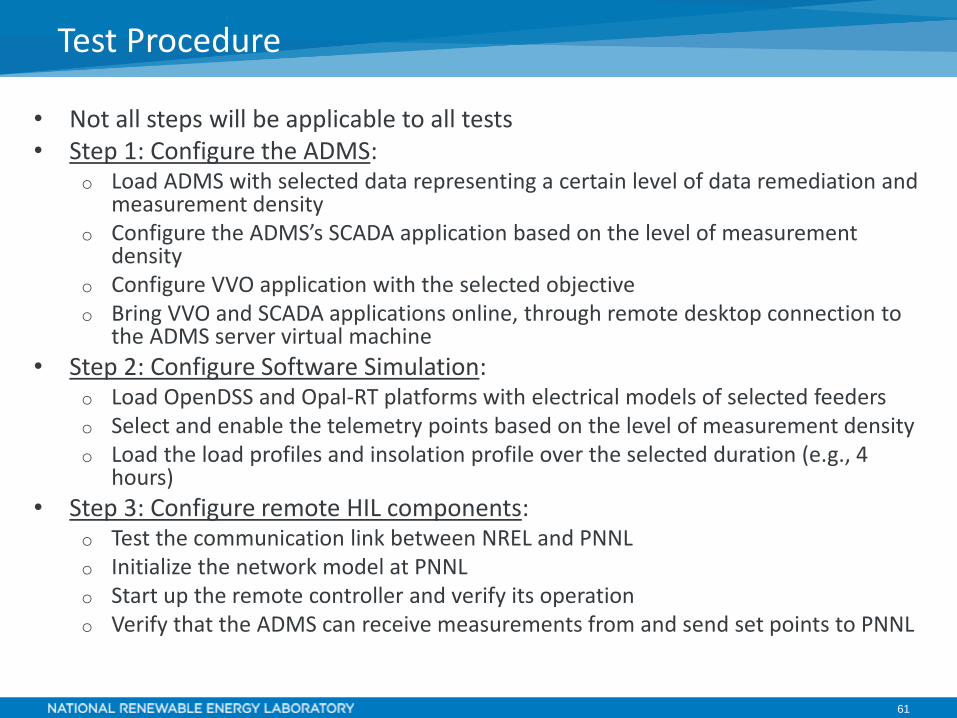
• Not all steps will be applicable to all tests• Step 1: Configure the ADMS:
o Load ADMS with selected data representing a certain level of data remediation and measurement density
o Configure the ADMS’s SCADA application based on the level of measurement density
o Configure VVO application with the selected objective o Bring VVO and SCADA applications online, through remote desktop connection to
the ADMS server virtual machine
• Step 2: Configure Software Simulation: o Load OpenDSS and Opal-RT platforms with electrical models of selected feeders o Select and enable the telemetry points based on the level of measurement densityo Load the load profiles and insolation profile over the selected duration (e.g., 4
hours)
• Step 3: Configure remote HIL components: o Test the communication link between NREL and PNNLo Initialize the network model at PNNLo Start up the remote controller and verify its operationo Verify that the ADMS can receive measurements from and send set points to PNNL
Test Procedure

62
• Step 4: Configure local CHIL components: o Verify the configuration of the capacitor bank and voltage regulator
controllerso Start up the capacitor bank and voltage regulator controllers
• Step 5: Configure local PHIL components: o Verify the configuration and operating limit set points on the
controllable AC and DC sources that act as grid and PV simulators respectively
o Energize the grid and PV simulators using nominal manual set pointso Verify the operation of the PV inverter in the desired mode
• Step 6: Enable data collection and management systems: o Enable the data collection system
• Step 7: Perform simulation: o Initialize the co-simulation from the co-simulation coordinator
Test Procedure

63
Test Metrics
64
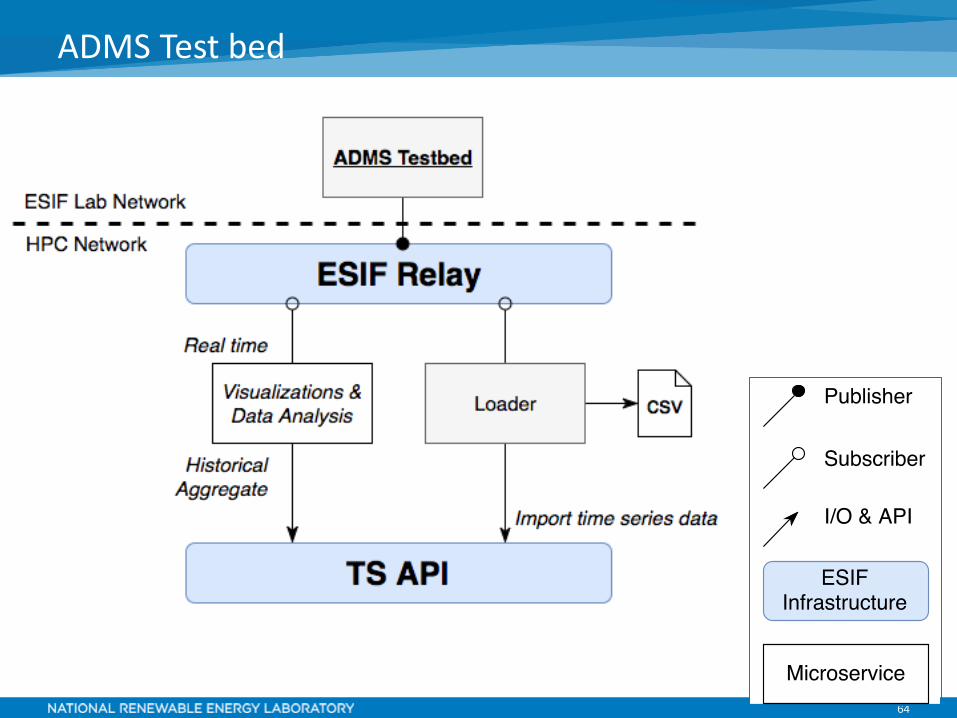
ADMS Test bed
65
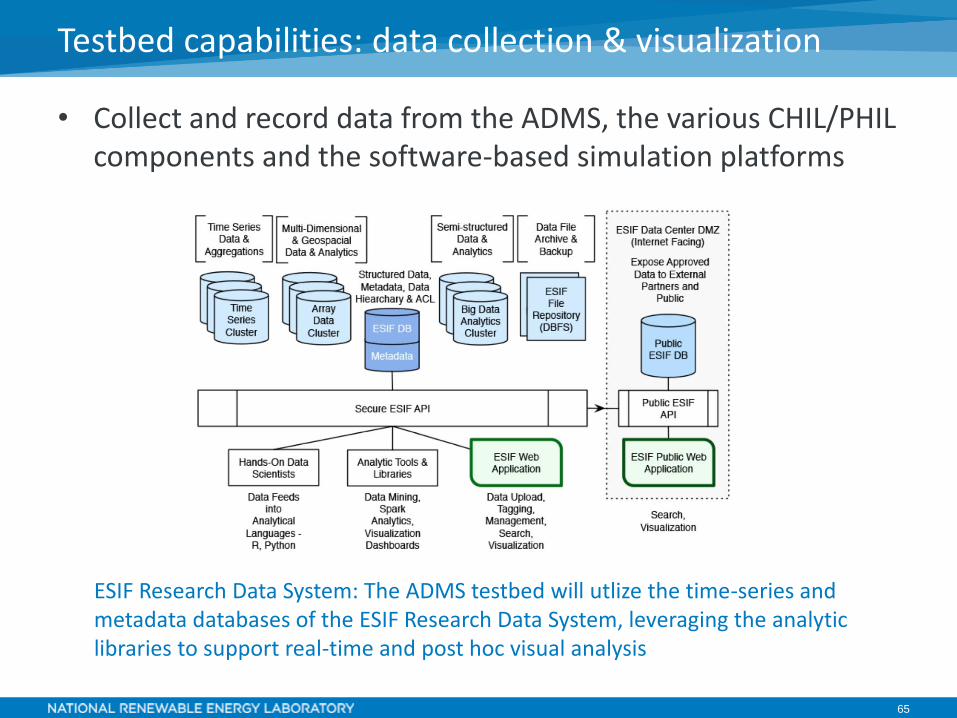
• Collect and record data from the ADMS, the various CHIL/PHIL components and the software-based simulation platforms
Testbed capabilities: data collection & visualization
ESIF Research Data System: The ADMS testbed will utlize the time-series and metadata databases of the ESIF Research Data System, leveraging the analytic libraries to support real-time and post hoc visual analysis