advanced driver assistance system - walter scott, jr...
TRANSCRIPT

Advanced Driver Assistance System Mid Project Report
Fall Semester 2016
Full Report
By
Drew DeVos
Derek Isabelle
Jordan Tunnell
Department of Electrical and Computer Engineering
Colorado State University
Fort Collins, Colorado 80523
Project advisor(s): Dr. Sudeep Pasricha, Dr. Thomas Bradley, Graduate Student Vipin Kumar
Approved by: Dr. Sudeep Pasricha

Abstract
There has been a major shift in the car industry in recent years. Almost all new vehicles
come equipped with some system that will assist the driver. The reason for this is that ADAS
systems can save lives. Systems such as automatic braking, smart cruise control, and even full
autonomous control give the user an additional point of safety. By developing tools and systems
that alert the driver of possible hazards, many accidents could be avoided. This project is a
continuation of the work done by last year’s EcoCAR3 ADAS (Advanced Driver Assistance
System) team. The goal of this project is to continue to build upon the computer vision algorithms
designed last year. Where the ultimate goal is to implement a subset of the algorithms on a laptop
system compatible with a custom designed stereo vision camera system. In addition, the project
will also focus on continuing to port and develop code for the provided NXP S32V board. Under
the supervision of Dr. Sudeep Pasricha and Vipin Kumar, the ECE graduate student for EcoCAR,
the team will implement computer vision methods that will assist drivers to be safer on the road.
To implement the desired ADAS system the team will focus on refinement and
improvements of stereo vision, object detection, lane departure detection, sign detection, and the
development of the S32V board. To complete the software tasks of this project the team has
selected to use C++ with computer vision libraries from OpenCV version 3.1. Additional software
that will be required for the ADAS deliverables will be the vision toolkit from Matlab. The team
has utilized Matlab’s object detection libraries to begin identifying and training various objects
with a set of training images of cars and pedestrians. This machine learning algorithm known as
Boosting is currently being employed to train a classifier so that the computer can determine what
the object is. In addition, the team has designed and calibrated a Stereo Vision Camera that allows
the system to estimate the distance of the identified objects. With the use of the Matlab vision tool
kit the two video feeds once calibrated, rectified, and developed into a Point Map, can give the
distance of the objects from the cameras. To then determine the validity of the results of the
developed system a ground truth database is compared to the algorithm to determine values such
as true positive, true negative, false positive, and false negative.
Currently, classifiers are being trained to detect the various objects described above. This
is done using various image data bases that contain sets of identified cars and pedestrians. The
current results of the custom trained classifiers are varying where the true positive rate is been
largely under 30%. The team has also taken test footage with the custom built Stereo Rig and is
still conducting the accuracy of the distance estimation vs camera distance. The team will continue
to improve the classifiers and continue to refine the stereo rig parameters to meet the DTVC
requirement.

Contents A. Introduction .............................................................................................................................................. 1
A.1 Overview of ADAS ............................................................................................................................... 1
A.2 EcoCar3 and ADAS .............................................................................................................................. 2
A.3 Deliverable Description for ADAS ....................................................................................................... 2
A.3.1 PC System ........................................................................................................................................ 2
A.3.2 Embedded System ....................................................................................................................... 3
A.4 Outline For Report .............................................................................................................................. 4
B. Summary of Previous Work ...................................................................................................................... 5
B.1 Overview ............................................................................................................................................. 5
B.2 Color Space Conversion ...................................................................................................................... 5
B.1.1 Program Flow ............................................................................................................................... 6
B.3 Filtering and Blob detection ............................................................................................................... 6
B.4 Lane Detection .................................................................................................................................... 7
B.5 Basic Object Detection ........................................................................................................................ 7
B.6 Stereo Vision ....................................................................................................................................... 7
B.7 Ending Status ...................................................................................................................................... 7
C. Design........................................................................................................................................................ 8
C.1 Stereo Rig ............................................................................................................................................ 8
C.1.1 Physical Design ............................................................................................................................. 8
C.1.2 Calibration .................................................................................................................................... 8
C.1.3 Distance Estimations .................................................................................................................... 9
C.1.4 Video Capture and Ground Truth Labeling ................................................................................ 11
C.2 Object Detection ............................................................................................................................... 11
C.2.1 Vehicle Classifier Training .......................................................................................................... 12
C.2.2 Pedestrian Classifier Training ..................................................................................................... 13
C.2.3 Traffic Sign Detection ................................................................................................................. 14
C.3 Embedded System ............................................................................................................................ 14
C.3.1 Lane Detection ........................................................................................................................... 14
C.3.2 Enclosure .................................................................................................................................... 15
D. Future Work and Conclusion .................................................................................................................. 16
D.1 Work Over Winter Break .................................................................................................................. 16
D.2 Future Goals ..................................................................................................................................... 16

D.3 Future Work ...................................................................................................................................... 16
D.3.1 Optimizing Current Code ........................................................................................................... 17
D.3.2 Port to embedded system ......................................................................................................... 17
D.3.3 Implement object tracking and other algorithms ..................................................................... 17
D.3.4 Field testing in vehicle ............................................................................................................... 17
D.3 Conclusion ........................................................................................................................................ 17
E. References............................................................................................................................................... 18
F. Bibliography ............................................................................................................................................ 19
G. Acknowledgments .................................................................................................................................. 19
Appendix A – Abbreviations ........................................................................................................................ 20
Appendix B – Budget ................................................................................................................................... 21
Appendix C - Project Plan Evolution ........................................................................................................... 22
Appendix D – FMEA .................................................................................................................................... 25
Appendix E – DTVC ...................................................................................................................................... 26
Appendix F – Car Classification ................................................................................................................... 31

List of Figures
Figure 1 - 3D Representation of HSV Color Space (Left) and YCbCr Color Space (right) [8] ................... 5
Figure 2 - Program Flow ............................................................................................................................... 6
Figure 3 - Stop Sign Detection ...................................................................................................................... 7
Figure 4 - Custom Built Stereo Vision System ............................................................................................. 8
Figure 5 - Stereo Vision Checkerboard Calibration ...................................................................................... 9
Figure 6 - Unrectified Image ....................................................................................................................... 10
Figure 7 - Rectified Image .......................................................................................................................... 10
Figure 8- Disparity Map .............................................................................................................................. 10
Figure 9 – Cascade Classifier Model Diagram ........................................................................................... 11
Figure 10 - Examples of Training Images. The left image shows a positive image captured during a live
driving session. The right image shows a negative image taken from the T. Veit data set. ....................... 12
Figure 11 - Results of Ad-Hoc Classifier Testing. The left image shows a classifier producing more false
alarms than the classifier used on the right. ................................................................................................ 13
Figure 12 - Lane Detections ........................................................................................................................ 15
Figure 13 - Old Timeline ............................................................................................................................ 22
Figure 14 - Work Flow ............................................................................................................................... 26
Figure 15 - Car Orientations ....................................................................................................................... 31
List of Tables
Table 1 - Performance Evaluation Example [1] ............................................................................................ 3
Table 2 - Stereo Vision Camera Calibration Test Example .......................................................................... 9
Table 3 – Stanford Vehicle Data Including Orientation and Usability Labels ........................................... 13
Table 4 - Estimated Budget ......................................................................................................................... 21
Table 5 - Actual Spending .......................................................................................................................... 21
Table 6 - Team Due Dates and Major Deliverables .................................................................................... 23
Table 7 - Team Timeline ............................................................................................................................. 24
Table 8 - FMEA .......................................................................................................................................... 25
Table 9 - Test1 Vehicle Detection .............................................................................................................. 27
Table 10 - Test2 Distance Estimation ......................................................................................................... 28
Table 11 - Test3 Lane Detection ................................................................................................................. 29
Table 12 - Test4 NXP Board ...................................................................................................................... 30

1
A. Introduction
A.1 Overview of ADAS The Advanced Driver Assistance System, or ADAS, is an embedded system used
mainly as a safety device for automobile drivers. It is also the first step to self-driving, self-
sufficient cars, much like what Google and Tesla is developing now. Features of ADAS systems
include Smart Cruise Control, Automatic Breaking, Lane Departure Alert, and many others. To
accomplish these goals computer vision is needed to detect and track various objects one would
see operating a vehicle. In many current ADAS systems today a multitude of sensors are used to
develop the features mentioned above. Sensors such as LIDAR, Radar, Infrared, and Stereo
Cameras. However, the only sensor that can determine what the object is with any degree of
success is the camera. Where all of the other sensors are used to determine speed and distance.
With all ADAS systems, all of this data is then compiled and analyzed in real time where necessary
information is commutated to the driver in the forum of buzzers, HUD, and other graphical means.
The focus on this project is to utilize the camera to determine what the objects are and with a stereo
vision camera determine how far they are from the system.
Automobile accidents are a severe hazard on today’s roads. They frequently cause damage
to properties, vehicles, and most unfortunately, people. Accidents occur quickly and often are the
cause of thousands of injuries and deaths every year. According to the National Safety Council,
Motor Vehicle crashes are the primary cause of death in children and young adults ages 5 to 24,
as well as the #2 cause of death for adults. These fatalities are often caused by distracted drivers
or even drivers under the influence of drugs such as alcohol. Designing a tool that will mitigate
these fatalities and alert drivers of any potential hazards is a top priority for this project. The goal
for this project is to make a robust PC system that can operate in real time. Where the PC will
utilize computer and stereo vision to detect and identify key objects such as lanes, pedestrians,
signs, and vehicles.
An embedded system provided by the EcoCAR3 competition will then be utilized to run a
subset of the vision algorithms developed. The use of the embedded system is ideal because of its
low cost and lower power usage. Driving can be dull, especially when driving for long periods of
time. That is why audio feedback can be beneficial. A sharp beeping sound or light indication can
cut through potentially monotonous noises and wake the driver from daydreaming. Accurate visual
feedback will also make the driver more aware of their surrounding environment and alleviate
some worry of crashing into something. If this is not enough to cause the driver to drive safely,
ADAS will eventually be able to determine the driver is not reacting in a proper and timely manner
and try to correct the situation on its own. This is far down the timeline of the project and won’t
be implemented anytime soon. More on safety and ADAS systems see Appendix D.
Computer Vision unfortunately still has some limitations. The only sensor that can classify
an object is a camera, so we are bound by the operating condition of the sensor itself. Several
notable issues include hazard weather conditions and lighting. Times such as dawn and dusk where
sun light is directly shining into the lens of the camera will render an image that is useless. Similar

2
conditions would happen when entering and exiting a tunnel. Snow is an example when the
weather would completely blocks necessary information such as lane markings and even important
signs. It is critical that current ADAS systems know their limitations and rely on software that can
determine these hazards to avoid potentially fatal misidentifications.
A.2 EcoCar3 and ADAS EcoCAR3 is a competition sponsored by the U.S. Deparment of Energy, GM, Argonne
National Labs, MATLAB, NXP, and others to design the car of the feature. Each Competition is
split up into four year sections. Where we are currently on the third year of the third EcoCAR
competition. The goal of EcoCAR3 is to develop an energy efficient high performance vehicle.
Given a Camaro the CSU team has developed a hybrid electric vehicle and is competing against
15 other teams. This is the second year of ADAS in the EcoCAR3 competition (See Section B) for
more details. As a part of the competition we are given a portion of the budget see Appendix B for
more details.
A.3 Deliverable Description for ADAS As a part of the EcoCAR3 competition the ADAS team is required to submit two
deliverables. The first major deliverable for the EcoCar competition is the Stereo Vision Tool
check due on January 19th. The details of this deliverable can be see below. The second is the
Hardware tool check due May of next year where the goal is to refine the PC development and
port code over to competition provide board. See Section C and D for more details.
A.3.1 PC System All code and algorithms need to be developed and run on a portable pc. The January 19th
stereo vision tool check includes all PDF documentation, video files and source code written and
captured using the PC system.
A.3.1 Stereo Vision Rig
A custom stereo vision camera system must be built. A prebuilt stereo vision camera may
not be used, as to avoid the use of any pre-installed camera calibration code.
A.3.1.2 Calibration
To calibrate the custom stereo vision rig, the checkerboard file provided by MathWorks
must be used. A minimum of 20 calibration images must be used, and all images and calibrated
settings files must be saved and submitted.
A.3.1.3 Video Capture and Ground Truth Labeling
After a calibration settings file has been created, a database of MP4 video footage showing
certain events must be recorded. The details of what needs to be recorded can be seen below.
1.) Signs
- Approaching and stopping at stop signs.
- Passing by multiple speed limit signs.
- Driving by intersections with traffic lights
2.) Pedestrians
- Walking on sidewalks

3
- Crossing in front of vehicles
3.) Vehicles
- Following vehicles on freeway/highway
- Following vehicles on freeway/highway while the road curves
- Following vehicles through changing light conditions (Shade, Tunnels, Etc.)
- Following vehicles on city streets
- Changing lanes behind a vehicle
After this video has been captured, ground truth information must be labeled for each footage. The
requirements for what needs to be labeled in the ground truth information can be seen below.
1.) Pedestrians
2.) Oncoming vehicles
3.) Rear of vehicles
4.) Side of vehicles
5.) Stop signs
6.) Speed limit signs
A.3.1.4 Classification and Tracking Algorithm
After the video and ground truth databases have been created, testing using the developed
classification and tracking algorithms is performed. The program should identify all receding
vehicles in each frame, label each vehicle, and calculate the distance to each vehicle in meters. A
table is created to measure the performance of the algorithm. An example row of this table can be
seen below.
Table 1 - Performance Evaluation Example [1]
After performing testing on the algorithm, the algorithm should be modified, and retested
to increase accuracy. Finally, the algorithm will be tested on the competition provided video.
A.3.2 Embedded System
The S32V board is not a focus for the January 19th stereo vision tool check, but some
development is recommended to make the transition into the next semester easier.
A.3.3.1 Lane Detection
Lane detection is one of the first algorithms that is developed for the board. Using the
provided computer vision libraries, a lane detection demo is provided. Looking at and optimizing
this code should make porting the code for the other algorithms to the board easier in the coming
semester.
A.3.3.2 Enclosure
An enclosure needs to be built for the competition vehicle. It is not required for the January
19th stereo vision tool check, but may be required for next semester’s deliverable.

4
A.4 Outline For Report In the following sections below, the report will describe previous work, this year’s design
process, current results, plans for future work, and conclusion. In section B work completed last
year for the EcoCAR3 year 2 deliverables will be summarized. Where basic algorithm
development, and key algorithm used will be discussed. In section C the design process of this
year’s work will be discussed. Including classifier training and stereo vision distance estimation.
In the same section results on the discussed algorithms will be analyzed. In section D future work
for winter break and next semester will be shown. Lastly, in the same section the conclusion for
this document will be expressed.

5
B. Summary of Previous Work
B.1 Overview As mentioned in section A.2 this is the second year of ADAS for EcoCAR3. In that year
the team developed several algorithms that represent the foundation of computer vision. These
included color space manipulation, image filtering, and feature extraction. The competition last
year for ADAS was split into two parts. The Software and Hardware tool check. The first
deliverable focused on basic algorithms needed for all computer vision tasks. Where the second
covered basic components of the embedded system and basic object detection.
B.2 Color Space Conversion In computer vision, often we want to convert from an RGB color model, to one that
separates color information from intensity. A primary reason for this is to filter the image from
different lighting conditions. In the HSV and YCbCr color spaces, hue holds the color information
for a HSV image, where Cb (blue shift) and Cr (red shift) holds the color information for an YCbCr
image. As mentioned before, the separation of image intensity from the color information is very
important for detecting an image without worrying how the intensity component will affect the
pixels. Many algorithms in computer vision remove the image intensity component all together,
thus removing any changing lighting conditions. Once the color information is read, identifying
colors or objects is more easily done. Each color space has its own unique properties, though in
general most of them are designed to separate color information from image intensity. As seen in
figure 1 below on the left, hue primarily accounts for the change in color where the arrow shows
the direction if the H component was increasing. Saturation and value are generally seen as the
intensity determining the shade of the color. For the image on the right, we can see that the Y
component directly controls the brightness of the image and is often referred to as the grayscale
component of the image. Thus the other two components represent the color information of the
image itself.
Figure 1 - 3D Representation of HSV Color Space (Left) and YCbCr Color Space (right) [8]

6
B.1.1 Program Flow
Figure 2 - Program Flow
B.3 Filtering and Blob detection Blob detection plays a very important role in ADAS as it allows the detection of
important objects in a given frame. The most important of these objects include other vehicles,
people, and signs. After the detection of these objects we know the dimensions of the bounding
box, the position of the center of this bounding box, and how many objects are on the screen.
The dimensions of the box might be used to estimate distance, smaller for more distant objects
and large for closer objects. The change in these dimensions could give an idea of whether the
objects is moving toward or away from our vehicle. If the rectangle is taller than it is wide, the
object might be a person, if wider than tall or closer to a square it may be a vehicle. The distance
from the center of the screen, in conjunction with the same distance from the previous frame, can
also be used to give information about the speed and direction of the object. This information
could also be used to determine if a smaller object is actually part of a larger object. Finally, the
number of objects is important as it allows us to more accurately track objects from one frame to
the next, or to predict the performance of the system; a larger number of objects will take up

7
more resources. If all of these pieces of information are used together, a fairly robust object
detection system can be created.
B.4 Lane Detection The idea behind thresholding an image, in computer vision, is to extract important features
of a video frame. Regarding ADAS, this can be anything from stop signs, to brake lights, to lane
lines, to any other number of wanted features. For this particular activity the idea is to extract only
the lane lines from the input video and return a binary output video with lane lines the only thing
showing as white in each frame. If this is done correctly, the resulting image is a good starting
point for determining the position of the car relative to the surrounding environment.
B.5 Basic Object Detection Last year’s team developed basic object recognition using a cascade object detector.
More on this process be discussed in section C.2. The team developed a stop sign classifier and
used a vehicle classifier found a public data base. These classifiers had a relatively high false
positive rate around 30 – 50%. The vehicle classifier also had a 56% true positive rate.
Figure 3 - Stop Sign Detection
B.6 Stereo Vision Last year the team developed basic stereo vision distance estimation using the ZED
prebuilt stereo vision camera. Basic algorithm development was competed, but the accuracy of
the stereo vision distance estimations was poor.
B.7 Ending Status The building blocks of last year’s progress has helped the team develop what we currently
have. As seen in section C much of our focus has been on increasing the accuracy and speed of
these algorithms to meet the new standards we have and the competition has put in place.

8
C. Design
C.1 Stereo Rig Stereo vision is the process of extracting 3-D information from multiple 2-D views of a
scene. This 3d information is estimated by using a pair of images (stereo pair), and matching
stereo pairs to estimate the relative depth of the scene. Stereo vision is very important to ADAS
systems, where it is used to estimate the actual distance or range of objects of interest from the
camera.
This year the competition required that a custom stereo vision rig was built. For last year’s
EcoCar 2 competition a pre-built Zed stereo vision camera was used. The main function of this
stereo camera is to create a 3d point cloud for every frame, and to extract distance and velocity
estimation from it. All software and calibration done for the custom stereo vision rig had to be
created by the team, using built in MatLab functions and applications.
C.1.1 Physical Design
The custom rig was designed based on the suggestions from the EcoCar3 fall workshop.
The parts used to create the rig were a vanguard multi mount, two 1080p Logitech cameras, and a
tri suction cup base. One requirement for the stereo vision rig is that it is easily interchanged
between different vehicles. The current design of the custom rig allows for each transition between
cars, along with easy transition between different camera setups. This camera system can be seen
in the figure below.
Figure 4 - Custom Built Stereo Vision System
C.1.2 Calibration
Once a distance between to cameras has been determined, the calibration of the stereo
vision rig has to only be done once. The steps for calibrating the cameras are as follows:
1.) Use the calibration checkerboard picture, and capture images from the left and right
cameras.
- The more pictures taken correlates to the accuracy of the calibration.
- The calibration checker board size along with smoothness will also effect the
calibration accuracy. Some example checkerboard images can be seen below.

9
Figure 5 - Stereo Vision Checkerboard Calibration
2.) Use the built in Matlab tool for stereovision calibration to take the images and create
a calibration file.
3.) Lower the mean pixel error, by taking out pictures that have a large mean pixel error,
and recalibrate.
4.) Export the Stereo Vision Parameters file for use.
One major focus of building the stereo vision rig has been adjusting the angle and width of
the two cameras. Differences in these parameters have resulted in different accuracies for distance
estimation. So far multiple stereovision calibration parameters have been exporting are currently
in testing for which is most optimal. An example of the documentation that has been done on this
can be seen below.
Table 2 - Stereo Vision Camera Calibration Test Example
Another future area of refinement for the stereo vision rig is the rate and timing of each
camera. As of right now we are only getting 11 frames per second. While this value allows for
computer vision to run at a decent pace, in a quick change of conditions, it might not catch an
important object of interest. This is something that needs to still be optimized. In addition because
the cameras are independent from one another there is a potential lag between capturing each
frame. This could cause error and the team is currently trying to mitigate this potential issue.
C.1.3 Distance Estimations
Once the stereo rig system is calibrated the calibration information is then used to rectify
the images as seen in the figure below. Where the goal is to line up each pixel so that a disparity
map can be created.

10
Figure 6 - Unrectified Image
Figure 7 - Rectified Image
As mentioned above the point of calibration is to align the stereo pair so that we can then
create the 3D representation of the space captured. This is done by creating a disparity map which
gives us the depth information we need to estimate distance. The use of notating the distance of
the calibration checkerboard now gives us the approximate distance in meters.
Figure 8- Disparity Map

11
The final step is to then draw a bounding box over the object that needs to be detected and
the corresponding distance will be found from that 3D point cloud.
C.1.4 Video Capture and Ground Truth Labeling
Part of the January 19th deliverable involves capturing and creating a database of ground
truth information. This process involved using the stereo vision rig to record footage, and then
using the built in MatLab labeler application to label the bounding boxes on objects. So far a couple
hours of footage have been gathered, with some still images labeled and ready for testing.
Currently we have footage showing:
1.) Following vehicles on highways (curved and straight).
2.) Following vehicles on city Streets.
3.) Changing lanes while driving behind a vehicle.
4.) Driving past multiple street signs and lights.
5.) Driving past pedestrians walking on the sidewalk.
The footage that still needs to be captured is:
1.) Pedestrians walking in front of the car on a crosswalk.
2.) Driving in changing lighting conditions.
C.2 Object Detection The detection or classification of objects in an image is an important part of any competent
ADAS system. Object classification allows an ADAS system to be aware of the types of objects
that surround the vehicle during driving, while other components such as radar, lidar, and sonar
are more suited for determining the position and velocity of large objects in the driving
environment. In the algorithm implemented for the EcoCar competition, frames were taken from
one of the stereo vision video feeds. Objects such as vehicles, signs and pedestrians were then
classified using a cascade object detector trained and executed in MatLab.
A cascade object detector is a piece of software that takes an input image and outputs
coordinates corresponding to bounding boxes which tell the location of certain objects in an image.
The objects are generally labeled by drawing the bounding box back into the original image. The
detector works by focusing on a small rectangular subsection of an image called a window. The
window slides across the image until every subsection has been searched for the object of interest.
For each window, the classifier searches for objects in stages. The first stage of a classifier looks
for simple patterns in the image window which can be something as simple as the upper portion
of the window being generally darker than the bottom. If the classifier finds the simple pattern,
Figure 9 – Cascade Classifier Model Diagram

12
then the region is analyzed using the next stage in the cascade. If a region fails to pass a classifier
stage, then the window moves along and the algorithm does not spend any more time or resources
analyzing that image region. Each stage of the cascade looks for increasingly complex features,
with the final stage making the final object classification. Figure 9 shows an abstract model of a
cascade classifier with its many stages [4].
There are different types of patterns (also known as features) that can be analyzed at a
classifier stage. Both Haar features and HOG (Histogram of Oriented Gradients) features were
tried during classifier development by the ADAS team. Since it is difficult to algorithmically
determine an object in an image, machine learning techniques must be utilized in order to train the
classifier stages to recognize similarities among images of the object of interest.
C.2.1 Vehicle Classifier Training
The process for training vehicle classifiers involved three major steps, data gathering, the
labeling of ground truth information, and finally performing the training using the annotated data.
Both positive and negative images were needed to train the classifier. Positive images consisted of
images containing instances of vehicles while negative images consisted of images not containing
vehicles as shown in Figure 10.
Positive images were taken from a publicly available database as well as from images taken
during live road driving. 16,185 positive images of vehicles in various orientations were obtained
from the Stanford Cars Dataset [5]. These images came with vehicle bounding box data, also
known as ground truth information, stored in a MatLab structure array as seen in table 3. Negative
images were used with permission from Pinz [6] and Veit [7]. The next step was to manually
categorize these images into subsets labeled by orientation and usability. Approximately 5000
images were additionally categorized in this way. For example, photos of vehicles taken from the
front were labeled with an orientation of 2, while photos taken from the rear were labeled with an
orientation of 2. See appendix F for details on manual labeling.
Figure 10 - Examples of Training Images. The left image shows a positive image captured during a live driving session. The
right image shows a negative image taken from the T. Veit data set.

13
Table 3 – Stanford Vehicle Data Including Orientation and Usability Labels
These additional labels provided the team with more degrees of freedom to experiment
with while training the vehicle classifier. Many classifiers were trained in batches. The team
discovered that rear orientations not mixed with any other orientation set appeared to have the
most success. Another key result was that the false alarm rate was too high for most trained
classifiers. Figure 11 shows examples of classifiers detecting vehicles in a recorded driving
session.
C.2.2 Pedestrian Classifier Training
For pedestrian detection, a classifier was trained using the Aggregate Channel Feature
Object Detection. This algorithm was originally developed by Piotr Dollár and is outlined in his
paper “Pedestrian Detection: A Benchmark” [2]. The data set used to train this classifier was the
Figure 11 - Results of Ad-Hoc Classifier Testing. The left image shows a classifier producing more false alarms than the classifier used
on the right.

14
Caltech Pedestrian Dataset [2]. Permission to use this algorithm and dataset were both granted by
Piotr Dollár. Testing this classifier on a set of images with pre-determined bounding boxes resulted
in a log average miss rate of 29.20%.
Overall this algorithm has a smaller miss rate than some other pedestrian tracking
algorithms, but further investigation into other algorithms is something that needs to be
documented. Some of the other training algorithms that are going to be looked into are HOG,
Multi-FTR, and the haar cascade object detection we used for vehicles.
C.2.3 Traffic Sign Detection
Traffic sign detection will utilize cascade classifier training as mentioned above.
Additionally, the team plans to look into color thresholding and optical character recognition
(OCR) as alternate methods for stop sign detection.
C.3 Embedded System The EcoCar competition provides a S32V Micro Controller Unit to be used as an embedded
system in the vehicle. The goal for this embedded system is to implement and optimize lane
tracking, along with port some of the other pc algorithms over to the board. A vision SDK is also
provided by the competition, which utilizes different aspects of the architecture such as the image
signal processor, the apex vector unit, and the arm processor.
The competition also provided a development environment specifically for the board. This
IDE consists of the standard coding view, and a graphical view that lets the user visualize the
vision SDK. This IDE also includes a testing and debugging tool, which directly interfaces with
the board. This tool makes debugging programs that use multiple processors in the architecture
easier to handle.
One of the main challenges of the board is going to be using the apex vector processing
unit mentioned above. The apex processor is very good for parallel code, and can speed up
performance when used for functions like filtering and edge extraction. Making sure that we
parallelize our code, and obtain optimal performance when porting over other algorithms is going
to be one of the focuses for the next semester.
C.3.1 Lane Detection
Currently using the vision sdk, a lane detection demo is available. The lane detection demo
works well in real time, running at an average of 29 frames per second. This demo is also accurate,
and can handle switching to other lanes. This demo has not been tested in real time in a real driving
scenario, but has been tested on videos involving driving on streets with clear lane markings. This
is a step up from last year, where all that was needed was to create white lines where the lanes
should be on prerecorded videos. A screenshot of this demo can be seen below.

15
Figure 12 - Lane Detections
C.3.2 Enclosure
One of the requirements for this competition is that an enclosure is built to house the board
and pc inside of the car. There is no current set plan for the embedded system enclosure, but
current talks with the mechanical and controls teams have been started. We want to make sure that
we supply the board with enough power, and that heating and physical damages are not caused by
being in the vehicle.

16
D. Future Work and Conclusion
D.1 Work Over Winter Break As a part of the EcoCAR3 competition the ADAS team has a major deliverable due on the
19th of January. In which the team will need to implement a Stereo Vision Camera system that can
estimate the distance of objects such as pedestrians, vehicles, and stop and speed signs. Once
completed, the second semester is focused on refinement of the previous Stereo Vision system on
the PC in addition to porting the code to our embedded system. Where by the end of the year the
goal is to have the PC complete the previous goals mentioned above, but in a real time system at
no less than 10 fps with a distance estimation accuracy of 90% at 50 feet and a 90 % true positive
rate. In addition the embedded system will have at minimum lane detection implemented with a
buzzer setup when a lane is being changed. This will be our minimum viable product by the end
of the year.
D.2 Future Goals
Minimum Viable Product
o PC System (Minimum 10 fps)
Object Detection (with 90% true positive rate)
Lanes
Pedestrians
Cars
Signs
o Embedded System
Enclosure built
Port Lane detection to the board
Utilize the APEX and DSP
Buzzer System to Alert Driver
Stretch Goals
o Completion of Android APP
Sub functions of PC System
Analyze video and images
o PC
Implement Object Tracking
Utilize System GPU
Utilize System threads
Port Code to OpenCV
o Embedded System
Port Object Detection
Compile own Computer vision Libraries
Optimize existing code and recompile
D.3 Future Work To complete the goals stated above the team will need to first complete the ADAS Vision
Deliverable due the 19th of January. The current state of the project is that the team is still

17
developing classifiers to identify the objects and is refining the code needed to complete the
project. The distance estimation code and the methodology of calibration of the camera is
complete.
The team will plan to meet frequently over the break to complete the deliverable on time.
Where a winter break schedule will be created so the team can stay on schedule and complete the
project on time.
D.3.1 Optimizing Current Code
Once the team comes back from break a shift in focus from development to refinement will
occur where the team will need to make sure that the PC system can work in real time. In order to
complete this goal the team will adhered to the DTVC testing requirements to refine the code to
meet all of the requirements. This will be done in an agile development approach where the team
will define what the goal will be for a two weeks period and then the system will be developed and
fully tested to meet these goals.
D.3.2 Port to embedded system
For the Embedded System the team will need to port the existing code to the board using
the NXP IDE. The team will start developing their own code for the board starting the first week
after break. Where the goal is to have a working section of the system in the first month and a half
of returning.
D.3.3 Implement object tracking and other algorithms
If the team meets all of the goals defined above the team will then work towards the stretch
goals to add more functionality for the board and improve the speed of the PC System.
D.3.4 Field testing in vehicle
Once the PC and the embedded system are at a testable state the systems will be
implemented into our personal vehicle for testing. As part of the refinement stage we will visually
inspect the output of our algorithms and improve as necessary.
D.3 Conclusion As mentioned before the need for ADAS systems is very clear. Features such as lane
detection and automatic breaking can save lives. Many companies are all trying to develop these
systems that can detect objects and their distances in real time, all under a low power and cost
envelope. As shown above to achieve this statement is actually quite difficult.
The team has shown the basics of the steps requited to create such features. However,
accuracy, reliability, speed, and safety are all necessary improvements still needed. All the steps
mentioned in section C will be continued to develop an ADAS system. Though, refinement and
possible improvements in the code will be explored to make a safe, reliable, real time ADAS
system.

18
E. References [1] P. Dollár, C. Wojek, B. Schiele and P. Perona, Pedestrian Detection: An Evaluation of the
State of the Art PAMI, 2012.
[2] P. Dollár, C. Wojek, B. Schiele and P. Perona, Pedestrian Detection: A Benchmark
CVPR 2009, Miami, Florida.
[3] Year 3 Event Rules. Rep. no. Revision A/ Chicago: Argonne National Labs, n.d. Print.
[4] Khattab, Khalil. “Cascade Detector.” Intechopen.com, Philippe Brunet, Julien Dubois and
Johel Miteran, InTech, August 1, 2011,
http://www.intechopen.com/source/html/17163/media/image3.jpeg.
[5] 3D Object Representations for Fine-Grained Categorization
Jonathan Krause, Michael Stark, Jia Deng, Li Fei-Fei
4th IEEE Workshop on 3D Representation and Recognition, at ICCV 2013 (3dRR-13).
Sydney, Australia. Dec. 8, 2013.
[6] Opelt, A., A. Pinz, M. Fussenegger, and P. Auer. "Generic Object Recognition with
Boosting." IEEE Transactions on Pattern Analysis and Machine Intelligence 28.3 (2006):
416-31. July 2004. Web. 1 Dec. 2016.
[7] T. Veit, J.-P. Tarel, P. Nicolle and P. Charbonnier, "Evaluation of Road Marking Feature
Extraction", in Proceedings of 11th IEEE Conference on Intelligent Transportation
Systems (ITSC’08), Beijing, China, October 12-15, 2008.
[8] Kekre, H., & Sonawane, K. (2013). Performance Evaluation of Bins Approach in YCbCr
Color Space with and without Scaling. International Journal of Soft Computing and
Engineering, 3(3), 204-204.

19
F. Bibliography General statistics. (n.d.). Retrieved December 11, 2015, from http://www-
nrd.nhtsa.dot.gov/pubs/812115.pdf
General statistics. (n.d.). Retrieved December 11, 2015, from
http://www.iihs.org/iihs/topics/t/general-statistics/fatalityfacts/state-by-state-overview#Fatal-
crash-totals
H. Bay, A. Ess, T. Tuytelaars and L. Van Gool, 'Speeded-Up Robust Features (SURF)',
Computer Vision and Image Understanding, vol. 110, no. 3, pp. 346-359, 2008.
Kekre, H., & Sonawane, K. (2013). Performance Evaluation of Bins Approach in YCbCr Color
Space with and without Scaling. International Journal of Soft Computing and Engineering, 3(3),
204-204.
M. Nieto, J. Arróspide Laborda and L. Salgado, 'Road environment modeling using robust
perspective analysis and recursive Bayesian segmentation', Machine Vision and Applications,
vol. 22, no. 6, pp. 927-945, 2010.
M. Nieto, A. Cortés, O. Otaegui, J. Arróspide and L. Salgado, 'Real-time lane tracking using
Rao-Blackwellized particle filter', Journal of Real-Time Image Processing, 2012.
Radic, Drago. “IT – Informatics Alphabet” Split-Croatita. Retrieved November 18, 2015. from
http://www.informatics.buzdo.com/p357-color-correction.htm
R. Tapia-Espinoza and M. Torres-Torriti, 'Robust Lane Sensing and Departure Warning Under
Shadows and Occlusions', Sensors, vol. 13, no. 3, pp. 3270-3298, 2013.
S. Waite and E. Oruklu, 'FPGA-Based Traffic Sign Recognition for Advanced Driver Assistance
Systems', Journal of Transportation Technologies, vol. 03, no. 01, pp. 1-16, 2013.
Viola, P., and M. Jones. "Rapid Object Detection Using a Boosted Cascade of Simple Features."
Proceedings of the 2001 IEEE Computer Society Conference on Computer Vision and Pattern
Recognition. CVPR 2001 (n.d.): n. pag. Web.
G. Acknowledgments Special thanks to Advisers and Professors Dr. Pasricha and Dr. Bradley, and graduate student adviser
Vipin Kumar.

20
Appendix A – Abbreviations
ADAS – Advanced Driver Assistance System
ARM – Advanced RISC Machine
GM – General Motors
HOG – Histogram of Oriented Gradients
HSV – Hue Saturation Value
HUD – Heads Up Display
LiDAR – Light and Radar
MATLAB – Matrix Laboratory
OCR – Optical Character Recognition
PC – Personal Computer
RADAR – Radio Detection and Ranging
RGB – Red Green Blue
SONAR – Sound Navigation and Ranging
YCbCr- Luma Blue-Difference Red-Difference

21
Appendix B – Budget Our current total budget estimate is roughly around $2500.00 - $3000.00. The two primary
sources of funding include the ECE budget and the EcoCAR3 funding. The estimated expenses
account for the laptop, cameras needed for stereo vision, the embedded sensors, storage, and
enclosure needs. As seen below in Table 4 and 5 that we are currently still under budget with most
of our parts needed already paid for. The only other foreseen expenses left are sensors for the board
and an enclosure all which will fit with the amount remaining. We still have yet to spend any
amount of the ECE budget which will provide us some additional funding if needed.
Estimated Budget
Equipment Quantity Price
Nvidia GPU Laptop 1 $2,000.00
USB 3.0 Cameras 2 $100.00 X 2 = $200.00
Mounting Equipment 1 $200.00
Buzzer for Board 1 $25.00
Enclosure for Board 1 $200
Miscellaneous 1 $100
Total Estimated Cost $2,725
Senior Design Amount +$827
Table 4 - Estimated Budget
Actual Spending
Equipment Quantity Price Method of Payment
MSI Laptop 1 $2,000.00 EcoCAR3 Budget
Logitech webcam 2 $135.94 EcoCAR3 Budget
Vanguard multi Mount 1 $74.99 EcoCAR3 Budget
3 Cup Suction Mount 2 $27.98 Jordan Personal
Miscellaneous 1 $31.05 Jordan Personal
External Storage 3TB
Seagate
1 $99.99 EcoCAR3 Budget
Current Cost $2369.95
Table 5 - Actual Spending

22
Appendix C - Project Plan Evolution Project Plan and Deliverables
The first team plan created on September, 5 as seen in figure 12 was a basic timeline that
didn’t have much weight considering the team didn’t all agree on these dates. Not having a more
detailed plan caused the team to fall behind. On October, 16 the team developed a timeline with
the use of sticky notes that made up what can be seen on tables 6 and 7. This format of a timeline
allowed the team to stay more on track gage where the team need to be at all times. We will plan
to follow this format and timeline as the next semester approaches.
Figure 13 - Old Timeline

23
Team Roles and Due Dates
Table 6 - Team Due Dates and Major Deliverables

24
Team Gantt Chart
Table 7 - Team Timeline
25
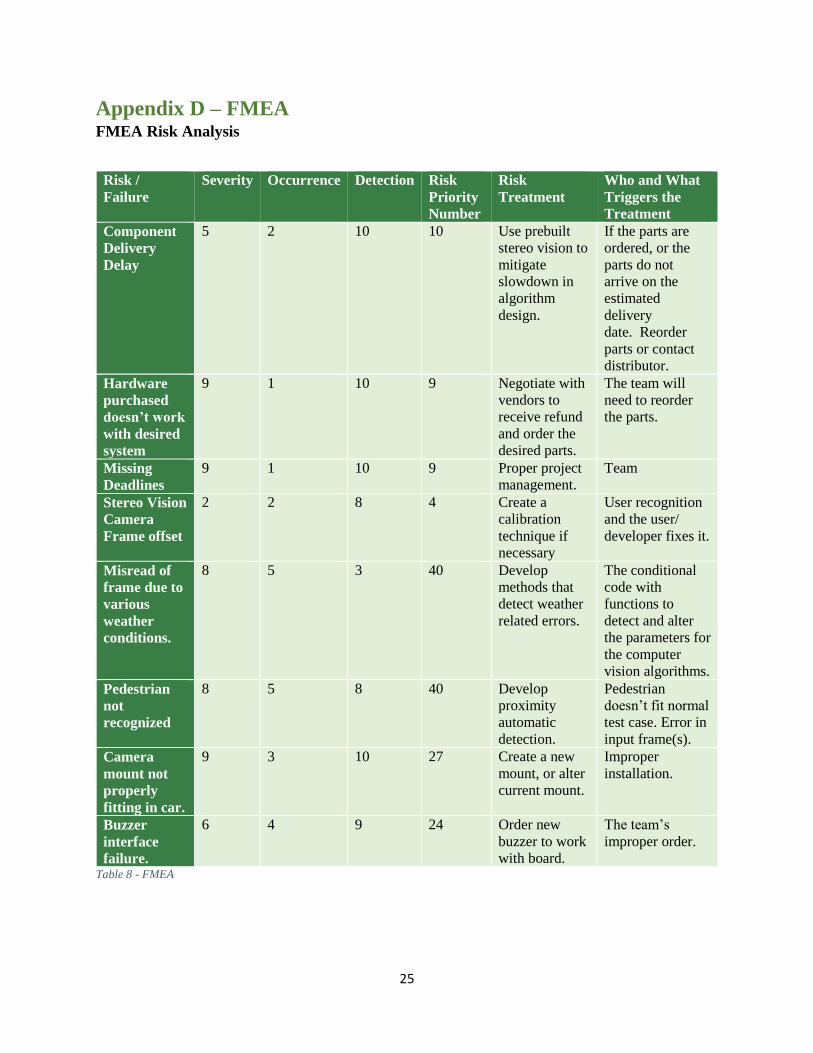
Appendix D – FMEA FMEA Risk Analysis
Risk /
Failure Severity Occurrence Detection Risk
Priority
Number
Risk
Treatment Who and What
Triggers the
Treatment Component
Delivery
Delay
5 2 10 10 Use prebuilt
stereo vision to
mitigate
slowdown in
algorithm
design.
If the parts are
ordered, or the
parts do not
arrive on the
estimated
delivery
date. Reorder
parts or contact
distributor. Hardware
purchased
doesn’t work
with desired
system
9 1 10 9 Negotiate with
vendors to
receive refund
and order the
desired parts.
The team will
need to reorder
the parts.
Missing
Deadlines 9 1 10 9 Proper project
management. Team
Stereo Vision
Camera
Frame offset
2 2 8 4 Create a
calibration
technique if
necessary
User recognition
and the user/
developer fixes it.
Misread of
frame due to
various
weather
conditions.
8 5 3 40 Develop
methods that
detect weather
related errors.
The conditional
code with
functions to
detect and alter
the parameters for
the computer
vision algorithms.
Pedestrian
not
recognized
8 5 8 40 Develop
proximity
automatic
detection.
Pedestrian
doesn’t fit normal
test case. Error in
input frame(s). Camera
mount not
properly
fitting in car.
9 3 10 27 Create a new
mount, or alter
current mount.
Improper
installation.
Buzzer
interface
failure.
6 4 9 24 Order new
buzzer to work
with board.
The team’s
improper order.
Table 8 - FMEA

26
Appendix E – DTVC
As seen in the above figures our goal this year is to develop an ADAS system that can track
pedestrians, vehicles, and lanes. The success of the EcoCar3 ADAS team in developing effective
and efficient recognition and tracking systems is highly dependent on the quantity and quality of
tests performed. As a part of the rubric given to us, the competition will focus on how the team
tested and modified parameters to reach a live tracking and distance estimation system.
Figure 14 - Work Flow
Our test plan involves design, development, test, and optimization. A large portion of our
project will be testing, and then optimizing our algorithms. This will involve gathering test data
in different conditions (described in the plans below). Some initial limits were set, but those values
may change as the test and optimization cycles continue. These limits can be seen in the test plans
below.
Due to the nature of our project most of what we will develop can be tested the same way.
Where the main categories include object detection, distance and velocity estimation, and porting
algorithms to the embedded system. Below are four representative field tests which describe how
the performance of the ADAS systems will be measured.

27
Test 1: Performance Test of Vehicle Detection (using the PC)
Prerequisite Tasks: 1. Classifier trained with training images.
2. Camera Rig setup to capture live footage.
3. Write script to compare ground truth information. Considered correct if bounding boxes cover
80% of pixels.
Design Requirements: 1. Detects vehicles on freeway/highway.
2. Detects vehicles on freeway/highway while road curves.
3. Detects vehicles through changing light conditions.
4. Detects vehicles on city streets.
5. Detects vehicles when changing lanes behind vehicle.
Setup Procedure: 1. Gather test footage/photos from an online database or through personal video capture in a
vehicle with camera rig setup.
2. Create ground truth database for all gathered test footage/photos. Use competition provided
MATLAB software to create bounding boxes around vehicles for each frame/photo.
3. For test with gathered footage/photos, create script to compare ground truth information
between algorithm generated bounding boxes, and manually created bounding boxes.
4. For live testing have camera rig setup with pc, and two people in the car.
5. Test with multiple sets of test images that fulfill design requirements.
Performance Requirements: Database Footage/Photo testing
1. True Positive % True Negative % >= 90%
2. False Positive % and False Negative % <= 10%
Live Testing 1. True Positive % True Negative % >= 90%
2. False Positive % and False Negative % <= 10%
Frame Rate 1. 15 < Frame Rate < 20 with 720p Resolution
Action Plan (based on test results): 1. If true positive or true negative rates are not above 90 %:
- Modify Classifier parameters (Type of classifier, classifier training images)
- Increase image resolution.
2. If Frame rate doesn’t fall in between the bounds: - Modify the number of stages in the classifier.
- Modify classifier to only look for certain angles of vehicles.
- Parallelize classifier to handle multiple angles with multiple threads.
- Decrease image resolution.
Table 9 - Test1 Vehicle Detection

28
Test 2: Performance Test of Vehicle Distance Estimation (using the PC)
Prerequisite Tasks: 1. Stereo camera rig functional.
2. Stereo camera rig calibrated.
3. Object detection can identify and bound each receding vehicle in each frame (90% true positive
rate).
Design Requirements: 1. Calculate the distance to each vehicle (may use whatever method desired).
2. Notate each bounding box with the distance in meters.
3. Estimations beyond 30 meters need not be accurate within 5%.
Setup Procedure: Static Test
1. Park two vehicles a known distance apart.
2. Place Camera rig in one vehicle.
3. Capture footage.
4. Run distance estimation algorithm on captured footage back in the lab.
Dynamic Test
1. Place camera rig in vehicle.
2. Follow another test vehicle down closed off road.
3. Estimate distance in real-time on laptop algorithm.
4. Capture “true” distance using radar gun or other similar devices.
5. Log results.
6. Analyze the results back in the lab (MATLAB).
Performance Requirements: Static Test
1. Estimation is within 5% of actual distance (for distance < 30 meters).
Dynamic Test
1. Estimation is within 5% of actual distance (for distance < 30 meters).
2. Estimates must be made on each frame.
3. Frame rate must be within 15-20 fps at 720p resolution.
Action Plan (based on test results): 1. If estimate is not within 5%:
- Increase image resolution.
- Change inter-camera distance of stereo vision system.
Calibrate the camera with pictures that have a higher confidence score.
2. If frame rate is too low (Dynamic test only):
- Decrease image resolution.
- Optimize object detection (see Test 1 Action Plan).
- Adjust pixel region the algorithm covers.
Table 10 - Test2 Distance Estimation

29
Test 3: Performance Test of Lane Tracking (using the PC)
Prerequisite Tasks: 1. Test footage of lanes recorded of varying clarity. (Solid white, solid faded white, obstructions
snow, no paint)
2. Camera Rig setup to capture live footage.
Design Requirements: 1. Highlight lanes on road and output the pixel width.
2. Detect lanes through changing light conditions.
3. Detects lanes on freeway/highway.
4. Detects lanes on freeway/highway while road curves.
5. Detects lanes on city streets.
6. Detects changing lanes Highlight red.
7. Determines which direction lane changes
Setup Procedure: 1. Gather footage of the needed lanes both still images and live video.
2. Develop ground truth database for all gathered test footage/photos. Use competition provided
MATLAB software to create bounding boxes around lanes for each frame/photo.
3. Create script to compare the developed algorithm vs ground truth information. Considered
correct if bounding boxes cover 80% of pixels.
4. Live test with two people in the car. Track frame rate, analyze video after capture.
Performance Requirements: Database Footage/Photo testing
1. True Positive % True Negative % >= 90%
2. False Positive % and False Negative % <= 10%
3. Detect missing lanes with 50% success
Live Testing 1. True Positive % True Negative % >= 90%
2. False Positive % and False Negative % <= 10%
3. Detect missing lanes with 40% success
Frame Rate 1. 15 < Frame rate < 20 with 720p resolution
Action Plan (based on test results): 1. If true positive rates not above 90%
- Adjust parameters of lane detection algorithm
- Use different algorithm Hough vs Canny edge detection
- Adjust color space to remove effects of lighting conditions
2. If Frame rate doesn’t fall within bounds
- Use lane tracking vs detection every 5 frames to increase performance
- Adjust pixel region the algorithm covers.
Table 11 - Test3 Lane Detection

30
Test 4: Performance Test of Lane Detection on NXP Board vs PC component
Prerequisite Tasks: 1. Lane detection implemented and tested on PC component
2. Lane detection algorithm ported over to NXP board.
Design Requirements: 1. Highlight lanes on road and output the pixel width
2. Detect lanes through changing light conditions
3. Detects lanes on freeway/highway
4. Detects lanes on freeway/highway while road curves
5. Detects lanes on city streets
6. Detects changing lanes Highlight red.
7. Determines which direction lane changes
Setup Procedure: 1. Gather footage of the needed lanes both still images and live video.
2. Test footage of lanes recorded of varying clarity. (Solid white, solid faded white, obstructions
snow, no paint)
3. Develop ground truth database for all gathered test footage/photos. Use competition provided
MATLAB software to create bounding boxes around lanes for each frame/photo.
4. For test with gathered footage/photos, create script to compare ground truth information
between algorithm generated bounding boxes, and manually created bounding boxes.
5. For live testing have camera rig setup with pc, and two people in the car.
6. Test with multiple sets of test images.
Performance Requirements: Database Footage/Photo testing
1. True Positive % True Negative % >= 90%
2. False Positive % and False Negative % <= 10%
Live Testing 1. True Positive % True Negative % >= 90%
2. False Positive % and False Negative % <= 10%
Frame Rate 1. Frame Rate must be at least 90 % of the pc components acceptable frame rate.
2. 13 < Frame Rate < 18 with 720p Resolution
Power Requirement 1. Power < 50 Watts
Action Plan (based on test results): 1. If true positive or true negative rates are not above 90 %:
- Adjust parameters of lane detection algorithm
- Use different algorithm Hough vs Canny edge detection
- Adjust color space to remove effects of lighting conditions
2.) If Frame rate doesn’t fall in between the bounds: - Use Apex vector processing unit to parallelize some aspects of the
algorithm.
Table 12 - Test4 NXP Board

31
Appendix F – Car Classification
Rules for Manually Classifying Positive Vehicle Images
Orientation:
front, back, side left, side right, passing left, passing right, oncoming left, oncoming right
Figure 15 - Car Orientations
Usability: 0 1 2 3
The usability is a measure of how useful the image will be for training for realistic driving
scenarios.
0 = This image should not be included in any training set.
1 = poor
2 = good
3 = great