advanced education and...
TRANSCRIPT

Advanced Educationand Technology
Annual Report2006-07

Advanced Education and Technology ◊ 2006-07 Annual Report
Advanced Education and Technology ◊ 2006-07 Annual Report
For more information, contact:
Corporate Planning and Performance Measurement
Advanced Education and Technology
9th Floor, Commerce Place
10155 102 Street
Edmonton, Alberta T5J 4L5
To be connected toll-free, call 310-000
This document is available on the Internet at
Copyright © 2007, the Crown in Right of the Province of Alberta,as represented by the Minister of Advanced Education and Technology
Permission is hereby given by the copyright owner for any person toreproduce this document for educational purposes and on a non-profit basis.
ISSN 1913-7885
phone
fax
(780) 422-1281
(780) 427-0266
www.advancededandtech.gov.ab.ca
Deaf or hearing impaired with TDD/TDY units,call 427-9999 in Edmonton
Other locations, call 1-800-232-7215

Advanced Education and Technology
Advanced Education and Technology ◊ 2006-07 Annual Report i
Preface 1
1
2
3
4
16
42
63
83
89
104
118
125
138
149
158
Minister’s Accountability Statement
Message from the Minister
Management’s Responsibility for Reporting
Overview
Results Analysis
Financial Statements
Ministry of Advanced Education and Technology
Department of Advanced Education and Technology
Access to the Future Fund
Post-Secondary Institutions
Alberta Research Council Inc.
iCORE Inc. (Alberta Informatics Circle of Research Excellence)
Alberta Heritage Foundation for Medical Research
Alberta Ingenuity (Alberta Heritage Foundation for Science and Engineering Research)
Other Information
Alphabetical List of Government Entities’ Financial Statements in 2006-07 Annual Reports
Advanced Education and Technology
2006-07 Annual Report
Advanced Education and Technology
Advanced Education and Technology ◊ 2006-07 Annual Reportii
Advanced Education and Technology ◊ 2006-07 Annual Report 1
Advanced Education and TechnologyAdvanced Education and Technology
The Public Accounts of Alberta are prepared in accordance with the Financial Administration Act and the Government Accountability Act. The Public Accounts consist of the annual report of the Government of Alberta and the annual reports of each of the 20 Ministries.The annual report of the Government of Alberta released June 21, 2007 contains the Minister of Finance’s accountability statement and the consolidated financial statements of the Province. The Measuring Up report released June 28, 2007 provides a comparison of the actual performance results to the desired results set out in the government’s business plan.This annual report of the Ministry of Advanced Education and Technology contains the Minister’s accountability statement, the audited consolidated financial statements of the Ministry and a comparison of actual performance results to desired results set out in the Ministry business plan. This Ministry annual report also includes:
the financial statements of entities making up the Ministry including the Department of Advanced Education and Technology, regulated funds and provincial agencies for which the Minister is responsible,other financial information as required by the Financial Administration Act and Government Accountability Act, either as separate reports or as a part of the financial statements, to the extent that the Ministry has anything to report.
�
�
The Ministry’s annual report for the year ended March 31, 2007 was prepared under my direction in accordance with the Government Accountability Act and the government’s accounting policies. All of the government’s policy decisions as at September 17, 2007 with material economic or fiscal implications of which I am aware have been considered in the preparation of this report.
Doug HornerMinister of Advanced Education and Technology
original signed by
Public Accounts 2006-07 - Preface
Minister’s Accountability Statement

Adva
nced
Edu
catio
n an
d Te
chno
logy
Advanced Education and Technology
I am pleased to present the 2006-07 Annual Report for the Ministry of Advanced Education and Technology. The report highlights accomplishments of the former ministries of Advanced Education, and Innovation and Science, and also reflects upon the exciting goals Advanced Education and Technology has been working toward since its creation in December 2006.The Ministry, together with its stakeholders, partners and agencies, made many positive steps toward creating accessible, affordable, quality learning opportunities for Albertans, and also supported commercialization and innovation across the province by:
Introducing a new tuition fee policy that limits annual tuition increases to the annual change in the Alberta Consumer Price Index;Issuing the first matching grant payments of $42.5 million under the Access to the Future Fund to support enhancements for the post-secondary system;Registering nearly 24,000 new apprentices, bringing the total number of apprentices being trained in Alberta to more than 60,000;Introducing a new $100 grant under the Alberta Centennial Education Savings Plan for Alberta students aged 8, 11 and 14.Contributing funds toward a $60 million Government of Alberta investment for the state-of-the-art National Institute for Nanotechnology (NINT) in Edmonton;Investing $8 million through the Energy Innovation Fund toward an $11 million contribution to a research project that aims to find the cleanest ways to generate electricity from Alberta’s vast reserves of coal; andAnnouncing a joint investment of $16.6 million in the federal-provincial Western Economic Partnership to increase innovation in, and promote the commercialization of environmental technologies.
Since its creation, Advanced Education and Technology has made great strides in building a stronger Alberta and managing growth pressures by: increasing access, affordability and quality in post-secondary education; increasing support for community education and literacy programs; and addressing the recommendations of the Value Added and Technology Commercialization Task Force to develop a strategy for technology commercialization and economic diversification.I welcome the opportunity for knowledge sharing and innovation this new Ministry brings, and I am confident our future achievements will help keep Alberta prospering in today’s global economy. Along with our stakeholders, the Ministry will continue to work toward building the best advanced learning system and developing the most innovative technology in the country.
�
�
�
�
�
�
�
Doug HornerMinister of Advanced Education and Technology
original signed by
Message from the Minister
Advanced Education and Technology ◊ 2006-07 Annual Report2

Advanced Education and TechnologyAdvanced Education and Technology
The Ministry of Advanced Education and Technology includes:the Department of Advanced Education and Technology,the Access to the Future Fund,the Public Post-Secondary Institutions,the Alberta Research Council Inc., andInformatics Circle of Research Excellence (iCORE) Inc.
The executives of the individual entities within the Ministry have the primary responsibility and accountability for the respective entities. Collectively, the executives ensure the Ministry complies with all relevant legislation, regulations and policies.Ministry business plans, annual reports, performance results and the supporting management information are integral to the government’s fiscal and business plans, annual report, quarterly reports and other financial and performance reporting.Responsibility for the integrity and objectivity of the consolidated financial statements and performance results for the Ministry rests with the Minister of Advanced Education and Technology. Under the direction of the Minister, I oversee the preparation of the Ministry’s annual report, including consolidated financial statements and performance results. The consolidated financial statements and the performance results, of necessity, include amounts that are based on estimates and judgments. The consolidated financial statements are prepared in accordance with the government’s stated accounting policies.As Deputy Minister, in addition to program responsibilities, I establish and maintain the Ministry’s financial administration and reporting functions. The Ministry maintains systems of financial management and internal control which give consideration to costs, benefits and risks that are designed to:
provide reasonable assurance that transactions are properly authorized, executed in accordance with prescribed legislation and regulations, and properly recorded so as to maintain accountability of public money,provide information to manage and report on performance,safeguard the assets and properties of the Province under Ministry administration,provide Executive Council, Treasury Board, the Minister of Finance and the Minister of Advanced Education and Technology any information needed to fulfill their responsibilities, andfacilitate preparation of Ministry business plans and annual reports required under the Government Accountability Act.
In fulfilling my responsibilities for the Ministry, I have relied, as necessary, on the executives of the individual entities within the Ministry.
�
�
�
�
�
�
�
�
�
�
Dr. R.J. (Bob) FessendenDeputy Minister of Advanced Education and TechnologySeptember 17, 2007
original signed by
Management’s Responsibility for Reporting
Advanced Education and Technology ◊ 2006-07 Annual Report 3
Overview
Advanced Education and Technology ◊ 2006-07 Annual Report4
Ove
rvie
w
Introduction
Operational Overview
Summary of Key Activities
Overview

Goals
Advanced Education and Technology’s goals align with its two Core Businesses:
Core Business 1
Core Business 2
Goal 1
Goal 3
Goal 2
Goal 4
Goal 5
Goal 6
Goal 7
A Learning Alberta
Innovation
Quality Advanced Learning Opportunities
Implement Innovation
Build Research Capacity in Areas of Strategic Priority
Accelerate Innovation in the Energy Sector
Accelerate Innovation in the Information andCommunications Technology Sector
Accelerate Innovation in the Life Sciences Sector
Adult Learners Participate in Advanced Education
Assist Alberta to be a learning and innovative society.Mission
Advanced Education
Innovation & ScienceAdvanced Education & Technology
VisionAlberta leads the world in inspiring and supporting lifelong learningfor all its peoples, and prospers through innovation.
Overview
Advanced Education and Technology ◊ 2006-07 Annual Report 5
Overview
In December 2006, the former Ministries of Advanced Education and Innovation and Science were merged to create the Ministry of Advanced Education and Technology.
Alberta Advanced Education and Technology’s vision and mission define the Ministry. The Ministry’s vision is its view of the future and the mission describes the Ministry’s purpose and reason for existence.
The Ministry’s goals are broad statements describing the desired outcomes that the Ministry wants to achieve in fulfilling its mission.
The vision, mission and goals below guided the work of the Ministry in the 2006-07 fiscal year.
Introduction

Adult Learning Communications
Apprenticeship & Industry Training Finance & Administration
Research Human Resources
Technology Commercialization
Policy & Planning
Minister
Deputy Minister
Overview
Advanced Education and Technology ◊ 2006-07 Annual Report6
Ove
rvie
w
Department of Advanced Education and Technology
In collaboration with learning providers, industry, communities, government agencies and non-governmental organizations, the Ministry of Advanced Education and Technology strives to fulfill its mission by creating accessible, affordable and quality learning opportunities that are responsive to the ongoing learning needs of Albertans. The Ministry collaborates with key innovation support agencies to foster support for commercialization and innovation activities across the province.
The Department of Advanced Education and Technology is organized into the Adult Learning, Apprenticeship and Industry Training, Research, Technology Commercialization, and Policy and Planning divisions. In addition, Communications, Finance and Administration, and Human Resources provide supporting functions to the work of the Ministry. Each division provides specific expertise to the advanced learning and innovation system. All divisions share responsibility for providing integrated service by partnering with one another, and with other Alberta ministries, post-secondary institutions, adult learning providers, stakeholder organizations and industry.
Operational Overview

Program Divisions
Support Divisionand Functions
Overview
Advanced Education and Technology ◊ 2006-07 Annual Report 7
Overview
Adult Learning
Apprenticeship and Industry Training
Research
Technology Commercialization
Policy and Planning
Communications
Finance and Administration
Human Resources
The Adult Learning Division works with adult learners and the public and private post-secondary institutions to support learners, provide learning opportunities and enhance the advanced learning system. Specifically, the division funds advanced learning providers; provides student financial assistance to Albertans; coordinates and approves programs of study at public institutions; licenses and approves programs offered by private providers; and funds, supports and provides community adult learning opportunities. The division also coordinates and supports activities of the Access Advisory Council, the Alberta Council on Admissions and Transfer, the Campus Alberta Quality Council and the Students Finance Board.
The Apprenticeship and Industry Training Division works with industry, employer and employee organizations, technical training providers, government and Ministry divisions to support the development, maintenance, and delivery of designated trade and occupation programs. Specifically, the division provides planning, coordination, and policy support to the Alberta Apprenticeship and Industry Training Board and its network of industry committees; facilitates industry’s development of training and certification standards; counsels apprentices and employers; provides funding for approved programs; promotes participation and certifies individuals in designated trades and occupations and monitors the workplace for compliance with the Apprenticeship and Industry Training Act and regulations.
The Research Division works with the Alberta Science and Research Authority and its research institutes for Life Sciences, Energy, Information and Communications Technology, Agriculture and Forestry to coordinate, support and promote research, development and innovation in the strategic priority sectors of energy, life sciences (e.g. agriculture, forestry, health, water), information and communications technology and nanotechnology. The University Research and Strategic Investments Branch is responsible for the pre- and post-award management of research capacity/equipment grant programs and the Innovation and Service Excellence Program. It facilitates alignment with the Research Institutes’ initiatives and other research partners where appropriate to build capacity and research excellence.
The Technology Commercialization Division supports the creation and establishment of new technology companies in key emerging industries by focusing on four areas of activity: technology development services; business development services; access to capital; and international partnerships and investment attraction. The division also provides the department with information management and technology services.
The Policy and Planning Division supports the Ministry in strategic corporate planning, innovation and advanced education policy development, and in provision of department-wide business innovation and legislative and regulatory services. The division works closely with the department’s line divisions, associated agencies (such as the Alberta Science and Research Authority), other support units within the department, and with advanced education and innovation departments in other jurisdictions. System issues are identified and understood through comprehensive environmental scanning and information collection and analysis processes. Policy options are identified and information, policies and planning directions are communicated to help the Ministry achieve its goals.
Communications provides timely, strategic communications support and advice (planning, consulting and technical guidance) to the Minister and the department on key issues, policies and initiatives. Communications works closely with other provincial departments and other levels of government, media, stakeholders, educational and research institutions and others to inform Albertans about the importance of advanced learning and innovation.
Finance and Administration provides strategic advice and services to the department in areas such as financial planning, reporting and operations. The goal of Finance and Administration is to ensure the effectiveness and efficiency of financial management, accountability and administration functions within the Ministry.
Human Resources provides consultation and support, and advises the department on all activities related to the management of its human resources such as policy and planning, staffing, performance management, job classification and organization design, employee relations, staff development, occupational health and safety, wellness, and pay and benefits.
Department of Advanced Education and Technology
Minister
Minister
Access to the Future Fund
Department of Advanced Education & Technology
Alberta Heritage Foundation for Medical Research Alberta Ingenuity
Public Post-Secondary InstitutionsUniversities
Colleges
Technical Institutes
Banff Centre
University of Alberta
Alberta College of Art & Design
Northern Alberta Institute of Technology
The Banff Centre for Continuing Education
Southern Alberta Institute of Technology
Bow Valley CollegeGrande Prairie Regional CollegeGrant MacEwan CollegeKeyano CollegeLakeland CollegeLethbridge CollegeMedicine Hat CollegeMount Royal CollegeNorQuest CollegeNorthern Lakes CollegeOlds CollegePortage CollegeRed Deer College
University of CalgaryUniversity of LethbridgeAthabasca University
Alberta Research Council Inc.
iCORE Inc.
Overview
Advanced Education and Technology ◊ 2006-07 Annual Report8
Ove
rvie
w
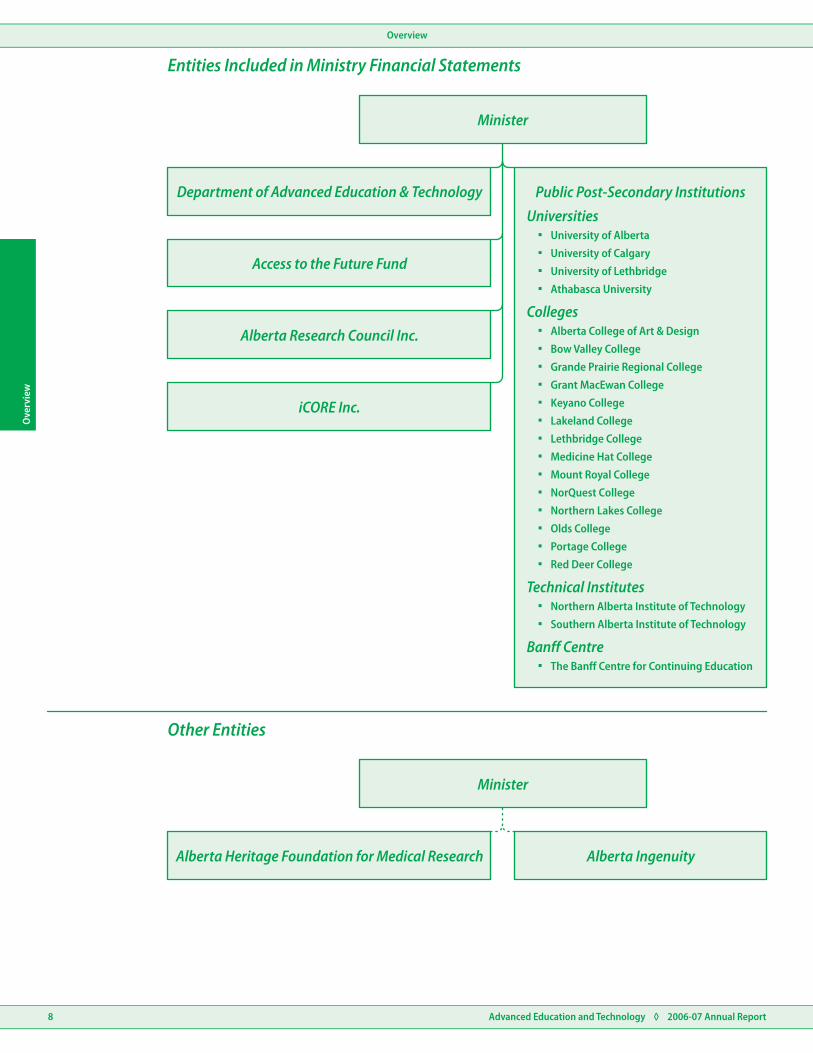
Entities Included in Ministry Financial Statements
Other Entities
Overview
Advanced Education and Technology ◊ 2006-07 Annual Report 9
Overview
The following entities are arms-length from, but accountable to, the Government of Alberta. They are excluded from consolidated budgets and financial statements of both the Ministry and the Government of Alberta. Under their respective statutes, these entities must prepare an annual report of their activities, including audited financial statements, and submit these to the Minister.
The Alberta Heritage Foundation for Medical Research supports biomedical and health research at Alberta universities, affiliated institutions, and other medical and technology-related institutions. The foundation currently provides funding for over 600 researchers and researchers-in-training at the province’s three main universities. Total funding awarded since 1980 is in excess of $850 million.
Alberta Ingenuity is the trade name of the Alberta Heritage Foundation for Science and Engineering Research. It supports a balanced, long-term program of science and engineering research based in Alberta to nurture the discovery of new knowledge and encourage its application to benefit Albertans.
Alberta Heritage Foundation for Medical Research
Alberta Ingenuity
Department of Advanced Education and Technology
Access to the Future Fund
Alberta Research Council Inc.
iCORE Inc.
Public Post-Secondary Institutions
For an overview of the Department of Advanced Education and Technology see pages 6 and 7.
The Access to the Future Fund supports innovation and excellence within the advanced learning system to enhance and expand accessible, affordable and high quality learning opportunities. The Fund receives income from an endowment held within the Alberta Heritage Savings Trust Fund. Established in 2005, the endowment is targeted to reach $3 billion at full implementation.
Alberta Research Council Inc. is a not-for-profit corporation owned by the Government of Alberta that delivers innovative science and technology solutions to meet the priorities of industry and government in Alberta and beyond. The corporation accelerates the development and commercialization of products, processes and services in the energy, life sciences, agriculture, environment, forestry and manufacturing sectors.
iCORE Inc. (Informatics Circle of Research Excellence) is a not-for-profit corporation owned by the Government of Alberta that supports the innovation-based economy of the province by attracting world-class information and communications technology researchers and graduate students to Alberta. Access to research expertise and high quality students provides Alberta’s traditional and emerging industry sectors with the knowledge and human resources needed to compete in the global economy.
Alberta’s public post-secondary institutions include universities, colleges, technical institutes and the Banff Centre.
Alberta’s four universities offer a wide range of undergraduate degree programs, as well as a comprehensive range of graduate studies. The universities are responsible for the majority of research undertaken within the province’s post-secondary system. Main campuses for Alberta’s three campus-based universities are located in Calgary, Edmonton and Lethbridge. There is also one distance learning university located in Athabasca.
Alberta’s 14 colleges may offer academic upgrading, job readiness, apprenticeship, certificate, diploma, university transfer, baccalaureate and applied degree programs.
Alberta also has two technical institutes that offer programs tailored to workplace requirements. Technical institutes may offer certificate, diploma, baccalaureate and applied degree, apprenticeship and continuing education programs.
The Banff Centre for Continuing Education provides advanced continuing education opportunities in fine arts, management studies, language training and environmental training for people who already have academic credentials and/or professional experience in their discipline.
Entities Included in Ministry Financial Statements
Other Entities

Access Advisory Council Alberta Science & Research Authority
Alberta Agricultural Research InstituteAlberta Life Sciences Institute
Alberta Forestry Research InsituteAlberta Energy Research InsituteAlberta Information & CommunicationsTechnology Institute
Alberta Apprenticeship & Industry Training Board
Alberta Council on Admissions & Transfer
Campus Alberta Quality Council
Students Finance Board
Minister
Overview
Advanced Education and Technology ◊ 2006-07 Annual Report10
Ove
rvie
w
Advisory Boards, Councils and Authorities

Overview
Advanced Education and Technology ◊ 2006-07 Annual Report 11
Overview
Access Advisory Council
Alberta Apprenticeship and Industry Training Board
Alberta Council on Admissions and Transfer
Campus Alberta Quality Council
Students Finance Board
Alberta Science and Research Authority
�
�
�
�
�
The Access Advisory Council is a 9-member council appointed by the Minister of Advanced Education and Technology. The Council provides strategic advice and recommendations to the Minister of Advanced Education and Technology regarding the objectives, operation and reporting of the Access to the Future Fund.
The Alberta Apprenticeship and Industry Training Board is a 13-member board, appointed by the Lieutenant Governor in Council. The Board works with industry to establish the standards and requirements for training and certification in programs under the Apprenticeship and Industry Training Act. It makes recommendations to the Minister of Advanced Education and Technology about the needs of Alberta’s labour market for skilled and trained workers and the designation of trades and occupations.
The Alberta Council on Admissions and Transfer is a 15-member council with representation from the public, students, the universities, public colleges and technical institutes, private colleges and Alberta Education. As an independent body, which reports annually to the Minister of Advanced Education and Technology, it is responsible for developing policies, guidelines and procedures designed to facilitate transfer agreements among post-secondary institutions.
The Campus Alberta Quality Council is an 11-member council that provides advice to the Minister of Advanced Education and Technology with respect to the quality of all proposed degree programs at both public and private institutions. It is also responsible for monitoring the programs once approved to ensure that the Council’s conditions and quality standards continue to be met.
The Students Finance Board is an 11-member board appointed by the Minister of Advanced Education and Technology, with representation from the public and students. The Board provides advice to the Minister on matters pertaining to financial assistance for post-secondary students. The Minister may also request the Board to make inquiries, conduct research, or collect information, and report the results to the Minister.
The Alberta Science and Research Authority is an independent board of members from Alberta’s academic, business and research communities, appointed by government. The authority’s mission is to enhance the contribution of science and research to the sustainable prosperity and quality of life of all Albertans. In order to fulfill this mission, the authority functions as the senior science and research advisory body to the Government of Alberta.
The authority includes:
Alberta Life Sciences Institute
Alberta Agricultural Research Institute
Alberta Forestry Research Institute
Alberta Energy Research Institute
Alberta Information and Communications Technology Institute
Each institute is an unincorporated board comprising representatives from industry, academia and government. They provide strategic direction in priority sectors.
Advisory Boards, Councils and Authorities

Overview
Advanced Education and Technology ◊ 2006-07 Annual Report12
Ove
rvie
w
In support of its core businesses and goals, Alberta Advanced Education and Technology pursued the following activities in 2006-07.
�
�
�
�
�
�
�
�
�
�
�
Released the A Learning Alberta final report which includes a long-range policy framework for Alberta’s advanced education system. As a result of the recommendations, the Ministry initiated the development of a roles and mandates framework for the publicly funded post-secondary system and launched Vibrant Learning Communities, a comprehensive review of community adult learning programs.
Invested $42.5 million through the Access to the Future Fund for matching grants for donations to universities, colleges, technical institutes and other post-secondary providers to improve access, affordability and quality. The Access to the Future Fund receives income from an endowment that was increased from $750 million to $1 billion in 2006-07.
Invested $24.5 million in the University of Alberta’s new China Institute to support the institute as it develops educational, research and business connections between China and Alberta.
Created more than 2,400 new certificate, diploma, undergraduate and graduate spaces at Alberta’s post-secondary institutions through the Enrolment Planning Envelope, increasing learner access to Alberta’s post-secondary system. Of these new spaces, 200 were created for Aboriginal students, with the majority being created outside of the seven major urban centers close to Aboriginal communities.
Increased the number of apprenticeship technical training seats by 26% from the previous year.
Expanded access to baccalaureate nursing programs, following the recommendation of the Campus Alberta Quality Council to approve a new four-year Bachelor of Science in Nursing degree at Grant MacEwan College.
Approved 17 new degree programs proposed by Alberta public colleges, university colleges and universities based on the recommendation of the Campus Alberta Quality Council.
Addressed industry need for certification and training options in the ironworker and welder trades and recognized snubbing services as a designated occupation.
Licensed five new private institutions to offer vocational training programs in accordance with the Private Vocational Schools Act. There are now 151 private institutions in Alberta offering 764 licensed vocational training programs.
Supported 83 Community Adult Learning Councils which provided approximately 65,000 registrants with almost 5,000 course, workshop and conference opportunities.
Expanded access to apprenticeship technical training in local communities by offering electrician technical training at Northern Lakes College and welder technical training at Olds College for the first time.
�
�
�
�
�
�
�
�
�
Facilitated distribution of apprenticeship Individual Learning Modules (ILMs) in provinces across Canada through agreements with nine colleges outside Alberta. Of the 1.4 million ILMs utilized, out-of-province usage accounted for 29%, resulting in the expanded use of consistent training materials across Canada.
Worked with post-secondary technical training providers to provide pre-trades training that leads to an apprenticeship. Pre-trades training opportunities were offered in the heavy equipment technician, electrician, welder, carpenter, steamfitter-pipefitter, millwright and automotive service technician trades in locations across the province.
Contributed $2.8 million toward a $16 million investment for an equipment legacy program for the WorldSkills Calgary 2009 competition.
Amended the Post-secondary Learning Act and created a new regulation to allow public colleges and technical institutes in Alberta that offer bachelor degree programs to choose a model of governance that reflects the involvement of academic staff in decision making around academic programming.
In collaboration with Alberta Infrastructure and Transportation, provided a total of $395 million for maintenance, preservation and expansion projects to enhance the infrastructure of Alberta’s post-secondary system and facilitate the delivery of high-quality advanced learning opportunities throughout the province.
Created a new $300,000 Alberta-Smithsonian internship program through the University of Alberta that will provide opportunities for 50 post-secondary students to gain valuable international academic and life experiences.
Introduced the Washington Center-Alberta internship partnership which will offer 25 Alberta post-secondary students the opportunity to gain work experience or take courses at The Washington Center in Washington D.C. and earn academic credit at their home institution.
Supported the recognition of prior learning by processing over 8,200 prior learning assessment applications for apprentices and trade certificate applicants, a 60% increase over the previous year. These provide advanced standing in an apprenticeship program or full certification.
Worked collaboratively with Alberta Employment, Immigration and Industry; Service Canada; and Citizenship and Immigration Canada to provide foreign worker information sessions across the province. The sessions provide information about the foreign worker recruitment processes, rights and obligations.
Summary of Key Activities
A Learning Alberta
Goal 1
Core Business 1
Quality Advanced Learning Opportunities
Overview
Advanced Education and Technology ◊ 2006-07 Annual Report
Overview
�
�
�
�
�
�
�
�
�
�
�
Established and implemented components of the Affordability Framework, including the establishment of a new tuition fee policy that limits annual tuition increases to the annual change in the Alberta Consumer Price Index, and the implementation of changes to student financial assistance programs.
Launched mentoring pilot projects in Edmonton and Calgary to help younger students discover their skills and interests, build their self-esteem, and learn about all aspects of planning for post-secondary studies.
Expanded the Learning Clicks post-secondary awareness program to include a component focused on providing parents with information on the learning options available to their children.
Supported industry and organizations to encourage increased hiring and training of underrepresented groups in the trades through the Alberta Aboriginal Apprenticeship Project, Youth Apprenticeship Project, CAREERS: The Next Generation, Aboriginal Youth Ambassadors, Youth in Transition to Apprenticeship Project, and Opportunities for Women in Construction.
Registered nearly 24,000 new apprentices, bringing the total number of apprentices being trained in Alberta to more than 60,000. Participation in Alberta’s apprenticeship and industry training system is at the highest level ever, which is helping to address the skilled labour shortages being experienced in the province.
Launched new resources for students with disabilities and their parents to assist with preparing and planning for post-secondary studies.
Launched the Youth in Transition program, a new pilot program through NorQuest College that will assist immigrant youth in strengthening their literacy skills.
Promoted increased hiring of apprentices by employers, resulting in more than 13,500 employer training sites for apprentices.
Funded 72 volunteer tutor adult literacy programs that assisted 2,019 adults with more than 89,000 hours of tutoring support to improve their reading, writing, numeracy, or English language skills.
Provided a record number of scholarships to more than 30,000 Alberta students totaling almost $50 million.
Awarded a record 396 Registered Apprenticeship Program (RAP) scholarships, worth $1,000 each, to high school graduates throughout the province.
�
�
�
�
�
�
�
�
�
�
�
�
Expanded the Alexander Rutherford High School Achievement Scholarship by adding hundreds of different courses to the eligibility criteria for Grade 12 students who achieve outstanding grades.
Awarded 60 Aboriginal post-secondary students with the Aboriginal Health Careers Bursary to help ensure that Aboriginal communities will have greater access to Aboriginal health care practitioners and culturally-sensitive health services.
Partnered with nine Aboriginal organizations to support family literacy programming specific to their needs.
Implemented a $2 million pilot program that will provide grants for post-secondary students attending First Nations colleges.
In partnership with the Canada Millennium Scholarship Foundation, introduced the Millennium Alberta Rural Incentive Bursary that provided 4,574 post-secondary students from rural Alberta up to $1,000 each towards their post-secondary education.
Awarded more than $7.2 million in scholarships to 1,400 Albertans completing masters and doctorate level studies recognizing their exceptional academic achievement.
Launched the Scholarship Connections database, a new online tool to provide prospective and current post-secondary students with improved access to scholarship opportunities.
Awarded eight Alberta high school students with Grant MacEwan United World College Scholarships, providing them with two years of study at one of 12 United World Colleges located worldwide.
Completed a federal-provincial agreement that will allow international students studying at Alberta’s public post-secondary institutions to work off-campus.
Expanded the Alberta Centennial Education Savings Plan to students aged 8, 11 and 14, making them eligible to receive a $100 grant from the Government of Alberta for their Registered Education Savings Plan (RESP).
Responded to 159,713 enquiries on student assistance programs including loans, grants, bursaries and scholarships.
Co-chaired the Building and Educating Tomorrow’s Workforce priority initiative with Alberta Employment, Immigration and Industry. A provincial labour force strategy with four themes: inform, attract, develop and retain, was successfully released to the public and actions related to the four themes were implemented.
Goal 2 Adult Learners Participate in Advanced Education
13

Overview
Advanced Education and Technology ◊ 2006-07 Annual Report14
Ove
rvie
w
�
�
�
�
�
Announced $16.6 million under the joint federal-provincial Western Economic Partnership for innovation and economic development initiatives to fund 10 diverse projects including carbon dioxide management, fuel cells technology, the development of new environmental products, and bioproducts.
Launched the National Institute for Nanotechnology (NINT) facility in Edmonton, which includes high-tech equipment providing optimal conditions for nano-scale research and collaboration, and will help make Alberta one of the world’s leaders in this highly sophisticated and specialized science.
As part of Innovation and Investment Week, sponsored The Banff Venture Forum and the Alberta Life Technologies Investor Forum, attracting more than 300 local and international investors and government officials. The forums provided insight into key industry issues as well as the chance to learn from world-class investment professionals.
Provided $2.6 million in funding for the Regional Innovation Support Initiative to help Alberta entrepreneurs and innovative companies through different phases of the innovation process.
Announced a new funding competition for Alberta’s Innovation Program, resulting in the provision of $7.6 million for 11 innovative projects. The projects included: exploring innovative approaches to the use of new technologies to add value to pulp production; developing new fibres from agricultural products as materials for industry; and demonstrating technologies to remove hydrocarbons and solids from produced water in heavy oil.
�
�
�
�
�
�
Doubled the capacity of Alberta Ingenuity’s industry associates program by providing 40 new researchers a stipend of $48,000 and a research allowance of $7,000 each year for up to two years, to address the growing need for research personnel in industry.
Provided $2.4 million to 12 successful researchers to help get their labs up and running, through three rounds of the competitive Small Equipment Grants Program.
Provided $19.7 million to support large-scale research infrastructure projects through the competitive Alberta Science and Research Investments Program.
Provided $400,000 in renewal funding to the Pacific Institute for the Mathematical Sciences to support the Institute’s math-based educational and industrial activities.
Provided $500,000 to the Canadian Institute for Advanced Research to support networks of leading researchers who contribute to strategic research priorities in Alberta and beyond.
Provided $700,000 for priority research equipment for the National Institute of Nanotechnology.
�
�
�
�
Launched the Hydrocarbon Upgrading Demonstration Program to test and demonstrate next generation technologies (e.g. gasification) that upgrade hydrocarbons to value-added refined products and which include carbon dioxide capture and storage.
Sponsored the Global Networking Symposium on BioEnergy in Calgary, featuring international speakers and provincial leaders in agriculture, finance and energy, and focusing on the multi-billion dollar global biofuel industry and opportunities for production of bio-based transportation fuels in Alberta.
Provided $22.5 million toward the first projects to be funded under the $200 million Energy Innovation Fund. One project will determine the best design for a plant to use Alberta’s lower mercury and lower sulphur coal as a cleaner fuel to generate heat and electricity. Another project will gasify solid wastes to produce electricity, resulting in a smaller landfill and reduced methane gas which is a key greenhouse gas.
Began developing technologies to make bitumen more marketable world wide, supporting economic growth and employment via small regional field developments, developing new industries and creating possibilities for exporting technology and expertise.
Innovation
Goal 3 Goal 5
Goal 4
Core Business 2
Implement Innovation Accelerate Innovation in the EnergySector
Build Research Capacity in Areas ofStrategic Priority

Overview
Advanced Education and Technology ◊ 2006-07 Annual Report 15
Overview
�
�
�
�
�
�
�
Contributed $2.5 million towards the establishment of the Alberta Centre for Micro and Nano-technologies Packaging and Product Development.
Contributed $160,000 towards a nearly $1 million investment, in partnership with Western Economic Diversification Canada, in support of phase two of the Wireless City initiative, to showcase Alberta’s wireless products and services to international markets via demonstrations, tradeshows and the first “Alberta Wireless Solutions” catalogue.
Coordinated the Information and Communications Technology Forum, Alberta Week - Alberta at the Smithsonian Folklife Festival, which highlighted nine Alberta companies providing diagnostic sensing and surveillance technologies to allow remote monitoring of people, assets or situations.
Participated in the second workshop on Sensor Networks with the University of Alberta, University of Calgary, and China’s Harbin Institute of Technology, focusing on potential areas of collaboration in sensor technology applications.
rdSponsored a technology showcase at the 33 meeting of the Asia Pacific Cooperation Telecommunications and Information Working Group, to position Calgary, Alberta and Canada as international trade, technology and policy leaders in both the information and communications technology industry and the Asia Pacific Region.
Initiated and facilitated with the National Institute for Nanotechnology, the attraction of the Xerox Research Centre of Canada. Referred to as “XRCC West”, this centre will engage in a series of research and development projects to create new technology, exploiting nano-scale behaviour.
Established two new iCORE Chairs in Alberta, an iCORE Chair in Information Security and an iCORE/SMART Technologies Industry Chair in Interactive Technologies Research. These two new chairs significantly enhance the capacity of the research system in Alberta and expand the iCORE Academy to a total of 11 Industry Chairs and 15 Research Chairs.
�
�
�
�
�
�
�
�
�
Invested $7.8 million in the Alberta Agricultural Research Institute’s three strategic theme areas: bioproducts, sustainable production, and health and nutrition.
Invested $6.6 million in the Alberta Forestry Research Institute’s strategic theme areas of: sustainable forest management, new products and processes, and value chain improvement, including $4.3 million in mountain pine beetle research.
Invested $8.8 million in the Alberta Life Sciences Institute’s four strategic themes: bioproducts innovation, health innovation, resource management innovation and building the base, including a $5.0 million investment in water research.
Participated in the Agricultural Biotechnology International Conference 2006, with leading international researchers in the agricultural biotechnology sector and industry partners and investors, focusing on both the innovation and the commercialization of agriculture biotechnology.
Contributed to the development of the Biotech Business Development Centre, a multi-tenant facility designed to help growing companies in the early stages of development access subsidized flexible lab space for the development of biotechnology products and services to unleash their innovative and commercial potential.
Promoted Alberta biotechnology industries to international audiences at the BIO 2006 conference, showcasing innovation from companies and government agencies including therapeutic drugs for cancer, hepatitis and multiple sclerosis; regenerative medicine; plant-made pharmaceuticals; and contract research and bio-manufacturing.
The Alberta Research Council has significantly improved the recovery of heavy oils through advancements in polymer flooding, which moves oil more effectively into production wells and can increase recovery of heavy oils by another 10%.
The Alberta Research Council, together with its partner Golder Associates, developed MapNow, a new software tool that aids in decision making related to land-use management by creating spatial maps of various potential landscape changes resulting from all types of human land use.
The Alberta Research Council continues to position the province to take an active role in developing the bio-economy by working on many fronts, from feedstock to processing to end-product, in order to build the science and technology base for a biocomposites industry in Alberta.
Goal 6 Goal 7Accelerate Innovation in the Informationand Communications Technology Sector
Accelerate Innovation in the Life SciencesSector

Audited Information
Results Analysis
Advanced Education and Technology ◊ 2006-07 Annual Report16
Resu
lts A
naly
sis
Report of the Auditor General on the Results of Applying Specified Auditing Procedures toPerformance Measures
Operational Highlights
Financial Highlights
Core Business 1 - A Learning Alberta
Core Business 2 - Innovation
Goal 1 - Quality Advanced Learning Opportunities
Goal 2 - Adult Learners Participate in Advanced Education
Goal 3 - Implement Innovation
Goal 4 - Build Research Capacity in Areas of Strategic Priority
Goal 5 - Accelerate Innovation in the Energy Sector
Goal 6 - Accelerate Innovation in the Information and Communications Technology Sector
Goal 7 - Accelerate Innovation in the Life Sciences Sector
Results Analysis

Advanced Education and Technology ◊ 2006-07 Annual Report 17
Results AnalysisResults Analysis
To the Members of the Legislative Assembly
Management is responsible for the integrity and objectivity of the performance results included in the Ministry of Advanced Education and Technology's 2006–07 Annual Report. My responsibility is to carry out the following specified auditing procedures on performance measures in the annual report. I verified:Completeness1. Performance measures and targets matched those included in Budget 2006. Actual
results are presented for all performance measures.Reliability2. Information in reports from external organizations, such as Statistics Canada, matched
information that the Ministry used to calculate the actual results.3. Information in reports that originated in the Ministry matched information that the
Ministry used to calculate the actual results. In addition, I tested the processes the Ministry used to compile the results.
Comparability and Understandability4. Actual results are presented clearly and consistently with the stated methodology and
are presented on the same basis as targets and prior years' information.I found no exceptions when I performed these procedures.As my examination was limited to these procedures, I do not express an opinion on whether the set of measures is relevant and sufficient to assess the performance of the Ministry in achieving its goals.
Fred J. Dunn, FCAAuditor General
original signed by
Edmonton, AlbertaAugust 8, 2007
Report of the Auditor General on the Results of ApplyingSpecified Auditing Procedures to Performance Measures

Resu
lts A
naly
sis
Advanced Education and Technology ◊ 2006-07 Annual Report18
Results Analysis
A Learning Alberta
Internal Government Transfers
Other Revenue
Sub-Total
Core Business
Transfers from Government of Canada
Innovation
Increase in Equity in Public Post-Secondary Institutions
2,314,104
168,438
65,853
461,856
227,565
1,827,575
131,338
53,331
398,723
214,054
2,200,994
163,159
58,693
475,999
254,147
194,475
372,206
198,715
289,959
182,855
—
2,508,579
834,062
2,026,290
688,682
2,383,849
475,999
$
$
$
$
$
$
$
$
$
$
$
$
Budget
Budget
Actual
Actual
2007
2007
2006
2006
Actual
Actual
(in thousands)
(in thousands)
Financial Highlights
Expenses
Expenses were $125 million more than originally budgeted, primarily due to the approval of additional operational and infrastructure funding for the province’s public post-secondary institutions. Expenses were $482 million higher than the prior year, primarily due to increases in operational and infrastructure funding for public post-secondary institutions, as well as the payment of the first grants from the Access to the Future Fund. Detailed information on grants provided to Alberta’s public post-secondary institutions can be found in Schedule 4 of the Ministry Financial Statements on page 59.
All expenses for the A Learning Alberta core business are in support of the Government of Alberta’s “Education” function. All expenses for the Innovation core business are in support of the “Agriculture, Research Management and Economic Development” function.
Revenue
A discussion of the main sources of revenue is below. Additional detail on the Ministry’s revenues can be found in Schedule 1 of the Ministry Financial Statements on page 56.
Transfers from Government of Canada include $175 million for Canada Social Transfers (CST). CST is calculated throughout the year, after budget estimates are made, and is based on a tax-points system that adjusts payments based on the province’s tax base. In addition to CST, the Ministry received a payment from the new federal Post-Secondary Infrastructure Trust of $51 million for capital grants to public post-secondary institutions.
Internal Government Transfers includes $104 million from the Lottery Fund for various Ministry programs and $25 million from the Alberta Heritage Scholarship Fund for Heritage Scholarships. It also includes a $40 million transfer from the Advanced Education Endowment to support the Access to the Future Fund.
Other Revenue includes $45 million for contract research revenues at the Alberta Research Council (ARC), $8 million for interest on student loans issued and $7 million related to apprenticeship marketing activities.
As per the government’s accounting and reporting policies, the change in equity in public post-secondary institutions is reported in the Ministry financial statements. The change in equity reflects the cumulative effect of the institutions’ financial transactions. The budget process does not include the institutions and no budget was set for their change in equity.

Results Analysis
Advanced Education and Technology ◊ 2006-07 Annual Report 19
Results Analysis
Core Business 1 A Learning Alberta
Operational Highlights
Expenses In 2006-07, the Ministry provided $2.3 billion in support of the A Learning Alberta core business, in the following areas:
$1.4 billion in base operating grants to the 21 public post-secondary institutions and seven private, not-for-profit colleges to support instruction and operating costs.
$395 million for post-secondary facilities infrastructure.
$213 million for spaces in programs (including apprenticeship training) that are institution priorities and have high learner and labour market demand.
$42 million in matching grants paid from the Access to the Future Fund.
$24 million in departmental support to the Apprenticeship and Industry Training system.
$20 million in support of community based adult learning programs including literacy and inmate programs.
$50 million for other support including:
Grants to support strategic initiatives at post-secondary institutions (e.g. China Institute at the University of Alberta).
Grants to encourage and reward excellence and improve performance at post-secondary institutions.
Funding for institutions’ technology requirements (e.g. high speed internet access, Microsoft licenses).
Total funding to support the advanced learning system increased by $510 million from 2005-06, primarily in the areas of operating grants and infrastructure.
$50 million in scholarships, including Heritage and Achievement Scholarships.
$22 million in bursaries, including the Alberta Opportunities and Rural Incentive bursaries.
$31 million in projected loan relief and expenses related to future defaults on student loans.
$15 million in other support to learners including almost $8 million in Alberta Centennial Education Savings Plan grants and $7 million to improve loan systems.
Quality Advanced Learning Opportunities
�
�
�
�
�
�
�
�
�
�
Learners Participate in Advanced Education
�
�
�
�
902005-06
% 20 40 60 80 100
Satisfaction of Recent Post-SecondaryGraduates with the Overall Quality of theirEducation
Source: Alberta Advanced Education and Technology
Resu
lts A
naly
sis
Advanced Education and Technology ◊ 2006-07 Annual Report20
Results Analysis
Core Business 1 A Learning Alberta
Goal 1 Quality Advanced Learning Opportunities
Strategies In support of Goal 1, Advanced Education and Technology adopted the following strategies:
Implement an overall advanced learning policy framework to guide strategic direction of the advanced learning system. To facilitate this, the Ministry will align the organizational structure, as well as measures of performance, so they support the objectives of the A Learning Alberta review.
Implement the accessibility, affordability and quality requirements of the Access to the Future Act.
Support the development of a post-secondary application process and complete the development of the website providing access to information and application processes for scholarships, to enable learners to better access learning opportunities.
Implement responsive mechanisms that support investment in the advanced learning system.
Develop a long-term capital plan to address the infrastructure needed to support quality learning opportunities in Alberta’s public post-secondary institutions.
Encourage increased industry participation and investment in the apprenticeship and industry training system in collaboration with the Alberta Apprenticeship and Industry Training Board, employers and stakeholders.
Further develop Alberta’s unique cooperative arrangements and strengthen Alberta’ leadership in pan-Canadian initiatives through the Council of Ministers of Education, Canada; Canadian apprenticeship councils; and others.
Co-champion the Building and Educating Tomorrow’s Workforce Top Priority and support other government top priorities.
Enhance Alberta’s capacity for innovation, knowledge creation and knowledge transfer in collaboration with post-secondary institutions and other stakeholders.
Implement an international education action plan to position the international education sector competitively and to facilitate the internationalization of the post-secondary system.
Support the implementation of Alberta’s policy framework on immigration to Alberta by working with partners and stakeholders to increase opportunities for English as a Second Language, improve ways for international students to access Alberta’s labour market and enhance foreign credential recognition.
�
�
�
�
�
�
�
�
�
�
�
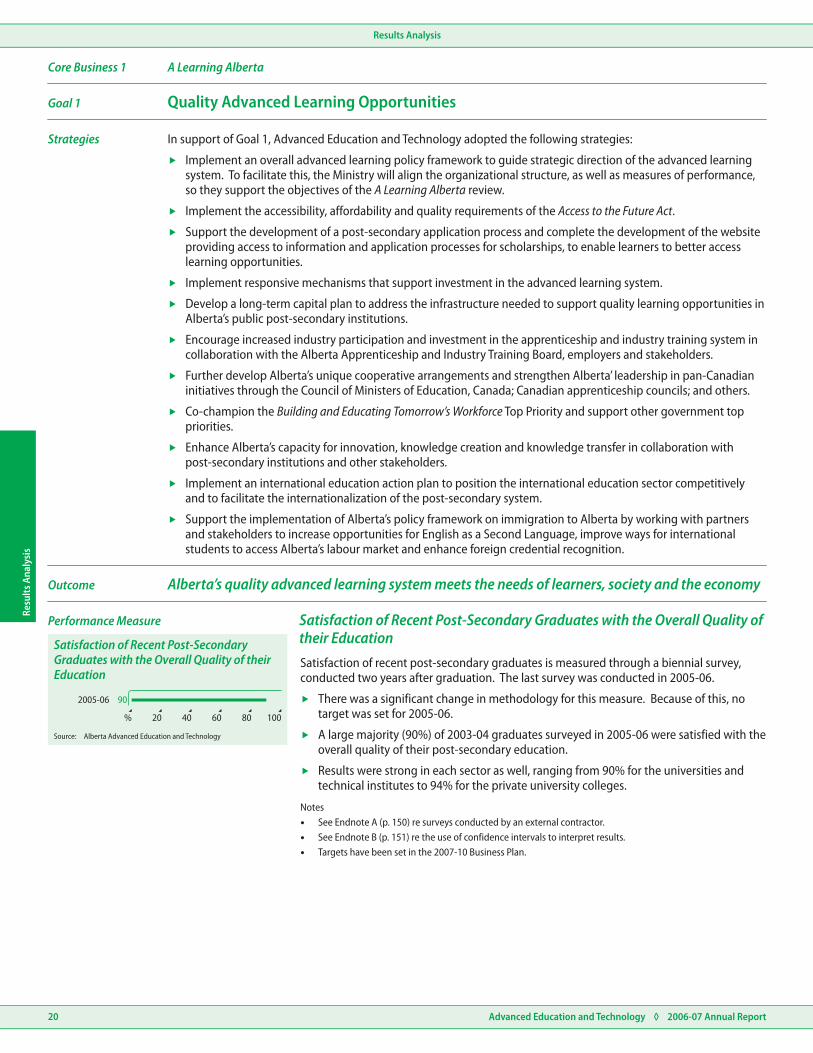
Performance Measure Satisfaction of Recent Post-Secondary Graduates with the Overall Quality oftheir EducationSatisfaction of recent post-secondary graduates is measured through a biennial survey, conducted two years after graduation. The last survey was conducted in 2005-06.
There was a significant change in methodology for this measure. Because of this, no target was set for 2005-06.
A large majority (90%) of 2003-04 graduates surveyed in 2005-06 were satisfied with the overall quality of their post-secondary education.
Results were strong in each sector as well, ranging from 90% for the universities and technical institutes to 94% for the private university colleges.
Notes�See Endnote A (p. 150) re surveys conducted by an external contractor.�See Endnote B (p. 151) re the use of confidence intervals to interpret results.�Targets have been set in the 2007-10 Business Plan.
�
�
�
Outcome Alberta’s quality advanced learning system meets the needs of learners, society and the economy

Satisfaction of Recent ApprenticeshipGraduates with On-the-Job Training
Satisfaction of Recent ApprenticeshipGraduates with Technical Training
Source: Alberta Advanced Education and Technology
Canada
59
58
57
56
55
Alberta
Target 58
58
58
56
56
57
2006
2005
2004
2003
2002
% 20 40 60 80 100
Educational Attainment of Albertansaged 25-64: Proportion having CompletedPost-Secondary Education
Source: Statistics Canada, Labour Force Survey, special tabulation forAlberta Advanced Education and Technology
Technical Training
95
94
93
95
95
94
On-the-Job Training
Target 93
93
91
93
92
91
2006-07
2004-05
2002-03
2000-01
1998-99
% 20 40 60 80 100
Aboriginal Albertans aged 25-64 who haveCompleted Post-Secondary Programs
Source: Statistics Canada, Labour Force Survey, special tabulation forAlberta Advanced Education and Technology
All Albertans
58
58
56
56
Aboriginal Albertans
43
44
43
45
2006
2005
2004
2003
% 20 40 60 80 100
Results AnalysisResults Analysis
Advanced Education and Technology ◊ 2006-07 Annual Report 21
Goal 1 Quality Advanced Learning Opportunities
Performance Measure Satisfaction of Recent Apprenticeship GraduatesSatisfaction of apprenticeship graduates is measured through a biennial survey. Apprenticeship graduates are surveyed approximately 8 to 20 months after graduation. The targets for both measures were met.
A very high percentage of recent apprenticeship graduates continue to be satisfied with the quality of their on-the-job (93%) and technical training (94%).
2006-07 satisfaction with on-the-job training experienced a statistically significant increase.
Notes�See Endnote A (p. 150) re surveys conducted by an external contractor.�See Endnote B (p. 151) re the use of confidence intervals to interpret survey results.�A target is considered met if the result is within 5% of the target.
�
�
Performance Measure Educational Attainment of Albertans aged 25-64The Ministry recognizes the positive social and economic benefits of post-secondary education. Post-secondary completion rates of Albertans aged 25-64 measures the highly qualified citizenry in Alberta.
In 2006, the post-secondary completion rate of Albertans aged 25-64 was 58%, meeting the target.
Alberta is on par with the Canadian average, however, the number of Canadians completing post-secondary education is increasing at a faster rate.
Albertans between the ages of 25-64 have the highest employment rate in Canada. Alberta’s strong economy, with ample employment opportunities, may affect post-secondary completion rates.
Notes�See Endnote C (p. 152) re Statistics Canada’s Labour Force Survey.�In previous annual reports this measure was reported for Albertans aged 25-34. The age range was expanded
to 25-64 in the 2005-08 Business Plan to better reflect the Ministry’s focus on lifelong learning.
�
�
�
Performance Measure Educational Attainment of Aboriginal Albertans aged 25-64This is a new measure included in the 2006-09 Business Plan. No targets have been set for this measure.
The post-secondary completion rate for Aboriginal Albertans aged 25-64 has remained relatively stable. The slight decrease is not statistically significant due to the high variation in the number of respondents.
The percentage of Aboriginal Albertans aged 25-64 who report post-secondary completion is considerably lower than for the population as a whole. The completion rate for all Albertans aged 25-64 was 58% in 2006.
The A Learning Alberta final report provided recommendations for policy actions to increase participation in learning opportunities by Aboriginal groups. In response, government has developed several initiatives supporting Aboriginal participation in post-secondary education.
Government and the Alberta Apprenticeship and Industry Training Board worked with employers, Aboriginal communities and Aboriginal youth to encourage participation in trades-related careers.
Notes�See Endnote C (p. 152) re Statistics Canada’s Labour Force Survey.
�Targets have been set in the 2007-10 Business Plan.
�
�
�
�

9,196
8,315
2005-06
2004-05
108642000s
International Visa Students Registered at Alberta Post-Secondary Institutions
Source: Alberta Advanced Education and Technology
Journeypersons
97
97
97
University Graduates
Certificate / Diploma Graduates
Target
9797
9695
2006-07
2005-06
2004-05
2003-04
% 20 40 60 80 100
Percentage of Advanced Education GraduatesEmployed: Post-Secondary Certificate or Diploma,University Degree and Apprenticeship Certificate
Source: Alberta Advanced Education and Technology
94
90
91
2005-06
2003-04
2001-02
% 20 40 60 80 100
Employer Satisfaction with the Skills andQuality of Work of Recent AdvancedEducation System Graduates
Source: Alberta Advanced Education and Technology
Public Satisfaction that Learners are WellPrepared for Citizenship
Source: Alberta Advanced Education and Technology
Target 72
66
69
70
66
69
2006-07
2005-06
2004-05
2003-04
2002-03
% 20 40 60 80 100
Resu
lts A
naly
sis
Results Analysis
Advanced Education and Technology ◊ 2006-07 Annual Report22
Performance Measure International Visa StudentsThis is a new measure in the 2007-10 Business Plan. No targets have been set.
The number of international learners in Alberta has increased. In 2005-06, 881 more international visa students attended publicly funded post-secondary institutions.
The growing number of international learners is an indicator of an increase in global recognition of Alberta’s quality advanced education system.
Notes�Targets have been set in the 2007-10 Business Plan.�See Endnote D (p. 152) re Learner Enrollment Reporting System.�See Endnote E (p. 152) re international visa students registered at post-secondary institutions.
�
�
Performance Measure Employment Rates of Advanced Education GraduatesEmployment rates of system graduates provide a measure of advanced learning system outcomes. These rates are measured through biennial surveys.
In 2006-07, the employment rate of journeypersons was 97%, meeting the target. The employment rates of university and certificate/diploma graduates were last measured in 2005-06; both had employment rates of 97%.
High employment rates of recent graduates are indicative of the high quality graduates exiting the system. The results can also be attributed to the high demand for qualified workers, as Alberta faces shortages in many key industries.
Notes�The next university, certificate and diploma graduate survey will be conducted in 2007-08; the next
apprenticeship graduate survey will be conducted in 2008-09.�See Endnote A (p. 150) re surveys conducted by an external contractor.�See Endnote B (p. 151) re the use of confidence intervals to interpret results.
�
�
Outcome Albertans are well prepared for employment and citizenship
Goal 1 Quality Advanced Learning Opportunities
Performance Measure Employer SatisfactionEmployers were asked about their level of satisfaction with post-secondary graduates.
Satisfaction levels have been consistently high, and the target was met. In 2005-06, 94% of employers were satisfied with the skills and quality of work of advanced education system graduates.
Notes�This measure has been revised in the 2006-09 Business Plan to only capture employer satisfaction of advanced
learning system graduates; high school graduates are not included.�The survey is biennial; the next survey will be conducted in 2007-08.�See Endnote A (p. 150) re surveys conducted by an external contractor.�See Endnote B (p. 151) re the use of confidence intervals to interpret results over time.
�
Public Satisfaction that Learners are WellPrepared for Citizenship
Source: Alberta Advanced Education and Technology
Target 72
66
69
70
66
69
2006-07
2005-06
2004-05
2003-04
2002-03
% 20 40 60 80 100
Performance Measure Preparation for Citizenship�
�
In 2006-07 the majority of Albertans (66%) were satisfied that adult learners are well prepared for citizenship.
Public satisfaction has remained relatively stable, experiencing a slight decrease in 2003-04 and 2006-07.
Notes�66% of respondents were satisfied that adults taking education or training are being well prepared for
citizenship, 9% indicated they were dissatisfied, and 25% answered don’t know/not applicable or did not answer the question.
�See Endnote A (p. 150) re surveys conducted by an external contractor.�See Endnote B (p. 151) re the use of confidence intervals to interpret results.

Results AnalysisResults Analysis
Advanced Education and Technology ◊ 2006-07 Annual Report 23
Satisfaction of recent post-secondary graduates withthe overall quality of their education
Outcomes / Performance Measures
Satisfaction of recentapprenticeship graduates with
On-the-job training
Technical training
Educational attainment of Albertans aged 25-64 -post-secondary completion
Aboriginal Albertans aged 25-64 who have completedpost-secondary education
International visa students registered at Albertapost-secondary institutions
92% 2000-01 93% 2002-03 93% 2006-0791% 2004-05 93%
95% 2000-01 95% 2002-03 94% 2006-0793% 2004-05 95%
56% 2003
45% 2003
56% 2004
43% 2004
58% 2006
43% 2006
9,196 2005-06
58% 2005
44% 2005
8,315 2004-05
58%
Previous Years’ Results
90%— —
—
—
—
—
—
—
— — —
—
— —
— —
— —
2005-06
Current Results 2006-07 Targets
Percentage ofadvanced educationgraduates employed
Post-secondary certificate ordiploma graduates
University graduates
Journeypersons
Employer satisfaction with the skills and quality of workof recent advanced education system graduates
Public satisfaction that learners are well prepared forcitizenship
95% 97%2003-04 2005-06
97% 2005-0696% 2003-04
97% 2006-0797% 2004-05 97%
66% 2003-04
91% 2001-02
70% 2004-05
94% 2005-06
66% 2006-07
90% 2003-04
69% 2005-06 72%
Goal 1 Quality Advanced Learning Opportunities
Results at a Glance
Albertans are well prepared for employment and citizenship
Alberta’s quality advanced learning system meets the needs of learners, society and the economy
Discussion of Results Goal 1 focused on increasing access to quality advanced learning opportunities for all Albertans. Government strongly supported this goal and advanced education remained a high priority during this reporting year. This commitment was evident in the 31% increase in expenses in 2006-07, including increases in funding for spaces and capital infrastructure, and strategic investments such as the $42.5 million invested through the Access to the Future Fund to improve access and quality in the advanced learning system.
New investments made during 2006-07 allowed post-secondary institutions to provide new spaces in college, technical institute, university and apprenticeship programs. New degree programs were approved at Alberta’s public colleges, university colleges and universities and new private institutions were licensed to further increase access and capacity in the system. Community Adult Learning Councils offered nearly 5,000 learning opportunities, resulting in approximately 65,000 registrations in courses such as adult basic literacy and English as a second language.
With respect to quality of advanced learning opportunities, the results achieved were strong with 90% of recent post-secondary institution graduates being satisfied with their post-secondary education, and more than 90% of apprenticeship graduates being satisfied with their technical training or on-the-job training. 97% of graduates were employed shortly after graduation. Post-secondary institutions and the Alberta Apprenticeship and Industry Training Board along with its committees are significant contributors to these strong results.
The quality of Alberta’s advanced learning system was also evident in employer satisfaction rates with 94% of employers indicating they were satisfied with the skills and quality of work of recent graduates.
To build on these strong results and on the strengths of the system, the A Learning Alberta final report identified long-range policy recommendations for Alberta’s advanced learning system. In response, the Ministry initiated the development of a roles and mandates framework for the publicly funded post-secondary system and launched Vibrant Learning Communities, a comprehensive review of community adult learning programs in Alberta.
Alberta’s strong economic growth was a significant external factor again in 2006-07, as it created a high demand for skilled graduates. Advanced Education and Technology played a role in responding to this challenge by funding additional training spaces. Industry also plays a key role in training apprentices.

12,300
12,800
10,500
2006
Target
2005
1512963000s
Increase in Participation of Albertans aged18-64 in Learning Opportunities(base year 2004)
Source: Statistics Canada, Labour Force Survey, special tabulation forAlberta Advanced Education and Technology
7,350
8,300
2,592
Target
2006-07
2005-06
108642000s
Increase in Full-Load Equivalent StudentSpaces
Source: Alberta Advanced Education and Technology
Resu
lts A
naly
sis
Results Analysis
Advanced Education and Technology ◊ 2006-07 Annual Report24
Core Business 1 A Learning Alberta
Goal 2 Adult Learners Participate in Advanced Education
In support of Goal 2, Advanced Education and Technology adopted the following strategies:
Conduct a study to analyze the impact of the affordability of advanced education and access to advanced learning opportunities.
Develop strategies to increase participation in learning opportunities by Aboriginal, immigrant, and other underrepresented groups.
Review affordability and improve the design and delivery of student financial assistance to continue to ensure that financial need is not a barrier to participation in advanced learning opportunities.
Enhance the knowledge and awareness of parents and learners about planning and saving for post-secondary studies.
Improve learning access for Albertans by enhancing transitions into and within the advanced learning system.
Provide opportunities in local communities for adults including Aboriginal, immigrant, youth, and other underrepresented groups to return to learning to meet their personal learning and employment goals.
Develop innovative approaches to improve participation and achievement in apprenticeship and industry training, in response to industry needs.
�
�
�
�
�
�
�
Strategies
Performance Measure Increased Participation in Learning OpportunitiesThe increase in participation by Albertans in learning opportunities is a reflection of the system’s ability to attract new learners.
In 2006, 12,300 more Albertans reported participating in learning opportunities, compared to the base year (2004). The target was met, since the result is within 5% of the target.
Learning opportunities encompassed by this measure include attendance at a college, university or technical institutes, as well as private vocational schools and community based learning.
Notes�See Endnote C (p. 152) re information on Statistics Canada’s Labour Force Survey.
�
�
Performance Measure Increase in Full-Load Equivalent Student SpacesThe increase in full-load equivalent spaces is a measure of increased capacity of the advanced learning system.
In 2006-07, 8,300 more learning spaces were funded compared to the number of spaces funded in the base year. The target was met.
The Ministry increased the number of apprenticeship full-load equivalent seats by 2,405 and certificate, diploma and degree programs were increased by 5,895 full-load equivalent spaces in 2006-07.
Notes�A full-load equivalent space represents one learner taking a full-load for a standard year of study. Since
students can attend training for varying lengths of time depending on program choice, the full load equivalent measure of spaces allows for comparisons across program types.
�The 2005-06 increase in full-load equivalent student spaces has been restated from the number reported in the 2006-09 Business Plan.
�See Endnote F (p. 152) re increase in full-load equivalent student spaces.
�
�
Outcome Adult Albertans participate in learning

Canada
23
23
23
22
22
Alberta
Target 21
18
19
19
19
20
2006
2005
2004
2003
2002
% 20 40 60 80 100
Participation in Post-Secondary Education,Albertans aged 18-34
Source: Alberta Advanced Education and Technology
Public Satisfaction that Adult Albertans areAble to Access the Education or Trainingthey Want
Source: Alberta Advanced Education and Technology
Target 72
79
79
69
72
73
2006-07
2005-06
2004-05
2003-04
2002-03
% 20 40 60 80 100
Target 15,000
15,879
13,886
12,570
11,881
2006
2005
2004
2003
000s 4 8 12 16 20
New Apprentices Registered (5-Year Average)
Source: Alberta Advanced Education and Technology
Results Analysis
Advanced Education and Technology ◊ 2006-07 Annual Report 25
Results Analysis
Goal 2 Adult Learners Participate in Advanced Education
Performance Measure Participation in Post-Secondary Education�
�
�
�
18% of 18-34 year olds in Alberta were participating in post-secondary education in 2006.
Canadians aged 18-34 are increasing their participation in post-secondary education whereas the participation of 18-34 year olds in Alberta has declined since 2002. Enticing labour market opportunities in Alberta may be causing learners to delay participation in the advanced learning system.
In previous years, this measure targeted 18-24 year olds, however, with the diversification of learners, the 18-34 year olds age grouping better captures Albertans who are participating in post-secondary education.
Several raising-awareness initiatives are in place to inform primary and secondary students of post-secondary learning opportunities.
Notes�See Endnote C (p. 152) re Statistics Canada’s Labour Force Survey.
Performance Measure Access to Education or TrainingPublic satisfaction that adult Albertans are able to access the education or training they want is a measure of the accessibility and availability of advanced learning opportunities.
In 2006-07, 79% of the public were satisfied that adult Albertans are able to access the education or training they want. The target was met.
The increased public satisfaction with access to education and training can be explained in part by the release of the Affordability Framework, including a new tuition fee policy, accompanied by strategies to increase participation of underrepresented groups. There is continued effort and strategies in place to increase participation in the trades.
Notes�See Endnote A (p. 150) re surveys conducted by an external contractor.
�
�
Performance Measure New Apprentices RegisteredNew apprentices registered is a key indicator of the success in attracting new entrants into the trades.
Due to the strong demand for skilled journeypersons, employers have been signing up record numbers of apprentices for training in recent years.
In 2006, the five-year average of apprentice registrations grew to 15,879, surpassing the target.
Notes�Five-year averages are used for this measure to smooth out swings resulting from changes in the level of
economics activity.�See Endnote G (p. 153) re new apprentices registered.
�
�

6,320
5,455
2005-06
2004-05
108642000s
Aboriginal Albertans Participating at AlbertaPost-Secondary Institutions
Source: Alberta Advanced Education and Technology
912005-06
% 20 40 60 80 100
Source:
Post-Secondary Graduates with PriorLearning who Reported that they hadReceived the Transfer Credit they Expected
Alberta Advanced Education and Technology
Public Agreement that Programs, Classesor Courses are Offered in Locations(including online) that are Easily Accessible
Source: Alberta Advanced Education and Technology
77
77
75
78
2006-07
2005-06
2004-05
2003-04
% 20 40 60 80 100
Results AnalysisRe
sults
Ana
lysi
s
Advanced Education and Technology ◊ 2006-07 Annual Report26
Goal 2 Adult Learners Participate in Advanced Education
Performance Measure Participation of Aboriginal Albertans in Post-Secondary EducationAboriginal Albertans participating at publicly funded post-secondary institutions is a new measure being foreshadowed in the 2007-10 Business Plan. Targets will be set in the 2008-11 Business Plan, once three years worth of data are available.
This measure is an indicator of the province’s ability to attract Aboriginal learners into the post-secondary system.
Notes�The number of Aboriginal Albertans participating in publicly funded post-secondary education has been
restated from the number reported in the 2007-10 Business Plan (6,386 in 2004-05), to show only Aboriginal learners from Alberta.
�Aboriginal status is self-reported by individuals and therefore the data may under represent the true number of Aboriginal learners in the post-secondary system.
�See Endnote I (p. 153) re post-secondary participation of Aboriginal Albertans.
�
Performance Measure Transfer CreditThe percentage of post-secondary graduates with prior learning who reported that they had received the transfer credit they expected is a new measure in the 2007-10 Business Plan. No targets have been set.
This measure is an indicator of the flexibility of the system to accommodate learner needs.
Notes�Targets have been set in the 2007-10 Business Plan.�Biennial survey, next conducted in 2007-08.�See Endnote A (p. 150) re surveys conducted by an external contractor.�See Endnote J (p. 153) re graduates with prior learning who received the transfer credit they expected.
�
Performance Measure Accessibility of Advanced Learning System Programs, Classes and CoursesPublic agreement that programs, classes or courses are offered in locations (including online) that are easily accessible is a new measure in the 2007-10 Business Plan. No target was set.
The Ministry supports and implements initiatives directed to increasing accessibility through the number of available seats, by providing learning opportunities in many communities and by promoting distance learning.
Notes�Targets have been set in the 2007-10 Business Plan.�See Endnote A (p. 150) re surveys conducted by an external contractor.�See Endnote L (p. 154) re public agreement that post-secondary education is accessible.
�

1,262
1,100
1,137
2006
Target
2005
1,5001,200900600300#
Participation of Aboriginal Albertans inApprenticeship
Source: Alberta Advanced Education and Technology
Public Agreement that the Learning Systemis within the Means of Most Albertans
Source: Alberta Advanced Education and Technology
Target 50
51
48
46
50
52
2006-07
2005-06
2004-05
2003-04
2002-03
% 20 40 60 80 100
832005-06
% 20 40 60 80 100
Proportion of Graduates who Agree that the Program they Graduated from was Worth theFinancial Cost
Source: Alberta Advanced Education and Technology
Results AnalysisResults Analysis
Advanced Education and Technology ◊ 2006-07 Annual Report 27
Goal 2 Adult Learners Participate in Advanced Education
Performance Measure Participation of Aboriginal Albertans in ApprenticeshipAboriginal Albertans are important to Alberta’s economy, adding to the supply of skilled and knowledgeable workers.
In 2006, the number of Aboriginal Albertans participating in apprenticeship was 1,262. The target was met.
The increase in Aboriginal apprentices is a reflection of the system’s ability to attract learners, and the high demand for skilled workers as a result of Alberta’s strong economy.
Government and Apprenticeship and Industry Training have been working with Aboriginal communities, institutions, industry and the secondary school system to support and encourage increased participation of Aboriginal persons in the trades.
Notes�Totals include Aboriginal apprentices registered in Alberta’s apprenticeship and industry training system but
who reside in other Canadian jurisdictions. These individuals participate in technical training in Alberta but are issued certificates in their home jurisdiction. In 2006 there were 3 Aboriginal apprentices registered who were planning to take their examinations outside Alberta; in 2005 there were none.
�Aboriginal status is based on self-disclosure and may under represent the actual number of Aboriginal persons participating in the program.
�See Endnote H (p. 153) re participation of Aboriginals in apprenticeship.
�
�
�
Performance Measure Affordability of the Learning System�
�
In 2006-07, half of Albertans surveyed agreed that the learning system is within the means of most Albertans. The target was met.
Satisfaction with the affordability of the education system is increasing. This may be due to the Affordability Framework and the new tuition fee policy which was implemented to reduce the financial barriers affecting participation.
Notes�See Endnote A (p. 150) re surveys conducted by an external contractor.
Outcome Alberta’s advanced learning system is affordable to learners
Performance Measure Affordability of the Advanced Learning SystemThe percentage of graduates who agree that the program they graduated from was worth the financial cost is a new measure in the 2007-10 Business Plan. No target was set.
Graduates’ agreement that their program was worth the financial cost is an indicator of the graduates’ satisfaction with the affordability and quality of the post-secondary education system.
Notes�Targets have been established in the 2007-10 Business Plan.�Biennial survey, next conducted in 2007-08.�See Endnote A (p. 150) re surveys conducted by an external contractor.�See Endnote K (p. 154) re graduates’ agreement that their program was worth the financial cost.
�
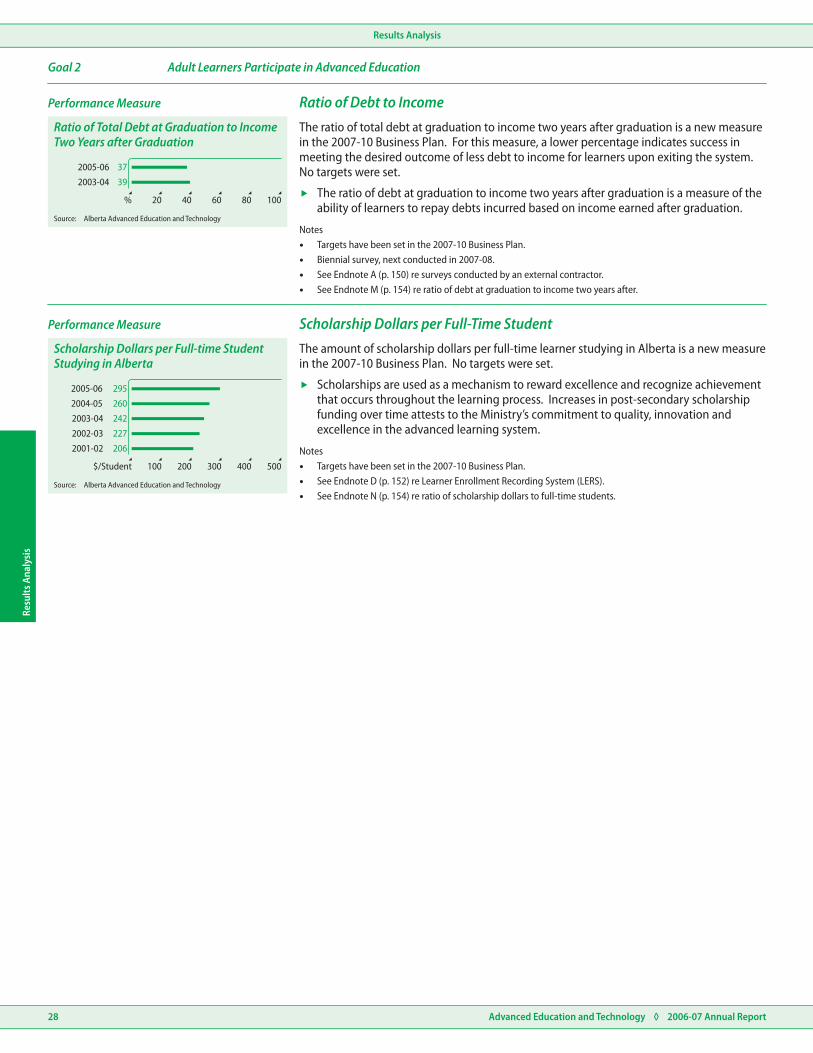
37
39
2005-06
2003-04
% 20 40 60 80 100
Ratio of Total Debt at Graduation to IncomeTwo Years after Graduation
Source: Alberta Advanced Education and Technology
2004-05
2005-06
260
295
242
227
206
2003-04
2002-03
2001-02
$/Student 100 200 300 400 500
Scholarship Dollars per Full-time StudentStudying in Alberta
Source: Alberta Advanced Education and Technology
Results AnalysisRe
sults
Ana
lysi
s
Advanced Education and Technology ◊ 2006-07 Annual Report28
Goal 2 Adult Learners Participate in Advanced Education
Performance Measure Ratio of Debt to IncomeThe ratio of total debt at graduation to income two years after graduation is a new measure in the 2007-10 Business Plan. For this measure, a lower percentage indicates success in meeting the desired outcome of less debt to income for learners upon exiting the system. No targets were set.
The ratio of debt at graduation to income two years after graduation is a measure of the ability of learners to repay debts incurred based on income earned after graduation.
Notes�Targets have been set in the 2007-10 Business Plan.�Biennial survey, next conducted in 2007-08.�See Endnote A (p. 150) re surveys conducted by an external contractor.�See Endnote M (p. 154) re ratio of debt at graduation to income two years after.
�
Performance Measure Scholarship Dollars per Full-Time StudentThe amount of scholarship dollars per full-time learner studying in Alberta is a new measure in the 2007-10 Business Plan. No targets were set.
Scholarships are used as a mechanism to reward excellence and recognize achievement that occurs throughout the learning process. Increases in post-secondary scholarship funding over time attests to the Ministry’s commitment to quality, innovation and excellence in the advanced learning system.
Notes�Targets have been set in the 2007-10 Business Plan.�See Endnote D (p. 152) re Learner Enrollment Recording System (LERS).�See Endnote N (p. 154) re ratio of scholarship dollars to full-time students.
�

Results AnalysisResults Analysis
Advanced Education and Technology ◊ 2006-07 Annual Report 29
Increase in participation by Albertans aged 18-64 inlearning opportunities (base year 2004)
Increase in full-load equivalent student spaces
Participation rate in post-secondary education -Albertans aged 18-34
Public satisfaction that adult Albertans can accesseducation or training
New apprentices registered (five-year average)
Aboriginal Albertans participating at post-secondaryinstitutions
Percentage of post-secondary graduates with priorlearning who reported that they had received thetransfer credit they expected
Public agreement that programs, classes and courses are offered in locations (including online) that areeasily accessible
19% 2003 19% 2004 18%
8,300
2006
2006-07
19%
2,592
2005
2005-06
21%
7,350
12,800
72% 2003-04 69%
75%78%
50%
2004-05
2004-052003-04
2003-04
79%
77%
91%
2006-07
2006-07
2005-06
79%
77%
2005-06
2005-06
72%
11,881 2003 12,570 2004 15,879 2006
6,320 2005-06
13,886 2005
5,455 2004-05
10,500 —
—
— —
—
—
— — —
— —
—
—
—
—
—
—
—
—
—
—
—
2005
15,000
12,300 2006
Participation of Aboriginal Albertans in apprenticeship
Public agreement that the learning system is withinthe means of most Albertans
Proportion of graduates who agree that the programthey graduated from was worth the financial cost
Ratio of total debt at graduation to income two yearsafter graduation
Scholarship dollars per full-time student studying inAlberta
1,137 2005
48%
242
2005-06
2003-04
46%
227
2004-05
2002-03
83%
51%
295260
1,262
2005-06
2006-07
2005-062004-05
2006
50%
1,100
37% 2005-0639% 2003-04
Outcomes / Performance Measures Previous Years’ Results Current Results 2006-07 Targets
Goal 2 Adult Learners Participate in Advanced Education
Alberta’s advanced learning system is affordable to learners
Adult Albertans participate in learning
Discussion of Results Goal 2 focused on increasing participation in the advanced learning system. A key aspect of enhancing participation is maintaining an affordable advanced learning system. During the reporting year the Ministry implemented components of the Affordability Framework which aims to remove financial barriers and ensure students are appropriately supported throughout the learning process. This included the establishment of a new tuition fee policy and implementation of changes to student financial assistance programs.
Satisfaction with the affordability of the learning system is increasing, with half of Albertans agreeing that the learning system is within the means of most Albertans. This positive result may be attributed to the Affordability Framework and the Ministry’s commitment towards ensuring an affordable advanced learning system. In keeping with this, the Ministry provided a record number of scholarships to more than 30,000 Alberta students totaling almost $50 million.
Public satisfaction that adult Albertans are able to access the education or training they want remained high in 2006-07 at 79% since its significant increase from 69% in 2004-05.
Because of the strong economy and enticing labour market opportunities, increasing participation in post-secondary education continues to be a significant challenge. In response, the Ministry developed several initiatives to inform Albertans about advanced learning opportunities and the return on investment associated with post-secondary completion.
Results at a Glance

Results AnalysisRe
sults
Ana
lysi
s
Advanced Education and Technology ◊ 2006-07 Annual Report30
Core Business 2 Innovation
Expenses In 2006-07, the Ministry provided $194 million in support of the Innovation core business, in the following areas:
$9.9 million was provided to fund 37 technology commercialization projects.
$7.6 million was provided to fund 11 projects under the Innovation and Service Excellence program.
$71 million in expenses by Alberta Research Council Inc., including $44.4 million for contract research and development services funded by the private sector and other external customers.
$26 million was provided through research capacity programming to support science and research initiatives of strategic importance to Alberta including:
$6.9 million for the Alberta Institute for Viral Immunology.
$4.1 million for the creation of Alberta Transplant Applied Genomics Canada.
$2.5 million to the Alberta Centre for Advanced Micro and Nanotechnology Products to establish an innovation centre for the commercialization of Micro Nanotechnology products.
$2.8 million was provided to the Science Alberta Foundation to enhance science literacy awareness programs.
$14.5 million was provided to support a project to gasify municipal solid waste. By doing this, the landfill size will be reduced, resulting in a reduction of emissions from the landfill, and the waste will be turned into electricity.
$9.2 million was provided for clean coal projects centered on the key platform technology of gasification and CO2 capture and storage.
$9.5 million was provided by iCORE for research grants such as chair and professor establishment grants, industrial chair establishment grants, visiting professor grants, recruitment grants, graduate and student scholarships, and outreach activities including lecture series, workshops and conferences.
$2.25 million was provided to TRLabs. TRLabs connects the knowledge and technologies at universities with the innovative needs of industry and trains students to enhance ICT expertise and improve Canada’s global competitiveness.
$1.25 million to establish Alberta Cyberinfrastructure for Innovation, an organization that will lead provincial efforts in cyberinfrastructure (CI). CI involves the coordinated and integrated use of “shared” high performance computers, advanced high speed data networks, visualization tools, data storage facilities, computer software, remote sensors and advanced collaboration facilities shared by numerous users in many locations.
$5 million was directed to research to advance the goals of the Water for Life Strategy: safe drinking water, efficient water use and healthy aquatic ecosystems.
$4.3 million for research and development related to the mountain pine beetle infestations.
$3 million to fund the Mental Health research chairs to attract international experts and expand mental health research in the province.
$3 million to support the triticale biorefining initiative that will create an industrial crop for Alberta and western Canada suited for bioenergy, fibres and materials as well as engineering for biopolymers and plastics.
Implement Innovation
�
�
�
Build Research Capacity in Areas of Strategic Priority
�
�
�
�
�
Accelerate Innovation in the Energy Sector
�
�
Accelerate Innovation in the Information and Communications Technology Sector
�
�
�
Accelerate Innovation in the Life Sciences Sector
�
�
�
�
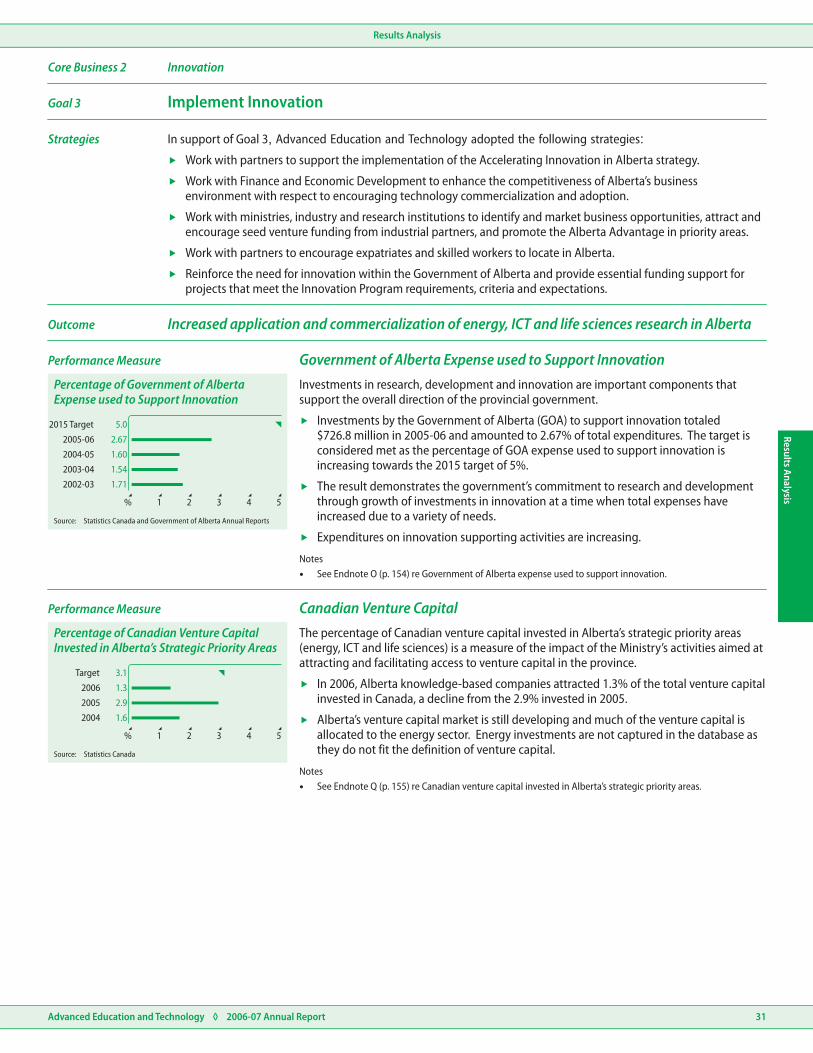
2015 Target 5.0
2.67
1.60
1.54
1.71
2005-06
2004-05
2003-04
2002-03
% 1 2 3 4 5
Percentage of Government of AlbertaExpense used to Support Innovation
Source: Statistics Canada and Government of Alberta Annual Reports
Target 3.1
1.3
2.9
1.6
2006
2005
2004
% 1 2 3 4 5
Percentage of Canadian Venture CapitalInvested in Alberta’s Strategic Priority Areas
Source: Statistics Canada
Results Analysis
Advanced Education and Technology ◊ 2006-07 Annual Report 31
Results Analysis
Core Business 2 Innovation
Goal 3 Implement Innovation
In support of Goal 3, Advanced Education and Technology adopted the following strategies:
Work with partners to support the implementation of the Accelerating Innovation in Alberta strategy.
Work with Finance and Economic Development to enhance the competitiveness of Alberta’s business environment with respect to encouraging technology commercialization and adoption.
Work with ministries, industry and research institutions to identify and market business opportunities, attract and encourage seed venture funding from industrial partners, and promote the Alberta Advantage in priority areas.
Work with partners to encourage expatriates and skilled workers to locate in Alberta.
Reinforce the need for innovation within the Government of Alberta and provide essential funding support for projects that meet the Innovation Program requirements, criteria and expectations.
�
�
�
�
�
Strategies
Performance Measure Government of Alberta Expense used to Support InnovationInvestments in research, development and innovation are important components that support the overall direction of the provincial government.
Investments by the Government of Alberta (GOA) to support innovation totaled $726.8 million in 2005-06 and amounted to 2.67% of total expenditures. The target is considered met as the percentage of GOA expense used to support innovation is increasing towards the 2015 target of 5%.
The result demonstrates the government’s commitment to research and development through growth of investments in innovation at a time when total expenses have increased due to a variety of needs.
Expenditures on innovation supporting activities are increasing.
Notes�See Endnote O (p. 154) re Government of Alberta expense used to support innovation.
�
�
�
Performance Measure Canadian Venture CapitalThe percentage of Canadian venture capital invested in Alberta’s strategic priority areas (energy, ICT and life sciences) is a measure of the impact of the Ministry’s activities aimed at attracting and facilitating access to venture capital in the province.
In 2006, Alberta knowledge-based companies attracted 1.3% of the total venture capital invested in Canada, a decline from the 2.9% invested in 2005.
Alberta’s venture capital market is still developing and much of the venture capital is allocated to the energy sector. Energy investments are not captured in the database as they do not fit the definition of venture capital.
Notes�See Endnote Q (p. 155) re Canadian venture capital invested in Alberta’s strategic priority areas.
�
�
Outcome Increased application and commercialization of energy, ICT and life sciences research in Alberta

Target 6.4
6.8
6.9
6.3
2006
2005
2004
% 2 4 6 8 10
Albertans Employed in Knowledge-Intensive(High-Tech) Companies as a Percentage ofAlbertans Employed in all Companies
Source: Alberta Advanced Education and Technology
Target 818
903
789
822
697
2004
2003
2002
2001
$ million 200 400 600 800 1,000
Alberta Business Expenditures on Researchand Development
Source: Statistics Canada
Resu
lts A
naly
sis
Results Analysis
Advanced Education and Technology ◊ 2006-07 Annual Report32
Goal 3 Implement Innovation
Performance Measure Alberta Business Expenditures on Research and DevelopmentBusiness expenditure on research and development is a measure of the Ministry’s progress toward creating an environment where great ideas are more likely to be developed and brought to market. The Ministry’s emphasis is focused on supporting applied research and development, strengthening the technology commercialization system, and encouraging business growth in energy, ICT and life sciences in Alberta.
In 2004, Alberta businesses invested $903 million in research and development, exceeding the target of $818 million.
Notes�Provincial level data is reported for two years previous. 2004 data was released in September 2006.�2001, 2002 and 2003 data has been restated in Statistics Canada’s 2006 publication.�See Endnote R (p. 155) re business expenditure on research and development.
�
Outcome Increased implementation of innovative initatives to enhance Government of Alberta servicedelivery and to facilitate the application of new knowledge in Alberta
Performance Measure Proportion of Albertans Employed in Knowledge-Intensive CompaniesAlbertans employed in knowledge-intensive (high-tech) companies compared to Albertans employed in all companies is an indicator of the size of the knowledge-based sector.
In 2006, 6.8% of Albertans were employed in knowledge-intensive (high-tech) companies, exceeding the target.
An increase in employees in knowledge-based companies reflects an overall growth in Alberta’s knowledge-intensive sector.
Notes�Endnote P (p. 155) re Albertans employed in knowledge-intensive companies.
�
�
Target 117,000
127,800
122,900
111,100
2006
2005
2004
000s 50 100 150 200 250
Number of Albertans Employed in Knowledge-Intensive (High-Tech) Companies
Source: Alberta Advanced Education and Technology
Performance Measure Albertans Employed in Knowledge-Intensive CompaniesAn increase in Albertans employed in knowledge-intensive (high-tech) companies is an indicator of a growing knowledge-based economy.
In 2006, Alberta’s high-technology companies employed 127,800 people, surpassing the target.
A significant factor driving the increase in knowledge-based sectors has been the high demand for services to support the energy sector.
Notes�See Endnote P (p. 155) re Albertans employed in knowledge-intensive companies.
�
�
Outcome Growth in Alberta’s ICT and life sciences sectors

Results AnalysisResults Analysis
Advanced Education and Technology ◊ 2006-07 Annual Report 33
Percentage of Government of Alberta expense used tosupport innovation
Number of Albertans employed in knowledge-intensive(high-tech) companies
Alberta business expenditures on research anddevelopment ($ million)
Percentage of Canadian venture capital invested insrategic priority areas
Albertans employed in knowledge-intensive (high-tech)companies as a percentage of Albertans employed inall companies
1.3%
6.8%
903
2006
2006
2004
2.9%
6.9%
2005
2005
3.1%
6.4%
818
117,000
Increasing up to 5% as affordable,
by 2015
1.54%1.71%
111,100
697
1.6%—
—
— 6.3%
2003-042002-03
2004
2001
2004
2004
2.67%
127,800
789
2005-06
2006
2003
1.60%
122,900
822
2004-05
2005
2002
Outcomes / Performance Measures Previous Years’ Results Current Results 2006-07 Targets
Goal 3 Implement Innovation
Discussion of Results Goal 3 focused on implementing innovation in Alberta. Investments in research result in innovative ideas, products and processes that, if commercialized successfully for the global marketplace, have the potential to yield significant economic and social benefits for the province.
Investments supporting innovation totaled $726.8 million in 2005-06, or 2.67% of Government of Alberta expenditures. This demonstrates the government’s commitment to creating an environment where great ideas are more likely to be developed and brought to market in Alberta, with a focus on supporting applied research and development, strengthening the technology commercialization system, and encouraging business growth in priority sectors.
In support of this, the Ministry announced a new funding competition for Alberta’s Innovation Program, resulting in the provision of $7.6 million for 11 innovative projects. Furthermore, a $16.6 million investment was announced under the joint federal-provincial Western Economic Partnership for innovation and economic development initiatives.
Alberta’s high technology sectors employed 6.8% of all Alberta employees, or 127,800 people in 2006-07. A significant factor driving the increase has been the demand for services to support the energy sector during this period of growth.
Alberta’s venture capital market is still developing. The percentage of venture capital invested in the strategic priority areas of energy, information and communications technology, and life sciences in Alberta experienced a decline in 2006. The dominance of the energy sector in Alberta continues to divert venture capital from reaching high-tech investments, which generally offer a longer investment horizon.
Alberta businesses expended $903 million to conduct research and development, $85 million more than targeted for 2006-07. This increase may indicate progress toward creating an environment where great ideas are more likely to be developed and brought to market in Alberta.
Increased application and commercialization of energy, ICT and life sciences in Alberta
Growth in Alberta’s ICT and life sciences sectors
Increased implementation of innovative initiatives to enhance Government of Alberta service delivery and to facilitate the application ofnew knowledge in Alberta
Results at a Glance

17,149
17,611
16,159
14,923
2004-05
2005-06
2003-04
2002-03
20161284000s
Graduate Students Studying in Alberta
Source: Alberta Advanced Education and Technology,Learner Enrolment Reporting System (LERS)
Target 750
631.6
650.5
583.7
434.2
2005-06
2004-05
2003-04
2002-03
$ million 200 400 600 800 1,000
Total Sponsored Research Revenue Attractedby Alberta Universities
Source: Advanced Education and Technology
Resu
lts A
naly
sis
Results Analysis
Advanced Education and Technology ◊ 2006-07 Annual Report34
Core Business 2 Innovation
Goal 4 Build Research Capacity in Areas of Strategic Priority
In support of Goal 4, Advanced Education and Technology adopted the following strategies:
Provide support to recruit and retain highly qualified and effective scientific personnel at Alberta public research institutions.
Strengthen Alberta’s scientific capacity to support areas of strategic importance through investing in Alberta’s publicly-funded research infrastructure. Examples include nanotechnology, genomics/proteomics, bioinformatics and wireless communications technologies.
Encourage greater investment in Alberta’s research and innovation priorities from industry and federal government sources.
Coordinate research and innovation-related investments, policies and programs by collaborating with other ministries and public institutions. For example, support Education in its studies of the needs relative to the skills required to support innovation.
Work with the Alberta Heritage Foundation for Medical Research and the Alberta Ingenuity Fund to align efforts with provincial priorities, with an increased focus on technology commercialization.
Promote science and technology awareness within Alberta, including encouraging youth to enter careers in science and technology. As a cornerstone, provide ongoing support to the Science Alberta Foundation for the work they accomplish with children, youth, teachers and communities to promote science awareness.
Promote Alberta’s strengths in science and technology both nationally and internationally.
�
�
�
�
�
�
�
Strategies
Performance Measure Sponsored Research Revenue Attracted by Alberta Universities�
�
Alberta universities’ sponsored research revenue has more than tripled in the last nine years, reflecting the introduction of new programs and the expansion of existing provincial and federal programs aimed at increasing the research capacity and capability of Alberta.
In 2005-06, the total sponsored research revenue attracted by universities was $631.6 million, a decrease from the previous year. This decrease in sponsored research funding in Alberta is mainly a result of the completion of university capital projects which had significant investments from the Government of Alberta.
Notes�See Endnote S (p. 155) re total sponsored research revenue attracted by Alberta Universities.
Performance Measure Graduate Students Studying in AlbertaThe number of graduate students studying in Alberta is a new measure in the 2007-10 Business Plan. No targets have been set.
Students participating in graduate level courses do innovative work and contribute greatly to the research capacity of the province.
The number of graduate students studying at Alberta’s publicly-funded institutions is increasing.
Notes�Targets have been set in the 2007-10 Business Plan.�The number of graduate students studying in Alberta in 2004-05 has been restated from the number reported
in the 2007-10 Business Plan.�See Endnote D (p. 152) re Learner Enrollment Reporting System (LERS).�See Endnote U (p. 156) re graduate students studying in Alberta.
�
�
Outcome A supportive environment that encourages innovation, collaboration and networks
Outcome A skilled workforce to support research and innovation
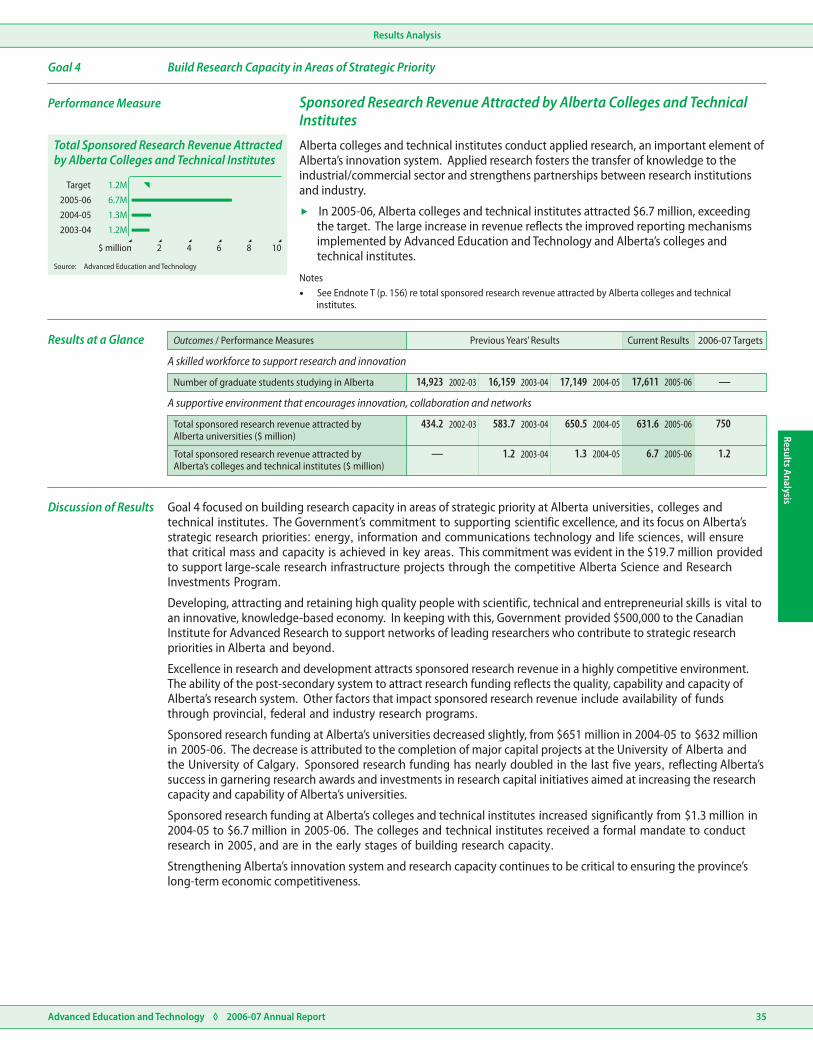
Total Sponsored Research Revenue Attractedby Alberta Colleges and Technical Institutes
Target 1.2M
1.3M
6.7M
1.2M
2004-05
2005-06
2003-04
$ million 2 4 6 8 10
Source: Advanced Education and Technology
Results AnalysisResults Analysis
Advanced Education and Technology ◊ 2006-07 Annual Report 35
Outcomes / Performance Measures Previous Years’ Results Current Results 2006-07 Targets
Number of graduate students studying in Alberta 17,611 —2005-0614,923 2002-03 17,149 2004-0516,159 2003-04
Total sponsored research revenue attracted byAlberta universities ($ million)
750583.7434.2 2003-042002-03 631.6 2005-06650.5 2004-05
Total sponsored research revenue attracted byAlberta’s colleges and technical institutes ($ million)
6.7 2005-061.3 2004-05 1.21.2— 2003-04
Performance Measure Sponsored Research Revenue Attracted by Alberta Colleges and TechnicalInstitutes
Alberta colleges and technical institutes conduct applied research, an important element of Alberta’s innovation system. Applied research fosters the transfer of knowledge to the industrial/commercial sector and strengthens partnerships between research institutions and industry.
In 2005-06, Alberta colleges and technical institutes attracted $6.7 million, exceeding the target. The large increase in revenue reflects the improved reporting mechanisms implemented by Advanced Education and Technology and Alberta’s colleges and technical institutes.
Notes�See Endnote T (p. 156) re total sponsored research revenue attracted by Alberta colleges and technical
institutes.
�
Goal 4 Build Research Capacity in Areas of Strategic Priority
Discussion of Results Goal 4 focused on building research capacity in areas of strategic priority at Alberta universities, colleges and technical institutes. The Government’s commitment to supporting scientific excellence, and its focus on Alberta’s strategic research priorities: energy, information and communications technology and life sciences, will ensure that critical mass and capacity is achieved in key areas. This commitment was evident in the $19.7 million provided to support large-scale research infrastructure projects through the competitive Alberta Science and Research Investments Program.
Developing, attracting and retaining high quality people with scientific, technical and entrepreneurial skills is vital to an innovative, knowledge-based economy. In keeping with this, Government provided $500,000 to the Canadian Institute for Advanced Research to support networks of leading researchers who contribute to strategic research priorities in Alberta and beyond.
Excellence in research and development attracts sponsored research revenue in a highly competitive environment. The ability of the post-secondary system to attract research funding reflects the quality, capability and capacity of Alberta’s research system. Other factors that impact sponsored research revenue include availability of funds through provincial, federal and industry research programs.
Sponsored research funding at Alberta’s universities decreased slightly, from $651 million in 2004-05 to $632 million in 2005-06. The decrease is attributed to the completion of major capital projects at the University of Alberta and the University of Calgary. Sponsored research funding has nearly doubled in the last five years, reflecting Alberta’s success in garnering research awards and investments in research capital initiatives aimed at increasing the research capacity and capability of Alberta’s universities.
Sponsored research funding at Alberta’s colleges and technical institutes increased significantly from $1.3 million in 2004-05 to $6.7 million in 2005-06. The colleges and technical institutes received a formal mandate to conduct research in 2005, and are in the early stages of building research capacity.
Strengthening Alberta’s innovation system and research capacity continues to be critical to ensuring the province’s long-term economic competitiveness.
A skilled workforce to support research and innovation
A supportive environment that encourages innovation, collaboration and networks
Results at a Glance

Target 2.50
1.91
1.71
2.82
2006-07
2005-06
2004-05
Ratio 1 2 3 4 5
Energy Research: Public Investments to Government of AlbertaInvestments
Ratio of Private and Other
Source: Alberta Advanced Education and Technology
Results AnalysisRe
sults
Ana
lysi
s
Advanced Education and Technology ◊ 2006-07 Annual Report36
Core Business 2 Innovation
Goal 5 Accelerate Innovation in the Energy Sector
In support of Goal 5, Advanced Education and Technology adopted the following strategies:
Provide applied research and development to support technology commercialization and adoption of technologies.
Lead crosscutting initiatives in competitive intelligence, technology transfer/commercialization and capacity building.
Enhance the capacity for energy innovation through strong university, provincial and federal research organization-based programs and high quality research teams that support the six strategic priority areas.
Ensure alignment with industry and other government ministries to promote technology advances in energy and to collaborate in the development and implementation of energy innovation programs with other providers within Canada, the United States and elsewhere.
Support the Innovative Energy Technology Program and field pilot projects that advance the deployment of new energy technologies.
Collaborate nationally with stakeholders using EnergyINet as a key vehicle to pursue energy research and innovation investments in six strategic priority areas, i.e. oil sands upgrading, clean carbon/coal, CO2 management, improved recovery, alternate and renewable energy, and water management.
Promote industry collaboration and maintain close working relationships with associations, such as the Petroleum Technology Alliance of Canada , the Canadian Clean Power Coalition, the Canadian Oil Sands Network for Research and Development, the Canadian Energy Research Institute, Canadian Association of Petroleum Producers and Climate Change Central.
�
�
�
�
�
�
�
Strategies
Performance Measure Leverage of Government of Alberta Investments in Energy ResearchThe ratio of private and other public investment to Government of Alberta (GOA) investments in energy research shows how government support is leveraged to attract more investors.
In 2006-07, for every dollar invested by the GOA, $1.91 was invested by other partners.
The increased ability to leverage government investments in 2006-07 is mainly due to updated information on investments for several projects. The amount of non-GOA funding substantially increased, which increased the ratio overall.
The Alberta Energy Research Institute, which has a number of projects within this measure, has established an objective of garnering support for projects from the federal government and industry.
Notes�See Endnote V (p. 156) re investments in priority research areas.
�
�
�
Outcome Increased collaboration among energy research performers and energy producers

Non-Government of Alberta Investment
63.4
53.8
29.450.0
Government of Alberta Investment
Target 21.5
32.0
12.5
14.9
2006-07
2005-06
2004-05
$Million 20 40 60 80 100
Investments in Energy Research: Governmentof Alberta and Non-Government of Alberta
Source: Alberta Advanced Education and Technology
Results AnalysisResults Analysis
Advanced Education and Technology ◊ 2006-07 Annual Report 37
Energy research: ratio of non-GOA investments to GOA investments 2.502.82 2004-05 1.91 2006-071.71 2005-06
50.0 63.429.4 53.82004-05 2006-072005-06
12.5 21.52005-0614.9 32.02004-05 2006-07
Outcomes / Performance Measures Previous Years’ Results Current Results 2006-07 Targets
Investments in energy research Non-GOA investment ($ million)
GOA investment ($ million)
Performance Measure Investments in Energy Research�
�
�
�
In 2006-07, Government of Alberta and non-Government of Alberta investments increased from the previous two years, and significantly surpassed their targets.
Government of Alberta investments in energy research totaled $32 million and non-Government of Alberta investments in energy research totaled $63.4 million in 2006-07.
The Alberta Energy Research Institute, which has a number of projects within this measure, has established an objective of garnering support from the federal government and industry.
A contributing factor to the increase in funding for energy research in 2006-07 was the establishment of the government’s Energy Innovation Fund. The Fund allowed additional projects to be instated through the Alberta Energy Research Institute, and included non-Government of Alberta contributors.
Notes�This measure has been dropped in the 2007-10 Business Plan due to difficulty in measuring investments made
by various partners over the lifespan of a project. New measures are being developed to measure an environment where research, development and innovation are fostered.
�See Endnote V (p. 156) re investments in priority research areas.
Outcome Increased joint investments in energy research by industry, the federal government and Alberta
Goal 5 Accelerate Innovation in the Energy Sector
Increased collaboration among energy research performers and energy producers
Increased joint investments in energy research by industry, the federal government and Alberta
Discussion of Results Goal 5 focused on accelerating innovation in the energy sector. Energy, directly or indirectly, accounts for a large part of the Alberta economy. The ratio of investments shows the relevance of energy related projects to, and the alignment of industry or other funding partners’ priorities with, Government of Alberta (GOA) strategic priorities. Research excellence is also a factor in attracting research funding from other sources.
Goal 5 results are influenced by economic factors that can impact the amount of industry investment in energy research. Changes in any federal research funding programs also impact the results, as do any changes in the provincial government’s budget for Advanced Education and Technology and other Alberta research agencies.
In 2006-07, the Government of Alberta attracted 1.91 dollars from other partners for every dollar invested by the GOA. The ratio is lower than the target of 2.50. This can be attributed to the fact that the Alberta Energy Research Institute (AERI) has established an objective of garnering support for projects from the federal government and industry. Some of the AERI investments are not readily attributable to specific projects. Energy-related projects lead through the University Research and Strategic Investments Branch focused on research equipment support primarily at post-secondary institutions, and while matching federal government investment is often available, industry investment is less prevalent.
Investments in energy research were above target in 2006-07 and garnered $32 million from the GOA sources and $63.4 million from non-GOA partners. Funding for energy research increased in 2006-07 through the establishment of the government’s Energy Innovation Fund which allowed additional projects to be initiated through the AERI, with other contributors involved.
Results at a Glance

Total Chairs and Professors
Total Graduate Student Scholarships
26
268
24.2
200
24
263
21
254
New Chairs and Professors
New Graduate Student Scholarships
Target
Target
3.2
80
3
77
3
105
4
100
2006-07
2006-07
2005-06
2005-06
2004-05
2004-05
#
#
10
100
20
200
30
300
40
400
50
500
iCORE Research Chairs, Industry Chairs andProfessors
iCORE Graduate Student Scholarships
Source:
Source:
Alberta Advanced Education and Technology
Alberta Advanced Education and Technology
Target 1.95
2.01
1.94
1.81
2006-07
2005-06
2004-05
Ratio 1 2 3 4 5
ICT Research: Ratio of Private and OtherPublic Investments to Government of AlbertaInvestments
Source: Alberta Advanced Education and Technology
Resu
lts A
naly
sis
Results Analysis
Advanced Education and Technology ◊ 2006-07 Annual Report38
Core Business 2 Innovation
Goal 6 Accelerate Innovation in the Information and Communications Technology Sector
In support of Goal 6, Advanced Education and Technology adopted the following strategies:
Update the ICT Strategy for Alberta.
Lead and guide ICT research and innovation to grow the ICT industry.
Build clusters of internationally recognized research teams in areas of ICT in which Alberta companies are able to be global leaders. These areas include networks and wireless communications, artificial intelligence and machine learning, computational and integrative science (e.g. systems biology), new computational models such as nanodevices, and quantum computing.
Work with industry to encourage and increase their support of ICT research at Alberta universities.
Collaborate with government partners such as Alberta Ingenuity and the universities to increase the number of Alberta advanced graduates from ICT related fields of study.
Increase and nurture collaboration between public research institutions, industry, the investment community and academia in Alberta and other jurisdictions.
�
�
�
�
�
�
Strategies
iCORE AwardsiCORE’s primary function is to attract, retain, educate and support exceptional ICT researchers and students. Increasing the number of world-class researchers is important to fostering excellence in ICT research and technology development.
Three of the four targets were met in 2006-07, resulting in an increase in Alberta’s ICT research capability.
In 2006-07, three new research chairs, industry chairs and/or professors were sponsored by iCORE. Recruitment of the fourth research chair was underway in 2006-07; the process of recruiting the right candidate for a position requires a negotiation process which cannot always be aligned within the fiscal year.
The 77 new graduate scholarships awarded in 2006-07 did not meet the target of 80. The number of active graduate student scholarships at 268 surpassed the target of 200 due to increased funding for student scholarships.
Notes�See Endnote W (p. 156) re iCORE awards.
�
�
�
Outcome A skilled workforce to support ICT research and innovation and other sectors of the Alberta economy
Performance Measure Leverage of Government of Alberta Investment in ICT ResearchInvestment in Information and Communications Technology (ICT) research is key to advancing many areas of research and development.
In 2006-07, collaborating partners invested $2.01 in ICT research for every dollar invested by the Government of Alberta. The target was met.
The amount of investments leveraged has increased since 2004-05. This is attributed to several factors including a more rigorous review of investments by all parties, the beginning of some high leverage projects, and some new strategic investments.
Notes�See Endnote V (p. 156) re investments in priority research areas.
�
�
An environment that supports and encourages innovation in ICT research, through collaborativeresearch, development and technology commercialization
Outcome

Non-Government of Alberta Investment
57.0
40.7
60.252.8
Government of Alberta Investment
Target 20.9
20.5
23.6
23.7
2006-07
2005-06
2004-05
$Million 20 40 60 80 100
Investments in ICT Research: Government ofAlberta and Non-Government of Alberta
Source: Alberta Advanced Education and Technology
Results AnalysisResults Analysis
Advanced Education and Technology ◊ 2006-07 Annual Report 39
Outcomes / Performance Measures Previous Years’ Results Current Results 2006-07 Targets
4 32004-05 2005-06
24 2005-0621 2004-05
77
26
3
2006-07
2006-07
2006-07
105 2005-06 80
200
24.2
3.2
254
100
2004-05
2004-05
268 2006-07263 2005-06
New research chairs, industry chairs and professors
Total active research chairs, industry chairs & professors
New graduate student scholarships
Total active graduate student scholarships
iCORE Awards(Totals include New)
1.951.81 2004-05 2.01 2006-071.94 2005-06ICT research: ratio of non-GOA investments to GOA investments
Investments in ICT research Non-GOA investment ($ million)
GOA investment ($ million)
52.8 57.060.2 40.72004-05 2006-072005-06
23.6 20.92005-0623.7 20.52004-05 2006-07
Goal 6 Accelerate Innovation in the ICT Sector
Performance Measure Investment in ICT Research�
�
�
In 2006-07, collaborating partners invested $57 million in ICT research and the Government of Alberta invested $20.5 million.
The increase in partner funding can be attributed, in part, to the recovery of the ICT industry and aggressive efforts by the Ministry to attract corporate partners to participate in research in the province. Significant investment in emerging industries, especially nanotechnology, contributed to the increased non-Government of Alberta funding.
Investment by collaborating partners is evidence that Alberta is being recognized for excellence of its people, ideas, research capacity and capability.
Notes�This measure has been dropped in the 2007-10 Business Plan due to difficulty in measuring investments made
by various partners over the lifespan of a project. New measures are being developed to measure an environment where research, development and innovation are fostered.
�See Endnote V (p. 156) re investments in priority research areas.
Outcome Facilitate the growth of ICT industrial sectors
An environment that supports and encourages innovation in ICT research, through collaborative research, development and technologycommercialization
Facilitate the growth of ICT industrial sectors
A skilled workforce to support ICT research and innovation an other sectors of the Alberta economy
Discussion of Results Goal 6 focused on accelerating innovation in the information and communications technology sector. Information and communications technology (ICT) is vital to Alberta’s economic future and will play a key role in improving all sectors of the Alberta economy.
ICT investment by industry is evidence of its recognition of the excellence of Alberta’s people, ideas, research capacity and capability. However, several economic factors can impact the amount of industry investment in ICT research. Changes in federal research funding programs also impact results, as do any changes in the provincial government budget for Advanced Education and Technology and other Alberta research agencies.
In 2006-07, the Government of Alberta (GOA) attracted 2.01 dollars from other partners for every dollar invested in ICT by the GOA. This result can be attributed to several factors including a more rigorous review of investments by all parties, the beginning of high leverage projects, and new strategic investments.
Through targeted investments, Alberta strives to create an environment that supports and encourages innovation in ICT research via collaborative research, development and technology commercialization. Investments in ICT research in 2006-07 garnered $20.5 million from GOA sources and $57 million from non-GOA partners. The increase in partner funding can be attributed, in part, to the recovery of the ICT industry and aggressive efforts by the Ministry to attract corporate partners to participate in research in the province. Significant investment in emerging industries, especially nanotechnology, also contributed to the increased non-GOA funding.
Through iCORE Inc., the Ministry is attracting and growing a critical mass of outstanding researchers and graduate students in computer science, electrical and computer engineering, and other ICT related disciplines. There were 77 new graduate scholarships awarded in 2006-07. In addition, the number of active graduate student scholarships was 268, exceeding iCORE’s target.
Results at a Glance
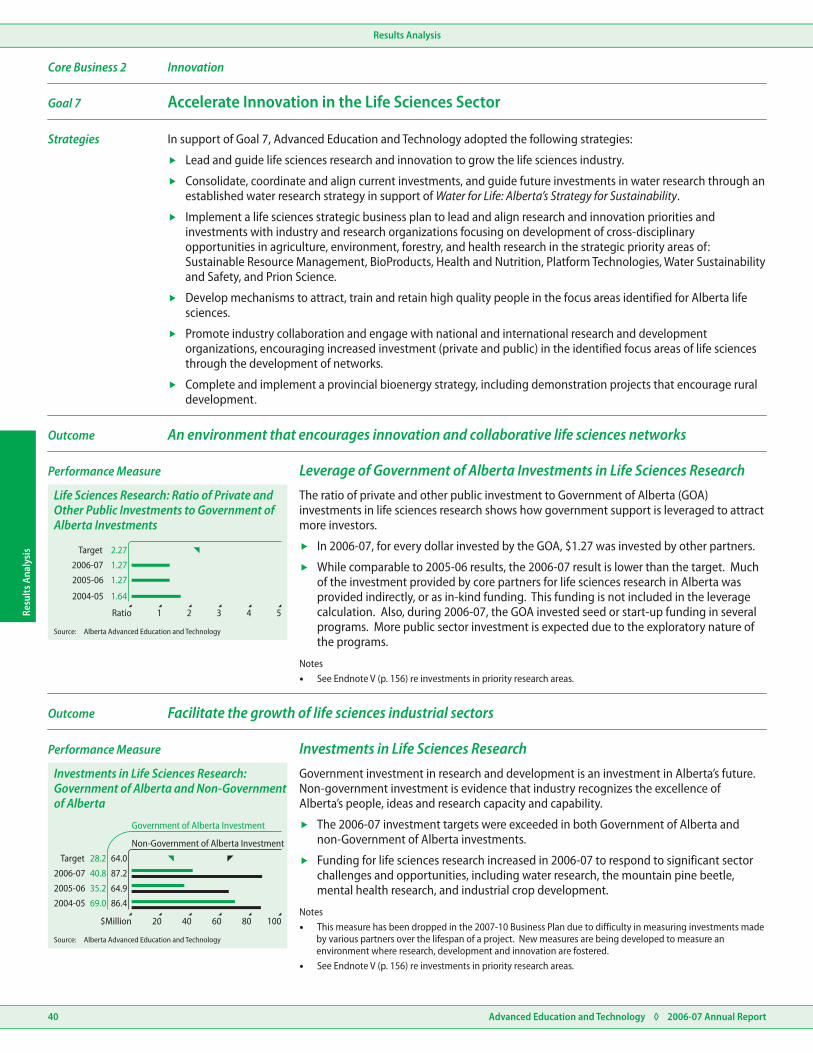
Target 2.27
1.27
1.27
1.64
2006-07
2005-06
2004-05
Ratio 1 2 3 4 5
Life Sciences Research: Ratio of Private andOther Public Investments to Government ofAlberta Investments
Source: Alberta Advanced Education and Technology
Non-Government of Alberta Investment
87.2
64.0
64.986.4
Government of Alberta Investment
Target 28.2
40.8
35.2
69.0
2006-07
2005-06
2004-05
$Million 20 40 60 80 100
Investments in Life Sciences Research:Government of Alberta and Non-Governmentof Alberta
Source: Alberta Advanced Education and Technology
Resu
lts A
naly
sis
Results Analysis
Advanced Education and Technology ◊ 2006-07 Annual Report40
Core Business 2 Innovation
Goal 7 Accelerate Innovation in the Life Sciences Sector
In support of Goal 7, Advanced Education and Technology adopted the following strategies:
Lead and guide life sciences research and innovation to grow the life sciences industry.
Consolidate, coordinate and align current investments, and guide future investments in water research through an established water research strategy in support of Water for Life: Alberta’s Strategy for Sustainability.
Implement a life sciences strategic business plan to lead and align research and innovation priorities and investments with industry and research organizations focusing on development of cross-disciplinary opportunities in agriculture, environment, forestry, and health research in the strategic priority areas of: Sustainable Resource Management, BioProducts, Health and Nutrition, Platform Technologies, Water Sustainability and Safety, and Prion Science.
Develop mechanisms to attract, train and retain high quality people in the focus areas identified for Alberta life sciences.
Promote industry collaboration and engage with national and international research and development organizations, encouraging increased investment (private and public) in the identified focus areas of life sciences through the development of networks.
Complete and implement a provincial bioenergy strategy, including demonstration projects that encourage rural development.
�
�
�
�
�
�
Strategies
Performance Measure Leverage of Government of Alberta Investments in Life Sciences ResearchThe ratio of private and other public investment to Government of Alberta (GOA) investments in life sciences research shows how government support is leveraged to attract more investors.
In 2006-07, for every dollar invested by the GOA, $1.27 was invested by other partners.
While comparable to 2005-06 results, the 2006-07 result is lower than the target. Much of the investment provided by core partners for life sciences research in Alberta was provided indirectly, or as in-kind funding. This funding is not included in the leverage calculation. Also, during 2006-07, the GOA invested seed or start-up funding in several programs. More public sector investment is expected due to the exploratory nature of the programs.
Notes�See Endnote V (p. 156) re investments in priority research areas.
�
�
Performance Measure Investments in Life Sciences ResearchGovernment investment in research and development is an investment in Alberta’s future. Non-government investment is evidence that industry recognizes the excellence of Alberta’s people, ideas and research capacity and capability.
The 2006-07 investment targets were exceeded in both Government of Alberta and non-Government of Alberta investments.
Funding for life sciences research increased in 2006-07 to respond to significant sector challenges and opportunities, including water research, the mountain pine beetle, mental health research, and industrial crop development.
Notes�This measure has been dropped in the 2007-10 Business Plan due to difficulty in measuring investments made
by various partners over the lifespan of a project. New measures are being developed to measure an environment where research, development and innovation are fostered.
�See Endnote V (p. 156) re investments in priority research areas.
�
�
Outcome
Outcome
Facilitate the growth of life sciences industrial sectors
An environment that encourages innovation and collaborative life sciences networks
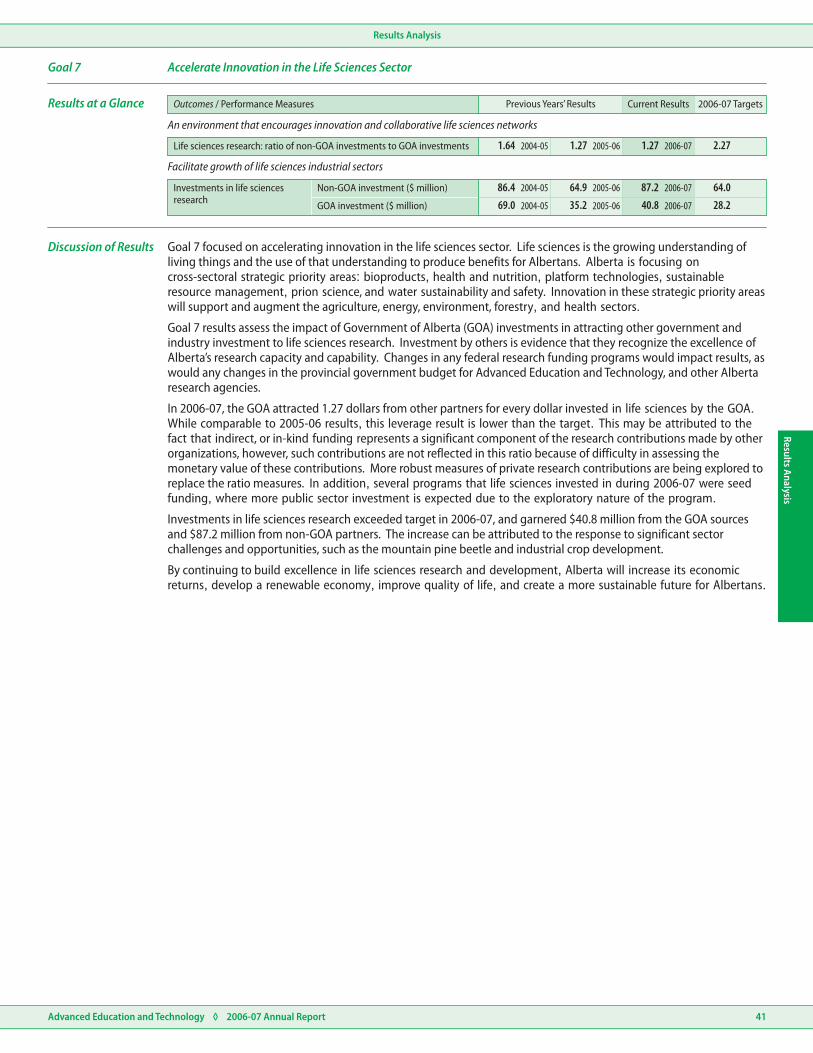
Results AnalysisResults Analysis
Advanced Education and Technology ◊ 2006-07 Annual Report 41
Life sciences research: ratio of non-GOA investments to GOA investments 2.271.64 2004-05 1.27 2006-071.27 2005-06
86.4 87.264.9 64.02004-05 2006-072005-06
35.2 28.22005-0669.0 40.82004-05 2006-07
Investments in life sciencesresearch
Non-GOA investment ($ million)
GOA investment ($ million)
Outcomes / Performance Measures Previous Years’ Results Current Results 2006-07 Targets
Discussion of Results
An environment that encourages innovation and collaborative life sciences networks
Facilitate growth of life sciences industrial sectors
Goal 7 Accelerate Innovation in the Life Sciences Sector
Goal 7 focused on accelerating innovation in the life sciences sector. Life sciences is the growing understanding of living things and the use of that understanding to produce benefits for Albertans. Alberta is focusing on cross-sectoral strategic priority areas: bioproducts, health and nutrition, platform technologies, sustainable resource management, prion science, and water sustainability and safety. Innovation in these strategic priority areas will support and augment the agriculture, energy, environment, forestry, and health sectors.
Goal 7 results assess the impact of Government of Alberta (GOA) investments in attracting other government and industry investment to life sciences research. Investment by others is evidence that they recognize the excellence of Alberta’s research capacity and capability. Changes in any federal research funding programs would impact results, as would any changes in the provincial government budget for Advanced Education and Technology, and other Alberta research agencies.
In 2006-07, the GOA attracted 1.27 dollars from other partners for every dollar invested in life sciences by the GOA. While comparable to 2005-06 results, this leverage result is lower than the target. This may be attributed to the fact that indirect, or in-kind funding represents a significant component of the research contributions made by other organizations, however, such contributions are not reflected in this ratio because of difficulty in assessing the monetary value of these contributions. More robust measures of private research contributions are being explored to replace the ratio measures. In addition, several programs that life sciences invested in during 2006-07 were seed funding, where more public sector investment is expected due to the exploratory nature of the program.
Investments in life sciences research exceeded target in 2006-07, and garnered $40.8 million from the GOA sources and $87.2 million from non-GOA partners. The increase can be attributed to the response to significant sector challenges and opportunities, such as the mountain pine beetle and industrial crop development.
By continuing to build excellence in life sciences research and development, Alberta will increase its economic returns, develop a renewable economy, improve quality of life, and create a more sustainable future for Albertans.
Results at a Glance

Ministry of Advanced Education and Technology
Advanced Education and Technology ◊ 2006-07 Annual Report42
Min
istr
y of
Adva
nced
Edu
catio
n an
d Te
chno
logy
Auditor’s Report
Consolidated Statement of Operations
Consolidated Statement of Financial Position
Consolidated Statement of Cash Flows
Notes to the Consolidated Financial Statements
Schedules to the Consolidated Financial Statements
RevenuesSchedule 1
2
3
4
5
6
7
8
Expenses - Directly Incurred Detailed by Object
Budget
Funding Provided to Post-Secondary Institutions
Statement of Alberta Heritage Scholarship Fund Expenses
Voted Non-Budgetary Disbursements by Program
Related Party Transactions
Allocated Costs
Audited Information
Ministry of Advanced Education and Technology
Consolidated Financial Statements
March 31, 2007
Advanced Education and Technology ◊ 2006-07 Annual Report 43
Ministry of Advanced Education and Technology
Ministry of
Advanced Education and Technology
To the Members of the Legislative Assembly
I have audited the consolidated statement of financial position of the Ministry of Advanced Education and Technology as at March 31, 2007 and the consolidated statements of operations and cash flows for the year then ended. These financial statements are the responsibility of the Ministry’s management. My responsibility is to express an opinion on these financial statements based on my audit.I conducted my audit in accordance with Canadian generally accepted auditing standards. Those standards require that I plan and perform an audit to obtain reasonable assurance whether the financial statements are free of material misstatement. An audit includes examining, on a test basis, evidence supporting the amounts and disclosures in the financial statements. An audit also includes assessing the accounting principles used and significant estimates made by management, as well as evaluating the overall financial statement presentation.In my opinion, these consolidated financial statements present fairly, in all material respects, the financial position of the Ministry as at March 31, 2007 and the results of its operations and its cash flows for the year then ended in accordance with Canadian generally accepted accounting principles.
Fred J. Dunn, FCAAuditor General
original signed by
Edmonton, AlbertaMay 22, 2007
Auditor’s Report
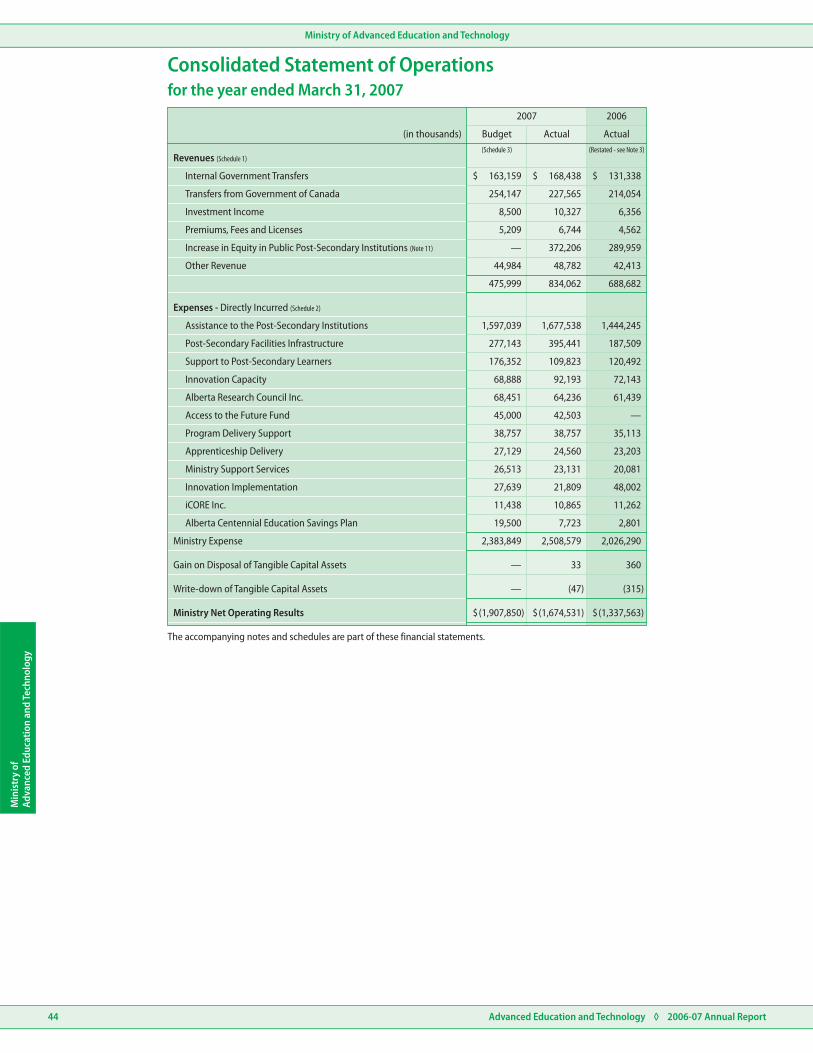
Ministry of Advanced Education and Technology
Advanced Education and Technology ◊ 2006-07 Annual Report44
Min
istr
y of
Adva
nced
Edu
catio
n an
d Te
chno
logy
Revenues (Schedule 1)
Internal Government Transfers
Transfers from Government of Canada
Investment Income
Premiums, Fees and Licenses
Increase in Equity in Public Post-Secondary Institutions (Note 11)
Other Revenue
Expenses - Directly Incurred (Schedule 2)
Assistance to the Post-Secondary Institutions
Post-Secondary Facilities Infrastructure
Support to Post-Secondary Learners
Innovation Capacity
Alberta Research Council Inc.
Access to the Future Fund
Program Delivery Support
Apprenticeship Delivery
Ministry Support Services
Innovation Implementation
iCORE Inc.
Alberta Centennial Education Savings Plan
Ministry Expense
Ministry Net Operating Results
Write-down of Tangible Capital Assets
Gain on Disposal of Tangible Capital Assets
$
$
$
$
$
$
2007
Budget(Schedule 3) (Restated - see Note 3)
Actual Actual
2006
(in thousands)
163,159 168,438 131,338
254,147 227,565 214,054
8,500 10,327 6,356
5,209 6,744 4,562
— 372,206 289,959
44,984 48,782 42,413
475,999 834,062 688,682
1,597,039 1,677,538 1,444,245
277,143 395,441 187,509
176,352 109,823 120,492
68,888 92,193 72,143
68,451 64,236 61,439
45,000 42,503 —
38,757 38,757 35,113
27,129 24,560 23,203
26,513 23,131 20,081
27,639 21,809 48,002
11,438 10,865 11,262
19,500 7,723 2,801
2,383,849 2,508,579 2,026,290
— 33 360
— (47) (315)
(1,907,850) (1,674,531) (1,337,563)
The accompanying notes and schedules are part of these financial statements.
for the year ended March 31, 2007Consolidated Statement of Operations

Ministry of Advanced Education and Technology
Advanced Education and Technology ◊ 2006-07 Annual Report 45
Ministry of
Advanced Education and Technology
(Restated - see Note 3)Assets
Liabilities
Cash (Note 4)
Equity in Public Post-Secondary Institutions (Note 11)
Loans Receivable (Note 6)
Tangible Capital Assets (Note 7)
Accounts Payable and Accrued Liabilities (Note 8)
Unearned Revenue (Note 9)
Liability for Student Loans Issued (Note 10)
Deferred Contributions
Current Portion of Long Term Debt
Accounts Receivable (Note 5)
Net Assets
Net Operating Results
Net Transfer from General Revenues
Net Assets at End of Year
Net Assets at Beginning of Year (Note 3)
$
$
$
$
$
$
$
$
2007 2006(in thousands)
27,934 25,187
29,341 27,442
188,172 152,550
41,778 34,223
2,764,666 2,392,460
3,051,891 2,631,862
136,326 76,256
59,440 7,258
5,422 9,241
1,114 1,540
— 273
202,302 94,568
2,537,294 2,164,685
(1,674,531) (1,337,563)
1,986,826 1,710,172
2,849,589 2,537,294
3,051,891 2,631,862
as at March 31, 2007Consolidated Statement of Financial Position
The accompanying notes and schedules are part of these financial statements.
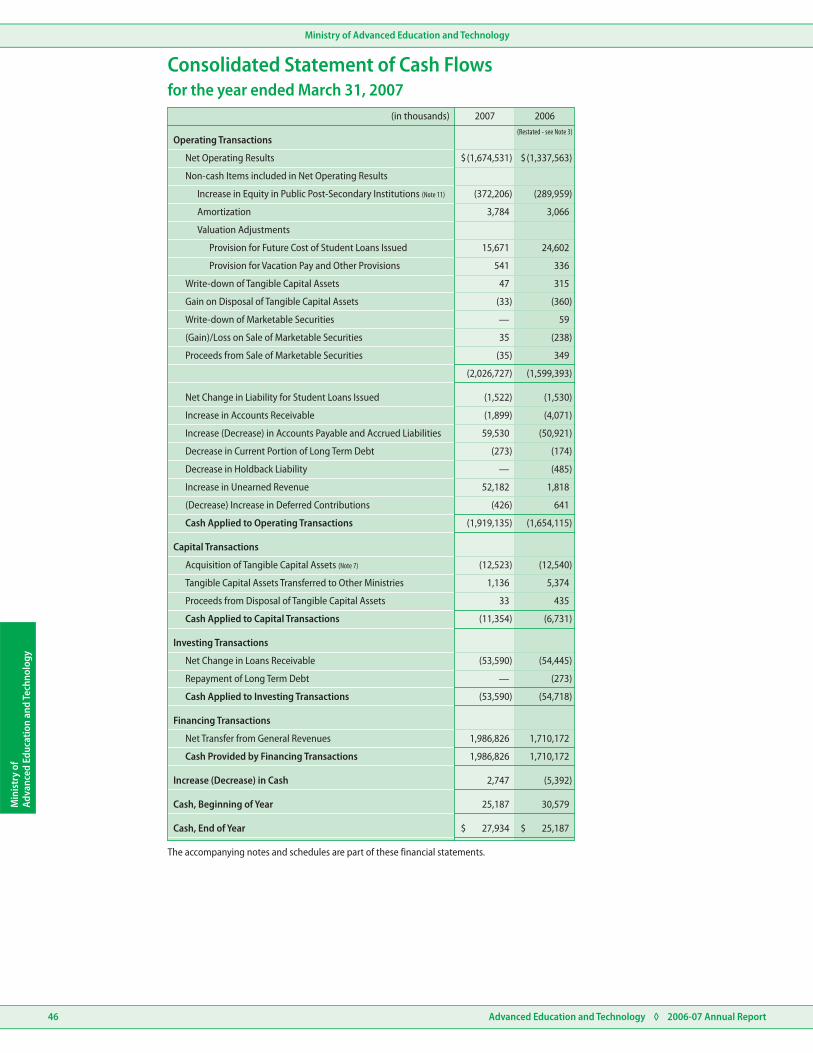
Ministry of Advanced Education and Technology
Advanced Education and Technology ◊ 2006-07 Annual Report46
Min
istr
y of
Adva
nced
Edu
catio
n an
d Te
chno
logy
(Restated - see Note 3)Operating Transactions
Capital Transactions
Investing Transactions
Financing Transactions
Net Operating Results
Acquisition of Tangible Capital Assets (Note 7)
Net Change in Loans Receivable
Net Transfer from General Revenues
Tangible Capital Assets Transferred to Other Ministries
Repayment of Long Term Debt
Proceeds from Disposal of Tangible Capital Assets
Cash Applied to Capital Transactions
Cash Applied to Investing Transactions
Cash Provided by Financing Transactions
Non-cash Items included in Net Operating Results
Increase in Equity in Public Post-Secondary Institutions (Note 11)
Amortization
Valuation Adjustments
Provision for Future Cost of Student Loans Issued
Provision for Vacation Pay and Other Provisions
Write-down of Tangible Capital Assets
Gain on Disposal of Tangible Capital Assets
Write-down of Marketable Securities
(Gain)/Loss on Sale of Marketable Securities
Net Change in Liability for Student Loans Issued
Increase in Accounts Receivable
Increase (Decrease) in Accounts Payable and Accrued Liabilities
Decrease in Current Portion of Long Term Debt
Decrease in Holdback Liability
Increase in Unearned Revenue
(Decrease) Increase in Deferred Contributions
Cash Applied to Operating Transactions
Proceeds from Sale of Marketable Securities
Increase (Decrease) in Cash
Cash, Beginning of Year
Cash, End of Year
$
$
$
$
2007 2006(in thousands)
(1,674,531) (1,337,563)
(372,206) (289,959)
3,784 3,066
15,671 24,602
541 336
47 315
(33) (360)
— 59
35 (238)
(35) 349
(2,026,727) (1,599,393)
(1,522) (1,530)
(1,899) (4,071)
59,530 (50,921)
(273) (174)
— (485)
52,182 1,818
(426) 641
(1,919,135) (1,654,115)
(12,523) (12,540)
1,136 5,374
33 435
(11,354) (6,731)
(53,590) (54,445)
— (273)
(53,590) (54,718)
1,986,826 1,710,172
1,986,826 1,710,172
2,747 (5,392)
25,187 30,579
27,934 25,187
for the year ended March 31, 2007Consolidated Statement of Cash Flows
The accompanying notes and schedules are part of these financial statements.
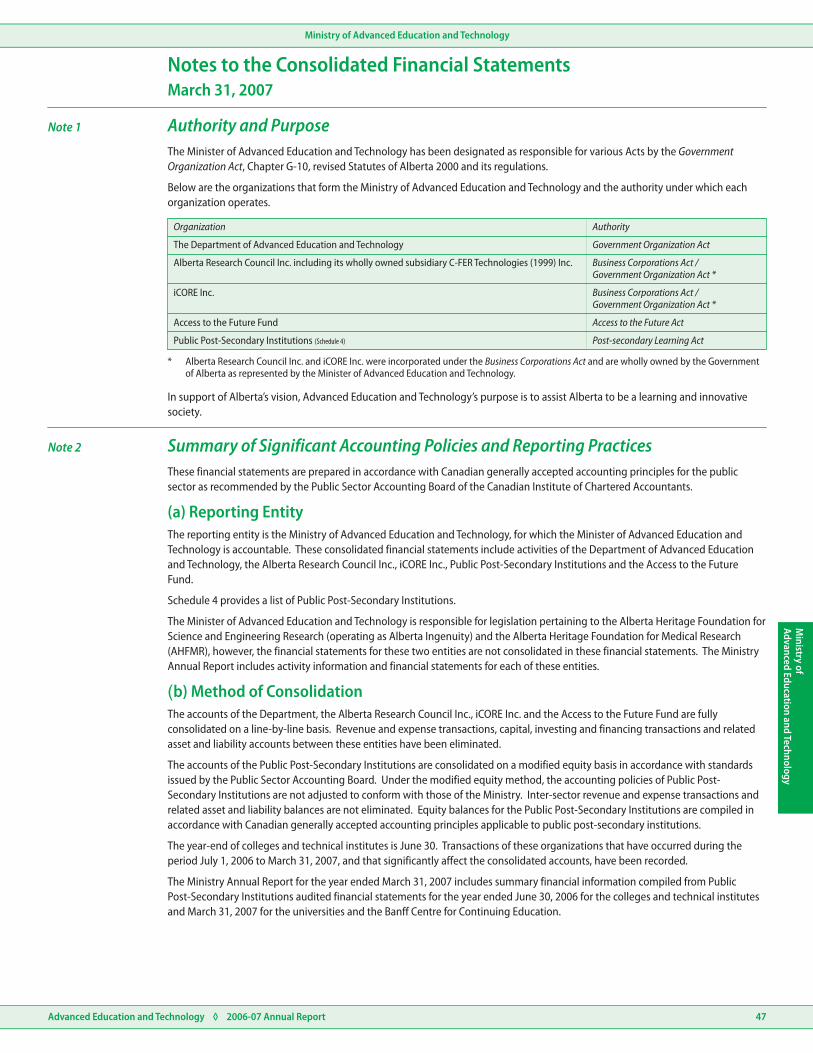
Ministry of Advanced Education and Technology
Advanced Education and Technology ◊ 2006-07 Annual Report 47
Ministry of
Advanced Education and Technology
iCORE Inc.
Access to the Future Fund
Public Post-Secondary Institutions (Schedule 4)
Alberta Research Council Inc. including its wholly owned subsidiary C-FER Technologies (1999) Inc.
The Department of Advanced Education and Technology
Access to the Future Act
Post-secondary Learning Act
Business Corporations Act /Government Organization Act *
Business Corporations Act /Government Organization Act *
Government Organization Act
Organization Authority
March 31, 2007
Note 1 Authority and Purpose
Notes to the Consolidated Financial Statements
The Minister of Advanced Education and Technology has been designated as responsible for various Acts by the Government Organization Act, Chapter G-10, revised Statutes of Alberta 2000 and its regulations.
Below are the organizations that form the Ministry of Advanced Education and Technology and the authority under which each organization operates.
In support of Alberta’s vision, Advanced Education and Technology’s purpose is to assist Alberta to be a learning and innovative society.
* Alberta Research Council Inc. and iCORE Inc. were incorporated under the Business Corporations Act and are wholly owned by the Government of Alberta as represented by the Minister of Advanced Education and Technology.
Note 2 Summary of Significant Accounting Policies and Reporting PracticesThese financial statements are prepared in accordance with Canadian generally accepted accounting principles for the public sector as recommended by the Public Sector Accounting Board of the Canadian Institute of Chartered Accountants.
The reporting entity is the Ministry of Advanced Education and Technology, for which the Minister of Advanced Education and Technology is accountable. These consolidated financial statements include activities of the Department of Advanced Education and Technology, the Alberta Research Council Inc., iCORE Inc., Public Post-Secondary Institutions and the Access to the Future Fund.
Schedule 4 provides a list of Public Post-Secondary Institutions.
The Minister of Advanced Education and Technology is responsible for legislation pertaining to the Alberta Heritage Foundation for Science and Engineering Research (operating as Alberta Ingenuity) and the Alberta Heritage Foundation for Medical Research (AHFMR), however, the financial statements for these two entities are not consolidated in these financial statements. The Ministry Annual Report includes activity information and financial statements for each of these entities.
The accounts of the Department, the Alberta Research Council Inc., iCORE Inc. and the Access to the Future Fund are fully consolidated on a line-by-line basis. Revenue and expense transactions, capital, investing and financing transactions and related asset and liability accounts between these entities have been eliminated.
The accounts of the Public Post-Secondary Institutions are consolidated on a modified equity basis in accordance with standards issued by the Public Sector Accounting Board. Under the modified equity method, the accounting policies of Public Post-Secondary Institutions are not adjusted to conform with those of the Ministry. Inter-sector revenue and expense transactions and related asset and liability balances are not eliminated. Equity balances for the Public Post-Secondary Institutions are compiled in accordance with Canadian generally accepted accounting principles applicable to public post-secondary institutions.
The year-end of colleges and technical institutes is June 30. Transactions of these organizations that have occurred during the period July 1, 2006 to March 31, 2007, and that significantly affect the consolidated accounts, have been recorded.
The Ministry Annual Report for the year ended March 31, 2007 includes summary financial information compiled from Public Post-Secondary Institutions audited financial statements for the year ended June 30, 2006 for the colleges and technical institutes and March 31, 2007 for the universities and the Banff Centre for Continuing Education.
(a) Reporting Entity
(b) Method of Consolidation

Ministry of Advanced Education and Technology
Advanced Education and Technology ◊ 2006-07 Annual Report48
Min
istr
y of
Adva
nced
Edu
catio
n an
d Te
chno
logy
Note 2 Summary of Significant Accounting Policies and Reporting Practices (continued)
(c) Basis of Financial ReportingRevenues
Internal Government Transfers
Transfers from Government of Canada
Dedicated Revenue
ExpensesDirectly Incurred
�
�
�
Incurred by Others
Assets
All revenues are reported on the accrual basis of accounting. Cash received for which goods or services have not been provided by year end is recorded as unearned revenue.
Internal government transfers are transfers between entities within the government reporting entity where the entity making the transfer does not receive any goods or services directly in return.
Transfers from Government of Canada are recognized as revenues when authorized by federal legislation or federal/provincial agreements, eligibility criteria if any are met, and a reasonable estimate of the amounts can be made. Overpayments relating to Canada Social Transfer entitlements and transfers received before revenue recognition criteria have been met are included in accounts payable and accrued liabilities.
Dedicated revenue initiatives provide a basis for authorizing spending. Dedicated revenues are shown as credits or recoveries in the details of the Government Estimates for a supply vote. If budgeted revenues are not fully realized, spending is reduced by an equivalent amount. If actual dedicated revenues exceed budget, the Ministry may, with the approval of the Treasury Board, use the excess revenue to fund additional expenses on the program.
Directly incurred expenses are those costs the Ministry has primary responsibility and accountability for, as reflected in the Government’s budget documents.
In addition to program operating expenses such as salaries and supplies, etc. directly incurred expenses also include:
amortization of tangible capital assets.
pension costs which comprise the cost of employer contributions for current service of employees during the year.
valuation adjustments which include changes in the valuation allowances used to reflect financial assets at their net recoverable or other appropriate value. Valuation adjustments also represent the change in management’s estimate of future payments arising from obligations relating to vacation pay, and student loans.
Grants are recognized as expenses when authorized, eligibility criteria if any are met, and a reasonable estimate of the amounts can be made.
Services contributed by other entities in support of the Ministry operations are disclosed in Schedule 8.
Financial assets of the Ministry are limited to financial claims, such as advances to and receivables from other organizations, employees, students and other individuals.
Loans receivable are recorded at cost net of the allowance for loan relief completion payments and an allowance for impaired loans.
Tangible capital assets of the Ministry are recorded at historical cost and amortized on a straight-line basis over the estimated useful lives of the assets. The threshold for capitalizing new systems development is $100,000 and the threshold for all other tangible capital assets is $5,000. All land is capitalized.
Expenses for patents owned by the Ministry as a result of research activity are not capitalized due to the uncertain value of benefits that may accrue to the Ministry.
Expenses on the acquisition or development of other intangible assets including intellectual capital are not capitalized as currently there is no acceptable methodology for measuring the value of future benefits accruing to the Ministry.
Equity in Public Post-Secondary Institutions represents the difference between the carrying value of assets held by the Institutions and their liabilities as determined at March 31, 2007.

Ministry of Advanced Education and Technology
Advanced Education and Technology ◊ 2006-07 Annual Report 49
Ministry of
Advanced Education and Technology
Liabilities
Net Assets
Measurement Uncertainty
�
�
�
Valuation of Financial Assets and Liabilities
Liabilities are recorded to the extent that they represent present obligations as a result of events and transactions occurring prior to the end of fiscal year. The settlement of liabilities will result in sacrifice of economic benefits in the future. They include the Ministry’s obligations for future payments under the Student Financial Assistance Act for guarantees, remissions, risk premiums and interest.
Net assets represent the difference between the carrying value of assets held by the Ministry and its liabilities.
(in thousands)
Measurement uncertainty exists when there is variance between the recognized or disclosed amount and another reasonably possible amount.
The allowance for loan relief completion payments amounting to $46,318 (2006 - $54,191), the allowance for impaired loans amounting to $25,510 (2006- $33,621), as well as, the liability for student loans issued amounting to $5,422 (2006 - $9,241) are subject to measurement uncertainty.
The Ministry has made certain estimates in the following areas:
The number of students exceeding their maximum debt limit in determining the allowance for loan relief completion payments.
Recovery and default rates in the determination of the allowance for impaired loans.
Future interest, recovery and default rates in the determination of the liability for student loans.
Changes in these assumptions could materially impact the amounts reported in these financial statements.
Note 10 discloses additional information on the liability for student loans issued.
Fair value is the amount of consideration agreed upon in an arm’s length transaction between knowledgeable, willing parties who are under no compulsion to act.
The fair values of cash, accounts receivable, accounts payable, accrued liabilities and unearned revenue are estimated to approximate their carrying values because of the short term nature of these instruments. The fair value of long-term debt approximates its carrying value as interest rates approximate the market value. The fair values of loans receivable and liability for student loans issued are not reported as there is no organized financial market for these instruments and it is not practicable within constraints of timeliness or cost to estimate the fair values with sufficient reliability.
Note 2 Summary of Significant Accounting Policies and Reporting Practices (continued)

Ministry of Advanced Education and Technology
Advanced Education and Technology ◊ 2006-07 Annual Report50
Min
istr
y of
Adva
nced
Edu
catio
n an
d Te
chno
logy
Revenues
Expenses
Net Operating Results
Net Transfers from General Revenues
Net Assets (Liabilities) at March 31, 2005
Net Assets at March 31, 2006
$ $ $ $ $
$ $ $ $ $
$
$
AdvancedEducation
(a) (a) (b) (f)(c) (d) (e)
Innovationand Science
Infrastructureand
Transportation Other
Inclusion ofPublic
Post-SecondaryInstitutions As Restated(in thousands)
281,348 101,595 16,000 (220) 289,959 688,682
1,722,781 199,051 107,009 (2,596) — 2,026,245
(1,441,433) (97,456) (91,009) 2,376 289,959 (1,337,563)
1,496,606 126,478 89,469 (2,381) — 1,710,172
81,385 (19,289) — 88 2,102,501 2,164,685
136,558 9,733 (1,540) 83 2,392,460 2,537,294
Alberta Research Council Inc.
Access to the Future Fund
Department of Advanced Education and Technology
iCORE Inc.
$
$
$
$
2007(Restated - see Note 3)
2006(in thousands)
12,141 9,503
9,839 11,262
5,831 4,316
123 106
27,934 25,187
a. The responsibility for the Ministry of Innovation and Science and the Ministry of Advanced Education were transferred to the Ministry of Advanced Education and Technology on December 15, 2006 (O.C. 637/2006).
b. Effective April 1, 2006 the Ministry assumed responsibility from the Department of Infrastructure and Transportation for reporting costs of post-secondary facilities infrastructure.
c. The International Qualifications Assessment Services program was transferred from the Ministry of Advanced Education to the Ministry of the Employment, Immigration and Industry on December 15, 2006 (O.C. 637/2006).
d. Responsibility for the Standing Policy Committee on Learning and Employment program was transferred from the Ministry of Advanced Education and Technology to the Ministry of the Employment, Immigration and Industry on January 23, 2007 (O.C. 24/2007).
e. Effective April 1, 2006, the Ministry assumed responsibility from the Department of Economic Development for reporting costs of a shared research program and the Ministry transferred the responsibility to the Department of Restructuring and Government Efficiency for reporting shared services.
f. Effective for the 2007 fiscal year, the Ministry expanded its reporting entity to include the accounts of Public Post-Secondary Institutions in its consolidated financial statements on a modified equity basis (see Note 2(b) and Note 11). Previously, the financial results of the Public Post-Secondary Institutions were included in the Government of Alberta Consolidated Financial Statements.
The Ministry of Advanced Education and Technology was established in December 2006 as a result of government restructuring. In addition, the Ministry’s reporting entity has expanded to include the Public Post-Secondary Institutions (see Note 11). Comparative figures for 2006 have been restated as if the Ministry had always been assigned its current responsibilities.
The following is a summary of the effects of the reporting changes on the 2006 consolidated financial statements:
Note 3 Reporting Change
Note 4 CashThe cash balance consists of the following:

Ministry of Advanced Education and Technology
Advanced Education and Technology ◊ 2006-07 Annual Report 51
Ministry of
Advanced Education and Technology
Loans Receivable
Commercial
Government of Canada
Other
Accrued Interest Receivable on Loans
Alberta Government Departments and Agencies
Less:
Allowance for Loan Relief
Completion Payments
Allowance for Impaired Loans
$
$$$
$
$$$
$
$
$
$
2007
NetRealizable
Value
NetRealizable
Value
Allowancefor Doubtful
Accounts
2007
GrossAmount
(Restated - see Note 3)
2006
2006
(in thousands)
(in thousands)
14,508 (786) 13,722 12,593
11,986 — 11,986 11,272
1,682 — 1,682 1,115
1,253 — 1,253 784
698 — 698 1,678
30,127 (786) 29,341 27,442
260,000 240,362
(46,318) (54,191)
(25,510) (33,621)
188,172 152,550
Note 6
Note 5
Loans Receivable
Accounts Receivable
Effective August 2001, under the terms of the Alberta Student Loan Program, loans are provided by the Ministry to qualifying students at interest rates prescribed by the Minister of Advanced Education and Technology.
Loans become payable and interest is earned when students discontinue their studies or graduate. Loans bear interest at either a fixed rate of prime plus 5% or floating rate based on prime plus 2.5% and are repayable to a maximum term of 114 months. When loans receivable are classified as impaired, interest ceases to accrue. Loans are unsecured.
Loans receivable are stated at cost net of the allowance for loan relief completion payments and the allowance for impaired loans. Loan relief completion payments on Alberta Student Loans are available to students who complete their studies and have assumed a total combined indebtedness of Canada and Alberta Student Loans exceeding established debt limits.
The allowance for impaired loans is a general provision that estimates the amount of loans receivable that will be impaired. The key assumptions used to determine this provision are default and recovery rates.
Loans receivable are classified as impaired when:
there is no longer reasonable assurance as to the timely collection of the full amount of principal or interest, or
the borrower has failed to make payments for a period of 150 days, or
interest is owing to the Province for a period of 180 days.
�
�
�
Accounts receivable are unsecured and reported at their net realizable value.

Ministry of Advanced Education and Technology
Advanced Education and Technology ◊ 2006-07 Annual Report52
Min
istr
y of
Adva
nced
Edu
catio
n an
d Te
chno
logy
(a) Equipment includes office equipment, furniture and fixtures.(b) Historical cost included work-in-progress at March 31, 2007 totaling $18,250 (2006 - $13,684) comprised of: computer software development
projects.(c) Includes capital assets from discontinued operations.
Estimated Useful Life
Historical Cost (b)
Beginning of year
Additions
Disposals including:
Write-downs
Impairment
Transfers
Other (c)
Accumulated Amortization
Beginning of year
Amortization expense
Effect of disposals, includingwrite-downs
Other (c)
Net Book Value at March 31, 2007
Net Book Value at March 31, 2006
Indefinite 30 years 5-10 years 3-10 years 25 years
$ $ $ $ $
$
$
$
$
$
$
$
$
$
$
$ $
$
$
Land Building Equipment
ComputerHardware /
Software
2007
LeaseholdImprovements Total Total
2006
(in thousands)
Accounts Payable
Unearned Revenue:
Accrued Liabilities:
Federal Post-Secondary Education Infrastructure Trust
Vacation
Other
Other
Advances from Government of Canada
41,658
50,731
8,141
19,778
8,709
136,326
59,440
66,749
16,369
—
7,449
14,102
7,258
76,256
7,258
38,336
$
$
$
$
$
$
$
$
2007
2007
(Restated - see Note 3)
(Restated - see Note 3)
2006
2006
(in thousands)
(in thousands)
(Restated - see Note 3)(a)
566 2,142 40,547 27,836 9,283 80,374 76,277
— — 6,924 5,567 32 12,523 12,540
— — (2,188) (106) — (2,294) (2,079)
— — — — — — (990)
— — (945) (191) — (1,136) (5,374)
— — (3,849) (901) (8,309) (13,059) (12,907)
566 2,142 40,489 32,205 1,006 76,408 67,467
— 508 29,044 7,884 8,716 46,152 45,764
— 67 1,458 2,217 42 3,784 3,066
— — (2,141) (106) — (2,247) (2,679)
— — (3,849) (901) (8,309) (13,059) (12,907)
— 575 24,512 9,094 449 34,630 33,244
566 1,567 15,977 23,111 557 41,778
566 1,634 11,501 19,954 568 34,223
Note 8
Note 9
Accounts Payable and Accrued Liabilities
Unearned Revenue
Note 7 Tangible Capital Assets
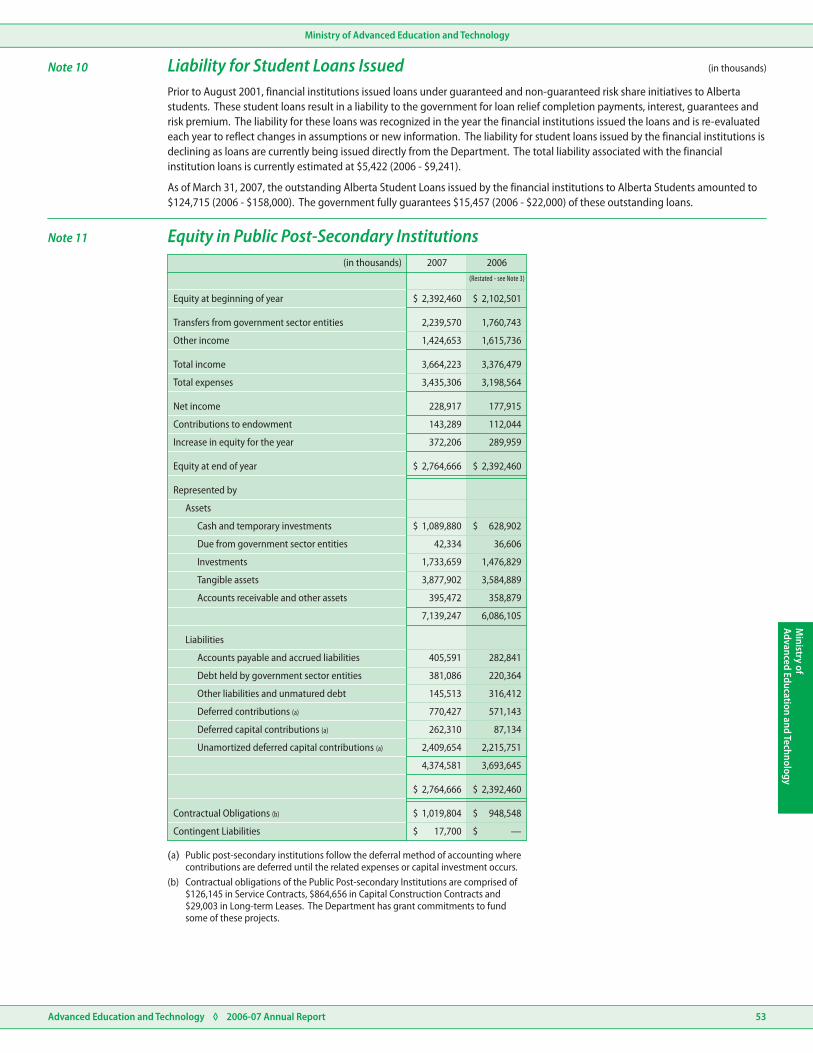
Ministry of Advanced Education and Technology
Advanced Education and Technology ◊ 2006-07 Annual Report 53
Ministry of
Advanced Education and Technology
Equity at beginning of year
Transfers from government sector entities
Other income
Total income
Total expenses
Net income
Contributions to endowment
Increase in equity for the year
Equity at end of year
Represented by
Assets
Cash and temporary investments
Due from government sector entities
Investments
Tangible assets
Accounts receivable and other assets
Liabilities
Accounts payable and accrued liabilities
Debt held by government sector entities
Other liabilities and unmatured debt
Deferred contributions (a)
Deferred capital contributions (a)
Unamortized deferred capital contributions (a)
Contractual Obligations (b)
Contingent Liabilities
$
$
$
$
$
$
$
$
$
$
$
$
2007(Restated - see Note 3)
2006(in thousands)
2,392,460 2,102,501
2,239,570 1,760,743
1,424,653 1,615,736
3,664,223 3,376,479
3,435,306 3,198,564
228,917 177,915
143,289 112,044
372,206 289,959
2,764,666 2,392,460
1,089,880 628,902
42,334 36,606
1,733,659 1,476,829
3,877,902 3,584,889
395,472 358,879
7,139,247 6,086,105
405,591 282,841
381,086 220,364
145,513 316,412
770,427 571,143
262,310 87,134
2,409,654 2,215,751
4,374,581 3,693,645
2,764,666 2,392,460
1,019,804 948,548
17,700 —
Note 10 (in thousands)Liability for Student Loans IssuedPrior to August 2001, financial institutions issued loans under guaranteed and non-guaranteed risk share initiatives to Alberta students. These student loans result in a liability to the government for loan relief completion payments, interest, guarantees and risk premium. The liability for these loans was recognized in the year the financial institutions issued the loans and is re-evaluated each year to reflect changes in assumptions or new information. The liability for student loans issued by the financial institutions is declining as loans are currently being issued directly from the Department. The total liability associated with the financial institution loans is currently estimated at $5,422 (2006 - $9,241).
As of March 31, 2007, the outstanding Alberta Student Loans issued by the financial institutions to Alberta Students amounted to $124,715 (2006 - $158,000). The government fully guarantees $15,457 (2006 - $22,000) of these outstanding loans.
Note 11 Equity in Public Post-Secondary Institutions
(a) Public post-secondary institutions follow the deferral method of accounting where contributions are deferred until the related expenses or capital investment occurs.
(b) Contractual obligations of the Public Post-secondary Institutions are comprised of $126,145 in Service Contracts, $864,656 in Capital Construction Contracts and $29,003 in Long-term Leases. The Department has grant commitments to fund some of these projects.

Ministry of Advanced Education and Technology
Advanced Education and Technology ◊ 2006-07 Annual Report54
Min
istr
y of
Adva
nced
Edu
catio
n an
d Te
chno
logy
2007
2008
2009
2010
Thereafter
$ $ $ $ $
$ $ $ $ $
$
$
ServiceContracts Grants
UncashedLoans
2007
ComputerDevelopment Total
(Restated - see Note 3)
(Restated - see Note 3)
Total
2006
Department
Alberta Research Council Inc.
iCORE Inc.
Access to the Future Fund
859,922
324
897,199
20,453
16,500
1,263,387
374
1,354,338
18,761
71,816
$
$
$
$
2007 2006(in thousands)
(in thousands)
Canadian Millennium Scholarship Foundation
Canadian Millennium Scholarships
Government of Canada
Canada Study Grants
Canada Access Grants
French Minority Language Education and French Second Language Instruction
27,203
7,309
44,780
4,455
5,813
26,839
8,692
41,123
3,964
1,628
$
$
$
$
2007 2006(in thousands)
— — — — — 387,313
9,005 613,644 3,073 9,907 635,629 505,996
4,182 236,387 — 1,515 242,084 356,715
475 14,307 — — 14,782 68,314
27 4,677 — — 4,704 36,000
13,689 869,015 3,073 11,422 897,199 1,354,338
Note 12 Contractual Obligations
Contractual obligations for the Public Post-Secondary Institutions are not included in the above; additional information on the contractual obligations for the Public Post-Secondary Institutions can be found in Note 11.
The aggregate amounts payable for the unexpired terms of these contractual obligations are as follows:
Note 13 (in thousands)Contingent LiabilitiesAt March 31, 2007, the Ministry of Advanced Education and Technology is a defendant in four legal claims (2006 Restated - See Note 3 - four legal claims). Three of these claims have specified amounts totaling $53,400 (2006 Restated - See Note 3 - $53,400). The value of the fourth claim is unknown at this time.
The resulting loss, if any, from these claims can not be determined.
Contingent Liabilities for the Public Post-Secondary Institutions are not included with the Ministry’s contingent liabilities. Additional information on contingent liabilities for the Public Post-Secondary Institutions can be found in Note 11.
Note 14 (in thousands)Payments under AgreementThe Department has entered into agreements to deliver programs that are fully funded by the Government of Canada. Costs incurred under these agreements are made by the Ministry under authority of the Financial Administration Act, Section 25. Accounts receivable includes $8,851 (2006 - $7,767) and accounts payable and accrued liabilities includes $4,524 (2006 - $2,211) relating to payments under agreement.
Amounts paid and payable under agreements on behalf of the Government of Canada:
Ministry of Advanced Education and Technology
Advanced Education and Technology ◊ 2006-07 Annual Report 55
Ministry of
Advanced Education and Technology
Note 16
Note 17
Note 15 (in thousands)
Comparative Figures
Approval of Financial Statements
Defined Benefit Plans
Certain 2006 figures have been reclassified to conform to the 2007 presentation.
The financial statements were approved by the Senior Financial Officer and the Deputy Minister.
Ministry Pension Plans
Universities Academic Pension Plan
The Ministry participates in the multi-employer Management Employees Pension Plan and Public Service Pension Plan. The Ministry also participates in the multi-employer Supplementary Retirement Plan for Public Service Managers. The expense for these pension plans is equivalent to the annual contributions of $6,527 for the year ended March 31, 2007 (2006 Restated - See Note 3 - $5,980).
At December 31, 2006, the Management Employees Pension Plan reported a deficiency of $6,765 (2005 -$165,895) and the Public Service Pension Plan reported a surplus of $153,024 (2005 - $187,704). At December 31, 2006, the Supplementary Retirement Plan for Public Service Managers had a surplus of $3,698 (2005 - $10,018).
The Ministry also participates in two multi-employer Long Term Disability Income Continuance Plans. At March 31, 2007, the Bargaining Unit Plan reported an actuarial surplus of $153 (2006 - $8,699) and the Management, Opted Out and Excluded Plan an actuarial surplus of $10,148 (2006 - $8,309). The expense for these two plans is limited to employer’s annual contributions for the year.
The Universities Academic Pension Plan (UAPP) is a multiemployer defined benefit pension plan for academic staff and other members (Employees) of the Universities of Alberta, Calgary and Lethbridge, Athabasca University and the Banff Centre for Continuing Education (Employers).
UAPP reported an unfunded liability at December 31, 2006. Responsibility for the unfunded liability is shared amongst the Government of Alberta, the Employees and the Employers. The Government of Alberta’s responsibility is limited to a portion of the pre-1992 unfunded liability whereas the Employer and Employees share equally in the balance of any pre- or post-1992 deficiencies.
At March 31, 2007 the Government of Alberta estimated their share of the pre-1992 deficiency to be $196,000 (2006 - $190,000) reporting this amount in the consolidated financial statements of the province of Alberta. The Employees and Employers shared equally in the remaining unfunded liability which is estimated to be approximately $27,900 (2006 - $214,900). As participants in a multiemployer defined benefit plan, the universities do not record their portion of the unfunded liability in their financial statements.
The Annual Report of the Universities Academic Pension Plan contains additional information.

Ministry of Advanced Education and Technology
Advanced Education and Technology ◊ 2006-07 Annual Report56
Min
istr
y of
Adva
nced
Edu
catio
n an
d Te
chno
logy
Lottery Fund
Canada Social Transfers
Interest on Student Loans Issued
Marketing Apprenticeship
Contract Revenue
Trade School License Fee
Refunds of Expenditure
Internal Government Transfers
Transfers from Government of Canada
Investment Income
Premiums, Fees and Licenses
Other Revenue
Increase in Equity in Public Post-Secondary Institutions
Increase in Equity in Public Post-Secondary Institutions
Alberta Heritage Scholarship Fund
Canada Student Loans Administration
Access to the Future Fund
Post-Secondary Education Infrastructure Trust
Other
Other
Other
Miscellaneous
$
$
$
$
$
$
2007
Budget Actual(Restated - see Note 3)
Actual
2006
(in thousands)
103,957 103,957 97,238
25,452 24,921 22,850
33,750 39,560 11,250
163,159 168,438 131,338
243,986 175,105 210,726
1,781 1,102 1,843
— 50,577 —
8,380 781 1,485
254,147 227,565 214,054
8,000 7,858 5,695
500 2,469 661
8,500 10,327 6,356
5,000 6,530 4,399
160 158 163
49 56 —
5,209 6,744 4,562
— 372,206 289,959
— 372,206 289,959
42,458 45,200 38,843
— 3,441 3,507
2,526 141 63
44,984 48,782 42,413
475,999 834,062 688,682
Schedule 1 Revenues
for the year ended March 31, 2007Schedules to the Consolidated Financial Statements

Ministry of Advanced Education and Technology
Advanced Education and Technology ◊ 2006-07 Annual Report 57
Ministry of
Advanced Education and Technology
Grants
Provision for Future Costs of Student Loans Issued
Recoveries from Support Service Arrangements with Related Parties (a)
Salaries, Wages and Employee Benefits
Valuation Adjustment and Other Provisions
Supplies and Services
Amortization of Capital Assets
Other
Valuation Adjustments
Less:
$
$
$
$
$
$
2007
Budget Actual(Restated - see Note 3)
Actual
2006
(in thousands)
2,155,318 2,330,516 1,851,445
95,291 92,688 84,568
81,215 66,926 63,665
7,425 3,784 3,066
250 238 508
44,345 15,671 24,602
5 541 336
2,383,849 2,510,364 2,028,190
— (1,785) (1,900)
2,383,849 2,508,579 2,026,290
(a) The Ministry provides information technology support services to the Ministry of Employment, Immigration and Industry $1,785 (2006- $1,900). Costs for these services are recovered from the Ministry.
Schedule 2 Expenses - Directly Incurred Detailed by Object

Ministry of Advanced Education and Technology
Advanced Education and Technology ◊ 2006-07 Annual Report58
Min
istr
y of
Adva
nced
Edu
catio
n an
d Te
chno
logy
Internal Government Transfers
Assistance to Post-Secondary Institutions
Gain (Loss) on Disposal of Tangible Assets
Access to the Future Fund
Write-down of Tangible Capital Assets
Revenues
Expenses - Directly Incurred
Transfers from Government of Canada
Investment Income
Premiums, Fees and Licenses
Increase in Equity in Public Post-Secondary Institutions
Other Revenue
Post-Secondary Facilities Infrastructure
Support to Post-Secondary Learners
Alberta Centennial Education Savings Plan
Apprenticeship Delivery
Innovation Capacity
Innovation Implementation
Alberta Research Council Inc.
iCORE Inc.
Ministry Support Services
Program Delivery Support
Dedicated Revenue Shortfalls
Ministry Expense
Ministry Net Operating Results
Equipment and Inventory Purchases
$
$
$
$
$
$
$
$
$
$
$
$
2007
Estimates AdjustmentsAuthorized
Supplementary(b)(a)
AuthorizedBudget(in thousands)
163,159 — — 163,159
254,147 — — 254,147
8,500 — — 8,500
5,209 — 1,500 6,709
— — — —
44,984 — — 44,984
475,999 — 1,500 477,499
1,597,039 — 66,200 1,663,239
45,000 — — 45,000
277,143 — 118,300 395,443
176,352 — (45,085) 131,267
19,500 — (11,325) 8,175
27,129 — 1,500 28,629
68,888 — 25,000 93,888
27,639 — (1,200) 26,439
68,451 — — 68,451
11,438 — — 11,438
26,513 — (1,000) 25,513
38,757 — — 38,757
— (1,760) — (1,760)
2,383,849 (1,760) 152,390 2,534,479
— — — —
— — — —
(1,907,850) 1,760 (150,890) (2,056,980)
10,376 — — 10,376
Schedule 3 Budget
(a) Estimates have been restated to reflect the following:�$0.996 million transfer to the Ministry of Employment, Immigration and Industry and $0.2 million transfer to the Ministry of
Treasury Board as a result of the Government Reorganization announced on December 13, 2006 (Note 3), and�$4.0 million transfer of appropriation from Alberta Infrastructure and Transportation for emerging capital purposes.
(b) Supplementary estimates were approved on September 8, 2006 and March 23, 2007. Treasury Board approval is pursuant to section 24(2) of the Financial Administration Act (for dedicated revenue initiatives).
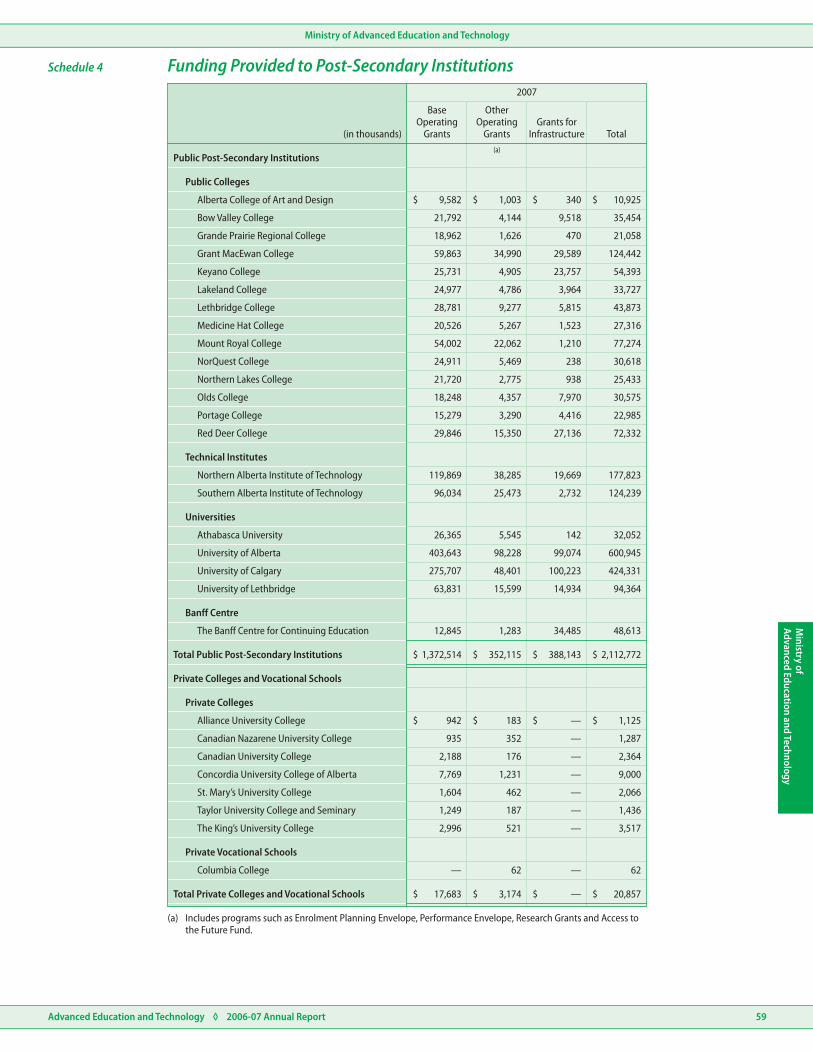
Ministry of Advanced Education and Technology
Advanced Education and Technology ◊ 2006-07 Annual Report 59
Ministry of
Advanced Education and Technology
Public Colleges
Medicine Hat College
Mount Royal College
Public Post-Secondary Institutions
Alberta College of Art and Design
Bow Valley College
Grande Prairie Regional College
Grant MacEwan College
Keyano College
Lakeland College
Lethbridge College
NorQuest College
Northern Lakes College
Olds College
Portage College
Red Deer College
Technical Institutes
Universities
Banff Centre
Northern Alberta Institute of Technology
Athabasca University
The Banff Centre for Continuing Education
Total Public Post-Secondary Institutions
University of Calgary
Southern Alberta Institute of Technology
University of Alberta
University of Lethbridge
Private Colleges and Vocational Schools
Private Colleges
Private Vocational Schools
Alliance University College
Columbia College
Canadian Nazarene University College
Canadian University College
Concordia University College of Alberta
St. Mary’s University College
Taylor University College and Seminary
The King’s University College
Total Private Colleges and Vocational Schools
$
$
$
$
$
$
$
$
$
$
$
$
$
$
$
$
2007
BaseOperating
Grants
OtherOperating
GrantsGrants for
Infrastructure(a)
Total(in thousands)
9,582 1,003 340 10,925
21,792 4,144 9,518 35,454
18,962 1,626 470 21,058
59,863 34,990 29,589 124,442
25,731 4,905 23,757 54,393
24,977 4,786 3,964 33,727
28,781 9,277 5,815 43,873
20,526 5,267 1,523 27,316
54,002 22,062 1,210 77,274
24,911 5,469 238 30,618
21,720 2,775 938 25,433
18,248 4,357 7,970 30,575
15,279 3,290 4,416 22,985
29,846 15,350 27,136 72,332
119,869 38,285 19,669 177,823
96,034 25,473 2,732 124,239
26,365 5,545 142 32,052
403,643 98,228 99,074 600,945
275,707 48,401 100,223 424,331
63,831 15,599 14,934 94,364
12,845 1,283 34,485 48,613
1,372,514 352,115 388,143 2,112,772
942 183 — 1,125
935 352 — 1,287
2,188 176 — 2,364
7,769 1,231 — 9,000
1,604 462 — 2,066
1,249 187 — 1,436
2,996 521 — 3,517
— 62 — 62
17,683 3,174 — 20,857
Schedule 4 Funding Provided to Post-Secondary Institutions
(a) Includes programs such as Enrolment Planning Envelope, Performance Envelope, Research Grants and Access to the Future Fund.
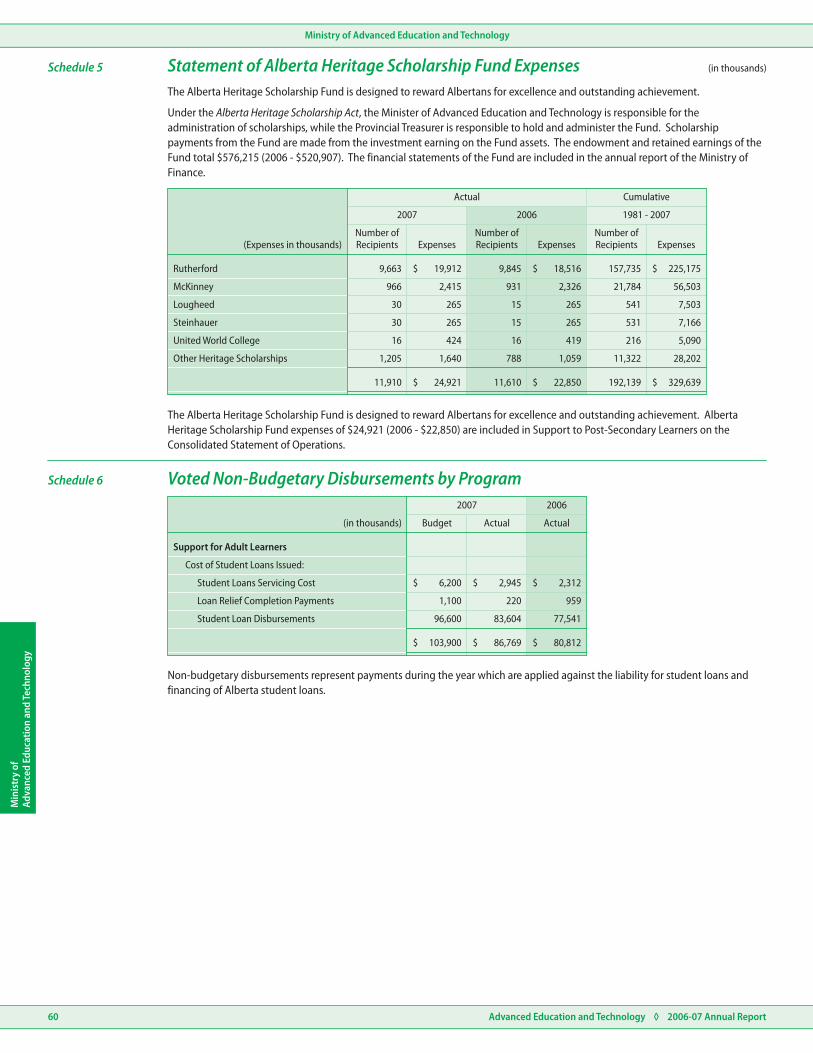
Ministry of Advanced Education and Technology
Advanced Education and Technology ◊ 2006-07 Annual Report60
Min
istr
y of
Adva
nced
Edu
catio
n an
d Te
chno
logy
Rutherford
McKinney
Lougheed
Steinhauer
United World College
Other Heritage Scholarships
$
$
$ $
$ $
2007
Number ofRecipients
Number ofRecipients
Number ofRecipients
Actual
Expenses Expenses Expenses
2006
Cumulative
1981 - 2007
(Expenses in thousands)
Support for Adult Learners
Cost of Student Loans Issued:
Student Loans Servicing Cost
Loan Relief Completion Payments
Student Loan Disbursements
$
$
$
$
$
$
2007
Budget Actual Actual
2006
(in thousands)
9,663 19,912 9,845 18,516 157,735 225,175
966 2,415 931 2,326 21,784 56,503
30 265 15 265 541 7,503
30 265 15 265 531 7,166
16 424 16 419 216 5,090
1,205 1,640 788 1,059 11,322 28,202
11,910 24,921 11,610 22,850 192,139 329,639
6,200 2,945 2,312
1,100 220 959
96,600 83,604 77,541
103,900 86,769 80,812
(in thousands)
The Alberta Heritage Scholarship Fund is designed to reward Albertans for excellence and outstanding achievement.
Under the Alberta Heritage Scholarship Act, the Minister of Advanced Education and Technology is responsible for the administration of scholarships, while the Provincial Treasurer is responsible to hold and administer the Fund. Scholarship payments from the Fund are made from the investment earning on the Fund assets. The endowment and retained earnings of the Fund total $576,215 (2006 - $520,907). The financial statements of the Fund are included in the annual report of the Ministry of Finance.
The Alberta Heritage Scholarship Fund is designed to reward Albertans for excellence and outstanding achievement. Alberta Heritage Scholarship Fund expenses of $24,921 (2006 - $22,850) are included in Support to Post-Secondary Learners on the Consolidated Statement of Operations.
Schedule 5
Schedule 6
Statement of Alberta Heritage Scholarship Fund Expenses
Voted Non-Budgetary Disbursements by Program
Non-budgetary disbursements represent payments during the year which are applied against the liability for student loans and financing of Alberta student loans.
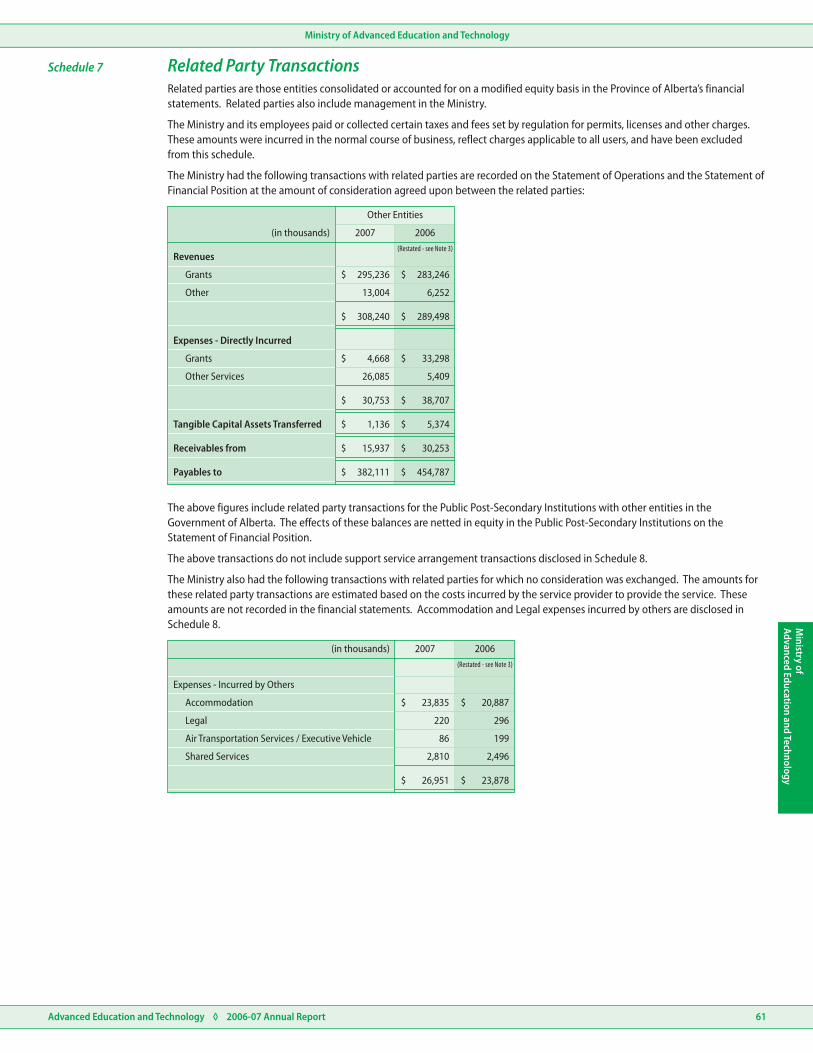
Ministry of Advanced Education and Technology
Advanced Education and Technology ◊ 2006-07 Annual Report 61
Ministry of
Advanced Education and Technology
Revenues
Expenses - Directly Incurred
Tangible Capital Assets Transferred
Receivables from
Payables to
Expenses - Incurred by Others
Grants
Grants
Accommodation
Other
Other Services
Legal
Air Transportation Services / Executive Vehicle
Shared Services
23,835
220
26,951
86
2,810
20,887
296
23,878
199
2,496
$
$
$
$
$
$
$
$
$
$
$
$
$
$
$
$
$
$
2007
Other Entities
2007
(Restated - see Note 3)
(Restated - see Note 3)
2006
2006
(in thousands)
(in thousands)
295,236 283,246
13,004 6,252
308,240 289,498
4,668 33,298
26,085 5,409
30,753 38,707
1,136 5,374
15,937 30,253
382,111 454,787
Related parties are those entities consolidated or accounted for on a modified equity basis in the Province of Alberta’s financial statements. Related parties also include management in the Ministry.
The Ministry and its employees paid or collected certain taxes and fees set by regulation for permits, licenses and other charges. These amounts were incurred in the normal course of business, reflect charges applicable to all users, and have been excluded from this schedule.
The Ministry had the following transactions with related parties are recorded on the Statement of Operations and the Statement of Financial Position at the amount of consideration agreed upon between the related parties:
The above figures include related party transactions for the Public Post-Secondary Institutions with other entities in the Government of Alberta. The effects of these balances are netted in equity in the Public Post-Secondary Institutions on the Statement of Financial Position.
The above transactions do not include support service arrangement transactions disclosed in Schedule 8.
The Ministry also had the following transactions with related parties for which no consideration was exchanged. The amounts for these related party transactions are estimated based on the costs incurred by the service provider to provide the service. These amounts are not recorded in the financial statements. Accommodation and Legal expenses incurred by others are disclosed in Schedule 8.
Schedule 7 Related Party Transactions

Ministry of Advanced Education and Technology
Advanced Education and Technology ◊ 2006-07 Annual Report62
Min
istr
y of
Adva
nced
Edu
catio
n an
d Te
chno
logy
Program
Assistance to the Post-Secondary Institutions
Post-Secondary Facilities Infrastructure
Support to Post-Secondary Learners
Innovation Capacity
Alberta Research Council Inc.
Access to the Future Fund
Program Delivery Support
Apprenticeship Delivery
Ministry Support Services
Innovation Implementation
iCORE Inc.
Alberta Centennial Education Savings Plan
$ $ $ $
$ $ $ $
$
$
ExpensesAccommodation
CostsLegal
Services
Expenses - Incurred by Others
TotalExpenses
TotalExpenses
2007 2006
(in thousands)(Restated - see Note 3)(c)(b)(a)
1,677,538 — — 1,677,538 1,445,090
395,441 — — 395,441 187,509
109,823 1,319 17 111,159 121,771
92,193 498 82 92,773 72,536
64,236 16,642 — 80,878 76,965
42,503 — — 42,503 —
38,757 933 2 39,692 35,113
24,560 2,427 35 27,022 25,182
23,131 1,730 56 24,917 21,195
21,809 286 28 22,123 48,049
10,865 — — 10,865 11,262
7,723 — — 7,723 2,801
2,508,579 23,835 220 2,532,634 2,047,473
(a) Expenses – Directly Incurred as per Statement of Operations. Support to post-secondary learners includes provision for future costs of student loans issued and Alberta Centennial Education Savings Plan (ACES).
(b) Costs shown for Accommodation on Schedule 7 are allocated based on proportion of full time employees.(c) Costs shown for Legal Services on Schedule 7, allocated by estimated costs incurred by each program.
Schedule 8 Allocated Costs

Department of Advanced Education and Technology
Advanced Education and Technology ◊ 2006-07 Annual Report 63
Departm
ent ofAdvanced Education and Technology
Auditor’s Report
Statement of Operations
Statement of Financial Position
Statement of Cash Flows
Notes to the Financial Statements
Schedules to the Financial Statements
Revenues
Dedicated Revenue Initiatives
Schedule 1
2
3
4
5
6
7
8
Expenses - Directly Incurred Detailed by Object
Budget
Comparison of Directly Incurred , Equipment/Inventory Purchases,Statutory Expenses and Non-Budgetary Disbursements by Element toAuthorized Budget
Expenses
Salaries and Benefits Disclosure
Related Party Transactions
Allocated Costs
Department of Advanced Education and Technology
Audited Information
Financial Statements
March 31, 2007
Advanced Education and Technology ◊ 2006-07 Annual Report64
Department of Advanced Education and Technology
Dep
artm
ent o
fAd
vanc
ed E
duca
tion
and
Tech
nolo
gy
To the Minister of Advanced Education and Technology
I have audited the statement of financial position of the Department of Advanced Education and Technology as at March 31, 2007 and the statements of operations and cash flows for the year then ended. These financial statements are the responsibility of the Department’s management. My responsibility is to express an opinion on these financial statements based on my audit.I conducted my audit in accordance with Canadian generally accepted auditing standards. Those standards require that I plan and perform an audit to obtain reasonable assurance whether the financial statements are free of material misstatement. An audit includes examining, on a test basis, evidence supporting the amounts and disclosures in the financial statements. An audit also includes assessing the accounting principles used and significant estimates made by management, as well as evaluating the overall financial statement presentation.In my opinion, these financial statements present fairly, in all material respects, the financial position of the Department as at March 31, 2007 and the results of its operations and its cash flows for the year then ended in accordance with Canadian generally accepted accounting principles.
Fred J. Dunn, FCAAuditor General
original signed by
Edmonton, AlbertaMay 22, 2007
Auditor’s Report

Advanced Education and Technology ◊ 2006-07 Annual Report 65
Department of Advanced Education and Technology
Departm
ent ofAdvanced Education and Technology
Revenues (Schedule 1)
Internal Government Transfers
Transfers from Government of Canada
Investment Income
Premiums, Fees and Licenses
Other Revenue
Expenses - Directly Incurred (Note 2b & Schedules 3 & 5)
Assistance to Post-Secondary Institutions
Post-Secondary Facilities Infrastructure
Support to Post-Secondary Learners
Voted
Innovation Capacity
Program Delivery Support
Apprenticeship Delivery
Ministry Support Services
Innovation Implementation
Statutory
Alberta Heritage Scholarships
Valuation Adjustments
Provision for Future Cost of Student Loans Issued
Valuation Adjustments and Other Provisions
Alberta Centennial Education Savings Plan
Net Operating Results
Gain on Disposal of Tangible Capital Assets
Total Voted and Statutory Expense
$
$
$
$
$
$
2007
Budget(Schedule 4) (Restated - see Note 3)
Actual Actual
2006
(in thousands)
129,409 128,878 120,088
254,147 227,565 214,054
8,000 7,858 5,767
5,209 6,744 4,562
2,526 8,203 3,705
399,291 379,248 348,176
1,597,039 1,677,538 1,444,245
277,143 395,441 187,509
80,326 103,038 83,363
106,550 68,690 72,704
55,989 50,159 74,002
38,757 38,757 35,113
27,129 24,560 23,203
26,513 23,131 20,081
2,209,446 2,381,314 1,940,220
25,452 24,921 22,850
19,500 7,723 2,801
44,345 15,671 24,602
5 541 336
89,302 48,856 50,589
2,298,748 2,430,170 1,990,809
— — 40
(1,899,457) (2,050,922) (1,642,593)
The accompanying notes and schedules are part of these financial statements.
for the year ended March 31, 2007Statement of Operations

Advanced Education and Technology ◊ 2006-07 Annual Report66
Department of Advanced Education and Technology
Dep
artm
ent o
fAd
vanc
ed E
duca
tion
and
Tech
nolo
gy
(Restated - see Note 3)Assets
Liabilities
Cash
Loans Receivable (Note 5)
Tangible Capital Assets (Note 6)
Accounts Payable and Accrued Liabilities (Note 7)
Unearned Revenue (Note 8)
Liability for Student Loans Issued (Note 9)
Deferred Contributions
Accounts Receivable (Note 4)
Net Assets
Net Operating Results
Net Transfer from General Revenues
Net Assets at End of Year
Net Assets at Beginning of Year
$
$
$
$
$
$
$
$
2007 2006(in thousands)
5,830 4,316
14,934 13,191
188,172 152,550
21,543 19,729
230,479 189,786
120,915 63,766
52,346 1,006
817 697
5,422 9,241
179,500 74,710
115,076 43,119
(2,050,922) (1,642,593)
1,986,825 1,714,550
50,979 115,076
230,479 189,786
as at March 31, 2007Statement of Financial Position
The accompanying notes and schedules are part of these financial statements.

Advanced Education and Technology ◊ 2006-07 Annual Report 67
Department of Advanced Education and Technology
Departm
ent ofAdvanced Education and Technology
(Restated - see Note 3)Operating Transactions
Capital Transactions
Investing Transactions
Financing Transactions
Net Operating Results
Acquisition of Tangible Capital Assets
Net Change in Loans Receivable
Net Transfer from General Revenues
Capital Assets Transferred to Other Ministries
Applied to Capital Transactions
Applied to Investing Transactions
Non-cash Items included in Net Operating Results
Amortization
Provision for Future Cost of Student Loans Issued
Valuation Adjustments and Other Provisions
Gain on Disposal of Tangible Capital Assets
Net Change in Liability for Student Loans Issued
Increase in Accounts Receivable
Increase (Decrease) in Accounts Payable and Accrued Liabilities
Decrease in Holdback Liability
Increase in Unearned Revenue
Increase in Deferred Contributions
Applied to Operating Transactions
Increase (Decrease) in Cash
Cash, Beginning of Year
Cash, End of Year
$
$
$
$
2007 2006(in thousands)
(2,050,922) (1,642,593)
2,103 1,288
— (40)
15,671 24,602
541 336
(2,032,607) (1,616,407)
(1,522) (1,530)
(1,743) (1,787)
56,608 (50,323)
— (485)
51,340 444
120 67
(1,927,804) (1,670,021)
(5,053) (5,856)
1,136 996
(3,917) (4,860)
(53,590) (54,445)
(53,590) (54,445)
1,986,825 1,714,550
1,514 (14,776)
4,316 19,092
5,830 4,316
for the year ended March 31, 2007Statement of Cash Flows
The accompanying notes and schedules are part of these financial statements.

Advanced Education and Technology ◊ 2006-07 Annual Report68
Department of Advanced Education and Technology
Dep
artm
ent o
fAd
vanc
ed E
duca
tion
and
Tech
nolo
gy
March 31, 2007
Note 1 Authority and Purpose
Notes to the Financial Statements
The Department of Advanced Education and Technology operates under the authority of the Government Organization Act, Chapter G-10, revised Statutes of Alberta 2000.
In support of Alberta’s vision, Advanced Education and Technology’s purpose is to assist Alberta to be a learning and innovative society.
Note 2 Summary of Significant Accounting Policies and Reporting PracticesThese financial statements are prepared in accordance with Canadian generally accepted accounting principles for the public sector as recommended by the Public Sector Accounting Board of the Canadian Institute of Chartered Accountants.
The reporting entity is the Department of Advanced Education and Technology, which is part of the Ministry of Advanced Education and Technology and for which the Minister of Advanced Education and Technology is accountable. Other entities reporting to the Minister are the Access to the Future Fund (AFF), the Alberta Research Council Inc. (ARC) and the Informatics Circle of Research Excellence Inc. (iCORE). Entities accountable to the Minister are the Public Post-Secondary Institutions (universities, technical institutes, public colleges and the Banff Centre for Continuing Education). The activities of iCORE, ARC, AFF and the Public Post-Secondary Institutions are not included in these financial statements.
The Ministry Annual Report provides a more comprehensive accounting of the financial position and results of the Ministry’s operations for which the Minister is accountable.
All departments of the Government of Alberta operate within the General Revenue Fund (the Fund). The Fund is administered by the Minister of Finance. All cash receipts of departments are deposited into the Fund and all cash disbursements made by departments are paid from the Fund. Net transfer from General Revenues is the difference between all cash receipts and all cash disbursements made.
All revenues are reported on the accrual basis of accounting. Cash received for which goods or services have not been provided by year end is recorded as unearned revenue.
Internal government transfers are transfers between entities within the government reporting entity where the entity making the transfer does not receive any goods or services directly in return.
Transfers from Government of Canada are recognized as revenues when authorized by federal legislation or federal/provincial agreements, eligibility criteria if any are met, and a reasonable estimate of the amounts can be made. Overpayments relating to Canada Social Transfer entitlements and transfers received before revenue recognition criteria have been met are included in accounts payable and accrued liabilities.
Dedicated revenue initiatives provide a basis for authorizing spending. Dedicated revenues are shown as credits or recoveries in the details of the Government Estimates for a supply vote. If budgeted revenues are not fully realized, spending is reduced by an equivalent amount. If actual dedicated revenues exceed budget, the Department may, with approval of the Treasury Board, use the excess revenue to fund additional expenses on the program. Schedule 2 discloses information on the Department’s dedicated revenue initiatives.
Directly incurred expenses are those costs the Department has primary responsibility and accountability for, as reflected in the Government’s budget documents.
(a) Reporting Entity
(b) Basis of Financial ReportingRevenues
Internal Government Transfers
Transfers from Government of Canada
Dedicated Revenue
ExpensesDirectly Incurred

Advanced Education and Technology ◊ 2006-07 Annual Report 69
Department of Advanced Education and Technology
Departm
ent ofAdvanced Education and Technology
Note 2 Summary of Significant Accounting Policies and Reporting Practices (continued)
In addition to program operating expenses such as salaries and supplies, directly incurred expenses also include:
amortization of tangible capital assets.
pension costs which comprise the cost of employer contributions for current service of employees during the year.
valuation adjustments which include changes in the valuation allowances are used to reflect financial assets at their net recoverable or other appropriate value. Valuation adjustments also represent the change in management’s estimate of future payments arising from obligations relating to student loans, vacation pay and project abandonment.
Grants are recognized as expenses when authorized, eligibility criteria if any are met, and a reasonable estimate of the amounts can be made.
Services contributed by other entities in support of the Department operations are disclosed in Schedule 8.
Financial assets of the Department are limited to financial claims, such as advances to and receivables from other organizations, employees, students and other individuals.
Loans receivable are recorded at cost net of the allowance for loan relief completion payments and the allowance for impaired loans.
Tangible capital assets of the Department are recorded at historical cost and amortized on a straight-line basis over the estimated useful lives of the assets. The threshold for capitalizing new systems development is $100,000 and the threshold for all other tangible capital assets is $5,000.
Liabilities are recorded to the extent that they represent present obligations as a result of events and transactions occurring prior to the end of fiscal year. The settlement of liabilities will result in sacrifice of economic benefits in the future. They include the Department’s obligations for future payments under the Student Financial Assistance Act for guarantees, remissions, risk premiums and interest.
Net assets represent the difference between the carrying value of assets held by the Department and its liabilities.
(in thousands)
Measurement uncertainty exists when there is variance between the recognized or disclosed amount and another reasonably possible amount.
The liability for student loans issued amounting to $5,422 (2006 - $9,241), the allowance for loan relief completion payments amounting to $46,318 (2006 - $54,191) and the allowance for impaired loans amounting to $25,510 (2006 - $33,621).
The Department has made certain estimates in the following areas:
The number of students exceeding their maximum debt limit in determining the allowance for loan relief completion payments.
Recovery and default rates in the determination of the allowance for impaired loans.
Future interest, recovery and default rates in the determination of the liability for student loans.
Changes in these estimates could materially impact the liability for student loans issued, the allowance for loan relief completion payments and the allowance for impaired loans. Note 9 discloses information on the liability for student loans issued.
Fair value is the amount of consideration agreed upon in an arm’s length transaction between knowledgeable, willing parties who are under no compulsion to act.
The fair values of cash, accounts receivable, advances, accounts payable and accrued liabilities and unearned revenue are estimated to approximate their carrying values because of the short-term nature of these instruments.
The fair values of loans receivable and liability for student loans issued are not reported as there is no organized financial market for all of the instruments and it is not practicable within constraints of timeliness or cost to estimate the fair values with sufficient reliability.
�
�
�
Incurred by Others
Assets
Liabilities
Net Assets
Measurement Uncertainty
�
�
�
Valuation of Financial Assets and Liabilities

Advanced Education and Technology ◊ 2006-07 Annual Report70
Department of Advanced Education and Technology
Dep
artm
ent o
fAd
vanc
ed E
duca
tion
and
Tech
nolo
gy
Net assets from the former Department of Advanced Education
Net liabilities from the former Department of Innovation and Science
Transfer to the Department of Employment, Immigration and Industry
Net assets at March 31, 2005
$
$
(in thousands)
81,385
(38,354)
88
43,119
Government of Canada
Other
Accrued Interest Receivable on Loans
$
$
$
$
2007(Restated - see Note 3)
2006(in thousands)
11,986 11,272
1,253 784
1,695 1,135
14,934 13,191
The Department of Advanced Education and Technology was established as a result of a restructuring of government ministries announced on December 13, 2006 and other transfers of responsibilities to and from other departments. Comparative figures for 2006 have been restated as if the Department had always been assigned with its current responsibilities. Net assets on March 31, 2005 are made up as follows:
Accounts receivable are unsecured and non-interest bearing.
As a result of government restructuring, the following changes in the responsibility were made:
The Department of Innovation and Science and the Department of Advanced Education were transferred to the Department of Advanced Education and Technology on December 15, 2006 (O.C. 637/2006).
The International Qualifications Assessment Services program was transferred from the Department of Advanced Education to the Department of the Employment, Immigration and Industry on December 15, 2006 (O.C. 637/2006).
Responsibility for the Standing Policy Committee on Learning and Employment program was transferred from the Department of Advanced Education and Technology to the Department of the Employment, Immigration and Industry on January 23, 2007 (O.C. 24/2007).
�
�
�
Note 3
Program Transfer
Government Reorganization
Note 4 Accounts Receivable

Advanced Education and Technology ◊ 2006-07 Annual Report 71
Department of Advanced Education and Technology
Departm
ent ofAdvanced Education and Technology
(a) Equipment includes office equipment.(b) Historical cost included work-in-progress at March 31, 2007 totaling $15,103 (2006 - $11,829) comprised of: computer software
development projects.
Loans Receivable
Less:
Allowance for Loan Relief
Completion Payments
Allowance for Impaired Loans
$
$
$
$
2007 2006(in thousands)
260,000 240,362
(46,318) (54,191)
(25,510) (33,621)
188,172 152,550
Estimated Useful Life
Historical Cost (b)
Beginning of year
Additions
Disposals, including write-downs
Transfers to Alberta Government Departments and Agencies
Accumulated Amortization
Beginning of year
Amortization expense
Effect of disposals
Net Book Value at March 31, 2007
Net Book Value at March 31, 2006
5-10 years 3-10 years
$ $ $
$ $
$
$
$
Equipment
ComputerHardware
and Software Total
2007
Total
2006
(in thousands)(Restated - see Note 3)(a)
80 25,377 25,457 20,661
967 4,086 5,053 5,856
— — — (64)
(945) (191) (1,136) (996)
102 29,272 29,374 25,457
14 5,714 5,728 4,545
13 2,090 2,103 1,288
— — — (105)
27 7,804 7,831 5,728
75 21,468 21,543
66 19,663 19,729
Note 5 Loans Receivable
Effective August 2001, under the terms of the Alberta Student Loan Program, loans are provided by the Department to qualifying students at interest rates prescribed by the Minister of Advanced Education and Technology.
Loans become payable and interest is earned when students discontinue their studies or graduate. Loans bear interest at either a fixed rate of prime plus 5% or floating rate based on prime plus 2.5% and are repayable to a maximum term of 114 months. When loans receivable are classified as impaired, interest ceases to accrue. Loans are unsecured.
Loans receivable are stated at cost net of the allowance for loan relief completion payments and the allowance for impaired loans. Loan relief completion payments on Alberta Student Loans are available to students who complete their studies and have assumed a total combined indebtedness of Canada and Alberta Student Loans exceeding established debt limits.
The allowance for impaired loans is a general provision that estimates the amount of loans receivable that will be impaired. The key assumptions used to determine this provision are default and recovery rates.
Loans receivable are classified as impaired when:
there is no longer reasonable assurance as to the timely collection of the full amount of principal or interest, or
the borrower has failed to make payments for a period of 150 days, or
interest is owing to the Province for a period of 180 days.
�
�
�
Note 6 Tangible Capital Assets
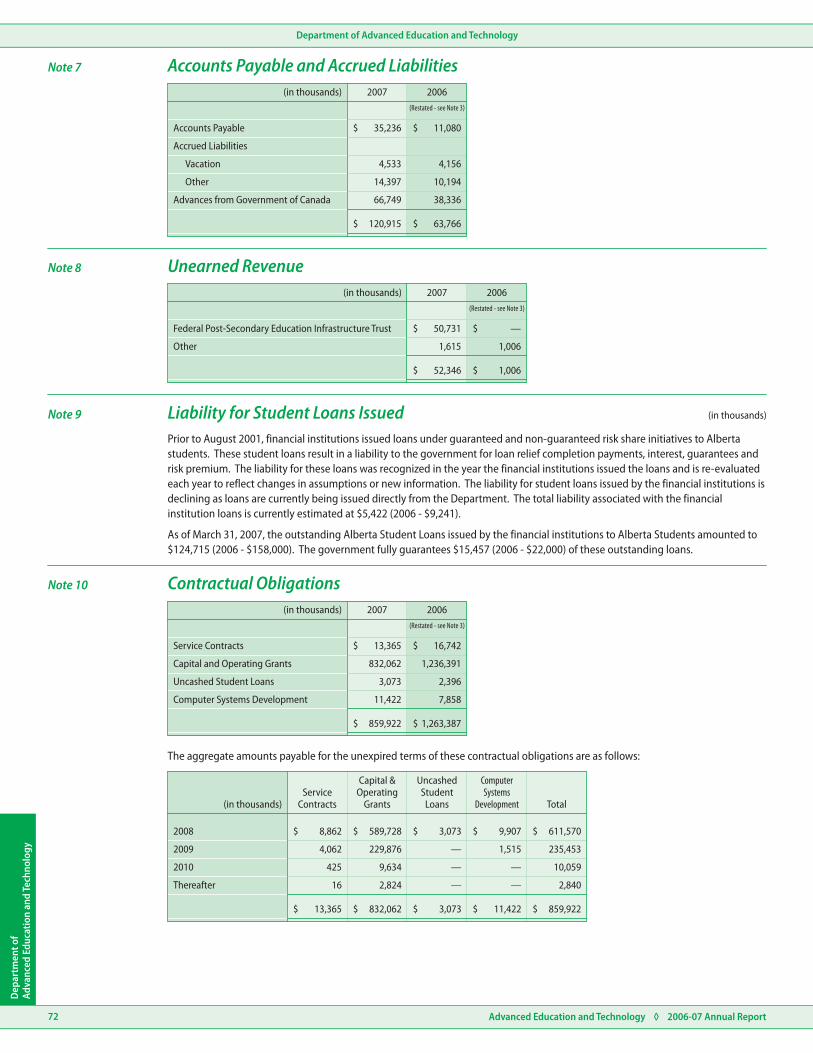
Advanced Education and Technology ◊ 2006-07 Annual Report72
Department of Advanced Education and Technology
Dep
artm
ent o
fAd
vanc
ed E
duca
tion
and
Tech
nolo
gy
Accounts Payable
Accrued Liabilities
Federal Post-Secondary Education Infrastructure Trust
Vacation
Other
Other
Advances from Government of Canada
35,236
50,731
4,533
14,397
1,615
120,915
52,346
66,749
11,080
—
4,156
10,194
1,006
63,766
1,006
38,336
$
$
$
$
$
$
$
$
2007
2007
(Restated - see Note 3)
(Restated - see Note 3)
2006
2006
(in thousands)
(in thousands)
2008
2009
2010
Thereafter
$ $ $ $ $
$ $ $ $ $
ServiceContracts
Capital &Operating
Grants
UncashedStudent
Loans
ComputerSystems
Development Total
(Restated - see Note 3)
(in thousands)
Service Contracts
Capital and Operating Grants
Uncashed Student Loans
Computer Systems Development
13,365
832,062
3,073
859,922
11,422
16,742
1,236,391
2,396
1,263,387
7,858
$
$
$
$
2007 2006(in thousands)
8,862 589,728 3,073 9,907 611,570
4,062 229,876 — 1,515 235,453
425 9,634 — — 10,059
16 2,824 — — 2,840
13,365 832,062 3,073 11,422 859,922
Note 7
Note 8
Accounts Payable and Accrued Liabilities
Unearned Revenue
Note 9 (in thousands)Liability for Student Loans IssuedPrior to August 2001, financial institutions issued loans under guaranteed and non-guaranteed risk share initiatives to Alberta students. These student loans result in a liability to the government for loan relief completion payments, interest, guarantees and risk premium. The liability for these loans was recognized in the year the financial institutions issued the loans and is re-evaluated each year to reflect changes in assumptions or new information. The liability for student loans issued by the financial institutions is declining as loans are currently being issued directly from the Department. The total liability associated with the financial institution loans is currently estimated at $5,422 (2006 - $9,241).
As of March 31, 2007, the outstanding Alberta Student Loans issued by the financial institutions to Alberta Students amounted to $124,715 (2006 - $158,000). The government fully guarantees $15,457 (2006 - $22,000) of these outstanding loans.
Note 10 Contractual Obligations
The aggregate amounts payable for the unexpired terms of these contractual obligations are as follows:

Advanced Education and Technology ◊ 2006-07 Annual Report 73
Department of Advanced Education and Technology
Departm
ent ofAdvanced Education and Technology
Canadian Millennium Scholarship Foundation
Canadian Millennium Scholarships
Government of Canada
Canada Study Grants
Canada Access Grants
French Minority Language Education and French Second Language Instruction
27,203
7,309
44,780
4,455
5,813
26,839
8,692
41,123
3,964
1,628
$
$
$
$
2007 2006(in thousands)
Note 11 (in thousands)Contingent LiabilitiesAt March 31, 2007, the Department of Advanced Education and Technology is a defendant in two legal claims (2006 Restated - See Note 3 - two legal claims). These claims have specified amounts totaling $51,200 (2006 Restated - See Note 3 two claims with specified amounts totaling $51,200). The resulting loss, if any, from these claims cannot be determined.
Note 14
Note 15
Note 13 (in thousands)
Comparative Figures
Approval of Financial Statements
Defined Benefit Plans
Certain 2006 figures have been reclassified to conform to the 2007 presentation.
The financial statements were approved by the Senior Financial Officer and the Deputy Minister.
The Department participates in the multi-employer Management Employees Pension Plan and Public Service Pension Plan. The Department also participates in the multi-employer Supplementary Retirement Plan for Public Service Managers. The expense for these pension plans is equivalent to the annual contributions of $3,864 for the year ended March 31, 2007 (2006 Restated - See Note 3 - $3,474).
At December 31, 2006, the Management Employees Pension Plan reported a deficiency of $6,765 (2005 - $165,895) and the Public Service Pension Plan reported a surplus of $153,024 (2005 - $187,704). At December 31, 2006, the Supplementary Retirement Plan for Public Service Managers had a surplus of $3,698 (2005 - $10,018).
The Department also participates in two multi-employer Long Term Disability Income Continuance Plans. At March 31, 2007, the Bargaining Unit Plan reported an actuarial surplus of $153 (2006 - $8,699) and the Management, Opted Out and Excluded Plan an actuarial surplus of $10,148 (2006 - $8,309). The expense for these two plans is limited to employer’s annual contributions for the year.
Note 12 (in thousands)Payments Under AgreementThe Department has entered into agreements to deliver programs that are fully funded by the Government of Canada. Costs incurred under these agreements are made by the Department under authority of the Financial Administration Act, Section 25. Accounts receivable includes $8,851 (2006 - $7,767) and accounts payable and accrued liabilities includes $4,524 (2006 - $2,211) relating to payments under agreement.
Amounts paid and payable under agreements on behalf of the Government of Canada:

Advanced Education and Technology ◊ 2006-07 Annual Report74
Department of Advanced Education and Technology
Dep
artm
ent o
fAd
vanc
ed E
duca
tion
and
Tech
nolo
gy
Lottery Fund
Canada Social Transfers
Interest on Student Loans Issued
Marketing Apprenticeship
Trade School License Fee
Refunds of Expenditure
Internal Government Transfers
Transfers from Government of Canada
Investment Income
Premiums, Fees and Licenses
Other Revenue
Alberta Heritage Scholarship Fund
Canada Student Loans Administration
Post-Secondary Education Infrastructure Trust
Other
Other
Other
Miscellaneous
$
$
$
$
$
$
2007
Budget Actual(Restated - see Note 3)
Actual
2006
(in thousands)
25,452 24,921 22,850
103,957 103,957 97,238
129,409 128,878 120,088
243,986 175,105 210,726
1,781 1,101 1,843
— 50,577 —
8,380 782 1,485
254,147 227,565 214,054
8,000 7,858 5,695
— — 72
8,000 7,858 5,767
5,000 6,530 4,399
160 158 163
49 56 —
5,209 6,744 4,562
— 3,438 3,289
2,526 4,765 416
2,526 8,203 3,705
399,291 379,248 348,176
Schedule 1 Revenues
for the year ended March 31, 2007Schedules to the Financial Statements

Advanced Education and Technology ◊ 2006-07 Annual Report 75
Department of Advanced Education and Technology
Departm
ent ofAdvanced Education and Technology
Innovation Capacity (a)
Life Sciences Research
Energy Research
Support for Adult Learning (b & d)
Marketing Apprenticeship
Program Delivery Support (c)
Program Delivery Support
$
$
$
$
$
$
2007
AuthorizedDedicatedRevenues
ActualDedicatedRevenues
(Shortfall) /Excess(in thousands)
1,160 420 (740)
370 — (370)
6,500 6,530 30
2,031 1,351 (680)
10,061 8,301 (1,760)
Grants
Voted
Recoveries from Support Service Arrangements with Related Parties (a)
Grants
Valuation Adjustments
Provision for Future Cost of Student Loans Issued
Valuation Adjustments and Other Provisions
Salaries, Wages and Employee Benefits
Supplies and Services
Amortization of Capital Assets
Total Voted Expenses before Recoveries
Other
Less
Statutory
$
$
$
$
$
$
$
$
$
$
$
$
2007
Budget Actual(Restated - see Note 3)
Actual
2006
(in thousands)
47,176 45,040 41,957
57,909 44,071 42,575
2,098,794 2,291,697 1,856,063
246 188 237
5,321 2,103 1,288
2,209,446 2,383,099 1,942,120
— (1,785) (1,900)
2,209,446 2,381,314 1,940,220
44,952 32,644 25,651
44,345 15,671 24,602
5 541 336
89,302 48,856 50,589
The revenue of each dedicated revenue initiative is included in the Department’s revenue.(a) The Department receives reimbursements from the Government of Canada for research grants approved under the Western Economic
Partnership Agreement.(b) Marketing Apprenticeship includes providing certain services in designated trades and occupations, including: assessment of competencies in
designated occupations; the assessment of individuals’ prior work experience, knowledge and skills in a designated trade or occupation (Qualification Certificate Program); and application/record books, prior learning assessments, replacement of certificates in designated trades. It also includes expertise in training and certification programs to other countries; providing consulting services with respect to training and certification to other countries and jurisdictions: and providing apprenticeship seats in Alberta’s institution on a cost recovery basis for Yukon, Northwest Territories and Nunavut apprentices.
(c) The dedicated revenues for program delivery support are amounts received from the Government of Canada and the Canadian Millennium Scholarship Foundation (CMSF) to administer the Canada Student Loans, Grants and the Canadian Millennium Scholarship Foundation bursary program.
(d) Approved at the February 6, 2007 Treasury Board meeting. Treasury Board approval is pursuant to section 24(2) of the Financial Administration Act (for dedicated revenue initiatives).
Schedule 2 Dedicated Revenue Initiatives
(a) The Department provides information technology support services to the Department of Employment, Immigration and Industry $1,785 (2006 - $1,900). Costs for these services are recovered from that Department.
Schedule 3 Expenses - Directly Incurred Detailed by Object

Advanced Education and Technology ◊ 2006-07 Annual Report76
Department of Advanced Education and Technology
Dep
artm
ent o
fAd
vanc
ed E
duca
tion
and
Tech
nolo
gy
Internal Government Transfers
Assistance to Post-Secondary Institutions
Voted Operating Expenses
Revenues
Expenses - Directly Incurred
Transfers from Government of Canada
Investment Income
Premiums, Fees and Licenses
Other Revenue
Post-Secondary Facilities Infrastructure
Support to Post-Secondary Learners
Dedicated Revenue Shortfall (Schedule 2)
Apprenticeship Delivery
Innovation Capacity
Innovation Implementation
Ministry Support Services
Program Delivery Support
Provision for Future Cost of Student Loans Issued
Alberta Heritage Scholarships
Alberta Centennial Education Savings Plan
Valuation Adjustments and Other Provisions
Statutory
Total Expenses
Net Operating Results
Equipment and Inventory Purchases (EIP)
$
$
$
$ $
$ $
$ $
$
$
$
$
$
$
2007
Estimates Adjustments BudgetAuthorized
Supplementary(b)(a)
AuthorizedBudget(in thousands)
129,409 — 129,409 — 129,409
254,147 — 254,147 — 254,147
8,000 — 8,000 — 8,000
5,209 — 5,209 1,500 6,709
2,526 — 2,526 — 2,526
399,291 — 399,291 1,500 400,791
26,513 — 26,513 (1,000) 25,513
38,757 — 38,757 — 38,757
1,597,039 — 1,597,039 66,200 1,663,239
277,143 — 277,143 118,300 395,443
106,550 — 106,550 (31,000) 75,550
27,129 — 27,129 1,500 28,629
80,326 — 80,326 25,000 105,326
55,989 — 55,989 (1,200) 54,789
— (1,760) (1,760) — (1,760)
2,209,446 (1,760) 2,207,686 177,800 2,385,486
44,345 — 44,345 (14,085) 30,260
25,452 — 25,452 — 25,452
19,500 — 19,500 (11,325) 8,175
5 — 5 — 5
2,298,748 (1,760) 2,296,988 152,390 2,449,378
(1,899,457) 1,760 (1,897,697) (150,890) (2,048,587)
4,947 — 4,947 — 4,947
Schedule 4 Budget
(a) Estimates have been restated to reflect the following:�$0.996 million transfer to the Department of Employment, Immigration and Industry and $0.2 million transfer to the
Department of Treasury Board as a result of the Government Reorganization announced on December 13, 2006 (Note 3), and
�$4.0 million transfer of appropriation from Alberta Infrastructure and Transportation for emerging capital purposes.(b) Supplementary estimates were approved on September 8, 2006 and March 23, 2007. Treasury Board approval is pursuant to
section 24(2) of the Financial Administration Act (for dedicated revenue initiatives).

Advanced Education and Technology ◊ 2006-07 Annual Report 77
Department of Advanced Education and Technology
Departm
ent ofAdvanced Education and Technology
1
3
2
1.0.1
3.0.1
2.0.1
1.0.2
3.0.2
2.0.2
1.0.3
3.0.3
2.0.3
1.0.4
3.0.4
2.0.4
1.0.5
3.0.5
1.0.6
3.0.6
1.0.7
3.0.7
1.0.8
3.0.8
1.0.9
3.0.9
1.0.10
1.0.11
1.0.12
Sub-Total
Ministry Support Services
Assistance to Post-Secondary Institutions
Program Delivery Support
Voted Operating Expenses andEquipment/Inventory Purchases
Minister’s Office
Private University Colleges
Program Delivery Support
Minister’s Committees
Technical Institutes
Operating Expense
Operating Expense
Operating Expense
Equipment/Inventory Purchase
Equipment/Inventory Purchase
l
l
l
l
l
l
l
l
l
l
Deputy Minister’s Office
Public Colleges
Equipment/Inventory Purchases
Finance and Administrative Services
Universities
Community Education
Human Resource Services
The Banff Centre for Continuing Education
Expense
System-Wide Planning
Inter-Jurisdiction Programs
Expense funded by Lotteries
Information Management and Technology
Enrolment Planning Envelope
Learning Television
Legislative Services
Performance Envelope
Expense
International and Intergovernmental Relations
Other Program Support
Expense funded by Lotteries
Communications
Amortization of Capital Assets
Amortization of Capital Assets
Sub-Total
Sub-Total
Standing Policy Committee on Education andEmployment
$ $ $ $ $ $
2006-07Estimates Adjustments
2006-07Actual
ExpenseAuthorized
Supplementary(b) (c)(a)
2006-07Authorized
BudgetUnexpended
(Over-expended)(in thousands)
690 — — 690 639 51
212 — — 212 231 (19)
977 — — 977 943 34
8,396 — (1,000) 7,396 6,127 1,269
50 — — 50 65 (15)
1,869 — — 1,869 1,857 12
2,841 — — 2,841 2,194 647
7,771 — — 7,771 7,930 (159)
917 — — 917 630 287
563 — — 563 443 120
1,325 — — 1,325 1,283 42
1,120 — — 1,120 920 200
661 — — 661 457 204
88 — — 88 107 (19)
27,480 — (1,000) 26,480 23,826 2,654
13,895 — — 13,895 14,115 (220)
3,000 — — 3,000 2,913 87
4,086 — — 4,086 4,840 (754)
15,600 — — 15,600 15,600 —
353 — — 353 300 53
2,300 — — 2,300 2,300 —
2,523 — — 2,523 1,602 921
41,757 — — 41,757 41,670 87
16,037 — — 16,037 17,700 (1,663)
215,659 — — 215,659 215,936 (277)
364,311 — — 364,311 376,970 (12,659)
757,387 — — 757,387 769,546 (12,159)
12,773 — — 12,773 12,845 (72)
6,282 — — 6,282 6,255 27
183,120 — 31,700 214,820 213,050 1,770
13,000 — — 13,000 12,995 5
28,470 — 34,500 62,970 52,241 10,729
1,597,039 — 66,200 1,663,239 1,677,538 (14,299)
Schedule 5 Comparison of Directly Incurred Expenses, Equipment/Inventory Purchases,Statutory Expenses and Non-Budgetary Disbursements by Element toAuthorized Budget

Advanced Education and Technology ◊ 2006-07 Annual Report78
Department of Advanced Education and Technology
Dep
artm
ent o
fAd
vanc
ed E
duca
tion
and
Tech
nolo
gy
5
6
7
4
5.0.1
5.0.2
5.0.3
5.0.4
5.0.5
6.0.1
7.0.1
7.0.2
7.0.3
7.0.4
4.0.1
5.0.6
6.0.2
5.0.7
6.0.3
Support to Post-Secondary Learners
Apprenticeship Delivery
Innovation Capacity
Post-Secondary Facilities Infrastructure
Voted Operating Expenses andEquipment/Inventory Purchases
Program Systems Support
Maintenance Grants
Special Needs Bursary
Alberta Opportunities Bursary
l
l
l
l
l
l
l
l
l
l
l
l
l
l
Achievement Scholarships
Apprenticeship Delivery Support
Research Capacity
Energy Research
Life Sciences Research
Information and Communications TechnologyResearch
Post-Secondary Facilities Infrastructure
Expense
Operating Expense
Expense
Expense
Expense
Expense
Expense
Expense funded by Lotteries
Equipment/Inventory Purchases
Expense funded by Lotteries
Expense funded by Lotteries
Expense funded by Lotteries
Expense funded by Lotteries
Expense funded by Lotteries
Student Loan Relief - Benefit
Market Apprenticeship
Rural Incentive Bursary
Amortization of Capital Assets
Sub-Total
Sub-Total
Sub-Total
Sub-Total
2006-07Estimates Adjustments
2006-07Actual
ExpenseAuthorized
Supplementary(b) (c)(a)
2006-07Authorized
BudgetUnexpended
(Over-expended)(in thousands)
261,143 — 118,300 379,443 379,441 2
16,000 — — 16,000 16,000 —
277,143 — 118,300 395,443 395,441 2
11,550 — (2,200) 9,350 7,378 1,972
10,400 — (3,900) 6,500 6,284 216
1,100 — (200) 900 692 208
13,000 — (2,000) 11,000 10,737 263
22,900 — (1,500) 21,400 21,333 67
3,100 — — 3,100 3,100 —
36,400 — (17,600) 18,800 14,812 3,988
8,100 — (3,600) 4,500 4,354 146
106,550 — (31,000) 75,550 68,690 6,860
19,999 — — 19,999 18,009 1,990
430 — — 430 309 121
5,000 — 1,500 6,500 6,513 (13)
2,130 — — 2,130 38 2,092
27,559 — 1,500 29,059 24,869 4,190
4,891 — 2,000 6,891 9,407 (2,516)
21,914 — — 21,914 22,557 (643)
2,407 — 15,000 17,407 12,546 4,861
19,200 — — 19,200 19,200 —
2,771 — 8,000 10,771 10,144 627
14,405 — — 14,405 14,405 —
3,300 — — 3,300 3,984 (684)
11,438 — — 11,438 10,795 643
80,326 — 25,000 105,326 103,038 2,288
Schedule 5 Comparison of Directly Incurred Expenses, Equipment/Inventory Purchases,Statutory Expenses and Non-Budgetary Disbursements by Element toAuthorized Budget (continued)

Advanced Education and Technology ◊ 2006-07 Annual Report 79
Department of Advanced Education and Technology
Departm
ent ofAdvanced Education and Technology
Voted Operating Expenses andEquipment/Inventory Purchases
Statutory Expenses
Total Voted Expenses
Non-Budgetary Disbursements by Program
Total Non-Budgetary Disbursements
8
5
5.0.8
8.0.1
8.0.3
Dedicated Revenue Shortfall (Schedule 2)
8.0.2
5.0.9
5.0.10
Innovation Implementation
Cost of Student Loans Issued
Voted Operating Expenses andEquipment/ Inventory Purchases
Operating Expenses
Provision for Future Cost of Student LoansIssued
Operating Expenses funded by Lotteries
Alberta Heritage Scholarships
Alberta Centennial Education Savings Plan
Equipment Inventory Purchases
Valuation Adjustments and Other Provisions
l
l
Student Loans Servicing Cost
Technology Commercialization Initiatives
Transfer to Alberta Research Council Inc.
Innovation and Service Excellence Program
Operating Expense
Equipment/Inventory Purchases
Loan Relief Completion Payments
Student Loan Disbursements
Total Voted Expenses
Total Statutory Expenses
Sub-Total
2006-07Estimates Adjustments
2006-07Actual
ExpenseAuthorized
Supplementary(b) (c)(a)
2006-07Authorized
BudgetUnexpended
(Over-expended)(in thousands)
$
$
$
$
$
$
$
$
$
$
$
$
$
$
$
$
$
$
$
$
$
$
$
$
$
$
$
$
$
$
$
$
$
$
$
$
$
$
$
$
$
$
12,889 — (1,200) 11,689 12,873 (1,184)
14,750 — — 14,750 8,936 5,814
550 — — 550 1,136 (586)
28,350 — — 28,350 28,350 —
56,539 — (1,200) 55,339 51,295 4,044
— (1,760) — (1,760) — (1,760)
2,214,393 (1,760) 177,800 2,390,433 2,386,367 4,066
2,105,489 (1,760) 177,800 2,281,529 2,277,357 4,172
103,957 — — 103,957 103,957 —
4,947 — — 4,947 5,053 (106)
2,214,393 (1,760) 177,800 2,390,433 2,386,367 4,066
44,345 — (14,085) 30,260 15,671 14,589
25,452 — — 25,452 24,921 531
19,500 — (11,325) 8,175 7,723 452
5 — — 5 541 (536)
89,302 — (25,410) 63,892 48,856 15,036
6,200 — — 6,200 2,945 3,255
1,100 — — 1,100 220 880
96,600 — — 96,600 83,604 12,996
103,900 — — 103,900 86,769 17,131
Schedule 5
(a) Estimates have been restated to reflect the following:�$0.996 million transfer to the Department of Employment, Immigration and Industry and $0.2 million transfer to the Department of
Treasury Board as a result of the Government Reorganization announced on December 13, 2006 (Note 3), and�$4.0 million transfer of appropriation from Alberta Infrastructure and Transportation for emerging capital purposes.
(b) Supplementary estimates were approved on September 8, 2006 and March 23, 2007. Treasury Board approval is pursuant to section 24(2) of the Financial Administration Act (for dedicated revenue initiatives).
(c) Includes achievement bonuses of $1.246 million.
Comparison of Directly Incurred Expenses, Equipment/Inventory Purchases,Statutory Expenses and Non-Budgetary Disbursements by Element toAuthorized Budget (continued)
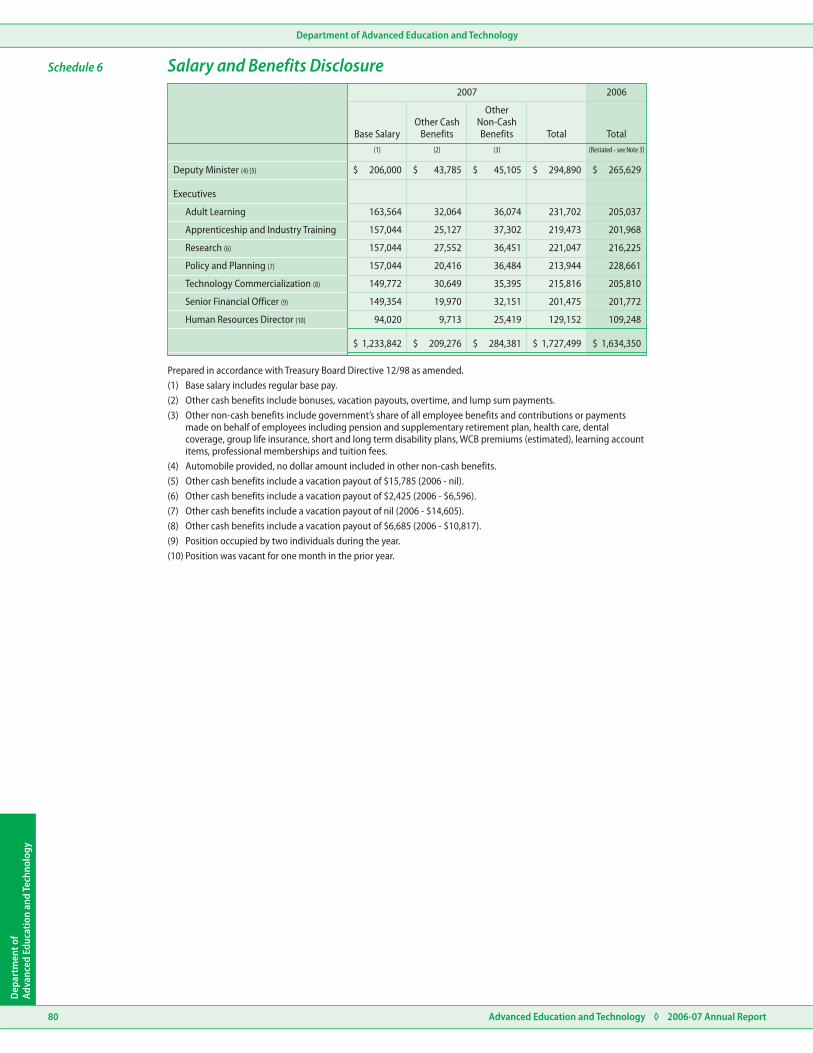
Advanced Education and Technology ◊ 2006-07 Annual Report80
Department of Advanced Education and Technology
Dep
artm
ent o
fAd
vanc
ed E
duca
tion
and
Tech
nolo
gy
Deputy Minister (4) (5)
Executives
Adult Learning
Apprenticeship and Industry Training
Research (6)
Policy and Planning (7)
Technology Commercialization (8)
Senior Financial Officer (9)
Human Resources Director (10)
$
$
$
$
$
$
$
$
$
$
Base SalaryOther Cash
Benefits
OtherNon-CashBenefits Total
2007
Total
2006
(Restated - see Note 3)(1) (2) (3)
206,000 43,785 45,105 294,890 265,629
163,564 32,064 36,074 231,702 205,037
157,044 25,127 37,302 219,473 201,968
157,044 27,552 36,451 221,047 216,225
157,044 20,416 36,484 213,944 228,661
149,772 30,649 35,395 215,816 205,810
149,354 19,970 32,151 201,475 201,772
94,020 9,713 25,419 129,152 109,248
1,233,842 209,276 284,381 1,727,499 1,634,350
Schedule 6 Salary and Benefits Disclosure
Prepared in accordance with Treasury Board Directive 12/98 as amended.(1) Base salary includes regular base pay.(2) Other cash benefits include bonuses, vacation payouts, overtime, and lump sum payments.(3) Other non-cash benefits include government’s share of all employee benefits and contributions or payments
made on behalf of employees including pension and supplementary retirement plan, health care, dental coverage, group life insurance, short and long term disability plans, WCB premiums (estimated), learning account items, professional memberships and tuition fees.
(4) Automobile provided, no dollar amount included in other non-cash benefits. (5) Other cash benefits include a vacation payout of $15,785 (2006 - nil).(6) Other cash benefits include a vacation payout of $2,425 (2006 - $6,596). (7) Other cash benefits include a vacation payout of nil (2006 - $14,605).(8) Other cash benefits include a vacation payout of $6,685 (2006 - $10,817).(9) Position occupied by two individuals during the year.(10) Position was vacant for one month in the prior year.

Advanced Education and Technology ◊ 2006-07 Annual Report 81
Department of Advanced Education and Technology
Departm
ent ofAdvanced Education and Technology
Revenues
Expenses - Directly Incurred
Tangible Capital Assets Transferred
Receivables from
Payables to
Expenses - Incurred by Others
Grants
Grants
Accommodation
Other
Other Services
Legal
Air Transportation Services / Executive Vehicle
Shared Services
7,193
220
10,309
86
2,810
5,361
296
8,352
199
2,496
$ $
$ $
$ $
$ $
$ $
$ $
$ $
$
$
$ $
$ $
$ $
$ $
$ $
$ $
$ $
$
$
2007 2007
Entities in the MinistryOther Entities
Outside the Ministry
2007
Other EntitiesOutside the Ministry
(Restated - see Note 3) (Restated - see Note 3)
(Restated - see Note 3)
2006 2006
2006
(in thousands)
(in thousands)
— — 128,878 120,088
929 647 — —
929 647 128,878 120,088
2,115,422 1,585,705 4,668 1,014
579 225 5,623 5,213
2,116,001 1,585,930 10,291 6,227
— — 1,136 996
5 5 8 69
28,992 4,932 182 59
Related parties are those entities consolidated or accounted for on a modified equity basis in the Province of Alberta’s financial statements. Related parties also include management in the Department.
The Department and its employees paid or collected certain taxes and fees set by regulation for permits, licenses and other charges. These amounts were incurred in the normal course of business, reflect charges applicable to all users, and have been excluded from this schedule.
The Department had the following transactions with related parties which are recorded on the Statement of Operations and the Statement of Financial Position at the amount of consideration agreed upon between the related parties:
The above transactions do not include support service arrangement transactions disclosed in Schedule 8.
The Department also had the following transactions with related parties for which no consideration was exchanged. The amounts for these related party transactions are estimated based on the costs incurred by the service provider to provide the service. These amounts are not recorded in the financial statements. Accommodation and Legal expenses incurred by others are disclosed in Schedule 8.
Schedule 7 Related Party Transactions
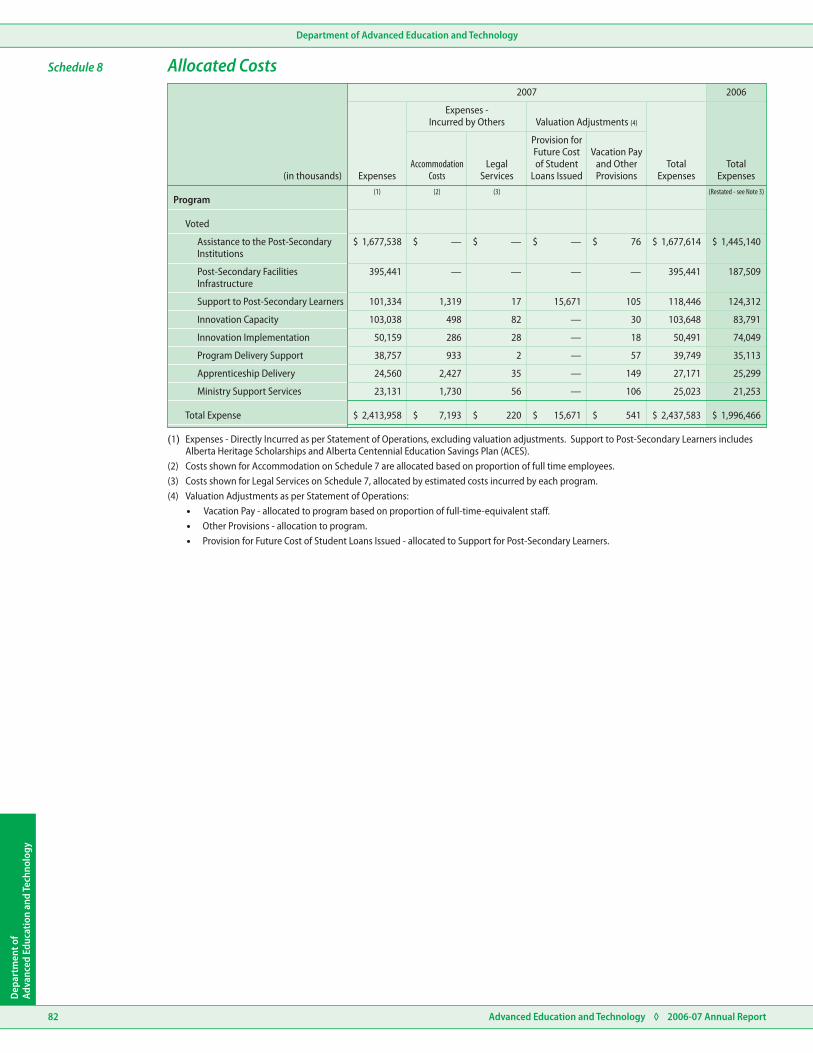
Advanced Education and Technology ◊ 2006-07 Annual Report82
Department of Advanced Education and Technology
Dep
artm
ent o
fAd
vanc
ed E
duca
tion
and
Tech
nolo
gy
Program
Assistance to the Post-SecondaryInstitutions
Voted
Post-Secondary FacilitiesInfrastructure
Support to Post-Secondary Learners
Innovation Capacity
Program Delivery Support
Apprenticeship Delivery
Ministry Support Services
Total Expense
Innovation Implementation
$ $ $$ $ $
$ $ $$ $ $
$
$
ExpensesAccommodation
Costs
Provision forFuture Costof Student
Loans IssuedLegal
Services
Vacation Payand OtherProvisions
Expenses -Incurred by Others Valuation Adjustments (4)
TotalExpenses
TotalExpenses
2007 2006
(in thousands)(Restated - see Note 3)(3)(2)(1)
1,677,538 — — — 76 1,677,614 1,445,140
395,441 — — — — 395,441 187,509
101,334 1,319 17 15,671 105 118,446 124,312
103,038 498 82 — 30 103,648 83,791
50,159 286 28 — 18 50,491 74,049
38,757 933 2 — 57 39,749 35,113
24,560 2,427 35 — 149 27,171 25,299
23,131 1,730 56 — 106 25,023 21,253
2,413,958 7,193 220 15,671 541 2,437,583 1,996,466
Schedule 8 Allocated Costs
(1) Expenses - Directly Incurred as per Statement of Operations, excluding valuation adjustments. Support to Post-Secondary Learners includes Alberta Heritage Scholarships and Alberta Centennial Education Savings Plan (ACES).
(2) Costs shown for Accommodation on Schedule 7 are allocated based on proportion of full time employees.(3) Costs shown for Legal Services on Schedule 7, allocated by estimated costs incurred by each program.(4) Valuation Adjustments as per Statement of Operations:
�Vacation Pay - allocated to program based on proportion of full-time-equivalent staff.�Other Provisions - allocation to program.�Provision for Future Cost of Student Loans Issued - allocated to Support for Post-Secondary Learners.

Access to the Future Fund
Advanced Education and Technology ◊ 2006-07 Annual Report 83
Access to the Future Fund
Statement of Operations
Auditor’s Report
Statement of Financial Position
Statement of Cash Flows
Notes to the Financial Statements
Schedule to the Financial Statements
Funding Provided to Eligible RecipientsSchedule 1
Audited Information
Access to the Future Fund
Financial Statements
March 31, 2007

Access to the Future Fund
Advanced Education and Technology ◊ 2006-07 Annual Report84
Acce
ss to
the
Futu
re F
und
To the Minister of Advanced Education and Technology
I have audited the statement of financial position of the Access to the Future Fund as at March 31, 2007 and the statements of operations and cash flows for the year then ended. These financial statements are the responsibility of the Fund’s management. My responsibility is to express an opinion on these financial statements based on my audit.I conducted my audit in accordance with Canadian generally accepted auditing standards. Those standards require that I plan and perform an audit to obtain reasonable assurance whether the financial statements are free of material misstatement. An audit includes examining, on a test basis, evidence supporting the amounts and disclosures in the financial statements. An audit also includes assessing the accounting principles used and significant estimates made by management, as well as evaluating the overall financial statement presentation.In my opinion, these financial statements present fairly, in all material respects, the financial position of the Fund as at March 31, 2007 and the results of its operations and its cash flows for the year then ended in accordance with Canadian generally accepted accounting principles.
Fred J. Dunn, FCAAuditor General
original signed by
Edmonton, AlbertaMay 22, 2007
Auditor’s Report

Access to the Future Fund
Advanced Education and Technology ◊ 2006-07 Annual Report 85
Access to the Future FundRevenues
Assets
Liabilities
Transfer from Department of Finance
Cash (Note 4)
Accounts Payable and Accrued Liabilities
Interest income
Expenses
Net Assets
The accompanying notes and schedule are part of these financial statements.
The accompanying notes and schedule are part of these financial statements.
Net Operating Results
Net Assets at End of Year
Grants (Schedule 1)
Total Expenses
Net Assets at Beginning of Year
Net Operating Results
39,56033,750
9,839
—
1,520—
41,08033,750
9,839
—
42,50345,000
11,262
(1,423)
42,50345,000
9,839
(1,423)(11,250)
9,839
11,250
11,262
—
12
11,262
11,262
—
—
—
11,262
—
11,262
11,262
11,262
$
$
$
$
$
$
$
$
$
$
$
$
$
$
2007
2007
Budget Actual Actual
2006
2006
(in thousands)
(in thousands)
Operating Transactions
Increase (Decrease) in Cash
Net Operating Results
Cash, Beginning of Year
Cash, End of Year
(1,423)
(1,423)
11,262
9,839
11,262
11,262
—
11,262
$
$
$
$
2007 2006(in thousands)
for the year ended March 31, 2007
as at March 31, 2007
Statement of Operations
Statement of Financial Position
for the year ended March 31, 2007Statement of Cash Flows
The accompanying notes and schedule are part of these financial statements.

Access to the Future Fund
Advanced Education and Technology ◊ 2006-07 Annual Report86
Acce
ss to
the
Futu
re F
und
Allocation to endowment
Opening balance
Inflation proofing
Closing balance
11,250
250,000
750,000
1,011,250
—
750,000
—
750,000
$
$
$
$
2007 2006(in thousands)
March 31, 2007
Note 1 Authority and Purpose
Notes to the Financial Statements
The Access to the Future Fund (the Fund) operates under the authority of the Access to the Future Act.
The purpose of the Fund is to support innovation and excellence by enhancing and expanding opportunities for Albertans to participate in accessible, affordable and high-quality advanced education opportunities. The Fund is intended to provide seed money for innovations in the post-secondary system as well as matching grants to stimulate private, industry, corporate and other public contributions that establish and support improved learner outcomes, faculty, staff and graduate student development, attraction and retention, knowledge and technology transfer and affordability.
Note 2 Summary of Significant Accounting Policies and Reporting PracticesThe recommendations of the Public Sector Accounting Board (PSAB) of the Canadian Institute of Chartered Accountants are the primary source for the disclosed basis of accounting. These financial statements are prepared in accordance with the following accounting policies that have been established by government.
The reporting entity is the Access to the Future Fund, which is part of the Ministry of Advanced Education and Technology and for which the Minister of Advanced Education and Technology is accountable. The other entities reporting to the Minister are the Department of Advanced Education and Technology, the Alberta Research Council Inc. (ARC) and the Informatics Circle of Research Excellence Inc. (iCORE). Entities accountable to the Minister are the Public Post-Secondary Institutions (universities, technical institutes, public colleges and the Banff Centre for Continuing Education). The activities of these organizations are not included in these financial statements.
The Ministry Annual Report provides a more comprehensive accounting of the financial positions and results of the Ministry’s operations for which the Minister is accountable.
All revenues are reported on the accrual basis of accounting.
Grants are recognized as expenses when authorized, eligibility criteria if any are met, and a reasonable estimate of the amounts can be made.
Financial assets of the Fund are limited to cash transferred or interest receivable from the General Revenue Fund of the Province of Alberta (General Revenue Fund).
Net assets represent the difference between the carrying value of assets held by the Fund and its liabilities.
(a) Reporting Entity
(b) Basis of Financial ReportingRevenues
Expenses
Assets
Net Assets
Note 3 Advanced Education Endowment
The Advanced Education Endowment (the Endowment) is an account within the Alberta Heritage Savings Trust Fund that was established by the Access to the Future Act. As per Section 7 of the Access to the Future Act, an amount equal to 4.5% of the total amount allocated to the Endowment shall be paid annually from the General Revenue Fund to the Fund.
The Endowment received $250 million (2006 - $750 million) in transfers from the Alberta Heritage Savings Trust Fund.
The Endowment is inflation-proofed in accordance with Section 6 of the Access to the Future Act and Section 11 of the Alberta Heritage Savings Trust Fund Act.
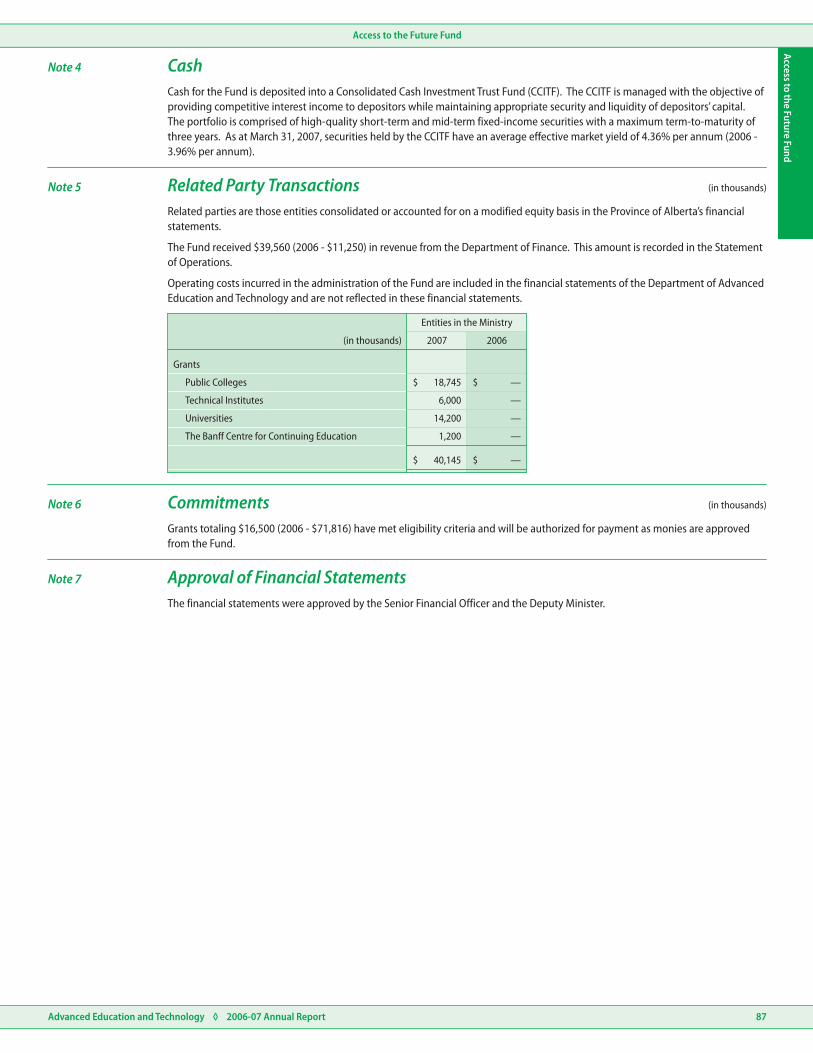
Access to the Future Fund
Advanced Education and Technology ◊ 2006-07 Annual Report 87
Access to the Future Fund
Public Colleges
Grants
Technical Institutes
Universities
The Banff Centre for Continuing Education
6,000
14,200
1,200
18,745
40,145
—
—
—
—
—
$
$
$
$
2007
Entities in the Ministry
2006(in thousands)
Note 5
Note 6
Note 7
(in thousands)
(in thousands)
Note 4
Related Party Transactions
Commitments
Approval of Financial Statements
Cash
Related parties are those entities consolidated or accounted for on a modified equity basis in the Province of Alberta’s financial statements.
The Fund received $39,560 (2006 - $11,250) in revenue from the Department of Finance. This amount is recorded in the Statement of Operations.
Operating costs incurred in the administration of the Fund are included in the financial statements of the Department of Advanced Education and Technology and are not reflected in these financial statements.
Grants totaling $16,500 (2006 - $71,816) have met eligibility criteria and will be authorized for payment as monies are approved from the Fund.
The financial statements were approved by the Senior Financial Officer and the Deputy Minister.
Cash for the Fund is deposited into a Consolidated Cash Investment Trust Fund (CCITF). The CCITF is managed with the objective of providing competitive interest income to depositors while maintaining appropriate security and liquidity of depositors’ capital. The portfolio is comprised of high-quality short-term and mid-term fixed-income securities with a maximum term-to-maturity of three years. As at March 31, 2007, securities held by the CCITF have an average effective market yield of 4.36% per annum (2006 - 3.96% per annum).
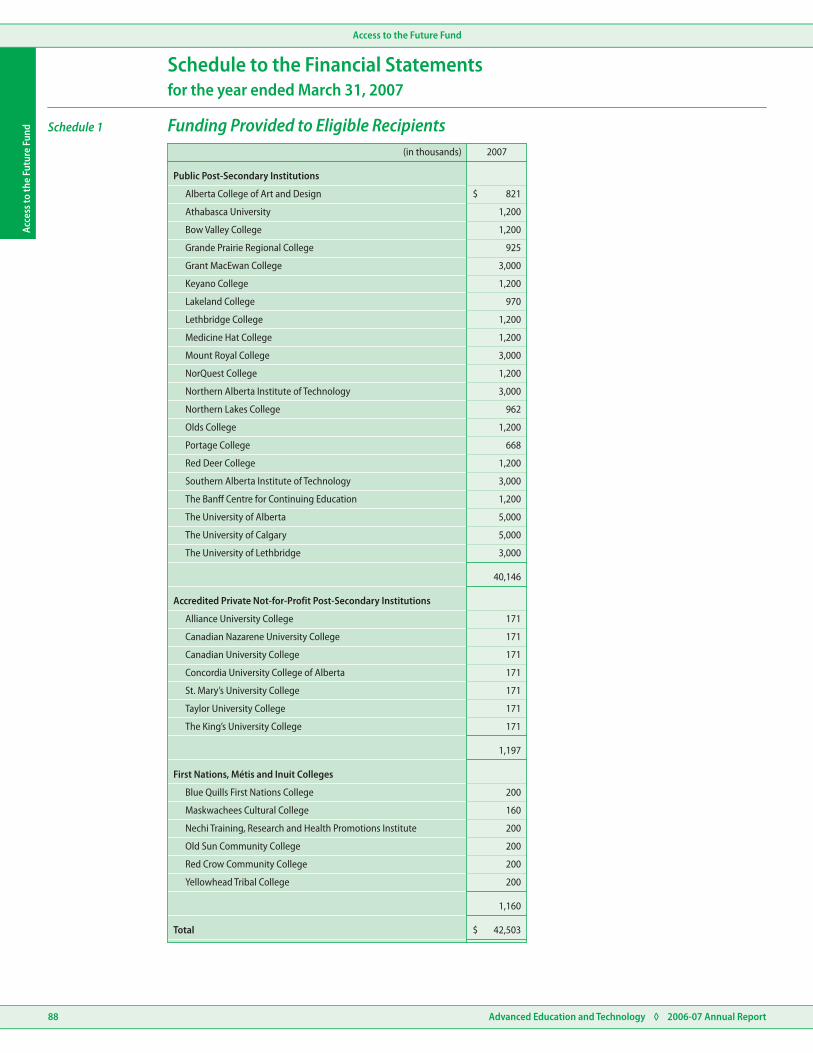
Access to the Future Fund
Advanced Education and Technology ◊ 2006-07 Annual Report88
Acce
ss to
the
Futu
re F
und
Public Post-Secondary Institutions
Alberta College of Art and Design
Athabasca University
Bow Valley College
Grande Prairie Regional College
Grant MacEwan College
Keyano College
Lakeland College
Lethbridge College
Medicine Hat College
Mount Royal College
NorQuest College
Northern Alberta Institute of Technology
Northern Lakes College
Olds College
Portage College
Red Deer College
Southern Alberta Institute of Technology
The Banff Centre for Continuing Education
The University of Alberta
The University of Calgary
The University of Lethbridge
Accredited Private Not-for-Profit Post-Secondary Institutions
First Nations, Métis and Inuit Colleges
Total
Alliance University College
Blue Quills First Nations College
Canadian Nazarene University College
Maskwachees Cultural College
Canadian University College
Nechi Training, Research and Health Promotions Institute
Concordia University College of Alberta
Old Sun Community College
St. Mary’s University College
Red Crow Community College
Taylor University College
The King’s University College
Yellowhead Tribal College
821
1,200
1,200
925
3,000
1,200
970
1,200
1,200
3,000
1,200
3,000
962
1,200
668
1,200
3,000
1,200
5,000
5,000
3,000
171
200
171
160
171
200
171
200
171
200
171
171
200
1,197
1,160
42,503
40,146
$
$
2007(in thousands)
Schedule 1 Funding Provided to Eligible Recipients
for the year ended March 31, 2007Schedule to the Financial Statements

Post-Secondary Institutions
Advanced Education and Technology ◊ 2006-07 Annual Report 89
Post-Secondary Institutions
Summary of Colleges
Summary of Technical Institutes
Summary of Universities
The Banff Centre for Continuing Education
Disclosure of Salaries and Benefits for President Positions
Summary of Significant Accounting Policies
Audited financial statements are available on Advanced Education and Technology’s website:
For a print version of the complete audited financial statements of post-secondary institutions, please order by:www.advancededandtech.gov.ab.ca
phonee-mailonline
(780) [email protected]
Unaudited Information
Post-Secondary Institutions
Financial StatementsFinancial Statements

90 Advanced Education and Technology ◊ 2006-07 Annual Report
Post-Secondary InstitutionsPo
st-S
econ
dary
Inst
itutio
ns
Revenue
Grants
Sales, rentals and services
Tuition and related fees
Education contracts and contractprograms
Investment income
Donations and contributions
Amortization of deferred capitalcontributions
Ancillary services
Miscellaneous revenue
Expenses
Salaries, wages and benefits
Instruction and instructional support
Supplies and services
Amortization of capital assets
Maintenance, utilities and property tax
Facilities cost
Scholarships and bursaries
Other
Loss (gain) on disposal of capital assets
Excess Revenue over Expenses
Changes in Financial Position
Cash generated (used) by operatingactivities
Cash generated (used) by investingactivities
Cash generated (used) by financingactivities
Increase (decrease) in cash andshort-term investments
Cash and short-term investments atbeginning of year, net of bankindebtedness
Cash and short-term investments at endof year, net of bank indebtedness
$
$
$
$
$
$
$ $ $ $ $ $ $
$
$
$
$
$
$
$
$
$
$
$
$
$
$
$
Bow ValleyCollege
AlbertaCollege of
Art & Design
GrandePrairie
RegionalCollege
GrantMacEwan
CollegeKeyanoCollege
LakelandCollege
LethbridgeCollege(in thousands)
9,738 22,728 18,936 64,205 25,570 25,323 32,251
939 — 3,436 21,840 5,286 4,980 7,021
4,194 11,209 6,700 48,812 6,745 11,432 15,733
— 9,589 1,048 3,869 687 3,441 1,951
300 510 438 3,154 516 538 661
301 337 828 3,984 907 205 324
714 1,402 1,727 3,518 1,932 2,548 2,247
802 1,491 — — — — —
159 — — — — 1,777 —
17,147 47,266 33,113 149,382 41,643 50,244 60,188
10,367 29,510 20,211 84,961 24,837 25,014 36,212
548 — — — — — —
4,167 9,930 7,645 28,869 7,587 12,669 9,941
948 2,305 2,789 9,582 3,357 4,549 4,508
— — 865 3,984 1,516 2,028 1,548
— — — — — — —
217 195 228 1,055 479 184 268
404 868 897 10,322 1,563 262 3,241
1 — (2) — 23 (13) —
16,652 42,808 32,633 138,773 39,362 44,693 55,718
495 4,458 480 10,609 2,281 5,551 4,470
898 6,093 2,469 19,753 3,423 5,724 8,600
(474) (13,927) (7,047) (25,132) (4,555) (3,578) (8,221)
66 10,323 5,503 22,032 16,124 5,702 9,379
490 2,489 925 16,653 14,992 7,848 9,758
4,935 3,457 (609) 31,458 2,297 2,530 2,547
5,425 5,946 316 48,111 17,289 10,378 12,305
for the Year Ended June 30, 2006
Summary of Colleges
Statement of Operations and Changes in Financial Position

91Advanced Education and Technology ◊ 2006-07 Annual Report
Post-Secondary InstitutionsPost-Secondary Institutions
Revenue
Grants
Sales, rentals and services
Tuition and related fees
Education contracts and contractprograms
Investment income
Donations and contributions
Amortization of deferred capitalcontributions
Ancillary services
Miscellaneous revenue
Expenses
Salaries, wages and benefits
Instruction and instructional support
Supplies and services
Amortization of capital assets
Maintenance, utilities and property tax
Facilities cost
Scholarships and bursaries
Other
Loss (gain) on disposal of capital assets
Excess Revenue over Expenses
Changes in Financial Position
Cash generated (used) by operatingactivities
Cash generated (used) by investingactivities
Cash generated (used) by financingactivities
Increase (decrease) in cash andshort-term investments
Cash and short-term investments atbeginning of year, net of bankindebtedness
Cash and short-term investments at endof year, net of bank indebtedness
$
$
$
$
$
$
$ $ $ $ $ $ $
$
$
$
$
$
$
$
$
$
$
$
$
$
$
$
Mount RoyalCollege
Medicine HatCollege
NorQuestCollege
NorthernLakes
College Olds CollegePortageCollege
Red DeerCollege(in thousands)
22,777 59,537 25,182 21,497 18,992 16,738 32,219
3,415 17,419 1,894 1,608 5,120 1,976 1,435
9,492 32,512 9,940 3,564 5,378 3,295 15,760
— 17,559 4,580 178 2,304 1,541 2,624
755 4,519 515 301 891 193 654
103 1,183 188 137 601 308 870
1,238 7,300 892 1,304 1,872 994 2,570
— — — — — — 7,125
— — — 45 — 304 —
37,780 140,029 43,191 28,634 35,158 25,349 63,257
22,187 87,658 31,667 16,180 21,476 14,858 41,424
— — — — — — —
7,511 23,823 7,590 6,800 7,166 6,952 12,278
2,491 10,929 2,253 2,078 3,145 1,662 4,237
931 5,009 582 1,423 1,242 724 1,982
— — — 191 — — —
232 1,437 — 44 229 115 291
1,376 5,049 353 1,354 1,783 — 2,782
— — — — (6) — —
34,728 133,905 42,445 28,070 35,035 24,311 62,994
3,052 6,124 746 564 123 1,038 263
6,501 10,244 2,521 3,708 4,896 1,845 7,923
(4,938) (24,737) (2,016) (3,540) (11,817) (1,434) (3,241)
5,543 6,268 2,070 929 10,391 755 18,142
7,106 (8,225) 2,575 1,097 3,470 1,166 22,824
2,273 21,090 343 2,976 4,439 2,602 11,308
9,379 12,865 2,918 4,073 7,909 3,768 34,132
for the Year Ended June 30, 2006
Summary of Colleges
Statement of Operations and Changes in Financial Position (continued)
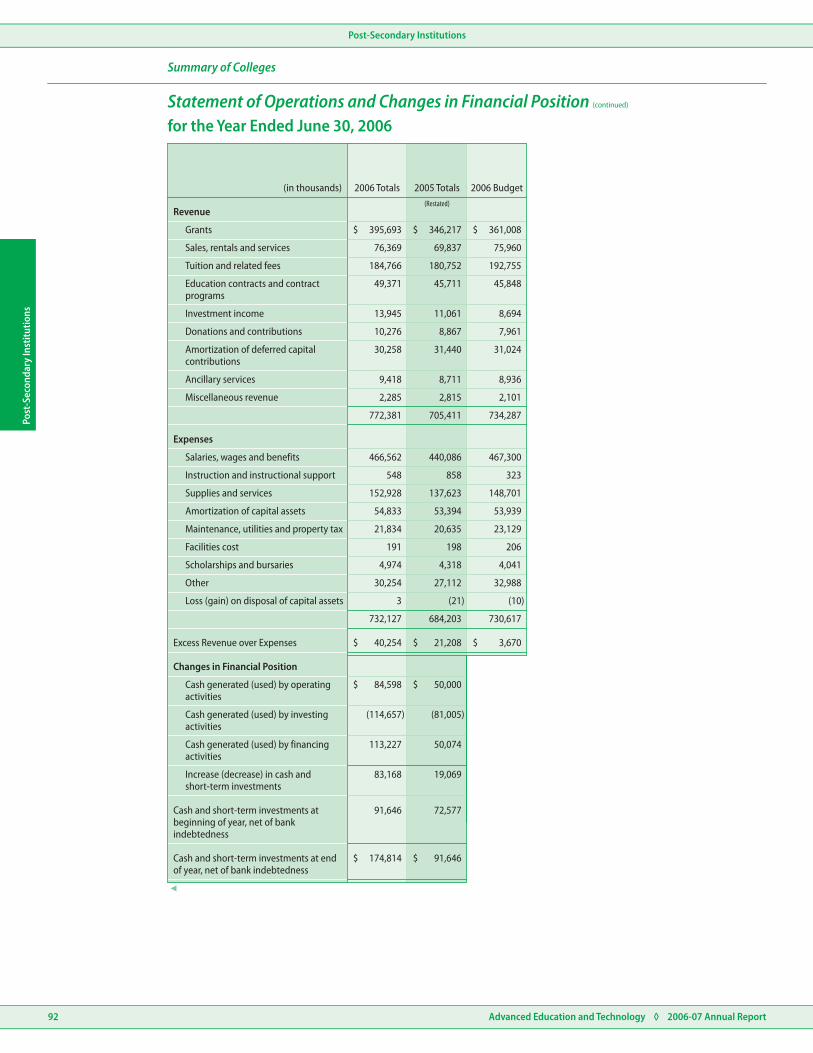
92 Advanced Education and Technology ◊ 2006-07 Annual Report
Post-Secondary InstitutionsPo
st-S
econ
dary
Inst
itutio
ns
Revenue
Grants
Sales, rentals and services
Tuition and related fees
Education contracts and contractprograms
Investment income
Donations and contributions
Amortization of deferred capitalcontributions
Ancillary services
Miscellaneous revenue
Expenses
Salaries, wages and benefits
Instruction and instructional support
Supplies and services
Amortization of capital assets
Maintenance, utilities and property tax
Facilities cost
Scholarships and bursaries
Other
Loss (gain) on disposal of capital assets
Excess Revenue over Expenses
Changes in Financial Position
Cash generated (used) by operatingactivities
Cash generated (used) by investingactivities
Cash generated (used) by financingactivities
Increase (decrease) in cash andshort-term investments
Cash and short-term investments atbeginning of year, net of bankindebtedness
Cash and short-term investments at endof year, net of bank indebtedness
$
$
$
$
$
$
$ $
$
$
2005 Totals2006 Totals 2006 Budget(in thousands)
395,693 346,217 361,008
76,369 69,837 75,960
184,766 180,752 192,755
49,371 45,711 45,848
13,945 11,061 8,694
10,276 8,867 7,961
30,258 31,440 31,024
9,418 8,711 8,936
2,285 2,815 2,101
772,381 705,411 734,287
466,562 440,086 467,300
548 858 323
152,928 137,623 148,701
54,833 53,394 53,939
21,834 20,635 23,129
191 198 206
4,974 4,318 4,041
30,254 27,112 32,988
3 (21) (10)
732,127 684,203 730,617
40,254 21,208 3,670
84,598 50,000
(114,657) (81,005)
113,227 50,074
83,168 19,069
91,646 72,577
174,814 91,646
(Restated)
for the Year Ended June 30, 2006
Summary of Colleges
Statement of Operations and Changes in Financial Position (continued)

93Advanced Education and Technology ◊ 2006-07 Annual Report
Post-Secondary InstitutionsPost-Secondary Institutions
Assets
Current
Cash and short-term investments
Accounts receivable
Inventories
Prepaid expenses and deposits
Long-term
Investments
Capital assets
Other assets
Liabilities and Net Assets
Current
Long-term
Net Assets
Bank indebtedness
Debt
Endowments
Accounts payable and accruedliabilities
Investment in capital assets
Deferred contributions
Internally restricted
Accrued vacation pay
Deferred capital contributions
Unrestricted
Unearned revenue
Unamortized deferred capitalcontributions
Deferred contributions
Other long-term liabilities
Current portion of long-term debt
Other current liabilities
$
$
$
$
$
$
$
$
$
$
$
$
$
$
$
$
$
$
$
$
$
$
$
$
$
$
$
$
Bow ValleyCollege
AlbertaCollege of
Art & Design
GrandePrairie
RegionalCollege
GrantMacEwan
CollegeKeyanoCollege
LakelandCollege
LethbridgeCollege(in thousands)
5,426 5,946 316 48,111 17,287 10,378 12,306
362 2,425 970 2,676 2,724 4,305 2,117
521 757 542 1,975 224 835 583
— 214 83 691 231 — 413
6,309 9,342 1,911 53,453 20,466 15,518 15,419
2,690 22,502 12,170 29,292 8,361 4,374 13,273
5,454 22,666 35,650 205,056 67,120 57,081 52,427
861 — — — 81 13 —
15,314 54,510 49,731 287,801 96,028 76,986 81,119
— — — — — — —
595 1,865 1,977 8,247 5,263 3,776 3,759
747 1,817 1,500 4,768 1,731 1,814 831
374 1,469 407 4,383 872 1,576 1,595
1,094 1,555 757 9,623 2,711 847 2,217
— — 90 1,240 309 175 160
132 7 524 — — — —
2,942 6,713 5,255 28,261 10,886 8,188 8,562
— — 3,009 50,986 5,741 2,400 5,795
— — — — — — —
1,319 10,453 3,437 11,458 9,478 4,700 5,074
4,650 18,756 26,830 100,305 37,379 41,854 35,158
135 8 — — — — —
6,104 29,217 33,276 162,749 52,598 48,954 46,027
1,860 707 2,900 12,826 1,426 1,776 5,617
729 3,894 5,603 52,524 23,692 12,652 11,314
1,828 11,364 1,974 24,984 — 4,514 2,317
1,851 2,615 723 6,457 7,426 902 7,282
6,268 18,580 11,200 96,791 32,544 19,844 26,530
15,314 54,510 49,731 287,801 96,028 76,986 81,119
as at June 30, 2006
Summary of Colleges
Statement of Financial Position

94 Advanced Education and Technology ◊ 2006-07 Annual Report
Post-Secondary InstitutionsPo
st-S
econ
dary
Inst
itutio
ns
Assets
Current
Cash and short-term investments
Accounts receivable
Inventories
Prepaid expenses and deposits
Long-term
Investments
Capital assets
Other assets
Liabilities and Net Assets
Current
Long-term
Net Assets
Bank indebtedness
Debt
Endowments
Accounts payable and accruedliabilities
Investment in capital assets
Deferred contributions
Internally restricted
Accrued vacation pay
Deferred capital contributions
Unrestricted
Unearned revenue
Unamortized deferred capitalcontributions
Deferred contributions
Other long-term liabilities
Current portion of long-term debt
Other current liabilities
$
$
$
$
$
$
$
$
$
$
$
$
$
$
$
$
$
$
$
$
$
$
$
$
$
$
$
$
(in thousands)Mount Royal
CollegeMedicine Hat
CollegeNorQuestCollege
NorthernLakes
College Olds CollegePortageCollege
Red DeerCollege
9,379 12,865 2,918 4,073 7,909 3,768 34,131
787 3,907 1,450 1,009 1,670 1,036 1,060
273 691 172 281 433 175 989
280 1,598 166 161 0 86 451
10,719 19,061 4,706 5,524 10,012 5,065 36,631
9,437 58,322 9,342 4,798 15,268 1,904 6,134
44,733 183,161 26,868 30,365 26,725 30,936 54,084
— — — — — — 1,317
64,889 260,544 40,916 40,687 52,005 37,905 98,166
— — — — — — —
1,868 6,899 2,428 1,208 2,972 797 5,302
664 4,704 2,670 1,878 1,708 1,096 3,291
805 5,410 1,031 9 1,046 325 2,240
2,317 7,538 730 3,162 2,844 1,006 6,785
90 916 — — 181 — 241
— 293 — 72 — — 443
5,744 25,760 6,859 6,329 8,751 3,224 18,302
3,601 31,041 — — 3,476 — 5,875
— 5,861 — — — — —
2,587 526 655 — 9,251 303 16,833
29,441 134,032 15,353 24,895 14,981 27,336 33,595
1,114 3,617 — 62 — — 344
36,743 175,077 16,008 24,957 27,708 27,639 56,647
2,832 25,111 676 615 5,751 570 4,897
11,600 17,178 11,515 5,470 8,088 3,600 14,903
2,740 13,408 4,722 12 649 2,161 1,615
5,230 4,010 1,136 3,304 1,058 711 1,802
22,402 59,707 18,049 9,401 15,546 7,042 23,217
64,889 260,544 40,916 40,687 52,005 37,905 98,166
as at June 30, 2006
Summary of Colleges
Statement of Financial Position (continued)

95Advanced Education and Technology ◊ 2006-07 Annual Report
Post-Secondary InstitutionsPost-Secondary Institutions
Assets
Current
Cash and short-term investments
Accounts receivable
Inventories
Prepaid expenses and deposits
Long-term
Investments
Capital assets
Other assets
Liabilities and Net Assets
Current
Long-term
Net Assets
Bank indebtedness
Debt
Endowments
Accounts payable and accruedliabilities
Investment in capital assets
Deferred contributions
Internally restricted
Accrued vacation pay
Deferred capital contributions
Unrestricted
Unearned revenue
Unamortized deferred capitalcontributions
Deferred contributions
Other long-term liabilities
Current portion of long-term debt
Other current liabilities
$
$
$
$
$
$
$
$
(in thousands) 2006 Totals 2005 Totals
174,813 92,253
26,498 23,343
8,451 8,046
4,374 3,760
214,136 127,402
197,867 160,508
842,326 809,620
2,272 2,206
1,256,601 1,099,736
— 609
46,956 44,790
29,219 27,518
21,542 18,633
43,186 24,906
3,402 3,174
1,471 1,877
145,776 121,507
111,924 106,629
5,861 815
76,074 22,193
544,565 522,975
5,280 4,496
743,704 657,108
67,564 61,193
182,762 178,707
72,288 41,814
44,507 39,407
367,121 321,121
1,256,601 1,099,736
(Restated)
as at June 30, 2006
Summary of Colleges
Statement of Financial Position (continued)

96 Advanced Education and Technology ◊ 2006-07 Annual Report
Post-Secondary InstitutionsPo
st-S
econ
dary
Inst
itutio
ns
Revenue
Grants
Earned revenue programs
Tuition and related fees
Donations and fund raising
Investment income
Sales, rentals and services
Amortization of deferred capital contributions
Ancillary services
Expenses
Salaries, wages and benefits
Supplies and services
Utilities
Interest expense
Facility rentals
Repairs and maintenance
Capital amortization
Scholarships and bursaries
Loss on disposal of capital assets
Excess Revenue over Expenses
Changes in Financial Position
Cash generated (used) by operating activities
Cash generated (used) by investing activities
Cash generated (used) by financing activities
Net increase (decrease) in cash and short-term investments
Cash and short-term investments at beginning of year
Cash and short-term investments at end of year
$
$
$
$
$
$
$ $ $ $
$
$
$
$
$
$
$
$
NorthernAlberta
Institute ofTechnology
SouthernAlberta
Institute ofTechnology 2006 Totals 2005 Totals 2005 Budget(in thousands)
(Restated)
126,981 105,439 232,420 205,093 221,718
32,554 41,082 73,636 69,588 74,122
32,227 31,223 63,450 62,492 63,224
3,930 3,148 7,078 8,995 9,583
17,775 18,644 36,419 34,121 38,310
5,440 4,038 9,478 8,774 7,101
4,732 2,938 7,670 5,160 3,474
8,544 8,593 17,137 17,648 15,311
232,183 215,105 447,288 411,871 432,843
146,521 120,115 266,636 244,723 278,379
49,636 38,876 88,512 83,562 83,219
8,635 8,900 17,535 16,358 16,235
— 1,367 1,367 1,321 1,262
561 — 561 482 756
1,569 2,994 4,563 4,169 5,201
— 11,474 11,474 10,873 10,402
15,811 14,671 30,482 32,022 29,923
232 1,028 1,260 1,460 1,722
222,965 199,425 422,390 394,970 427,099
9,218 15,680 24,898 16,901 5,744
43,595 33,893 77,488 35,135
(51,650) (34,000) (85,650) (52,289)
26,300 58,586 84,886 14,267
18,245 58,479 76,724 (2,887)
1,590 46,189 47,779 50,666
19,835 104,668 124,503 47,779
for the Year Ended June 30, 2006
Summary of Technical Institutes
Statement of Operations and Changes in Financial Position

97Advanced Education and Technology ◊ 2006-07 Annual Report
Post-Secondary InstitutionsPost-Secondary Institutions
Assets
Current
Cash and short-term investments
Accounts receivable
Inventories
Prepaid expenses
Total Current
Investments
Capital assets
Other assets
Total Assets
Liabilities and Net Assets
Current
Long-term
Net Assets
Long-term liabilities
Endowments
Bank indebtedness
Accounts payable and accrued liabilities
Long-term leases
Employee benefit liabilities
Investment in capital assets
Internally restricted
Accrued vacation pay
Deferred capital contributions
Unrestricted net assets
Total Net Assets
Total Liabilities and Net Assets
Unearned revenue
Unamortized deferred capital contribution
Total Long-Term
Deferred contribution
Current portion of employee benefit liabilities
Current portion of long-term liabilities
Current portion of long-term leases
Total Current Liabilities
$
$
$
$
$
$
$
$
$
$
$
$
$
$
$
$
(in thousands)
NorthernAlberta
Institute ofTechnology
SouthernAlberta
Institute ofTechnology 2006 Totals 2005 Totals
19,835 104,668 124,503 47,779
10,402 9,074 19,476 14,056
3,928 1,945 5,873 6,166
1,117 410 1,527 1,581
35,282 116,097 151,379 69,582
68,455 24,324 92,779 73,932
221,933 212,696 434,629 399,568
6,496 — 6,496 2,862
332,166 353,117 685,283 545,944
— — — —
27,358 22,337 49,695 38,674
12,808 — 12,808 11,718
9,339 9,281 18,620 16,051
— 8,930 8,930 8,792
22,938 20,376 43,314 15,652
— 1,542 1,542 685
547 — 547 548
72,990 62,466 135,456 92,120
— 70,427 70,427 19,279
5,734 2,486 8,220 4,917
670 — 670 1,147
— 868 868 545
125,135 116,610 241,745 227,012
131,539 190,391 321,930 252,900
12,541 11,204 23,745 21,670
8,111 — 8,111 7,794
95,581 72,696 168,277 150,897
11,404 16,360 27,764 20,563
127,637 100,260 227,897 200,924
332,166 353,117 685,283 545,944
as at June 30, 2006
Summary of Technical Institutes
Statement of Financial Position
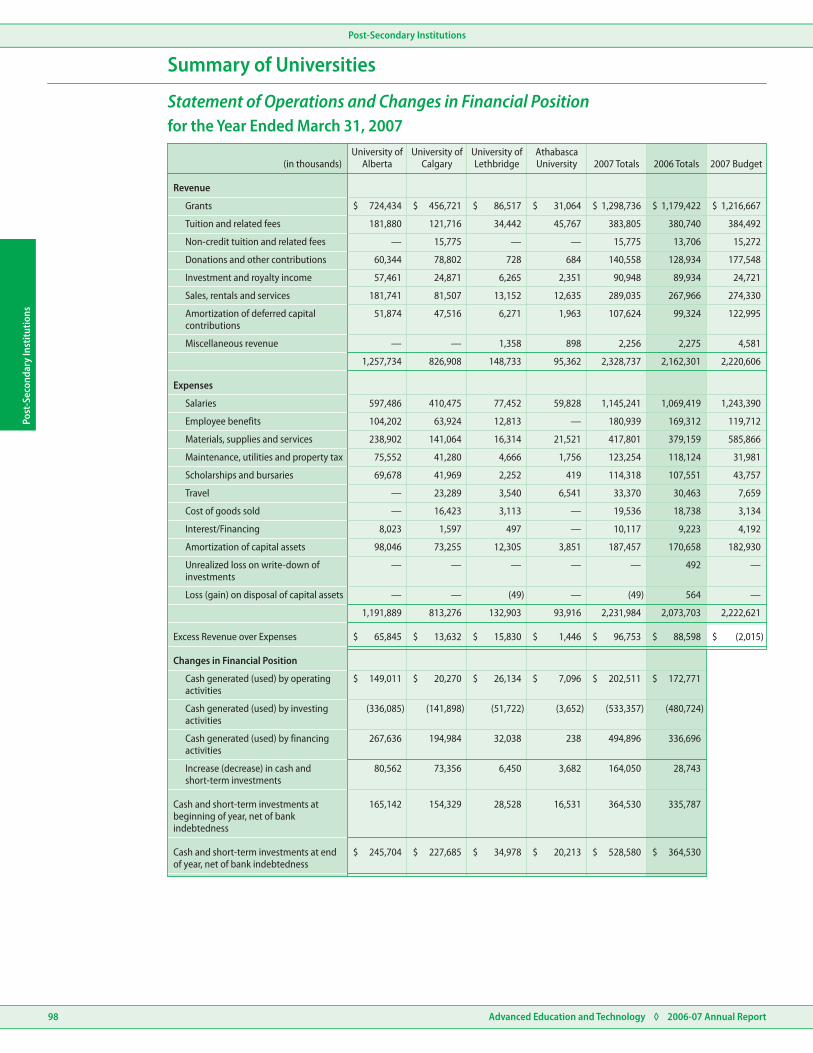
98 Advanced Education and Technology ◊ 2006-07 Annual Report
Post-Secondary InstitutionsPo
st-S
econ
dary
Inst
itutio
ns
Revenue
Grants
Non-credit tuition and related fees
Tuition and related fees
Investment and royalty income
Donations and other contributions
Amortization of deferred capitalcontributions
Sales, rentals and services
Miscellaneous revenue
Expenses
Salaries
Employee benefits
Materials, supplies and services
Amortization of capital assets
Unrealized loss on write-down ofinvestments
Maintenance, utilities and property tax
Scholarships and bursaries
Travel
Cost of goods sold
Interest/Financing
Loss (gain) on disposal of capital assets
Excess Revenue over Expenses
Changes in Financial Position
Cash generated (used) by operatingactivities
Cash generated (used) by investingactivities
Cash generated (used) by financingactivities
Increase (decrease) in cash andshort-term investments
Cash and short-term investments atbeginning of year, net of bankindebtedness
Cash and short-term investments at endof year, net of bank indebtedness
$
$
$
$
$
$
$ $ $ $ $ $
$
$
$
$
$
$
$
$
$
$
$
$
$
$
University ofCalgary
University ofAlberta
University ofLethbridge
AthabascaUniversity 2007 Totals 2006 Totals 2007 Budget(in thousands)
724,434 456,721 86,517 31,064 1,298,736 1,179,422 1,216,667
181,880 121,716 34,442 45,767 383,805 380,740 384,492
— 15,775 — — 15,775 13,706 15,272
60,344 78,802 728 684 140,558 128,934 177,548
57,461 24,871 6,265 2,351 90,948 89,934 24,721
181,741 81,507 13,152 12,635 289,035 267,966 274,330
51,874 47,516 6,271 1,963 107,624 99,324 122,995
— — 1,358 898 2,256 2,275 4,581
1,257,734 826,908 148,733 95,362 2,328,737 2,162,301 2,220,606
597,486 410,475 77,452 59,828 1,145,241 1,069,419 1,243,390
104,202 63,924 12,813 — 180,939 169,312 119,712
238,902 141,064 16,314 21,521 417,801 379,159 585,866
75,552 41,280 4,666 1,756 123,254 118,124 31,981
69,678 41,969 2,252 419 114,318 107,551 43,757
— 23,289 3,540 6,541 33,370 30,463 7,659
— 16,423 3,113 — 19,536 18,738 3,134
8,023 1,597 497 — 10,117 9,223 4,192
98,046 73,255 12,305 3,851 187,457 170,658 182,930
— — — — — 492 —
— — (49) — (49) 564 —
1,191,889 813,276 132,903 93,916 2,231,984 2,073,703 2,222,621
65,845 13,632 15,830 1,446 96,753 88,598 (2,015)
149,011 20,270 26,134 7,096 202,511 172,771
(336,085) (141,898) (51,722) (3,652) (533,357) (480,724)
267,636 194,984 32,038 238 494,896 336,696
80,562 73,356 6,450 3,682 164,050 28,743
165,142 154,329 28,528 16,531 364,530 335,787
245,704 227,685 34,978 20,213 528,580 364,530
for the Year Ended March 31, 2007
Summary of Universities
Statement of Operations and Changes in Financial Position

99Advanced Education and Technology ◊ 2006-07 Annual Report
Post-Secondary InstitutionsPost-Secondary Institutions
University ofCalgary
University ofAlberta
University ofLethbridge
AthabascaUniversity 2007 Totals 2006 Totals
Assets
Current
Cash and short-term investments
Accounts receivable
Inventories
Prepaid expenses and deposits
Other
Investments
Capital assets
Other assets
Liabilities and Net Assets
Current
Long-term
Net Assets
Employee benefit liabilities
Endowments
Accounts payable and accrued liabilities
Investment in capital assets
Current portion of employee benefit liabilities
Deferred contributions
Internally restricted
Deferred capital contributions
Unrestricted
Deferred revenue
Unamortized deferred capital contributions
Long-term debt
Deferred contributions
Other long-term liabilities
Current portion of long-term liabilities
$
$
$
$
$
$
$
$
$
$
$
$
$
$
$
$
$
$
$
$
$
$
$
$
(in thousands)
261,915 335,460 34,978 20,213 652,566 476,493
151,280 98,550 8,245 4,558 262,633 221,818
— 5,713 447 3,340 9,500 9,279
— 3,677 787 834 5,298 5,803
13,917 — — — 13,917 11,993
427,112 443,400 44,457 28,945 943,914 725,386
943,241 386,296 70,180 29,468 1,429,185 1,252,704
1,537,838 749,690 206,855 20,062 2,514,445 2,313,452
— 32,342 3,358 211 35,911 29,531
2,908,191 1,611,728 324,850 78,686 4,923,455 4,321,073
124,399 69,280 9,946 3,099 206,724 198,292
31,187 — 4,107 6,091 41,385 47,616
16,674 15,879 4,441 11,829 48,823 47,303
241,765 248,439 11,001 2,943 504,148 423,934
14,811 2,886 430 117 18,244 11,468
428,836 336,484 29,925 24,079 819,324 728,613
42,353 — 6,343 3,338 52,034 53,120
90,000 — 573 263 90,836 90,957
10,501 60,774 20,625 — 91,900 33,249
982,131 510,559 99,617 11,652 1,603,959 1,465,346
151,544 — 4,309 — 155,853 125,491
— 28,021 — — 28,021 24,457
1,276,529 599,354 131,467 15,253 2,022,603 1,792,620
751,478 437,175 24,537 1,560 1,214,750 1,019,183
410,418 214,190 102,499 8,621 735,728 699,357
— 26,327 17,758 27,009 71,094 70,059
40,930 (1,802) 18,664 2,164 59,956 11,241
1,202,826 675,890 163,458 39,354 2,081,528 1,799,840
2,908,191 1,611,728 324,850 78,686 4,923,455 4,321,073
as at March 31, 2007
Summary of Universities
Statement of Financial Position

(Restated)
100 Advanced Education and Technology ◊ 2006-07 Annual Report
Post-Secondary InstitutionsPo
st-S
econ
dary
Inst
itutio
ns
Revenue
Grants
Accommodation
Tuition and related fees
Investment income
Donations and other contributions
Amortization of deferred capital contributions
Sales, rentals and services
Expenses
Salaries, wages and benefits
Supplies and materials
Amortization of capital assets
Vehicles and equipment
Facility operating
Purchased services
Scholarships and financial assistance
Travel and related
Financial costs
Marketing and promotion
Interfund transfers
Loss (gain) on disposal of capital assets
Excess Revenue over Expenses
Changes in Financial Position
Cash generated from operating activities
Cash applied to investing activities
Cash generated from financing activities
Increase (decrease) in cash
Cash and short-term investments at beginning of year
Cash and short-term investments at end of year
$
$
$
$
$
$
$ $
$
$
2006 Actual2007 Actual 2007 Budget(in thousands)
15,822 16,131 15,083
13,703 14,241 14,003
6,964 7,093 6,824
5,252 5,464 5,361
528 368 372
3,782 3,010 4,032
1,294 1,343 1,343
47,345 47,650 47,018
25,223 24,296 25,776
3,740 3,807 3,722
4,169 4,160 4,351
3,694 4,969 3,943
2,695 2,876 2,814
1,596 1,680 1,711
526 564 606
666 582 677
1,183 1,073 1,091
2,511 2,491 2,491
— — (164)
— 8 —
46,003 46,506 47,018
1,342 1,144 —
4,415 1,708
(42,764) (5,900)
37,639 3,748
(710) (444)
1,027 1,471
317 1,027
for the Year Ended March 31, 2007
The Banff Centre for Continuing Education
Statement of Operations and Changes in Financial Position
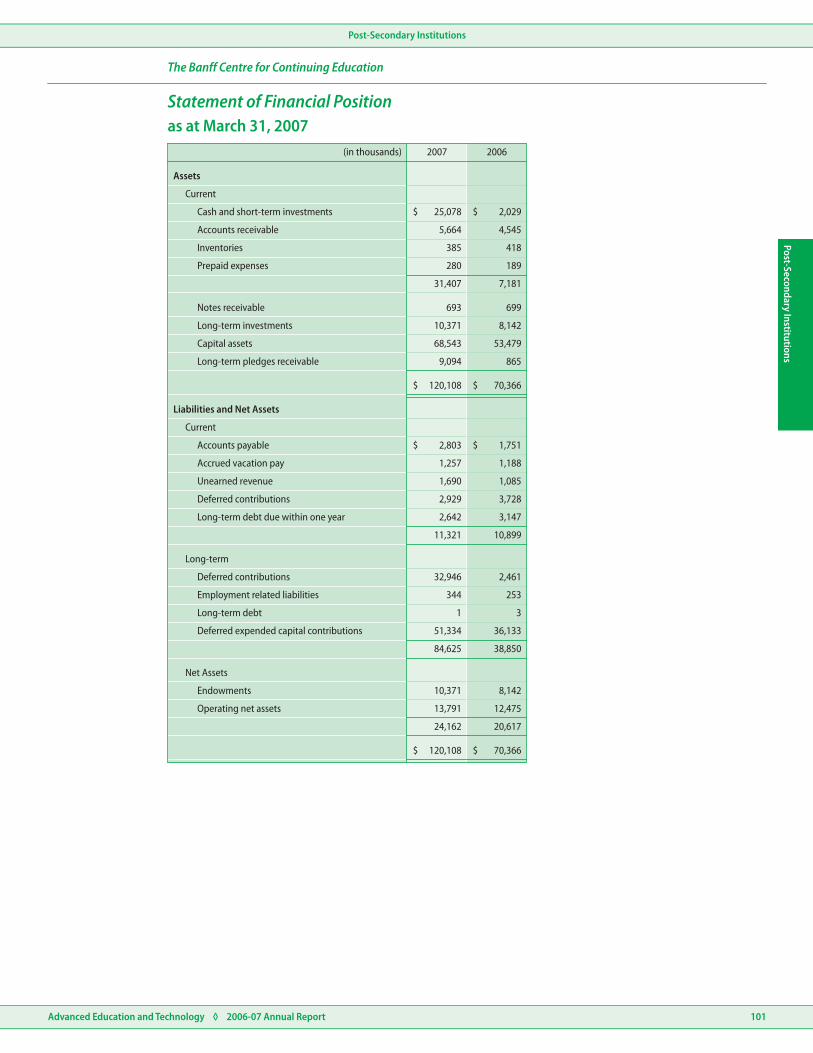
101Advanced Education and Technology ◊ 2006-07 Annual Report
Post-Secondary InstitutionsPost-Secondary Institutions
20062007
Assets
Current
Cash and short-term investments
Accounts receivable
Inventories
Prepaid expenses
Long-term investments
Notes receivable
Capital assets
Long-term pledges receivable
Liabilities and Net Assets
Current
Long-term
Net Assets
Endowments
Accrued vacation pay
Accounts payable
Deferred contributions
Employment related liabilities
Operating net assets
Unearned revenue
Deferred expended capital contributions
Long-term debt
Deferred contributions
Long-term debt due within one year
$
$
$
$
$
$
$
$
(in thousands)
25,078 2,029
5,664 4,545
385 418
280 189
31,407 7,181
693 699
10,371 8,142
68,543 53,479
9,094 865
120,108 70,366
2,803 1,751
1,257 1,188
1,690 1,085
2,929 3,728
2,642 3,147
11,321 10,899
32,946 2,461
344 253
31
51,334 36,133
84,625 38,850
10,371 8,142
13,791 12,475
24,162 20,617
120,108 70,366
The Banff Centre for Continuing Education
as at March 31, 2007Statement of Financial Position

102 Advanced Education and Technology ◊ 2006-07 Annual Report
Post-Secondary InstitutionsPo
st-S
econ
dary
Inst
itutio
ns
Colleges
Technical Institutes
Universities
The Banff Centre
Alberta College of Art & Design
Northern Alberta Institute of Technology
University of Alberta
The Banff Centre for Continuing Education
University of Lethbridge
University of Calgary
Athabasca University
Southern Alberta Institute of Technology
Bow Valley College
Grande Prairie Regional College
Grant MacEwan College
Keyano College
Lakeland College
Lethbridge College
Medicine Hat College
Mount Royal College
NorQuest College
Northern Lakes College
Olds College
Portage College
Red Deer College
$$ $ $
Other CashBenefits
(1) (2)
Base Salary
OtherNon-CashBenefits Total
(June 30, 2006)
(June 30, 2006)
(March 31, 2007)
(March 31, 2007)
414,000 — 177,000 591,000
334,000 — 148,000 482,000
293,000 30,000 88,000 411,000
253,000 24,000 49,000 326,000
247,000 — 35,000 282,000
174,900 24,874 48,997 248,771
172,273 31,301 17,919 221,493
131,000 — 19,183 150,183
202,784 — 44,804 247,588
130,000 — 24,152 154,152
143,000 — 26,234 169,234
150,000 15,000 24,678 189,678
165,984 — 33,659 199,643
230,000 20,000 138,000 388,000
155,628 — 15,986 171,614
145,258 57,622 21,110 223,990
166,703 9,600 32,922 209,225
138,788 23,837 26,250 188,875
160,933 — 64,164 225,097
235,000 100,000 20,000 355,000
191,000 62,000 98,000 351,000
Disclosure of Salaries and Benefits for President Positions
(1) Other Cash Benefits include bonuses, overtime, lump sum payments and honoraria.(2) Other Non-Cash Benefits includes the institution’s share of all employee benefits and contributions or payments
made on behalf of employees including pension, health care, dental coverage, vision coverage, out of country medical benefits, group life insurance, accidental disability and dismemberment insurance, long and short-term disability plan, professional memberships and tuition. Other non-cash benefits figure also includes the institution’s share of the cost of additional benefits including sabbaticals or other special leave with pay, financial planning services, retirement planning services, concessionary loans, travel allowances, car allowances, housing allowances and club memberships.
Note: The Presidents of Post-Secondary Institutions are appointed by the Institution’s Board of Governors.
103Advanced Education and Technology ◊ 2006-07 Annual Report
Post-Secondary InstitutionsPost-Secondary Institutions
Post-secondary institutions prepare their financial statements in accordance with generally accepted accounting principles for not-for-profit organizations. The following are significant accounting policies followed by these entities:
Revenues and expenses are recognized on an accrual basis.
Revenues received for the provision of goods and services are recognized in the period in which the goods are provided or the services rendered.
Unrestricted contributions are recognized as revenues when received.
Capital grants are recorded as deferred contributions until the amounts are invested in capital assets.
Once capital grants are invested in capital assets, the amounts are transferred to unamortized deferred capital contributions. Unamortized deferred capital contributions are recognized as earned revenue in the periods in which the related amortization expense of the funded capital asset is recorded.
Externally restricted non-capital contributions are deferred and recognized as revenue in the period in which the related expenses are incurred.
Endowment contributions are recognized as direct increases in net assets in the period in which they are received.
Contributions for capital assets that will not be amortized, such as land and art collections, are recorded as direct increases in net assets in the period the assets are acquired.
Capital assets are recorded at cost when acquired. Capital assets are amortized based on amortization policies set by post-secondary institutions.
Donated assets are recorded at fair value where fair value is reasonably determined.
Inventories of merchandise for resale are valued at the lower of cost and net realizable value. Inventories of supplies for consumption are valued at the lower of cost and replacement value.
Short-term investments are recorded at the lower of cost or market value. Long-term investments are recognized at market value.
�
�
�
�
�
�
�
�
�
�
�
�
Summary of Significant Accounting Policies

Alberta Research Council Inc.
Advanced Education and Technology ◊ 2006-07 Annual Report104
Albe
rta
Rese
arch
Cou
ncil
Inc.
Auditor’s Report
Consolidated Balance Sheet
Consolidated Statement of Revenue and Expense and Operating Equity
Consolidated Statement of Cash Flows
Notes to the Consolidated Financial Statements
Schedules to the Consolidated Financial Statements
Consolidated Schedule of Allocated Costs
Schedule of Segmented Information
Schedule 1
Audited Information
2
Alberta Research Council Inc.
Consolidated Financial Statements
March 31, 2007
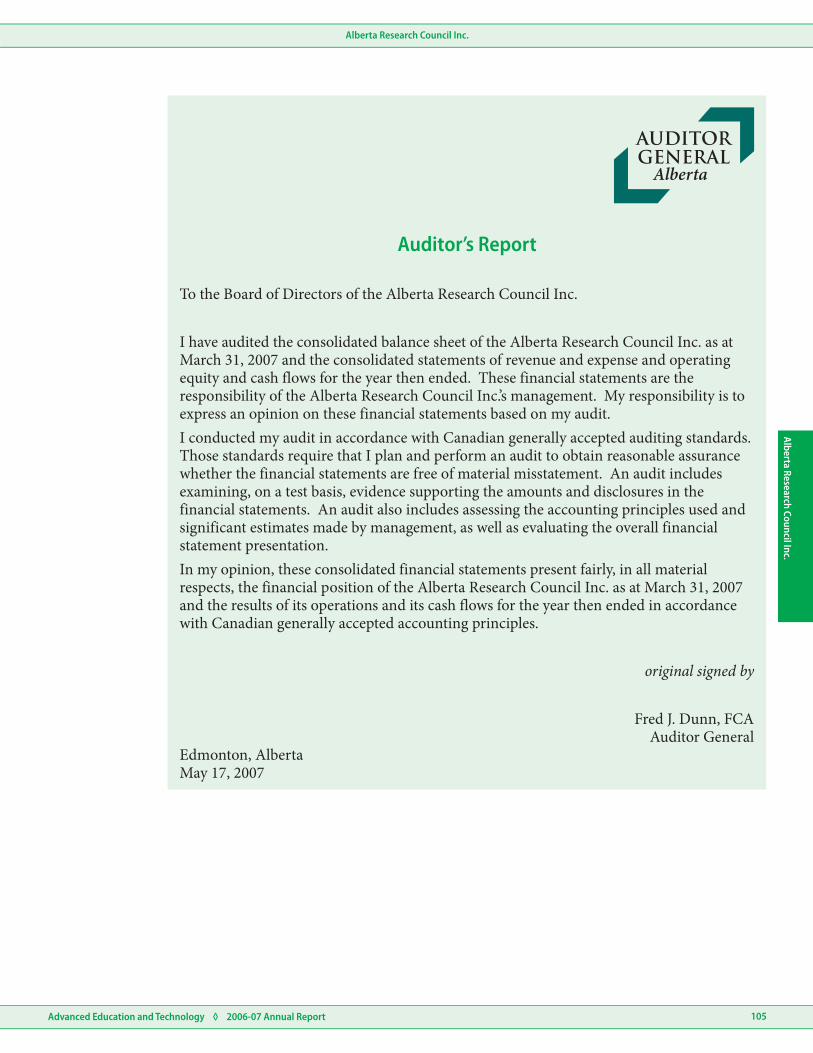
Alberta Research Council Inc.
Advanced Education and Technology ◊ 2006-07 Annual Report 105
Alberta Research Council Inc.
To the Board of Directors of the Alberta Research Council Inc.
I have audited the consolidated balance sheet of the Alberta Research Council Inc. as at March 31, 2007 and the consolidated statements of revenue and expense and operating equity and cash flows for the year then ended. These financial statements are the responsibility of the Alberta Research Council Inc.’s management. My responsibility is to express an opinion on these financial statements based on my audit.I conducted my audit in accordance with Canadian generally accepted auditing standards. Those standards require that I plan and perform an audit to obtain reasonable assurance whether the financial statements are free of material misstatement. An audit includes examining, on a test basis, evidence supporting the amounts and disclosures in the financial statements. An audit also includes assessing the accounting principles used and significant estimates made by management, as well as evaluating the overall financial statement presentation.In my opinion, these consolidated financial statements present fairly, in all material respects, the financial position of the Alberta Research Council Inc. as at March 31, 2007 and the results of its operations and its cash flows for the year then ended in accordance with Canadian generally accepted accounting principles.
Fred J. Dunn, FCAAuditor General
original signed by
Edmonton, AlbertaMay 17, 2007
Auditor’s Report

Alberta Research Council Inc.
Advanced Education and Technology ◊ 2006-07 Annual Report106
Albe
rta
Rese
arch
Cou
ncil
Inc.
Assets
Current
Cash (Note 3)
Accounts receivable (Notes 4 & 7)
Accrued income receivable (Note 7)
Prepaid expenses
Long-term
Property, plant and equipment (Note 6)
Liabilities and Equity
Accounts payable and accrued liabilities (Note 7)
Current
Unearned contract revenue (Note 7)
Current portion of long-term debt (Note 8)
Commitments (Note 10)
Equity
Operating
Contingencies (Note 9)
9,50312,140
11,91113,226
3,152
284
3,428
364
24,85029,158
14,49220,235
39,34249,393
13,22217,566
7,562
273
21,057
8,218
—
25,784
18,28523,609
39,34249,393
$
$
$
$
$
$
$
$
20062007(in thousands)
as at March 31, 2007Consolidated Balance Sheet
The accompanying notes are an integral part of these financial statements.
LeRoy Johnson, M.L.A.Wetaskiwin-CamroseChair, Board of Directors
original signed by
James CarterChair, ARC Audit Committee
original signed by
Approved by the Board of Directors
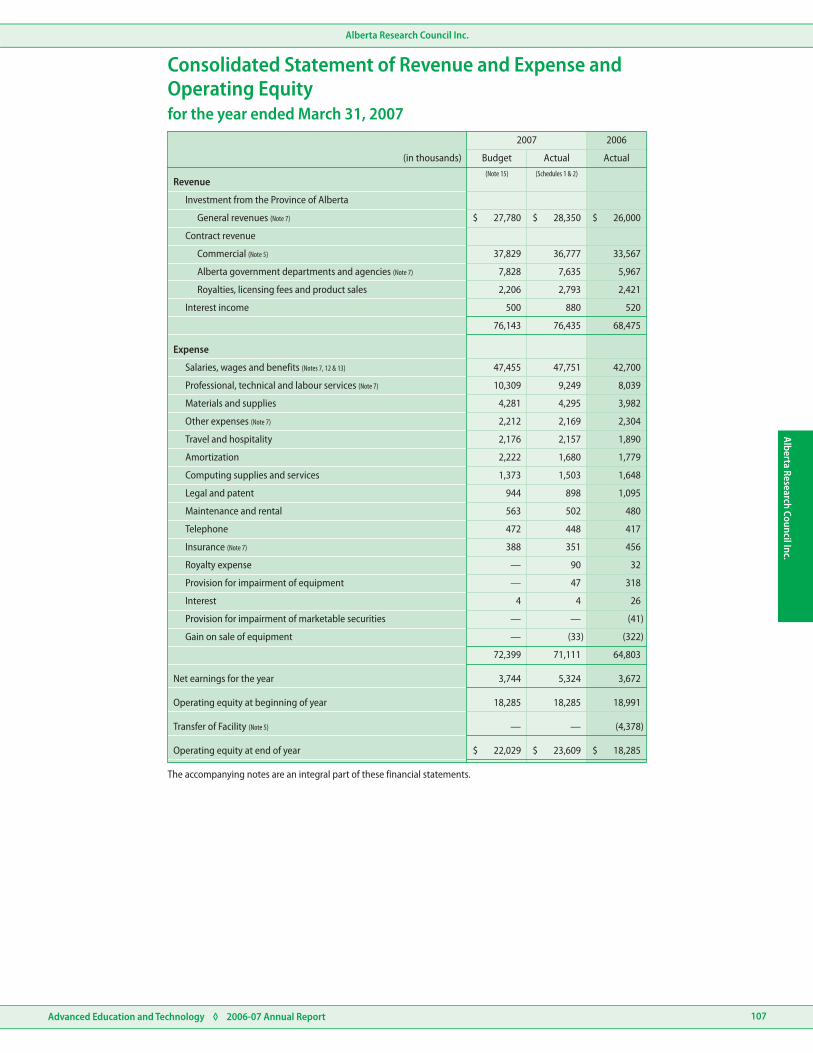
Alberta Research Council Inc.
Advanced Education and Technology ◊ 2006-07 Annual Report 107
Alberta Research Council Inc.
Revenue
Investment from the Province of Alberta
General revenues (Note 7)
Contract revenue
Commercial (Note 5)
Alberta government departments and agencies (Note 7)
Royalties, licensing fees and product sales
Interest income
Expense
Other expenses (Note 7)
Materials and supplies
Professional, technical and labour services (Note 7)
Salaries, wages and benefits (Notes 7, 12 & 13)
Travel and hospitality
Amortization
Computing supplies and services
Legal and patent
Maintenance and rental
Insurance (Note 7)
Telephone
Provision for impairment of equipment
Royalty expense
Interest
Provision for impairment of marketable securities
Net earnings for the year
Operating equity at beginning of year
Transfer of Facility (Note 5)
Gain on sale of equipment
Operating equity at end of year
26,000
33,567
5,967
2,421
28,35027,780
36,77737,829
7,6357,828
2,7932,206
520880500
68,47576,43576,143
3,982
8,039
42,700
4,2954,281
9,24910,309
47,75147,455
2,3042,1692,212
1,8902,1572,176
1,7791,6802,222
1,6481,5031,373
1,095898944
480
417
502563
448472
456
32
351388
90—
31847—
2644
(41)
3,672
18,991
(4,378)
——
5,3243,744
18,28518,285
——
(322)
64,803
(33)—
71,11172,399
18,28523,60922,029
$
$
$$
$$
Actual
2006
Actual(Schedules 1 & 2)
Budget(Note 15)
2007
(in thousands)
for the year ended March 31, 2007
Consolidated Statement of Revenue and Expense andOperating Equity
The accompanying notes are an integral part of these financial statements.

Alberta Research Council Inc.
Advanced Education and Technology ◊ 2006-07 Annual Report108
Albe
rta
Rese
arch
Cou
ncil
Inc.
Cash Provided by (Used in)
Operating activities
Net earnings for the year
Amortization
Gain on sale of marketable securities
Proceeds on sale of marketable securities
Provision for impairment of marketable securities
Provision for impairment of equipment
Gain on sale of equipment
Net change in non-cash balances (Note 11)
Net cash provided by operating activities
Investing activities
Purchases of property, plant and equipment
Purchases for construction of facility (Note 5)
Proceeds on disposal of property, plant and equipment
Net cash used by investing activities
Financing activities
Repayment of long-term debt
Increase (decrease) in cash
Cash at beginning of year
Cash at end of year
Supplementary cash flow information
Interest paid
Interest received
3,6725,324
1,7791,680
(138)(35)
349
(41)
318
(322)
(159)
5,458
(4,017)
(2,667)
435
(6,249)
(447)
(1,238)
10,741
9,503
26
520
35
—
47
(33)
3,329
10,347
(7,470)
—
33
(7,437)
(273)
2,637
9,503
12,140
4
880
$
$
$
$
$
$
$
$
20062007(in thousands)
for the year ended March 31, 2007Consolidated Statement of Cash Flows
The accompanying notes are an integral part of these financial statements.

Alberta Research Council Inc.
Advanced Education and Technology ◊ 2006-07 Annual Report 109
Alberta Research Council Inc.
Building
Leasehold improvements
Equipment
Furniture and fixtures
Computer equipment and software
Twenty-five years
Thirty years
Five to twenty years
Five years
Three years
for the year ended March 31, 2007
Note 1
Note 2
Authority and Purpose
Summary of Significant Accounting Policies and Reporting Practices
Notes to the Consolidated Financial Statements
The Alberta Research Council Inc. is incorporated under the Alberta Business Corporations Act (Alberta).
The Ministry of Advanced Education and Technology was established as a result of the government restructuring announced on December 13, 2006. The Alberta Research Council Inc. (”Research Council”) is a subsidiary of the Ministry of Advanced Education and Technology of the Province of Alberta. The Ministry of Advanced Education and Technology and its wholly owned subsidiaries are exempt from the payment of income tax under Section 149 of the Income Tax Act (Canada).
The mission of the Research Council is to develop and help deploy innovative science and technology solutions for the benefit of Alberta.
The consolidated financial statements have been prepared by management in accordance with Canadian generally accepted accounting principles. The precise determination of many assets and liabilities is dependent upon future events. Accordingly, the preparation of financial statements for a reporting period necessarily involves the use of estimates and approximations which have been made using careful judgment. Actual results could differ from those estimates. These consolidated financial statements have, in management’s opinion, been properly prepared within reasonable limits of materiality and within the framework of the accounting policies summarized below.
These consolidated financial statements include the accounts of the Research Council and its wholly owned subsidiary, C-FER Technologies (1999) Inc.
Shares of public companies are recorded at the lower of cost and market value.
Property, plant and equipment are recorded at cost and are amortized on a straight-line basis over their estimated useful lives using the following annual rates:
(a) Basis of Consolidation
(b) Marketable Securities
(c) Property, Plant and Equipment
(d) Patents and Other Intangible Assets
(e) Revenue Recognition
Expenses incurred related to patents owned by the Research Council as a result of research activity are not capitalized due to the uncertain value of benefits which may accrue to the Research Council.
Expenses incurred on the development of other intangible assets including intellectual capital are not capitalized as there currently is not an acceptable methodology for measuring the value of future benefits accruing to the Research Council.
General revenues received from the Province of Alberta are recognized as revenue in the year the transfers to the Research Council are authorized by the Government of Alberta.
Contract revenue is recognized as costs are incurred, up to the contract maximum and in accordance with contracted cost-sharing ratios. Revenue from C-FER contracts is recognized using the percentage of completion method. The Research Council makes full provision for all known or estimated losses on uncompleted contracts as soon as they can reasonably be estimated.
Royalties and licensing fees are recognized as they accrue in accordance with the relevant agreements and when the amount can be reasonably estimated and there is reasonable assurance of collectability of proceeds.
Revenue from product sales is recognized when products are delivered.
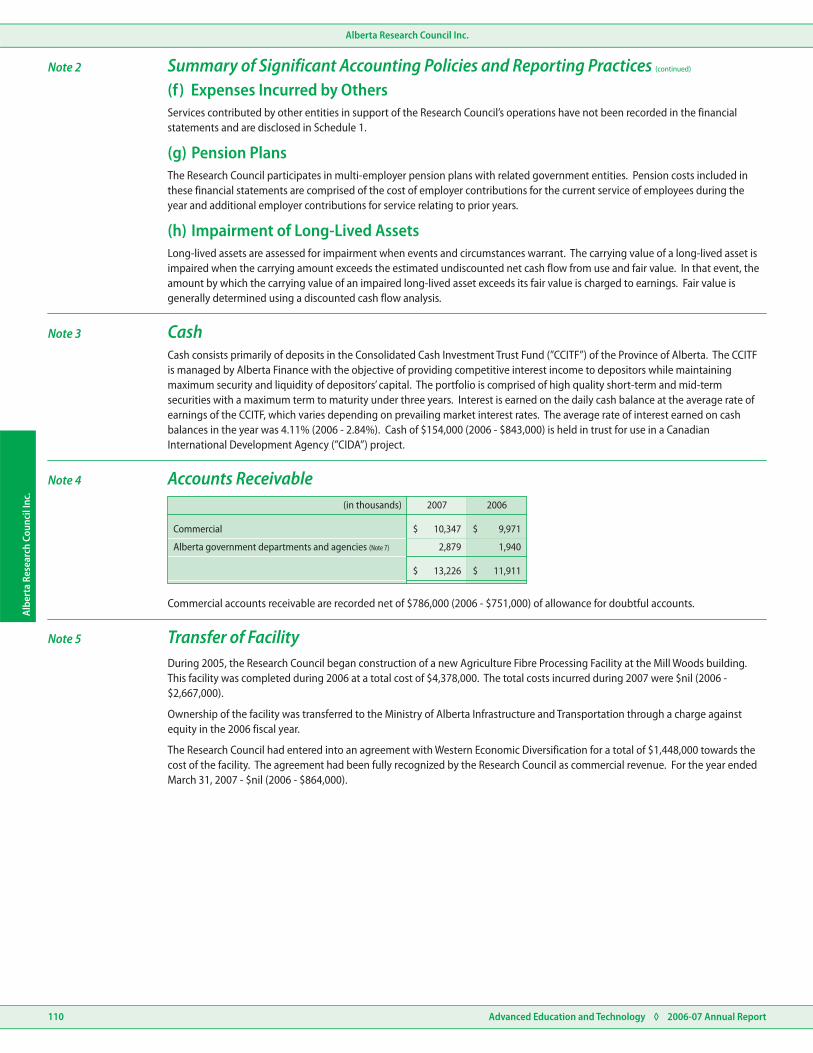
Alberta Research Council Inc.
Advanced Education and Technology ◊ 2006-07 Annual Report110
Albe
rta
Rese
arch
Cou
ncil
Inc.
Commercial
Alberta government departments and agencies (Note 7)
9,97110,347
1,9402,879
11,91113,226
$
$
$
$
20062007(in thousands)
Note 3
Note 2 Summary of Significant Accounting Policies and Reporting Practices (continued)
CashCash consists primarily of deposits in the Consolidated Cash Investment Trust Fund (”CCITF”) of the Province of Alberta. The CCITF is managed by Alberta Finance with the objective of providing competitive interest income to depositors while maintaining maximum security and liquidity of depositors’ capital. The portfolio is comprised of high quality short-term and mid-term securities with a maximum term to maturity under three years. Interest is earned on the daily cash balance at the average rate of earnings of the CCITF, which varies depending on prevailing market interest rates. The average rate of interest earned on cash balances in the year was 4.11% (2006 - 2.84%). Cash of $154,000 (2006 - $843,000) is held in trust for use in a Canadian International Development Agency (”CIDA”) project.
(f) Expenses Incurred by Others
(g) Pension Plans
(h) Impairment of Long-Lived Assets
Services contributed by other entities in support of the Research Council’s operations have not been recorded in the financial statements and are disclosed in Schedule 1.
The Research Council participates in multi-employer pension plans with related government entities. Pension costs included in these financial statements are comprised of the cost of employer contributions for the current service of employees during the year and additional employer contributions for service relating to prior years.
Long-lived assets are assessed for impairment when events and circumstances warrant. The carrying value of a long-lived asset is impaired when the carrying amount exceeds the estimated undiscounted net cash flow from use and fair value. In that event, the amount by which the carrying value of an impaired long-lived asset exceeds its fair value is charged to earnings. Fair value is generally determined using a discounted cash flow analysis.
Note 5
Note 4
Transfer of Facility
Accounts Receivable
During 2005, the Research Council began construction of a new Agriculture Fibre Processing Facility at the Mill Woods building. This facility was completed during 2006 at a total cost of $4,378,000. The total costs incurred during 2007 were $nil (2006 - $2,667,000).
Ownership of the facility was transferred to the Ministry of Alberta Infrastructure and Transportation through a charge against equity in the 2006 fiscal year.
The Research Council had entered into an agreement with Western Economic Diversification for a total of $1,448,000 towards the cost of the facility. The agreement had been fully recognized by the Research Council as commercial revenue. For the year ended March 31, 2007 - $nil (2006 - $864,000).
Commercial accounts receivable are recorded net of $786,000 (2006 - $751,000) of allowance for doubtful accounts.

Alberta Research Council Inc.
Advanced Education and Technology ◊ 2006-07 Annual Report 111
Alberta Research Council Inc.
Advanced Education and Technology
Related Party
Advanced Education and Technology
Advanced Education and Technology
Related Party
Energy
Agriculture and Food
Finance
Energy
Environment
Sustainable Resource Development
Other ministries (1)
Infrastructure and Transportation
Other ministries (1)
Revenues
Expenses
3,913
—
26,000
380
5,686
232
28,350
380
221
108
263
330
22
1,704
45
62
5,967
62
26
65
1,402
125
94
7,635
64
71
31,967
576
35,985
1,077
$
$
$
$
$
$
Investment Revenue
IMAGIS System
Services
Insurance
Parking
Miscellaneous
Contract Revenue
Contract Revenue
Contract Revenue
Contract Revenue
Contract Revenue
Contract Revenue
Ministry
Ministry
Ministry
Ministry
Ministry
Ministry
Ministry
Ministry
Ministry
Ministry
Ministry
Ministry
$
$
2006
2006
2007
2007
Transaction
Transaction
Relationship
Relationship
(in thousands)
(in thousands)
Land
Building
Leasehold improvements
Equipment
Furniture and fixtures
Computer equipment and software
566566—566
1,634
568
11,412
21
291
1,567
557
15,887
15
1,643
575
449
24,373
111
1,290
2,142
1,006
40,260
126
2,933
14,49220,23526,79847,033
$
$
$$$
$$$
2006
NetNet
2007
AccumulatedAmortizationCost(in thousands)
(1)
Note 7 Related Party TransactionsThe following tables summarize the Research Council’s related party transactions for the year:
(1) Other ministries include related party amounts less than $50,000.
Note 6 Property, Plant and Equipment
(1) The Research Council has entered into two agreements with Western Economic Diversification and will receive $776,000 toward the cost of equipment. This revenue is recognized into income through commercial revenue over the useful life of the assets. For the year ended March 31, 2007, the Research Council has recognized $8,000 of revenue of the total amount of $776,000.

Alberta Research Council Inc.
Advanced Education and Technology ◊ 2006-07 Annual Report112
Albe
rta
Rese
arch
Cou
ncil
Inc.
Agriculture and Food
Agriculture and Food
Energy
Advanced Education and Technology
Related Party
Related Party
Related Party
Related Party
Advanced Education and Technology
Advanced Education and Technology
Finance
Environment
Environment
Sustainable Resource Development
International, Intergovernmental and Aboriginal Relations
Other ministries
Other ministries
1,205
72
3
179
450
—
184
2,505
300
10
38
1,231
210
85
536
166
232
226
—
—
20
49
60
50
44
47
1,940
737
3
2,879
1,854
220
$
$
$
$
$
$
$
$
$
$
$
Ministry
Ministry
Ministry
Ministry
Ministry
Ministry
Ministry
Ministry
Ministry
Ministry
Ministry
Ministry
Ministry
$
$
$
2006
2006
2006
2006
2007
2007
2007
2007
Relationship
Relationship
Relationship
Relationship
(in thousands)
(in thousands)
(in thousands)
(in thousands)
Note 7 Related Party Transactions (continued)
Included in accounts receivable are the following related party transactions:
Included in unearned contract revenue are the following related party transactions:
Included in accounts payable are the following related party transactions:
Included in accrued income receivable is the following related party transaction:
Accommodation CostsThe premises occupied by the Research Council, as well as some office furniture and tenant improvements, have been provided by the Province of Alberta at no cost (see Schedule 1).

Alberta Research Council Inc.
Advanced Education and Technology ◊ 2006-07 Annual Report 113
Alberta Research Council Inc.
Accounts receivable
Accrued income receivable
Prepaid expenses
Accounts payable and accrued liabilities
Unearned contract revenue
5.37% mortgage, due October 2006, payable in monthly instalments of $39,376 including interest
Year ending March 31, 2008
Less: Current portion
2009
2010
2011
(1,561)
273
(1,315)
—
143
109
208
(767)
1,852
273
(276)
(80)
4,344
656
—
120
50
11
(159)
—
3,329
—
324
$
$
$
$
$
$
$
$
$
$
2006
2006
2007
2007
(in thousands)
(in thousands)
(in thousands)
Note 9 Contingencies(a) During fiscal 2000, the Research Council was made aware of a $2,200,000 claim relating to intellectual property ownership,
which was filed by a former employee. Management believes that the claim is without merit; however, the likelihood of loss is not determinable at this time. Any settlement that may occur would be accounted for as a charge against earnings in the year of settlement.
(b) The Research Council is aware of a contractual dispute with a former project partner. Any settlement that may occur would be accounted for as a charge against earnings in the year of settlement.
Note 12
Note 11
Note 8
Note 10
Pension Plan
Net Change in Non-Cash Working Capital Balances
Long-term Debt
Commitments
The Research Council participates in three multi-employer pension plans: Management Employees Pension Plan, Supplementary Retirement Plan and Public Service Pension Plan, as well as a Defined Contribution Plan. The expense for these pension plans is equivalent to the annual contributions of $2,663,000 for the year ended March 31, 2007 (2006 - $2,506,000).
Future minimum lease payments for office equipment and vehicles over the next four years and in total are as follows:
The mortgage became due in October 2006 and has been fully paid.

Alberta Research Council Inc.
Advanced Education and Technology ◊ 2006-07 Annual Report114
Albe
rta
Rese
arch
Cou
ncil
Inc.
Chair of the Board (4)
Board Members
Chief Executive Officer
Executive / Vice Presidents
Chief Financial Officer
Vice-President, Energy (5)
Vice-President, Engineered Products and Services
Vice-President, Corporate Relations
Vice-President, Life Sciences
Vice-President, Strategic Development (6)
—
14,486
302,310
170,419
237,005
165,932
146,814
160,123
195,501
—
25,008
319,906
185,308
196,859
198,694
148,922
180,522
175,110
—
—
3,898
30,872
31,630
30,918
24,558
28,730
29,198
—
25,008
116,004
20,000
15,000
20,000
9,500
25,000
9,500
—
—
200,004
134,436
150,229
147,776
114,864
126,792
136,412
$$$$$
2006
TotalTotal
OtherNon-CashBenefits
2007
Other CashBenefitsBase Salary
(1) (2) (3)
Note 13 Board of Directors and Senior Executive Salaries and Benefits
(1) Base salary includes regular base pay.(2) Other cash benefits include bonuses, overtime, car allowance, payments made in lieu of benefits, lump sum payments and
honoraria.(3) Other non-cash benefits and allowances includes the employer’s share of the cost of pension and Supplementary Retirement
Plan, Canada Pension Plan, Employment Insurance, dental, major medical, basic life insurance, short and long-term disability, employee health care expense accounts and membership fees.
(4) Remuneration of the Chair of the Board was paid by Advanced Education and Technology.(5) A new Vice-President, Energy was appointed April 1, 2006.(6) A new Vice-President, Strategic Development was appointed August 1, 2006.
Note 15
Note 16
Note 14
Budget
Comparative Figures
Financial Instruments
The 2007 budget was approved by the Board of Directors on March 22, 2006.
The comparative figures have been reclassified where necessary to conform with current year presentation.
Financial instruments consist of accounts receivable, accrued income receivable, marketable securities and long-term investments which will result in future cash receipts as well as accounts payable and accrued liabilities which will result in future cash outlays.
Fair value estimates are made at a specific point in time, based on relevant market information and information about the financial instrument. These estimates are subjective in nature and involve uncertainties, matters of significant judgment, and therefore cannot be determined with precision. Changes in assumptions could significantly affect the estimates.
The fair values of accounts receivable, accrued income receivable, accounts payable and accrued liabilities approximate the carrying values due to their short-terms to maturity. The fair value of the marketable securities is their market value as disclosed on the balance sheet.
The Research Council is exposed to normal credit risk with respect to its commercial sales. However, this is minimized by the Research Council’s program of credit evaluation of new customers. Provisions are maintained for potential credit losses, and any such losses to date have been within management’s expectations. The Research Council is not exposed to significant credit risk from any one customer.

Alberta Research Council Inc.
Advanced Education and Technology ◊ 2006-07 Annual Report 115
Alberta Research Council Inc.
Total Expense 80,32987,75316,64271,111
2006
TotalExpenses
TotalExpenses
2007
AccommodationCosts
ExpensesIncurred
by Others
Expense(2) (3)
(in thousands)
$ $$$
Building maintenance
Accommodation cost
Grants in lieu of taxes
Lease costs
Project expenses
Amortization 2,912
15,526
—
1,964
1,821
8,829
2,914
16,642
404
2,012
2,053
9,259 $
$
$
$
20062007(in thousands)
for the year ended March 31, 2007Schedule 1 (1)Consolidated Schedule of Allocated Costs
(1) If these allocated costs were paid for by the Research Council, the Province’s contribution to the Research Council would be increased by $16,642,000 making total revenue for 2007 $93,077,000. Net profit for 2007 would have remained at $5,324,000.
(2) Expenses as per Consolidated Statement of Revenue and Expense and Operating Equity.
(3) Accommodation costs, including premises occupied by the Research Council, as well as some office furniture and tenant improvements, have been provided by the Province of Alberta at no cost. The Province’s costs to provide this support are as follows:
for the year ended March 31, 2007Schedules to the Consolidated Financial Statements

Alberta Research Council Inc.
Advanced Education and Technology ◊ 2006-07 Annual Report116
Albe
rta
Rese
arch
Cou
ncil
Inc.
External revenue
Draw on ProvincialInvestment Funds
Amortization of segmentproperty, plant andequipment
Total segment property,plant and equipment
Segment property, plantand equipment purchasedduring the year
Segment earnings (loss) 904 680967 959(28) (253)5,324 3,672
350 438611 488123 2441,680 1,779
12,174 11,25021,492 19,52212,194 11,15276,435 68,475
5,137 4,7129,350 8,5619,639 8,36028,350 26,000
7,037 6,53812,142 10,9612,555 2,79248,085 42,475
3,481 2,286
596
7,727 4,502 5,842 2,164 20,235 5,867 3,754 4,050 821 14,492
609
30,575
2,456 1,144 2,405 1,465 7,470 910 1,775 1,177 155 4,017
26,551
4,224 4,367
26,351 22,184$ $$ $$ $$ $
$ $
$
$
$
$
$
$
$
$
$ $
$
$
$
$
$
$
$
$
$ $
$
$
$
$
$
$
$
$
$ $
$
$
$
$
$
$
$
$
$ $
$ $
$
$
$
$
$
$
$
$
EngineeredProducts &
Services
EngineeredProducts &
Services
EngineeredProducts &
Services
EngineeredProducts &
Services
Life Sciences
Life Sciences
Life Sciences
Life Sciences
2007
2007
2006
2006
Corporate /Commercialization
Corporate /Commercialization
Corporate /Commercialization
Corporate /Commercialization
Total
Total
Total
Total
Energy
Energy
Energy
Energy
(in thousands)
(in thousands)
The Research Council has four reportable segments: energy, engineered products and services, life sciences and corporate/ commercialization. During the year, Life Sciences and Integrated Resource Management were merged into a single reporting segment. These segments represent the company’s management structure and internal financial reporting.
The Research Council derives revenue through technology development, demonstration and deployment work, conducted within these units. Energy develops and helps industry deploy technologies that improve recovery and reduce the production costs for hydrocarbon, cleaner and alternative energy technologies. Engineered Products and Services develop and deploy value-added bio-based products and processes. Life Sciences helps capture the full commercial potential of new discoveries; bringing together industry, government and communities to create innovative science and technology solutions that enrich life with environmental, economic and social benefits.
Corporate/commercialization includes general and administrative expenses that are not allocated to specific segments. Revenues include interest, royalty and other revenues that have not been allocated to specific segments.
The accounting policies of the reportable segments are the same as those described in the summary of significant accounting policies in Note 2 except for subsection (f ) Expenses Incurred by Others. The Research Council allocates these expenses across the segments based on the market value of the services received by each segment. The Research Council evaluates performance based on operating surplus or deficit before extraordinary items and discontinued operations.
Financial information by reportable segment for the years ended March 31, 2007 and 2006 is as follows:
i)
ii)
Operating results by operating segment
Segment operating property, plant and equipment
for the year ended March 31, 2007Schedule 2 Schedule of Segmented Information

Alberta Research Council Inc.
Advanced Education and Technology ◊ 2006-07 Annual Report 117
Alberta Research Council Inc.
Current assets
Total revenue
Cash provided by operating activities
Balance Sheet
Statement of Operations
Statement of Cash Flows
Property, plant and equipment
Total expenses
Cash used in investing activities
Current liabilities
Net earnings from operations
5,291
570
3,206
7,347
(138)
3,710
7,917
1,145
4,534
586
3,398
8,342
(378)
3,347
8,928
1,550
$
$
$
$
$
$
20062007(in thousands)
C-FER Technologies (1999) Inc.C-FER Technologies (1999) Inc. (”C-FER”) is a wholly owned subsidiary of the Research Council and is included within the Energy Segment presented above. Separate financial statements are not provided for C-FER as its business is closely integrated with that of the Research Council and disclosure in these statements is considered adequate. The following aggregate amounts are included in these consolidated financial statements in respect of C-FER’s financial position, results of operations and cash flows:
for the year ended March 31, 2007Schedule 2 Schedule of Segmented Information (continued)
iCO
RE In
c.iCORE Inc.
Advanced Education and Technology ◊ 2006-07 Annual Report118
Auditor’s Report
Statement of Operations
Statement of Financial Position
Statement of Cash Flows
Notes to the Financial Statements
Schedules to the Financial Statements
Board of Directors and Senior Executive Salaries and Benefits
Related Party Transactions
Schedule 1
Audited Information
2
iCORE Inc.(Alberta Informatics Circle of Research Excellence)
Financial Statements
for the year ended March 31, 2007
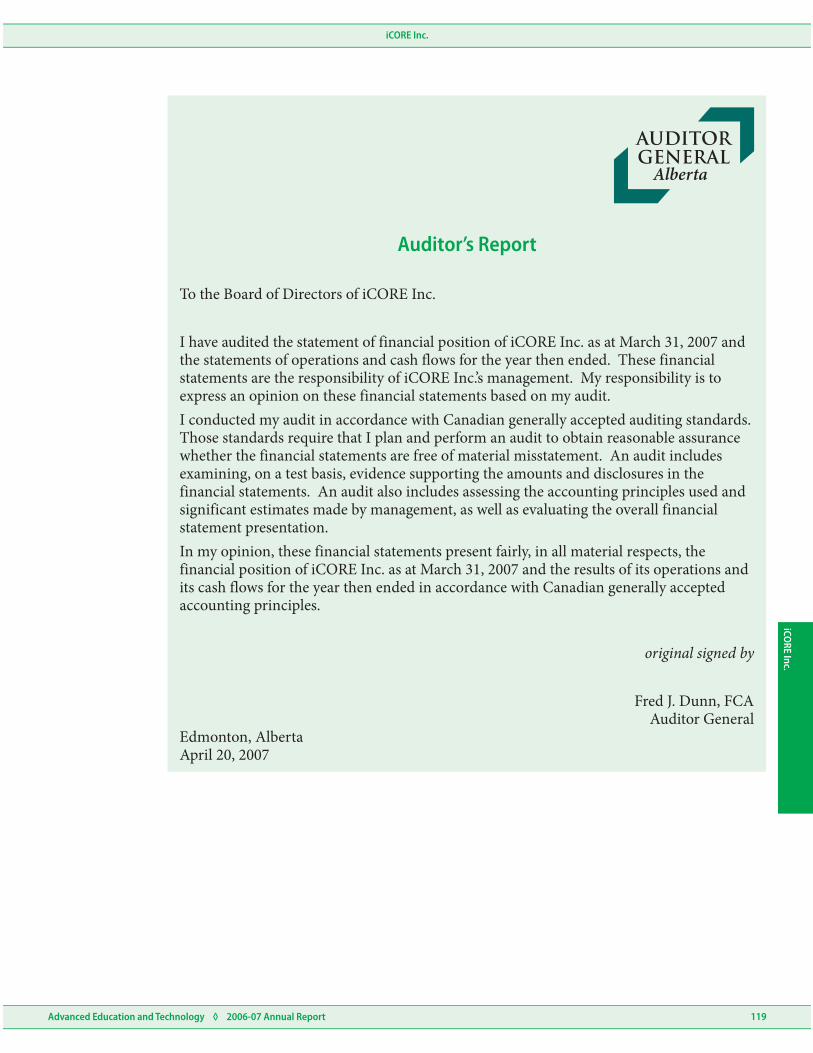
iCORE Inc.
Advanced Education and Technology ◊ 2006-07 Annual Report 119
iCORE Inc.
To the Board of Directors of iCORE Inc.
I have audited the statement of financial position of iCORE Inc. as at March 31, 2007 and the statements of operations and cash flows for the year then ended. These financial statements are the responsibility of iCORE Inc.’s management. My responsibility is to express an opinion on these financial statements based on my audit.I conducted my audit in accordance with Canadian generally accepted auditing standards. Those standards require that I plan and perform an audit to obtain reasonable assurance whether the financial statements are free of material misstatement. An audit includes examining, on a test basis, evidence supporting the amounts and disclosures in the financial statements. An audit also includes assessing the accounting principles used and significant estimates made by management, as well as evaluating the overall financial statement presentation.In my opinion, these financial statements present fairly, in all material respects, the financial position of iCORE Inc. as at March 31, 2007 and the results of its operations and its cash flows for the year then ended in accordance with Canadian generally accepted accounting principles.
Fred J. Dunn, FCAAuditor General
original signed by
Edmonton, AlbertaApril 20, 2007
Auditor’s Report

iCO
RE In
c.iCORE Inc.
Advanced Education and Technology ◊ 2006-07 Annual Report120
Revenue
Internal government transfers (Schedule 2)
Other revenue
Expenses - Directly Incurred
Dr. Seamus O’SheaChair of the BoardiCORE Inc.
original signed by
Dr. Peter FlynnChair of the iCORE Audit CommitteeiCORE Inc.
original signed by
Approved by the Board of Directors
The accompanying notes and schedules are part of these financial statements.
Salaries and benefits
Graduate student grants (Note 4)
Research grants (Schedule 2)
Supplies and services
Communications, outreach and projects
Net Operating Results
10,79511,438
73—
10,86811,438
9,53110,160
——
691660
418350
226268
10,86511,438
3—
12,370
67
12,437
10,489
579
590
499
254
12,412
25
$
$
$
$
$
$
2007
Budget Actual Actual
2006
(in thousands)
for the year ended March 31, 2007Statement of Operations

iCORE Inc.
iCORE Inc.
Advanced Education and Technology ◊ 2006-07 Annual Report 121
Assets
Current Liabilities
Cash
Accounts payable and accrued liabilities
Accounts receivable
Net Assets
The accompanying notes and schedules are part of these financial statements.
Contractual Obligations (Note 3)
Net operating results
Net assets at end of year
Net assets at beginning of year
123
108
15
138
108
27
3
30
138
106
79
—
106
79
2
25
27
106
$
$
$
$
$
$
$
$
2007 2006(in thousands)
Cash Provided by (Used in)
Net operating results
Operating transactions
Increase (decrease) in accounts payable and accrued liabilities
Cash from operating transactions
(Increase) decrease in accounts receivable
Increase (decrease) in cash
Cash, beginning of year
Cash, end of year
3
29
(15)
17
17
106
123
25
(674)
9
(640)
(640)
746
106
$
$
$
$
2007 2006(in thousands)
as at March 31, 2007Statement of Financial Position
for the year ended March 31, 2007Statement of Cash Flows
The accompanying notes and schedules are part of these financial statements.

iCO
RE In
c.iCORE Inc.
Advanced Education and Technology ◊ 2006-07 Annual Report122
for the year ended March 31, 2007
Note 1
Note 2
Authority and Purpose
Summary of Significant Accounting Policies and Reporting Practices
Notes to the Financial Statements
iCORE Inc. is incorporated under the Business Corporations Act (Alberta).
The Ministry of Advanced Education and Technology was established as a result of the government restructuring announced on December 13, 2006. iCORE Inc. is a subsidiary of the Ministry of Advanced Education and Technology of the Province of Alberta. The Ministry of Advanced Education and Technology and its wholly owned subsidiaries are exempt from the payment of income tax under Section 149 of the Income Tax Act (Canada).
The mandate of iCORE Inc. is to attract and grow a critical mass of outstanding researchers in the fields of computer science, electrical and computer engineering, physics, mathematics and other information and communications technology related disciplines. iCORE Inc. invests in the highest calibre research scientists and leaders who work on fundamental and applied problems in information and communications technology. It aims to fund iCORE Chairs at Alberta universities, around which world-class research teams will be developed.
These financial statements have been prepared by management in accordance with the recommendations of the Public Sector Accounting Board of the Canadian Institute of Chartered Accountants. The precise determination of many assets and liabilities is dependent on future events. Accordingly, the preparation of financial statements for a reporting period necessarily involves the use of estimates and approximations which have been made using careful judgement. Actual results could differ from those estimates. These financial statements have, in management’s opinion, been properly prepared within reasonable limits of materiality and within the framework of the accounting policies summarized below which have been established by government for Provincial Corporations. All amounts are shown in Canadian dollars.
All revenues are reported on the accrual basis of accounting. Cash received for which goods or services have not been provided by year end is recorded as unearned revenue.
Internal government transfers are transfers between entities within the government reporting entity where the entity making the transfer does not receive any goods or services directly in return.
Directly incurred expenses are those costs iCORE Inc. has primary responsibility and accountability for, as reflected in the Government’s budget documents.
Research grants are recognized when authorized and eligibility criteria are met.
Services contributed by other entities in support of iCORE Inc. operations are disclosed in Schedule 2.
Financial assets of iCORE Inc. are limited to financial claims recoverable at fiscal year end.
The threshold for capitalizing new systems development is $100,000 and the threshold for all other tangible capital assets is $5,000.
Liabilities represent all financial claims payable by iCORE Inc. at fiscal year end.
Net assets/net liabilities represents the difference between the carrying value of assets held by iCORE Inc. and its liabilities.
Fair value is the amount of consideration agreed upon in an arm’s length transaction between knowledgeable, willing parties who are under no compulsion to act.
The fair values of accounts receivable, accounts payable and accrued liabilities are estimated to approximate their book values.
(a) Basis of Financial ReportingRevenues
Internal Government Transfers
ExpensesDirectly lncurred
lncurred by Others
Assets
Liabilities
Net Assets / Net Liabilities
Valuation of Financial Assets and Liabilities

iCORE Inc.
iCORE Inc.
Advanced Education and Technology ◊ 2006-07 Annual Report 123
Grant agreements
Thereafter
2011
2010
2009
2008
20,453
20,453
1,853
—
4,673
6,511
7,416
18,761$
$
$
$
2007
GrantAgreements
2006(in thousands)
(in thousands)
Note 3 Contractual Obligations
The aggregate amounts payable for the unexpired terms of these contractual obligations are as follows:
Note 5 Comparative FiguresCertain 2006 figures have been reclassified to conform to the 2007 presentation.
Note 4 Graduate Student GrantsDuring the 2006-2007 fiscal year the graduate student grant program was entirely funded by the Ministry of Advanced Education and Technology. iCORE managed the program. The funding provided by the Ministry of Advanced Education and Technology is not reflected in these financial statements.

iCO
RE In
c.iCORE Inc.
Advanced Education and Technology ◊ 2006-07 Annual Report124
for the year ended March 31, 2007Schedule 2 Related Party Transactions
Related parties are those entities consolidated or accounted for on the modified equity basis in the Province of Alberta’s financial statements. Related parties also include management in iCORE Inc.
iCORE Inc. and its employees paid or collected certain taxes and fees set by regulation for permits, licences and other charges. These amounts were incurred in the normal course of business, reflect charges applicable to all users, and have been excluded from this Schedule.
iCORE Inc. had the following transactions with related parties recorded on the Statement of Operations and the Statement of Financial Position at the amount of consideration agreed upon between the related parties:
iCORE also had the following transactions with related parties for which no consideration was exchanged. The amounts for these related party transactions are estimated based on the costs incurred by the service provider to provide the service. These amounts are not recorded in the financial statements.
Chair of the Board (1)
Vice President, Programs
President and Chief Executive Officer (4)
Prepared in accordance with Treasury Board Directive 03/2004.(1) Board members receive no compensation.(2) Base salary included regular base pay.(3) Employer’s share of all employee benefits and contributions or payments made on behalf of
employees including retirement savings plan, health care, dental coverage, vision coverage and professional development allowance.
(4) The salary amount (including benefits paid by the University) for the President and Chief Executive Officer is $256,143 paid to the University of Alberta for 100% secondment.
15,108 — 15,108
109,309 31,041 140,350
256,143 — 256,143
12,422
129,792
246,432
$ $ $ $
Base Salary(2)
OtherBenefits
(3)
2007
Total Total
2006
Revenues - Internal Government Transfers
Expenses - Incurred by Others
Expenses - Directly Incurred
Grant payments to Post-Secondary Institutions
Payments to Alberta Research Council Inc.
Grant from Department of Advanced Education and Technology
Accommodation from the Province of Alberta
10,795
9,351
12
9,363
12,370
10,971
10
10,981
10,795
39
39
12,370
39
39
$
$
$
$
$
$
$
$
$
$
$
$
2007
2007
2006
2006
Entities in the Ministry
Entities in the Ministry
(in thousands)
(in thousands)
for the year ended March 31, 2007Schedule 1 Board of Directors and Senior Executive Salaries and Benefits
for the year ended March 31, 2007Schedules to the Financial Statements

Alberta Heritage Foundation for Medical Research
Advanced Education and Technology ◊ 2006-07 Annual Report 125
Alberta Heritage Foundation
for Medical Research
Auditor’s Report
Consolidated Statement of Financial Position
Consolidated Statement of Operations
Consolidated Statement of Changes in Net Assets
Consolidated Statement of Cash Flows
Notes to the Consolidated Financial Statements
Audited Information
Alberta Heritage Foundation for Medical Research
Consolidated Financial Statements
March 31, 2007

Advanced Education and Technology ◊ 2006-07 Annual Report126
Alberta Heritage Foundation for Medical Research
Albe
rta
Her
itage
Fou
ndat
ion
for M
edic
al R
esea
rch
To the Board of Trustees of the Alberta Heritage Foundation for Medical Research
I have audited the consolidated statement of financial position of the Alberta Heritage Foundation for Medical Research as at March 31, 2007 and the consolidated statements of operations, changes in net assets and cash flows for the year then ended. These financial statements are the responsibility of the Foundation’s management. My responsibility is to express an opinion on these financial statements based on my audit.I conducted my audit in accordance with Canadian generally accepted auditing standards. Those standards require that I plan and perform an audit to obtain reasonable assurance whether the financial statements are-free of material misstatement. An audit includes examining, on a test basis, evidence supporting the amounts and disclosures in the financial statements. An audit also includes assessing the accounting principles used and significant estimates made by management, as well as evaluating the overall financial statement presentation.In my opinion, these consolidated financial statements present fairly, in all material respects, the financial position of the Alberta Heritage Foundation for Medical Research as at March 31, 2007 and the results of its operations, changes in net assets and its cash flows for the year then ended in accordance with Canadian generally accepted accounting principles.
Fred J. Dunn, FCAAuditor General
original signed by
Edmonton, AlbertaMay 11, 2007
Auditor’s Report

Alberta Heritage Foundation for Medical Research
Alberta Heritage Foundation
for Medical Research
Assets
Current assets
Cash (Note 3)
Accounts receivable
Accounts receivable - employee loan (Note 13)
Advances and prepaid expenses
Property and equipment (Note 5)
Employee loan (Note 13)
Liabilities
Accounts payable and accrued liabilities
Current liabilities
Deferred contributions (Note 8)
Current portion of deferred lease inducement
Accrued retirement allowance (Note 7)
Deferred lease inducement
Accrued registered pension liability (Note 6)
Deficit (Note 4)
$
$
$
$
$
$
$
$
20062007(in thousands)
5,926 8,529
343 134
25 25
82 95
6,376 8,783
542 370
150 175
7,068 9,328
1,370 1,705
5,727 7,182
28 —
7,125 8,887
1,131 961
15 20
99 13
8,370 9,881
(1,302) (553)
7,068 9,328
as at March 31, 2007Consolidated Statement of Financial Position
The accompanying notes are part of these financial statements.
Gail SurkanTrustee
original signed by
Nancy MannixTrustee
original signed by
Approved by the Board
Advanced Education and Technology ◊ 2006-07 Annual Report 127

Alberta Heritage Foundation for Medical Research
Albe
rta
Her
itage
Fou
ndat
ion
for M
edic
al R
esea
rch
Net assets (deficit) - Beginning of year
Deficiency of revenue over expenses
Purchase of property and equipment
Proceeds from disposal of property and equipment
Loss on disposal of property and equipment
Amortization of property and equipment
Net assets (deficit) - End of year
$ $
$ $
$ $
$ $
Unrestricted
2007
Total
2006
Invested inProperty andEquipment Total(in thousands)
370 (923) (553) 680
— (749) (749) (1,233)
319 (319) — —
— — — —
(4) 4 — —
(143) 143 — —
542 (1,844) (1,302) (553)
Revenues
Transfers from Endowment Fund (Note 4)
Transfer from Deferred Contributions (Note 8)
Donations
Interest
Recoveries on ForeFront (Note 9)
Other revenues
Expenses
Grants, awards and program (Note 14)
Research support
Knowledge transfer programs
Infrastructure grants
Training support
Partnerships
Outreach and education
Operations
Deficiency of revenues over expenses
$
$
$
$
20062007(in thousands)
55,000 50,000
6,330 6,732
607 471
193 128
1 3
— 105
62,131 57,439
33,258 29,638
9,314 9,458
7,995 7,420
6,660 6,216
325 55
1,459 1,551
3,869 4,334
62,880 58,672
( 749) (1,233)
for the year ended March 31, 2007Consolidated Statement of Changes in Net Assets
Advanced Education and Technology ◊ 2006-07 Annual Report128
The accompanying notes are part of these financial statements.
for the year ended March 31, 2007Consolidated Statement of Operations
The accompanying notes are part of these financial statements.

Alberta Heritage Foundation for Medical Research
Alberta Heritage Foundation
for Medical Research
Operating Activities
Cash provided by (used in)
Deficiency of revenues over expenses
Items not affecting cash
Amortization of property and equipment
Loss on sale of property and equipment
Net change in non-cash working capital items
Accounts receivable
Advances and prepaid expenses
Accounts payable and accrued liabilities
Deferred contributions
Accrued retirement allowance
Accrued registered pension liability
Investing Activities
Purchase of property and equipment
Proceeds on disposal of property and equipment
Received loan payable
Deferred lease inducement
Decrease in cash
Cash - Beginning of year
Cash - End of year
$
$
$
$
2007 2006(in thousands)
(749) (1,233)
143 139
4 5
(602) (1,089)
(209) 195
13 5
(335) 361
(1,455) (883)
170 342
(5) (60)
(2,423) (1,129)
(319) (185)
— 10
25 —
114 —
(180) (175)
(2,603) (1,304)
8,529 9,833
5,926 8,529
for the year ended March 31, 2007Consolidated Statement of Cash Flows
Advanced Education and Technology ◊ 2006-07 Annual Report 129
The accompanying notes are part of these financial statements.
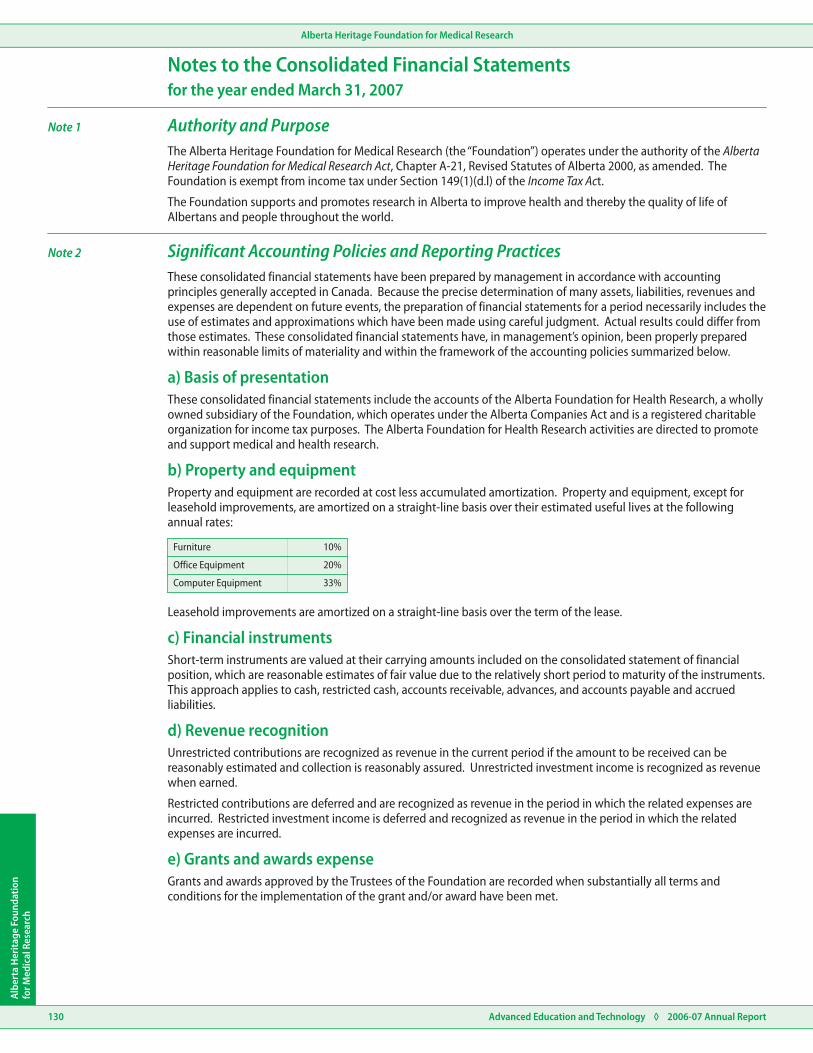
Alberta Heritage Foundation for Medical Research
Albe
rta
Her
itage
Fou
ndat
ion
for M
edic
al R
esea
rch
Furniture
Office Equipment
Computer Equipment
10%
20%
33%
Advanced Education and Technology ◊ 2006-07 Annual Report130
for the year ended March 31, 2007
Note 1
Note 2
Authority and Purpose
Significant Accounting Policies and Reporting Practices
Notes to the Consolidated Financial Statements
The Alberta Heritage Foundation for Medical Research (the “Foundation”) operates under the authority of the Alberta Heritage Foundation for Medical Research Act, Chapter A-21, Revised Statutes of Alberta 2000, as amended. The Foundation is exempt from income tax under Section 149(1)(d.l) of the Income Tax Act.
The Foundation supports and promotes research in Alberta to improve health and thereby the quality of life of Albertans and people throughout the world.
These consolidated financial statements have been prepared by management in accordance with accounting principles generally accepted in Canada. Because the precise determination of many assets, liabilities, revenues and expenses are dependent on future events, the preparation of financial statements for a period necessarily includes the use of estimates and approximations which have been made using careful judgment. Actual results could differ from those estimates. These consolidated financial statements have, in management’s opinion, been properly prepared within reasonable limits of materiality and within the framework of the accounting policies summarized below.
These consolidated financial statements include the accounts of the Alberta Foundation for Health Research, a wholly owned subsidiary of the Foundation, which operates under the Alberta Companies Act and is a registered charitable organization for income tax purposes. The Alberta Foundation for Health Research activities are directed to promote and support medical and health research.
Property and equipment are recorded at cost less accumulated amortization. Property and equipment, except for leasehold improvements, are amortized on a straight-line basis over their estimated useful lives at the following annual rates:
a) Basis of presentation
b) Property and equipment
Leasehold improvements are amortized on a straight-line basis over the term of the lease.
Short-term instruments are valued at their carrying amounts included on the consolidated statement of financial position, which are reasonable estimates of fair value due to the relatively short period to maturity of the instruments. This approach applies to cash, restricted cash, accounts receivable, advances, and accounts payable and accrued liabilities.
Unrestricted contributions are recognized as revenue in the current period if the amount to be received can be reasonably estimated and collection is reasonably assured. Unrestricted investment income is recognized as revenue when earned.
Restricted contributions are deferred and are recognized as revenue in the period in which the related expenses are incurred. Restricted investment income is deferred and recognized as revenue in the period in which the related expenses are incurred.
Grants and awards approved by the Trustees of the Foundation are recorded when substantially all terms and conditions for the implementation of the grant and/or award have been met.
c) Financial instruments
d) Revenue recognition
e) Grants and awards expense

Alberta Heritage Foundation for Medical Research
Alberta Heritage Foundation
for Medical Research
Furniture and equipment
Expected long-term rate on return of plan assets
Computer hardware and software
Discount rate
Leasehold improvements
Assumed rate of salary escalation
Leasehold under construction
7.00%7.00%
6.00%5.75%
4.50%4.50%
$$$$
$$$$
CostAccumulatedAmortization
2007
2007
Net
2006
2006
Net(in thousands)
531 329 202 223
1,301 1,162 139 113
231 203 28 34
173 — 173 —
2,236 1,694 542 370
Note 4
Note 6
Alberta Heritage Foundation for Medical Research Endowment Fund
Pension Plan
The Endowment Fund operates pursuant to the Alberta Heritage Foundation for Medical Research Act (the “Act”) and consists of an endowment from the Government of Alberta together with cumulative earnings thereon, less cumulative transfers to the Foundation.
Transfers to the Foundation are available at the request of the Trustees of the Foundation in accordance with the terms of the Act.
At March 31, 2007, the net assets of the Endowment Fund valued at cost were approximately $1.370 billion (2006 - $1.129 billion) and the market value of the investments was $1.490 billion (2006 - $1.210 billion).
The Foundation’s policy is to retain funds in the Endowment Fund and transfers are made only on an as needed basis. This policy may result in a deficit within the statement of financial position of the Foundation.
The Foundation’s pension plan is a defined benefit plan. An actuarial valuation of the plan was carried out on March 31, 2007. The next actuarial valuation for funding purposes must be at an effective date no later than March 31, 2010. The following significant actuarial assumptions were employed to determine the pension expense and the accrued benefit obligation:
The transitional asset is being amortized over the average remaining service period of active employees expected to receive benefits under benefit plans.
The cost of pensions and other retirement benefits earned by employees is determined using the projected benefit method prorated on service and management’s best estimate of expected plan investment performance, salary escalation and retirement ages of employees. The discount rate used to determine the accrued benefit obligation was determined by reference to market interest rates at the measurement date on high-quality debt instruments with cash flows that match the timing and amount of expected benefit payments. For purposes of calculating the expected return on plan assets, those assets are valued at fair value. The excess of the net actuarial gain (loss) over 10% of the greater of the benefit obligation and the fair value of plan assets is amortized over the average remaining service life of active employees. 100% of the plan assets are held in trust by Manulife Financial and are invested in accordance with pension plan investment policy.
Note 5 Property and Equipment
Advanced Education and Technology ◊ 2006-07 Annual Report 131
Note 3 CashCash consists of deposits in the Consolidated Cash Investment Trust Fund (“CCITF”) of the Province of Alberta. The CCITF is managed with the objective of providing competitive interest income to depositors while maintaining appropriate security and liquidity of depositors’ capital. The portfolio is comprised of high quality, short-term and mid-term fixed income securities with a maximum term to maturity of three years. As at March 31, 2007, securities held by the CCITF have an average effective market yield of 4.36% per annum (March 31, 2006 - 3.96% per annum).
Trustees have authority to draw down funds from the endowment to cover cash requirements. Cash is therefore drawn from the endowment on an as needed basis. Funds to cover deferred contributions (Note 8) are also included in cash and maintained in the Consolidated Cash Investment Trust Fund.

Alberta Heritage Foundation for Medical Research
Advanced Education and Technology ◊ 2006-07 Annual Report132
Albe
rta
Her
itage
Fou
ndat
ion
for M
edic
al R
esea
rch
Current service cost, net of employee contributions
Accrued benefit obligation - Beginning of year
Accrued benefit obligation - End of year
Fair value of plan assets - Beginning of year
Funded status - plan deficit
Interest cost
Current service cost - net of employee contributions
Actual return on plan assets
Unamortized net actuarial loss
Expected return on plan assets
Employee contributions
Contributions
Amortization of net actuarial loss
Interest cost
Amortization of transitional asset
Actuarial loss
Defined benefit plan expense
Benefits paid
Benefits paid
Unamortized net transitional asset
Fair value of plan assets - End of year
Accrued benefit liability
$
$
$
$
$
$
$
$
$
$
$
$
$
$
$
$
2007
2007
2007
2007
2006
2006
2006
2006
(in thousands)
(in thousands)
(in thousands)
(in thousands)
225 207
217 178
(208) (184)
24 12
(29) (29)
229 184
3,518 2,803
225 207
54 61
217 178
(31) 428
(319) (159)
3,664 3,518
2,986 2,570
295 270
288 305
(319) (159)
3,250 2,986
414 532
(711) (853)
312 341
15 20
Note 6
a) Pension Expense
b) Accrued Benefit Obligation
c) Plan Assets
d) Accrued Benefit Liability
Pension Plan (continued)
Information about the Foundation’s defined benefit plan is a follows:
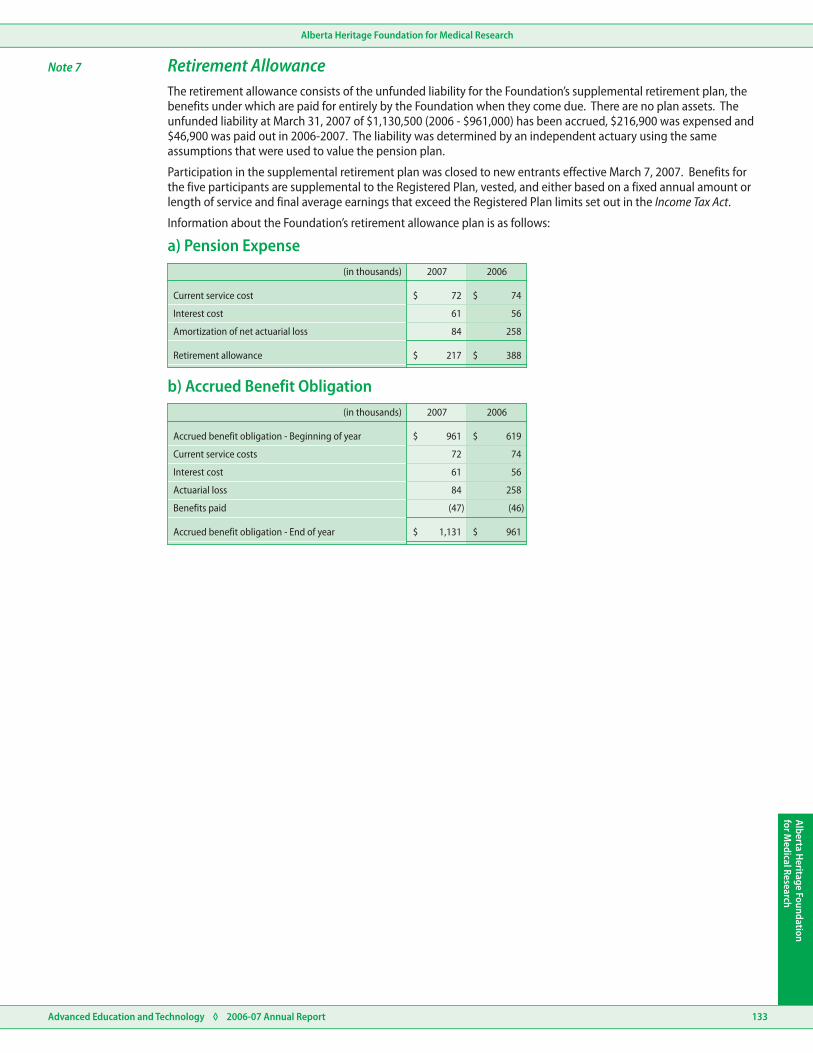
Alberta Heritage Foundation for Medical Research
Alberta Heritage Foundation
for Medical Research
Current service cost
Accrued benefit obligation - Beginning of year
Accrued benefit obligation - End of year
Interest cost
Current service costs
Amortization of net actuarial loss
Interest cost
Actuarial loss
Retirement allowance
Benefits paid
$
$
$
$
$
$
$
$
2007
2007
2006
2006
(in thousands)
(in thousands)
72 74
61 56
84 258
217 388
961 619
72 74
61 56
84 258
(47) (46)
1,131 961
Note 7 Retirement AllowanceThe retirement allowance consists of the unfunded liability for the Foundation’s supplemental retirement plan, the benefits under which are paid for entirely by the Foundation when they come due. There are no plan assets. The unfunded liability at March 31, 2007 of $1,130,500 (2006 - $961,000) has been accrued, $216,900 was expensed and $46,900 was paid out in 2006-2007. The liability was determined by an independent actuary using the same assumptions that were used to value the pension plan.
Participation in the supplemental retirement plan was closed to new entrants effective March 7, 2007. Benefits for the five participants are supplemental to the Registered Plan, vested, and either based on a fixed annual amount or length of service and final average earnings that exceed the Registered Plan limits set out in the Income Tax Act.
Information about the Foundation’s retirement allowance plan is as follows:
Advanced Education and Technology ◊ 2006-07 Annual Report 133
a) Pension Expense
b) Accrued Benefit Obligation

Alberta Heritage Foundation for Medical Research
Albe
rta
Her
itage
Fou
ndat
ion
for M
edic
al R
esea
rch
Contributions received during the year
Less: Amounts recognized as revenue in current year
Decrease during the year
Balance at beginning of year
Balance at end of year
Balance is comprised as follows:
Transfers from Alberta Health and Wellness
Health Research Collaboration
Transfers from Diabetes Research and Innovation Fund
Transfers from Alberta Mental Health Board
Transfers from Canadian Nurses Foundation
Canadian Nurses Foundation
Transfers from Health Quality Council of Alberta
Health Quality Council of Alberta
Diabetes Research and Innovation Fund (”DRIF”)
Health Research Collaboration (”HRC”)
Alberta Mental Health Board (”AMHB”)
$
$
$
$
$
$
$
$
2007 2006(in thousands)
4,800 4,800
— 1,010
75 —
— 17
— 38
4,875 5,865
6,330 6,677
— 17
— 38
6,330 6,732
(1,455) (867)
7,182 8,049
5,727 7,182
4,642 6,172
1,010 1,010
75 —
5,727 7,182
Note 8 Deferred Contributionsa) Health Research Collaboration (“HRC”)
The Foundation and Alberta Health and Wellness have entered into an agreement to facilitate and enhance health research and health technology assessment and their dissemination in the province of Alberta. This agreement concluded March 31, 2007 and remaining funds will be used to meet all outstanding and forward commitments under the agreement.
Responsibility for the health technology assessment component was transferred from the Foundation to the Institute of Health Economics. Related staff and the operating budget for the balance of the year were included in the transfer.
b) Diabetes Research and Innovation Fund (“DRIF”)
The Foundation and Alberta Health and Wellness with the Government of the Yukon, have entered into an agreement to support research in the prevention and management in the cure of diabetes.
c) Alberta Mental Health Board (“AMHB”)
The Foundation and the Alberta Mental Health Board have entered into a cost-sharing agreement to jointly fund training awards in the area of mental health research.
Deferred contributions represent unspent resources externally restricted under the HRC Agreement, the Diabetes Research and Innovation Fund and the Alberta Mental Health Board.
Amounts are recognized as revenue to the extent of expenses incurred under these programs during the current period. Unspent grants returned for awards ended or terminated in a prior year are credited directly to deferred contributions.
Changes in the deferred contributions balance are as follows:
Advanced Education and Technology ◊ 2006-07 Annual Report134
Note 9 Recoveries on ForeFrontThe Foundation has entered into various agreements to fund technology commercialization projects. The Foundation believes these projects have high scientific merit, but are speculative with both technical and commercial risk. Any recoveries by the Foundation under these agreements will be long-term, in some cases at least ten years. In addition to recoveries, some agreements contain a provision for future royalty payments.
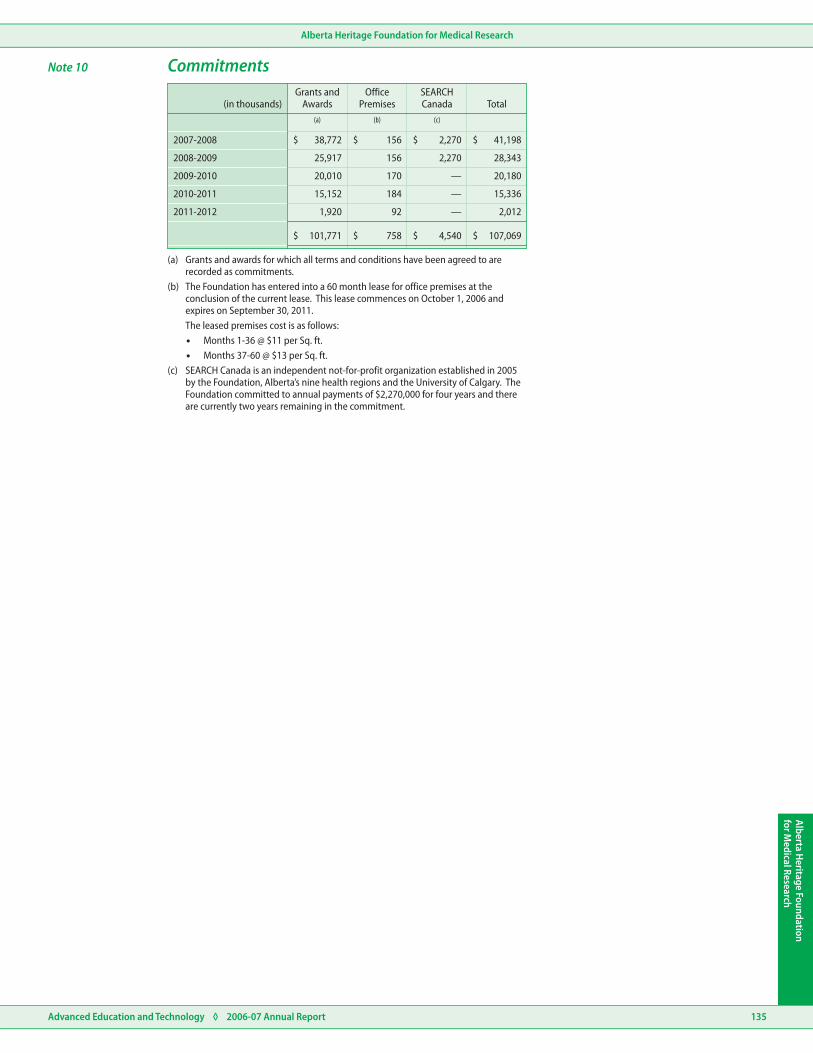
Alberta Heritage Foundation for Medical Research
Alberta Heritage Foundation
for Medical Research
2011-2012
2007-2008
2008-2009
2009-2010
2010-2011
$ $ $
$ $ $
$
$
Grants andAwards
(a) (b) (c)
OfficePremises
SEARCHCanada Total(in thousands)
38,772 156 2,270 41,198
25,917 156 2,270 28,343
20,010 170 — 20,180
15,152 184 — 15,336
1,920 92 — 2,012
101,771 758 4,540 107,069
Note 10 Commitments
(a) Grants and awards for which all terms and conditions have been agreed to are recorded as commitments.
(b) The Foundation has entered into a 60 month lease for office premises at the conclusion of the current lease. This lease commences on October 1, 2006 and expires on September 30, 2011.The leased premises cost is as follows:�Months 1-36 @ $11 per Sq. ft.�Months 37-60 @ $13 per Sq. ft.
(c) SEARCH Canada is an independent not-for-profit organization established in 2005 by the Foundation, Alberta’s nine health regions and the University of Calgary. The Foundation committed to annual payments of $2,270,000 for four years and there are currently two years remaining in the commitment.
Advanced Education and Technology ◊ 2006-07 Annual Report 135

Alberta Heritage Foundation for Medical Research
Albe
rta
Her
itage
Fou
ndat
ion
for M
edic
al R
esea
rch
Chairman
Board of Trustees
President and Chief Executive Officer (a)
President and Chief Executive Officer
President and Chief Executive Officer
Vice President - Programs
Vice President - Programs
Vice President - Programs
Vice President - Corporate Affairs
Vice President - Corporate Affairs
Vice President - Corporate Affairs
$ $ $ $
$
$
$
$
$ $
$
$
$
$
$
$
$
$
$
$
$
Base Salaries
CurrentService Cost
AccruedObligation
March 31, 2006
AccruedObligation
March 31, 2007
(b) (c) (d)
2007
2007
Other CashBenefits
Prior Serviceand
Other Costs
Changes inAccrued
Obligation
OtherNon-CashBenefits Total
Total
2006
2006
Total
Total
17,600 — — 17,600 11,983
70,850 — — 70,850 73,093
274,275 — 76,102 350,377 394,836
174,208 — 104,997 279,205 265,394
139,366 — 48,333 187,699 194,098
676,299 — 229,432 905,731 939,404
54 (10) 44 94
5 22 27 47
11 74 85 86
70 86 156 227
94 44 138
79 27 106
124 85 209
Note 11 Executive Compensation
Supplementary Retirement Benefits
(a) The taxable benefit amount for the home loan for the President & Chief Executive Officer is excluded from the figures indicated above.
(b) Salaries include regular base pay, overtime, retainers, honoraria and any other direct cash remuneration.(c) Other non-cash benefits include the Foundation’s share of all employee benefits and contributions or payments
made on behalf of the employees including pension and supplementary retirement plan, health care, dental coverage, group life insurance, short and long-term disability plans and professional memberships.
(d) Salaries and benefits are distributed to various expense categories including program planning, governance and corporate administration.
Advanced Education and Technology ◊ 2006-07 Annual Report136
Under the terms of the supplementary retirement plan (“SRP”), executive officers may receive supplemental retirement payments. Retirement arrangement costs as detailed below are not cash payments in the period but are the period expense for rights to future compensation. Costs shown reflect the total estimated cost to provide annual pension income over an actuarially determined post employment period. SRP provides future pension benefits to participants based on years of service and earnings. The cost of these benefits is actuarially determined using the projected benefit method pro-rated on services, a market interest rate, and management’s best estimate of expected costs and the period of benefit coverage. Net actuarial gains and losses of the benefit obligations are amortized over the average remaining service life of the employee group. Current service cost is the actuarial present value of the benefits earned in the fiscal year. Prior service and other costs include amortization of past service costs on plan initiation, amortization of actuarial gains and losses, and interest accruing on the actuarial liability.
The accrued obligation for each executive under the SRP is outlined in the following table:
(in thousands)
(in thousands)
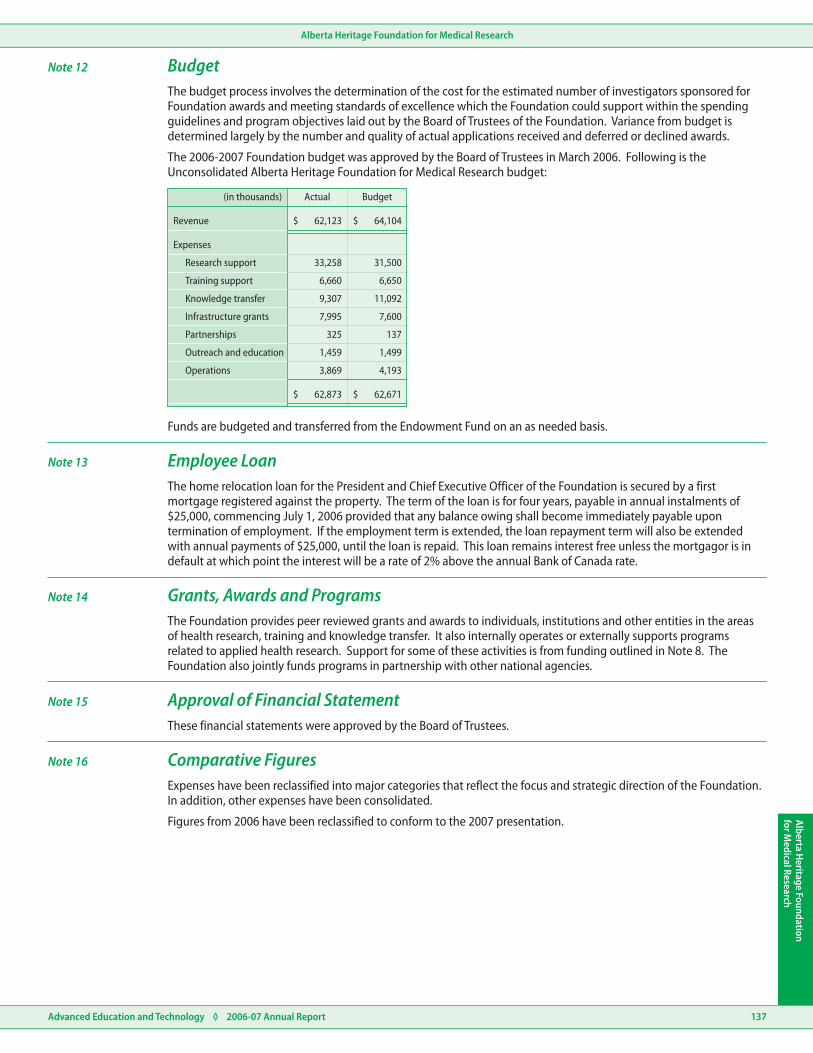
Alberta Heritage Foundation for Medical Research
Alberta Heritage Foundation
for Medical Research
Revenue
Research support
Expenses
Training support
Knowledge transfer
Infrastructure grants
Partnerships
Outreach and education
Operations
$
$
$
$
Actual Budget(in thousands)
62,123 64,104
33,258 31,500
6,660 6,650
9,307 11,092
7,995 7,600
325 137
1,459 1,499
3,869 4,193
62,873 62,671
Note 12
Note 13
Note 14
Note 15
Note 16
Budget
Employee Loan
Grants, Awards and Programs
Approval of Financial Statement
Comparative Figures
The budget process involves the determination of the cost for the estimated number of investigators sponsored for Foundation awards and meeting standards of excellence which the Foundation could support within the spending guidelines and program objectives laid out by the Board of Trustees of the Foundation. Variance from budget is determined largely by the number and quality of actual applications received and deferred or declined awards.
The 2006-2007 Foundation budget was approved by the Board of Trustees in March 2006. Following is the Unconsolidated Alberta Heritage Foundation for Medical Research budget:
The home relocation loan for the President and Chief Executive Officer of the Foundation is secured by a first mortgage registered against the property. The term of the loan is for four years, payable in annual instalments of $25,000, commencing July 1, 2006 provided that any balance owing shall become immediately payable upon termination of employment. If the employment term is extended, the loan repayment term will also be extended with annual payments of $25,000, until the loan is repaid. This loan remains interest free unless the mortgagor is in default at which point the interest will be a rate of 2% above the annual Bank of Canada rate.
The Foundation provides peer reviewed grants and awards to individuals, institutions and other entities in the areas of health research, training and knowledge transfer. It also internally operates or externally supports programs related to applied health research. Support for some of these activities is from funding outlined in Note 8. The Foundation also jointly funds programs in partnership with other national agencies.
These financial statements were approved by the Board of Trustees.
Expenses have been reclassified into major categories that reflect the focus and strategic direction of the Foundation. In addition, other expenses have been consolidated.
Figures from 2006 have been reclassified to conform to the 2007 presentation.
Funds are budgeted and transferred from the Endowment Fund on an as needed basis.
Advanced Education and Technology ◊ 2006-07 Annual Report 137

Alberta Ingenuity
Advanced Education and Technology ◊ 2006-07 Annual Report138
Albe
rta
Inge
nuity
Auditor’s Report
Statement of Financial Position
Statement of Operations
Statement of Changes in Net Assets (Liabilities)
Statement of Cash Flow
Notes to the Financial Statements
Schedule to the Financial Statements
Consolidated Statement of Operations
Audited Information
Alberta Heritage Foundation for Science and Engineering Research(operating as Alberta Ingenuity)
Financial Statements
March 31, 2007
Schedule A
Advanced Education and Technology ◊ 2006-07 Annual Report 139
Alberta IngenuityAlberta Ingenuity
To the Board of Trustees of the Alberta Heritage Foundation for Science and Engineering Research
I have audited the statement of financial position of the Alberta Heritage Foundation for Science and Engineering Research as at March 31, 2007 and the statements of operations, changes in net assets and cash flow for the year then ended. These financial statements are the responsibility of the Foundation’s management. My responsibility is to express an opinion on these financial statements based on my audit.I conducted my audit in accordance with Canadian generally accepted auditing standards. Those standards require that I plan and perform an audit to obtain reasonable assurance whether the financial statements are free of material misstatement. An audit includes examining, on a test basis, evidence supporting the amounts and disclosures in the financial statements. An audit also includes assessing the accounting principles used and significant estimates made by management, as well as evaluating the overall financial statement presentation.In my opinion, these financial statements present fairly, in all material respects, the financial position of the Alberta Heritage Foundation for Science and Engineering Research as at March 31, 2007 and the results of its operations, changes in net assets and its cash flows for the year then ended in accordance with Canadian generally accepted accounting principles.
Fred J. Dunn, FCAAuditor General
original signed by
Edmonton, AlbertaMay 11, 2007
Auditor’s Report

Alberta Ingenuity
Advanced Education and Technology ◊ 2006-07 Annual Report140
Albe
rta
Inge
nuity
Assets
Current
Cash (Note 3, 4)
Accounts and interest receivable
Contributions receivable (Note 6)
Advances and prepaid expenses
Long-term
Portfolio Investments - Prion Fund (Note 4)
Property and equipment (Note 5)
Total Assets
Liabilities and Net Assets
Accounts payable and accrued liabilities
Current
Current portion of deferred lease inducement
Long-term
Deferred lease inducement
Deferred contributions (Note 6)
Net assets (liabilities)
Unrestricted
Invested in capital assets
13,11525,680
43108
—310
53
13,16326,101
25,11510,920
453644
38,73137,665
2091,038
3239
2411,077
251307
37,899
38,391
37,754
39,138
(113)
453
340
(2,117)
644
(1,473)
38,73137,665
$
$
$
$
$
$
$
$
20062007(in thousands)
as at March 31, 2007Statement of Financial Position
The accompanying notes and schedule are part of these financial statements.
Mr. Ronald Triffo, P.Eng.Chairman
original signed by
Ms. Mary Ritchie, FCATrustee
original signed by
Approved by the Board

Alberta Ingenuity
Advanced Education and Technology ◊ 2006-07 Annual Report 141
Alberta Ingenuity
Revenue
Transfers from Endowment Fund (Note 9)
Grants from Advanced Education and Technology (Note 6)
Interest and other revenue
Expenses
Grants and Awards
Ingenuity Centres
Students
Research Funding
Industrial Associateships
Infrastructure Funding
Fellowships
Scholars
New Faculty Awards
Genome Alberta
Industrial Internships
Associateships / Establishment Grants
Special Initiatives
Sponsorships
Operations
Administration
Human Resources
Corporate Administration
Communication / External Relations
Governance and Planning
Program Development
Amortization of Property and Equipment
Peer Review
Total Expenses
Excess (deficiency) of revenues over expenses
21,700 17,97523,9006,417 1,8848,023
71 3224
28,188 19,89131,947
8,502 1,6697,312
4,121 3,3284,659
3,438
3,304
—
2,447
3,209
3,280
2,200
1,982
—
1,273
4,000
2,620
1,468 1,7561,602
725 570984
396
—
150
103
261
1,350
75
103
319
—
150
110
43 13710
26,432 12,96928,255
1,826
577
1,152
492
1,401
702
397
330
260
260
536
363
196
105
10
76
319
92
138
2,557
1,012
48
1,470
828
134
2,390
1,157
30,001 15,26731,802
(1,813) 4,624145
$ $
$ $
$
$
Actual
(Schedule A)
Actual
2006
Budget
(Note 7)
2007
(in thousands)
for the year ended March 31, 2007Statement of Operations
The accompanying notes and schedule are part of these financial statements.

Alberta Ingenuity
Advanced Education and Technology ◊ 2006-07 Annual Report142
Albe
rta
Inge
nuity Balance at beginning of year
Cash Flows from Operating Activities
Cash from Endowment Fund transfers and investment earnings
Cash for grants and awards
Cash for operations
Cash for administration
Cash to Prion Research Fund
Investment in Genome Alberta Fund
Cash from Prion Fund CCITF earnings
Cash from Genome Alberta investment earnings
Cash from Water Fund transfers and investment earnings
Net Cash provided from operating activities
Cash Flows from Financing and Investing Activities
Cash paid for purchase of property and equipment
Investment in Prion Research Fund
Income from Prion Investment Fund
Deferred lease inducement
Net increase in cash for the year
Cash at beginning of year
Excess (deficiency) of revenue over expenses
Purchase of property and equipment
Loss on disposal of property and equipment
Amortization of property and equipment
Balance at end of year
Cash at end of year
(113) (4,284)453 340
(1,813) 4,624
18,007
—
21,771
(1,813)
(296) —
(18,102)
296
(25,656)
—
— —
(1,465)
—
(2,175)
—
105 —
(779)
35,000
3,000
583
85
—
36,329
(376)
(25,115)
1,115
267
12,220
895
(105)
(1,300)
—
—
651
61
5,046
(1,602)
(296)
14,196
204
63
12,565
13,115
—
(2,117) 340
13,115
644
25,680
(1,473)
$ $
$
$ $
$
$
$
$
$
$
$
Unrestricted
2007
2007
Total
2006
2006
Invested inCapital Assets Total(in thousands)
(in thousands)
for the year ended March 31, 2007
for the year ended March 31, 2007
Statement of Changes in Net Assets (Liabilities)
Statement of Cash Flow
Alberta Ingenuity
Advanced Education and Technology ◊ 2006-07 Annual Report 143
Alberta Ingenuity
Furniture
Office Equipment
Computer Equipment
10%
20%
33%
for the year ended March 31, 2007
Note 1
Note 2
Authority and Purpose
Significant Accounting Policies and Reporting Practices
Notes to the Financial Statements
The Alberta Heritage Foundation for Science and Engineering Research (the Foundation) operates under the authority of the Alberta Heritage Foundation for Science and Engineering Research Act, Chapter A-22, Revised Statutes of Alberta 2003, as amended. The Foundation commenced operations on April 1, 2000 and is exempt from income tax under Section 149(l)(d.1) of the Income Tax Act.
The Foundation supports and promotes a balanced long term program of science and engineering research based in Alberta directed to the discovery of new knowledge and application of that knowledge to improve the quality of Alberta’s economy, communities and environment.
These financial statements have been prepared by management in accordance with accounting principles generally accepted in Canada. The precise determination of many asset and liabilities is dependent on future events. Accordingly, the preparation of financial statements for a reporting period necessarily involves the use of estimates and approximations which have been made using careful judgment. Actual results could differ from those estimates. These financial statements have, in management’s opinion, been properly prepared within reasonable materiality and within the framework of the accounting policies summarized below.
Property, plant and equipment are recorded at cost less accumulated amortization. Property, plant and equipment are amortized on a straight-line basis over their estimated useful lives at the following annual rates:
(a) Property and Equipment
Leasehold improvements are amortized on a straight-line basis over the term of the lease.
The Foundation’s portfolio investments are held in the Universe Fixed Income Pool (UFIP) established and administered by Alberta Finance. These investments consist of fixed-income securities which are recorded at cost as of the trade date and adjusted for amortization of discount or premium on a straight-line basis over the life of the instruments. The cost of disposals within the UFIP is determined on the average cost basis. Where there has been a loss in value of an investment that is other than a temporary decline, the investment is written down to recognize the loss and the written-down value is deemed to be the new cost.
UFIP investments have a market-based unit value that is used to value purchases and sales of pool units. Fair values of public fixed-income securities held by UFIP are equal to year-end closing sale prices or the average of the latest bid and ask prices quoted by an independent securities valuation company. Fair values of private fixed income securities held by UFIP are equal to the net present value of future cash flows discounted using appropriate interest rate premiums over similar Government of Canada benchmark bonds trading in the market. The total fair value of portfolio investments is disclosed in Note 4 to the financial statements.
The carrying values of accounts and interest receivable, and accounts payable and accrued liabilities approximate fair value due to the relative short-term maturity of these financial instruments.
Unrestricted contributions are recognized as revenue in the current period if the amount to be received can be reasonably estimated and collection is reasonably assured. Unrestricted investment income is recognized as revenue when earned.
Restricted contributions are deferred and recognized as revenue in the period(s) that eligible expenditures are incurred. Restricted investment income is deferred and recognized as revenue on the same basis as the underlying restricted contributions.
Grants and awards approved by the Trustees of the Foundation are recorded as expenses when all conditions of eligibility have been met.
(b) Financial Instruments
(c) Revenue Recognition
(d) Grants and Awards Expense

Alberta Ingenuity
Advanced Education and Technology ◊ 2006-07 Annual Report144
Albe
rta
Inge
nuity
Note 2 Significant Accounting Policies and Reporting Practices (continued)
(e) Deferred Lease Inducement
(f) Investment Income
(g) Derivatives
Deferred Lease inducements represent the unamortized portion of cash payments received by the Foundation for office premises. Deferred Lease inducements will be amortized on a straight-line basis over the term of the lease.
Investment income is recorded on the accrual basis where there is reasonable assurance as to its measurement and collect-ability. Gains and losses arising from disposals of investments are included in the determination of investment income.
The Foundation owns a portion of certain derivative contracts through its investment in the UFIP (see Note 4). Derivative contracts are financial contracts, the value of which is derived from the value of underlying assets, indices, interest rates or currency rates. The notional value of a derivative contract represents the amount to which a rate or price is applied in order to calculate the exchange of cash flows. The fair value of these derivatives at the reporting date is included in the fair value of the Foundation’s UFIP investment as follows:
(i) Bond index swaps involve exchange of a floating interest rate cash flow for one based on the performance of a market index. Bond index swaps are valued based on changes in the appropriate market based index net of accrued floating rate interest.
(ii) Interest rate swaps involve exchange of fixed and floating rate interest cash flows. Cross-currency interest rate swaps involve exchange of fixed-to-fixed and fixed-to-floating interest rate cash flows of Canadian fixed-income securities denominated in foreign currency for Canadian currency amounts both initially and at maturity. Interest rate swaps and cross-currency interest rate swaps are valued based on discounted cash flows using current market yields and exchange rates.
(iii) Credit default swaps allow counter-parties to buy and sell protection on credit risk inherent in a bond. A premium is paid, based on a notional amount, from one counter-party to a second counter-party in exchange for a contingent payment should a defined credit event occur with respect to the underlying security. Credit default swaps are valued based on discounted cash flows using current market yields and calculated default probabilities.
(iv) Foreign exchange forward contracts are contractual agreements to exchange specified currencies at an agreed upon exchange rate on an agreed future settlement date. Forward foreign exchange contracts are valued based on quoted market prices.
Income and expense arising from net cash flow receivables or payables under derivative contracts are included in investment income. Certain derivative contracts, primarily interest rate swaps and cross-currency interest rate swaps, are designated and accounted for as hedges of market risks. Hedge accounting recognizes fair value gains and losses from hedge-effective derivatives in the same period as the offsetting gains and losses on the security being hedged. Derivative contracts not designated as hedges for purposes of hedge accounting, primarily bond index swaps, forward foreign exchange contracts and credit default swap contracts, are recorded at fair value with gains and losses included in current period income.
Note 3 CashCash consists of demand deposits in the Consolidated Cash Investment Trust Fund (CCITF). The CCITF is administered by the Ministry of Finance with the objective of providing competitive interest income to depositors while maintaining maximum security and liquidity of depositors’ capital. The portfolio is comprised of high-quality short-term and mid-term fixed-income securities with a maximum term-to-maturity of three years. As at March 31, 2007, securities held by the Fund have an average effective market yield of 4.36% per annum (2006 - 3.96% per annum). Included within Ingenuity’s cash balance is $20.6 million (2006 - $12.8 million) and $5 million (2006 - $nil) of restricted cash held for PRION Research and Water for Life programs respectively.

Alberta Ingenuity
Advanced Education and Technology ◊ 2006-07 Annual Report 145
Alberta Ingenuity
Fixed-income securities
Government of Canada, direct and guaranteed
Alberta, direct and guaranteed
Other provincial, direct and guaranteed
Municipal
Corporate, public and private
Accounts receivable and accrued investment income
Accounts payable and accrued liabilities
4 4
2,531 6,539
4 4
2,634 6,869
5 122
1,513 4,279
6,451 12,699
10,504 23,643
111 517
(46) (43)
4 120
1,448 4,208
6,765 13,440
10,855 24,641
111 517
(46) (43)
10,569 24,11710,920 25,115
$ $
$ $
$ $
$ $
Cost Cost
2007 2006
Fair Value Fair Value(in thousands)
Net realized (losses)/gains on investments includingderivatives
Income from deposits in the Consolidated CashInvestment Trust Fund (”CCITF”)
Net investment income by type of income
Net investment income by type of investment
Interest income
Income from Universe Fixed Income Pool (”UFIP”)
Investment income
Security lending income
Administration expenses
(617)
651
—
61
— (617)
46 830
132
700
—
72
651
204
61
—
46 830
— 204
700
1,115
72
—
823 — — 823 987
1 — — 1 1
(3) — — (3) (5)
—
—
—
855
855
61
61
46 1,034
46 1,034
1,815
1,815
72
72
$$$$ $
$$$$ $
$
$
$$$$ $
$$$$ $
$
$
AlbertaIngenuity
PrionResearch
2007
GenomeAlberta Water for Life Total
2006
Total(in thousands)
Note 4 Portfolio Investments - Prion FundThe Foundation’s Prion Fund investments are held in the Universe Fixed Income Pool (UFIP) established and administered by Alberta Finance. The pool is comprised of high quality Canadian fixed income instruments and related derivatives and is managed with the objective of providing above-average returns compared to the total return of the Scotia Capital Universe Bond Index over a four-year period while maintaining adequate security and liquidity of participants’ capital. Competitive returns are achieved through management of the portfolio duration and sector rotation. At March 31, 2007, the Foundation’s percentage ownership, at market, in the UFIP was 0.10% (2006 - 0.25%).
A. Investment Risk Management
B. Investment Income
The Alberta Investment Management department of Alberta Finance manages all of the investments held by Ingenuity. Income and financial returns of the Foundation are exposed to credit risk and price risk. Credit risk relates to the possibility losses may occur from failure of another party to perform according to the terms of a contract. Price risk is comprised of interest rate risk and market risk. Interest rate risk relates to the possibility investments will change in value due to fluctuations in market interest rates. Market risk relates to the possibility investments will change in value due to future fluctuations in market prices. The Foundation considers its investments to be long-term, so market devaluations are not recorded unless there is evidence a decline is other than temporary. As at March 31, 2007, the market value of its UFIP investments was $351,000 less than the recorded cost.
To earn an optimal financial return at an acceptable level of risk, Alberta Finance has established an investment policy which is reviewed annually. Risk is reduced through asset class diversification, diversification within each asset class, and quality and duration constraints on fixed-income instruments. Controls are also in place respecting the use of derivatives.
Investment income, by type of income and investment, is as follows:
Schedule of Investments in Fixed Income Securities (UFIP)

Alberta Ingenuity
Advanced Education and Technology ◊ 2006-07 Annual Report146
Albe
rta
Inge
nuity
Furniture and equipment
Computer hardware and software
Leasehold improvements
55 143 108198
134 116 106250
34 385 239419
223 644 453867
$$$$
$$$$
CostAccumulatedAmortization
2007
Net BookValue
2006
Net BookValue
Opening balance
Restricted Cash in CCITF
Contribution
Investment earnings
Due from Province of Alberta
Grants and disbursements
Investments
Ending balance
Total
—
855
—
(6,361)
10,920
30,658
29,733
36,164
18,813
—
61
—
—
—
1,796
1,796
1,735
1,796
5,000
46
—
(56)
—
4,990
5,027
—
5,027
310
—
310
—
—
310
310
—
—
5,310
962
310
(6,417)
10,920
37,754
36,866
37,899
25,636
$
$
$
$
$
$
$
$
$
$
$
$
$
$
$
$
$
$
$
$
PrionResearch
PrionResearch
GenomeAlberta
GenomeAlberta
Water for Life
Water for Life
OtherPrograms
OtherPrograms
Total
Total
(in thousands)
(in thousands)
Note 5
Note 6
Note 7
Property and Equipment
Deferred Contributions
Budget
(in thousands)
The Ministry of Advanced Education and Technology has committed to provide Alberta Ingenuity with $30 million to promote, facilitate and enhance Water research within Alberta over a 7 year period, commencing in 2006-2007. The amounts were authorized by the Ministry in 2006-07 and $5 million was received in January 2007. The balance of $25 million is scheduled to be delivered in 2007-08. Deferred contribution balances at March 31, 2007 are:
The budget process involves the determination of the cost for the estimated number of investigators sponsored for the Foundation’s awards and meeting standards of excellence which the Foundation could support within the spending guidelines and program objectives laid out by the Board of Trustees of the Foundation. The Budget was approved by the Board of Trustees on March 14, 2006.
Deferred Contributions at March 31, 2007 consist of:
As this funding is restricted in its use, the contributions are deferred and recognized as revenue in the period(s) that eligible expenditures are incurred. Restricted investment income is deferred and recognized as revenue on the same basis as the underlying restricted contributions.
At year end, Alberta Ingenuity held $925,000 in funds designated for the Prion Initiative and was due $37,000 from the Water Initiative. Advances are made quarterly from the Prion cash account to Alberta Ingenuity in anticipation of forthcoming Prion expenditures. Prior to year end, Alberta Ingenuity and the Ministry of Advanced Education and Technology entered into agreements that will see Ingenuity manage the Len Bolger Memorial Scholarship ($250,000) and an International Review of the Alberta Life Sciences Institute ($60,000). Payments to Ingenuity under the terms of these agreements will be made during the 2007-08 fiscal year.

Alberta Ingenuity
Advanced Education and Technology ◊ 2006-07 Annual Report 147
Alberta Ingenuity
(in thousands)
Chairman
2007-2008
Accumulated unused funding limit, opening
Board of Trustees
2008-2009
4.5% of average market value at March 31, preceding three years
President
2009-2010
2010-2011
2011-2012
Transfers to the Foundation during the year
Accumulated unused funding limit, closing
12,225
11,804
320
289
12,545
21,030
12,385
—
8,937
70,350
2,292
1,888
291
72,238
6,358
26,890
—
3,775
66,000
1,106
313
139
28,210
300
301
316
314,210
5,181
2,189
2,030
(21,700)
220,000
3,775
1,575
1,575
148,575
15,654
30,418
1,497
398,993
36,788
17,575
220,000
19,637
$
$
$
$
$
$
$
$
$
$
$
$
$
$
$
$
$
$
$
$
$
$
Salaries
IngenuityCentres
(a)
(a)
(b)
(b)
(c)
(c)
Other CashBenefits
Other Grantsand Awards
2007
2007
OtherNon-CashBenefits
OfficePremises
Total
Total
2006
2006
Total
Note 8
Note 10
Note 9
Executive Compensation
Commitments
Alberta Heritage Foundation for Science and Engineering Research Endowment Fund
(a) Salaries include regular base pay.(b) Other Cash Benefits include bonuses, overtime, lump sum payments and honoraria.(c) Other Non-Cash Benefits include the Foundation’s share of all employee benefits and contributions
or payments made on behalf of employees including Employment Insurance, Canada Pension Plan, Accidental Death and Dismemberment insurance, long and short-term disability plans, professional memberships and group pension.
(a) The amounts to be paid to the Ingenuity Centres in future years will be based on budgets to be submitted by the Centres, the amount of which is not known at this time. The amounts included in the schedule above are based on the amounts budgeted for 2006-07.
(b) Commitments for Other Grants and Awards include amounts estimated to be paid under the terms of the grant agreements in future periods provided all conditions of eligibility are met by the recipient.
(c) The Foundation has entered into a 120-month lease for the Manulife office premises, which expires on January 31, 2016.
The Endowment Fund operates pursuant to the Alberta Heritage Foundation for Science and Engineering Research Act and consists of endowment contributions of $721 million (including $100 million deposited in September 2006) from the General Revenue Fund of the Province of Alberta together with cumulative earnings thereon, less cumulative transfers to the Foundation. At March 31, 2007, the book value of the net assets of the Endowment Fund were $836 million (2006 - $677 million) and the market value of the investments were $892 million (2006 - $716 million).
In the 2005 Spring session of the Alberta Legislature, the Government announced its commitment to increase the Endowment Fund by an additional $500 million. As at March 31, 2007, $200 million has been transferred to the Fund under this commitment.
For 2004-05 and subsequent years, payments from the Endowment Fund to the Foundation in the fiscal year may not exceed 4.5% of the average of the market values of the Fund determined on March 31 of the preceding three fiscal years. Any unused portion of the amount permitted to be paid in a fiscal year may be paid to the Foundation in any subsequent fiscal year.
(in thousands)
10,675
7,902
89,578
22,458
267,301
(17,975)
367,554
12,385

Alberta Ingenuity
Advanced Education and Technology ◊ 2006-07 Annual Report148
Albe
rta
Inge
nuity
Revenue
Transfers from Endowment Fund (Note 9)
Grants from Advanced Education and Technology (Note 6)
Interest and other revenue
Programs
Ingenuity Centres
Students
Research Funding
Industrial Associates
Infrastructure Funding
Fellowships
Scholars
New Faculty Awards
Industrial Interns
Associateships / Establishment Grants
Special Initiatives
Sponsorships
Operations
Administration
Human Resources
Corporate Administration
Communications
Governance and Planning
Program Development
Amortization
Peer Review
Strategic Initiatives
Excess (deficiency) of revenues over expenses
21,700 — — 21,700
— 6,361 56 6,417
71 — — 71
21,771 6,361 56 28,188
8,502 —
—
3,438
—
2,200
—
—
—
—
—
—
—
5,638
—
—
—
—
—
—
—
—
—
—
—
—
—
8,502
4,121 4,121
— 3,438
3,304 3,304
— 2,200
1,982 1,982
1,468 1,468
725 725
396 396
150 150
103 103
43 43
20,794 26,432
1,446 380 — 1,826
282 115 — 397
190 — — 190
105 33 — 138
6 — — 6
2,029 528 — 2,557
357 171 49 577
299 24 7 330
105 — — 105
761 195 56 1,012
23,584 6,361 56 30,001
(1,813) — — (1,813)
$ $ $
$ $ $
$
$
PrionInstitute
WaterInstitute Consolidated
AlbertaIngenuity(in thousands)
for the year ended March 31, 2007Consolidated Statement of Operations
Note 11 Approval of Financial StatementsThese financial statements were approved by the Board of Trustees.
Note 12
Schedule A
Comparative FiguresCertain comparative figures have been reclassified to conform to the presentation for the current year.
for the year ended March 31, 2007Schedule to the Financial Statements

Advanced Education and Technology ◊ 2006-07 Annual Report 149
Other InformationO
ther Information
Endnotes
Statement of Remissions, Compromises and Write-offs
Statement of Guarantees and Indemnities
Audited InformationOther Information

Other Information
Advanced Education and Technology ◊ 2006-07 Annual Report150
Oth
er In
form
atio
n
2,268
3,837
1,569
±1.1%
±0.9%
±1.6%
Completed Interviews
ConfidenceIntervalCohort
Graduates who attended technical training and completed on-the-job training requirements of their trade in the 2005-06 school year.
Total
Graduates who completed their apprenticeshipprogram in the 2005-06 school year, but did not attendtechnical training in that year.
±0.7%
±0.5%
±0.9%
±1.2%
±2.7%
ConfidenceInterval
8,212
17,243
5,469
3,101
461
Completed InterviewsSector
Universities
System Total
Public Colleges
Technical Institutes
Private University Colleges
Surveys of recent apprenticeship graduates are conducted every other year. The last survey was conducted in 2007, with 3,117 interviews of apprentices who had graduated between August 1, 2005 and July 31, 2006. Graduates were surveyed by telephone about their satisfaction with the apprenticeship and industry training system. Survey findings were published in the report Survey of 2005-06 Graduates of the Apprenticeship System - Key Performance Indicators, May 14, 2007. The percentages of Alberta apprenticeship training system graduates who were somewhat satisfied or very satisfied with the quality of their on-the-job training and technical training are reported.
Satisfaction questions are based on a four-point scale. Satisfaction rates are based on those respondents who report being somewhat satisfied or very satisfied. The percentage is calculated by dividing the sum of the somewhat satisfied and very satisfied by the total number of survey respondents, including the don’t know responses to these questions.
Not all apprenticeship graduates completed a technical training component as part of their apprenticeship program. As a result, respondents who had not completed any technical training or who had completed their technical training prior to starting their apprenticeship were omitted from this portion of the analysis. This represents about 13% of the apprentice graduate population.
In order to provide detailed analysis by trade group, training institute and region, the sampling frame included a census of the populations of both cohorts, with a minimum number of completed interviews attained for each cohort. The following table provides the sample size and confidence interval for each cohort.
Based on the sampling method identified above, a minimum of 3,837 completed interviews was to be conducted from the two cohorts. The population of 2005-2006 graduates of apprenticeship training was split 55% to 45% respectively between those who completed both their technical training and on-the-job training requirements in the 2005-2006 school year and those who had completed their technical training prior to the 2005-2006 school year (or were not required to take any technical training during their apprenticeship).
Despite the shortfall in the number of expected survey completions, overall survey results provide a margin of error of no greater than +1.2% at the 95% confidence level or 19 times out of 20, and does not impact the quality of the results reported. Based on the outcome of all call attempts, an overall response rate of 58% was achieved for Cohort 1 and 48% for Cohort 2, with an overall response rate of 53%.
The final reports on the surveys mentioned below can be access at:
www.advancededucation.gov.ab.ca/pubstats/research.asp
The Post-Secondary Graduate Outcomes Surveys are conducted every other year of graduates of publicly funded post-secondary institutions two years after graduation. The last survey was conducted in 2006, with 17,243 interviews being conducted of 2003-04 graduates from parchment programs at 28 Alberta publicly funded post-secondary institutions. The results of previous graduate surveys were reported in the Alberta Learning 2003-04 Annual Report and the Alberta Advanced Education 2004-05 Annual Report. However, the results of those surveys are not comparable to the survey results for 2003-04 graduates because of changes in survey methodology. The 2006 survey used a four-point scale for questions related to graduate satisfaction (very satisfied, satisfied, dissatisfied and very dissatisfied categories), whereas previous surveys used a five-point scale (including a middle neutral response category).
Graduates were surveyed by telephone about their employment outcomes upon graduating, further studies undertaken, and satisfaction with the overall quality of their educational experience. For smaller institutions, a census survey method, which attempts to obtain responses from all graduating students, was used. The larger institutions used a quota sampling method, which targeted achieving a response rate of 60%.
Only graduates of parchment programs (i.e. certificate, diploma and degree programs) were surveyed. The targeted number of responses was set to achieve a 95% confidence level, by institution, with a 5% confidence interval (or better). Results are reported across each of the following types of institutions: all universities combined, all university colleges combined, all colleges combined and all technical institutes combined. Results presented are the combined percentages of respondents who were very satisfied / satisfied, or who strongly agreed / agreed. No responses were excluded.
Endnotes
Endnote A Surveys Conducted by an ExternalContractor
Survey of Post-Secondary Institution Graduates
Survey of Apprenticeship Graduates
The 2006 survey was coordinated by Alberta Advanced Education to ensure consistent implementation of the survey among all participating post-secondary institutions, using a common survey methodology and timeframe. The survey was conducted between January and April of 2006 by an independent third-party contractor. The question set used will be in the next update of the Key Performance Indicators Reporting Manual for Alberta’s Post-Secondary Institutions, available online at:
www.advancededandtech.gov.ab.ca/software

Other Information
Advanced Education and Technology ◊ 2006-07 Annual Report 151
Other Inform
ation
2002-03
Survey
2003-04
2004-05
2005-06
2006-07
C.I.C.I.C.I.C.I. SampleSampleSampleSample
Public(re the adult
learning system)
Adult Learners Adults notparticipating
in learning
Employers
±1.8%
±1.8%
±1.8%
±1.8%
±1.8%
3,109
3,000
3,000
3,000
3,000
1,103
1,000
1,035
1,049
986
±2.9%
±3.1%
±3.0%
±3.0%
±3.1%
2,006
2,000 2,000
2,200
—
—
—
1,965
1,951
2,014
±2.2%
±2.2% ±2.2%
±2.0%
—
—
—
±2.2%
±2.2%
±2.2%
When a result is obtained by surveying a random sample of the target population (e.g. the public, employers, graduates), there is a confidence interval associated with the result, which is expressed as a percentage above and below the obtained result. A confidence interval indicates how much variation one might expect from the obtained survey result, as a consequence of sampling and diversity among respondents. Differences in survey results over time or among respondent groups on the same survey question are reported at the “.05 level of confidence” (i.e. the same results would be obtained in repeated sampling 19 times out of 20).
In Alberta Advanced Education and Technology’s Annual Report, confidence intervals are used to determine:
whether differences in survey results over time are likely the result of sampling variations, or represent actual change, and
whether differences among respondent groups to the same question are likely the result of sampling variations or represent actual differences.
When comparing results of survey questions over time or among respondent groups, there is an actual difference between two survey results, 19 times out of 20, if there is no overlap between the confidence intervals of the two observed values. When this is the case, it is acknowledged in the related text that there is an increase, change or significant difference in survey results over time or among groups. When the confidence intervals of the two observed values do overlap, the observed difference will be due to sampling variation 19 times out of 20, and we cannot conclude that the difference is real (i.e., “significant”). In such cases, the related text indicates that results are similar or stable over time or among groups.
The following hypothetical examples illustrate:
a) two survey results where the confidence intervals overlap and, consequently, it is concluded that there is no real difference between the two survey results.
b) two survey results where the confidence intervals do not overlap and, consequently, it is concluded that there is a real difference between the two survey results.
a) Where two survey results are 76% and 80%, both with a confidence interval of 2.5%, then the upper limit of the confidence interval for the “76%” result is 78.5%, and the lower limit of the confidence interval of the “80%” result is 77.5%. Since the confidence intervals “overlap”, it cannot be concluded that there is a real difference between the two survey results, as the observed difference could be due to sampling variation.
b) If the two survey results are 74% (with a confidence interval of 2.5%) and 80% (also with a confidence interval of 2.5%), the upper limit of the confidence interval for the “74%” result is 76.5%, and the lower limit of the confidence interval of the “80%” result is 77.5%. Since the confidence intervals “do not overlap,” it can be concluded that there is a real difference between the two survey results, as sampling variation alone does not account for the observed difference. In such cases, the related text indicates that there is a significant difference over time (i.e. an increase or decrease) or between groups.
�
�
The survey instruments for these surveys use four-point response scales (very satisfied / satisfied / dissatisfied / very dissatisfied or strongly agree / agree / disagree / strongly disagree), depending on the question. Although not asked, don’t know responses and refusals are recorded as well. Results presented are the combined percentages of respondents who were very satisfied / satisfied, or who strongly agreed / agreed.
The public survey results were published April 2007 in the report Satisfaction with Education in Alberta, Public / Adult Learners /Adult Non-Learners, 2006-07. The last employer results were published March 2006, in the report 2005-06 Employer Satisfaction Survey.
C.I. - Confidence Interval
Endnote B Use of Confidence Intervals for Interpreting Survey ResultsAlberta Advanced Education and Technology collaborated with Alberta
Education to commission telephone surveys of random samples of the Alberta public and key client groups. The purpose of these surveys is to obtain perceptions of how the education system is performing in meeting learners’ and society’s needs and expectations. Professional survey research firms are contracted to conduct the surveys, using trained interviewers and the Computer-Assisted Telephone Interviewing (CATI) system. Survey results are compiled by the survey research firms and provided to the two ministries. Surveys of the public are conducted annually. Graduate, employer, and learning system partners and stakeholder surveys are conducted every second year. The next employers’ satisfaction survey will be conducted in 2007-08.
The following table provides sampling information about the public survey conducted for the two ministries in recent years that are reported in this 2006-07 Annual Report. The information includes the respondent groups surveyed, sample sizes and the confidence intervals for results from the survey. Results are considered accurate within the confidence interval 19 times out of 20 (i.e. at a confidence level of 95%). Sampling variation can account for observed differences in results from year to year.
Public and Employer Surveys

The increase in full-load equivalent (FLE) student spaces is designed to measure the number of newly funded spaces over and above the base year. There has been considerable variability in the number of newly funded FLE spaces offered over time, depending on training demand, government budget allocations and difficulty in standardizing the methodology between apprenticeship and certificate, diploma and degree programs. This measure has been dropped in the 2007-10 Business Plan.
The increase in FLE spaces measures the increased number of certificate, diploma and degree spaces and the increased number of apprenticeship seats funded by government. The department uses FLE as the measure for enrolment in post-secondary programs. One FLE represents one student taking a full-load for a standard year of study. Since students can attend training for varying lengths of time depending on program choice, the full load equivalent measure of spaces allows for comparisons across program types. The increase in FLE spaces measures the number of funded FLE spaces over and above the number of spaces available in 2005-06.
For certificate, diploma, and degree programs, the increase is the number of spaces over and above the total enrollment in the base year (2003-04). The two-year lag in calculating the increase is used since the Enrolment Planning Envelope (EPE) seat levels in 2005-06 are negotiated in 2004-05 based on the number of spaces funded in 2003-04. There is a two-year lag for calculating the increase in spaces. For apprenticeship programs, the increase is the number of seats over and above the total number of seats funded in the base year (2004-05). Apprenticeship seat funding is negotiated based on the number of seats required for technical training in a given year. The base years show the increase in funded spaces over and above those provided for learners in 2005-06.
Endnote F Increase in Full-Load Equivalent Spaces
Other Information
Advanced Education and Technology ◊ 2006-07 Annual Report152
Oth
er In
form
atio
n
±1.0%
±1.0%
±1.0%
±5.0%
Coefficientof Variation
1,337
1,918
8,517
324
AverageMonthlyCount ofPersons *Age Group
18-24
25-34
18-64
25-64
Population
All Albertans
Aboriginal Albertans
Additional information on the Labour Force Survey methodology and interpreting CVs is available on pages 18-25 of the Guide to Labour Force Survey, Catalogue no. 71-543-GIE (Revised February 2006), available online from Statistics Canada: www.statcan.ca.
The Labour Force Survey (LFS) is a monthly Canada-wide survey, conducted by Statistics Canada, of a representative sample of households in the ten provinces. Data are collected on all members of the household who are 15 years of age or older. Residents of the Yukon, Northwest Territories and Nunavut, persons living on Indian Reserves, inmates of institutions, and full-time members of the Canadian Armed Forces are excluded from the survey.
The Canadian sample size for the LFS averaged 53,372 households over the reporting period. Alberta’s sample size corresponds to its share of the population. In 2006, between 5,119 and 5,254 Alberta households were surveyed each month (an average of 5,209 per month), with information provided on between 10,241 and 10,560 individuals per month.
A change in LFS methodology to measure post-secondary completion rates was introduced in the 2005 reporting year. Previously, only college and university participation rates were included in the measure. The measure reported in this annual report was expanded to include other post-secondary education. The other category, as defined by Statistics Canada, includes those who report attending institutions such as English as a second language or taking French language courses that do not qualify as high school, college or university education; computer and business skills programs other than those offered by colleges or universities; culinary, hairdressing or bartending schools; and police academies. Including the other category makes the measure more inclusive, in keeping with the direction of the Ministry to encourage all types of advanced learning. This change in methodology results in a change in the participation rate for 2003 from 33%, as reported in the 2004-05 Annual Report, revised to 34% in this report.
To capture information on Aboriginal Albertans, Alberta Advanced Education and Technology, along with other government departments, has contracted Statistics Canada to over-sample the Aboriginal population in the LFS, to improve the quality of data available on Aboriginal educational and labour market outcomes. Aboriginal identifier questions were added to the Alberta LFS and the sample was increased. Increased sampling was undertaken in urban centres such as Edmonton, Calgary, Lethbridge and Red Deer, with significant Aboriginal populations. Between 220 and 243 Alberta households containing Aboriginals were surveyed each month in 2006, with information provided on between 296 and 358 Aboriginal individuals aged 25-64 each month and a total of 3,886 over the year.
The coefficient of variation (the standard error as a percentage of the reported result), which measures the accuracy of the Labour Force Survey’s estimates, varies and is proportional to the size of the age groups. In general, the larger the head count in each age group, the higher the accuracy. Below is a table showing the sizes of the age groups and the associated coefficients of variation.
Endnote C Endnote DStatistics Canada’s Labour Force Survey Learner Enrollment Recording SystemThe Learner Enrollment Recording System (LERS) is a database used by the department to track changes in learner demographics and characteristics in the advanced education system. Alberta publicly funded institutions submit their enrolment data in credit programs to the department where it is reviewed. Enrolment data are subject to a host of accountability constrains and are signed off by institutional and department officials as correct. Data for Alberta’s publicly funded institutions is reported in LERS for the academic year (May to April for universities, July to June for colleges and technical institutes and May to April for private universities colleges). Finalized data is available in the fall for the previous school year.
Endnote E International Visa Students Registeredat Alberta Post-Secondary Institutions
This is a new measure in the 2007-10 Business Plan. No targets were set. International student participation is a measure of the quality of the advanced learning system. Change in enrolment over time is an indicator of the department’s success in achieving international recognition and increasing international visa student participation.
The total number of international students has been defined as the total unduplicated headcount of students who require a visa to study in Canada and are physically attending a publicly-funded post-secondary institution in Alberta at some point during the academic year. Learners taking online classes from their home country are not included in this measure. Data is provided by institutions and stored in the Learner Enrollment Reporting System (LERS).
See Endnote D (p. 152) for information on LERS.
* approximate number
Other Information
Advanced Education and Technology ◊ 2006-07 Annual Report 153
Other Inform
ation
Apprenticeship registrations are a key factor in addressing critical skill shortages. Participation in apprenticeship training is increasing as a result of the very busy economy and initiatives aimed at increasing the number of Aboriginal Albertans in the trades.
This measure is based on the number of registrations of Aboriginal Albertans at year end (December 31). Aboriginal status is self-disclosed, so the count of registrations may be lower than the actual number of Aboriginal persons participating in apprenticeship. Aboriginal apprentices who registered in more than one trade or branch of a trade within the year are counted only once.
This measure includes Aboriginal apprentices registered in Alberta’s apprenticeship and industry training system, but who reside in other Canadian jurisdictions. Alberta provides technical training for apprentices from other provinces and territories where the trade is designated, but the jurisdictions are unable to provide the training due to small apprentice registration numbers. Alberta does not issue these individuals a certificate. In 2005, there were no such Aboriginal apprentices participating in Alberta’s apprenticeship and industry training system. In 2006, there were three.
The source of this data is Advanced Education and Technology’s Skilled Trades Information System (STIS). STIS is a dynamic database system, which is updated constantly by field staff all over the province. Therefore, the data generated is only as up-to-date as the last update provided from staff. The data is not frozen and results can vary if pulled at different points in time. As a result, this data will not be able to be replicated from STIS at a later date.
Apprenticeship registrations are a key factor in addressing critical skill shortages. Participation in apprenticeship training is increasing as a result of the very busy economy. The ability to attract learners into the apprenticeship system is influenced by economic circumstances and employer willingness to employ and sign on more apprentices. Therefore, the department’s ability to impact this measure is limited.
The number of new apprentice registrations by calendar year is available historically. This measure is based on a five-year average calculation of the number of new registrations. An average is taken in order to smooth out any sharp rises or drops in the level that could occur in a particular year. The 2006 figure is based on averaging registrations from 2002-2006.
New apprentices include all apprentices that register during the calendar year. It includes those returning to do an additional apprenticeship after completing one or more apprenticeships in previous years and those continuing an apprenticeship in another trade for which they registered in a previous year. Apprentices who registered in more than one trade or branch of a trade within the year are counted only once. The number does not include re-instated apprentices (unless re-instated in the same year).
The source for these data is Advanced Education and Technology’s Skilled Trades Information System.
This is a new measure in the 2007-10 Business Plan. No targets were set. Targets will be set in the 2008-11 Business Plan once three years of data is acquired. Aboriginal participation at post-secondary institutions is a measure of the system’s ability to attract diverse learners. Monitoring this information and observing the changes in enrolment over time is an indicator of the Ministry’s success in increasing Aboriginal learner participation in post-secondary education.
Aboriginal participation in post-secondary education is measured by the total unduplicated headcount of Aboriginal learners from Alberta who have registered at publicly funded post-secondary institutions. Data is collected from the institutions and entered into the Learner Enrollment Reporting System (LERS). Learners who self-identified as Status Indian/First Nations, Non-Status Indian/First Nations, Métis, or Inuit and who reported they were residents of Alberta were included in the count. Aboriginal status is self-disclosed, therefore the count of registrations may be lower than the actual number of Aboriginal learners participating in the system.
The 2007-10 Business Plan reports that 6,386 Aboriginal learners participated at Alberta publicly-funded post-secondary institutions in 2004-05. However, this is the total number of self-identified Aboriginal learners from all geographic sources, including other parts of Canada and possibly the United States. The 5,455 learners that are reported here for 2004-05 include only the Aboriginal learners from Alberta participating in post-secondary institutions.
See Endnote D (p. 152) for information on LERS.
Endnote I
Endnote H
Participation of Aboriginal Albertans at Post-Secondary Institutions
Participation of Aboriginal Albertans in Apprenticeship
Endnote G New Apprentice Registrations
This is a new measure being reported for the first time in Advanced Education and Technology’s 2006-07 Annual Report. No targets were set as this is a new measure. Targets have been set in the 2007-10 Business Plan.
The percentage of post-secondary graduates with prior learning who reported they had received the transfer credit they expected is an indicator of the ability of the system to help students achieve desired outcomes. Additionally, the measure offers insight into collaborative transfer arrangements between Alberta’s post-secondary institutions.
In the Alberta Post-Secondary Graduate Outcomes Survey, Class of 2003-04, graduates with prior learning were asked if they received the transfer credit they expected. Results reported include only those who responded yes (other response options included no, don’t know and no response). Graduates are surveyed two years after graduation.
See Endnote A (p. 150) for information on the Post-Secondary Graduate Outcomes Survey.
Endnote J Graduates who Received the TransferCredit they Expected

Other Information
Advanced Education and Technology ◊ 2006-07 Annual Report154
Oth
er In
form
atio
n
This is a new measure being reported for the first time in the 2006-07 Annual Report. No targets were set as this is a new measure. Targets have been set in the 2007-10 Business Plan.
The ratio of graduates’ income two years after graduation to debt at graduation is a measure of the ability of learners to afford and attend post-secondary education considering their employability after graduation. A lower ratio of debt to income is indicative of lower debt levels of students and/or higher incomes after graduation.
The Graduate Outcomes Survey targets graduates two years after graduation. This measure is based on graduates who had debt at the time of their graduation and were employed two years after graduation. The ratio of debt to income is calculated by dividing median debt by median income. Graduates who did not accumulate any debt by graduation or were not employed two years after graduation were not included in the calculations as they would have skewed the results.
See Endnote A (p. 150) for information on the Post-Secondary Graduate Outcomes Survey.
This is a new measure being reported for the first time. No targets were set. Targets have been set in the 2007-10 Business Plan. Scholarship dollars per full-time student provides a snapshot of the Ministry’s ability to fulfill one of its strategic priorities of ensuring quality and innovation in the advanced learning system.
The scholarship dollars per full-time student is determined by the total scholarship expenditures divided by the total number of full-time students in Alberta’s post-secondary institutions. Scholarship expenditure data comes from Alberta Advanced Education and Technology’s Learner Assistance Sector. Department expenditures on Achievement Scholarships, as well as the French Fellowship. Enrolment data comes from the Learner Enrollment Reporting System (LERS).
See Endnote A (p. 150) for information on the Post-Secondary Graduate Outcomes Survey.
See Endnote D (p. 152) for information on LERS.
This is a new measure, so no targets were set. Targets have been set in the 2007-10 Business Plan. The percentage of post-secondary graduates who agree that the program they graduated from was worth the financial cost is an indicator of the ability of the system to help students achieve desired outcomes.
Data comes from the Alberta Post-Secondary Graduate Outcomes Survey, Class of 2003-04. Graduates surveyed two years after graduation were asked if they considered the program they graduated from to be worth the financial cost to themselves and/or their family. Responses for those who agree or strongly agree were combined to obtain the percentage of graduates who agree that the program they graduated from was worth the financial cost.
See Endnote A (p. 150) for information on the Post-Secondary Graduate Outcomes Survey.
This is a new measure being reported for the first time. No targets were set. Targets have been set in the 2007-10 Business Plan. Public satisfaction that courses, programs and classes are offered in locations that are accessible is an indicator of accessibility of post-secondary education.
Through the annual public survey, Albertans are asked how satisfied they are that “programs, classes or courses you want are offered in locations (including on-line) that are easily accessible for you.” The satisfaction levels are the combined percentages of satisfied and very satisfied responses.
See Endnote A (p. 150) for information on Education and Advanced Education and Technology’s Public Survey.
Endnote K
Endnote L
Endnote M
Endnote NGraduates’ Satisfaction that theirProgram was Worth the Financial Cost
Public Agreement that Post-SecondaryEducation is Accessible
Ratio of Debt at Graduation to IncomeTwo Years After
Scholarship Dollars per Full-TimeEquivalent Learner
Innovation comprises science and technology (S&T) and other sources of new ideas that lead to new and improved products and services. S&T comprises of Research and Development and Related Science Activities, which are reported annually by all Government of Alberta (GOA) ministries in a Statistics Canada report. Data are available for the 2005-06 year.
Additional programs and investments supporting innovation in the province are:
The Innovation Program, administered by Advanced Education and Technology on behalf of the GOA.
The Industry and Regional Development, Trade and Investment, investments carried out by Alberta Economic Development.
The Innovative Energy Technology Program, administered by Alberta Energy which supports the adoption and use of innovative energy technologies. It provides royalty adjustments to a number of specific pilot and demonstration projects that use innovative technologies to increase recoveries from existing reserves and encourage responsible, development of oil, natural gas and in-situ oil sands reserves.
The Alberta Heritage Foundation for Medical Research that received a $200 million top up to its endowment in 2005-06 and Alberta Ingenuity, which received a $100 million top up to its endowment in the same year.
GOA investments to support innovation totaled 726.8 million in 2005-06. The actual total expense of the GOA in 2005-06 was $27,191 million. These numbers were used to calculate the percentage of GOA expense used to support innovation.
�
�
�
�
Endnote O Government of Alberta Expense usedto Support Innovation
Other Information
Advanced Education and Technology ◊ 2006-07 Annual Report 155
Other Inform
ation
Data on Canadian venture capital comes from the VCAnalyst system provided by Thomson Financial, the premiere source of venture capital information in Canada, at www.canadavc.com. The amount of VC funds invested in Canada and the provinces is collected within the following parameters:
Data are collected for Quarters 1, 2, 3 and 4 of Year One.
Data are collected for both new fundings and follow-on fundings.
Data are collected for the life sciences, information and communications, and other technology (energy and environmental).
Data are not collected for traditional industries (i.e. retail and manufacturing).
Data are collected for early stage deals (seed and start-up) and expansion stage deals.
Data are not collected for later stage deals (mezzanine, turnaround, etc.).
Data are collected for all size deals (i.e. $500,000 through $5 million).
The data is stored in a dynamic database, which can have data added to earlier periods at a later date. Thus, data can be more accurate at later dates when additional information becomes available. 2006 data was retrieved from the system on May 11, 2007.
�
�
�
�
�
�
�
Business expenditure on research and development data comes from Statistics Canada’s report: R&D expenditures in the provinces by business enterprise, in terms of performing and funding, 1990 to 2004, Vol. 30, No. 7. Catalogue 88-001-XIE / ISSN 1209-1278.
www.statcan.ca/english/freepub/88-001-XIE/88-001-XIE2006007.pdf
Statistics Canada obtains R&D data from research performers. The funding data reported here is the amount of research and development funding provided by businesses. Provincial level data, including Alberta’s data, lags by two years due to the information gathering and analysis process. The data is collected annually by Statistics Canada.
As funding is a dynamic process, Statistics Canada updates its data as information becomes available. Data from 2001, 2002 and 2003 were revised in the 2006 Statistics Canada report and therefore are being restated in the 2006-07 Annual Report.
The number and percentage of employees in knowledge-based (high-tech) companies is a measure of Alberta’s research and innovation capability. Alberta knowledge-intensive (high-tech) company employment information comes from Statistics Canada. Results are based on the Labour Force Survey.
Knowledge-intensive (high-tech) companies are defined by North American Industry Classification System (NAICS). The following NAICS codes comprise the High-Technology Sector:
3254 - Pharmaceutical and Medicine Manufacturing
334 - Computer and Electronic Manufacturing
3353 - Electrical Equipment Manufacturing
3359 - Other Electrical Equipment and Component Manufacturing
3364 - Aerospace Product and Parts Manufacturing
5112 - Software Publishers
5152 - Pay and Specialty Television
516 - Internet Publishing and Broadcasting
517 - Telecommunications
5182 - Data Processing, Hosting, and Related Services
5191 - Other Information Services
5413 - Architectural, Engineering and Related Services
5415 - Computer Systems Design and Related Services
5416 - Management, Scientific and Technical Consulting Services
5417 - Scientific Research and Development Services
6215 - Medical and Diagnostic Laboratories
8112 - Electronic and Precision Equipment Repair & Maintenance
Endnote P
Endnote Q
Endnote RAlbertans Employed inKnowledge-Intensive Companies
Canadian Venture Capital Invested inPriority Areas
Business Expenditure on Research and Development
Total sponsored research revenue attracted by Alberta universities is an indicator of the value of sponsored research at Alberta universities. The funding sources include the provincial government, industry, non-profit organizations, and the federal government.
Sponsored research revenues are those received outside of the university base operating grant and include both research grants and research contracts. This performance measure reflects research capability in Alberta through the success of its major universities in attracting sponsored research funding from several sources.
The data is provided to Advanced Education and Technology by the University of Alberta, University of Calgary, University of Lethbridge and Athabasca University. The universities submit the data using a template and guidelines, which outline the information required and specific instructions about how the revenue should be reported. This ensures the data submitted are comparable across universities. The universities derive the data from audited financial statements and supplementary schedules. The reported data is compiled and analyzed by Advanced Education and Technology in the Research Funding at Alberta Universities Report published by the University Research and Strategic Investments Branch, Advanced Education and Technology.
www.innovation.gov.ab.ca/inv/sec/ursi/res_rep/doc/2005-06_Sponsored_Research_Report.pdf
The 2005-06 finalized number was available in December 2006.
Endnote S Sponsored Research Revenue Attractedby Alberta Universities

Other Information
Advanced Education and Technology ◊ 2006-07 Annual Report156
Oth
er In
form
atio
n
This is a new measure and therefore no targets were set. Targets have been set in the 2007-10 Business Plan. Alberta Advanced Education and Technology recognizes the importance of participating in graduate level post-secondary programs. Having people with the right skills and knowledge is what will drive Alberta’s economy and position Alberta for success.
This measure presents a headcount of graduate students studying in Alberta. The measure does not differentiate between part-time and full-time students or between Masters, PhD and Post Doctorate students. A student participating in a graduate level course counts as one student. Data comes from the Learner Enrollment Reporting System (LERS).
See Endnote D (p. 152) for information on LERS.
The Ministry tracks investments in energy, ICT and life sciences research. Government of Alberta and non-Government of Alberta investments are tracked in the Grantium database.
Grantium is a complete Enterprise Grants Management software solution used by Advanced Education and Technology to consolidate/automate the life-cycle process for grant programs. It provides web access to information about grant programs and common web links that explain the grant program to prospective applicants. Grantium manages all stages of pre- and post-award grant processing. Project information is submitted to the department by the applicant, where it is reviewed and verified by program staff. The workflow in Grantium is configured to ensure data integrity. The data is reviewed by representatives in the Research Division and with Research Institutes and business areas as required. Business areas review reports and input updates to the Grantium database as the reports are received, to support the accuracy of the data.
Data for the ratio of private and other public investments in energy research comes from the Grantium database.
Data for the ratio of private and other public investments in life sciences research comes from Grantium and SIR databases. The Ministry of Advanced Education and Technology obtains data from active research agreements and enters it into the SIR database. Information is added after research agreements are signed and updated or when the agreements are amended or more recent information becomes available.
Data for the ratio of private and other public investments for ICT comes from Grantium and iCORE. Researchers funded through iCORE are required to submit an annual report by May 15. The annual report contains details on all funding obtained, including funding sources. iCORE consolidates the information from researchers to derive this measure. The information is also cross-validated with other sources (CFI, CRC, ASRIP and AIF data).
Data for all three ratio measures comply with the Leverage Measure Guidelines, last revised in 2007. All administrative streams are excluded.
Total sponsored research revenue attracted by Alberta technical institutes and colleges measures the growth of the research capacity and capability of technical institutes and colleges in the province.
The data is reported based on standardized sponsored research reporting templates submitted by each institution to the Ministry of Advanced Education and Technology. Questions from the institutions about the guidelines, reporting of data and the final data collection are directed to a representative of Advanced Education and Technology. The data are compiled by the department representative and verified by a manager before it is reported in the business plan.
Endnote T
Endnote U
Endnote VSponsored Research Revenue Attractedby Alberta Technical Institutes andColleges
Graduate Students Studying in Alberta
Investments in Priority Research Areas
The measure is a summary of the data from contracts iCORE has with the universities to fund Major Awards and Graduate Student Awards. An electronic database of contract information is maintained which generates reports on counts of contracts and individuals.
Major Awards include: research chairs, research professors and industry research chairs. In the case of a co-award, where two people share a major award, this is counted as two awards as there are two people who receive the title and funding. There was one co-award in 2006-07. In instances where one person received two awards (a research chair and an industry chair), each award is counted separately. In 2006-07 there were two people who each received two awards for a total of four awards.
iCORE has board-approved criteria and processes for making graduate student awards. For each graduate student, the criteria are checked and the award is made.
iCORE submits its compilation of data to the Ministry. A management committee then reviews the data before the respective report is finalized.
Endnote W iCORE Awards

Other Information
Advanced Education and Technology ◊ 2006-07 Annual Report 157
Other Inform
ation
Crown Guarantees
Total write-offs - Implemented Guarantees, Indemnities, Loans and Advances - Section 20 of the Student Financial Assistance Act
Total remissions, compromises and write-offs
Total compromises
Write-offs
Remissions under Section 21 of the Financial Administration Act
Compromises under Section 22 of the Financial Administration Act
Total remissions
—
34,882
632
64
34,187
1,684 1,643$
$
$
$ $
Amount ofGuarantee Payments Recoveries(in thousands)
(in thousands)
The following statement has been prepared pursuant to Section 23 of the Financial Administration Act. This statement includes all remissions, compromises and write-offs made or approved during the fiscal period.
Statement of Remissions, Compromises and Write-offs
Statement of Guarantees and Indemnities given bythe Crown and Provincial Corporationsfor the year ended March 31, 2007
for the year ended March 31, 2007
The following has been prepared pursuant to Section 75 of the Financial Administration Act. The statement summarizes the amounts of all guarantees given by the Crown through the Ministry of Advanced Education under the Student Financial Assistance Act for the year ended March 31, 2007, the amounts paid as a result of liability under guarantees, and the amounts recovered on debts owing as a result of payments under guarantees.

Government Entities
Advanced Education and Technology ◊ 2006-07 Annual Report158
Gov
ernm
ent E
ntiti
es
Entities included in the Consolidated Government Reporting Entity
Entities not included in the Consolidated Government Reporting Entity
Schools, Universities, Colleges and Hospitals included in the Consolidated Government ReportingEntity
Alphabetical List of Government Entities’ Financial Statementsin Ministry 2006-07 Annual Reports

Government Entities
Advanced Education and Technology ◊ 2006-07 Annual Report 159
Governm
ent Entities
1Access to the Future Fund Advanced Education and Technology
Agriculture Financial Services Corporation Agriculture and Food
Alberta Alcohol and Drug Abuse Commission Health and Wellness
Alberta Cancer Prevention Legacy Fund2 Finance
Alberta Capital Finance Authority Finance
Alberta Energy and Utilities Board Energy
Alberta Foundation for the Arts Tourism, Parks, Recreation and Culture
Alberta Gaming and Liquor Commission Solicitor General and Public Security
Alberta Heritage Foundation for Medical Research Endowment Fund Finance
Alberta Heritage Savings Trust Fund Finance
Alberta Heritage Scholarship Fund Finance
Alberta Heritage Science and Engineering Research Endowment Fund Finance
Alberta Historical Resources Foundation Tourism, Parks, Recreation and Culture
Alberta Insurance Council Finance
Alberta Local Authorities Pension Plan Corporation3 Finance
Alberta Pensions Administration Corporation Finance
Alberta Petroleum Marketing Commission Energy
Alberta Research Council Inc. Advanced Education and Technology
Alberta Risk Management Fund Finance
Alberta School Foundation Fund Education
Alberta Securities Commission Finance
Alberta Social Housing Corporation Municipal Affairs and Housing
Alberta Sport, Recreation, Parks and Wildlife Foundation Tourism, Parks, Recreation and Culture
Alberta Treasury Branches Finance
ATB Insurance Advisors Inc.4 Finance
ATB Investment Management Inc. Finance
ATB Investment Services Inc. Finance
ATB Services Inc. Finance
Child and Family Services Authorities Children’s Services
Calgary and Area Child and Family Services Authority
Central Alberta Child and Family Services Authority
East Central Alberta Child and Family Services Authority
Edmonton and Area Child and Family Services Authority
North Central Alberta Child and Family Services Authority
Northeast Alberta Child and Family Services Authority
Northwest Alberta Child and Family Services Authority
Southeast Alberta Child and Family Services Authority
Southwest Alberta Child and Family Services Authority
Metis Settlements Child and Family Services Authority
C-FER Technologies (1999) Inc. Advanced Education and Technology
Credit Union Deposit Guarantee Corporation Finance
Department of Advanced Education and Technology Advanced Education and Technology
Department of Agriculture and Food Agriculture and Food
Department of Children’s Services Children’s Services
Department of Education Education
Ministry, Department, Fund or Agency Ministry Annual Report
Government Entities’ Financial Statements in Ministry 2006-07 Annual ReportsEntities included in the Consolidated Government Reporting Entity
Established July 10, 2005.
Proclaimed May 31, 2006.
Incorporated December 16, 2005.
Incorporated July 12, 2006.
1.
2.
3.
4.

Government Entities
Advanced Education and Technology ◊ 2006-07 Annual Report160
Gov
ernm
ent E
ntiti
es
Department of Municipal Affairs and Housing Municipal Affairs and Housing
Department of Seniors and Community Supports Seniors and Community Supports
Department of Solicitor General and Public Security Solicitor General and Public Security
Department of Sustainable Resource Development Sustainable Resource Development
Department of Tourism, Parks, Recreation and Culture Tourism, Parks, Recreation and Culture
Environmental Protection and Enhancement Fund Sustainable Resource Development
Gainers Inc. Finance
Government House Foundation Tourism, Parks, Recreation and Culture
Historic Resources Fund Tourism, Parks, Recreation and Culture
Human Rights, Citizenship and Multiculturalism Education Fund Tourism, Parks, Recreation and Culture
iCORE Inc. Advanced Education and Technology
Lottery Fund Solicitor General and Public Security
Ministry of Advanced Education and Technology Advanced Education and Technology
Ministry of Agriculture and Food Agriculture and Food
Ministry of Children’s Services Children’s Services
Ministry of Education Education
Ministry of Employment, Immigration and Industry5 Employment, Immigration and Industry
Ministry of Energy Energy
Ministry of Environment5 Environment
Ministry of Executive Council5 Executive Council
Ministry of Finance Finance
Ministry of Health and Wellness Health and Wellness
Ministry of Infrastructure and Transportation5 Infrastructure and Transportation
Ministry of International, Intergovernmental and Aboriginal Relations5 International, Intergovernmental and Aboriginal Relations
Ministry of Justice5 Justice
Ministry of Municipal Affairs and Housing Municipal Affairs and Housing
Ministry of Seniors and Community Supports Seniors and Community Supports
Ministry of Service Alberta5 Service Alberta
Ministry of Solicitor General and Public Security Solicitor General and Public Security
Ministry of Sustainable Resource Development Sustainable Resource Development
Ministry of Tourism, Parks, Recreation and Culture Tourism, Parks, Recreation and Culture
Ministry of the Treasury Board5 Treasury Board
N.A. Properties (1994) Ltd. Finance
Natural Resources Conservation Board Sustainable Resource Development
Persons with Developmental Disabilities Community Boards6 Seniors and Community Supports
Calgary Region Community Board
Central Region Community Board
Edmonton Region Community Board
Northeast Region Community Board
Northwest Region Community Board
South Region Community Board
Persons with Developmental Disabilities Provincial Board Seniors and Community Supports
Provincial Judges and Masters in Chambers Reserve Fund Finance
Safety Codes Council Municipal Affairs and Housing
Supplementary Retirement Plan Reserve Fund Finance
Victims of Crime Fund Solicitor General and Public Security
Wild Rose Foundation Tourism, Parks, Recreation and Culture
Department of Energy
Department of Finance
Department of Health and Wellness
Energy
Finance
Health and Wellness
Ministry, Department, Fund or Agency Ministry Annual Report
Entities included in the Consolidated Government Reporting Entity (continued)
Ceased operations June 30, 2006.
5.
6.
Ministry includes only the department so separate departmental financial statements are not necessary.

Government Entities
Advanced Education and Technology ◊ 2006-07 Annual Report 161
Governm
ent Entities
Alberta Foundation for Health Research Advanced Education and Technology
Alberta Heritage Foundation for Medical Research Advanced Education and Technology
Alberta Heritage Foundation for Science and Engineering Research Advanced Education and Technology
Alberta Teachers’ Retirement Fund Board Education
Improvement Districts Trust Account’ Municipal Affairs and Housing
Local Authorities Pension Plan Finance
Long-Term Disability Income Continuance Plan - Bargaining Unit Employment, Immigration and Industry
Long-Term Disability Income Continuance Plan - Management, Opted Out and Excluded Employment, Immigration and Industry
Management Employees Pension Plan Finance
Provincial Judges and Masters in Chambers Pension Plan Finance
Provincial Judges and Masters in Chambers (Unregistered) Pension Plan Finance
Public Service Management (Closed Membership) Pension Plan Finance
Public Service Pension Plan Finance
Special Areas Trust Account Municipal Affairs and Housing
Special Forces Pension Plan Finance
Supplementary Retirement Plan for Public Service Managers Finance
Workers’ Compensation Board Employment, Immigration and Industry
Fund or Agency Ministry Annual Report
Entities not included in the Consolidated Government Reporting Entity

Government Entities
Advanced Education and Technology ◊ 2006-07 Annual Report162
Gov
ernm
ent E
ntiti
es
Almadina School Society Education
Aspen View Regional Division No. 19 Education
Aurora School Ltd. Education
Battle River Regional Division No. 31 Education
Black Gold Regional Division No. 18 Education
Boyle Street Education Centre Education
Buffalo Trail Public Schools Regional Division No. 28 Education
Calgary Arts Academy Society Education
Calgary Girls’ School Society Education
Calgary Roman Catholic Separate School District No. 1 Education
Calgary School District No. 19 Education
Calgary Science School Society Education
Canadian Rockies Regional Division No. 12 Education
CAPE-Centre for Academic and Personal Excellence Institute Education
Chinook’s Edge School Division No. 73 Education
Christ the Redeemer Catholic Separate Regional Division No. 3 Education
Clearview School Division No. 71 Education
East Central Alberta Catholic Separate Schools Regional Division No. 16 Education
East Central Francophone Education Region No. 3 Education
Edmonton Catholic Separate School District No. 7 Education
Edmonton School District No. 7 Education
Elk Island Catholic Separate Regional Division No. 41 Education
Elk Island Public Schools Regional Division No. 14 Education
Evergreen Catholic Separate Regional Division No. 2 Education
FFCA Charter School Society Education
Foothills School Division No. 38 Education
Fort McMurray Roman Catholic Separate School District No. 32 Education
Fort McMurray School District No. 2833 Education
Fort Vermilion School Division No. 52 Education
Golden Hills School Division No. 75 Education
Grande Prairie Roman Catholic Separate School District No. 28 Education
Grande Prairie Public School District No. 2357 Education
Grande Yellowhead Regional Division No. 35 Education
Grasslands Regional Division No. 6 Education
Greater North Central Francophone Education Region No. 2 Education
Greater Southern Public Francophone Education Region No. 4 Education
Greater Southern Separate Catholic Francophone Education Region No. 4 Education
Greater St. Albert Catholic Regional Division No. 29 Education
High Prairie School Division No. 48 Education
Holy Family Catholic Regional Division No. 37 Education
Holy Spirit Roman Catholic Separate Regional Division No. 4 Education
Horizon School Division No. 67 Education
Lakeland Roman Catholic Separate School District No. 150 Education
Lethbridge School District No. 51 Education
Living Waters Catholic Regional Division No. 42 Education
School Board or School Ministry Annual Report
School Boards and Schools
Schools, Universities, Colleges and Hospitals included in7the Consolidated Government Reporting Entity on a Modified Equity Basis
The subsidiaries of the schools, universities , colleges and hospitals , if any, are not currently included in this listing.
The Public Sector Accounting Board of the Canadian Institute of Chartered Accountants has issued standards that require controlled entities to be fully consolidated line-by-line. In a transitional period to March 31, 2008,the Ministry is permitted to use the modified equity method of accounting. Under the modified equity method, the controlled entities’ net assets and operating results are included in one line on the Ministry’s consolidatedstatements of financial position and operations, respectively.
7.
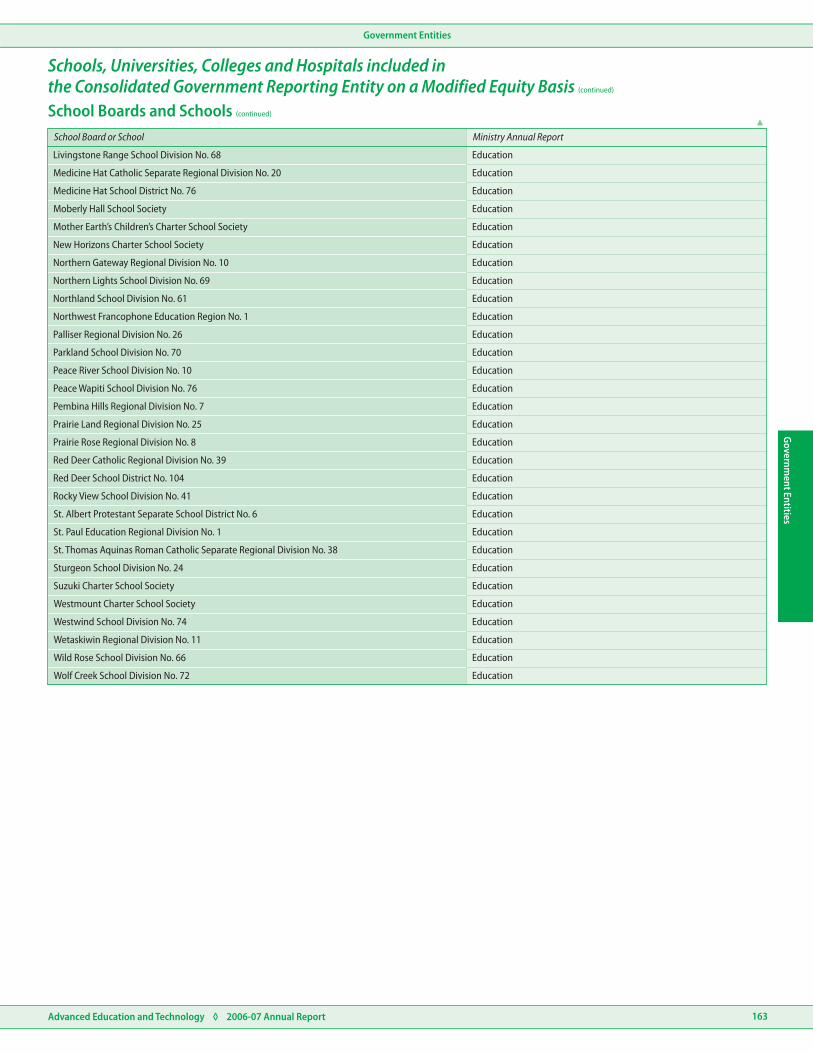
Government Entities
Advanced Education and Technology ◊ 2006-07 Annual Report 163
Governm
ent Entities
Livingstone Range School Division No. 68 Education
Medicine Hat Catholic Separate Regional Division No. 20 Education
Medicine Hat School District No. 76 Education
Moberly Hall School Society Education
Mother Earth’s Children’s Charter School Society Education
New Horizons Charter School Society Education
Northern Gateway Regional Division No. 10 Education
Northern Lights School Division No. 69 Education
Northland School Division No. 61 Education
Northwest Francophone Education Region No. 1 Education
Palliser Regional Division No. 26 Education
Parkland School Division No. 70 Education
Peace River School Division No. 10 Education
Peace Wapiti School Division No. 76 Education
Pembina Hills Regional Division No. 7 Education
Prairie Land Regional Division No. 25 Education
Prairie Rose Regional Division No. 8 Education
Red Deer Catholic Regional Division No. 39 Education
Red Deer School District No. 104 Education
Rocky View School Division No. 41 Education
St. Albert Protestant Separate School District No. 6 Education
St. Paul Education Regional Division No. 1 Education
St. Thomas Aquinas Roman Catholic Separate Regional Division No. 38 Education
Sturgeon School Division No. 24 Education
Suzuki Charter School Society Education
Westmount Charter School Society Education
Westwind School Division No. 74 Education
Wetaskiwin Regional Division No. 11 Education
Wild Rose School Division No. 66 Education
Wolf Creek School Division No. 72 Education
School Board or School Ministry Annual Report
School Boards and Schools (continued)
Schools, Universities, Colleges and Hospitals included inthe Consolidated Government Reporting Entity on a Modified Equity Basis (continued)

Government Entities
Advanced Education and Technology ◊ 2006-07 Annual Report164
Gov
ernm
ent E
ntiti
es
Alberta College of Art & Design
Northern Alberta Institute of Technology
Southern Alberta Institute of Technology
Alberta Cancer Board
Capital Health
Health Quality Council of Alberta8
Alberta Mental Health Board
Chinook Regional Health Authority
Northern Lights Health Region
Aspen Regional Health Authority
David Thompson Regional Health Authority
Peace Country Health
Calgary Health Region
East Central Health
Palliser Health Region
Advanced Education and Technology
Advanced Education and Technology
Advanced Education and Technology
Advanced Education and Technology
Advanced Education and Technology
Advanced Education and Technology
Advanced Education and Technology
Advanced Education and Technology
Advanced Education and Technology
Advanced Education and Technology
Advanced Education and Technology
Advanced Education and Technology
Advanced Education and Technology
Advanced Education and Technology
Advanced Education and Technology
Health and Wellness
Health and Wellness
Health and Wellness
Health and Wellness
Health and Wellness
Health and Wellness
Health and Wellness
Health and Wellness
Health and Wellness
Health and Wellness
Health and Wellness
Health and Wellness
Advanced Education and Technology
Advanced Education and Technology
Bow Valley College
Grande Prairie Regional College
The Banff Centre for Continuing Education
Grant MacEwan College
Keyano College
Lakeland College
Lethbridge College
Medicine Hat College
Mount Royal College
NorQuest College
Northern Lakes College
Olds College
Portage College
Red Deer College
Established July 1, 2006.
Athabasca University Advanced Education and Technology
Advanced Education and Technology
Advanced Education and Technology
Advanced Education and Technology
University of Alberta
University of Calgary
University of Lethbridge
University Ministry Annual Report
College Ministry Annual Report
Technical Institute or The Banff Centre Ministry Annual Report
Regional Health Authority or Provincial Health Board Ministry Annual Report
Colleges
Universities
Technical Institutes and The Banff Centre
Regional Health Authorities and Provincial Health Boards
Schools, Universities, Colleges and Hospitals included inthe Consolidated Government Reporting Entity on a Modified Equity Basis (continued)
8.

Athabasca
Banff
Calgary
Edmonton
Fort McMurray
Grouard
Lac La Biche
Medicine Hat
Olds
Red Deer
Vermilion
Lethbridge
Grande Prairie
Lethbridge College
University of Lethbridge
Medicine Hat College
Olds College
Red Deer College
Alberta College of Art & Design
Bow Valley College
Mount Royal College
Southern Alberta Institute of Technology
University of Calgary
Alliance University College
Nazarene University College
St. Mary’s University College
Grant MacEwan College
College
NorQuest College
Northern Alberta Institute of Technology
Technical Institute
University of Alberta
Concordia University College
Taylor University College
The King’s University College
University
The Banff Centre for Continuing Education
Banff Centre
Private University College
Grande Prairie Regional College
Northern Lakes College
Lakeland College
Athabasca University
Portage College
Keyano College
Lacombe Canadian University College
Advanced Education and Technology ◊ 2006-07 Annual Report
Public Post-Secondary Institutions
Publicly Funded Post-Secondary InstitutionsMain Campuses

(403) 410-1400 1-866-428-2663
(780) 539-2944 1-888-539-4772
(780) 497-5040 1-888-497-4622
(780) 791-4800 1-800-251-1408
(780) 853-8672 1-800-661-6490
(403) 320-3200 1-800-572-0103
(403) 529-3811 1-866-282-8394
(403) 440-6111 1-877-676-0686
(780) 644-6000 1-866-534-7218
(780) 751-3200 1-866-652-3456
(430) 556-8281 1-800-661-6537
(780) 623-5551 1-866-623-5551
(403) 342-3300 1-888-732-4630
(780) 471-7400 1-800-661-4077
(403) 284-7248 1-877-284-7248
(780) 492-3111 —
(403) 220-5110 —
(403) 320-5700 —
(780) 675-6100 1-800-788-9041
(403) 762-6100
(780) 450-5111
(780) 644-5210
(780) 427-8765
(780) 422-9021
(780) 427-8921
(780) 415-4597
(780) 427-1488
(780) 427-5607
(780) 422-1185
(780) 422-1120
(780) 415-8369
(780) 427-2649
(780) 422-5400
(780) 427-2648
(780) 427-2210
(780) 415-4744
(780) 427-2025
(403) 210-5335
(780) 423-5727
(780) 423-5735
1-800-565-9989
—
310-0000
310-0000
310-0000
310-0000
310-0000
310-0000
310-0000
—
1-877-423-5727
—
(403) 284-7600 1-800-251-8290
www.macewan.ca
www.keyano.ca
www.lakelandc.ab.ca
www.lethbridgecollege.ab.ca
www.mhc.ab.ca
www.mtroyal.ab.ca
www.norquest.ab.ca
www.northernlakescollege.ca
www.oldscollege.ab.ca
www.portagecollege.ca
www.rdc.ab.ca
www.nait.ca
www.sait.ca
www.ualberta.ca
www.ucalgary.ca
www.uleth.ca
www.athabascau.ca
www.banffcentre.ca
www.arc.ab.ca
—
www.tradesecrets.gov.ab.ca
www.acat.gov.ab.ca
www.caqc.gov.ab.ca
www.alis.gov.ab.ca/studentsfinance
www.asra.gov.ab.ca
www.advancededandtech.gov.ab.ca
www.icore.ca
www.ahfmr.ab.ca
www.albertaingenuity.ca
www.gprc.ab.ca
www.bowvalleycollege.ca
www.acad.ab.ca
PhoneOrganization Toll Free Website
Alberta College of Art and Design
Grande Prairie Regional College
Lethbridge College
Bow Valley College
Grant MacEwan College
Keyano College
Lakeland College
Medicine Hat College
Mount Royal College
NorQuest College
Northern Lakes College
Olds College
Portage College
Red Deer College
Colleges
Public Post-Secondary Institutions
Technical Institutes
Universities
University of Alberta
University of Calgary
University of Lethbridge
Athabasca University
Banff Centre
The Banff Centre for Continuing Education
Alberta Apprenticeship and Industry Training Board
Alberta Research Council
Access to the Future Fund
Adult Learning
Apprenticeship and Industry Training
Research
Technology Commercialization
Policy and Planning
Communications
Finance and Administration
Entities
Other Entities
Advisory Boards, Councils and Authorities
Human Resources
Deputy Minister’s Office
Minister’s Office
Advanced Education and Technology
Alberta Council on Admissions and Transfer
iCORE
Campus Alberta Quality Council
Alberta Heritage Foundation for Medical Research
Students Finance Board
Alberta Science and Research Authority
Alberta Ingenuity
Northern Alberta Institute of Technology
Southern Alberta Institute of Technology
Contact Information