advanced generator design using pareto-...
TRANSCRIPT

Advanced generator design using Pareto-optimization
Martin R. KuhnGerman Aerospace Center (DLR), Institute of Robotics and Mechatronics
Abstract- In upcoming and future more-electric airplanes more electrical loads connected to the power distribution network will behave nonlinearly and will be switching with advanced demands on the network to keep the power quality. While a lot of effort was already spent on techniques to design the network structure and filters, also the generators have to face the new demands and constraints. Trade offs between performance, weight, and latterly power quality have to be made and design choices have to be backed up by qualitative and quantitative measures. Therefore a convenient design tool chain was elaborated for an externally excited synchronous generator. Pre-existing analytic design functions containing electrical, mechanical and thermal analytical models were expanded by a new criterion for power quality. This criterion defined by industrial standards was included via virtual tests by time-domain simulation. Frequency domain criteria were gained in simulation by new signal property monitor blocks. Standards' conformance is visualized conveniently. A state of the art genetic algorithm similar to NSGA-II was applied to generate the Pareto-front of contrary design trade offs. Several convenient visualizations of the Pareto results are presented, which clearly link the parameters, tuners and output results. To ease the transition from theoretical design to the 3d mechanical layout, a CATIA model of the optimized generator candidate is generated directly from Matlab.
I. INTRODUCTION
In order to improve the ecological footprint, efficiency and cost of future aircrafts, all systems will require intensive optimization of architectures and subsystem at all levels during all design phases. New architectures including several transitions from AC power distribution network to DC power demand new criteria and close collaboration and improved optimization. A key enabler is modeling and simulation. Electrical generators, which used to be just one source of power beside pneumatics and hydraulics, gain in importance [1]. Thus optimized designs are needed with investigations exceeding former design cycles and adding criteria from time domain simulations.
In the last years a lot of research was spent on analyzing and designing power quality and network stability of the electrical power distribution system [2] [3] or subsystems [4]. While filter design and control schemes were treated in detail the impact for the generators attained little attention. In this paper it is focused on an advanced optimization including criteria of power quality of the AC network.
This paper is structured as follows:
In chapter II. the generator is introduced and some general notes on synchronous machine design from literature are given. The optimization setup including demands and formulation of the optimization problem is documented in chapter III.. Additional criteria come from a time domain simulation with industrial standards. New blocks of “Modelica” modelling language relying on Fast Fourier Transformation are presented in chapter IV.. Via the new tool chain of chapter V. a direct link between Matlab and CATIA is established to visualize the mechanical design three-dimensionally. The assembly of the different optimization and evaluation tasks and benefits of Pareto optimal simulation via a genetic algorithm is explained in chapter VI.. Chapter VII. gives the results of the design study.
II. GENERATOR DESIGN
Starter generators are significant contributions to the concept of More Electric Aircrafts. The replacement of conventional hydraulic, pneumatic and mechanical loads by electric systems and drives increases the on-board electrical load significantly. Classic airplane generators in the range of 100kVA are replaced by generators in the range of 150 to 250 kVA for the new Boeing 787 [5]. The most commonly used type of machine to generate the electrical power is the externally excited synchronous machine with interior rotor [6]. For this machine high efficiency can be combined with the high reliability via little electronics which is essential for aerospace industry. External excitation enables controlled output voltage at the variable shaft speed introduced in newer aircrafts as A380 or B787. Actually this type of machine comprises of three synchronous machines: In the first one, a permanent magnet rotor generates a three phase AC voltage. This is rectified to DC voltage and is used by the generator control for feeding the one phase stator of the second machine. In this, the rotor is the armature and generates a three phase voltage. This is rectified again and feeds the field winding in the rotor of the main machine. The three phase stator output is the generator's output.
The basic steps of synchronous machine design are well known from literature, while constraints and detailed design are very specific to the application. Starting with the design as proposed in [7], the most crucial part in machine design is to fix the basic design choices. First the type of machine is chosen e. g. synchronous, interior rotor. Then by help of design rules a preliminary main geometric layout and the magnetic circuit is designed. Afterwards dependent geometric

properties and electrical characteristics can be calculated. In the next step, the final machine is found from numerical parameter optimization. Thus machine design always is an iterative process to find the parameters satisfying the specification. Often verification by numeric magnetic field computation concludes the design. The function to be optimized in the next chapter involves the parameter optimization part. Additional to the basic electromechanical layout thermal, liquid cooling pressure and mechanical constraints of the generator have to be taken into account. For details the reader is referred to [7], [8] or for an industrial design [6].
III. FORMULATION OF TUNERS AND CONSTRAINTS FOR THE ANALYTIC SIZING FUNCTION
The generator optimization task can be formulated as a constraint optimization problem
{ mincrit (X )subject to constr (X )≤0
(1)
where X is the vector of the tuner values, crit is the criteria vector to be minimized and constr is the inequality constraint vector of criteria, which may not exceed the limitation 0.
At first stage, the single objective function was the weight of the generator active part. Constraints exist on the temperatures, maximum mechanical speed, mechanical stress, maximum excitation current and geometries with a total vector length of 31. The list of tuners can be seen from Table1. The field “type” indicates continuous (c) or discrete (d) variability.
Table 1LIST OF TUNERS
Name Type Name Type Name typePole pair number
d Iron length c Yoke stator height
c
Notch width c Notch height c Number of statoric turns in series/phase
d
Bore diameter c Yoke rotor height
c Number of rotor notches
d
Rotor notch width
c Rotor notch height
c Number of excitation turns/pole
d
Airgap c Number of damper bars /pole
d Diameter of damper bar
c
Input variables to the analytic generator layout function were broken down into their atomic elements. For example, the number of notches “nes” is a multiple “k” of the pole pair number “p”:
nes=k⋅p (2)
Thus nes can be varied by the independent tuners k and p. In some cases constraints exist on the variability of the design variables. For example, be a variable v, which is the fraction of tuners x1 and x2:
v=x1
x2
(3)
If v has to be restricted to integer values, the preliminary tuner value x´* with * being 1 or 2, has to treated by a “repair algorithm” to get v integer:
x*= x*+∆ , min( x*+∆)s.t. v=x1
x2
∈ (4)
All tuner values were allowed to vary free between minimum and maximum values except the pole pair number p. This parameter influences most equations substantially with no smooth transition of criteria values between adjacent p’s. Thus four independent optimizations were run with a polepair number of 1,2,3 and 4.
Since small variations of the preliminary tuners may not lead to variations of v, gradient based optimizers may not work. But genetic algorithms do and can be adapted to handle discrete tuners. This study used an implementation of an evolutionary strategy algorithm with self adaptation of the mutation variation [9].The optimization was performed using the MOPS design environment [10].
In first instance very good optimization results could be gained for minimization of total weight with constraints for speed, mechanical stress and temperatures. This led to generator weight savings of around 10% compared to the original industrial design. While this is a good result, little information is given on trade-offs with other criteria and parameter influence at this instance.
IV. CRITERIA FOR POWER QUALITY FROM SIMULATION
In the next step further criteria of the generator power quality were added. Since for More Electric Aircraft architectures the quantity and power demand of non-linear rectifiers rises the influence of generator parameters to AC distribution network harmonics shall be investigated. Improvements on the generator side could not only lead to better power quality, but directly related to it, to weight savings in loads passive filters or prevention of expensive and reliability decreasing electronic equipment. At TEOS III forum, Barcelona 2009, Airbus representatives called filter weights the main show stoppers for an all DC electrical network.
From theoretical and practical investigations in literature as [11] qualitative relations between harmonic content of passively rectified AC circuits and generator parameters are known. In [12] the spectrum and impedance of passively commutated six pulse rectifiers are derived. These add significant positive sequence harmonics in the fifth harmonic and negative sequence harmonics in the seventh harmonic. This interacts on the one hand side with the generator saliency, meaning the difference in inductance between direct and quadrature axis. The other main influence are the subtransient inductances Ld ' ' and Lq' ' for positive sequence distortions and directly related to it, the negative sequence inductance for negative sequence distortions which is Ln=(Ld ' '+Lq' ' )/2 . While some analytic predictions on power quality can be estimated, more quantitative

measures can be added via time-domain simulation of an advanced generator model in an electrical network.
Table 2POWER QUALITY LIMITS
Limit name LimitTotal Harmonic Distortion (THD) in relation to base harmonic voltage
11%
Individual Harmonic Content (IHC) in relation to base harmonic voltage
7.5%
1. Time domain simulation using Modelica/DymolaModelica is a free, object-oriented modelling language that
has been developed since 1996 by the non-profit Modelica Association. Many free Modelica model libraries are available, especially the Modelica standard library that contains a large collection of components, such as models for analogue and digital electrical systems [13]. For this investigation, the commercial Modelica simulation environment Dymola was used. Dymola provides the necessary functionality for easy graphical construction of Modelica models, efficient simulation and some post-processing operations [14]. MOPS offers an interface to construct optimization setups for and from Dymola models or embed simulations as part of the design study.
The demands on power quality were taken analogously to industrial standards [15] and [16]. In an industrial generator design process check of power quality often is part of the validation and verification (V&V). Using simulation and standards already in the component design phase allows matched design and reuse of simulation models for later evaluation phases. The limits can be seen in Table 2.
2. Implementation of property monitorsIn order to observe the criteria for maximum total
harmonic distortion (THD) and individual frequency limits signal monitors for frequency domain criteria were needed. For post processing, Modelica functions for fast Fourier transformation (FFT) [17] were already applied in [18]. Alternatively, a solution via “signal monitor” blocks connected graphically to the data of interest does have the advantage of embedding the limits as part of the model. The measures for the standards conformance can be calculated and visualized in simulation. Further demands are an user defined update time of the spectrum computation and the possibility to visualize the spectrum via Bode plots. No existing library existing met the requirements and thus was implemented newly:
Since the FFT algorithm calculates the spectrum X(f) from a set of past signal samples x those have to be stored and made accessible in simulation:
X ( f )=FFT ( x(t 0) , x(t 0−∆ t ) , .. , x( t0−n⋅∆ t )) (5)
Three methods of data storage were identified: Sampling by time events (“when time> t then..”), the Modelica function "delay" and via an external C function.
The sampling method is most straightforward: After every sampling time interval ts, the value of the selected signal is taken and stored in a data vector. This method and a Modelica language based algorithm for calculation of the FFT was
programmed and tested. Results were produced correctly but the model’s simulation time grew rapidly when adding the FFT block. This behavior can be explained by the implementation of the variable step solver in Dymola. The integration step size is forced by the sampling to lower intervals than with the original model. This leads to time consuming additional equation system evaluations at every sampling point.
The second method is using the "delay" function of Modelica, which delays the input signal to the output by a specified time. For n FFT points n delays have to be added. The delay function relies on simulator's internally saved data. The signal’s history is stored by polynomials between some simulator’s evaluation points rather than a dense grid of sampling points. This method also was implemented but showed memory problems: Since "delay" is just one-dimensional, for every instance of this function all internal polynomials are stored instead of shared storage. This does not only cause exhaustive memory usage but also Dymola restricts the user to 2000 instances of "delay". Improvements in the Modelica language might improve the "delay" function to single storage-multiple time data out.
As a third possibility, utilizing external “C” programming language functions, embedded in the Modelica code, was identified. The new function is triggered by the simulator using the monitored simulation result as input. At every evaluation step given by the integration algorithm the model including the C function is evaluated provided that the C-function appears in the differential algebraic system. By adding a virtual output it is avoided that it is seen by the simulator as a pure output, which is just evaluated at the user defined display intervals. When using a variable step solver as DASSL properly, it is always guaranteed that the time steps are small enough to sample the signal with a sufficient resolution. The C function stores the data in a circular memory buffer generated at the simulation start and erases it at the finish. An example of input data and the selected interpolations can be seen from figure 1.
At the reversal points the variable step solver has a high sampling density while in between little data is stored. Since variable step solvers use "back-stepping" in time in case the step width was taken too large, the C function also has to delete data sets from time steps not used. The FFT is calculated by another C function. It extracts the stored data from memory, reduces it to the data length needed or
Fig. 1. Data storage with C function
0.955 0.96 0.965 0.97 0.975 0.9890
100
110
time []
sign
al []
datafitted

Fig. 2. Interface of the "spectrum" property monitor.
precedes zeros in case not enough data is gained up to that moment ("zero padding") and interpolates the irregular sampled data to a regular sampled data. For re-sampling, a numeric calculation of a best-fit curve implemented first was abandoned due to large computation time also it can be useful for input data with large step width. Instead it was replaced by a quicker simulation point to simulation point interpolation using cubic hermetic splines. The block works proper and quick. Minor Dymola internal problems with long translation- but not simulation- time occur in case of a high number of FFT points. Dymola's symbolic equation manipulation algorithm might get slow with handling the large amount of outputs for the n amplitudes of the frequencies plus n indicators for the frequency position.
Further features implemented for all monitors are windowing (rectangle, Bartlett, Hann, Hamming, Blackman, Kaiser) and reduction and amplitude correction to a positive-half-side spectrum. By the mentioned zero padding it is possible to calculate higher frequency resolutions from a limited amount of data. The FFT block’s interface lets the user choose to evaluate the FFT function just once at a specified time or update repeatedly.
The input for the limits of the single frequencies is of table type. The limits can be visualized from the interface shown in figure 2. For the single frequencies limits, absolute limits,
limits relative to the amplitude of a selected (electrical) base frequency and individual harmonic content (just harmonics and limits relative to base frequency) are supported. The base frequency can be searched as the highest amplitude in a user defined interval.
Since at least Dymola does not support a calculation and visualization of a spectrum directly, an additional Modelica function is offered to plot the spectrum calculated by the spectrum block. Executing the function proposes the last translated model as source or another model can be selected automatically. Property monitors are searched automatically. The spectrum is visualized at the most critical point concerning limits. The plot gives information on the name of this special observer block and the simulated time when this FFT was started.
3. Simulation modelFor the power quality investigation, a generator model
with saturation, harmonic content and inclusion of damper circuits was established in Modelica as in [19]. Generator parameters were inputs from the optimization routine. As electrical load to the alternating current network a combined
load of 150kVA consisting of 75% linear resistive load and 25% rectifier nonlinear switching load was chosen. No filters for common or differential mode harmonics were taken into account. The share of nonlinear load is in line with classic airplane architectures.
The simulation model in Modelica/Dymola can be seen in figure 3. This “virtual test bed” to embed the generator under test was established with observer blocks to check for industrial standards conformance. As inputs, it contains information to interacting systems, which are the shaft to turbine and the load network in this case. Spectral limits on the output are stated by the “spectrum” property monitors. The observer, which is connected to the signal AC network phase voltage, is parametrized with the limits and calculates a measure for standards compliance where “smaller one” means compliance. A key demand for later re-usage as V&V model that is also clear and easy to use visualization. It was found the Modelica library “properties” [20] can be utilized to meet this aspect. These blocks are visualizers for logic conditions also displayed textually. During the simulation, if the condition is “true” the block stays green, for false changes to red and in case it goes back to true after false it is green with a red box around. In the example, the Boolean type “property” for condition fulfilled/not fulfilled is visualized by the green blocks of the “Property” library.
V. MATLAB/CATIA INTERFACE
The generator's electrical design usually is performed by other persons or departments than the mechanical design. To improve this workflow and allow discussion on the basis of a preliminary model an additional step was introduced to extract a CATIA model from Matlab data. This is the first application of the new DLR tool chain for Matlab based generic generation of airplane frames. Common external interface methods for CATIA are parameterized models,
Fig. 3. Simulation model
linear load 75 %
nonlinear load 25 %
star
m=3
Rl
m=3
Lf1
m=3
constantSpeed
idea
lDio
de1
m=3
R=540^2/(150e3*0.25)
resistor1
star1
m=3
star2
m=3
idea
lDio
de2
m=3
spectrum
m=3
potentialSensor
L=1e-6
inductor1
C=1e-5
capacitor
spectrum._propobserver_f < 1 + 1e-6
reqIHC
spectrum._propobserver_thd < 1 + 1e-6
reqTHD
R=1e-6
rc
machine_beh1 Rf
m=3
Lf
m=3
ground
GCU
ground1
ground2
R=0
resi
stor
L=ln
indu
ctor
booleanConstant
true

coupled via construction tables, MS visual basic script/CATScript requiring intermediate files for data transmission or use of the very expensive CAA RADE Developer API intended for programming CATIA extensions. Here a methodology using the COM interface is used, which is not officially supported by CATIA but is very flexible. Via a set of easy to apply Matlab commands the layout in figure 4 could be drawn. Handles of the various elements are returned, which allow later manipulation of the objects.
VI. OPTIMIZATION CHAIN
The full tool chain implemented for investigation of power quality in the generator design consists of the Matlab analytic sizing function, the Dymola simulation and the visualization via the Matlab/CATIA interface. In order to expand the design via the analytic function of chapter 2 by power quality criteria a second criterion was introduced. For treating multi-criteria optimization there exist several methods: The multi-dimensional criteria can be treated as weighted inputs to a penalty function reducing the optimization task to a one-dimensional problem. This gives a single optimum quite quick but little knowledge on parameter influence and no knowledge about other optimal solutions. Gridding or Monte Carlo analysis visualizes a large range of solutions but demands a very high amount of data to show all optima. Furthermore for very complex tasks, as for this generator optimization, most random tries can lead to infeasible solutions while optimization may exploit knowledge of valid tuner regions found before, which often have feasible solutions in their proximity. Instead of a single optimal point, by variation of the penalty function it is possible to get a picture of the shape of the pareto-optimal set. While a variation of the penalty function would lead to a new optimum faster than for the first optimization since the former tuner values are expected to be in the neighborhood of the new optimum tuners this still would increase the computation time essentially.
Here it is proposed to use a manipulated population based search “ga2” similar to NSGA-II [21] to optimize the Pareto front directly. The algorithm uses non-domination ranking relation and crowding distance. The non-domination ranking sorts the individuals in the genetic population for the multiple objectives. This keeps the parts of the population to evolve for the individual criterion they are ranked best and thus keeps global optimization in all directions of the objective space. Crowding distance ensures solutions are uniformly spread between the single-criterion optimal solutions. The “ga2” algorithm was applied successfully in [22], NSGA-II helped to design an induction motor in [8].
When planning the optimization setup it is essential to consider the time scales apparent in the different layout and analysis components. Characteristic values for computation time for one evaluation can be taken from Table 3.
Table 3CHARACTERISTIC VALUES FOR COMPUATION TIME
Matlab function analytic generator design function
Dymola simulation 0.5 s
CATIA model generation
0.5 s 100 s 180 s
The time domain simulation demands approximately 0.05 seconds simulated time for the electric transients to reach a periodic steady state condition. Further 0.45 seconds are necessary for data generation used in the spectrum block for 12 bit 10 kHz FFT calculation. As can be seen the calculation time between evaluating the Matlab function of the analytic design rules and performing a simulation with Dymola or generating a CATIA model differs by some magnitudes. Even in case just tuner combinations, which lead to feasible results of the Matlab function, would be further investigated via a simulation this would typically just reduce the evaluations to around 20% (e.g. from 375000 evaluations to 70000 for p=3). Instead of performing optimizations with the criterion weight from the “fast” analytic function and power quality from the time-domain simulation, it is taken advantage of the knowledge on relations between power quality and generator parameters in chapter 2. The generator saliency was limited by design choices to a small number with little influence on power quality. This was confirmed by simulation of a limited number of experimental solutions of the analytic function with differing saliency. Almost no influence on the voltage total harmonic content of the AC line was detected. Thus the negative sequence inductance was made the second criterion for power quality without the need for time-domain simulation in the optimization run itself. In a second step afterwards, the pareto front results of weight versus Ln were taken and for each point the parameter sets were fed into the simulation. This procedure reduces the number of simulations needed to around 200 cycles and produces qualitative measures for power quality for the relevant set of the Pareto front results. With the computer cluster available at DLR optimization typically takes around 26 hours. Simulation at a single PC demands 11 minutes. The approach is justified by
Fig. 4. CATIA model of generator active part
the plots in figure 6: the AC line power quality clearly is linearly dependent upon the negative sequence.
The CATIA model output just is evaluated once for one Pareto front result since the different plots look quite similar. Nevertheless they can be generated for user selected points.
VII. RESULTS
Figure 6 to 8 show some results of the generator optimization (normalized). In figure 6 the relation between voltage THD and Ln is plotted. Their tight relation is clearly proven. The criteria Ln vs. weight are displayed in figure 5. While there exists a large area of feasible results, it can be seen there is a clear Pareto front of contrary design objectives. The results can be combined for THD versus weight investigations. In this fictitious example no industrial standard was violated but the setup can be used for investigations to derive quantitative information about the weight cost needed to prevent harmonic overvoltages.
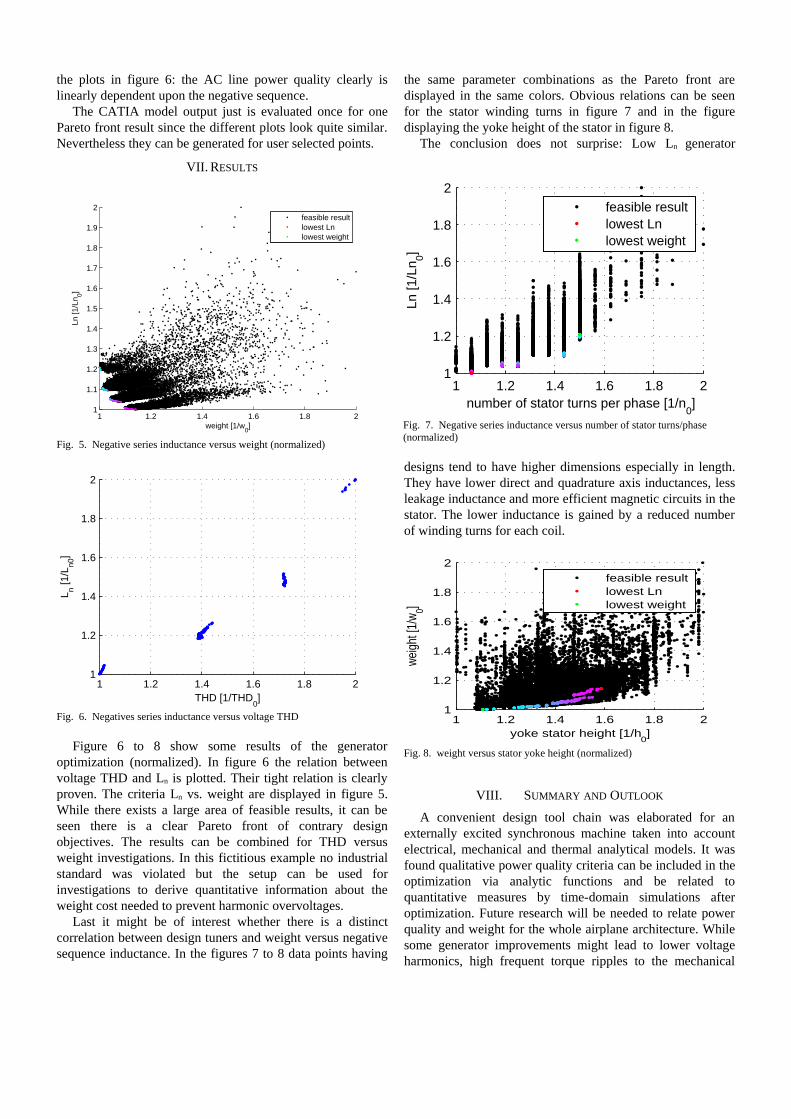
Last it might be of interest whether there is a distinct correlation between design tuners and weight versus negative sequence inductance. In the figures 7 to 8 data points having
the same parameter combinations as the Pareto front are displayed in the same colors. Obvious relations can be seen for the stator winding turns in figure 7 and in the figure displaying the yoke height of the stator in figure 8.
The conclusion does not surprise: Low Ln generator
designs tend to have higher dimensions especially in length. They have lower direct and quadrature axis inductances, less leakage inductance and more efficient magnetic circuits in the stator. The lower inductance is gained by a reduced number of winding turns for each coil.
VIII. SUMMARY AND OUTLOOK
A convenient design tool chain was elaborated for an externally excited synchronous machine taken into account electrical, mechanical and thermal analytical models. It was found qualitative power quality criteria can be included in the optimization via analytic functions and be related to quantitative measures by time-domain simulations after optimization. Future research will be needed to relate power quality and weight for the whole airplane architecture. While some generator improvements might lead to lower voltage harmonics, high frequent torque ripples to the mechanical
Fig. 5. Negative series inductance versus weight (normalized)
1 1.2 1.4 1.6 1.8 21
1.1
1.2
1.3
1.4
1.5
1.6
1.7
1.8
1.9
2
weight [1/w0]
Ln [1
/Ln 0]
feasible resultlowest Lnlowest weight
Fig. 6. Negatives series inductance versus voltage THD
1 1.2 1.4 1.6 1.8 21
1.2
1.4
1.6
1.8
2
THD [1/THD0]
L n [1/L
n0]
Fig. 8. weight versus stator yoke height (normalized)
1 1.2 1.4 1.6 1.8 21
1.2
1.4
1.6
1.8
2
yoke stator height [1/h0]
weig
ht [1
/w0]
feasible resultlowest Lnlowest weight
Fig. 7. Negative series inductance versus number of stator turns/phase (normalized)
1 1.2 1.4 1.6 1.8 21
1.2
1.4
1.6
1.8
2
number of stator turns per phase [1/n0]
Ln [1
/Ln 0]
feasible resultlowest Lnlowest weight

shaft may increase complexity and mass in the combustion turbine.
IX. ACKNOWLEDGMENT
The research leading to these results has received funding from the European Union's Seventh Framework Programme (FP7/2007-2013) for the Clean Sky Joint Technology Initiative under grant agreement no. CSJU-GAM-SGO-2008-001. The author wishes to thank Thales Avionics Electrical Systems for data, information and support.
The author wishes to thank D. Joos of DLR for support and all new implementations in MOPS and R. Kuchar of DLR for supplying and supporting the Matlab-CATIA tool-chain and programming the base implementation of the generator.
Some algorithms for the spectrum monitor were taken from CMATH library by University of Queensland, Australia by courtesy of Peter Jacobs.
The “Properties” library was used due to courtesy of D. Bouskela, EDF R&D, and T. Eric, Dassault-aviation.
X. REFERENCES
[1] K. Emadi and M. Ehsani, “Aircraft power systems: technology, state of the art, and future trends,” IEEE Aerospace and Electronic Systems Magazine, vol. 15, no. 1, pp. 28–32, Jan. 2000.
[2] J. Sun, Z. Bing, and K. J. Karimi, “Small-signal modeling of multipulse rectifiers for more-electric aircraft applications,” in Proc. IEEE Power Electronics Specialists Conf. PESC 2008, 2008, pp. 302–308.
[3] K.-N. Areerak, S. V. Bozhko, G. M. Asher, and D. W. P. Thomas, “Stability analysis and modelling of ac-dc system with mixed load using dq-transformation method,” in Proc. IEEE Int. Symp. Industrial Electronics ISIE 2008, 2008, pp. 19–24.
[4] S. Chandrasekaran, S. Ragon, D. Lindner, Z. Gürdal, and D. Boroyevich, “Optimization of an aircraft power distribution subsystem,” AIAA Journal of Aircraft, vol. 40, no. 1, pp. 16–26, August 2002.
[5] M. Sinnett. (2007, April) 787 no-bleed systems. Boeing. [Online]. Available: http://www.boeing.com/commercial/aeromagazine/articles/-qtr_4_07/AERO_Q407_article2.pdf
[6] F. Delhasse and F. Biais, “High power starter generators for airliners,” in Changes in Aeronautical and Space Systems, AAAF, Ed., June 2006.
[7] G. Müller, K. Vogt, and B. Ponick, Berechnung elektrischer Maschinen. Wiley-VCH, 2008.
[8] J. L. Besnerais, A. Fasquelle, V. Lanfranchi, M. Hecquet1, and P. Brochet, “Mixed-variable optimal design of induction mot,” in EngOpt 2008 - International Conference on Engineering Optimization, 2008.
[9] A. Eiben and J. Smith, Introduction to Evolutionary Computation. Springer, 2007.
[10] H.-D. Joos, “A methodology for multi-objective design assessment and flight control synthesis tuning,” Aerospace Science and Technology, vol. 3, no. 3, pp. 161 – 176, 1999
[11] W. J. Bonwick, “Voltage waveform distortion in synchronous generators with rectifier loading,” IEE Proceedings B Electric Power Applications, vol. 127, no. 1, pp. 13–19, 1980.
[12] Z. Bing, K. J. Karimi, and J. Sun, “Input impedance modeling and analysis of line-commutated rectifiers,” vol. 24, no. 10, pp. 2338–2346, 2009.
[13] Modelica Association. http://www.modelica.org.[14] Dassault Systèmes. http://www.dynasim.com.[15] MIL-STD-704F: Aircraft electric power characteristic, US Department
of Defense Std., 2004. [Online]. Available: http://www.wbdg.org/ccb/-FEDMIL/std704f.pdf
[16] Airbus directive ABD100.1.8, part 1 - product, chap 8 - electric and installation requirements, Airbus Std., 2002.
[17] J. W. Cooley and J. W. Tukey, “An algorithm for the machine calculation of complex fourier series,” Math. Comput., vol. 19, p. 297–301, 1965.
[18] Y. Ji and J. Bals, “A novel modelica signal analysis tool towards design of more electric aircraft,” in Proc. 3rd IEEE Int Computer Science and Information Technology (ICCSIT) Conf, vol. 5, 2010, pp. 152–156.
[19] F. Kutt, M. Michna, P. Chrzan, and M. Ronkowski, “Nonlinear model of a synchronous generator for analysis of more electric aircraft power systems,” Zeszyty Problemowe – Maszyny Elektryczne, vol. 83, pp. 173–178, 2009.
[20] A. Jardin, D. Bouskela, T. Nguyen, and N. Ruel, “Modelling of system properties in a modelica framework,” in Proceedings of the 8th Modelica Conference, 2011.
[21] K. Deb, A. Pratap, S. Agarwal, and T. Meyarivan, “A fast and elitist multiobjective genetic algorithm: Nsga-II,” vol. 6, no. 2, pp. 182–197, 2002.
[22] T. Giese, B. Oehler, and M. Sielemann, “A systematic approach to optimise conventional environmental control architectures,” in Proceedings of the Deutscher Luft- und Raumfahrtkongress 2010, D. Scholz, Ed., 2010, pp. 945–953.