advanced magnetic materials - hindawi publishing...
TRANSCRIPT

Advanced Magnetic MaterialsGuest Editors: Arcady Zhukov, Mitsuteru Inoue,Manh-Huong Phan, and Vladimir Shavrov
Physics Research Internationa

Advanced Magnetic Materials

Physics Research International
Advanced Magnetic Materials
Guest Editors: Arcady Zhukov, Mitsuteru Inoue,Manh-Huong Phan, and Vladimir Shavrov

Copyright © 2012 Hindawi Publishing Corporation. All rights reserved.
This is a special issue published in “Physics Research International.” All articles are open access articles distributed under the CreativeCommons Attribution License, which permits unrestricted use, distribution, and reproduction in any medium, provided the originalwork is properly cited.

Editorial Board
Faustino Aguilera-Granja, MexicoRajeev Ahuja, SwedenN. P. Bigelow, USAPeter Blunden, CanadaW. Niel Brandt, USASean Cadogan, CanadaMaria G. Castellano, ItalyArthur E. Champagne, USAAshok Chatterjee, IndiaW. Y. Ching, USAAnil R. Chourasia, USADebashish Chowdhury, IndiaThomas D. Cohen, USAMike Cottam, CanadaG. Das, India Avishai Dekel, IsraelJerry P. Draayer, USAEhud Duchovni, IsraelDouglas J. Durian, USADipangkar Dutta, USASimon I. Eidelman, RussiaFaramarz Farahi, USAIsrael Felner, IsraelYuan Ping Feng, SingaporeLee Samuel Finn, USAMoshe Gai, USA Lian Gao, ChinaLuis Gimeno, SpainNikos D. Giokaris, GreeceLeonardo Golubovic, USADavid Goodstein, USAChristoph Grab, SwitzerlandRobert D. Guenther, USAAtul Gurtu, India
Robert B. Hallock, USAYilong Han, Hong KongShlomo Havlin, IsraelErnest M. Henley, USAJuan Jose Hernandez-Rey, SpainAlfred C. Huan, SingaporeNathan Ida, USAMartin Kroger, SwitzerlandPablo Laguna, USAShaun Lovejoy, CanadaDavid Lowe, USAYuli Lyanda-Geller, USAZ. Mao, USAThomas G. Mason, USAGrant J. Mathews, USAP. V. E. McClintock, UKPaul J. Meakin, USABaruch Meerson, IsraelE. Meyer, SwitzerlandSergey B Mirov, USAAndre Mischke, The NetherlandsW. B. Mori, USAFranco Nori, USAK. Alexander Nugent, AustraliaJeremy O’Brien, UKHans Rudolf Ott, SwitzerlandRavindra R. Pandey, USAByungwoo Park, KoreaJeevak M. Parpia, USAAnand Pathak, IndiaLorenzo Pavesi, ItalyA. John Peter, China
Jean-Francois Pinton, FranceViktor A. Podolskiy, USAHan Pu, USARajeev K. Puri, IndiaB. Raveau, FranceAli Hussain Reshak, Czech RepublicSlava V. Rotkin, USAAngel Rubio, SpainJames A. Sauls, USANir J. Shaviv, IsraelSteven Sherwood, AustraliaBellave Shivaram, USATheo Siegrist, USAVed Ram Singh, IndiaRoman Sobolewski, USAH. E. Stanley, USANeil S. Sullivan, USAUwe Claus Tauber, USAIchiro Terasaki, JapanFrank Tsui, USAJack Adam Tuszynski, CanadaGautam Vemuri, USADonepudi Venkateswara Rao, IndiaJacobus Verbaarschot, USABennie F. L. Ward, USAYue Wu, USAF. Yakuphanoglu, TurkeyWeitao Yang, USAHarold J. W. Zandvliet, The NetherlandsJianhui Zhong, USA
Contents
Advanced Magnetic Materials, Arcady Zhukov, Mitsuteru Inoue, Manh-Huong Phan,and Vladimir ShavrovVolume 2012, Article ID 385396, 2 pages
Microscopic Theory of Multipole Ordering in f -Electron Systems, Takashi HottaVolume 2012, Article ID 762798, 9 pages
Magnetic and Magnetoelectric Properties of Rare Earth Molybdates, B. K. Ponomarev and A. ZhukovVolume 2012, Article ID 276348, 22 pages
Influence of Magnesium Substitution on Thermal and Electrical Properties of NiCuZn Ferritesfor Microinductor Core Applications, M. Venkata Ramana, N. Ramamanohar Reddy,and K. V. Siva kumarVolume 2012, Article ID 861690, 8 pages
Improvement of Thermal Stability of Nd-Tb-Fe-Co-B Sintered Magnets by Additions of Pr, Ho, Al,and Cu, A. A. Lukin, E. I. Il’yashenko, A. T. Skjeltorp, and G. HelgesenVolume 2012, Article ID 416717, 4 pages
Fundamental Problems of the Electrodynamics of Heterogeneous Media,N. N. Grinchik and Yu. N. GrinchikVolume 2012, Article ID 185647, 28 pages
Magneto-Optical and Magnetic Studies of Co-Rich Glass-Covered Microwires,Alexander Chizhik and Valentina ZhukovaVolume 2012, Article ID 690793, 20 pages
Sintering of Soft Magnetic Material under Microwave Magnetic Field, Sadatsugu Takayama,Jun Fukushima, Junichi Nishijo, Midori Saito, Saburo Sano, and Motoyasu SatoVolume 2012, Article ID 165849, 4 pages
Metamagnetic Phase Transitions in (Sm0.5Gd0.5)0.55Sr0.45MnO3 Ceramics, Fedor N. BukhankoVolume 2012, Article ID 632016, 7 pages
Novel Applications of Ferrites, Raul ValenzuelaVolume 2012, Article ID 591839, 9 pages
Investigation of Multicritical Phenomena in ANNNI Model by Monte Carlo Methods,A. K. Murtazaev and J. G. IbaevVolume 2012, Article ID 730812, 4 pages
Softening the Crystal Scaffold for Lifes Emergence, Gargi Mitra-Delmotte and Asoke Nath MitraVolume 2012, Article ID 232864, 13 pages
Tailoring of Magnetocaloric Effect in Ni45.5Mn43.0In11.5 Metamagnetic Shape Memory Alloy, W. O. Rosa,L. Gonzalez, J. Garcıa, T. Sanchez, V. Vega, Ll. Escoda, J. J. Sunol, J. D. Santos, M. J. P. Alves, R. L. Sommer,V. M. Prida, and B. HernandoVolume 2012, Article ID 794171, 5 pages
Correlation between the Magnetoresistance, IR Magnetoreflectance, and Spin-DependentCharacteristics of Multilayer Magnetic Films, V. G. KravetsVolume 2012, Article ID 323279, 8 pages
Hindawi Publishing CorporationPhysics Research InternationalVolume 2012, Article ID 385396, 2 pagesdoi:10.1155/2012/385396
Editorial
Advanced Magnetic Materials
Arcady Zhukov,1 Mitsuteru Inoue,2 Manh-Huong Phan,3 and Vladimir Shavrov4
1 Departamento de Fısica de Materiales, Universidad del Paıs Vasco, UPV/EHU, 20018 San Sebastian, Spain and IKERBASQUE,Basque Foundation for Science, 48011 Bilbao, Spain
2 Department of Electrical and Electronic Information Engineering, Toyohashi University of Technology, -1 Hibarigaoka,Toyohashi 441-8580, Japan
3 Department of Physics, University of South Florida, Tampa, FL 33620, USA4 Institute of Radioengineering and Electronics, Russian Academy of Sciences, 125009 Moscow, Russia
Correspondence should be addressed to Arcady Zhukov, [email protected]
Received 11 March 2012; Accepted 11 March 2012
Copyright © 2012 Arcady Zhukov et al. This is an open access article distributed under the Creative Commons AttributionLicense, which permits unrestricted use, distribution, and reproduction in any medium, provided the original work is properlycited.
This special issue is inspired by a rapidly growing interestin the research of magnetism and magnetic materials,discoveries of novel magnetic materials, and recent progressin the development of functional materials with improvedmagnetic and magnetotransport properties. The researchis demanded by the last advances in technology andengineering and greatly associated with the developmentof advanced magnetic materials with improved magneticand magnetotransport properties. Certain industrial sec-tors, such as magnetic sensors, microelectronics, security,and energy-efficient magnetic refrigerators, demand cost-effective materials with reduced dimensionality and desirablemagnetic properties (i.e., enhanced magnetic softness, giantmagnetic field sensitivity, large magnetocaloric effect, largeshape memory effect, etc.). In particular, the miniaturizationof modern magnetoelectronic devices tends to stimulate arapid development of nanoscale magnetic materials. How-ever, the development of soft magnetic materials in differentforms of ribbons, wires, microwires, and multilayered thinfilms still continues to attract significant attention fromthe scientific community, as the discovery of the so-calledgiant magnetoimpedance effect in these materials makesthem very attractive for a wide range of high-performancesensor applications ranging from engineering, industry, tobiomedicine. In another research area, the development ofadvanced magnetocaloric materials for advanced magneticrefrigeration technology has also generated growing interestamong scientists. The majority of magnetic refrigerationis to develop new materials that are cost effective andpossess high cooling efficiencies (i.e., large magnetocaloric
effect over a wide temperature range). In all cases, acomprehensive understanding of the processing-structure-property relationship in the fabricated materials is of criticalimportance. Consequently, great efforts have been (and arebeing) focused on systematic theoretical and experimentalstudies with the overall aim of advancing our currentknowledge of the origins of the material properties related tothe existence of some special arrangements at the nanometricscale and/or to the prevision of novel unusual macroscopicproperties.
This special issue aims to provide most up-to-date infor-mation about recent developments in magnetic materials foradvanced technologies. It covers a wide range of experimen-tal and theoretical works highlighting the following maintopics:
(i) soft magnetic materials and sensor applications,
(ii) magnetocaloric materials and magnetic refrigeration,
(iii) magnetic shape alloys and related applications,
(iv) amorphous and nanocrystalline magnetic materialsand applications,
(v) metamagnetism,
(vi) ferrites,
(vii) electrodynamics of heterogeneous media.
We hope this issue will stimulate further interest in magneticmaterials research.

2 Physics Research International
Acknowledgment
Last but not least, we would like to acknowledge allthe editorial members, contributed authors and dedicatedreferees for their invaluable time, great contributions andassistance to this volume. Without such efforts we wouldnot be able to accomplish and bring this special issue to theinterested readers.
Arcady ZhukovMitsuteru Inoue
Manh-Huong PhanVladimir Shavrov

Hindawi Publishing CorporationPhysics Research InternationalVolume 2012, Article ID 762798, 9 pagesdoi:10.1155/2012/762798
Research Article
Microscopic Theory of Multipole Ordering in f -Electron Systems
Takashi Hotta1, 2
1 Department of Physics, Tokyo Metropolitan University, Hachioji, Tokyo 192-0397, Japan2 Advanced Science Research Center, Japan Atomic Energy Agency, Tokai, Ibaraki 319-1195, Japan
Correspondence should be addressed to Takashi Hotta, [email protected]
Received 31 August 2011; Accepted 2 February 2012
Academic Editor: Vladimir Shavrov
Copyright © 2012 Takashi Hotta. This is an open access article distributed under the Creative Commons Attribution License,which permits unrestricted use, distribution, and reproduction in any medium, provided the original work is properly cited.
A microscopic framework to determine multipole ordering in f -electron systems is provided on the basis of the standard quantumfield theory. For the construction of the framework, a seven-orbital Hubbard Hamiltonian with strong spin-orbit couplingis adopted as a prototype model. A type of multipole and ordering vector is determined from the divergence of multipolesusceptibility, which is evaluated in a random phase approximation. As an example of the application of the present framework, amultipole phase diagram on a three-dimensional simple cubic lattice is discussed for the case of n = 2, where n denotes the averagef -electron number per site. Finally, future problems concerning multipole ordering and fluctuations are briefly discussed.
1. Introduction
Recently, complex magnetism in rare-earth and actinidecompounds has attracted much attention in the researchfield of condensed matter physics [1–3]. Since in general,spin-orbit coupling between electrons in 4 f and 5 f orbitalsis strong, spin and orbital degrees of freedom are tightlycoupled in f -electron materials. Thus, when we attemptto discuss magnetic ordering in f -electron systems, it isnecessary to consider the ordering of spin-orbital complexdegrees of freedom, that is, multipole. In fact, ordering ofhigher-rank multipole has been actively investigated bothfrom experimental and theoretical sides in the research fieldof strongly correlated f -electron systems [2, 3]. Moreover,due to recent remarkable developments in experimentaltechniques and measurements, nowadays it has been possibleto detect directly and/or indirectly the multipole ordering.Note, however, that only spin degree of freedom oftenremains, when orbital degeneracy is lifted, for instance, dueto the effect of crystal structure with low symmetry. Inorder to promote the research of multipole phenomena, f -electron compounds crystallizing in the cubic structure withhigh symmetry are quite important. For instance, octupoleordering has been discussed in the phase IV of Ce0.7La0.3B6
[4] and NpO2 [3, 5–8] with cubic structure. As for NpO2,recently, a possibility of dotriacontapole ordering has beenalso pointed out [9, 10].
Here we emphasize that the study of multipole phe-nomena has been activated due to the focusing research offilled skutterudite compounds LnT4X12 with lanthanide Ln,transition metal atom T, and pnictogen X [11]. Since thesecompounds crystallize in the cubic structure of Th pointgroup, they have provided us an ideal stage for the researchof multipole physics. Furthermore, many isostructural mate-rials with different kinds of rare-earth and actinide ions havebeen successfully synthesized, leading to the development ofsystematic research on multipole ordering. In fact, recentexperiments in close cooperation with phenomenologicaltheory have revealed that multipole ordering frequentlyappears in filled skutterudites. For instance, a rich phasediagram of PrOs4Sb12 with field-induced quadrupole orderhas been unveiled experimentally and theoretically [12–14]. Furthermore, antiferro-Γ1-type higher multipole order[2] has been discussed for PrRu4P12 [15, 16] and PrFe4P12
[17–19].Now we turn our attention to theoretical research on
multipole order. Thus far, theory of multipole ordering hasbeen developed mainly from a phenomenological viewpointon the basis of an LS coupling scheme for multi- f -electronstate. It is true that several experimental results have beenexplained by those theoretical studies, but we believe thatit is also important to promote microscopic approach forunderstanding of multipole phenomena in parallel with

2 Physics Research International
phenomenological research. Based on this belief, the presentauthor has developed a microscopic theory for multipole-related phenomena with the use of a j- j coupling scheme[1, 20–22]. In particular, octupole ordering in NpO2 hasbeen clarified by the evaluation of multipole interaction withthe use of the standard perturbation method in terms ofelectron hopping [6–8, 23]. We have also discussed possiblemultipole states of filled skutterudites by analyzing multipolesusceptibility of a multiorbital Anderson model based on thej- j coupling scheme [24–29].
On the other hand, it is still difficult to understandintuitively the physical meaning of multipole degree offreedom due to the mathematically complicated form ofmultipole operator defined by using total angular momen-tum. As mentioned above, multipole is considered to bespin-orbital complex degree of freedom. In this sense, itseems to be natural to regard multipole as anisotropic spin-charge density. This point has been emphasized in thevisualization of multipole order [6–8, 23]. Then, we havedefined multipole as spin-charge density in the form of one-body operator from the viewpoint of multipole expansion ofelectromagnetic potential from charge distribution in elec-tromagnetism [30, 31]. Due to the definition of multipole inthe form of one-electron spin-charge density operator, it hasbeen possible to discuss unambiguously multipole state byevaluating multipole susceptibility even for heavy rare-earthcompounds with large total angular momentum [30].
As for the determination of the multipole state, we haveproposed to use the optimization of multipole susceptibilityon the basis of the standard linear response theory. We haveanalyzed an impurity Anderson model including seven forbitals with the use of the numerical renormalization grouptechnique and checked the effectiveness of the microscopicmodel on the basis of the j- j coupling scheme for thedescription of multipoles. We have also shown the result formultipole susceptibility of several kinds of filled skutteruditecompounds. With the use of the seven-orbital Andersonmodel, we have discussed field-induced multipole phenom-ena in Sm-based filled skutterudites, [32] multipole Kondoeffect, [33] and multipole state of Yb- and Tm-based filledskutterudites [34]. We have also discussed possible multipolestate in transuranium systems such as AmO2 [35] andmagnetic behavior of CmO2 [36].
From our previous investigations on the basis of themultiorbital Anderson model, it has been clarified that themultipole can be treated as spin-orbital complex degree offreedom in the one-electron operator form. However, inorder to discuss the ordering of multipole, it is necessaryto consider a periodic system including seven f orbitals peratomic site with strong spin-orbit coupling. The validity ofthe model on the basis of the j- j coupling scheme can bealso checked by such consideration. Namely, for the steadypromotion of multipole physics, it is highly expected to treatthe multipole ordering in a seven-orbital periodic model byovercoming a heavy task to solve the model including 14states per atomic site.
In this paper, we define a seven-orbital Hubbard modelwith strong spin-orbit coupling and explain a procedure todefine the multipole ordering by the divergence of multipole
susceptibility from a microscopic viewpoint. For the eval-uation of multipole susceptibility, we introduce a randomphase approximation. In principle, we can treat all the casesfor n = 1 ∼ 13 on the same footing, but here we focus onthe case of n = 2 corresponding to Pr and U compounds.As a typical example of the present procedure, we show aphase diagram including quadrupole ordering in a three-dimensional simple cubic lattice. Finally, we also discusssome future problems such as superconductivity induced bymultipole fluctuations near the multipole phase.
The organization of this paper is as follows. In Section 2,we explain each part of the seven-orbital Hubbard modelwith strong spin-orbit coupling. For the reference of readers,we show the list of hopping integrals among f -orbitals alongx, y, and z-axes through σ , π, δ, and φ bonds. In Section 3,we define the multipole operator as the complex spin-charge degree of freedom in the one-electron form. Then,we explain a scheme to determine the multipole orderingfrom the multipole susceptibility. Here we use a randomphase approximation for the evaluation of the multipolesusceptibility. In Section 4, we show the results for the case ofn = 2 in a three-dimensional simple cubic lattice. We discussthe phase diagram of the multipole ordering. In Section 5,we discuss some future problems and summarize this paper.Throughout this paper, we use such units as � = kB = 1.
2. Model Hamiltonian
The model Hamiltonian H is split into two parts as
H = Hkin +Hloc, (1)
where Hkin denotes a kinetic term and Hloc is a local part forpotential and interaction. The latter term is further given by
Hloc = Hso +HCEF +HC, (2)
where Hso is a spin-orbit coupling term, HCEF indicatescrystalline electric field (CEF) potential term, and HC
denotes Coulomb interaction term. We explain each term inthe following.
2.1. Local f -Electron Term. Among the three terms of Hloc,the spin-orbit coupling part is given by
Hso = λ∑
i,m,σ ,m′,σ ′ζm,σ ;m′,σ ′ f
†imσ fim′σ ′ , (3)
where fimσ is an annihilation operator of f -electron at sitei, σ = +1 (−1) for up (down) spin, m is the z-componentof angular momentum � = 3, λ is the spin-orbit interaction,and the matrix elements are expressed by
ζm,σ ;m,σ = mσ
2,
ζm+σ ,−σ ;m,σ =√�(� + 1)−m(m + σ)
2,
(4)
and zero for other cases.
Physics Research International 3
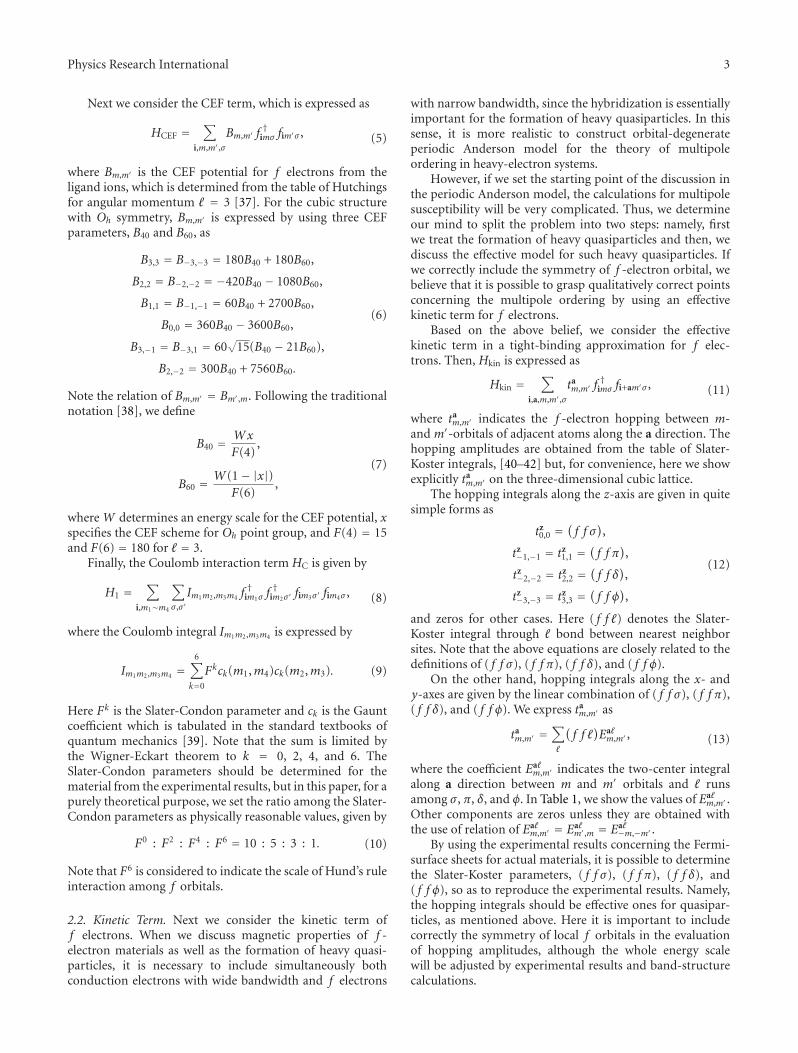
Next we consider the CEF term, which is expressed as
HCEF =∑
i,m,m′,σ
Bm,m′ f †imσ fim′σ , (5)
where Bm,m′ is the CEF potential for f electrons from theligand ions, which is determined from the table of Hutchingsfor angular momentum � = 3 [37]. For the cubic structurewith Oh symmetry, Bm,m′ is expressed by using three CEFparameters, B40 and B60, as
B3,3 = B−3,−3 = 180B40 + 180B60,
B2,2 = B−2,−2 = −420B40 − 1080B60,
B1,1 = B−1,−1 = 60B40 + 2700B60,
B0,0 = 360B40 − 3600B60,
B3,−1 = B−3,1 = 60√
15(B40 − 21B60),
B2,−2 = 300B40 + 7560B60.
(6)
Note the relation of Bm,m′ = Bm′,m. Following the traditionalnotation [38], we define
B40 = Wx
F(4),
B60 = W(1− |x|)F(6)
,
(7)
where W determines an energy scale for the CEF potential, xspecifies the CEF scheme for Oh point group, and F(4) = 15and F(6) = 180 for � = 3.
Finally, the Coulomb interaction term HC is given by
H1 =∑
i,m1∼m4
∑σ ,σ ′Im1m2,m3m4 f
†im1σ
f †im2σ ′ fim3σ ′ fim4σ , (8)
where the Coulomb integral Im1m2,m3m4 is expressed by
Im1m2,m3m4 =6∑
k=0
Fkck(m1,m4)ck(m2,m3). (9)
Here Fk is the Slater-Condon parameter and ck is the Gauntcoefficient which is tabulated in the standard textbooks ofquantum mechanics [39]. Note that the sum is limited bythe Wigner-Eckart theorem to k = 0, 2, 4, and 6. TheSlater-Condon parameters should be determined for thematerial from the experimental results, but in this paper, for apurely theoretical purpose, we set the ratio among the Slater-Condon parameters as physically reasonable values, given by
F0 : F2 : F4 : F6 = 10 : 5 : 3 : 1. (10)
Note that F6 is considered to indicate the scale of Hund’s ruleinteraction among f orbitals.
2.2. Kinetic Term. Next we consider the kinetic term off electrons. When we discuss magnetic properties of f -electron materials as well as the formation of heavy quasi-particles, it is necessary to include simultaneously bothconduction electrons with wide bandwidth and f electrons
with narrow bandwidth, since the hybridization is essentiallyimportant for the formation of heavy quasiparticles. In thissense, it is more realistic to construct orbital-degenerateperiodic Anderson model for the theory of multipoleordering in heavy-electron systems.
However, if we set the starting point of the discussion inthe periodic Anderson model, the calculations for multipolesusceptibility will be very complicated. Thus, we determineour mind to split the problem into two steps: namely, firstwe treat the formation of heavy quasiparticles and then, wediscuss the effective model for such heavy quasiparticles. Ifwe correctly include the symmetry of f -electron orbital, webelieve that it is possible to grasp qualitatively correct pointsconcerning the multipole ordering by using an effectivekinetic term for f electrons.
Based on the above belief, we consider the effectivekinetic term in a tight-binding approximation for f elec-trons. Then, Hkin is expressed as
Hkin =∑
i,a,m,m′,σ
tam,m′ f
†imσ fi+am′σ , (11)
where tam,m′ indicates the f -electron hopping between m-
and m′-orbitals of adjacent atoms along the a direction. Thehopping amplitudes are obtained from the table of Slater-Koster integrals, [40–42] but, for convenience, here we showexplicitly ta
m,m′ on the three-dimensional cubic lattice.The hopping integrals along the z-axis are given in quite
simple forms as
tz0,0 =
(f f σ
),
tz−1,−1 = tz
1,1 =(f f π
),
tz−2,−2 = tz
2,2 =(f f δ
),
tz−3,−3 = tz
3,3 =(f f φ
),
(12)
and zeros for other cases. Here ( f f �) denotes the Slater-Koster integral through � bond between nearest neighborsites. Note that the above equations are closely related to thedefinitions of ( f f σ), ( f f π), ( f f δ), and ( f f φ).
On the other hand, hopping integrals along the x- andy-axes are given by the linear combination of ( f f σ), ( f f π),( f f δ), and ( f f φ). We express ta
m,m′ as
tam,m′ =
∑�
(f f �
)Ea�m,m′ , (13)
where the coefficient Ea�m,m′ indicates the two-center integral
along a direction between m and m′ orbitals and � runsamong σ , π, δ, and φ. In Table 1, we show the values of Ea�
m,m′ .Other components are zeros unless they are obtained withthe use of relation of Ea�
m,m′ = Ea�m′,m = Ea�
−m,−m′ .By using the experimental results concerning the Fermi-
surface sheets for actual materials, it is possible to determinethe Slater-Koster parameters, ( f f σ), ( f f π), ( f f δ), and( f f φ), so as to reproduce the experimental results. Namely,the hopping integrals should be effective ones for quasipar-ticles, as mentioned above. Here it is important to includecorrectly the symmetry of local f orbitals in the evaluationof hopping amplitudes, although the whole energy scalewill be adjusted by experimental results and band-structurecalculations.

4 Physics Research International
Table 1: Coefficients Ea�m,m′ along the x- and y-axes between f
orbitals of nearest neighbor sites. Note that in double signs, theupper and lower signs correspond to the value along the x- and y-axes, respectively.
m m′ σ π δ φ
−3 −3 5/16 15/32 3/16 1/32
−3 −1 ∓√15/16 ∓√15/32 ±√15/16 ±√15/32
−3 1√
15/16 −√15/32 −√15/16√
15/32
−3 3 ∓5/16 ±15/32 ∓3/16 ±1/32
−2 −2 0 5/16 1/2 3/16
−2 0 0 ∓√30/16 0 ±√30/16
−2 2 0 5/16 −1/2 3/16
−1 −1 3/16 1/32 5/16 5/32
−1 1 ∓3/16 ±1/32 ∓5/16 ±5/32
0 0 0 3/8 0 5/8
3. Multipole Ordering
In order to discuss the multipole ordered phase from theitinerant side, we evaluate the multipole susceptibility χ byfollowing the standard quantum field theory. The multipolesusceptibility is defined by
χ(
q, iνn) = ∫ 1/T
0dτeiνnτ〈Xq(τ)X†−q(0)〉, (14)
where Xq denotes the multipole operator with momentumq, ν = 2πTn is the boson Matsubara frequency with aninteger n, T is a temperature, Xq(τ) = eHτXqe−Hτ , and 〈· · · 〉indicates the thermal average by using H . In the following,we introduce the multipole operator and explain a methodto evaluate the susceptibility.
3.1. Multipole Operator. In any case, first it is necessary todefine multipole. As for the definition of multipole, readersshould consult with [30, 31], but here we briefly explain thedefinition in order to make this paper self-contained. Wedefine X in the one-electron density-operator form as
Xq =∑k,γ
pk,γ(
q)T(k)γ
(q), (15)
where k denotes the rank of multipole, γ indicates the
irreducible representation for cubic point group, and T(k)γ (q)
indicates the cubic tensor operator, expressed in the second-quantized form as
T(k)γ
(q) = ∑
k,m,σ ,m′γ′T
(k,γ)mσ ,m′σ ′ f
†kmσ fk+qm′σ ′ . (16)
Here the matrix elements of the coefficient T(k,γ) arecalculated from the Wigner-Eckert theorem as [43]
T(k,γ)mσ ,m′σ ′ =
∑j,μ,μ′,q
G(k)γ,q
⟨j∥∥∥T(k)
∥∥∥ j⟩√2 j + 1
〈 jμ | jμ′kq〉
×⟨jμ | �msσ
2
⟨jμ′ | �m′s
σ ′
2
,
(17)
where � = 3, s = 1/2, j = � ± s, μ runs between − j and j, q
runs between −k and k, G(k)γ,q is the transformation matrix
between spherical and cubic harmonics, 〈JM|J ′M′J ′′M′′〉denotes the Clebsch-Gordan coefficient, and 〈 j‖T(k)‖ j〉 isthe reduced matrix element for spherical tensor operator,given by
⟨j∥∥∥T(k)
∥∥∥ j⟩ = 12k
√√√√(2 j + k + 1
)!(
2 j − k)!. (18)
Note that k ≤ 2 j and the highest rank is 2 j. When we definemultipoles as tensor operators in the space of total angularmomentum J on the basis of the LS coupling scheme, thereappear multipoles with k ≥ 8 for the cases of J ≥ 4, that is,for 2 ≤ n ≤ 4 and 8 ≤ n ≤ 12, where n is local f -electronnumber. If we need such higher-rank multipoles with k ≥ 8,it is necessary to consider many-body operators beyond thepresent one-body definition.
Note that when we express the multipole moment as (16)and (17), we normalize each multipole operator so as tosatisfy the orthonormal condition [44]
Tr{T(k,γ)T(k′,γ′)
}= δkk′δγγ′ , (19)
where δkk′ denotes the Kronecker’s delta.
3.2. Multipole Susceptibility. Now we move to the evaluationof multipole susceptibility. In order to determine the coeffi-cient pk,γ(q) in (15), it is necessary to calculate the multipolesusceptibility in the linear response theory. The multipolesusceptibility is expressed as
χ(
q, iνn) = ∑
kγ,k′γ′pk,γχkγ,k′γ′
(q, iνn
)p∗k′,γ′ , (20)
where the susceptibility matrix is given by
χkγ,k′γ′(
q, iνn) = ∑
m1∼m4
∑σ1∼σ4
T(k,γ)m1σ1,m3σ3
× χm1σ1m2σ2,m3σ3m4σ4
(q, iνn
)T
(k,γ)∗m2σ2,m4σ4 .
(21)
Then, χ and pk,γ are determined by the maximum eigenvalueand the corresponding normalized eigenstate of the suscep-tibility matrix equation (21).
In order to calculate actually the multipole susceptibility,it is necessary to introduce an appropriate approximation. Inthis paper, we use a random phase approximation (RPA) forthe evaluation of multipole susceptibility. For the purpose,we redivide the Hamiltonian H into two parts as
H = H0 +H1, (22)
where H0 indicates the one-electron part given by H0 =Hkin + Hso + HCEF and H1 is the interaction part, which isjust equal to HC in the present case. Then, we consider theperturbation expansion in terms of the Coulomb interaction.
The susceptibility diagrams are shown in Figure 1 andthey are expressed in a compact matrix form as
χ = χ(0)[
1− Uχ(0)]−1
+ χ(0)[
1 + J χ(0)]−1 − χ(0), (23)

Physics Research International 5
+ +
++
+ · · ·
+ · · ·
Figure 1: Feynman diagrams for multipole susceptibility in theRPA. The solid curve and broken line denote the noninteractingGreen’s function G(0) and Coulomb interaction, respectively.
where U and J are, respectively, given by
Um1σ1m2σ2,m3σ3m4σ4 = Im1m2,m3m4δσ1σ4δσ2σ3 ,
Jm1σ1m2σ2,m3σ3m4σ4 = Im1m2,m4m3δσ1σ3δσ2σ4 ,(24)
and the dynamical susceptibility χ(0) is given by
χ(0)m1σ1m2σ2,m3σ3m4σ4
(q, iνn
)= −T
∑n′
∑k
G(0)m1σ1,m4σ4
(k, iωn′)
×G(0)m2σ2,m3σ3
(k + q, iωn′ + iνn
).
(25)
Here G(0) is the one-electron Green’s function defined by thenoninteracting part H0.
In order to determine the multipole ordering, it isnecessary to detect the divergence of χ at νn = 0. We cannotevaluate the susceptibility just at a diverging point, but wefind such a critical point by the extrapolation of 1/χmax asa function of U , where U indicates the energy scale of theSlater-Condon parameters and χmax denotes the maximumeigenvalue of susceptibility matrix equation (21) for νn = 0.When we increase the magnitude of U , 1/χmax is graduallydecreased from the value in the weak-coupling limit. Inactual calculations, we terminate the calculation when 1/χmax
arrives at a value in the order of unity. By using the calculatedvalues of 1/χmax, we make an extrapolation of 1/χmax asa function of U . Then, we find a critical value of U atwhich 1/χmax becomes zero. As for the type of multipole andordering vector in the ordered phase, we extract such infor-mation from the eignevectors of the susceptibility matrixcorresponding to the maximum eigenvalue. By performingthe above calculations, it is possible to find the multipoleordered phase from a microscopic viewpoint in principle.
4. Results
In the previous sections, we have explained the modelHamiltonian and the procedure to determine the type ofmultipole ordering. We believe that the present procedurecan be applied to actual materials, but there are so manykinds of materials and multipole phenomena. Here we showthe calculated results for the case of n = 2 concerning Γ3
non-Kramers quadrupole ordering, in order to see how thepresent procedure works. The results for actual materials willbe discussed elsewhere.
4.1. CEF States. First we discuss the local CEF states in orderto determine the CEF parameter. We consider the case of
n = 2 corresponding to Pr3+ and U4+ ions. Since we discussthe local electron state, the energy unit is taken as F6. As forthe spin-orbit coupling, here we take λ/F6 = 0.1. Concerningthe value of W , it should be smaller than λ and we set W asW/F6 = 0.001.
In Figure 2, we show the CEF energies as functions of x.As easily understood from the discussion in the LS couplingscheme, the ground state multiplet for n = 2 is characterizedby J = 4, where J is total angular momentum given byJ = |L− S| with angular momentum L and spin momentumS. For n = 2, we find L = 5 and S = 1 from the Hund’s rulesand, thus, we obtain J = 4. Due to the effect of cubic CEF,the nonet of J = 4 is split into four groups as Γ1 singlet, Γ3
non-Kramers doublet, Γ4 triplet, and Γ5 triplet. In the presentdiagonalization of Hloc, we find such CEF states, as shown inFigure 2. When we compare this CEF energy diagram withthat of the LS coupling scheme [38], we find that the shapeof curves and the magnitude of excitation energy are differentwith each other. However, from the viewpoint of symmetry,the structure of the low-energy states is not changed betweenthe LS and j- j coupling schemes [1]. Since we are interestedin a possibility of Γ3 quadrupole ordering, we choose thevalue of x as x = 0.0 in the following.
4.2. Energy Bands. Next we consider the band structureobtained by the diagonalization of H0 = Hkin + HCEF + Hso.As for the Slater-Koster integrals, it is one way to determinethem so as to reproduce the Fermi-surface sheets of actualmaterials, but here we determine them from a theoreticalviewpoint as
−( f f σ) = (f f δ
) = t,(f f π
) = (f f φ
) = −t/2,(26)
where t indicates the magnitude of hopping amplitude.The size of t should be determined by the quasi-particlebandwidth, but here we simply treat it as an energy unit.
In Figure 3, we depict the eigen energies of H0 along thelines connecting some symmetric points in the first Brillouinzone. As for the spin-orbit coupling and CEF parameters,we set λ/t = 0.1 and W/t = 0.001. First we note thatthere exist seven bands and each band has double degeneracydue to time-reversal symmetry, which is distinguished bypseudospin. Since the magnitude of λ is not so large, wedo not observe a clear splitting between j = 7/2 octet andj = 5/2 sextet bands. Around at Γ point, we find that j = 5/2sextet is split into two groups, Γ7 doublet and Γ8 quartet.Here we note that the energy of Γ8 quartet is lower thanthat of Γ7. Since the Γ8 has orbital degeneracy, it becomes anorigin of the formation of Γ3 non-Kramers doublet, when weaccommodate a couple of electrons per site.
Note that the Fermi level is denoted by a horizontal line,which is determined by the condition of n = 2, where nis the average electron number per site. When we pay ourattention to the band near the Fermi level, we find thatthe orbital degeneracy exists in the bands on the Fermisurface. For instance, we see the degenerate bands on theFermi surface around the Γ point. Such orbital degeneracy inthe momentum space is considered to be a possible source

6 Physics Research International
−0.5−1 0 0.5 1−0.03
−0.02
−0.01
0
0.01
0.02
0.03
Γ1
Γ4
Γ5 Γ3
10F6
5F6
3F6
= 0.1F6
W = 0.001F6
En
ergy
(u
nit
s ofF
6)
x
F0 =F2 =F4 =
Figure 2: CEF energy levels obtained by the diagonalization of Hloc
for λ/F6 = 0.1 and W/F6 = 0.001 with F0 = 10F6, F2 = 5F6, andF4 = 3F6.
of Γ3 quadrupole ordering, which will be discussed in thenext subsection. Finally, in the present case, we expect theappearance of the large-volume Fermi surface as well asthe small-size pocket-like Fermi surface. Such mixture ofthe Fermi surface sheets with different topology may be animportant issue for the appearance of higher-rank multipoleordering.
4.3. Phase Diagram. Now we show the phase diagram ofthe multipole state. First it is necessary to calculate thesusceptibility equation (25) at νn = 0. As for the momentumq, we divide the first Brillouin zone into 16 × 16 × 16meshes. Concerning the momentum integration in (25),we exploit the Gauss-Legendre quadrature with due care.At low temperatures such as T/t = 0.01, it seems to beenough to divide the range between −π and π into 60segments along each direction axis. As found in (25), χ(0)
has 144 components in the spin-orbital space, but it isnot necessary to calculate all the components due to thesymmetry argument. We have checked that it is enough toevaluate 1586 components of χ(0).
We set the parameters as λ/t = 0.1, x = 0.0, W/t = 0.001,F2 = 0.5F0, F4 = 0.3F0, F6 = 0.1F0, −( f f σ) = ( f f δ) = t,and ( f f π) = ( f f φ) = −t/2. Note that the ratio amongthe Slater-Condon parameters is the same as that in Figure 2.We also note that the hopping amplitude t is relatively largecompared with local potential and interactions, since weconsider the multipole ordering from the itinerant side. Herewe emphasize that our framework actually works for themicroscopic discussion on the multipole ordering. A wayto determine more realistic parameters in the model will bediscussed elsewhere.
By changing the values of temperature T/t, we depictthe phase diagram in the plane of t/F0 and T/t. Note thatt2/F0 corresponds to the typical magnitude of multipole-multipole interaction between nearest neighbor sites. Asnaively understood, when the temperature is increased,larger value of U is needed to obtain the ordered state.Then, the phase diagram is shown in Figure 4. We evaluate
−5
0
5
10
X M Γ R
= 0.1tW = 0.001t
En
ergy
(u
nit
s oft)
−(ff ) = (ff ) = t(ff ) = (ff ) = −t/2
Figure 3: Energy band structure obtained by the diagonalization ofH0 for ( f f σ) = −t, ( f f π) = −t/2, ( f f δ) = t, ( f f φ) = −t/2,λ/t = 0.1, and W/t = 0.001. Note that we show the eigen energiesalong the lines of Γ → X → M → Γ → R → X .
the maximum eigenvalue of the multipole susceptibility byincreasing F0/t. One may think that the magnitude of t/F0
in Figure 4 is too small to obtain reasonable results in theRPA calculations. Here we note that the total bandwidth ofthe seven-orbital system is in the order of 10t, as shown inFigure 3. Namely, the critical value of the interaction F0
c atlow enough temperatures is considered to be in the order ofthe total bandwidth. In this sense, we consider that the valueof t/F0 in Figure 4 is not small for the RPA calculations. Notealso that when the temperature is increased, the magnitudeof noninteracting susceptibility is totally suppressed, leadingto the enhancement of F0
c . Thus, t/F0 is decreased when T isincreased, as observed in Figure 4.
At low temperatures as T/t < 0.3, we obtain that the max-imum eigen value of susceptibility matrix is characterizedby the multipole with Γ3 symmetry and the ordering vectorQ = (π,π,π). The component of the multipole depends onthe temperature, but the 90% of the optimized multipole isrank 2 (quadrupole). Others are rank 4 (hexadecapole) andrank 6 (tetrahexacontapole) components, which are about10%. Note again that the multipoles with the same symmetryare mixed in general, even if the rank of the multipoleis different. Namely, quadrupole is the main component,while hexadecapole and tetrahexacontapole are includedwith significant amounts. Note also that the phase diagramis shown only in the region of T/t < 1, but the boundarycurve approaches the line of t/F0 = 0. Since the case withvery large F0 is unrealistic, we do not pay our attention to thephase for T > t, although we can continue the calculation insuch higher temperature region.
When we increase the temperature, the magnetic phaseis observed for T/t > 0.3. The main component is Γ4
dipole and the ordering vector is Q = (0, 0, 0). Note thatthe susceptibility for Γ4 multipole moment does not meanmagnetic susceptibility, which is evaluated by the response ofmagnetic moment L+2S, that is, J+S. AtT/t = 0.4, admixtureof the multipole is as follows: rank 1 (dipole) 90.7%, rank 3(octupole) 6.5%, rank 5 (dotriacontapole) 2.1%, and rank

Physics Research International 7
0.05 0.1 0.15 0.200
0.2
0.4
0.6
0.8
1
= 0.1tW = 0.001t
Tem
pera
ture
(u
nit
s oft)
Γ4 dipole
Q = (0, 0, 0)
Γ3 quadrupoleQ = ( , , )
F2 = 0.5F0
F4 = 0.3F0
F6 = 0.1F0
−(ff ) = (ff ) = t(ff ) = (ff ) = −t/2
t/F0
Figure 4: Phase diagram of the multipole ordering for n = 2 on thethree-dimensional simple cubic lattice.
7 (octacosahectapole) 0.7%. The amounts are changed bythe temperature, but the main component is always dipole.We have found the low-temperature antiferroquadrupolestate and the high-temperature ferromagnetic phase. Sucha combination of nonmagnetic and magnetic phases canbe observed in other parameter sets including quadrupoleordering.
5. Discussion and Summary
We have constructed the microscopic framework to discussthe multipole ordering due to the evaluation of multipolesusceptibility in f -electron systems on the basis of the seven-orbital Hubbard model with strong spin-orbit coupling. Forthe evaluation of multipole susceptibility, we have used theRPA and found the critical point from 1/χmax. As an exampleof the present scheme, we have shown the results for thecase of n = 2 concerning quadrupole ordering on the three-dimensional simple cubic lattice. If we specify the latticestructure and determine the hopping parameter from thecomparison with the experimental results on the Fermi-surface sheets, in principle, it is possible to determine thetype of multipole ordering with the use of appropriate localCEF parameters and Coulomb interactions.
Although the microscopic theory of multipole orderinghas been proposed, it is necessary to elaborate the presentscheme both from theoretical and experimental viewpoints.In order to enhance the effectiveness of the present pro-cedure, we should increase the applicability of the theory.For instance, we have not considered at all the sublatticestructure in this paper, but in actuality, the staggered-typemultipole ordering has been observed. In order to reproducethe structure, it is necessary to maximize the multipolesusceptibility by taking into account the sublattice structure.It is one of future problems from a theoretical viewpoint.
It is also highly expected that the present scheme shouldbe applied to actual materials in order to explain the origin ofmultipole ordering. For instance, it is interesting to seek forthe origin of peculiar incommensurate quadrupole ordering
observed in PrPb3 [45]. At the first glance, it seems to bequite difficult to explain the origin of the Γ3 quadrupoleordering with the ordering vector of Q = (π/2±δ,π/2±δ, 0)with δ = π/8. However, if we use the present scheme,it may be possible to find a solution in a systematic way.Another issue is the revisit to octupole and higher-rankmultipole ordering in NpO2. The significant amount ofdotriacontapole component may be understood naturally inthe present scheme.
Another interesting future problem is the emergence ofsuperconductivity near the multipole ordered phase. It hasbeen widely accepted that anisotropic d-wave superconduc-tivity appears in the vicinity of the antiferromagnetic phase,as observed in several kinds of strongly correlated electronmaterials. In general, near the quantum phase transition,anisotropic superconducting pairs are formed due to theeffect of quantum critical fluctuations. Thus, also in thevicinity of multipole ordering, superconductivity is generallyexpected to occur. Even from purely theoretical interest,it is worthwhile to investigate superconductivity near theantiferroquadrupole phase in Figure 4. When we turn ourattention to actual material, in PrIr2Zn20, superconductivityhas been observed and quadrupole fluctuations have beenconsidered to play some roles [46]. Within the RPA, it ispossible to discuss the appearance of superconductivity inthe vicinity of quadrupole ordering in the present scheme.It is another future problem.
In summary, we have proposed the prescription to deter-mine the type of multipole ordering from a microscopicviewpoint on the basis of the seven-orbital Hubbard model.The multipole susceptibility has been obtained in the RPAand the quadrupole ordering has been actually discussed ina way similar to that for the spin ordering in the single-orbital Hubbard model. The application to actual f -electronmaterials will be discussed elsewhere, but we believe that thepresent scheme is useful to consider the origin of multipoleordering. In addition, a possibility of superconductivity nearthe multipole ordering is an interesting future problem.
Acknowledgments
The author thanks K. Ueda for discussions on heavy-electronsystems. This work has been supported by a Grant-in-Aid forScientific Research on Innovative Areas “Heavy Electrons”(no. 20102008) of The Ministry of Education, Culture,Sports, Science, and Technology, Japan. The computation inthis work has been partly done with the use of the facilities ofthe Supercomputer Center of Institute for Solid State Physics,University of Tokyo.
References
[1] T. Hotta, “Orbital ordering phenomena in d- and f -electronsystems,” Reports on Progress in Physics, vol. 69, no. 7, articleR02, pp. 2061–2155, 2006.
[2] Y. Kuramoto, H. Kusunose, and A. Kiss, “Multipole orders andfluctuations in strongly correlated electron systems,” Journal ofthe Physical Society of Japan, vol. 78, no. 7, Article ID 072001,2009.
8 Physics Research International
[3] P. Santini, S. Carretta, G. Amoretti, R. Caciuffo, N. Magnani,and G. H. Lander, “Multipolar interactions in f -electronsystems: the paradigm of actinide dioxides,” Reviews of ModernPhysics, vol. 81, no. 2, pp. 807–863, 2009.
[4] K. Kuwahara, K. Iwasa, M. Kohgi, N. Aso, M. Sera, and F.Iga, “Detection of neutron scattering from phase IV of Ce0.7La0.3B6: a confirmation of the octupole order,” Journal of thePhysical Society of Japan, vol. 76, no. 9, Article ID 093702,2007.
[5] Y. Tokunaga, Y. Homma, S. Kambe et al., “NMR evidence fortriple-�q; multipole structure in NpO2,” Physical Review Letters,vol. 94, no. 13, Article ID 137209, 2005.
[6] K. Kubo and T. Hotta, “Microscopic theory of multipoleordering in NpO2,” Physical Review B, vol. 71, no. 14, ArticleID 140404, 2005.
[7] K. Kubo and T. Hotta, “Analysis of f -p model for octupoleordering in NpO2,” Physical Review B, vol. 72, no. 13, ArticleID 132411, 2005.
[8] K. Kubo and T. Hotta, “Multipole ordering in f -electronsystems on the basis of a j-j coupling scheme,” Physical ReviewB, vol. 72, no. 14, Article ID 144401, 2005.
[9] P. Santini, S. Carretta, N. Magnani, G. Amoretti, and R.Caciuffo, “Hidden order and low-energy excitations in NpO2,”Physical Review Letters, vol. 97, no. 20, Article ID 207203, 2006.
[10] M.-T. Suzuki, N. Magnani, and P. M. Oppeneer, “First-principles theory of multipolar order in neptunium dioxide,”Physical Review B, vol. 82, no. 24, Article ID 241103, 2010.
[11] H. Sato, H. Sugawara, Y. Aoki, and H. Harima, “Magneticproperties of filled skutterudites,” in Handbook of MagneticMaterials, K. H. J. Buschow, Ed., vol. 18, pp. 1–110, Elsevier,Amsterdam, The Netherlands, 2009.
[12] Y. Aoki, T. Namiki, S. Ohsaki, S. R. Saha, H. Sugawara, andH. Sato, “Thermodynamical study on the heavy-fermionsuperconductor PrOs4Sb12: evidence for field-induced phasetransition,” Journal of the Physical Society of Japan, vol. 71, no.9, pp. 2098–2101, 2002.
[13] T. Tayama, T. Sakakibara, H. Sugawara, Y. Aoki, and H. Sato,“Magnetic phase diagram of the heavy fermion superconduc-tor PrOs4Sb12,” Journal of the Physical Society of Japan, vol. 72,no. 6, pp. 1516–1522, 2003.
[14] R. Shiina and Y. Aoki, “Theory of field-induced phase transi-tion in PrOs4Sb12,” Journal of the Physical Society of Japan, vol.73, no. 3, pp. 541–544, 2004.
[15] T. Takimoto, “Antiferro-hexadecapole scenario for metal-insulator transition in PrRu4P12,” Journal of the Physical Societyof Japan, vol. 75, no. 3, Article ID 034714, 2006.
[16] K. Iwasa, L. Hao, K. Kuwahara et al., “Evolution of 4f electronstates in the metal-insulator transition of PrRu4P12,” PhysicalReview B, vol. 72, no. 2, Article ID 024414, 2005.
[17] A. Kiss and Y. Kuramoto, “Scalar order: possible candidatefor order parameters in skutterudites,” Journal of the PhysicalSociety of Japan, vol. 75, no. 10, Article ID 103704, 2006.
[18] O. Sakai, J. Kikuchi, R. Shiina et al., “Experimental andtheoretical studies of NMR in PrFe4P12,” Journal of the PhysicalSociety of Japan, vol. 76, no. 2, Article ID 024710, 2007.
[19] J. Kikuchi, M. Takigawa, H. Sugawara, and H. Sato, “On thesymmetry of low-field ordered phase of PrFe4P12: 31P NMR,”Journal of the Physical Society of Japan, vol. 76, no. 4, Article ID043705, 2007.
[20] T. Hotta and K. Ueda, “Construction of a microscopic modelfor f -electron systems on the basis of a j-j coupling scheme,”Physical Review B, vol. 67, no. 10, Article ID 104518, 2003.
[21] T. Hotta, “Spin and orbital structure of uranium compoundson the basis of a j-j coupling scheme,” Physical Review B, vol.70, no. 5, pp. 054405–10, 2004.
[22] H. Onishi and T. Hotta, “An orbital-based scenario for themagnetic structure of neptunium compounds,” New Journalof Physics, vol. 6, article 193, 2004.
[23] K. Kubo and T. Hotta, “Multipole ordering in f -electronsystems,” Physica B, vol. 378-380, pp. 1081–1082, 2006.
[24] T. Hotta, “Magnetic fluctuations of filled skutterudites emerg-ing in the transition region between singlet and triplet states,”Physical Review Letters, vol. 94, no. 6, Article ID 067003, 2005.
[25] T. Hotta, “Microscopic approach to magnetism and super-conductivity of f -electron systems with filled skutteruditestructure,” Journal of the Physical Society of Japan, vol. 74, no.4, pp. 1275–1288, 2005.
[26] T. Hotta, “Multipole fluctuations in filled skutterudites,” Jour-nal of the Physical Society of Japan, vol. 74, no. 9, pp. 2425–2429, 2005.
[27] T. Hotta and H. Harima, “Effective crystalline electric fieldpotential in a j-j coupling scheme,” Journal of the PhysicalSociety of Japan, vol. 75, no. 12, Article ID 124711, 2006.
[28] T. Hotta, “Microscopic aspects of multipole properties of filledskutterudites,” Journal of Magnetism and Magnetic Materials,vol. 310, no. 2, pp. 1691–1697, 2007.
[29] T. Hotta, “Multipole susceptibility of multiorbital Andersonmodel coupled with Jahn-Teller phonons,” Journal of thePhysical Society of Japan, vol. 76, no. 3, Article ID 034713,2007.
[30] T. Hotta, “Multipole state of heavy lanthanide filled skutteru-dites,” Journal of the Physical Society of Japan, vol. 76, no. 8,Article ID 083705, 2007.
[31] T. Hotta, “Multipole as f -electron spin-charge density in filledskutterudites,” Journal of the Physical Society of Japan, vol. 77,supplement A, pp. 96–101, 2008.
[32] T. Hotta, “Field-induced multipole states of Sm-based filledskutterudites,” Journal of the Physical Society of Japan, vol. 77,no. 7, Article ID 074716, 2008.
[33] T. Hotta, “Magnetically robust multipole Kondo effect,”Journal of Physics: Conference Series, vol. 150, no. 4, Article ID042061, 2009.
[34] T. Hotta, “Construction of a microscopic model for Yb and Tmcompounds on the basis of a j-j coupling scheme,” Journal ofthe Physical Society of Japan, vol. 79, no. 9, Article ID 094705,2010.
[35] T. Hotta, “Microscopic analysis of multipole susceptibility ofactinide dioxides: a scenario of multipole ordering in AmO2,”Physical Review B, vol. 80, no. 2, Article ID 024408, 2009.
[36] F. Niikura and T. Hotta, “Magnetic behavior of curium dioxidewith a nonmagnetic ground state,” Physical Review B, vol. 83,no. 17, Article ID 172402, 2011.
[37] M. T. Hutchings, “Point-charge calculations of energy levels ofmagnetic ions in crystalline electric fields,” Solid State Physics,vol. 16, pp. 227–273, 1964.
[38] K. R. Lea, M. J. M. Leask, and W. P. Wolf, “The raising ofangular momentum degeneracy of f -electron terms by cubiccrystal fields,” Journal of Physics and Chemistry of Solids, vol.23, no. 10, pp. 1381–1405, 1962.
[39] J. C. Slater, Quantum Theory of Atomic Structure, McGraw-Hill, New York, NY, USA, 1960.
[40] J. C. Slater and G. F. Koster, “Simplified LCAO method for theperiodic potential problem,” Physical Review, vol. 94, no. 6, pp.1498–1524, 1954.

Physics Research International 9
[41] R. R. Sharma, “General expressions for reducing the Slater-Koster linear combination of atomic orbitals integrals to thetwo-center approximation,” Physical Review B, vol. 19, no. 6,pp. 2813–2823, 1979.
[42] K. Takegahara, Y. Aoki, and A. Yanase, “Slater-Koster tables forf -electrons,” Journal of Physics C, vol. 13, no. 4, article 016, pp.583–588, 1980.
[43] T. Inui, Y. Tanabe, and Y. Onodera, Group Theory and ItsApplications in Physics, Springer, Berlin, Germany, 1996.
[44] K. Kubo and T. Hotta, “Magnetic susceptibility of multiorbitalsystems,” Journal of the Physical Society of Japan, vol. 75, no. 1,Article ID 013702, 2006.
[45] T. Onimaru, T. Sakakibara, N. Aso, H. Yoshizawa, H. S. Suzuki,and T. Takeuchi, “Observation of modulated quadrupolarstructures in PrPb3,” Physical Review Letters, vol. 94, no. 19,Article ID 197201, 2005.
[46] T. Onimaru, K. T. Matsumoto, Y. F. Inoue et al., “Anti-ferroquadrupolar ordering in a Pr-based superconductorPrIr2Zn20,” Physical Review Letters, vol. 106, no. 17, Article ID177001, 2011.

Hindawi Publishing CorporationPhysics Research InternationalVolume 2012, Article ID 276348, 22 pagesdoi:10.1155/2012/276348
Review Article
Magnetic and Magnetoelectric Properties ofRare Earth Molybdates
B. K. Ponomarev1 and A. Zhukov2, 3
1 Institute of Solid State Physics, Russian Academy of Sciences, 142432 Chernogolovka, Russia2 IKERBASQUE, Basque Foundation for Science, 48011 Bilbao, Spain3 Departamento de Fisica de Materiales, Facultad de Quimicas, UPV/EHU, 20009 San Sebastian, Spain
Correspondence should be addressed to A. Zhukov, [email protected]
Received 27 July 2011; Accepted 14 February 2012
Academic Editor: Mitsuteru Inoue
Copyright © 2012 B. K. Ponomarev and A. Zhukov. This is an open access article distributed under the Creative CommonsAttribution License, which permits unrestricted use, distribution, and reproduction in any medium, provided the original work isproperly cited.
We present results on ferroelectric, magnetic, magneto-optical properties and magnetoelectric effect of rare earth molybdates(gadolinium molybdate, GMO, and terbium molybdate, TMO, and samarium molybdate, SMO), belonging to a new type offerroelectrics predicted by Levanyuk and Sannikov. While cooling the tetragonal β-phase becomes unstable with respect to twodegenerate modes of lattice vibrations. The β-β′ transition is induced by this instability. The spontaneous polarization appearsas a by-product of the lattice transformation. The electric order in TMO is of antiferroelectric type. Ferroelectric and ferroelasticGMO and TMO at room temperature are paramagnets. At low temperatures GMO and TMO are antiferromagnetic with the Neeltemperatures TN = 0.3 K (GMO) and TN = 0.45 K (TMO). TMO shows the spontaneous destruction at 40 kOe magnetic field.Temperature and field dependences of the magnetization in TMO are well described by the magnetism theory of singlets at 4.2 K≤ T ≤ 30 K. The magnetoelectric effect in SMO, GMO and TMO, the anisotropy of magnetoelectric effect in TMO at T = (1.8–4.2) K, the Zeeman effect in TMO, the inversion of the electric polarization induced by the laser beam are discussed. The correlationbetween the magnetic moment of rare earth ion and the magnetoelectric effect value is predicted. The giant fluctuations of theacoustic resonance peak intensity near the Curie point are observed.
1. Introduction
At the end of 1960s, there was a great interest in therare earth molybdates family R2(MoO4)3 (RMO) (R =Pr, Nd, Sm, Eu, Gd, Tb and Dy) because these compoundsexhibited the phenomena of ferroelectricity and ferroelastic-ity [1].
RMO from Pr2(MoO4)3 (PMO) to TMO crystallizesto the tetragonal β-structure with a space group P42m(point symmetry group is 42m). Their melting pointsare 1045◦C for PMO and 1172◦C for TMO. Dy2(MoO4)3
(DMO) crystallizes to cubic γ-phase at 1222◦C and trans-forms to β-structure at 1030◦C. While cooling the familyundergoes a transformation from the tetragonal β-phaseto the monoclinic α-Phase. The temperatures of the β-αtransformation are 987◦C for PMO and 805◦C for DMO.
However, the transformation is sluggish and, therefore,the high-temperature phase can be quenched in. If thethermodynamically metastable β-phases of RMO are furthercooled, they undergo the second transformation leading tothe lower symmetry ferroelastic-ferroelectric orthorhombicPba2 β′-structures (point symmetry group mm2). They arealso thermodynamically metastable. The temperatures of β-β′ phase transitions are 235◦C for PMO and 145◦C for DMO.
The single crystal samples of RMO are transparent in thevisible light.
Both β and β′ phases are piezoelectric. The β′ phase isferroelectric. The spontaneous electric polarization valuesare of ≈2 × 10⁻⁷ Coul/cm2. The dielectric permeability peakat the Curie temperature is of ≈10 for GMO.
The ferroelastic properties are well exhibited. In a single-domain sample of (001) cut, the switching of the ferroelectric
2 Physics Research International
Table 1
The ion The ground state The spin, SThe angular
Momentum, LThe total
Momentum, J
Sm3+ 6H5/2 5/2 5 5/2
Gd3+ 8S7/2 7/2 0 7/2
Tb3+ 7F6 3 3 6
domain can be observed visually in polarized light atcompressing the sample along the [010] axis.
Orthorhombic β′-phases of rare earth molybdates areparamagnetic down to temperatures below l K.
In RMO with R = Sm, Gd, Tb and in mixed molybdatesDyGd(MoO4)3 (DGMO), TbGd(MoO4)3 (TGMO) the non-linear magnetoelectric effect was observed experimentally. InTMO and in TGMO, the switching of ferroelectric domainsby the magnetic field was observed experimentally. These arethe first substances in which the possibility was found toswitch the ferroelectric domains by the magnetic field.
The longitudinal Zeeman effect was investigated in TMOin the magnetic fieldH ≤ 20 T along the [001] and [110] axesat T = 4.2 K and 1.7 K. The experimental field dependencesof the wave numbers of the absorption peaks νi(H) wereobtained. The analysis of the dependences shows that theexcited multiplet 5D4 of Tb3+ ion in the crystal field of TMOcan be considered as consisting from five singlets and twoquasidoublets. The field dependences of the energy levelsEi(H) were obtained from the experimental data in themagnetic field along the [001] axis for the 5D4 multiplet. Theexperimental dependences Ei(H) were described well by thetheory of the magnetism of singlets.
The dependences of the photoinduced voltage in TMOupon the time t of the illumination by a laser beam weremeasured at room temperature at 0.1 s ≤ t ≤ 4500 s. Thepower of the laser radiation was 0.4 W. The distributionof the intensity along the sample was varied from highlyinhomogeneous to homogeneous. It was found that thephotoinduced voltages of two types with the opposite signsappear due to the inhomogeneous illumination. The modelwas proposed to explain the appearance of the photoinducedvoltage due to the inhomogeneous illumination.
The qualitative explanation of the mechanisms of thesetwo effects was given. To make quantitative estimates, it isnecessary to measure the dependences of the effect uponthe temperature of the sample and upon the intensity ofthe light.
The temperature dependence of the intensity of themain acoustic resonant peak in GMO was measured attemperatures from 22◦C to 165◦C. This temperature rangeincludes the Curie point (TC = 159◦C). The low-frequencyfluctuations of the amplitude of the resonant current inGMO were observed near the Curie point. The corre-sponding variations of the measured voltage were 0.1 Volt.The typical times of the fluctuations were (10–100) sec.The relative values of the corresponding fluctuations ofthe piezoacoustic impedance in GMO are two orders ofmagnitude larger than the values of the fluctuations of thephysical parameters in the solids that were known before.
Such fluctuations of the physical properties of the solids wereobserved visually never before.
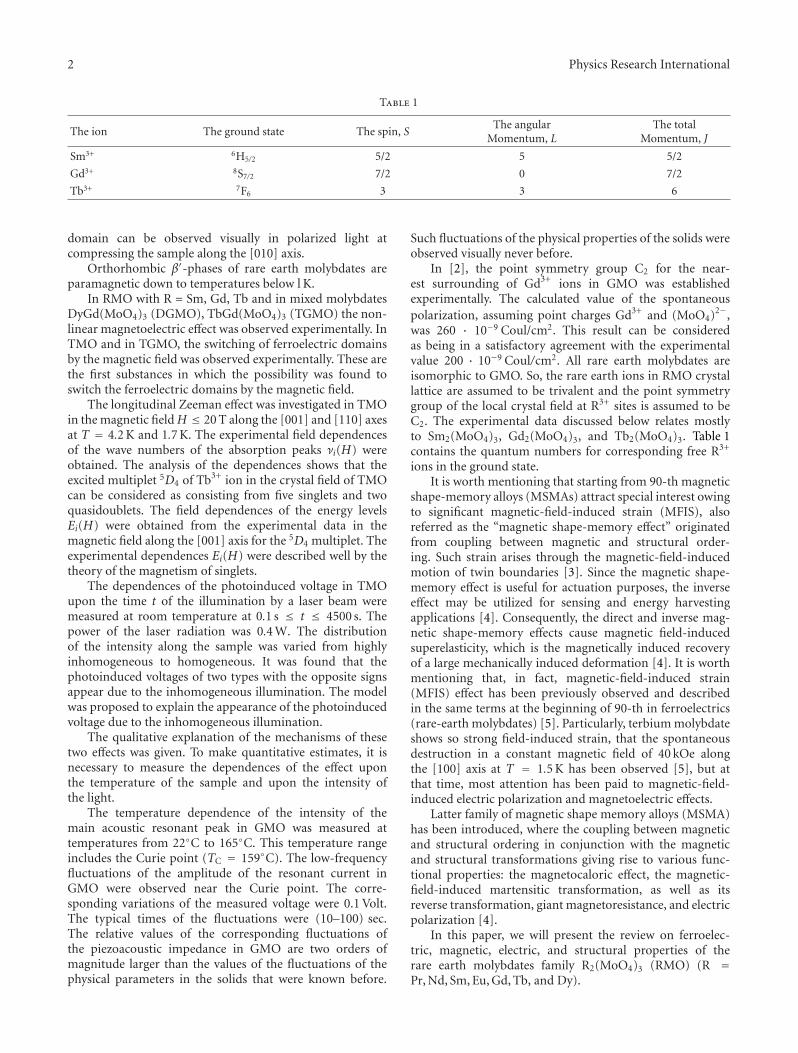
In [2], the point symmetry group C2 for the near-est surrounding of Gd3+ ions in GMO was establishedexperimentally. The calculated value of the spontaneouspolarization, assuming point charges Gd3+ and (MoO4)2−,was 260 · 10−9 Coul/cm2. This result can be consideredas being in a satisfactory agreement with the experimentalvalue 200 · 10−9 Coul/cm2. All rare earth molybdates areisomorphic to GMO. So, the rare earth ions in RMO crystallattice are assumed to be trivalent and the point symmetrygroup of the local crystal field at R3+ sites is assumed to beC2. The experimental data discussed below relates mostlyto Sm2(MoO4)3, Gd2(MoO4)3, and Tb2(MoO4)3. Table 1contains the quantum numbers for corresponding free R3+
ions in the ground state.It is worth mentioning that starting from 90-th magnetic
shape-memory alloys (MSMAs) attract special interest owingto significant magnetic-field-induced strain (MFIS), alsoreferred as the “magnetic shape-memory effect” originatedfrom coupling between magnetic and structural order-ing. Such strain arises through the magnetic-field-inducedmotion of twin boundaries [3]. Since the magnetic shape-memory effect is useful for actuation purposes, the inverseeffect may be utilized for sensing and energy harvestingapplications [4]. Consequently, the direct and inverse mag-netic shape-memory effects cause magnetic field-inducedsuperelasticity, which is the magnetically induced recoveryof a large mechanically induced deformation [4]. It is worthmentioning that, in fact, magnetic-field-induced strain(MFIS) effect has been previously observed and describedin the same terms at the beginning of 90-th in ferroelectrics(rare-earth molybdates) [5]. Particularly, terbium molybdateshows so strong field-induced strain, that the spontaneousdestruction in a constant magnetic field of 40 kOe alongthe [100] axis at T = 1.5 K has been observed [5], but atthat time, most attention has been paid to magnetic-field-induced electric polarization and magnetoelectric effects.
Latter family of magnetic shape memory alloys (MSMA)has been introduced, where the coupling between magneticand structural ordering in conjunction with the magneticand structural transformations giving rise to various func-tional properties: the magnetocaloric effect, the magnetic-field-induced martensitic transformation, as well as itsreverse transformation, giant magnetoresistance, and electricpolarization [4].
In this paper, we will present the review on ferroelec-tric, magnetic, electric, and structural properties of therare earth molybdates family R2(MoO4)3 (RMO) (R =Pr, Nd, Sm, Eu, Gd, Tb, and Dy).

Physics Research International 3
2. Ferroelectric Properties
Here, only a short description of ferroelectric properties ofRMO will be given. The detailed review of this question isavailable in [1].
RMO belongs to a new type of ferroelectrics (improperferroelectrics) theoretically predicted by Levanyuk and San-nikov [6].
While cooling the tetragonal β-phase becomes unstablewith respect to two degenerate modes (soft modes) oflattice vibrations, this instability induces the displacive phasetransition of the first order to the ferroelastic-ferroelectricβ′-GMO-type structure. The β-β′ transition temperature isalso the Curie temperature of the orthorhombic β′-RMO.The spontaneous polarization appears at the transitionas a by-product of the lattice transformation and cannotbe considered as the order parameter. This conclusionwas obtained for GMO by Petzelt and Dvorak [7] usinggroup analysis. They confirmed this result experimentally byfar-infrared reflectivity and transmission measurements inGMO.
Analogous result was obtained for TMO from neutron-scattering experiments [8, 9]. In [6], from the examinationof the soft mode, it was shown that the primary-orderparameter, which necessarily shows large fluctuations, nearTC, have no macroscopic polarization but have insteadantipolar. The freezing in of this antiferroelectric staticdisplacement couples to the shear strain which in turnproduces the electric polarization by piezoelectric coupling.
The displacive mechanism of β-β′ transition is valid forall the members of RMO family because they are isomorphicto GMO and TMO.
The crystal structure of β′-GMO was solved in [2, 10, 11].Above the Curie temperature, the structure is tetragonal withspace group P421m and point group 421m. Below the Curietemperature, it is orthorhombic with space group Pba2 andpoint group mm2. The reduction in point group symmetryfrom 421m to mm2 allows the formation of twin domains.They can be distinguished in polarized light. After coolingthrough the Curie point, the RMO single crystals alwaysare in a polydomain state. When cooled through the Curietemperature, the equivalent [110] and [110] axes of thetetragonal phase become the [100] and [010] axes of theorthorhombic phase. These orthorhombic axes are unequal.The b parameter along the [010] axis is larger than the aparameter along the [100] axis: (b−a)/a ≈ 3 × 10⁻³. So, thecrystal changes its shape during the transition. The axes [100]and [010] of the tetragonal phase become the axes [110] and[110] of the orthorhombic phase and the right angle betweenthem changes by the value of ≈10′. This is the shear angle ofthe transition. It is determined by the relation (b− a)/a. Therelative change of the [001] axis parameter Δc/c during thetransition is smaller than 10−4, but the structure of the [001]axis is changed drastically. It is not polar in the tetragonalphase and it becomes polar in the orthorhombic phase. Thisis the origin of the ferroelectric order.
The applied electric field along the [001] axis canreverse the [001] axis. This is accompanied by the mutualinterchange of the orthorhombic [100] and [010] axes.
Due to the difference between b and a parameters, themechanical compression along the [010] axis switches theorientational state. This is the origin of the ferroelasticity. Amaterial is said to be ferroelastic if it has two or more stableorientational states in the absence of the external mechanicalstress and if it can be reproducibly transformed from oneto another of these states by the application of mechanicalstress. Ferroelasticity was established in RMO by Aizu [12].
Ferroelasticity can be used to transform a multidomainsample into a single domain state. In a polydomain statedue to a very small value of the shear angle, the directionof the [010] axes in domains with positive [001] axes almostcoincides with the [100] axes in domains with negative [001]axes. So, a compression along [010] axes of positive domainsmakes them unstable. Simultaneously, this compressionmakes the negative domains more stable. Then, the domainswith the [100] axes along the compression should grow andthe domains with the [010] axes along the compressionshould disappear. This is the way to obtain a single domainsample.
The temperature dependence of the spontaneous electricpolarization PS in GMO was measured in [13] over thetemperature range from 4.2 K up to the Curie point TC =432.3 K. The electric polarization takes values of PS ≈ 290×10−9 Coul/cm2 at T = 4.2 K and PS ≈ 40 × 10−9 Coul/cm2
at T = TC = 432.3 K. The abrupt jump in the PS(T) curvewas observed at T = TC = 432.3 K with a hysteresis loop ofΔT ≈ 0.1 K width. This is a direct indication on the phasetransition of the first order. Room temperature values of PSin SMO, EMO, GMO, and TMO are in the range of PS ≈140×10−9 Coul/cm2 for EMO and PS ≈ 240×10−9 Coul/cm2
for SMO [14].The temperature dependences of electric and elastic
properties of GMO were measured in [15]. The dielectricpermittivity of the clamped crystal εκ33 does not dependon the temperature and shows no anomaly at the Curiepoint, while the elastic constant cE66 shows strong temperaturedependence with a marked anomaly at the Curie point. Thedielectric permittivity at constant and zero stress shows aweak anomaly at the Curie point due to the piezoelectriccoupling. This result indicates that the ferroelectric orderingin GMO is a secondary effect. It appears as a consequence ofthe structural β-β′ phase transition.
The pyroelectric properties of GMO were studied in [16,17]. Near TC, hard-to-control spurious domain nucleationwas observed. It was explained by small thermal gradientscaused by the thermal signal being detected.
Both β and β′ phases of RMO are piezoelectric [17].The electromechanical coupling coefficient is 4% at roomtemperature and 22% near TC.
The presence of the domain walls significantly influencesthe resonant behavior of a crystal.
3. Magnetic Properties
Magnetic properties of a single-crystal and single-domainspherical sample of GMO were investigated in [18–22]. In[18–20], the magnetization along the [001], [010] and [100]

4 Physics Research International
axes, respectively, was measured at temperatures from 0.3 Kto 4.2 K in magnetic field up to 90 kOe. The saturationmagnetization values at low temperatures and in highmagnetic field along all crystal directions correspond to themagnetic moment μS = 7μB which is typical for Gd3+
ion in the ground state 8S7/2. At temperatures above ≈1 K,the field dependences of the magnetization show a typicallyparamagnetic behavior. At T = 0.5 K, the field dependenceof the magnetization exhibits a weak anomaly at H = (2-3) kOe that indicates on the field induced transformationin the antiferromagnetic structure from the antiparallel toparallel orientation of ionic magnetic moments [18]. At T =0.35 K, this anomaly becomes more pronounced. On thebasis of these data, the authors conclude that GMO becomesantiferromagnetic at temperatures lower than ≈0.3 K.
Figure 1 shows the field dependences of the magnetiza-tion of GMO at T = 1 K in the magnetic field along the [001]axis (open circles), the [100] axis (triangles), and the [010]axis (crosses). These dependences were calculated from thetables published in [18–20]. The solid line is the Brillouinfunction B7/2(μSH/kT) that corresponds to a free Gd3+ ion inthe ground state 8S7/2 as it should be in a usual paramagneticsubstance. The Brillouin function describes qualitatively theexperimental magnetization curve along the [001] axis. Onecan see that the magnetization of the paramagnetic GMO atT = 1 K is saturated at the magnetic field H ≈ 60 kOe. Thesaturation magnetization is MS = 39 kG · cm3/mole Gd3+ =6.98μB/Gd3+ion. This value agrees well with the magneticmoment μS = 7μB of Gd3+ ion in the ground state 8S7/2.The dependences of the magnetization in the magnetic fieldalong the [100] and [010] axes are placed noticeably lowerthan for [001]. It is due to the natural magnetic crystallineanisotropy. The magnetization curves along the [100] and[010] axes are indistinguishable. It means that the [001] axisis the easy magnetization direction in GMO.
Figure 2 shows the experimental field dependence of theanisotropy energy for the magnetic field along the [100] axis.It was calculated from the data of Figure 1 using the relation:
Ea(H) =∫ H
0
[M[001](H)−M[100](H)
]dH. (1)
In the state of the saturation (H = HS ≈ 60 kOe), theanisotropy energy is Ea(HS) = ES ≈ 105 erg/g ≈ 4.5 ×10⁻⁵ eV/Gd3+ ion. This value is higher than the anisotropyconstant of ferromagnetic iron at room temperature (K1 ≈0.6 × 10⁵ erg/g). This is the energy needed to align allmagnetic moments of Gd3+ ions in the paramagnetic GMOalong the hard direction [100] at T = 1 K.
Figure 3 shows the dependence of the anisotropy energyin GMO Ea(mr) upon the reduced magnetization mr =M[100]/MS along [100]. Ea(mr) is derived from
Ea(M[100]
) = ∫M[100]
0
[H[100](M)−H[001](M)
]dM; (2)
by introducing a new variable mr =M[100]/MS.It is seen that this dependence is described well by the
relation:
Ea(mr) = ESm4r . (3)
0
2
4
6
8
0
1
10020 40 60 80
2, 3
H (kOe)
GMO, T = 1 K
Solid line—M = 7μBB7/2(μSH/kT)
(2) H along [100] (triangles)
(3) H along [010] (crosses)
(1) H along [001] (open circles)
M(μB
/Gd3+
)
Figure 1: The field dependences of the magnetization of GMO atT = 1 K in the magnetic field directed along the [001] axis (opencircles), the [100] axis (triangles) and the [010] axis (crosses).
020 40 60 80 1000
0.25
0.5
0.75
1
GMO, T = 1 K
H (kOe)
Ea
(105
erg/
g)
Figure 2: The field depends on the natural magnetic crystallineanisotropy energy upon the magnetic field along the [100] axis.
Here, ES is the anisotropy energy of a paramagnetic substancein a saturated state.
In [21], the magnetization curves of GMO were mea-sured in the magnetic field along the [001] axis in thetemperature range (0.1–0.5) K using the method of adia-batic demagnetizing. The sharp jump was observed on theisentropic magnetization curve in the magnetic field H =1.615 kOe. The temperature of the jump was 0.11 K. Themagnetic field H = 1.615 kOe is the critical field of thedestruction of the antiferromagnetic order in GMO at T =0.11 K. The magnetization was 350 G · cm3/mole Gd3+ at thebeginning of the jump and ≈30 kG·cm3/mole Gd3+ at theend of the jump. The magnetization curve between these twopoints was a vertical straight line. So, the phase transitionfrom the antiferromagnetic to the paramagnetic state inGMO goes without the stage of the spin-flop.
The heat capacity of GMO was measured in the magneticfield up to 90 kOe at the temperatures (0.1–4.2) K in papers[18–22]. The thermodynamic functions were calculatedusing the measured values of the magnetization and the heatcapacity.

Physics Research International 5
0
0.2
0.4
0.6
0.8
1
0 0.2 0.4 0.6 0.8 1
After Fisher, GMO,T = 1 K
Ea
(105
erg/
g)
m 4r = (M [100]/M S)4
Figure 3: The energy of the natural magnetic crystalline anisotropyof GMO versus the reduced magnetization. The magnetic field isdirected along the [100] axis.
In [23], the magnetization and heat capacity of a single-crystal and single-domain spherical sample of TMO weremeasured over the range (0.4–4.2) K with fields up to90 kOe directed along the [001] axis. The magnetization wasmeasured also along the [100] axis, but these measurementscould not be performed in the field above 25 kOe because ofthe mechanical destruction of the sample.
According to [23], the temperature dependences of theheat capacity at zero field and at H = 0.5 kOe show λ-type anomalies with pronounced maxima at T = 0.44 Kand 0.45 K, respectively. As the magnetic field is raised, theλ maxima shift toward the lower temperatures. The tem-perature dependences of the magnetization and magneticsusceptibility show the broad maxima around T = 1.6 K. Allof the above facts indicate on the antiferromagnetic orderingof the Tb3+ magnetic moments along the easy [001] axis withthe Neel temperature TN ≈ (0.44–1.6) K.
Above these temperatures, the magnetization curvesalong the [001] axis look like for a paramagnetic substanceat very low temperatures and in extremely high magneticfields; but the experimental value of the magnetic saturationMS = 7.7μB/Tb3+ differs noticeably from MS = 9μB/Tb3+ fora usual paramagnetic substance with Tb3+ion in the groundstate 7F6. On the basis of this difference, the authors in [23]conclude that the total mechanical moment of the groundstate doublet is Jz = ±5. In the following, we will show on thebasis of our magnetic measurements and the observations ofZeeman effect that it is not correct. The unusual value of themagnetic moment in TMO can be explained strictly by thequantum mechanical theory of magnetism of singlets withnondiagonal matrix elements in the angular momentumoperator of Tb3+ ion.
The magnetization curves along the [100] axis weremeasured only up to 25 kOe. The crystal was broken whenthe magnetic field was increased above 40 kOe. The authorsexplain the destruction of the sample by the magnetic torque.It is not a complete explanation of the self-destruction ofTMO single crystal. Our later measurements showed that asample of TMO at certain conditions can survive at T = 4.2 Keven in the field of 200 kOe along the [100] axis.
The absence of the magnetization data for TMO alongthe [100] axis at high magnetic fields makes it impossible toplot the anisotropy energy dependencies upon the magneticfield and the magnetization analogous to those for GMO onFigures 2 and 3. The estimate of the anisotropy energy ofTMO at H = 25 kOe and T = 1 K gives Ea ≈ 106 erg/g. FromFigure 2, the corresponding value for GMO is ≈105 erg/g,that is, ten times lower than for TMO.
It was established from the measurements of the heatcapacity in [23] that the relaxation time of the nuclear spinsystem of 159Tb3+ becomes very long at high fields and lowtemperatures. For example, in the magnetic fieldH = 90 kOeat the temperature T ≈ 1 K, the order of magnitude ofthe relaxation time is several hundred seconds. The heatcapacity values taken below those temperatures are not inequilibrium. The higher the magnetic field the higher is, thetemperature below which one cannot reach the equilibriumbetween the nuclear system and the lattice formed byelectronic shells of ions. This phenomenon complicates themagnetic measurements in TMO at low temperatures and inhigh magnetic fields.
In [5], the magnetization of single-crystal single-domainsamples of TMO was measured in pulsed magnetic fields upto 300 kOe with pulse duration of 0.01 s. The magnetizationcurves were measured at T = 4.2 K and 78 K along [001]axis and in the (001) plane. The magnetization process wasadiabatic. The magnetization was highly anisotropic. Themagnetization curves along the [001] axis were close to theparamagnetic saturation at both temperatures. At T = 78 K,H = 300 kOe, the magnetization reached 7.2μB/Tb3+ andat T = 4.2 K, H = 240 kOe, it was 7.8μB/Tb3+. Along the[010] axis, the magnetization was 3.4μB/Tb3+ at T = 78 K,H = 300 kOe, and 4.2μB/Tb3+ at T = 4.2 K, H = 240 kOe.The energy of the natural magnetic crystalline anisotropyof paramagnetic TMO was estimated qualitatively using themagnetization curves along the [001] axis and in the (001)plane. It proved to be of the order of Ea ≈ 2 · 107 erg/gat both temperatures. The magnetic anisotropy of the kindis unusual for a paramagnetic substance. It is the order ofmagnitude larger than the magnetic anisotropy constant offerromagnetic cobalt K1 ≈ 106 erg/g at 78 K.
Figure 4 shows the magnetization curves of TMO in theplane (001) at T = 4.2 K. At the beginning of the pulse ofthe magnetic field, the [100] axis of the sample was orientedalong the field. At H = 190 kOe, there was an anomalyon the magnetization curve. In the decreasing field, themagnetization curve was placed above that in the increasingfield. Inspection of the sample in the polarized light afterthese measurements showed that the [100] and [010] axeswere interchanged as compared to the state of the samplebefore switching on the pulse of the field. So, one couldget the difference between the magnetization values for thefield along the [100] and [010] axes. At H = 180 kOe, itwas ≈0.6μB/Tb 3+. This interchange was observed also in[24, 25] from the measurements of the magnetostriction andthe magnetoelectric effect. The interchange took place whenthe applied magnetic field was directed along the [100] axisand reached some critical value. In [26], the magnetization of
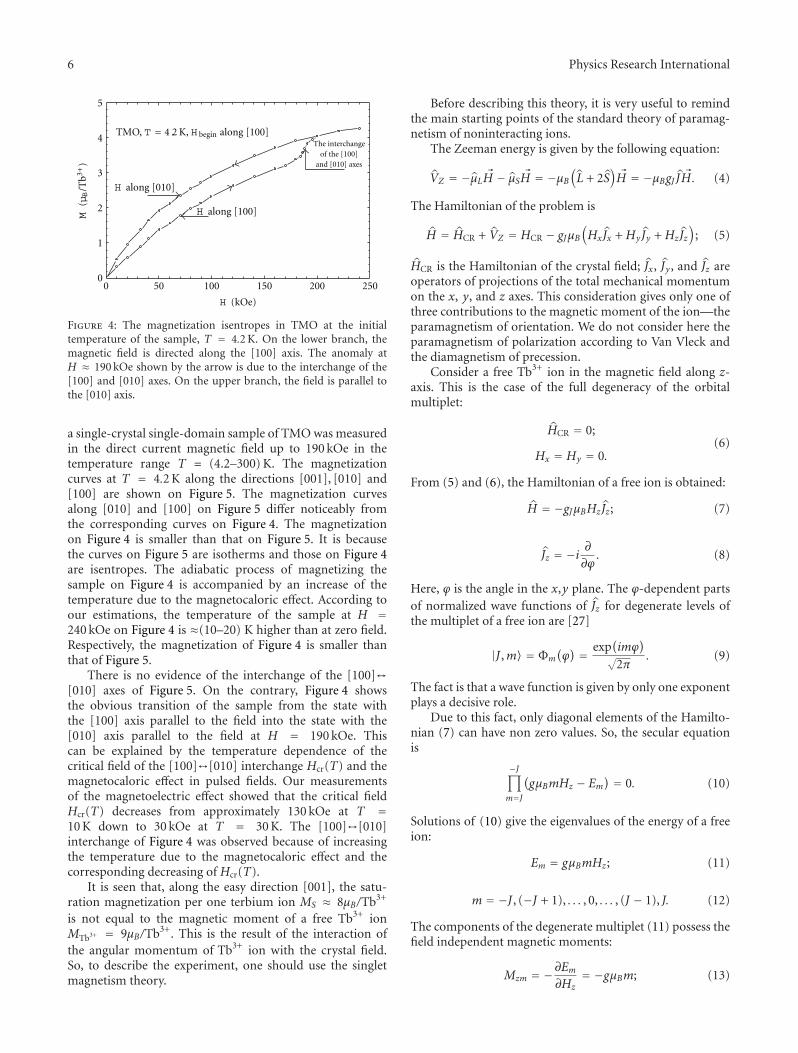
6 Physics Research International
0
1
2
3
4
5
0 50 100 150 200 250
The interchangeof the [100]
and [010] axes
H along [010]
H along [100]
TMO, T = 4.2 K, H begin along [100]
H (kOe)
M(μB
/Tb3+
)
Figure 4: The magnetization isentropes in TMO at the initialtemperature of the sample, T = 4.2 K. On the lower branch, themagnetic field is directed along the [100] axis. The anomaly atH ≈ 190 kOe shown by the arrow is due to the interchange of the[100] and [010] axes. On the upper branch, the field is parallel tothe [010] axis.
a single-crystal single-domain sample of TMO was measuredin the direct current magnetic field up to 190 kOe in thetemperature range T = (4.2–300) K. The magnetizationcurves at T = 4.2 K along the directions [001], [010] and[100] are shown on Figure 5. The magnetization curvesalong [010] and [100] on Figure 5 differ noticeably fromthe corresponding curves on Figure 4. The magnetizationon Figure 4 is smaller than that on Figure 5. It is becausethe curves on Figure 5 are isotherms and those on Figure 4are isentropes. The adiabatic process of magnetizing thesample on Figure 4 is accompanied by an increase of thetemperature due to the magnetocaloric effect. According toour estimations, the temperature of the sample at H =240 kOe on Figure 4 is ≈(10–20) K higher than at zero field.Respectively, the magnetization of Figure 4 is smaller thanthat of Figure 5.
There is no evidence of the interchange of the [100]↔[010] axes of Figure 5. On the contrary, Figure 4 showsthe obvious transition of the sample from the state withthe [100] axis parallel to the field into the state with the[010] axis parallel to the field at H = 190 kOe. Thiscan be explained by the temperature dependence of thecritical field of the [100]↔[010] interchange Hcr(T) and themagnetocaloric effect in pulsed fields. Our measurementsof the magnetoelectric effect showed that the critical fieldHcr(T) decreases from approximately 130 kOe at T =10 K down to 30 kOe at T = 30 K. The [100]↔[010]interchange of Figure 4 was observed because of increasingthe temperature due to the magnetocaloric effect and thecorresponding decreasing of Hcr(T).
It is seen that, along the easy direction [001], the satu-ration magnetization per one terbium ion MS ≈ 8μB/Tb3+
is not equal to the magnetic moment of a free Tb3+ ionMTb3+ = 9μB/Tb3+. This is the result of the interaction ofthe angular momentum of Tb3+ ion with the crystal field.So, to describe the experiment, one should use the singletmagnetism theory.
Before describing this theory, it is very useful to remindthe main starting points of the standard theory of paramag-netism of noninteracting ions.
The Zeeman energy is given by the following equation:
VZ = −μL �H − μS �H = −μB(L + 2S
)�H = −μBgJ J �H. (4)
The Hamiltonian of the problem is
H = HCR + VZ = HCR − gJμB(HxJx +HyJy +HzJz
); (5)
HCR is the Hamiltonian of the crystal field; Jx, Jy , and Jz areoperators of projections of the total mechanical momentumon the x, y, and z axes. This consideration gives only one ofthree contributions to the magnetic moment of the ion—theparamagnetism of orientation. We do not consider here theparamagnetism of polarization according to Van Vleck andthe diamagnetism of precession.
Consider a free Tb3+ ion in the magnetic field along z-axis. This is the case of the full degeneracy of the orbitalmultiplet:
HCR = 0;
Hx = Hy = 0.(6)
From (5) and (6), the Hamiltonian of a free ion is obtained:
H = −gJμBHzJz; (7)
Jz = −i ∂∂ϕ. (8)
Here, ϕ is the angle in the x,y plane. The ϕ-dependent partsof normalized wave functions of Jz for degenerate levels ofthe multiplet of a free ion are [27]
|J ,m〉 = Φm
(ϕ) = exp
(imϕ
)√
2π. (9)
The fact is that a wave function is given by only one exponentplays a decisive role.
Due to this fact, only diagonal elements of the Hamilto-nian (7) can have non zero values. So, the secular equationis
−J∏m=J
(gμBmHz − Em
) = 0. (10)
Solutions of (10) give the eigenvalues of the energy of a freeion:
Em = gμBmHz; (11)
m = −J , (−J + 1), . . . , 0, . . . , (J − 1), J. (12)
The components of the degenerate multiplet (11) possess thefield independent magnetic moments:
Mzm = −∂Em∂Hz
= −gμBm; (13)

Physics Research International 7
0
2
4
6
8
0 50 100 150 200
[010]
[100]
[001]
H (kOe)
TMO, T = 4.2 K
M(μB
/Tb3+
)
Figure 5: The magnetization curves of TMO at T = 4.2 K alongmain crystallographic directions. Solid lines are calculated using thetheory of magnetism of singlets.
Using (11) and (12) and the statistics of Maxwell-Boltzman,one obtains the Brillouin function to describe the field andtemperature dependence of the magnetization in a system offree ions:
Mz(H ,T) = gJμBBJ
(gJμBHz
kT
)
= gJμB
[2J + 1
2Jcth
(2J + 1
2J× gJμBHz
kT
)
− 12J
cth(
12J× gJμBHz
kT
)].
(14)
The total mechanical momentum of Tb3+ ion in 7F6 groundstate is
J = L + S = 3 + 3 = 6; (15)
L and S are the angular and spin moments, respectively. Theg-factor is [28]
g = 1 +J(J + 1) + S(S + 1)− L(L + 1)
2J(J + 1)= 3
2. (16)
The corresponding saturation magnetic moment is μS =gJμB = 9μB.
The singlet magnetism theory describes the magneticproperties of ions in the crystal field. It is based on theJahn-Teller theorem [29]. According to this theorem, thesurrounding of the ion cannot be stable if the ground stateof the ion in the crystal field is degenerate (excluding thecase of Kramers degeneracy for ions with an odd numberof outer electrons [30]). The spontaneous rearrangementof the crystal lattice goes on because the development ofthe instability reduces the symmetry of the crystal fieldand removes the degeneracy of the ground state. It meansthat rare earth ions with the even number of 4f electronsunavoidably have the singlet ground state [31]. If two lowestsinglets are separated by a narrow gap of the order of2Δ0 ≈ (1–5) cm−1 and are much more away from othersinglets, then the former two singlets can be considered as
a quasidoublet. The magnetic moment of the ion with thequasidoublet as a ground state should be calculated by thesinglet magnetism theory [31].
The main distinction of this theory from the standardtheory of the paramagnetism of free ions (6)–(16) is that thewave functions of the orbital singlets cannot be describedby only one exponent like (9). The crystal field splits thedegenerate multiplet of a free ion that is given by (11)–(12) and mixes the wave functions (9) of these levels. Thewave functions of the singlets are linear combinations of thefunctions given by (9) with the values ofm given by (12). Theforms of the combinations are determined by the symmetryof the crystal field and of the operators: Jx, Jy , and Jz.
The point symmetry group of the surrounding of Tb3+
ion in TMO is C2 [2]. For this symmetry, the Hamiltonianmatrix for the magnetic field along z axis is∣∣∣∣∣∣ −Δ0 gJeffμBHz
gJeffμBHz +Δ0
∣∣∣∣∣∣. (17)
Here, 2Δ0 is the splitting of energy levels of the quasi-doubletunder consideration.
Jeff is a nondiagonal matrix element of the total mechan-ical momentum operator. It is given by the relation:
Jeff =⟨ψz
∣∣Jx∣∣ψS⟩ = 6aS6az6 + 4aS4a
z4 + 2aS2a
z2; (18)
ψS andψz are the wave functions of the lower and upper levelsof the quasidoublet, respectively. The difference between MS
and MTb3+ is not too large. This result indicates that themain harmonics that form the quasidoublet are (|6, 6〉 −|6,−6〉)/√2 and (|6, 6〉 + |6,−6〉)/√2. From here, it follows
ψS = 1√2
[aS
6(|6, 6〉 + |6,−6〉)
+aS4(|6, 4〉 + |6,−4〉) + aS
2(|6, 2〉 + |6,−2〉) + aS0
];
ψz = 1√2
[az
6(|6, 6〉 − |6,−6〉)
+az4(|6, 4〉 − |6,−4〉) + az
2(|6, 2〉 − |6,−2〉)].(19)
One can see from (17) that for an ion with the ground statein the form of a quasidoublet the diagonal matrix elementsdo not depend upon the magnetic field and the nondiagonalelements are not zero and depend upon the magnetic field.This is a main distinction of the magnetic properties of thespectrum of singlets compared to the degenerate spectrum(11). The secular equation of the Hamiltonian (17) is∣∣∣∣∣∣−Δ0 − E gJeffμBHz
gJeffμBHz +Δ0 − E
∣∣∣∣∣∣ = 0. (20)
From (20), one obtains the eigenvalues of the energy of thequasi-doublet E1,2 in the magnetic field Hz:
E1,2 = ∓√Δ2
0 +(gJeffμBHz
)2. (21)
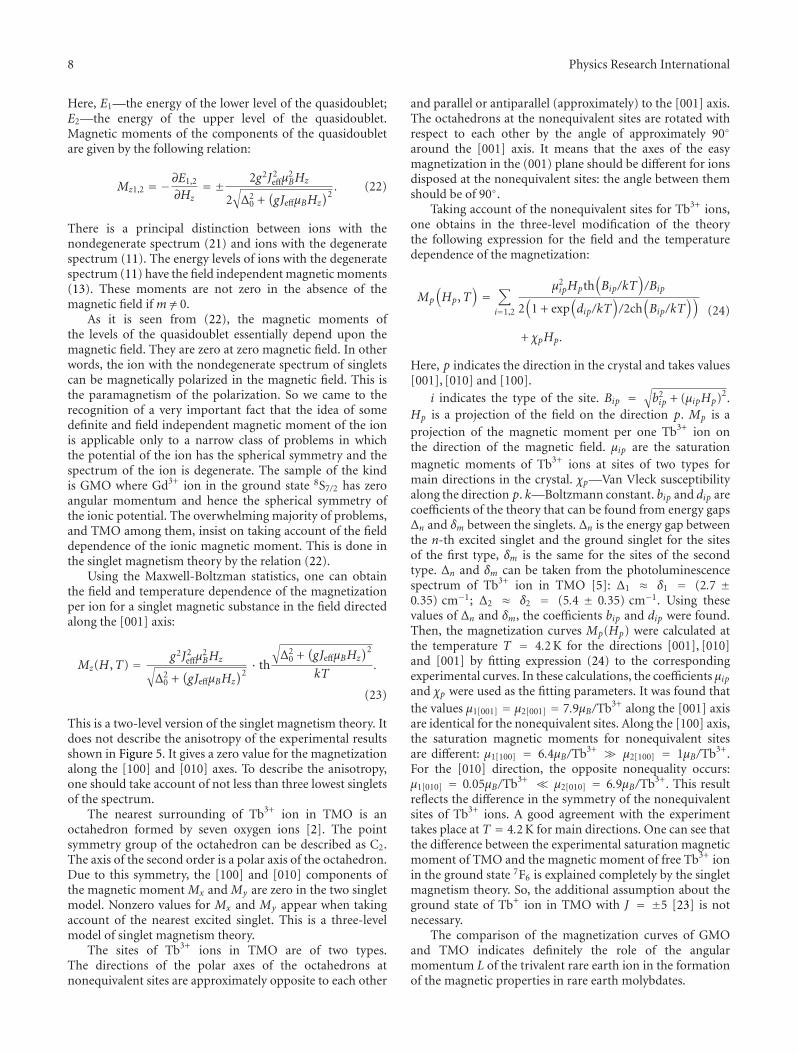
8 Physics Research International
Here, E1—the energy of the lower level of the quasidoublet;E2—the energy of the upper level of the quasidoublet.Magnetic moments of the components of the quasidoubletare given by the following relation:
Mz1,2 = −∂E1,2
∂Hz= ± 2g2J2
effμ2BHz
2√Δ2
0 +(gJeffμBHz
)2. (22)
There is a principal distinction between ions with thenondegenerate spectrum (21) and ions with the degeneratespectrum (11). The energy levels of ions with the degeneratespectrum (11) have the field independent magnetic moments(13). These moments are not zero in the absence of themagnetic field if m /= 0.
As it is seen from (22), the magnetic moments ofthe levels of the quasidoublet essentially depend upon themagnetic field. They are zero at zero magnetic field. In otherwords, the ion with the nondegenerate spectrum of singletscan be magnetically polarized in the magnetic field. This isthe paramagnetism of the polarization. So we came to therecognition of a very important fact that the idea of somedefinite and field independent magnetic moment of the ionis applicable only to a narrow class of problems in whichthe potential of the ion has the spherical symmetry and thespectrum of the ion is degenerate. The sample of the kindis GMO where Gd3+ ion in the ground state 8S7/2 has zeroangular momentum and hence the spherical symmetry ofthe ionic potential. The overwhelming majority of problems,and TMO among them, insist on taking account of the fielddependence of the ionic magnetic moment. This is done inthe singlet magnetism theory by the relation (22).
Using the Maxwell-Boltzman statistics, one can obtainthe field and temperature dependence of the magnetizationper ion for a singlet magnetic substance in the field directedalong the [001] axis:
Mz(H ,T) = g2J2effμ
2BHz√
Δ20 +
(gJeffμBHz
)2· th
√Δ2
0 +(gJeffμBHz
)2
kT.
(23)
This is a two-level version of the singlet magnetism theory. Itdoes not describe the anisotropy of the experimental resultsshown in Figure 5. It gives a zero value for the magnetizationalong the [100] and [010] axes. To describe the anisotropy,one should take account of not less than three lowest singletsof the spectrum.
The nearest surrounding of Tb3+ ion in TMO is anoctahedron formed by seven oxygen ions [2]. The pointsymmetry group of the octahedron can be described as C2.The axis of the second order is a polar axis of the octahedron.Due to this symmetry, the [100] and [010] components ofthe magnetic moment Mx and My are zero in the two singletmodel. Nonzero values for Mx and My appear when takingaccount of the nearest excited singlet. This is a three-levelmodel of singlet magnetism theory.
The sites of Tb3+ ions in TMO are of two types.The directions of the polar axes of the octahedrons atnonequivalent sites are approximately opposite to each other
and parallel or antiparallel (approximately) to the [001] axis.The octahedrons at the nonequivalent sites are rotated withrespect to each other by the angle of approximately 90◦
around the [001] axis. It means that the axes of the easymagnetization in the (001) plane should be different for ionsdisposed at the nonequivalent sites: the angle between themshould be of 90◦.
Taking account of the nonequivalent sites for Tb3+ ions,one obtains in the three-level modification of the theorythe following expression for the field and the temperaturedependence of the magnetization:
Mp
(Hp,T
)=
∑i=1,2
μ2ipHpth
(Bip/kT
)/Bip
2(
1 + exp(dip/kT
)/2ch
(Bip/kT
))+ χpHp.
(24)
Here, p indicates the direction in the crystal and takes values[001], [010] and [100].
i indicates the type of the site. Bip =√b2ip + (μipHp)2.
Hp is a projection of the field on the direction p. Mp is aprojection of the magnetic moment per one Tb3+ ion onthe direction of the magnetic field. μip are the saturationmagnetic moments of Tb3+ ions at sites of two types formain directions in the crystal. χp—Van Vleck susceptibilityalong the direction p. k—Boltzmann constant. bip and dip arecoefficients of the theory that can be found from energy gapsΔn and δm between the singlets. Δn is the energy gap betweenthe n-th excited singlet and the ground singlet for the sitesof the first type, δm is the same for the sites of the secondtype. Δn and δm can be taken from the photoluminescencespectrum of Tb3+ ion in TMO [5]: Δ1 ≈ δ1 = (2.7 ±0.35) cm−1; Δ2 ≈ δ2 = (5.4 ± 0.35) cm−1. Using thesevalues of Δn and δm, the coefficients bip and dip were found.Then, the magnetization curves Mp(Hp) were calculated atthe temperature T = 4.2 K for the directions [001], [010]and [001] by fitting expression (24) to the correspondingexperimental curves. In these calculations, the coefficients μipand χp were used as the fitting parameters. It was found thatthe values μ1[001] = μ2[001] = 7.9μB/Tb3+ along the [001] axisare identical for the nonequivalent sites. Along the [100] axis,the saturation magnetic moments for nonequivalent sitesare different: μ1[100] = 6.4μB/Tb3+ � μ2[100] = 1μB/Tb3+.For the [010] direction, the opposite nonequality occurs:μ1[010] = 0.05μB/Tb3+ � μ2[010] = 6.9μB/Tb3+. This resultreflects the difference in the symmetry of the nonequivalentsites of Tb3+ ions. A good agreement with the experimenttakes place at T = 4.2 K for main directions. One can see thatthe difference between the experimental saturation magneticmoment of TMO and the magnetic moment of free Tb3+ ionin the ground state 7F6 is explained completely by the singletmagnetism theory. So, the additional assumption about theground state of Tb+ ion in TMO with J = ±5 [23] is notnecessary.
The comparison of the magnetization curves of GMOand TMO indicates definitely the role of the angularmomentum L of the trivalent rare earth ion in the formationof the magnetic properties in rare earth molybdates.

Physics Research International 9
The L value determines the main contribution to theenergy Ea of the natural magnetic crystalline anisotropy. InGMO, Gd3+ ion in the ground state 8S7/2 has L = 0, andthe energy of anisotropy in the magnetically saturated stateis Ea ≈ 105 erg/g. The magnetization reaches the saturationalong hard directions [100] and [010] at H ≈ 60 kOe(see Figures 1 and 2). In TMO, Tb3+ ion in the groundstate 7F6 has L = 3, and the magnetization along harddirections [100] and [010] is far from saturation even in themagnetic field H = 190 kOe (see Figure 5). The energiesof anisotropy at H = 190 kOe found using relation (1) areEa[100] ≈ 1.13 · 107 ergg and Ea[010] ≈ 0.96 · 107 ergg thatis two orders of magnitude larger than in GMO. There isa strong correlation between the angular momentum valueand the anisotropy energy. The ion with the nonzero angularmomentum has a nonspherical charge cloud of the outer 4f-electrons. Magnetizing the crystal containing nonsphericalions like Tb3+ rotates these ions and hence changes thecoupling between the ions and the crystal field much morethan in the crystal with spherically isotropic ions like Gd3+.So, TMO is magnetically more anisotropic than GMO. Theanisotropy energy values for TMO found in [26] agree by theorder of magnitude with the value Ea ≈ 2 · 107 erg/g foundfrom the measurements in pulsed fields in [5]. The differenceis mainly due to the adiabatic character of magnetizing in [5]in contradiction to the isothermal one in [26].
The samples investigated in [5, 26] were not destroyedin contradiction to the result of [23] despite that magneticfields in [5, 27] were three times higher than in [23]. It meansthat the magnetic torque acting on the sample in [5, 26] wasalso larger than in [23]. So, the reason of the destroying thesample in [23] was not the magnetic torque in despite ofconclusion made in [23].
The rotation of the nonspherical rare earth ions whilemagnetizing RMO crystals distorts the crystal lattice ofRMO. The distortions of a ferroelectric crystal latticeunavoidably change its electric polarization due to thepiezoelectric effect. This is the origin of the magnetoelectriceffect to be discussed in the following section.
4. Magnetoelectric Effect
The presence of rare earth ions with nonzero angularmomentum and nonzero total momentum in the crystallattice of a ferroelectric substance leads to the large mag-netoelectric effect (MEE). Rare earth ions with nonzeroangular momentum possess the spatially anisotropic chargecloud of outer 4f-electrons. The spatial anisotropy ofthe magnetic ions determines large values of the naturalmagnetic crystalline anisotropy and the magnetostriction.These properties in the ferroelectric crystal ensure the strongdependence of the electric polarization upon the magneticfield, that is, MEE.
MEE was predicted in [32], but the consideration of theproblem was restricted by the linear magnetoelectric effect.It was established that this effect is possible only in theantiferromagnetic crystals. In [33], the prediction of linearMEE was given for a specific substance Cr2O3. The first
experimental observations of linear MEE in Cr2O3 were donein [34, 35].
The most important point of MEE in rare earth molyb-dates is the absence of the restrictions related to the magneticstructure. The general consideration of the problem showsthat nonlinear MEE in rare earth molybdates can exist in theparamagnetic state.
The first observation of nonlinear MEE in the paramag-netic tetragonal NiSO4 · 6H2O was published in [36].
In [37], nonlinear MEE was observed in paramagneticTMO at T = 77 K. That was the first observation of MEE inthe rare earth molybdate family. In [38], MEE was measuredin TMO and GMO in pulsed magnetic fields up to 110 kOeat T = (77–290) K.
Figure 6 shows the field dependence of the magneticallyinduced electric polarization (MEP) in TMO at T = 77 K[38]. The field was applied along the orthorhombic axis[110]. MEP was measured along the [110] axis. As thespontaneous polarization PS is directed along the [001] axis,this result can be considered as the rotation of the PS in themagnetic field.
The dependence of MEP upon the magnetic field isquadratic with a good accuracy. MEP is P = 4.12 ·10−9 Coul/cm2 at H = 10 T. It is small compared to thespontaneous electric polarization PS = 180 · 10−9 Coul/cm2
[14].MEP in GMO was equal to zero in the limit of the
experimental error.The standard symmetry consideration [39] shows that,
at a given geometry of the experiment, the componentsof the magnetically induced electrical polarization in theorthorhombic paramagnetic crystal are proportional to theproducts of the magnetization components:
Px ∼Mx ·Mz;
Py ∼My ·Mz.(25)
For a usual paramagnetic crystal,
Mz = χzzHz. (26)
Here x, y, z correspond to the [100], [010], [001] axes,respectively; χzz is a component of the diagonal tensor of themagnetic susceptibility. It follows from (25) and (26) that theeffect on Figure 6 should be zero.
The contradiction between the result of calculations [39]and the experimental observation of the nonzero effect in[37, 38] can be eliminated by taking account of the localsymmetry of Tb3+ ions surrounding. As it was noted inSection 3, the nearest surrounding of Tb3+ ion in TMOis an octahedron formed by seven oxygen ions [2]. Theoctahedron has the C2 point symmetry group. The axis ofthe second order is a polar axis of the octahedron. Thesymmetry axes of the octahedron do not coincide withthe symmetry axes of the crystal. The polar axis of theoctahedron makes an angle with the [001] axis, and themagnetic field applied in the (001) plane has a nonzeroprojection on the polar axis of the octahedron. Accordingto the theory of magnetism of singlets, the magnetic field
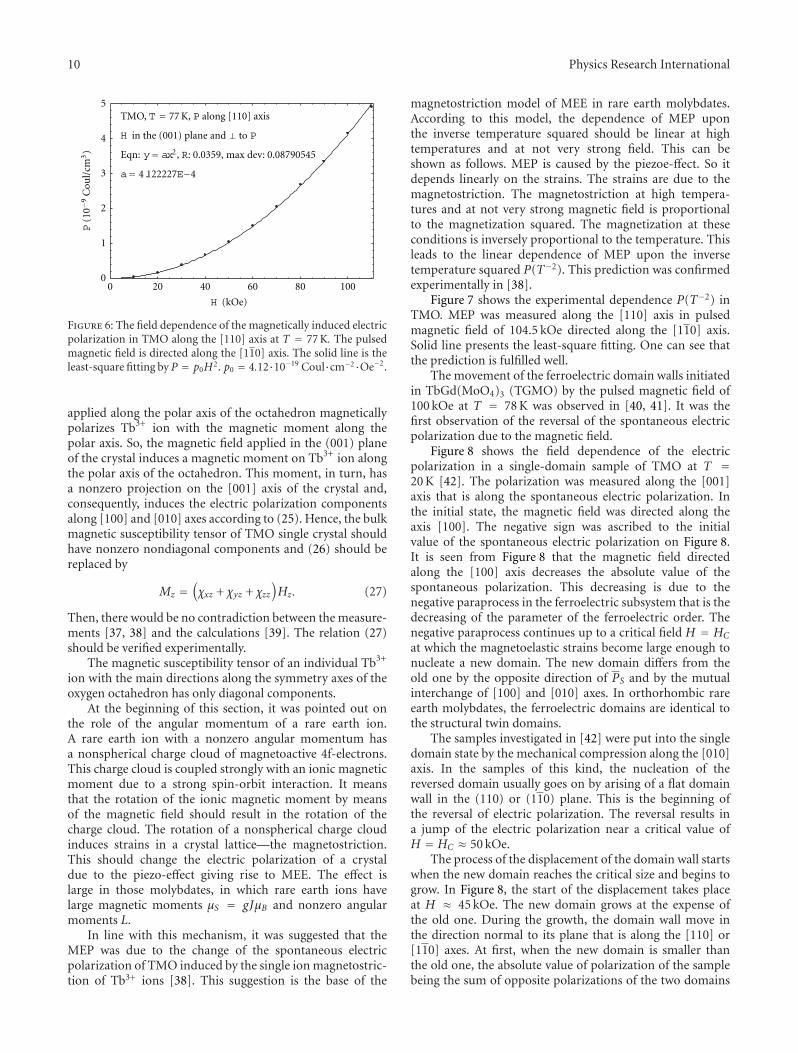
10 Physics Research International
0 20 40 60 80 1000
1
2
3
4
5
H (kOe)
TMO, T = 77 K, P along [110] axis
H in the (001) plane and ⊥ to P
Eqn: y= ax2, R: 0.0359, max dev: 0.08790545
a= 4.122227E−4
P(1
0−9
Cou
l/cm
3)
Figure 6: The field dependence of the magnetically induced electricpolarization in TMO along the [110] axis at T = 77 K. The pulsedmagnetic field is directed along the [110] axis. The solid line is theleast-square fitting by P = p0H2. p0 = 4.12·10−19 Coul·cm−2·Oe−2.
applied along the polar axis of the octahedron magneticallypolarizes Tb3+ ion with the magnetic moment along thepolar axis. So, the magnetic field applied in the (001) planeof the crystal induces a magnetic moment on Tb3+ ion alongthe polar axis of the octahedron. This moment, in turn, hasa nonzero projection on the [001] axis of the crystal and,consequently, induces the electric polarization componentsalong [100] and [010] axes according to (25). Hence, the bulkmagnetic susceptibility tensor of TMO single crystal shouldhave nonzero nondiagonal components and (26) should bereplaced by
Mz =(χxz + χyz + χzz
)Hz. (27)
Then, there would be no contradiction between the measure-ments [37, 38] and the calculations [39]. The relation (27)should be verified experimentally.
The magnetic susceptibility tensor of an individual Tb3+
ion with the main directions along the symmetry axes of theoxygen octahedron has only diagonal components.
At the beginning of this section, it was pointed out onthe role of the angular momentum of a rare earth ion.A rare earth ion with a nonzero angular momentum hasa nonspherical charge cloud of magnetoactive 4f-electrons.This charge cloud is coupled strongly with an ionic magneticmoment due to a strong spin-orbit interaction. It meansthat the rotation of the ionic magnetic moment by meansof the magnetic field should result in the rotation of thecharge cloud. The rotation of a nonspherical charge cloudinduces strains in a crystal lattice—the magnetostriction.This should change the electric polarization of a crystaldue to the piezo-effect giving rise to MEE. The effect islarge in those molybdates, in which rare earth ions havelarge magnetic moments μS = gJμB and nonzero angularmoments L.
In line with this mechanism, it was suggested that theMEP was due to the change of the spontaneous electricpolarization of TMO induced by the single ion magnetostric-tion of Tb3+ ions [38]. This suggestion is the base of the
magnetostriction model of MEE in rare earth molybdates.According to this model, the dependence of MEP uponthe inverse temperature squared should be linear at hightemperatures and at not very strong field. This can beshown as follows. MEP is caused by the piezoe-ffect. So itdepends linearly on the strains. The strains are due to themagnetostriction. The magnetostriction at high tempera-tures and at not very strong magnetic field is proportionalto the magnetization squared. The magnetization at theseconditions is inversely proportional to the temperature. Thisleads to the linear dependence of MEP upon the inversetemperature squared P(T−2). This prediction was confirmedexperimentally in [38].
Figure 7 shows the experimental dependence P(T−2) inTMO. MEP was measured along the [110] axis in pulsedmagnetic field of 104.5 kOe directed along the [110] axis.Solid line presents the least-square fitting. One can see thatthe prediction is fulfilled well.
The movement of the ferroelectric domain walls initiatedin TbGd(MoO4)3 (TGMO) by the pulsed magnetic field of100 kOe at T = 78 K was observed in [40, 41]. It was thefirst observation of the reversal of the spontaneous electricpolarization due to the magnetic field.
Figure 8 shows the field dependence of the electricpolarization in a single-domain sample of TMO at T =20 K [42]. The polarization was measured along the [001]axis that is along the spontaneous electric polarization. Inthe initial state, the magnetic field was directed along theaxis [100]. The negative sign was ascribed to the initialvalue of the spontaneous electric polarization on Figure 8.It is seen from Figure 8 that the magnetic field directedalong the [100] axis decreases the absolute value of thespontaneous polarization. This decreasing is due to thenegative paraprocess in the ferroelectric subsystem that is thedecreasing of the parameter of the ferroelectric order. Thenegative paraprocess continues up to a critical field H = HC
at which the magnetoelastic strains become large enough tonucleate a new domain. The new domain differs from theold one by the opposite direction of PS and by the mutualinterchange of [100] and [010] axes. In orthorhombic rareearth molybdates, the ferroelectric domains are identical tothe structural twin domains.
The samples investigated in [42] were put into the singledomain state by the mechanical compression along the [010]axis. In the samples of this kind, the nucleation of thereversed domain usually goes on by arising of a flat domainwall in the (110) or (110) plane. This is the beginning ofthe reversal of electric polarization. The reversal results ina jump of the electric polarization near a critical value ofH = HC ≈ 50 kOe.
The process of the displacement of the domain wall startswhen the new domain reaches the critical size and begins togrow. In Figure 8, the start of the displacement takes placeat H ≈ 45 kOe. The new domain grows at the expense ofthe old one. During the growth, the domain wall move inthe direction normal to its plane that is along the [110] or[110] axes. At first, when the new domain is smaller thanthe old one, the absolute value of polarization of the samplebeing the sum of opposite polarizations of the two domains

Physics Research International 11
0
1
2
3
4
5
0 0.5 1 1.5 2
max dev: 0.1420436, r2 = 0.9950631
T−2 (10−4 K−2)
P[1
10]
(10−
9C
oul/
cm−2
) y= +2.749071x1 − 0.06706485,
TMO, H along [110], 104.5 kOe
Figure 7: The dependence of the electrical polarization in TMOalong the [110] axis in pulsed magnetic field of 104.5 kOe directedalong [110] axis.
0 50 100 1500
100
200
300
400
H (kOe)
ΔP
(10−
9C
oul/
cm2) TMO, T = 20 K.
Initial state — H along [100]
Figure 8: The field dependence of the electric polarization in TMOmeasured along the [001] axis. T = 20 K. At H < 50 kOe, the fieldwas directed along the [100] axis. At H > 50 kOe, the field wasdirected along the [010] axis.
is decreasing. AtH ≈ 53 kOe, the opposite domains are equalin size (P = 0). Further, the absolute value of the polarizationbegan to grow. If the critical field is applied for a long time,the new domain occupies all the volume of the sample.At H ≈ 57 kOe, the reversal of the electric polarization iscompleted and the displacement process ceases.
After this, the increase of the polarization goes on by themechanism of the positive paraprocess.
The examination of the sample in polarized light afterthe measurements of Figure 8 showed that after the jump theaxes [100] and [010] were mutually interchanged. It is knownthat this interchange is accompanied by the reversal of theelectric polarization. This supports the above interpretationof Figure 8.
These experiments were the first to realize the reversalof the electric polarization in a ferroelectric crystal withoutusing the electric field. The temperature dependence HC(T)was measured in [42]. While decreasing the temperaturefrom 100 K down to 30 K, the critical field decreases from
60 kOe to 30 kOe. Further decrease of the temperature resultsin an increase of the critical field up to 130 kOe at T = 15 K.At lower temperatures down to 4.2 K, the reversal of theelectric polarization was not observed up to 200 kOe.
During the growth of the new domain in TMO, smallrotations of the tetrahedrons MoO4 take place [2]. Theserotations create defects in the crystal lattice. The moredefects are in the lattice the larger is the critical field.That is why every reversal of the spontaneous electricpolarization increases the critical field. When the numberof the reversal cycles was large enough the sample wasmechanically destroyed into small particles at the next inturn reversal.
Figure 9 shows the field dependence of MEP with asharp break down of MEP at H = 71.5 kOe. It is dueto the mechanical destruction of the sample. Before thedestruction, the spontaneous polarization of the sample wasreversed 5 times at temperatures from 98 K to 20 K. Onecan compare this number of complete reversals with theonly attempt to magnetize the sample of TMO along the[100] axis in Fishers experiment [23]. That attempt failedat H = 40 kOe because of the destruction of the sample.To the authors’ opinion, the reasons of the destruction werethe spherical shape and the pin holes of Fishers sample. Thepin holes were the origins of a large number of the domainwalls of different orientations. The domain walls intersectedeach other and very large stresses were concentrated atthose intersections. These stresses destroyed the sample.The spherical shape stopped the movement of the domainwalls because when a flat domain wall moves through thesphere, the area of the wall has to change its size and thisalso generates the stresses with the evident destruction. Thesamples used in [42] were rectangular parallelepipeds. Theyhad dimensions 7 × 7×1 mm3. The large face of the samplewas the (001) plane and the small faces were the (110) and(110) faces. At this orientation, the domain walls were alwaysparallel to the small faces and normal to the large face of thesample. This orientation ensured the easiest conditions forthe domain walls to move. So, the samples sustained severalreversals of the spontaneous electric polarization and severaltens of magnetizing up to H = 200 kOe along the [100] axiswithout the reversal.
The anisotropy of MEE in TMO was investigated exper-imentally in [43] in the magnetic field up to 60 kOe attemperatures 4.2 K; 1.8 K and at T = 0.39 K up to H =100 kOe. MEP was measured along the [001] axis. Themagnetic field was applied in the (001) plane. The angle ϕbetween the [010] axis and the magnetic field was variedfrom 0 to 90◦. The experimental angular dependences ofMEP did not obey the relations of the standard theory of theanisotropy of MEE in a paramagnetic crystal derived in [36].According to [36], the dependence of MEP in a tetragonalparamagnetic crystal upon the strength of the magnetic fieldand upon its direction can be described by the relation:
ΔP = ξH2 · sin 2ϕ. (28)
Here, ϕ is the angle between the magnetic field and thetetragonal axis; ξ is the constant of the theory.

12 Physics Research International
−25
−20
−15
−10
−5
0
0 20 40 60 80 100
H (kOe)
ΔP
(10−
9C
oul/
cm2)
TMO, T = 5 K, H along [100].From tmob.14
Figure 9: The field dependence of MEP in TMO at T = 5 K. Thefield is directed along the [100] axis. The positive direction of thespontaneous polarization coincides with that one of the ΔP axis. Asharp breakdown of MEP at H = 71.5 kOe is due to the mechanicaldestruction of the sample.
Figure 10 displays some of the experimental isotherms ofMEP measured along the [001] axis in TMO at 4.2 K (curves1–5) and at 0.39 K (curves 6–10) for various directions ofthe field in the (001) plane. The sign of ΔP(H) in Figure 10was determined by comparing it with the sign of the jump ofthe electric polarization when the spontaneous polarizationswitches in the critical magnetic field (see Figure 8). Thefield dependences of MEP are nonlinear. MEP is positive inthe magnetic field directed along the [010] axis (a positiveparaelectric process in the ferroelectric subsystem at ϕ =0, curves 1 and 6). MEP is negative in the magnetic fielddirected along the [100] axis (a negative paraprocess at ϕ =90◦, curves 5 and 10).
The field dependences ΔP(H) do not agree with (28) andwhat is more unusual is that the ΔP(H) itself depends uponthe direction of the field.
The angular dependences of MEP in TMO do not agreewith (28) neither.
Figure 11 displays some of the experimental angulardependences of MEP in TMO at temperatures T = 4.2 K(curves 1−3) and T = 0.39 K (curve 4). Curves 1, 2, 3 weremeasured at H = 20 kOe, 40 kOe, and 60 kOe, respectively.Curve 4 was measured at H = 100 kOe. The line 4 is drawnfor the eyes guide. The lines 1–3 are calculated followingthe theory of mean quadrupole moments [43, 44]. Thepoints refer to the experimental values of ΔP(H ,ϕ). Theirarrangement is not symmetric relative to ϕ = 45◦ contraryto (28). The absolute values of ΔP(ϕ = 0) and ΔP(ϕ = 90◦)are different. The values of ΔP(ϕ = 45◦) /= 0. So, (28) ofthe theory [36] does not describe MEE in TMO. Obviously,a new approach is needed to describe MEE in TMO. Thisapproach was developed in [44] and applied to the problemin [43] using the experimental field dependences of themagnetization [26].
The magnetic-field-induced electric polarization in crys-tals (MEP) is, like the magnetostriction and magnetic linearbirefringence, an even-parity magnetic effect. The classical
3
4
0 20 40 60 80 100−60
−40
−20
0
20
40TMO
H (kOe)
1
2
5
6
7
8
9
10
ΔP
(10−
9C
oul/
cm2)
Figure 10: MEP in TMO induced along the [001] axis by themagnetic field applied in the (001) plane for various values of theangle ϕ between the field and the [010] axis at T = 4.2 K (curves1–5) and T = 0.39 K (curves 6–10); (1) ϕ = 0◦; (2) 35.5◦; (3) 57.7◦;(4) 66.6◦; (5) 90◦; (6) 0◦; (7) 35.5; (8) 57.7◦; (9) 68.8◦; (10) 90◦.
theory of even effects was developed in [45, 46]. Thistheory describes well the properties of weakly anisotropiccompounds, in particular, of those containing d-ions. Thesituation with f-ions is more complicated. According to[44], even magnetic effects in rare earth compounds aregoverned by magnetic susceptibilities of the mean multipolemoments of the rare earth ions 4f-shell. Their calculationrequires knowledge of the energy levels and wave functionsof these ions. It was established in [26] that the groundstate of Tb3+ ions in TMO is apparently a combinationof three close-lying singlets, which belongs to differentirreducible representations of the symmetry group of the ionenvironment and are separated by 2.7 cm−1 in energy.
In this case, at the magnetic field in the (001) plane, thefollowing relation takes place [43]:
ΔPz(T ,H ,ϕ
) = AHxMx(T) + BHyMy(T) + CHxMy(T)
+DHyMx(T) + EH2x + FHxHy +GH2
y .
(29)
Here,T is the temperature. It should not be very high, but thecondition T � TN should be fulfilled. TN is the temperatureof the antiferromagnetic ordering. In TMO, TN = 0.45 K[23].
A,B,C,D,E,F, and G are constants of the theory whichdo not depend on the temperature; Hx = H[010] is themagnetic field component along the [010] axis:
Mx =M[010] − χVV[010]H[010]; (30)
M[010] is the magnetization component along the [010] axis.
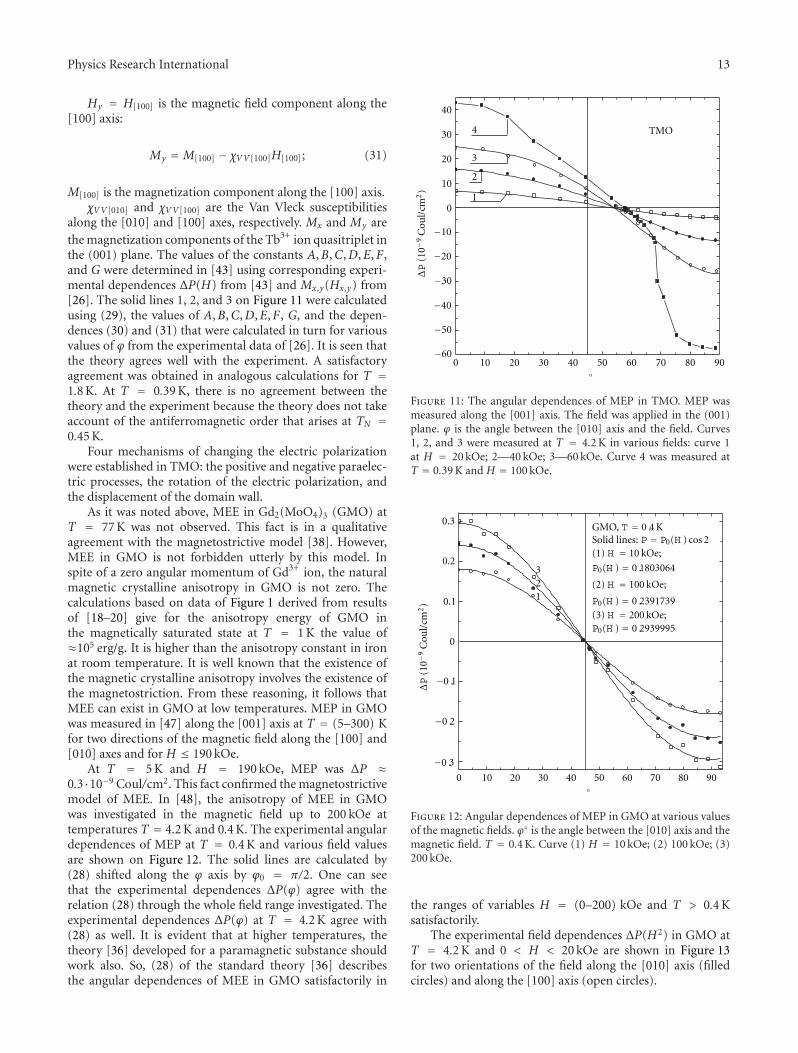
Physics Research International 13
Hy = H[100] is the magnetic field component along the[100] axis:
My =M[100] − χVV[100]H[100]; (31)
M[100] is the magnetization component along the [100] axis.χVV[010] and χVV[100] are the Van Vleck susceptibilities
along the [010] and [100] axes, respectively. Mx and My arethe magnetization components of the Tb3+ ion quasitriplet inthe (001) plane. The values of the constants A,B,C,D,E,F,and G were determined in [43] using corresponding experi-mental dependences ΔP(H) from [43] and Mx,y(Hx,y) from[26]. The solid lines 1, 2, and 3 on Figure 11 were calculatedusing (29), the values of A,B,C,D,E,F, G, and the depen-dences (30) and (31) that were calculated in turn for variousvalues of ϕ from the experimental data of [26]. It is seen thatthe theory agrees well with the experiment. A satisfactoryagreement was obtained in analogous calculations for T =1.8 K. At T = 0.39 K, there is no agreement between thetheory and the experiment because the theory does not takeaccount of the antiferromagnetic order that arises at TN =0.45 K.
Four mechanisms of changing the electric polarizationwere established in TMO: the positive and negative paraelec-tric processes, the rotation of the electric polarization, andthe displacement of the domain wall.
As it was noted above, MEE in Gd2(MoO4)3 (GMO) atT = 77 K was not observed. This fact is in a qualitativeagreement with the magnetostrictive model [38]. However,MEE in GMO is not forbidden utterly by this model. Inspite of a zero angular momentum of Gd3+ ion, the naturalmagnetic crystalline anisotropy in GMO is not zero. Thecalculations based on data of Figure 1 derived from resultsof [18–20] give for the anisotropy energy of GMO inthe magnetically saturated state at T = 1 K the value of≈105 erg/g. It is higher than the anisotropy constant in ironat room temperature. It is well known that the existence ofthe magnetic crystalline anisotropy involves the existence ofthe magnetostriction. From these reasoning, it follows thatMEE can exist in GMO at low temperatures. MEP in GMOwas measured in [47] along the [001] axis at T = (5–300) Kfor two directions of the magnetic field along the [100] and[010] axes and for H ≤ 190 kOe.
At T = 5 K and H = 190 kOe, MEP was ΔP ≈0.3·10−9 Coul/cm2. This fact confirmed the magnetostrictivemodel of MEE. In [48], the anisotropy of MEE in GMOwas investigated in the magnetic field up to 200 kOe attemperatures T = 4.2 K and 0.4 K. The experimental angulardependences of MEP at T = 0.4 K and various field valuesare shown on Figure 12. The solid lines are calculated by(28) shifted along the ϕ axis by ϕ0 = π/2. One can seethat the experimental dependences ΔP(ϕ) agree with therelation (28) through the whole field range investigated. Theexperimental dependences ΔP(ϕ) at T = 4.2 K agree with(28) as well. It is evident that at higher temperatures, thetheory [36] developed for a paramagnetic substance shouldwork also. So, (28) of the standard theory [36] describesthe angular dependences of MEE in GMO satisfactorily in
−60
−50
−40
−30
−20
−10
0
10
20
30
40
TMO
0 10 20 30 40 50 60 70 80 90◦
1
2
3
4
ΔP
(10−
9C
oul/
cm2)
Figure 11: The angular dependences of MEP in TMO. MEP wasmeasured along the [001] axis. The field was applied in the (001)plane. ϕ is the angle between the [010] axis and the field. Curves1, 2, and 3 were measured at T = 4.2 K in various fields: curve 1at H = 20 kOe; 2—40 kOe; 3—60 kOe. Curve 4 was measured atT = 0.39 K and H = 100 kOe.
0 10 20 30 40 50 60 70 80 90
−0.3
−0.2
−0.1
0
0.1
0.2
0.3
◦
123
ΔP
(10−
9C
oul/
cm2)
GMO, T = 0.4 K
(2) H = 100 kOe;
P0(H ) = 0.2391739
Solid lines: P = P0(H ) cos 2(1) H = 10 kOe;
P0(H ) = 0.1803064
(3) H = 200 kOe;P0(H ) = 0.2939995
Figure 12: Angular dependences of MEP in GMO at various valuesof the magnetic fields. ϕ◦ is the angle between the [010] axis and themagnetic field. T = 0.4 K. Curve (1) H = 10 kOe; (2) 100 kOe; (3)200 kOe.
the ranges of variables H = (0–200) kOe and T > 0.4 Ksatisfactorily.
The experimental field dependences ΔP(H2) in GMO atT = 4.2 K and 0 < H < 20 kOe are shown in Figure 13for two orientations of the field along the [010] axis (filledcircles) and along the [100] axis (open circles).

14 Physics Research International
−0.06
−0.04
−0.02
0
0.02
0.04
0.06
GMO, T = 4.2 K
= 0◦
The [100] axis
= 90◦
0 100 200 300 400
The [010] axis
H 2 (kOe)2
ΔP
(10−
9C
oul/
cm2)
Figure 13: The dependences of MEP in GMO upon the magneticfield squared at T = 4.2 K. Filled circles were obtained in themagnetic field along the [010] axis; open ones—the field along the[100] axis.
It is seen that, for both directions of the field, theexperimental isotherms agree with the relation (28) only atH2 < 40 (kOe)2, that is, H < 6.3 kOe. At higher fields, thedisagreement increases. At T = 0.4 K, the theory [36] failsutterly. So, the theory [36] is practically inapplicable to thedescription of MEE in GMO at low temperatures. The mainorigin of the magnetoelectric effect in rare earth molybdatesis the single ion magnetostriction of rare earth ions [37, 38].So, we supposed that the experimental dependence P(m) inGMO can be described by the relation analogous to thatobtained in [49] for the single ion magnetostriction:
ΔP(m(H ,T)) = ΔP0 · Il+1/2[L−1(m(H ,T))
]. (32)
Here, Il+1/2(x) is a normalized hyperbolic Bessel function ofl-th order:
Il+1/2(x) = [Il+1/2(x)]/[I1/2(x)];
Il+1/2(x) =∫ 1
−1Pl(y)
exp(xy
)dy;
(33)
Pl(y) is the Legendre polynomial. L−1(m) is the inverseLangevin function of the reduced magnetization m =M/MS.For the case considered, l = 2 has been defined by thesecond-order symmetry of the angular dependence P(ϕ)obtained from Figure 12. For l = 2, the reduced hyperbolicBessel function is given by the relation:
I5/2(x) = 1 +3x2− 3x
cth x. (34)
Relation (32) was used to describe the field dependence ofMEE in GMO. Results are shown on Figure 14. Points on this
figure present experimental dependences of MEP in GMOupon the reduced magnetization m. The circles present MEPvalues measured in the field directed along the [010] axis.The squares correspond to the field along the [100] axis.Filled symbols refer to the temperature T = 0.4 K, opensymbols refer to T = 4.2 K. The experimental values of MEPdo not exceed ΔP ≈ 0.3 · 10−9 Coul/cm2.
Calculated dependences ΔP(m) are shown by solid linesin Figure 14 for T = 4.2 K (curves 1 and 2). Coefficients ΔP0
are −0.18 · 10−9 C/cm2 and 0.17 · 10−9 C/cm2 for the [100]and [010] axes, respectively. For 0 < m < 0.8, the divergencebetween the experiment and the theory is δ(ΔP)/(ΔP) <0.02. So, the relation (32) obtained from the theory of thesingle ion magnetostriction agrees to the experiment wellat 0 < m < 0.8. For m = 0.95, δ(ΔP)/(ΔP) = 0.09. Thevalue m = 0.95 in the case of GMO corresponds to the fieldH ≈ 56, 7 kOe. It is seen that the range of validity of relation(32) is wider than relation (28) [36]. Nevertheless, the mostpart of the field range is not described.
The anomaly near m = 1 indicates some additionaleffects that should be considered. The dependences P(m)at T = 0.4 K cannot be explained by the theory of thesingle ion magnetostriction in its present form becausethis theory does not take account of the antiferromagneticstructure. The magnetic phase transition paramagnetism-antiferromagnetism that takes place in GMO at T = 0.3 Kmay affect the results of the measurements at T = 0.4 K. Thesolid lines 3 and 4 are drawn only for the eyes guide.
MEE in Sm2(MoO4)3 (SMO) was investigated in directcurrent magnetic field up to 200 kOe at temperatures from4.4 K to 0.43 K [50]. MEP was measured along the [001] axisin the magnetic field along the [010] axis and [100] axis.
Figure 15 represents a cycle of the MEP variation (abcde)observed in a single domain sample of SMO at T =1.4 K in the magnetic field directed along the 010] axis.At the ascending branch of the cycle (ab), the magneticfield was increased at a rate dH/dt = 0.755 kOe/s. Thebranch ab was passed for 265 s. It represents the experimentaldependence of MEP in the increasing field ΔPe↑(H). At theb point (H = 200 kOe), the MEP was ΔPe↑ = −5.46 ·10−9 Coul/cm2. At this point, the magnetic field was fixedand remained unvaried for 232 s. During this time, theMEP relaxed to ΔPe↓ = −3.01 · 10−9 Coul/cm2 (point c).At point c, the magnetic field started to decrease at a ratedH/dt = −0.755 kOe/s. The descending branch cd representsthe experimental dependence of MEP in the decreasing fieldΔPe↓(H). At point d, the magnetic field reached zero and wasfixed. The MEP was found to be ΔPe↓ = 3.12·10−9 Coul/cm2
at this point. After fixing the magnetic field at zero, theMEP was measured for 338 s. During this time, it relaxed toΔP = 1.4 · 10−9 Coul/cm2.
This variation of the MEP is plotted as de onFigure 15. Thus, the MEP in SMO relaxes in a fixed magneticfield. The relaxation is not due to the charge leakagethrough the electrometer input circuit because the timesof measurements at a fixed field 232 s and 338 s are twoorders of magnitude shorter than the time constant ofthe electrometer τem > 104 s. Analogous measurements ofthe MEP cycles were performed for other magnetic field

Physics Research International 15
GMO
−0.3
−0.2
−0.1
0
0.1
0.2
0.3
0 0.2 0.4 0.6 0.8 1
4
2
1
3
m = M /M S
ΔP
(10−
9C
oul/
cm2)
Figure 14: Dependences of MEP along the [001] axis in GMO uponthe reduced magnetization m =M/MS at various temperatures andmagnetic field directions. T = 4.2 K: curve (1) the magnetic fieldalong the [100] axis; curve (2) the field along the [010] axis. T =0.4 K: curve (3) the field along the [100] axis; curve (4) the fieldalong the [010] axis.
orientations and temperatures. The time dependences ofMEP on the segments bc and de were fitted well by theexponents:
ΔPe(H = const, t) = ΔP0 exp(− tτ
)+ PR. (35)
The relaxation time τ increased with decreasing temperature.It depended upon the magnetic field only weakly.
Table 2 presents the values of τ obtained at varioustemperatures in the field 200 kOe.
The relaxation of the MEP noticeably affected the MEPfield dependences because the measurement time 265 s wascomparable with the relaxation time τ. Our measurementsshowed that the relation between ΔP0 and PR can beapproximately described by the expression PR ≈ β(ΔP0)where β � 1 is a constant. In this case, a time-dependentcontribution could be eliminated from the experimental fielddependences ΔPe↑↓(H) using the relations:
ΔP↑(H) = ΔPe↑(H) +∫ H
0
ΔPe↑(H)ατ
(1 + β
)dH ; (36)
ΔP↑(H) = ΔPe↑(H)−∫ H
Hm
ΔPe↓(H)ατ
(1 + β
)dH+ P↑(Hm)− Pe↓(Hm).
(37)
Here, P↑↓(H) does not depend on the time. The ↑ and ↓arrows denote the values obtained under increasing anddecreasing field respectively; Hm is the maximum fieldreached in the measurements; α = dH/dt is the rate of the
Table 2: Relaxation time τ of MEP in SMO at various temperaturesin the field 200 kOe.
T (K)The field along
[010], τ (s)The field along
[100], τ (s)
4.4 127 128
2.6 279 192
1.4 337 403
0.9 490 490
0.43 534 828
SMO, T = 1.4 K
H (kOe)
c
b
f
a
d
e
−8
−6
−4
−2
0
2
4
0 50 100 150 200
ΔP
(10−
9C
oul/
cm2)
Figure 15: Field dependences of MEP in Sm2(MoO4)3 at T = 1.4 K.The field is directed along the [010] axis. Curves ab and cd presentexperimental dependences ΔPe↑↓(H) in increasing and decreasingfield, respectively. Straight lines bc and de present the relaxation ofΔP with the time at H = 200 kOe and H = 0, respectively. Curves afand fa are calculated from the curves ab and cd using (36) and (37),respectively.
magnetic field variation with the time; P↑(Hm) is the trueMEP at the maximum field calculated from the experimentalcurve Pe↑(H) using (36); Pe↑(Hm) is the experimental valueof MEP at the start of the decrease in the field (point cin the cycle in Figure 15). Curves ab and cd were usedto obtain the af and fa curves (Figure 15) by means of(36) and (37), respectively. One can see that eliminationof the time-dependent contribution from the experimentalΔPe↑↓(H) dependences yields a hysteresis-free P(H) relation.Analogous results were obtained at the temperatures 0.9; 1.4;2.6; 4.4 K in the field along the [010] and [100] axes.
Corresponding curves are shown in Figure 16. Thedependences 1 and 6 obtained at 4.4 K are fitted well by therelation (28) at ϕ = 0;π/2 and H < 50 kOe. At higher fieldsand lower temperatures, this relation fails.
The data described in Section 4 qualitatively confirmthe magnetostriction mechanism of MEE in rare earthmolybdates. This mechanism is based on the assumption thatthe magnetostriction affects the electric polarization of theseferroelectric compounds.
Table 3 shows the values of MEP in the three rare earthmolybdates investigated here at fixed temperature and fieldvalues. The values of g and J were taken from [51]. There is aclear qualitative correlation between the values of the angular

16 Physics Research International
Table 3: A comparison of MEP absolute values in TMO, GMO, and SMO at T = 4.2 K and H = 100 kOe.
Compound Figure T (K) ΔP (10−9 Coul/cm2) L of R3+ ion gJ of R3+ ion
TMO Figure 11 0.39 ≈(42–57) 3 9
GMO Figure 12 0.4 ≈0.25 0 7
SMO Figure 16 0.43 ≈3 5 0.7
0 50 100 150 200
−8
−10
−6
−4
−2
0
2
4
6
8109876
543
21
SMO
H (kOe)
ΔP
(10−
9C
oul/
cm2)
Figure 16: Field dependences of MEP in SMO after the eliminationof the time-dependent contribution. Curves 1–5 are measured inthe field along the [010] axis; curves 6–10 are measured in the fieldalong the [100] axis. The temperatures: curves (1, 6) T = 4.4 K; (2,7) 2.6 K; (3, 8) 1.4 K; (4, 9) 0.9 K; (5, 10) 0.43K.
momentum L and the values of ΔP. GMO with zero angularmomentum of R3+ ion possesses the least ΔP value. Theangular momentum L characterizes the spatial anisotropyof an ion. It is obvious that the rotation of an anisotropicion with L /= 0 produces more strains in a crystal lattice thanthe rotation of a spherically symmetrical ion with L = 0.So, the change of the electric polarization (MEP = ΔP) islarger for L /= 0 than for L = 0. There is some incongruityin this conclusion: the angular momentum of Sm3+ ion islarger than that of Tb3+ ion, but the ΔP value in SMO isthe order of magnitude smaller than that in TMO. This factcan be explained qualitatively by relations between the ionicmagnetic moments gJμB of R3+ ions under consideration.Here, g is g-factor; J = L± S is the total mechanical momentof R3+ ion; S is the spin mechanical moment of R3+ ion.The sign “−” corresponds to light rare earth ions from Ceto Eu, and the sign “+” corresponds to heavy rare earth ionsfrom Tb to Yb. μB is the Bohr magneton. One can see thatthe magnetic moment of Tb3+ ion is larger than that one ofSm3+ ion. So, one should conclude that the total effect of thespace anisotropy and the magnetic moment of Tb3+ ion islarger than that one of Sm3+ ion. It can be because of that theion with the larger magnetic moments rotates by the largerangle than the ion with a smaller magnetic moment in thesame magnetic field. The final result is determined by thequantitative contributions of the spatial anisotropy of ionsand the angles of their rotations due to the interaction oftheir magnetic moments with the applied magnetic field.
5. Magneto-Optical Properties
In [26], the experimental dependences of the magnetizationin terbium molybdate β′-Tb2(MoO4)3 (TMO) upon themagnetic field and the temperature M(H ,T) were describedsatisfactorily using the theory of the magnetism of singlets[31] at low temperatures T < 30 K. At higher temperatures,the agreement was not good. It was due to increasingpopulation of highest levels of 7F6 multiplet of Tb3+ ions. Forthe calculation of the magnetization at high temperatures,the highest levels of 7F6 multiplet should be known. Tocalculate the spectrum of 7F6 multiplet, one should knowthe crystal field acting on Tb3+-ion. Now, there is no theorythat enables one to calculate the crystal field parametersfrom the first principles. So, the investigations that allowobtain directly the data about the spectra of multiplets arevery useful. For example, the knowledge of the spectrumof the excited multiplet 5D4 can simplify the calculations ofthe crystal field parameters in the case under investigation.The spectrum of 5D4 multiplet can be found from theexperimental data for the optical absorption in TMO at lowtemperatures. The optical absorption in TMO was studied atzero magnetic field in [52]. 14 well-resolved absorption peakswere observed. It was established that those peaks correspondto the transitions 7F6 ⇒5D4 in Tb3+ ions.
In [53], the absorption spectra were measured in TMOin the nonpolarized light in the magnetic field H ≤ 200 kOealong the [001] and [110] axes at T = 4.2 K and T = 1.7 K. Awave vector of the light was parallel to the magnetic field.At zero field, 14 well-resolved peaks with wave numbersν = 20519 cm−1–20655 cm−1 (λ = 4873.5 A–4841.4 A) wereobserved. The magnetic field shifted the spectrum towardlarge ν values. The spectra were measured at 29 differentfield values. The experimental field dependences of the wavenumbers of the absorption peaks νi(H) were obtained forboth directions of the field.
The spectra did not depend upon the temperature. Therewas a pronounced dependence of the peak numbers and ofthe rate of their shift with the field dνi/dH upon the directionof the field. The analysis of these dependences showed thatthe excited multiplet 5D4 of Tb3+ ion in the crystal field ofTMO could be considered as consisting of five singlets andtwo quasidoublets. On the base of the measurements andanalysis of the absorption spectra in terbium molybdate, thefield dependence of the energy spectrum Ei(H) of the excitedmultiplet 5D4 of Tb3+ ion in the crystal field with the pointgroup symmetry C2 was found for the magnetic field up to200 kOe along the [001] axis. The experimental dependencesEi(H) could be described well by the theory of the magnetismof singlets.

Physics Research International 17
The number of the absorption peaks was explained by theexisting of two types of nonequivalent sites for Tb3+ ions inthe crystal lattice of TMO.
6. Anomalously High Photo Voltages
In [54], an anomalously high photoinduced voltage (APVeffect) in TMO was observed. The illumination of a singlecrystal of TMO by the beam of the argon laser with awave length of λ = 4880 A and a power of 0.5 W inducedin the ferroelectric single domain sample an additionalelectric polarization. The wave length corresponded to aproper absorption band of TMO. The laser beam wasdirected along the [110] axis. The surface of polarizationof the laser beam was normal to the (001) plane. Thedirection of the photoinduced polarization was the sameas that of the spontaneous polarization. The laser beamwas focused to a spot with an area 10−2 cm2. It meansthat the distribution of the intensity of the light was highlyinhomogeneous. The average value of the intensity in theilluminated spot was≈50 W/cm2. The photoinduced electricpolarization of the crystal depended upon the time ofthe illumination. After the illumination during 4.5 h, thephotoinduced polarization was approximately three timeslarger than the spontaneous electric polarization and showedthe tendency to the saturation.
The laser beam with the wave length 4880 A inducedin TMO the luminescence in the green part of the visiblespectrum with the wave length ≈ 5430 A. The quantumoutput constituted 20%.
In [55], the dependences of the photoinduced voltagein TMO upon the time t of the illumination by a laserbeam were measured at room temperature at 0.1 s ≤t ≤ 4500 s. The power of the laser radiation was 0.4 W.The distribution of the intensity along the sample wasvaried from highly inhomogeneous to homogeneous. Itwas found that the photoinduced voltages of two typeswith opposite signs appear due to the inhomogeneousillumination.
In [55], the APV effect in TMO was measured atheightened sensibility, respectively, to the photoinducedelectric polarization of the crystal.
Due to this, it was possible to observe relatively smallcontribution to the photoinduced polarization ΔPph that wasdirected opposite to the spontaneous electric polarization PS.This effect was observed at a small duration of illuminationt < 80 s. It was called APV-1. The effect that was observed in[54] was called APV-2. The sign of APV-1 was opposite to thesign of APV-2. The voltage and the relaxation time of APV-1 were essentially smaller than those of APV-2. That is whythe APV-1 effect was not observed on the background of theAPV-2 effect in [54].
The first observation of APV-effect was reported for asingle crystal sample of ferroelectric SbSI0.35Br0.65 [56]. Aphenomenological theory of the APV effect was describedin [57]. In works published up to now, the diffusioncontribution to the photoinduced current was ignored[57, 58]. According to [57], the time dependences of the
photoinduced current and the photoinduced voltage aregiven by the following expressions:
i(t) = i0 exp(− tτ
); (38)
V(t) = V0
[1− exp
(− tτ
)]. (39)
The effect APV-1 is well described by the expressions (38)and (39). The effect APV-2 does not follow these expressions.
Figure 17 shows experimental time dependences of thephotoinduced current i(t) (curve 1) and the photoinducedvoltage V(t) (curve 2).
These curves were obtained on the sample number 1 withsize 6 × 7×1 mm3. The large face of the sample was parallelto the plane (001).
The [100] and [010] crystal axes were directed along thebisectors of the right angles of the (001) sides. The laser beamwas focused on the 7 × 1 mm2 face of the sample by acylinder lens to the spot with dimensions 2 × 0.5 mm2. Thelarge size of the spot was along the [001] axis of the crystal.The intensity of the light in the spot was ≈40 W/cm2.
Arrows show the time when the light was switched onand off. These dependences are in a good agreement withexpressions (38) and (39) respectively. The constants arei0 ≈ 0.2 · 10−9 A; V0 ≈ −10 V; τ ≈ 5 s. The stepped form ofthe curve 1 is due to the resolution of the equipment. Whenthe light is switched on, the negative voltage V(t) appears.This voltage is due to the photoinduced electric polarization
Δ�Pph that is directed opposite to the spontaneous electric
polarization �PS. The value V0 ≈ −10 V corresponds to the
decreasing of �PS by the value ΔPph = 4.8 · 10−9 C/cm2.When the light is switched off, the photoinduced voltagedecreases exponentially with the time constant τ ≈ 5 s.The photoinduced voltage and the photoinduced current onFigure 17 are due to the effect APV-1.
Figure 18 shows the dependences ΔPph(t) for variousdistributions of the light intensity along the sample. Theswitching on and off the light are shown by the arrows.Curve 1 was measured on the sample number1 at the sameconditions as in Figure 17. One can see that the type ofthe dependence shown in Figure 17 occurs only duringshort time of ≈200 s after the light is switched on. At t ≈(250 − −300) s, the ΔPph(t) value reaches a minimum ofΔPph ≈ −4.8 · 10−9 C/cm2 and begins to increase withincreasing t.
At t ≈ 1700 s, the sign of ΔPph(t) is changed. Thepositive sign of ΔPph(t) at t > 1700 s corresponds to the
coincidence of the directions of �PS and �ΔPph. The tendencyto the saturation of ΔPph(t) is seen at large values of t. Atswitching off the light, the positive jump of the photoinducedpolarization occurs. It is of the same absolute value as thenegative jump at switching on the light. After this jump,the photoinduced polarization continues to increase slowly:an after-effect takes place. In other words, the long negativepulse of the polarization due to the effect APV-1 exists on thebackground of slow positive drift of the polarization. Thisdrift is due to the effect APV-2.
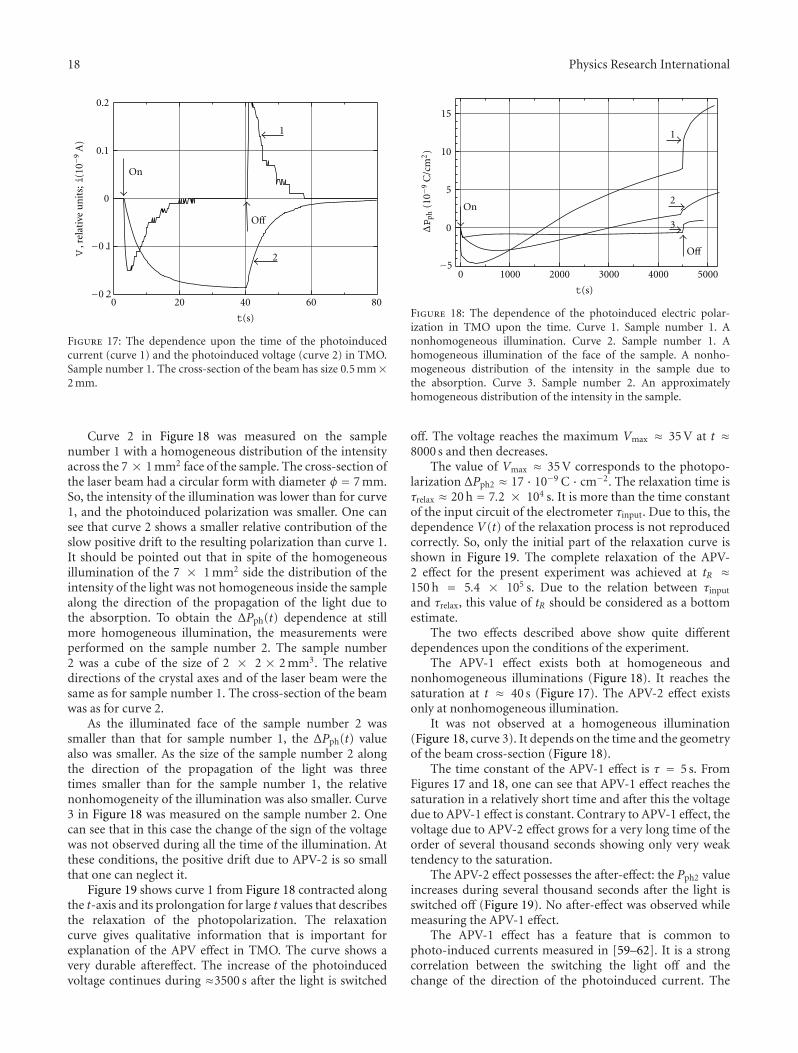
18 Physics Research International
−0.2
−0.1
0
0.1
0.2
0 20 40 60 80
t(s)
On
Off
1
2V, r
elat
ive
un
its;i(
10−9
A)
Figure 17: The dependence upon the time of the photoinducedcurrent (curve 1) and the photoinduced voltage (curve 2) in TMO.Sample number 1. The cross-section of the beam has size 0.5 mm×2 mm.
Curve 2 in Figure 18 was measured on the samplenumber 1 with a homogeneous distribution of the intensityacross the 7 × 1 mm2 face of the sample. The cross-section ofthe laser beam had a circular form with diameter φ = 7 mm.So, the intensity of the illumination was lower than for curve1, and the photoinduced polarization was smaller. One cansee that curve 2 shows a smaller relative contribution of theslow positive drift to the resulting polarization than curve 1.It should be pointed out that in spite of the homogeneousillumination of the 7 × 1 mm2 side the distribution of theintensity of the light was not homogeneous inside the samplealong the direction of the propagation of the light due tothe absorption. To obtain the ΔPph(t) dependence at stillmore homogeneous illumination, the measurements wereperformed on the sample number 2. The sample number2 was a cube of the size of 2 × 2 × 2 mm3. The relativedirections of the crystal axes and of the laser beam were thesame as for sample number 1. The cross-section of the beamwas as for curve 2.
As the illuminated face of the sample number 2 wassmaller than that for sample number 1, the ΔPph(t) valuealso was smaller. As the size of the sample number 2 alongthe direction of the propagation of the light was threetimes smaller than for the sample number 1, the relativenonhomogeneity of the illumination was also smaller. Curve3 in Figure 18 was measured on the sample number 2. Onecan see that in this case the change of the sign of the voltagewas not observed during all the time of the illumination. Atthese conditions, the positive drift due to APV-2 is so smallthat one can neglect it.
Figure 19 shows curve 1 from Figure 18 contracted alongthe t-axis and its prolongation for large t values that describesthe relaxation of the photopolarization. The relaxationcurve gives qualitative information that is important forexplanation of the APV effect in TMO. The curve shows avery durable aftereffect. The increase of the photoinducedvoltage continues during ≈3500 s after the light is switched
0 1000 2000 3000 4000 5000−5
0
5
10
15
1
2
t(s)
3
On
Off
ΔP
ph(1
0−9
C/c
m2)
Figure 18: The dependence of the photoinduced electric polar-ization in TMO upon the time. Curve 1. Sample number 1. Anonhomogeneous illumination. Curve 2. Sample number 1. Ahomogeneous illumination of the face of the sample. A nonho-mogeneous distribution of the intensity in the sample due tothe absorption. Curve 3. Sample number 2. An approximatelyhomogeneous distribution of the intensity in the sample.
off. The voltage reaches the maximum Vmax ≈ 35 V at t ≈8000 s and then decreases.
The value of Vmax ≈ 35 V corresponds to the photopo-larization ΔPph2 ≈ 17 · 10−9 C · cm−2. The relaxation time isτrelax ≈ 20 h = 7.2 × 10⁴ s. It is more than the time constantof the input circuit of the electrometer τinput. Due to this, thedependence V(t) of the relaxation process is not reproducedcorrectly. So, only the initial part of the relaxation curve isshown in Figure 19. The complete relaxation of the APV-2 effect for the present experiment was achieved at tR ≈150 h = 5.4 × 10⁵ s. Due to the relation between τinput
and τrelax, this value of tR should be considered as a bottomestimate.
The two effects described above show quite differentdependences upon the conditions of the experiment.
The APV-1 effect exists both at homogeneous andnonhomogeneous illuminations (Figure 18). It reaches thesaturation at t ≈ 40 s (Figure 17). The APV-2 effect existsonly at nonhomogeneous illumination.
It was not observed at a homogeneous illumination(Figure 18, curve 3). It depends on the time and the geometryof the beam cross-section (Figure 18).
The time constant of the APV-1 effect is τ = 5 s. FromFigures 17 and 18, one can see that APV-1 effect reaches thesaturation in a relatively short time and after this the voltagedue to APV-1 effect is constant. Contrary to APV-1 effect, thevoltage due to APV-2 effect grows for a very long time of theorder of several thousand seconds showing only very weaktendency to the saturation.
The APV-2 effect possesses the after-effect: the Pph2 valueincreases during several thousand seconds after the light isswitched off (Figure 19). No after-effect was observed whilemeasuring the APV-1 effect.
The APV-1 effect has a feature that is common tophoto-induced currents measured in [59–62]. It is a strongcorrelation between the switching the light off and thechange of the direction of the photoinduced current. The
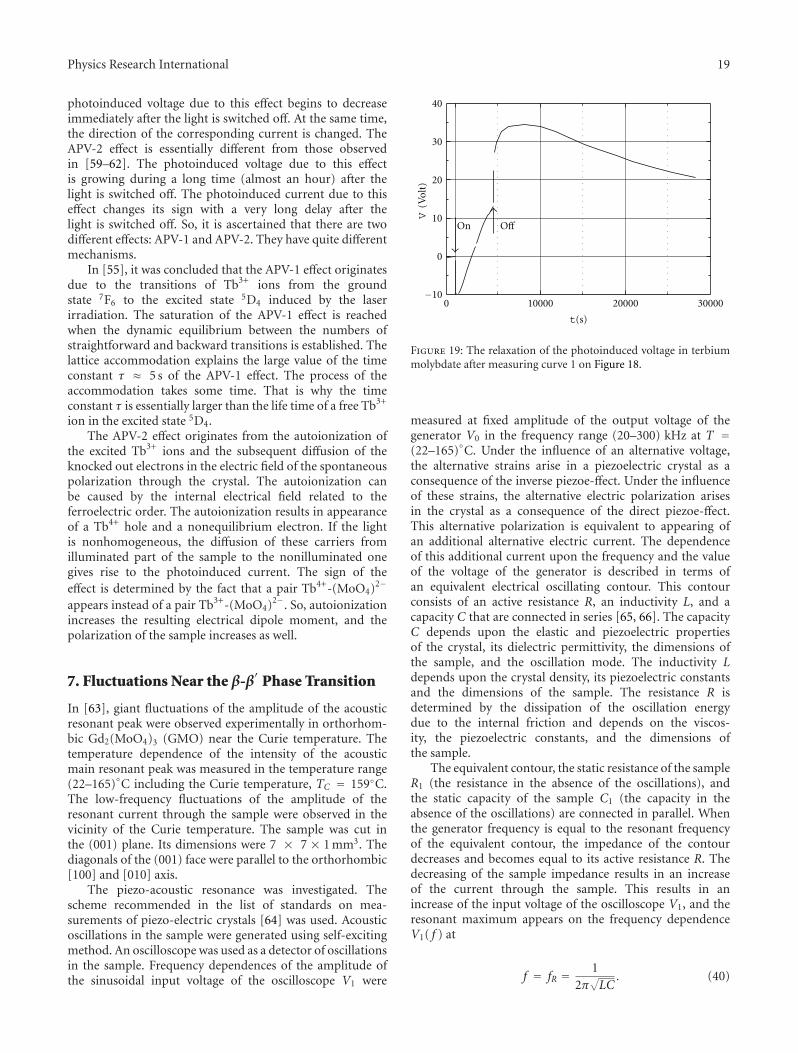
Physics Research International 19
photoinduced voltage due to this effect begins to decreaseimmediately after the light is switched off. At the same time,the direction of the corresponding current is changed. TheAPV-2 effect is essentially different from those observedin [59–62]. The photoinduced voltage due to this effectis growing during a long time (almost an hour) after thelight is switched off. The photoinduced current due to thiseffect changes its sign with a very long delay after thelight is switched off. So, it is ascertained that there are twodifferent effects: APV-1 and APV-2. They have quite differentmechanisms.
In [55], it was concluded that the APV-1 effect originatesdue to the transitions of Tb3+ ions from the groundstate 7F6 to the excited state 5D4 induced by the laserirradiation. The saturation of the APV-1 effect is reachedwhen the dynamic equilibrium between the numbers ofstraightforward and backward transitions is established. Thelattice accommodation explains the large value of the timeconstant τ ≈ 5 s of the APV-1 effect. The process of theaccommodation takes some time. That is why the timeconstant τ is essentially larger than the life time of a free Tb3+
ion in the excited state 5D4.The APV-2 effect originates from the autoionization of
the excited Tb3+ ions and the subsequent diffusion of theknocked out electrons in the electric field of the spontaneouspolarization through the crystal. The autoionization canbe caused by the internal electrical field related to theferroelectric order. The autoionization results in appearanceof a Tb4+ hole and a nonequilibrium electron. If the lightis nonhomogeneous, the diffusion of these carriers fromilluminated part of the sample to the nonilluminated onegives rise to the photoinduced current. The sign of theeffect is determined by the fact that a pair Tb4+-(MoO4)2−
appears instead of a pair Tb3+-(MoO4)2−. So, autoionizationincreases the resulting electrical dipole moment, and thepolarization of the sample increases as well.
7. Fluctuations Near the β-β′ Phase Transition
In [63], giant fluctuations of the amplitude of the acousticresonant peak were observed experimentally in orthorhom-bic Gd2(MoO4)3 (GMO) near the Curie temperature. Thetemperature dependence of the intensity of the acousticmain resonant peak was measured in the temperature range(22–165)◦C including the Curie temperature, TC = 159◦C.The low-frequency fluctuations of the amplitude of theresonant current through the sample were observed in thevicinity of the Curie temperature. The sample was cut inthe (001) plane. Its dimensions were 7 × 7 × 1 mm3. Thediagonals of the (001) face were parallel to the orthorhombic[100] and [010] axis.
The piezo-acoustic resonance was investigated. Thescheme recommended in the list of standards on mea-surements of piezo-electric crystals [64] was used. Acousticoscillations in the sample were generated using self-excitingmethod. An oscilloscope was used as a detector of oscillationsin the sample. Frequency dependences of the amplitude ofthe sinusoidal input voltage of the oscilloscope V1 were
0 10000 20000 30000−10
0
10
20
30
40
V(V
olt)
OffOn
t(s)
Figure 19: The relaxation of the photoinduced voltage in terbiummolybdate after measuring curve 1 on Figure 18.
measured at fixed amplitude of the output voltage of thegenerator V0 in the frequency range (20–300) kHz at T =(22–165)◦C. Under the influence of an alternative voltage,the alternative strains arise in a piezoelectric crystal as aconsequence of the inverse piezoe-ffect. Under the influenceof these strains, the alternative electric polarization arisesin the crystal as a consequence of the direct piezoe-ffect.This alternative polarization is equivalent to appearing ofan additional alternative electric current. The dependenceof this additional current upon the frequency and the valueof the voltage of the generator is described in terms ofan equivalent electrical oscillating contour. This contourconsists of an active resistance R, an inductivity L, and acapacity C that are connected in series [65, 66]. The capacityC depends upon the elastic and piezoelectric propertiesof the crystal, its dielectric permittivity, the dimensions ofthe sample, and the oscillation mode. The inductivity Ldepends upon the crystal density, its piezoelectric constantsand the dimensions of the sample. The resistance R isdetermined by the dissipation of the oscillation energydue to the internal friction and depends on the viscos-ity, the piezoelectric constants, and the dimensions ofthe sample.
The equivalent contour, the static resistance of the sampleR1 (the resistance in the absence of the oscillations), andthe static capacity of the sample C1 (the capacity in theabsence of the oscillations) are connected in parallel. Whenthe generator frequency is equal to the resonant frequencyof the equivalent contour, the impedance of the contourdecreases and becomes equal to its active resistance R. Thedecreasing of the sample impedance results in an increaseof the current through the sample. This results in anincrease of the input voltage of the oscilloscope V1, and theresonant maximum appears on the frequency dependenceV1( f ) at
f = fR = 12π√LC
. (40)

20 Physics Research International
The value of the maximum is given by the followingequation:
V1[fR(T)
] = VR(T) = V0[1 + ξ(T)C2
1
]√ξ(T)C2
2 + [1 + ξ(T)C1(C1 + C2)]2.
(41)
Here, T is the temperature; C1 the static capacity of thesample; C2 the input capacity of the oscilloscope;
ξ(T) = [R(T)]2
L(T)C(T)= 4π2[ fR(T)
]2[R(T)]2; (42)
R, L, C are the resistance, the inductivity, and the capacity ofthe equivalent contour, respectively. Equation (41) is derivedfor the case R1 � 1/(ωC1); R2 � 1/(ωC2). R2 is the activeinput resistance of the oscilloscope. It was assumed that thevalues R, C1, and C2 do not shift noticeably the resonanceterm ω2LC = 1.
Figure 20 shows the experimental temperature depen-dence of the resonant peak intensity VR(T).
At temperatures higher than≈130◦C, the intensityVR(T)displays large and slow fluctuations at constant values of thetemperature and the frequency. These fluctuations can befixed visually.
The time of fluctuations reaches tens of seconds.Figure 20 shows maximum (open circles) and minimum(filled circles) values ofVR. The maximum and the minimumvalues of VR were found from the observation during twominutes at fixed values of the temperature and the frequency.The variations of VR due to the fluctuations reached 0.1 Volt.The fluctuations could be observed only in the limit of theresonant peak width Δ fR ≈ 1 kHz. Out of the resonance, theywere zero with the accuracy of 0.008VR ≈ 0.0003 Volt. Curvesare drawn only for the eyes guide.
Figure 21 shows the time dependence of the resonantpeak intensity VR(t) at T = 154.25◦C and fR = 154.9 kHz.The oscillating line is a spline. The horizontal line is a meanvalue of VR over the time of observations. The mean squarefluctuation of VR is ≈33 mV.
It constitutes ≈15% of the mean value VR ≈ 0.22 Volt.The real frequency spectrum of the fluctuations is widerthan that of the curve on Figure 21. Rapid fluctuationsoccur with periods much less than one second. So fastvariations of VR(t) can be seen but it is impossible to fixthem visually. Observed fluctuations of VR(t) occurs due tothe fluctuations of the resonant current through the sample.When the temperature of the sample is near the temperatureof the phase transition, various parameters of the crystalfluctuate and lead to the fluctuations of the impedance ofthe equivalent contour. This results in the fluctuations of thecurrent through the sample. The value VR at the resonance isrelated to the parameters of the equivalent contour by (41).It is seen from (41) that the value of VR and consequentlythe values of its fluctuations can be presented as a functionof the only variable ξ = R2/LC. It can be shown that ξdepends on four material constants. They are the elasticconstant, the dielectric permeability, the coefficient of theinternal friction, and the piezoelectric constant. ξ depends
0.1
0.2
0.3
0.4
20 40 60 80 100 120 140 160
Gd2(MoO4)3
VR
(Vol
t)
0
T (◦C)
Figure 20: The temperature dependences of the maximum (opencircles) and minimum (filled circles) intensities of the fluctuatingresonant peak VR. Lines are drawn for the eyes guide.
0.1
0.2
0.3
00 20 40 60 80 100
Gd2(MoO4)3
VR
(Vol
t)
t(s)
T = 154.25◦C, f= 154.9 kHz
Eqn: y= b, R : 0.0329, max dev: 0.08010560
b= 0.2198982; R/b= 0.1496
Figure 21: Fluctuations at T = 154.25◦C and fR = 154.9 kHz. Theoscillating line is a spline. The horizontal line is a mean value of VR
over the time of observations.
also upon the density ρ, but fluctuations of the densitycannot reach so large values as shown on Figure 21. Theobserved fluctuations of the piezoacoustic impedance inGMO exceeds fluctuations of parameters of a crystal reportedup to now [67] by the two orders of magnitude.
Acknowledgments
A. Zhukov wishes to underline that most scientific contribu-tion in the field of RMO belongs to Prof. B. K. Ponomarev,

Physics Research International 21
who recently passed away. Consequently, the role of A.Zhukov, apart of magnetic measurements performed in1990s, was mostly the preparation of this publication. Thiswork was supported by EU ERA-NET Program underProject “SoMaMicSens” (MANUNET-2010-Basque-3), bySpanish Ministry of Science and Innovation, MICINN underProject MAT2010-18914 and by the Basque Governmentunder Saiotek 11 MIMAGURA Project (S-PE11UN087). A.Zhukov wishes to acknowledge the support of the BasqueGovernment under Program of Mobility of the InvestigatingPersonnel of the Department of Education, Universities andInvestigation, Grant nos. MV-2009-2-21 and MV-2010-2-31.
References
[1] L. H. Brixner, J. R. Barkley, and W. Jeitschko, “Rare-earthmolibdates (VI),” in Handbook on the Physics and Chemistryof Rare Earths, K. A. Gschneidner Jr. and L. Eyring, Eds., vol.chapter 30, pp. 610–655, North-Holland Publishing Company,1979.
[2] E. T. Keve, S. C. Abrahams, and J. L. Bernstein, “Ferroelectricferroelastic paramagnetic beta-Gd2(MoO4)3 crystal structureof the transition-metal molybdates and tungstates. VI,” TheJournal of Chemical Physics, vol. 54, no. 7, pp. 3195–3206,1971.
[3] K. Ullakko, J. K. Huang, C. Kantner, R. C. O’Handley, and V. V.Kokorin, “Large magnetic-field-induced strains in Ni2MnGasingle crystals,” Applied Physics Letters, vol. 69, no. 13, pp.1966–1968, 1996.
[4] D. C. Dunand and P. Mullner, “Size effects on magneticactuation in Ni-Mn-Ga shape-memory alloys,” AdvancedMaterials, vol. 23, no. 2, pp. 216–232, 2011.
[5] Boris K. Ponomarev, Sergey A. Ivanov, Valery D. Negrii et al.,“Giant magnetic anisotropy in paramagnetic Tb2(MoO4)3,”Ferroelectrics, vol. 151, no. 1–4, pp. 103–108, 1994.
[6] A. P. Levanyuk and D. G. Sannikov, “On closed by thetemperature phase transitions of the second type,” JETPLetters, vol. 55, pp. 256–265, 1968.
[7] J. Petzelt and V. Dvorak, “New type of ferroelectric soft modein gadolinium molybdate,” Physica Status Solidi (b), vol. 46,pp. 413–423, 1971.
[8] J. D. Axe, B. Dorner, and G. Shirane, “Mechanism of theferroelectric phase transformation in rare-earth molybdates,”Physical Review Letters, vol. 26, no. 9, pp. 519–523, 1971.
[9] B. Dorner, J. D. Axe, and G. Shirane, “Neutron-scatteringstudy of the ferroelectric phase transformation inTb2(MoO4)3,” Physical Review B, vol. 6, no. 5, pp. 1950–1963, 1972.
[10] W. Jeitschko, “The crystal structure of ferroelectric gadolin-ium molybdate, Gd2(MoO4)3,” Die Naturwissenschaften, vol.57, no. 11, p. 544, 1970.
[11] W. Jeitschko, “A comprehensive X-ray study of theferroelectric-ferroelastic and paraelectric-paraelastic phasesof Gd2(MoO4)3,” Acta Crystallographica B, vol. 28, pp. 60–76,1972.
[12] K. Aizu, “Possible species of ”Ferroelastic” crystals and ofsimultaneously ferroelectric and ferroelastic Crystals,” Journalof the Physical Society of Japan, vol. 27, no. 2, pp. 387–396,1969.
[13] E. Sawaguchi and L. E. Cross, “Spontaneous polarization ofGd2(MoO4)3,” Journal of Applied Physics, vol. 44, no. 6, pp.2541–2544, 1973.
[14] H. J. Borhardt and P. E. Bierstedt, “Ferroelectric rare-earthmolybdates,” Journal of Applied Physics, vol. 38, no. 5, pp.2057–2061, 1967.
[15] L. E. Cross, A. Fouskova, and S. E. Cummins, “Gadoliniummolybdate, a new type of ferroelectric crystal,” Physical ReviewLetters, vol. 21, no. 12, pp. 812–814, 1968.
[16] F. G. Ullman, B. N. Ganguly, and J. R. Zeidler, “Pyroelectricdetection properties of gadolinium molybdate (gmo),” Journalof Electronic Materials, vol. 1, no. 3, pp. 425–434, 1972.
[17] F. G. Ullman, K. M. Cheung, G. A. Rakes, and B. N. Ganguly,“Re-examination of the pyroelectric current anomaly ingadolinium molybdatet,” Ferroelectrics, vol. 9, pp. 63–64, 1975.
[18] R. A. Fisher, E. W. Hornung, G. E. Brodale, and W. F. Giauque,“Magnetothermodynamics of antiferromagnetic, ferroelectricβ-Gd2(M.oO4)3. I. Heat capacity, entropy, magnetic momentof the electrically polarized form from 0.4 to 4.2◦K with Fieldsto 90 kG along the c crystal axis,” The Journal of ChemicalPhysics, vol. 56, no. 1, pp. 193–212, 1972.
[19] E. W. Hornung, G. E. Brodale, R. A. Fisher, and W. F. Giauque,“Magnetothermodynamics of antiferromagnetic, ferroelectricβ-Gd2(MoO4)3. II. Heat capacity, entropy, magnetic momentof the electrically polarized form from 0.4 to 4.2◦K with fieldsto 90 kG along the a crystal axis,” The Journal of ChemicalPhysics, vol. 56, no. 10, pp. 5007–5018, 1972.
[20] G. E. Brodale, R. A. Fisher, E. W. Hornung, and W. F. Giauque,“Magnetothermodynamics of antiferromagnetic, ferroelectricβ-Gd2(MoO4)3. III. Heat capacity, entropy, magnetic momentof the electrically polarized form from 0.4 to 4.2◦K with fieldsto 90 kG along the b crystal axis,” The Journal of ChemicalPhysics, vol. 56, no. 12, pp. 6118–6125, 1972.
[21] R. A. Fisher, E. W. Hornung, G. E. Brodale, and W. F.Glauque, “Magnetothermodynamics of antiferromagnetic,ferroelectric, ferroelastic β-Gd2(MoO4)3, IV Thermodynamictemperature and other properties without heat introductionbelow 0.5◦K. Fields to 10 kG along the c+ crystal axis,” TheJournal of Chemical Physics, vol. 59, no. 11, pp. 5796–5809,1973.
[22] R. A. Fisher, E. W. Hornung, G. E. Brodale, and W. F. Giauque,“Magnetothermodynamics of antiferromagnetic, polarizedferroelectric, ferroelastic β-Gd2(MoO4)3. V. Thermodynamictemperature and other properties with heat introductionbelow 0.5◦K. Fields to 5 kG along the b crystal axis,” TheJournal of Chemical Physics, vol. 69, no. 6, pp. 2892–2900,1978.
[23] R. A. Fisher, E. W. Hornung, G. E. Brodale, and W. F. Giauque,“Magnetothermodynamics of ferroelectric, ferroelastic, anti-ferromagnetic β-terbium molybdate. I. Heat capacity, entropy,magnetic moment of the electrically polarized form from 0.4to 4.2 ◦K with fields to 90 kG along the c crystal axis,” TheJournal of Chemical Physics, vol. 63, no. 3, pp. 1295–1308,1975.
[24] B. K. Ponomarev, Yu. F. Popov, and D. S. Red’kin, “Magne-tostriction of paramagnetic terbium molybdate in fields up to150 kOe,” JETP Letters, vol. 57, pp. 483–486, 1993.
[25] B. K. Ponomarev, S. A. Ivanov, B. S. Red’Kin, and V. N. Kurlov,“Irreversible alterations of ferroelectric domain structure inparamagnetic rare earth molybdates induced by a magneticfield,” Journal of Applied Physics, vol. 75, no. 12, pp. 8004–8007,1994.

22 Physics Research International
[26] B. K. Ponomarev, A. I. Popov, J. Van Tol et al., “Magnetismof singlets in terbium molybdate,” Journal of Magnetism andMagnetic Materials, vol. 258-259, pp. 510–512, 2003.
[27] L. D. Landau and E. M. Lifshits, Kvantovaya Mekhanika,Nauka, Moscow, Russia, 1974.
[28] J. Samuel Smart, Effective Field Theories of Magnetism, IBMWatson Research Center, New York, NY, USA, 1966.
[29] H. A. Jahn and E. Teller, “Stability of polyatomic moleculesin degenerate electronic states. I. Orbital degeneracy,” Proceed-ings of the Royal Society A, vol. 161, pp. 220–235, 1937.
[30] H. A. Kramers, “Theorie generale de la rotation paramag-netique dans les cristaux,” Proceedings Academy of Science,Amsterdam, vol. 33, pp. 959–972, 1930.
[31] A. K. Zvezdin, V. M. Matveev, A. A. Mukhin, and A. I. Popov,Redkozemel’nye Iony v Magnito-Uporyadochennykh Kistallakh,Nauka, Moscow, Russia, 1985.
[32] L. D. Landau and E. M. Lifshits, Electrodynamics of Contin-uum, Gostekhizdat, Moscow, Russia, 1957.
[33] I. E. Dzyaloshinskii, “Topological model of a heisenberg spinglass,” JETP Letters, vol. 37, pp. 881–882, 1959.
[34] D. N. Astrov, “The magnetoelectric effect in antiferromagnet-ics,” JETP Letters, vol. 38, pp. 984–985, 1960.
[35] D. N. Astrov, “Magnetoelectric effect in chromium oxide,”JETP Letters, vol. 40, pp. 1035–1041, 1961.
[36] S. L. Hou and N. Bloembergen, “Paramagnetoelectric effectsin NiSO4 6H2O,” Physical Review, vol. 138, no. 4A, pp. A1218–A1226, 1965.
[37] S. A. Ivanov, V. N. Kurlov, B. K. Ponomarev, and B. S. Red’kin,“Magnetoelectric effect in terbium molibdate,” JETP Letters,vol. 52, no. 7, pp. 1003–1005, 1990.
[38] B. K. Ponomarev, S. A. Ivanov, B. S. Red’kin, and V. N.Kurlov, “Magnetoelectrical effect in paramagnetic rare-earthmolybdates,” Physica B, vol. 177, no. 1–4, pp. 327–329, 1992.
[39] I. E. Chupis, “Effect of magnetic field on ferroelectric prop-erties of rare-earthe molobdates,” Fizika Nizkikh Temperatur,vol. 21, no. 9, pp. 941–4695, 1995.
[40] B. K. Ponomarev, S. A. Ivanov, B. S. Red’kin, and V. N.Kurlov, “Effect of a magnetic field on the ferroelectric domainstructure of TbGd(MoO4)3,” JETP Letters, vol. 55, pp. 353–361, 1992.
[41] B. K. Ponomarev, V. D. Negrii, B. S. Red’kin, and Yu F. Popov,“Magneto-electro-elastic effects in some rare earth molybdatesand related properties,” Journal of Physics D: Applied Physics,vol. 27, no. 10, pp. 1995–2001, 1994.
[42] H. Wiegelmann, B. K. Ponomarev, J. van Tol, A. G. M. Jansen,P. Wyder, and B. S. Red’kin, “Magnetoelectric properties offerroelectric rare earth molybdates,” Ferroelectrics, vol. 183, pp.195–204, 1996.
[43] B. K. Ponomarev, A. I. Popov, E. Steep et al., Fizika TverdogoTela, vol. 47, no. 7, p. 1326, 2005.
[44] N. F. Vedernikov, A. K Zvezdin, R. Z. Levitin, and A. I. Popov,“Magnetic linear birefringence of rare-earth garnets,” JETPLetters, vol. 93, p. 2161, 1987, Soviet Physics—JETP, vol. 66,no. 6, p. 1233, 1987.
[45] N. S. Akulov, Ferromagnetics, Gostekhizdat, Moscow, Russia,1939.
[46] E. Callen and H. B. Callen, “Magnetostriction, forced mag-netostriction, and anomalous thermal expansion in ferromag-nets,” Physical Review, vol. 139, no. 2A, pp. A455–A471, 1965.
[47] B. K. Ponomarev, B. S. Red’kin, H. Wiegelmann, A. G. M.Jansen, P. Wyder, and J. van Tol., “Magnetoelectric effect inorthorhombic Gd2(MoO4)3,” Ferroelectric letters, vol. 18, no.3-4, pp. 133–140, 1994.
[48] B. K. Ponomarev, E. Steep, H. Wiegelmann, A. G. M. Jansen, P.Wyder, and B .S. Red’kin, “Anisotropy of the magnetoelectriceffect in β′-Gd2(MoO4)3,” Physics of the Solid State, vol. 42, no.4, pp. 716–738, 2000.
[49] H. B. Callen and E. Callen, “The present status of thetemperature dependence of magnetocrystalline anisotropy,and the l(l+1) 2 power law,” Journal of Physics and Chemistryof Solids, vol. 27, no. 8, pp. 1271–1285, 1966.
[50] B. K. Ponomarev, B. S. Red’kin, E. Steep, H. Wiegelmann, A. G.M. Jansen, and P. Wyder, “Magnetoelectric effect in samariummolybdate,” Physics of the Solid State, vol. 44, no. 1, pp. 145–148, 2002.
[51] K. P. Belov, M. A. Belyanchokova, R. Z. Levitin, and S.A. Nikitin, Rare-Earth Ferromagnets and Antiferromagnets,Nauka, Moscow, Russia, 1965.
[52] B. K. Ponomarev, J. Zeman, G. Martinez et al., “The anisotropyof the intensity of the optical absorption in β′—Tb2(MoO4)3,”Ferroelectrics, vol. 204, pp. 279–288, 1997.
[53] B. K. Ponomarev, A. I. Popov, B. S. Red’kin et al., “Thelongitudinal zeeman effect in terbium molybdate,” Journal ofMagnetism and Magnetic Materials, vol. 300, no. 1, pp. e422–e425, 2006.
[54] B. K. Ponomarev, I. A. Kornev, V. D. Negrii, G. M. Vizdrik, andB. S. Red’kin, “Anomalously high photovoltages in terbiummolybdate,” Physics of the Solid State, vol. 40, pp. 661–663,1998.
[55] B. K. Ponomarev, V. D. Negrii, and B. S. Red’Kin, “Two types ofphoto-induced voltages in terbium molybdate,” Ferroelectrics,vol. 280, pp. 119–130, 2002.
[56] A. A. Grekov, M. A. Malitskaia, V. D. Spitsina, and B. M.Fridkin, “Photoelectric effects in A5B6C7-type ferroelectrics-semiconductors with low-temperature phase transitions,”Kristallografiya, vol. 15, pp. 500–509, 1970.
[57] A. M. Glass, D. von der Linde, and T. J. Negran, “High-voltagebulk photovoltaic effect and the photorefractive process inLiNbO3,” Applied Physics Letters, vol. 25, no. 4, pp. 233–235,1974.
[58] V. M. Fridkin, Fotosegnetoelektriki, Nauka, Moscow, Russia,1979.
[59] A. G. Chynoweth, “Surface space-charge layers in bariumtitanate,” Physical Review, vol. 102, no. 3, pp. 705–714, 1956.
[60] P. V. Ionov, “Photosensitivity of ferroelectric niobates,” FizikaTverdogo Tela, vol. 15, no. 9, pp. 2827–2878, 1973.
[61] P. V. Ionov, V. V. Voronov, and V. T. Gabrielyan, “Detectionof photoinduced change of refraction in ferroelectric leadgermanate,” Fizika Tverdogo Tela, vol. 17, no. 4, pp. 1144–1146, 1975.
[62] V. M. Fridkin, B. N. Popov, and K. A. Verkhovskaya, “Photo-voltaic and photorefractive effects in ferroelectrics of kdp-group,” Fizika Tverdogo Tela, vol. 20, no. 4, pp. 1263–1265,1978.
[63] B. K. Ponomarev and B. S. Red’kin, “Fluctuations of the piezo-acoustic impedance in gadolinium molybdate near the curietemeprature,” Fiz. Tverd. Tela, vol. 49, pp. 1260–1264, 2007.
[64] “IRE standards on piezoelectric crystals,” Proceedings of the IR,vol. 49, no. 7, pp. 1161–1169, 1961.
[65] K. S. van Dyke, “The piezo-electric resonator and its equiv-alent network,” Proceedings of the IRE, no. 16, pp. 742–764,1928.
[66] L. Bergmann, Der Ultraschall und seine Anwendung in Wis-senschaft und Technik, Zurich, Switzerland, 1954.
[67] I. A. Yakovlev and T. S. Velichkina, “Two new phenomena atphase transitions of second type,” Uspekhi Fizicheskikh Nauk,vol. 63, no. 10, pp. 411–433, 1957.
Hindawi Publishing CorporationPhysics Research InternationalVolume 2012, Article ID 861690, 8 pagesdoi:10.1155/2012/861690
Research Article
Influence of Magnesium Substitution on Thermal andElectrical Properties of NiCuZn Ferrites for MicroinductorCore Applications
M. Venkata Ramana,1, 2 N. Ramamanohar Reddy,1 and K. V. Siva kumar1
1 Nanotechnology Laboratory, Department of Metallurgical and Materials Engineering, Indian Institute of Technology, Tamil Nadu,Chennai 600 036, India
2 Ceramic Composite Materials Laboratory, Department of Physics, Sri Krishnadevaraya University, Ananthapur 505 003, India
Correspondence should be addressed to M. Venkata Ramana, [email protected]
Received 22 July 2011; Revised 7 January 2012; Accepted 12 January 2012
Academic Editor: Arcady Zhukov
Copyright © 2012 M. Venkata Ramana et al. This is an open access article distributed under the Creative Commons AttributionLicense, which permits unrestricted use, distribution, and reproduction in any medium, provided the original work is properlycited.
Two series of NiMgCuZn ferrites, that is, (1) NixMg0.6−xCu0.1Zn0.3Fe2O4 and sample G: Ni0.3Mg0.3−yCu0.1Zn0.5−yFe2O4 withx = 0.0, 0.1, 0.2, 0.3 and (2) NixMg0.6−xCu0.1Zn0.3Fe2O4 with y = 0.0, 0.1, 0.2 were synthesized and prepared by conventionalceramic double-sintering process and to use them as core materials for microinductor applications. The formation of single phasewas confirmed by X-ray diffraction. The temperature and compositional variation of DC, AC electrical conductivities (σ) andthermoelectric power (α) were studied on these two series of polycrystalline ferrospinels. The studies were carried out in widerange of temperature from 30 to 350◦C. On the basis of thermoelectric study, the ferrites under present work were found to beshown as n-type and p-type transition. The electrical conduction in these ferrospinels is explained in the light of polaron hoppingmechanism. These ferrite compositions have been developed for their use as core materials for microinductor applications.
1. Introduction
The polycrystalline NiMgCuZn soft ferrites are suitable forcore materials in microinductor applications. In view ofthe extensive applications of NiCuZn ferrite [1–4], it iseconomical to replace nickel with magnesium and achievedesirable properties in NiMgCuZn ferrites. MgCuZn ferriteis a pertinent magnetic material suitable for high-frequencyapplications owing to its properties like high resistivity, fairlyhigh Curie transition temperature, environmental stability,and low cost [5–8]. In the present investigation two seriesof NiMgCuZn ferrospinels were prepared, their temperatureand compositional dependence of electrical properties likeDC, AC electrical conductivities and Seebeck coefficientwere studied, and the results were reported along with theconduction mechanism.
2. Experimental Procedure
2.1. Materials and Methods. Two series of soft ferrite com-positions having the chemical formulas: (i) NixMg0.6−xCu0.1Zn0.3Fe2O4, where x = 0.0, 0.1, 0.2, 0.3 and (ii)Ni0.3Mg0.3−yCu0.1Zn0.5−yFe2O4, where y = 0.0, 0.1, 0.2 wereprepared employing analytical grade NiO, MgO, CuO, ZnO,and Fe2O3. These constituents were ball milled (Retsch PM-200, Germany) in acetone medium for 10 h and dried inan oven. These dried powders were calcined in the formof cakes in closed alumina crucibles at 800◦C for 4 h. Afterpresintering, these cakes were crushed and ball milled onceagain to obtain fine particles, and finally these powders weresieved to get uniform particle size. The presintered greenpowders were mixed with 2% PVA as a binder and werecompacted in the form of pellets of 1.2 cm diameter and2 mm thickness at 150 MPa. These compacted bodies were

2 Physics Research International
finally sintered at 1250◦C for 2 h using a programmablefurnace and were cooled to room temperature at the rate of80◦C/hr. Sufficient care was taken to avoid zinc loss duringthe sintering process. All the samples were structurallycharacterized using Philips high-resolution X-ray diffractionsystem PM1710 with Cu Kα radiation.
2.2. Experimental Details. DC electrical conductivity mea-surements were carried out by a cell having guard ring facilityin addition to the two probes [9]. Silver paste (Du Pont)was applied to both the surfaces of the pellet to obtain goodohmic contacts. The measurements of conductivity weremade by applying a constant voltage of 2 V from a regulatedpower supply, in the temperature range 30 to 350◦C. Theelectrical conductivity (σDC) of NiMgCuZn ferrites underinvestigation has been computed using the relation
σ =(It
VA
), (1)
where I is the current passing through the specimen, V isthe voltage applied to the specimen, t is the thickness of thesample, and A denotes the area of cross-section of the sample.The Curie transition temperature Tc of the samples wasdetermined by magnetic permeability measurements [10].Thermoelectric power (Seebeck coefficient) measurementswere carried out in the temperature region 30 to 350◦Cby differential method similar to that of Reddy et al. [11]with a few modifications. A temperature difference of ΔT =10 K was maintained across the sample with the help of amicrofurnace fitted to the sample holder assembly. Temper-atures of both the surfaces of the pellet were measured withprecalibrated chromel-alumel thermocouples. The Thermo-electric power “α” was measured from the relation
α = ΔV
ΔT. (2)
Following convention adopted by Lal et al. [12] the positivesign indicates negative charge carriers and vice versa.
The AC conductivity, σAC of these ferrites were evaluatedfrom the dielectric measurements (ε′ and loss tangent, tan δ),carried out at 1 kHz employing a computer-controlled low-frequency impedance analyzer (Hioki 3532-50 LCR Hi Tester,Japan) using the standard formulae in the temperature range30 to 350◦C. In order to understand the electrical conductionmechanism, the dielectric measurements were carried outin the frequency region 100 Hz to 1 MHz and σAC that wasevaluated.
3. Results and Discussion
Table 1 gives the details of various oxides present in thetwo series of NiMgCuZn ferrites in mole percent. TypicalXRD patterns of one sample each from the two series ofNiMgCuZn ferrites (samples—B and G) are presented inFigure 1. X-ray analysis of these ferrite samples reveals thesingle-phase spinel structure. The lattice parameters of theseferrites were calculated from d-spacings. The variation oflattice parameter with the composition in these two series of
Table 1: Composition of various components of NiMgCuZnferrites in mole percent.
S. No. Sample NiO MgO CuO ZnO Fe2O3
Series 1
(1) A 0 30 5 15 50
(2) B 5 25 5 15 50
(3) C 10 20 5 15 50
(4) D 15 15 5 15 50
Series 2
(5) E 15 5 5 25 50
(6) F 15 10 5 20 50
(7) G 15 15 5 15 50
Series 1: A: Mg0.6Cu0.1Zn0.3Fe2O4, B: Ni0.1Mg0.5Cu0.1Zn0.3Fe2O4,C: Ni0.2Mg0.4Cu0.1Zn0.3Fe2O4, D: Ni0.3Mg0.3Cu0.1Zn0.3Fe2O4.Series 2: E: Ni0.3Mg0.1Cu0.1Zn0.5Fe2O4, F: Ni0.3Mg0.2Cu0.1Zn0.4Fe2O4, andG: Ni0.3Mg0.3Cu0.1Zn0.3Fe2O4.
samples is given in Table 2. It can be observed from Table 2that, in a given series, the lattice parameter is found toincrease. The ionic radii of ions are Ni2+ = 0.72 A, Mg2+ =0.65 A, Cu2+ = 0.72 A, Zn2+= 0.74 A, and Fe2+ = 0.64 A,respectively. The increasing trend of lattice constant in thetwo series of ferrites is attributed to the presence of Mg ionhaving a low ionic radius. The densities of the samples arepresented in Table 2. In series 1 and 2 it can be noticed thatwhen the nickel or magnesium concentrations are increasedin the ferrites, the magnitude of density also increases.
The room temperature values of DC, AC conductivitiesand Seebeck coefficients for the two series of the ferrospinelsstudied in the present work are also presented in Table 2 forcomparison.
The variation of DC conductivity (log σDC) with temper-ature is shown in Figures 2(a) and 2(b), and the variationof σDC with composition at room temperature is shown inFigure 2(c), for the series 1 and 2, respectively. The variationof DC conductivity with increase of temperature is almostlinear in all the ferrites and shows a change of slope near100 to 130◦C. However, in all the ferrites studied in thepresent work, no slope change is noticed at Curie transitiontemperature. The activation energies are calculated from thefollowing formula:
σ = σ0 exp(−EDC
kT
), (3)
where EDC is the activation energy, k is the Boltzmann con-stant, and T is the absolute temperature.
The activation energies in two regions calculated fromthe least square analysis of the data are given in Table 3.
An examination of data presented in Table 3 shows that,in sample A (sample without nickel) of series 1, the magni-tudes of DC conductivity are high, and activation energy isfound to be low compared to other ferrite samples. How-ever, the addition of nickel decreases the conductivity andincreases the activation energy in sample B. Further raise innickel concentration in series 1 saturated the magnitudes ofconductivity and decreased activation energies. In series 2

Physics Research International 3
Sample B
400
200
0
20 30 40 50 60 70
Cou
nts
(111
)
(220
)
(311
)(2
22) (4
00) (422
)
(511
)
(440
)
(620
)
(533
)(6
22)
Sample B
(111
)
(220
((()
(311
)(2
22) (4
00) (422
)
(511
)
(440
)
(620
)
(533
)(6
22)
Position 2 (◦)
(a)
(211
)
Sample G
(220
)
(311
)(2
22)
(400
)
(422
)
(511
)
(440
)
(620
)
400
100
300
200
0
20 30 40 50 60 70
Cou
nts
(211
)
Sample G
(220
)
(311
)(2
22)
(400
)
(422
)
(511
)
(440
)
(620
)
Position 2 (◦)
(b)
Figure 1: X-ray diffractograms of sample B: NixMg0.6−x Cu0.1Zn0.3Fe2O4 and sample G: Ni0.3Mg0.3−y Cu0.1Zn0.3−y Fe2O4.
Table 2: Values of AC, DC conductivities and Seebeck coefficient at room temperature.
S. No. Sample Lattice parameter ´A Density kg·m−3 σDC at RT Ω−1 Cm−1 σAC at RT Ω−1 Cm−1 Seebeck coefficient αμV/K
(1) A 8.374 4.267 7.467 × 10⁻⁵ 1.799 × 10⁻⁴ −79.55
(2) B 8.274 4.442 5.676 × 10⁻⁷ 2.247 × 10⁻⁶ 2168
(3) C 8.255 4.665 4.425 × 10⁻⁶ 8.475 × 10⁻⁶ 1966
(4) D 8.234 5.321 2.755 × 10⁻⁶ 2.292 × 10⁻⁶ 1586
(5) E 8.260 4.498 3.790 × 10⁻⁶ 3.958 × 10⁻⁶ 4830
(6) F 8.252 4.534 2.729 × 10⁻⁶ 2.446 × 10⁻⁶ 1741
(7) G 8.234 5.321 2.755 × 10⁻⁶ 2.292 × 10⁻⁶ 1586
Table 3: It shows the activation energies of DC conductivity atroom temperature.
S. No. Sample Tc (◦C)Activation energies of σDC (ev)
IR ER �E
(1) A 230 0.599 0.141 0.458
(2) B 270 1.025 0.726 0.298
(3) C 290 1.026 0.467 0.559
(4) D 300 1.113 0.386 0.727
(5) E 210 0.855 0.536 0.319
(6) F 280 1.008 0.428 0.580
(7) G 300 1.113 0.386 0.727
IR: Intrinsic region, ER: Extrinsic Region, and Tc: Curie temperature.
with increase of magnesium and decrease of zinc contents,the activation energies increased in the intrinsic region whilethere is a decreasing trend of activation energy in extrinsicregion. In series 1 as the nickel concentration is increased,the resistivity first increases and there after it decreases. Thismay be attributed to the fact that at low concentrations nickelexists in Ni2+ state, and it prefers A-site occupation. If theconcentration of nickel is increased, Ni2+ converts into Ni3+
and goes to B sites due to their ionic sizes. However, sincethe copper concentration is maintained low, its contributionmay be negligible. In series 2 the zinc concentration is morecompared to series 1. Moreover, zinc ion has strong A-sitepreference. Due to the preferential occupation of zinc ionsin A site it forces the nickel ions to occupy B sites. In viewof this the conductivity increases in series 2. It can also benoticed from Table 3 that, in general, the activation energies
of intrinsic region are larger than the activation energiesof the extrinsic region. Generally the electric conductivityis controlled by the migration of charge species under theinfluence of electric field and by the defect ion complexes,the polarization field, the relaxations, and so forth. At lowertemperatures the defect ion complexes, grain boundaries alsocontribute to the conduction mechanism. The activationenergy is less in this region (i.e., extrinsic region). At high-temperatures the charge species may not be subjected to anyinternal field. The defect ion complexes tend to dissociate.The activation energy in the high-temperature region maybe the migration energy for the charges.
AC conductivity σAC was evaluated from the data ofdielectric constant (ε′) and loss, tan δ using the relation
σAC = ε′εoω tan δ, (4)
where εo is the vacuum permittivity and ω the angularfrequency.
The plots of AC conductivity (log σAC) with reciprocaltemperature are shown in Figures 3(a) and 3(b), and thevariation of σAC with composition at room temperature isshown in Figure 3(c). It can be noticed from the figuresthat there are peak-like regions which indicate the Curietransition temperatures of the corresponding ferrite samples.Electrical conductivity studies on transition metal oxides[13], rare earth oxides [14–16], indicted polaron conductionmechanism through hopping.
In the first series of ferrites, namely, (samples A, B,C, and D) the nickel concentration is increased whilethe magnesium concentration is decreased keeping copperand zinc fixed. The variation of AC conductivity (log σAC)

4 Physics Research International
1.6 2 2.4 2.8 3.2
0.01
Sample A Sample B
Sample C
Sample D
1E−6
1E−5
1E−4
1E−3
1000/T (K−1)
log
DC
(a)
Sample E Sample F Sample G
1000/T (K−1)
0.01
1E−5
1E−4
1E−3
log
DC
1.5 1.8 2.1 2.4 2.7 3 3.3
(b)
DC
DC
×10−5 ×10⁻⁷
0 0.05 0.1 0.15 0.2 0.25 0.3
0
1
2
3
4
5
Series 1 Series 2
Sample
26
28
30
32
34
36
38
(c)
Figure 2: (a) Variation of log σDC with the T−1 for series 1. (b) Variation of log σDC with the T−1 for series 2. (c) Variation of log σDC withcomposition at room temperature.
with inverse temperature in these ferrites at the roomtemperature can be noticed from the figures that as the nickelconcentration in the ferrite increases, the conductivity is lowand found to be more with the addition of nickel in sampleB further decreasing with increase of nickel content in series1. However, the conductivity of series 2 is decreasing whenmagnesium and zinc concentration in the ferrite is variedkeeping nickel and copper constant. The activation energyin the series 1 is found to be increasing in both paramagneticand ferromagnetic region. While in series 2 it is decreasing in
both the regions, it may also be noted that activation energiesvary from 0.1 to 1.1, and a high activation energy goes handin hand with a low conductivity of the ferrites as shown bySamokhralov and Rustmov [17].
Conduction by polarons is discussed by several workers[18–20]. Polarons are of two types: large and small polarons.In the large polaron model, the conductivity is by bandmechanism at all temperatures, and the AC conductivitydecreases with frequency. The small polarons conduct inband-like manner up to a certain temperature, and the

Physics Research International 5
1.5 2 2.5 3 3.5
Sample A Sample B
Sample C Sample D
−6
−5
−4
−3
−2
−1
0
log
AC
1/T (K−1)
(a)
2 2.2 2.4 2.6 2.8 3 3.2 3.4
Sample E Sample F Sample G
−6
−5
−4
−3
−2
−1
0
1
1000/T (K−1)
(b)
0 0.05 0.1 0.15 0.2 0.25 0.3
Sample
Series 1Series 2
−6
−5.5
−5
−4.5
−4
−3.5
(c)
Sample A Sample C Sample E
105 107 109 1011 1013
−7
−6.5
−6
−5.5
−5
−4.5
−4
−3.5
−3
log
(−
DC
)
2
(d)
Figure 3: (a) Variation of log σ(AC) with T−1 for series 1. (b) Variation of log σ(AC) with T−1 for series 2. (c) Variation of log σ(AC) withcomposition at room temperature. (d) Plots of log σ(AC-DC) with log ω2 one sample from each series.
conductivity shows an increase with frequency. At highertemperatures, the conduction is by thermally activated hop-ping mechanism. For small polaron model the conductionincreases with the frequency, and follows the relation
σω − σDC = ω2τ2
(1 + ω2τ2), (5)
where ω is the angular frequency, and τ is the staying time(∼10−10) for the frequencies ω2τ2 < 1. log(σω − σDC) versuslog ω2 that should be a straight line. Plot of log(σω − σDC)as a function of log ω2 at room temperature for three typical
sample is shown in Figure 3(d). It can be seen that in the plotthere are regions of decreasing, increasing of log(σω − σDC)with increasing frequency. It is not conformation to equation(5). It can be stated that in the present series of ferrospinelsamples the results tend to indicate that the conductionmechanism is due to mixed polaron hopping.
The variation of thermoelectric power with the tempera-ture in the low- and high-temperature regions for two seriesof ferrites are shown in Figures 4(a) and 4(b), and variationat room temperature value can be observed in Figure 4(c).The thermoelectric voltage ΔV developed across the pellet

6 Physics Research International
0 50 100 150 200 250 300 350 400 450
0
5
10
15
20
25
Temperature
Sample A Sample B
Sample C
Sample D
−15
−10
−5
(a)
0 50 100 150 200 250 300 350 400
0
10
20
30
40
50
60
Temperature
Sample E Sample F Sample G
−10
(b)
0 0.05 0.1 0.15 0.2 0.25 0.3
0
5
10
15
20
25
30
35
40
45
50
55
60
Series 1Series 2
Series 1
Series 2
Sample
(c)
Figure 4: (a) Variation of the Seebeck coefficient with temperature for series 1. (b) Variation of the Seebeck coefficient with temperature forseries 2. (c) Variation of Seebeck coefficient at room temperature for the two series of ferrites.
has a temperature gradient, and ΔT is shown as α = ΔV/ΔT.The positive sign of α indicates negative charge carriers andvice versa.
It can be seen from Table 2, at room temperature theSeebeck coefficient of pure magnesium copper zinc ferrite(i.e., Sample A) shows negative sign, and with the additionof nickel the Seebeck coefficient α has increased showing thatpositive sign further increase of nickel composition leads tothe reduction of α value. While in the series 2, the sign ofthe Seebeck coefficient at room temperature is negative onlyfor the samples and decreases with increase of magnesium.However, it can be seen that the copper concentration is kept
in concentration in both series. With the addition of nickelconcentration, the thermoelectric power shows positive signshowing that from majority carriers n-type semiconductorsit can be observed that as the temperature increases theSeebeck coefficient sign that shows positive sign, as such itbehaves n-type and p-type semiconductors both the series1 and 2 the same is observed. The temperature dependenceof Seebeck coefficient (α) for the ferrites is satisfactorilydescribed by the formula [21]
α = A +(B
T
), (6)
where A and B are constants, and T is the temperature in K.

Physics Research International 7
It can be seen from Table 2 that the sign of the Seebeckcoefficient is transition from n-type and p-type semicon-ductors for all the ferrites on the basis of sign that theNi substituted MgCuZn ferrites have been classified as n-type and p-type semiconductors. Thus, the conductionmechanism in these ferrites is predominantly due to hoppingof electrons [22] from Fe2+ to Fe3+ ions
Fe3+ + e ⇐⇒ Fe2+. (7)
Ravinder [23] carried out the work and reported that theSeebeck coefficient is decreasing when nickel is increased,and this in turn leads to decrease in Zinc composition. Allthe mixed Ni-Zn ferrites are positive, and it shows thatthe majority of the charge carriers are holes. The presenceof nickel on the octahedral sites favours the conductionmechanism [24]
Ni2+ + Fe3+ ⇐⇒ Ni3+ + Fe2+. (8)
The conduction mechanism in p-type samples is predomi-nantly due to hole transfer from
Ni2+ to Ni2+ ions : Ni2+ + h ⇐⇒ Ni3+. (9)
It can be observed that Seebeck coefficient α is foundto be decreasing in all the ferrites. Except in sample A it isincreasing up to sample B and then starts decreasing due tothe addition of nickel. All our results show good agreementwith data from the literature.
4. Conclusions
The polycrystalline NiMgCuZn ferrite samples were pre-pared by the conventional method. X-ray diffraction patternsreveal the single phase spinel structure. The DC, AC andthermoelectric (Seebeck) coefficient was measured for theseferrospinels. The temperature variation of DC conductivityof series 1 indicates that the σDC is high and activation energyis low. In series 2, the activation energy is decreasing inextrinsic regions and increasing at the intrinsic region withincreasing and decreasing of magnesium and zinc contentin the present studied ferrites. The AC conductivity of theseferrites was calculated from the dielectric measurements. Itindicates that the conduction mechanism is due to mixedpolaron hopping. The temperature dependence of Seebeckcoefficient of this ferrites is showing p-type and n-typesemiconductor behavior.
Acknowledgments
This research was financially supported by Defence Researchand Development Organization, (DRDO) under GrantsERIP/ER/0103301/M/1 dated 09.01.2002, New Delhi, India.The authors are thankful to Prof. A. Varadarajulu, Depart-ment of Polymer Science and Technology, Sri Krishnade-varaya University, Anantapur, A.P, India for valuable discus-sions in the preparation of the manuscript.
References
[1] C. G. Koops, “On the dispersion of resistivity and dielectricconstant of some semiconductors at audiofrequencies,” Physi-cal Review, vol. 83, no. 1, pp. 121–124, 1951.
[2] G. Moltgen, “Dielectric analysis of ferrites,” Zeitschrift furAngewandte Physik, vol. 4, pp. 216–224, 1952.
[3] K. Iwauchi, “Dielectric properties of fine particles of Fe3O4
and some ferrites,” Japanese Journal of Applied Physics, vol. 10,pp. 1520–1528, 1971.
[4] L. G. Van Uiteret, “Dielectric properties of and conductivity inferrites ,” Proceedings of the IRE , vol. 44, no. 10, pp. 1294–1303,1956.
[5] N. Rezlescu, E. Rezlescu, P. D. Popa, M. L. Craus, and L.Rezlescu, “Copper ions influence on the physical properties ofa magnesium-zinc ferrite,” Journal of Magnetism and MagneticMaterials, vol. 182, no. 1-2, pp. 199–206, 1998.
[6] N. Rezlescu, L. Sachelarie, L. Rezlescu, and P. D. Popa,“Influence of PbO and Ta2O5 on some physical properties ofMgCuZn ferrites,” Crystal Research and Technology, vol. 36, no.2, pp. 157–167, 2001.
[7] L. Sachelarie, E. Rezlescu, and N. Rezlescu, “Influence of PbOon some properties of MgCuZn ferrites,” Physica Status Solidi,vol. 179, no. 1, pp. R1–R3, 2000.
[8] D. N. Bhosale, N. D. Choudhari, S. R. Sawant, and P. P.Bakare, “Initial permeability studies on high density Cu-Mg-Zn ferrites,” Journal of Magnetism and Magnetic Materials, vol.173, no. 1-2, pp. 51–58, 1997.
[9] V. R. K. Murthy and J. Sobhanadri, “Electrical conductivity ofsome nickel-zinc ferrites,” Physica Status Solidi, vol. 38, no. 2,pp. 647–651, 1976.
[10] N. Varalaxmi, M. VenkataRamana, N. Ramamanohar Reddy,G. Rajitha, K. V. Sivakumar, and V. R. K. Murthy, in Elasticbehavior and internal friction of ferrospinels, 2006.
[11] V. D. Reddy, M. A. Malik, and P. V. Reddy, “Electrical transportproperties of manganese-magnesium mixed ferrites,” Materi-als Science and Engineering B, vol. 8, no. 4, pp. 295–301, 1991.
[12] H. B. Lal, B. K. Verma, and V. Ram Yadav, “Electrical transportin heavy rare-earth iron garnets,” Journal of Materials Science,vol. 17, no. 11, pp. 3317–3326, 1982.
[13] D. Adler and J. Feinleib, “Electrical and optical properties ofnarrow-band materials,” Physical Review B, vol. 2, no. 8, pp.3112–3134, 1970.
[14] G. V. S. Rao, S. Ramdas, P. N. Mehrotra, and C. N. R. Rao,“Electrical transport in rare-earth oxides,” Journal of SolidState Chemistry, vol. 2, no. 3, pp. 377–384, 1970.
[15] H. B. Lal, B. K. Verma, and N. Dar, “On the ElectricalTransport and Dielectric Properties of Heavy Rare–EarthSesquioxides,” Indian Journal of Cryogenics, vol. 1, pp. 119–126, 1976.
[16] H. B. Lal and N. Dar, “Magnetic susceptibility, electrical con-ductivity and dielectric constant of Er2O3,” Indian Journal ofPure and Applied Physics, vol. 14, pp. 788–795, 1976.
[17] A. A. Samokhralov and A. G. Rustmov, Soviet Physics, SolidState, vol. 7, p. 961, 1965.
[18] J. Appel, in Solid State Physics, F. Seitz, D. Turnbull, and H.Ehrenreich, Eds., vol. 21, pp. 193–391, Academic press, NewYork, USA, 1968.
[19] I G. Austin and N. F. Mott, “Polarons in crystalline and non-crystalline materials,” Advances in Physics, vol. 18, no. 71, pp.41–102, 1969.
[20] N. F. Mott and E. A. Davis, Phonons and Polarons in ElectronicsProcessing in Non Crystalline Materials, Clarendon Press,Oxford, UK, 1971.

8 Physics Research International
[21] S. S. Flaschen and L. G. Van Uitert, “New low contact resis-tance electrode,” Journal of Applied Physics, vol. 27, no. 2, p.190, 1956.
[22] L. G. Van Uitert, “Dc resistivity in the nickel and nickel zincferrite system,” The Journal of Chemical Physics, vol. 23, no. 10,pp. 1883–1887, 1955.
[23] D. Ravinder, “Electrical properties of zinc substituted nickelferrites,” Indian Journal of Physics, vol. 74, no. 3, pp. 331–333,2000.
[24] J. Smit and H. P. J. Wijn, Ferrites, Cleaver, London, UK, 1959.

Hindawi Publishing CorporationPhysics Research InternationalVolume 2012, Article ID 416717, 4 pagesdoi:10.1155/2012/416717
Research Article
Improvement of Thermal Stability of Nd-Tb-Fe-Co-B SinteredMagnets by Additions of Pr, Ho, Al, and Cu
A. A. Lukin,1 E. I. Il’yashenko,2 A. T. Skjeltorp,3 and G. Helgesen3
1 Research and production Company “Magnets and Magnetic Systems” Ltd., 127238 Moscow, Russia2 Department of Physics, Moscow State University, 117234 Moscow, Russia3 Institute for Energy Technology, Kjeller and University of Oslo, 2027 Kjeller, Norway
Correspondence should be addressed to E. I. Il’yashenko, [email protected]
Received 29 July 2011; Revised 26 January 2012; Accepted 29 January 2012
Academic Editor: Arcady Zhukov
Copyright © 2012 A. A. Lukin et al. This is an open access article distributed under the Creative Commons Attribution License,which permits unrestricted use, distribution, and reproduction in any medium, provided the original work is properly cited.
The present work investigates the influence of Pr, Al, Cu, B and Ho which were introduced into the Co-containing sintered magnetsof Nd-Dy-Tb-Fe-Co-B type on the magnetic parameters (α, iHc, Br , BHmax). The effect of heat treatment parameters on magneticproperties was also studied. It was revealed that the essential alloying of NdFeB magnets by such elements as Dy, Tb, Ho, Co aswell as by boron-forming elements, for example, by titanium, may lead to reducing of F-phase quantity, and, as a consequence, todecreasing of magnetic parameters. It was also shown that additional doping of such alloys by Pr, B, Al and Cu leads to a significantincrease of the quantity of F-phase in magnets as well as solubility of the Dy, Tb, Ho and Co in it. This promotes the increase ofmagnetic parameters. It was possible to attain the following properties for the magnets (Nd0,15Pr0,35Tb0,25Ho0,25)15(Fe0,71Co0,29)bal·Al0,9Cu0,1B8,5 (at. %) after optimal thermal treatment {1175 K (3,6–7,2 ks) with slow (12–16 ks) cooling to 675 K and subsequentlyremaining at T = 775 K for 3,6 ks—hardening}: Br = 0, 88 T, iHc = 1760 kA/m, BHmax = 144 kJ/m3, α < |0, 01|%/K in thetemperature interval 223–323 K.
1. Introduction
High-energy (the maximum energy product, BHmax >400 kJ/m3) and high-coercive (intrinsic coercivity, iHc >2400 kA/m) sintered permanent magnets can be producednow on the base of Nd2Fe14B compound [1]. However, thesemagnets are significantly inferior to such materials as alnico,Sm2(Co,Fe,Cu,Zr)17, and SmCo5 in reversible magneticlosses, which are characterized by remanence temperaturereversible coefficient {α = (ΔBr/Br · ΔT) · 100%/K, whereis Br—remanence}.
Some improvement of this parameter is possible toachieve when replacing some Fe atoms by Co and someNd ones by Dy (Tb). For example, α = −0.06%/K in thetemperature interval 295–375 K was attained on the sinteredmagnets of {Nd0,8(Dy,Tb)0,2}15-16(Fe0,8Co0,2)bal · B6-8 typeafter heat treatment {remaining at T = 1175 K for 7.2kilosecond (ks) followed by the cooling with the rate of 0.01-0.02 K/s down to 575–705 K and duration at this temperaturefor 3.6 ks} [2–5].
Experimental saturation magnetization temperaturedependences for single-phase compound of (Nd1-xR∗x )2
(Fe1-yCoy)14B, where R∗—Dy, Tb, Gd, and Ho are available[6–8]. It follows from these dependencies that for attainingnear-zero α coefficient values in the operation temperatureinterval (295–375 K, in some case 225–425 K), it is necessarythat x and y values should be 0.4-0.5 and 0.2-0.3 correspond-ingly.
However, if the content of R∗ and Co is more than7,5 at.% (x > 0, 2) and 15 at.% (y > 0, 2) in the alloy of(Nd1-xR∗x )15-16(Fe1−yCoy)bal·B6-8 type, regularities observedfor the single-phase compound no further hold true: whileα coefficient shows no further changes, Br and iHc decreasewith the speed higher than that observed for the single-phase compound. This makes impossible to achieve near-zero α coefficient value and optimal Br and iHc parameters[2]. It was explained [2] by phase equilibrium shiftingresulting in new additional phases of (Nd,R∗)(Fe,Co,B)2,(Nd,R∗)(Fe,Co)4B and other types [9–11] formation and

2 Physics Research International
decreasing of (Nd,R∗)2(Fe,Co)14B phase quantity whenthe alloy is doped by R∗ and Co.
On the other hand, similar regularity of Nd2Fe14Bphase quantity decreasing and no further iHc rising atthe increasing of dysprosium (terbium) in the alloy wereobserved in {Nd0,8(Dy,Tb)0,2}15-16(Fe,Ti,Nb)bal · B6-7 typealloys. It was shown that doping of these alloys by Pr, Al,Cu as well as increasing of the boron content up to 8-9 at.%makes it possible to overcome this negative effect [2].
That is why the purpose of the present work was toinvestigate the influence of Pr, Al, Cu, B, and Ho introducinginto the Co-containing sintered magnets of Nd-Dy-Tb-Fe-Co-B type on the magnetic parameters (α, iHc, Br ,BHmax). The effect of heat treatment parameters on magneticproperties was also studied.
2. Experimental Procedure
Alloys of the (Nd,Pr,Tb,Dy,Ho)12,5-17,0(Fe,Co,Al,Nb,Ti,Cu)bal·B5,5-8,5 (at.%) type were prepared by vacuum-induction melting. Magnets were prepared using aconventional pattern [2]. Heat treatments in the 500–1275 K temperature interval were implemented for theselecting of the optimum schedule for the certain chemicalcomposition alloy.
Investigations of remagnetization processes and mag-netic properties evaluations were implemented with the helpof hysteresisgraph and vibrating magnetometer. Chemicaland phase composition of the alloys were controlled by aplasma emission spectrum method, local X-ray spectrumanalysis, X-ray diffraction analysis, and Mossbauer’s effectanalysis according to procedures described in [2].
3. Experimental Results and Discussion
Figure 1 demonstrates demagnetizing parts of hysteresisloops of sintered magnets with the following chemical com-positions: (Nd0,3Pr0,5Dy0,2)15(Fe0,8Co0,2)bal·Al0,2Bz, where zis 5,3 (1, iHc= 980 kA/m), 6,3 (2, iHc = 1070 kA/m),7,3 (3, iHc = 1190 kA/m), 8,3 (4, iHc = 1250 kA/m) atroom temperature. The optimal heat treatment schedulesfor these magnets were the following: 1175–1275 K , 3,6 kswith subsequent quenching in inert gas (z = 5,3–7,3) and1175 K, 3,6 ks + slow cooling (10–12 ks) + 900 K, 3,6 ks withsubsequent quenching in inert gas (z = 8,3). Significant iHc
increasing is observed with the z raising from 5,3 up to 8,3.At the same time quadratility Hk (demagnetization field thatreduces the intrinsic magnetization by 10%) of the curve wasalso improving.
Figure 2 demonstrates the dependences of iHc onthe heat treatment temperature for the (Nd0,25Pr0,4
Dy0,35)15(Fe0,72Co0,28)bal·Al0,2B7,5 chemical composition.The upper curve reflects the results of the experimentswhen the samples were exposed to teat treatment only atsome given temperature in the 675–1275 K interval witha 50 K step. Lower curve demonstrates the case wheneach sample was exposed to multistep heat treatmentstarting from 1275 K for 3,6 ks with the sequential
H (kA/m)
0.8
0.6
0.4
0.2
00
1
−300−600−900−1200−1500
1234
B(T
)
Figure 1: Demagnetizing parts of hysteresis loops of the magnets:(Nd0,3Pr0,5Dy0,2)15(Fe0,8Co0,2)bal·Al0,2Bz, where z is 5,3 (1, iHc =980 kA/m), 6,3 (2, iHc = 1070 kA/m), 7,3 (3, iHc = 1190 kA/m), 8,3(4, iHc = 1250 kA/m).
13501300125012001150110010501000
950900
600 800 1000 1200T (K)
iHc
(kA
/m)
Figure 2: Dependences of iHc of (Nd0.25Pr0.4Dy0,35)15
(Fe0,72Co0,28)bal·Al0,2B7,5 magnets on the heat treatment temper-ature for the single (upper curve) and multistep heat treatment inthe temperature 1275 K–675 K interval.
reducing of the temperature down to 675 K (intervalbetween stages was 50 K; endurance on the each stagewas 3,6 ks). The value of iHc was measured after the eachstage. As can be seen from Figure 2, minimum of iHc onupper curve corresponds to 975 K, while for the lowercurve monotonous decreasing of iHc from 1320 kA/m(1275 K) down to 960 kA/m (675 K) is observed. Analogousregularities are observed for chemical compositions{(Nd0,35Pr0,65)1-xDyx)}15(Fe1−yCoy)bal·Al0,2B7,5 (at.%), x =0,3-0,4, y = 0,22–0,30.
Higher level of magnetic properties (Br = 0,88 T, iHc =1760 kA/m, magnetic field energy BHmax = 144 kJ/m3,α < |0, 01|%/K in temperature interval 223–323 K) wasobtained on sintered magnets with chemical composition(Nd0,15Pr0,35Tb0,25Ho0,25)15(Fe0,71Co0,29)bal·Al0,9Cu0,1B8,5 aft-er the optimal heat treatment: 1175 K (3,6–7,2 ks) with slow(12–16 ks) cooling to 675 K and subsequently remainingat T = 775 K for 3,6 ks—hardening. Demagnetizing curvesat various temperatures (from 293 K to 423 K) and thetemperature iHc dependence for the multistep heat treatmentstarting from 1175 K to 675 K with 3,6 ks endurance on theeach stage are presented on Figures 3 and 4, respectively.The other part of the samples was continuously cooled from1175 K to 675 K. Time of cooling was equal to the totalendurance time during multistep heat treatment.

Physics Research International 3
0.8
0.6
0.4
0.2
0
1
0−500−1000−1500−2000
H (kA/m)
1 2 3
B(T
)
Figure 3: Demagnetizing parts of hysteresis loops of the magnets(Nd0,15Pr0,35Tb0,25Ho0,25)15(Fe0,71Co0,29)bal·Al0,9Cu0,1B8,5 at the tem-peratures 293 K (1, iHc = 1600 kA/m), 373 K (2, iHc = 920 kA/m),423 K (3, iHc = 550 kA/m).
600 800 1000 1200 1400T (K)
1700
1600
1500
1400
1300
1200
1100
1000
iHc
(kA
/m)
Figure 4: Temperature iHc dependence of (Nd0,15Pr0,35Tb0,25
Ho0,25)15(Fe0,71Co0,29)bal·Al0,9Cu0,1B8,5 magnets after multistep heattreatment (1175 K to 675 K).
It was noted that there is no significant difference in iHc
values between continuous and multistep changing of thetemperature during heat treatment. Only total endurancetime in the studied temperature interval is important. As arule, it should be not less than 10 ks. Significant reductionof iHc by 20–30% from the optimal value is observed at therapid cooling (e.g., at the quenching in inert gas).
On the next stage we investigated the properties ofthe magnets additionally doped by titanium as it isknown that this element increases iHc in Nd15Febal·B8
magnets [2]. For the magnets (Nd0.15Pr0.35Tb0.25Ho0.25)15
(Fe0.71Co0.29)bal·Al0,9Cu0.1Ti0.7-1.4B8.5, the reduction of iHc
down to 1280–1360 kA/m occurs. The optimal heat treat-ment was revealed to be the high temperature at 1275 Kwith subsequent quenching down to the room temperature.Similar regularities were also observed for the alloy doped byNb.
Significant iHc increasing (up to 2100 kA/m) was ob-served in the sintered magnets, produced by the blending ofthe powders of the two alloys which had the extreme contentof such elements as Tb, Ho, and Co (96 and 4 mass.% resp.):(Nd0,15Pr0,35Tb0,25Ho0,25)15(Fe0,71Co0,29)bal·Al0,9Cu0,1B8,5 and(Nd0,2Pr0,4Tb0,4)15(Fe0,8Co0,2)bal·Al0,9Cu0,1B8,5. It might beexplained by the chemical composition gradient in the near-boundary regions of the grains (higher Tb content and lowerCo content).
It is known [2, 7, 8] that in order to increase thermalstability of Nd2Fe14B compounds, such elements as Tb,
Dy, Ho, and Co are introduced into the alloys. Howeverif their content exceeds the critical level in the magnets,as is the case for instance for the magnet compositionsNd0,8-x(Tb,Dy,Ho)x(Fe0,8-yCoy)bal·B8), where x > 0,2, y >0,2, plummeting of the main magnetic parameters (Br ,iHc, BHmax) occurs. However, it was revealed that if thealloy beside these elements additionally doped by Pr,Al, and Cu, and the content of B is increased, simul-taneous improving of all magnetic parameters (Br , iHc,BHmax, α) is observed while x = 0,3-0,4 and y = 0,2-0,3. The optimal chemical composition was found tobe (Nd0,15Pr0,35Tb0,25Ho0,25)15(Fe0,71Co0,29)bal·Al0,9Cu0,1B8,5
which provides the best combination of all investigatedmagnetic parameters including thermal stability. As followsfrom X-ray spectrum and Mossbauer effect analysis, thismight be explained by the fact that alloying by Pr, Al, Cu,and B results in the simultaneous increasing both of F-phasecontent in magnets and the content of Dy, Tb, Ho, and Co inF-phase.
Parameters of optimal heat treatment for this composi-tion are the following: 1175 K (3,6–7,2 ks) with subsequent(continuous or step) slow (10–12 ks) cooling to optimaltemperature (775 K) and endurance at this temperaturefor 3,6 ks. It might be assumed that the improving of themain magnetic parameters after this treatment schedule iscaused by the better isolation of the F-phase grains due tothe Nd (or Nd and Pr) diffusion from F-phase into thegrains boundaries [2, 12]. The temperature and enduranceof the optimal thermal treatment depend on the F-phasehomogeneity (in Nd or rare-earth element) region, whichis determined by the chemical composition of the alloy andits production technology. Homogeneity region of F-phaseis widened by such elements as Pr, Ga, and hydrogen andnarrowed by Gd, Dy, Tb, Ho, Co, and Ni.
We assume to use these new compositions for recordingheads for high coercivity media [13] and for GMFG {giantmagnetic field gradient} devices for separation of dia-, para-,and weak magnetic materials [14].
4. Conclusion
Significant doping of NdFeB magnets by such elements asDy, Tb, Ho, Co, Ti, and Nb might lead to the reducing of F-phase quantity and, as a consequence, to decrease of the mainmagnetic parameters. It was shown that additional alloyingby Pr, Al, Cu and increasing of B content results in significantincrease of F-phase the content in magnets as well as quantityof Dy, Tb, Ho, and Co in it. This promotes the increase ofmagnetic parameters.
It was possible to attain the following properties for themagnets (Nd0,15Pr0,35Tb0,25Ho0,25)15 (Fe0,71Co0,29)bal·Al0,9
Cu0,1B8,5 (at.%) after the optimal thermal treatment {1175 K(3,6–7,2 ks) with slow (12–16 ks) cooling to 675 K andsubsequent endurance at T = 775 K for 3,6 ks—hardening}:Br = 0,88 T, iHc = 1760 kA/m, BHmax = 144 kJ/m3, α <|0, 01|%/K in the temperature interval 223–323 K.

4 Physics Research International
Acknowledgment
The authors express their thanks to S. Margarjan for thehelp in conducting the investigations using the Mossbauerspectroscopy.
References
[1] Sagawa M., “Development and prospect of the Nd-Fe-Bsintered magnets,” in Proceedings of the 21st InternationalWorkshop on Rare-Earth Permanent Magnets and their Appli-cations, pp. 183–186, Bled, Slovenia, 2010.
[2] V. A. Glebov and A. A. Lukin, Nanocrystal Rare-Earth HardMagnetic Materials, VNIINM, Moscow, Russia, 2007.
[3] M. Tokunaga, M. Tobise, N. Meguro, and H. Hrada,“Microstructure of R-Fe-B sintered magnet,” IEEE Transac-tions on Magnetics, vol. 22, no. 5, pp. 904–909, 1986.
[4] M. Tokunaga, H. Kogure, M. Endoh, and H. Harada,“Improvement of thermal stability of Nd-Dy-Fe-Co-B sin-tered magnets by additions of Al, Nb and Ga,” IEEE Transac-tions on Magnetics, vol. 23, no. 5, pp. 2287–2289, 1987.
[5] R. Grossinger, R. Krewenka, H. Buchner, and H. Harada, “Anew analysis of Nd-Fe-B based permanent magnets,” Journalde Physique, vol. 49, supplement 12, pp. C659–C660, 1988.
[6] S. Hirosawa, Y. Matsuura, H. Yamamoto, S. Fujimura, M.Sagawa, and H. Yamauchi, “Magnetization and magneticanisotropy of R2Fe14B measured on single crystals,” Journal ofApplied Physics, vol. 59, no. 3, pp. 873–879, 1986.
[7] M. Sagawa, S. Hirosawa, H. Yamamoto, S. Fujimura, and Y.Matsuura, “Nd-Fe-B Permanent Magnet Materials,” JapaneseJournal of Applied Physics, vol. 26, no. 6, pp. 785–800, 1987.
[8] A. T. Pedziwiatr and W. E. Wallace, “Structure and magnetismof the R2Fe14-xCoxB ferromagnetic systems (R = Dy and Er),”Journal of Magnetism and Magnetic Materials, vol. 233, pp.L136–L141, 2001.
[9] W. J. Ren, D. Li, Y. C. Sui et al., “Structural and magnetic prop-erties of Laves compounds Dy1−xPrx(Fe0.35Co0.55B0.1)2(0≤x ≤1),” Journal of Applied Physics, vol. 99, no. 8, Article ID08M701, pp. 08M701-1–08M701-3, 2006.
[10] M. Shimotomai, “Microstructural aspects of tough and Cor-rosion - resistant Nd-(FeCoNiTi)-B magnets,” in Proceedingsof the 13th International Workshop on Rare Earth PermanentMagnets and their Applications, pp. 267–281, Birmingham,UK, 1994.
[11] B. A. Cook, J. L. Harringa, F. C. Laabs, K. W. Dennis, A.M. Russell, and R. W. McCallum, “Diffusion of Fe, Co, Nd,and Dy in R2(Fe1−xCox)14B where R = Nd or Dy,” Journal ofMagnetism and Magnetic Materials, vol. 66, pp. 63–68, 1987.
[12] F. Vial, F. Joly, E. Nevalainen, M. Sagawa, K. Hiraga, andK. T. Park, “Improvement of coercivity of sintered NdFeBpermanent magnets by heat treatment,” Journal of Magnetismand Magnetic Materials, vol. 242–245, pp. 1329–1334, 2002.
[13] “Magnetic recording head and method for high coercivitymedia, employing concentrated stray magnetic fields,” PatentUS 7,492,550.
[14] “Method for forming a high-gradient magnetic field and asubstance separation device based thereon,” Canada Patent 2595 721.
Hindawi Publishing CorporationPhysics Research InternationalVolume 2012, Article ID 185647, 28 pagesdoi:10.1155/2012/185647
Research Article
Fundamental Problems of the Electrodynamicsof Heterogeneous Media
N. N. Grinchik and Yu. N. Grinchik
A.V. Luikov Heat and Mass Transfer Institute of the National Academy of Sciences of Belarus, Minsk, Belarus 15,P. Brovka Str., 2200072, Belarus
Correspondence should be addressed to N. N. Grinchik, [email protected]
Received 28 July 2011; Accepted 26 October 2011
Academic Editor: Vladimir Shavrov
Copyright © 2012 N. N. Grinchik and Yu. N. Grinchik. This is an open access article distributed under the Creative CommonsAttribution License, which permits unrestricted use, distribution, and reproduction in any medium, provided the original work isproperly cited.
The consistent physic-mathematical model of propagation of an electromagnetic wave in a heterogeneous medium is constructedusing the generalized wave equation and the Dirichlet theorem. Twelve conditions at the interfaces of adjacent media are obtainedand justified without using a surface charge and surface current in explicit form. The conditions are fulfilled automatically in eachsection of counting schemes for calculations. A consistent physicomathematical model of interaction of nonstationaly electricand thermal fields in a layered medium with allowance or mass transfer is constructed. The model is based on the methods ofthermodynamics and on the equations of an electromagnetic field and is formulated without explicit separation of the chargecarriers and the charge of an electric double layer.
1. Introduction
Let us consider the interface S between two media havingdifferent electrophysical properties. On each of its sides themagnetic-field and magnetic-inductance vectors as well asthe electric-field and electric-displacement vectors are finiteand continuous; however, at the surface S they can experiencea discontinuity of the first kind. Furthermore, at the interfacethere arise induced surface charges σ and surface currents i(whose vectors lie in the plane tangential to the surface S)under the action of an external electric field.
The existence of a surface charge at the interface Sbetween the two media having different electrophysicalproperties is clearly demonstrated by the following example.We will consider the traverse of a direct current through a flatcapacitor filled with two dielectric materials having relativepermittivities ε1 and ε2 and electrical conductivities λ1 andλ2. A direct-current voltage U is applied to the capacitorplates; the total resistance of the capacitor is R (Figure 1). It is
necessary to calculate the surface electric charge induced bythe electric current.
From the electric-charge conservation law follows theconstancy of flow in a circuit; therefore, the followingequation is fulfilled:
λ1En1 = λ2En2 =U
(RS), (1)
where En1 and En2 are the normal components of the electric-field vector.
At the interface between the dielectrics, the normalcomponents of the electric-inductance vector change spas-modically under the action of the electric field by a valueequal to the value of the induced surface charge σ :
ε0ε1En1 − ε0ε2En2 = σ. (2)

2 Physics Research International
Solving the system of (1) and (2), we obtain the expressionfor σ :
σ =(U
RS
)ε0
[(ε1
λ1
)−(ε2
λ2
)]. (3)
It follows from (3) that the charge σ is determined by thecurrent and the multiplier accounting for the properties ofthe medium. If (
ε1
λ1
)−(ε2
λ2
)= 0, (4)
a surface charge σ is not formed. What is more, recent trendsare toward increased use of micromachines and enginesmade from plastic materials, where the appearance of asurface charge is undesirable. For oiling of elements of suchmachines, it is best to use an oil with a permittivity εoil
satisfying the relation
ε1 < εoil < ε2. (5)
This oil makes it possible to decrease the electrization of themoving machine parts made from dielectric materials. Inaddition to the charge σ , a contact potential difference arisesalways independently of the current.
An electric field interacting with a material is investigatedwith the use of the Maxwell equation (1857). For conve-nience and correctness of further presentation we denote the
axial vector of magnetic field strength, induction as⇀H and
⇀B
jtotal = ∇×⇀H, ∇ ·D = ρ, (6)
−∂⇀B∂t
= ∇× E, ∇· ⇀B= 0, (7)
where jtotal = λE + ∂⇀D /∂t,
⇀B = μμ0
⇀H. In this case, at the
interface S the above system of equations is supplementedwith the boundary conditions [1, 2]:
Dn1 −Dn2= σ , (8)
Eτ1 − Eτ2 = 0, (9)
Bn1 − Bn2 = 0, (10)
⇀Hτ1 −
⇀Hτ2 =
[�ιτ · �n
]. (11)
The indices (subscripts) n and τ denote the normal andtangential components of the vectors to the surface S, andthe indices 1 and 2 denote the adjacent media with differentelectrophysical properties. The index τ denotes any directiontangential to the discontinuity surface. At the same time, aclosing relation is absent for the induced surface charge σ ,which generates a need for the introduction of an impedancematrix [3–7] that is determined experimentally or, in somecases, theoretically from quantum representations [8–12].We note that the Maxwell equation of electromagnetic fielddoes not coincide completely with the modern form ofthem (6), (7) which was first given by Hertz (1884) andindependently of him by Heaviside (1885). The equations
U
R
1, 1
2, 2
Figure 1: Dielectric media inside a flat capacitor.
of electromagnetic field with precise division of polar andaxial vectors are of importance in considering the boundaryconditions. One should bear in mind that electric fieldstrength E is a polar vector. Gradients of concentrationand temperature are also polar vectors. On the contrary,
magnetic field strength⇀H, as well as
⇀H, are axial vectors, or
pseudovectors. This is well seen from the formula for the
Lorentz force F = q[V⇀H]. Indeed, the behavior of
⇀H on
reflection at the origin of coordinates and substitution r →(−r) is determined by the behavior of the polar vectors F andV and the properties of their vector product. On substitutionr → (−r) the directions of the vectors F and V change tothe opposite; the sign of the vector product also reverses.
Consequently, on substitution r → (−r) the vector⇀H must
remain constant. This property is assumed to be an attributeof the axial vector.
The induced surface charge σ not only characterizes theproperties of a surface, but also represents a function of the
process, that is, σ(E(∂E/∂t,⇀H (∂
⇀H /∂t))); therefore, the
surface impedances [3–7] are true for the conditions underwhich they are determined. These impedances cannot beused in experiments conducted under other experimentalconditions.
The problem of determination of surface charge andsurface current on metal-electrolyte boundaries becomeseven more complicated in investigating and modeling non-stationary electrochemical processes, for example, pulseelectrolysis, when lumped parameters L, C, and R cannot beused in principle.
We will show that σ can be calculated using the Maxwellphenomenological macroscopic electromagnetic equationsand the electric-charge conservation law accounting for thespecial features of the interface between the adjacent media.
Separate consideration will be given to ion conductors.In constructing a physicomathematical model, we take into
account that E and⇀H are not independent functions; there-
fore, the wave equation for E or⇀H is more preferable than
the system of (6) and (7). It will be shown that inconsideration of propagation, interference of waves in theheterogeneous medium it is preferable to use the waveequation for a polar vector of electric field strength.

Physics Research International 3
2. Electron Conductors: New Closing Relationson the Boundaries of Adjacent Media
2.1. Generalized Wave Equation for E and Conditions on the
Boundaries in the Presence of Strong Discontinuities of the
Electromagnetic Field
2.1.1. Physicomathematical Model. We will formulate a phys-icomathematical model of propagation of an electromag-netic field in a heterogeneous medium. Let us multiply theleft and right sides of the equation for the total current (see(6)) by μμ0 and differentiate it with respect to time. Actingby the operator rot on the left and right sides of the firstequation of (7) on condition that μ = const we obtain
∂jtotal
∂t= 1μμ0
∇2E− 1μμ0
grad(div E). (12)
In Cartesian coordinates, (12) will take the form
∂jtotalx
∂t= 1μμ0
(∂2Ex∂x2
+∂2Ex∂y2
+∂2Ex∂z2
)
− 1μμ0
∂
∂x
(∂Ex∂x
+∂Ey
∂y+∂Ez∂z
),
∂jtotaly
∂t= 1μμ0
(∂2Ey
∂x2+∂2Ey
∂y2+∂2Ey
∂z2
)
− 1μμ0
∂
∂y
(∂Ex∂x
+∂Ey
∂y+∂Ez∂z
),
∂jtotalz
∂t= 1μμ0
(∂2Ez∂x2
+∂2Ez∂y2
+∂2Ez∂z2
)
− 1μμ0
∂
∂z
(∂Ex∂x
+∂Ey
∂y+∂Ez∂z
).
(13)
At the interface, the following relation [2] is also true:
div iτ + Iqx1 − Iqx2 = −∂σ
∂t. (14)
Let us write conditions (see (8)–(11)) in the Cartesiancoordinate system:
Dx1 −Dx2 = σ , (15)
Ey1 − Ey2 = 0, (16)
Ez1 − Ez2 = 0, (17)
Bx1 − Bx2 = 0, (18)
Hy1 −Hy2 = iz, (19)
Hz1 −Hz2 = iy , (20)
where iτ = iyj + izk is the surface-current density, and thecoordinate x is directed along the normal to the interface.The densities iy and iz of the surface currents representthe electric charge carried in unit time by a segment ofunit length positioned on the surface drawing the currentperpendicularly to its direction.
The order of the system of differential equations (13) isequal to (16). Therefore, at the interface S, it is necessary toset, by and large, nine boundary conditions. Moreover, thethree additional conditions (15), (19), and (20) containing(prior to the solution) unknown quantities should befulfilled at this interface. Consequently, the total number ofconjugation conditions at the boundary S should be equal to(12) for a correct solution of the problem.
As an example we consider a one-dimensional case ofheat propagation in the layered material. As is known, tosolve the problem we must specify two conditions at theinterface: the equality of heat fluxes and the equality oftemperatures, since in the heat conduction equation we havethe second derivative with respect to the coordinate.
Differentiating expression (15) with respect to time andusing relation (14), we obtain the following condition forthe normal components of the total current at the medium-medium interface:
div iτ + jtotalx1 = jtotalx2 , (21)
that allows one to disregard the surface charge σ . Let us in-troduce the arbitrary function f : [ f ]|x=ξ = f1|x=ξ+0 −f2|x=ξ−0. In this case, expression (21) will take the form
[div iτ + jtotalx1
]∣∣x=ξ = 0. (22)
It is assumed that, at the medium-medium interface, Exis a continuous function of y and z. Then, differentiatingEquation (21) with respect to y and z, we obtain
[∂
∂yjtotalx1
]∣∣∣∣∣x=ξ
= −∂(div iτ)∂y
,
[∂
∂zjtotalx1
]∣∣∣∣x=ξ
= −∂(div iτ)∂z
.
(23)
Let us differentiate conditions (18)–(20) for the magneticinduction and the magnetic-field strength with respect to
time. On condition that⇀B = μμ0
⇀H:
[∂Bx∂t
]∣∣∣∣x=ξ
= 0,
[1μμ0
∂By
∂t
]∣∣∣∣∣x=ξ
= ∂iz∂t
,
[1μμ0
∂Bz∂t
]∣∣∣∣∣x=ξ
= ∂iy
∂t.
(24)

4 Physics Research International
Using (7) and expressing (24) in terms of projections of theelectric-field rotor, we obtain
[rotxE]|x=ξ = 0,
[∂Ez∂y
− ∂Ey
∂z
]∣∣∣∣∣x=ξ
= 0, (25)
[1μμ0
rotyE
]∣∣∣∣∣x=ξ
= ∂iz∂t
,
or
[1μμ0
(∂Ex∂z
− ∂Ez∂x
)]∣∣∣∣∣x=ξ
= ∂iz∂t
,
(26)
[1μμ0
rotzE
]∣∣∣∣∣x=ξ
= ∂iz∂t
,
or
[1μμ0
(∂Ey
∂x− ∂Ex
∂y
)]∣∣∣∣∣x=ξ
= ∂iz∂t.
(27)
Here, (25) is the normal projection of the electric-field rotor,(26) is the tangential projection of the rotor on y, and (27) isthe rotor projection on z.
Assuming that Ey and Ez are continuous differentiablefunctions of the coordinates y and z, from conditions (16)and (17) we find[
∂Ey
∂y
]∣∣∣∣∣x=ξ
= 0,
[∂Ey
∂z
]∣∣∣∣∣x=ξ
= 0,[∂Ez∂y
]∣∣∣∣∣x=ξ
= 0,[∂Ez∂z
]∣∣∣∣x=ξ
= 0.
(28)
In accordance with the condition that the tangential pro-jections of the electric field on z and y are equal and inaccordance with conditions (16) and (17), the expressions forthe densities of the surface currents iz and iy take the form
iz = λEz∣∣∣x=ξ , iy = λEy
∣∣∣x=ξ , (29)
where
λ = 12
(λ1 + λ2)∣∣∣∣x=ξ
(30)
is the average value of the electrical conductivity at theinterface between the adjacent media in accordance withthe Dirichlet theorem for a piecewise-smooth, piecewise-differentiable function.
Consequently, formulas (28)–(30) yield[div �iτ
]∣∣∣x=ξ = 0. (31)
Relations (31) and (32) and hence the equality of the normalcomponents of the total current were obtained (in a differentmanner) by Grinberg and Fok [13]. In this work, it hasbeen shown that condition (31) leads to the equality of thederivatives of the electric field strength along the normal tothe surface [
∂Ex∂x
]∣∣∣∣x=ξ
= 0. (32)
With allowance for the foregoing we have twelve conditionsat the interface between the adjacent media that are necessaryfor solving the complete system of (13):
(a) the functions Ey and Ez are determined from (16) and(17);
(b) Ex is determined from condition (22);
(c) the values of ∂Ex/∂y, ∂Ex/∂z, and ∂Ex/∂x are deter-mined from relations (23) with the use of thecondition of continuity of the total-current normalcomponent at the interface (22) and the continuityof the derivative of the total current with respect tothe coordinate x;
(d) the values of ∂Ey/∂y, ∂Ey/∂z, and ∂Ez/∂z are deter-mined from conditions (28) and (29) in consequenceof the continuity of the tangential components of theelectric field along y and z;
(e) the derivatives ∂Ey/∂x and ∂Ez/∂x are determinedfrom conditions (26) and (27) as a consequence of theequality of the tangential components of the electric-field rotor along y and z.
Note that condition (21) was used by us in [14] inthe numerical simulation of the pulsed electrochemicalprocesses in the one-dimensional case. Condition (25) forthe normal component of the electric-field rotor representsa linear combination of conditions (28) and (29); therefore,rotxE = 0 and there is no need to use it in the subsequentdiscussion. The specificity of the expression for the generallaw of electric-charge conservation at the interface is thatthe components ∂Ey/∂y and ∂Ez/∂z are determined fromconditions (28) and (29) that follow from the equality andcontinuity of the tangential components Ey and Ez at theboundary S.
Thus, at the interface between the adjacent media thefollowing conditions are fulfilled: the equality of the total-current normal components; the equality of the tangentialprojections of the electric-field rotor; the electric-chargeconservation law; the equality of the electric-field tangentialcomponents and their derivatives in the tangential direction;the equality of the derivatives of the total-current normalcomponents in the direction tangential to the interfacebetween the adjacent media, determined with account forthe surface currents and without explicit introduction of asurface charge. They are true at each cross section of thesample being investigated.
2.1.2. Features of Calculation of the Propagation of Elec-tromagnetic Waves in Layered Media. The electromagneticeffects arising at the interface between different mediaunder the action of plane electromagnetic waves have aprofound impact on the equipment because all real devicesare bounded by the surfaces and are inhomogeneous inspace. At the same time, the study of the propagationof waves in layered conducting media and, according to[15], in thin films is reduced to the calculation of thereflection and transmission coefficients; the function E(x)is not determined in the thickness of a film, that is, thegeometrical-optics approximation is used.
The physicomathematical model proposed allows one toinvestigate the propagation of an electromagnetic wave in a

Physics Research International 5
layered medium without recourse to the assumptions used in[3–5, 7].
Since conditions (21)–(29) are true at each cross sectionof a layered medium, we will use schemes of throughcounting without an explicit definition of the interfacebetween the media. In this case, it is proposed to calculateEx at the interface in the following way.
In accordance with (15), Ex1 /=Ex2, that is, Ex(x) experi-ences a discontinuity of the first kind. Let us determine thestrength of the electric field at the discontinuity point x = ξon condition that Ex(x) is a piecewise-smooth, piecewise-differentiable function having finite one-sided derivativesE′x+ (x) and E′x−(x). At the discontinuity points xi,
E′x+ (xi) = limΔxi→+0
E(xi + Δxi)− E(xi + 0)Δxi
,
E′x−(xi) = limΔxi→−0
E(xi + Δxi)− E(xi − 0)Δxi
.
(33)
In this case, in accordance with the Dirichlet theorem [16],the Fourier series of the function E(x) at each point x,including the discontinuity point ξ, converges and its sumis equal to
Ex=ξ = 12
[E(ξ − 0) + E(ξ + 0)]. (34)
The Dirichlet condition (34) also has a physical meaning.In the case of contact of two solid conductors, for example,dielectrics or electrolytes in different combinations (metal-electrolyte, dielectric-electrolyte, metal-vacuum, and so on),at the interface between the adjacent media there alwaysarises an electric double-layer (EDL) with an unknown(as a rule) structure that, however, substantially influencesthe electrokinetic effects, the rate of the electrochemicalprocesses, and so on. It is significant that, in reality,the electrophysical characteristics λ, ε, and E(x) changeuninterruptedly in the electric double-layer; therefore, (34)is true for the case where the thickness of the electric double-layer, that is, the thickness of the interphase boundary, ismuch smaller than the characteristic size of a homogeneousmedium. In a composite, for example, in a metal withembedments of dielectric balls, where the concentrationof both components is fairly large and their characteristicsizes are small, the interphase boundaries can overlap andcondition (34) can break down.
If the thickness of the electric double-layer is muchsmaller than the characteristic size L of an object, (34) alsofollows from the condition that E(x) changes linearly in theEDL region. In reality, the thickness of the electric double-layer depends on the kind of contacting materials and cancomprise several tens of angstroms [17]. In accordance withthe modern views, the outer coat of the electric double-layerconsists of two parts, the first of which is formed by the ionsimmediately attracted to the surface of the metal (a “dense”or a “Helmholtz” layer of thickness h), and the second isformed by the ions separated by distances larger than theion radius from the surface of the layer, and the number ofthese ions decreases as the distance between them and theinterface (the “diffusion layer”) increases. The distribution of
the potential in the dense and diffusion parts of the electricdouble-layer is exponential in actual practice [17], that is,the condition that E(x) changes linearly breaks down; in thiscase, the sum of the charges of the dense and diffusion partsof the outer coat of the electric double-layer is equal to thecharge of its inner coat (the metal surface). However, if thethickness of the electric double-layer h is much smaller thanthe characteristic size of an object, the expansion of E(x)into a power series is valid and one can restrict oneself tothe consideration of a linear approximation. In accordancewith the more general Dirichlet theorem (1829), a knowledgeof this function in the EDL region is not necessary tosubstantiate (34). Nonetheless, the above-indicated physicalfeatures of the electric double-layer lend support to thevalidity of condition (34).
The condition at interfaces, analogous to (34), has beenobtained earlier [18] for the potential field (where rot E =0) on the basis of introduction of the surface potential,the use of the Green formula, and the consideration of thediscontinuity of the potential of the double-layer. In [18],it is also noted that the consideration of the thickness ofthe double-layer and the change in its potential at h/L �1 makes no sense in general; therefore, it is advantageousto consider, instead of the volume potential, the surfacepotential of any density. Condition (34) can be obtained, aswas shown in [16], from the more general Dirichlet theoremfor a nonpotential vorticity field [18].
Thus, the foregoing and the validity of conditions (15)–(17) and (23)–(29) at each cross-section of a layered mediumshow that, for numerical solution of the problem beingconsidered it is advantageous to use schemes of throughcounting and make the discretization of the medium in sucha way that the boundaries of the layers have common points.
The medium was divided into finite elements so that thenodes of a finite-element grid, lying on the separation surfacebetween the media with different electrophysical properties,were shared by these media at a time. In this case, the totalcurrents or the current flows at the interface should be equalif the Dirichlet condition (34) is fulfilled.
2.1.3. Results of Numerical Simulation of the Propagation ofElectromagnetic Waves in Layered Media. Let us analyze thepropagation of an electromagnetic wave through a layeredmedium that consists of several layers with different elec-trophysical properties in the case where an electromagnetic-radiation source is positioned on the upper plane of themedium. It is assumed that the normal component of theelectric-field vector Ex = 0 and its tangential componentEy = a sin(ωt), where a is the electromagnetic-wave ampli-tude (Figure 2).
In this example, for the purpose of correct specificationof the conditions at the lower boundary of the medium,an additional layer is introduced downstream of layer 6;this layer has a larger conductivity and, therefore, theelectromagnetic wave is damped out rapidly in it. In this case,the condition Ey = Ez = 0 can be set at the lower boundaryof the medium. The above manipulations were made tolimit the size of the medium being considered because,

6 Physics Research International
Ey
1
2
3
4
5
6
Figure 2: Scheme of a layered medium: layers 1, 3, and 5 arecharacterized by the electrophysical parameters ε1, λ1, and μ1, andlayers 2, 4, and 6 by ε2, λ2, and μ2.
−0.4
−0.8
0 0.5 1 1.5 2 2.5
t· 10−13
Ex/a
1
2
3
0.8
0.4
0
Figure 3: Time change in the tangential component of the electric-field strength at a distance of 1 μm (1), 5 μm (2), and 10 μm (3) fromthe surface of the medium at λ1 = 100, λ2 = 1000, ε1 = ε2 = 1,μ1 = μ2 = 1, and ω = 1014 Hz. t, sec.
in the general case, the electromagnetic wave is attenuatedcompletely at an infinite distance from the electromagnetic-radiation source.
Numerical calculations of the propagation of an elec-tromagnetic wave in the layered medium with electro-physical parameters ε1 = ε2 = 1, λ1 = 100, λ2 =1000, and μ1 = μ2 = 1 were carried out. Two values of thecyclic frequency ω = 2π/T were used: in the first case, theelectromagnetic-wave frequency was assumed to be equal toω = 1014 Hz (infrared radiation), and, in the second case, thecyclic frequency was taken to be ω = 109 Hz (radiofrequencyradiation).
As a result of the numerical solution of the system of(13) with the use of conditions S (22)–((31) and (32) at theinterfaces, we obtained the time dependences of the electric-field strength at different distances from the surface of thelayered medium (Figure 3).
|Ex|/a
y
0.8
0.6
0.4
0.2
00
5 10 15 20 25 30
1
2
Figure 4: Distribution of the amplitude of the electric-field-strength at the cross section of the layered medium: ω = 1014 (1)and 109 Hz (2). y, μm.
0.8
0.4
0
−0.4
−0.8
0 0.4 0.8 1.2
t· 10−13
Ex/a
12
3
Figure 5: Time change in the electric-field strength at a distance of1 (1), 5 (2), and 10 μm (3) from the surface of the medium. t, sec.
The results of our simulation (Figure 4) have shownthat a high-frequency electromagnetic wave propagatingin a layered medium is damped out rapidly, whereas alow-frequency electromagnetic wave penetrates into sucha medium to a greater depth. The model developed wasalso used for calculating the propagation of a modulatedsignal of frequency 20 kHz in a layered medium. As aresult of our simulation (Figure 5), we obtained changes inthe electric-field strength at different depths of the layeredmedium, which points to the fact that the model proposedcan be used to advantage for calculating the propagationof polyharmonic waves in layered media; such a calculationcannot be performed on the basis of the Helmholtz equation.
The physicomathematical model developed can also beused to advantage for simulation of the propagation ofelectromagnetic waves in media with complex geometric

Physics Research International 7
parameters and large discontinuities of the electromagneticfield (Figure 6).
Figure 6(a) shows the cross-sectional view of a cellularstructure representing a set of parallelepipeds with differentcross-sections in the form of squares. The parameters ofthe materials in the large parallelepiped are denoted byIndex 1, and the parameters of the materials in the smallparallelepipeds (the squares in the figure) are denoted byIndex 2.
An electromagnetic wave propagates in the paral-lelepipeds (channels) in the transverse direction. It isseen from Figure 6(b) that, in the cellular structurethere are “silence regions,” where the amplitude of theelectromagnetic-wave strength is close to zero, as wellas inner regions where the signal has a marked valuedownstream of the “silence” zone formed as a result of theinterference.
2.1.4. Results of Numerical Simulation of the Scattering ofElectromagnetic Waves in Angular Structures. It is radioloca-tion and radio-communication problems that are among themain challenges in the set of problems solved using radio-engineering devices.
Knowledge of the space-time characteristics of diffrac-tion fields of electromagnetic waves scattered by an objectof location into the environment is necessary for solvingsuccessfully any radiolocation problem. Irradiated objectshave a very intricate architecture and geometric shape of thesurface consisting of smooth portions and numerous wedge-shaped for formations of different type-angular joints ofsmooth portions, surface fractures, sharp edges, and so forth,with rounded radii much smaller than the probing-signalwavelength. Therefore, solution of radiolocation problemsrequires the methods of calculation of the diffraction fieldsof electromagnetic waves excited and scattered by differentsurface portions of the objects, in particular, by wedge-shaped formations, be known, since the latter are among themain sources of scattered waves.
For another topical problem, that is, radio communica-tion effected between objects, the most difficult are the issuesof designing of antennas arranged on an object, since theiroperating efficiency is closely related to the geometric andradiophysical properties of its surface.
The issues of diffraction of an electromagnetic wave inwedge-shaped regions are the focus of numerous of theproblems for a perfectly conducting and impedance wedgefor monochromatic waves is representation of the diffractionfield in an angular region in the form of a Sommerfeldintegral [19].
Substitution of Sommerfeld integrals into the system ofboundary conditions gives a system of recurrence functionalequations for unknown analytical integrands. The system’scoefficients are Fresnel coefficients defining the reflection ofplane media or their refraction into the opposite medium.From the system of functional equations, one determines,in a recurrence manner, sequences of integrand poles andresidues in these poles.
The edge diffraction field in both media is determinedusing a pair of Fredholm-type singular integral equationsof the second kind which are obtained from the above-indicated systems of functional equations with subsequentcomputation of Sommerfeld integrals by the saddle-pointapproximation. The branching points of the integrandscondition the presence of creeping waves excited by the edgeof the dielectric wedge.
The proposed method is only true of monochromaticwaves and of the approximate Leontovich boundary con-ditions, when the field of the electromagnetic wave slowlyvaries from point to point on a wavelength scale [20].
We note that the existing approximate Leontovich condi-tions have a number of other constants and should be usedwith caution [20].
In actual fact, the proposed calculation method does notwork in the presence of, for example, two wedges, when thesharp angles are pointed at each other, that is, an opticalknife, or in diffraction of the electromagnetic wave on asystem of parallel lobes, when the gap between the lobes isin the region of microns, and the electromagnetic field isstrongly “cut” throughout the space with a step much thanthe wavelength.
(A) Optical Knife. Figure 7 shows the field of an electro-magnetic wave in its diffraction on the optical knife. Theparameters of the wave at entry and at exit are Ex =104 sin(1010t),Ey = 104 cos (1010t).
The electrophysical characteristics are as follows. Thewedge is manufactured from aluminum: ε = 1; μ = 1;σ = 3.774 · 107 S/m; the ambient medium is air.
The dimensions of the computational domain are 0.1 ×0.05 m. The calculation time 10−9 sec, and the time step is10−11 sec.
Numerical solution of the system of equations (13) yieldsthe dependences of the distribution Ex, Ey on the opticalknife. The calculation results are in good agreement withthe existing experimental data and experiments speciallyconducted at the Department of the Physics and Chemistryof Nonequilibrium Media of the A.V. Luikov Heat and MassTransfer Institute of the National Academy of Sciences by A.I. Bereznyak.
The experiments were carried out with an optical-rangelaser and were tentative in character but the obtained exper-imental photographs of diffraction fields, and the calculatedresults turned out to be in good qualitative agreement.The authors express their thanks to A. I. Bereznyak for theconducting of the experiments.
(B) Diffraction Grating. The parameters of the wave andthe interfacial conditions are the same, as those for thecase “optical knife.” The electrophysical characteristics are asfollows: 2D lobes, ε = 12; and σ = 100 S/m; the ambientmedium is air; the characteristics of the prism and the squareare identical to those of the lobes.
Figure 8 corresponds to a calculation time of 10−10 sec;the time step is 10−12 sec. Figure 9 corresponds to a calcula-tion time of 10−9 sec; the time step is 10−11 sec.

8 Physics Research International
y
x
−0.4
−0.4
−0.2
−0.2
0
0
0.2
0.2
0.4
0.4
(a) Distribution of the amplitude of the electric-field strength in thetwo-dimensional medium
|E|
00
0.04 0.08 1.12
1
0.8
0.6
0.4
0.2
x
(b) Distribution of the amplitude of the electric-field strength in depth
Figure 6: Distribution of the amplitude of the electric-field strength in the two-dimensional medium and in depth at ε1 = 15, ε2 = 20,λ1 = 10−6, λ2 = 10, μ1 = μ2 = 1, and ω = 109 Hz (the dark background denotes medium 1, and the light background denotes medium 2). x,y, mm; E, V/m.
It is seen from the modeling results that the proposed“comb” cab be used as a filter of a high-frequency signal.Furthermore, we carried out numerical calculations of amodulated signal at a frequency of 20 kHz. The results ofthe modulated-signal calculations are not given. To analyzethe difference scheme for stability was analyzed by the initialdata. When the time and space steps are large there appearoscillations of the grid solution and of its “derivatives” (“rip-ple”) which strongly decrease the accuracy of the scheme.Undoubtedly, this issue calls for separate consideration. Theproposed algorithm of solution of Maxwell equations allowscircuitry-engineering modeling of high-frequency radio-engineering devices and investigation of the propagation ofelectromagnetic waves in media of intricate geometry in thepresence of strong discontinuities of electromagnetic field.
The result of Para 2.1 were published in part [21].
2.1.5. Conclusions. We were the first to construct a consistentphysicomathematical model of propagation of electromag-netic waves in layered media without recourse to the matricesof the induced-surface-charge impedances. This model isbased on the Maxwell equations, the electric-charge conser-vation law, the total-current continuity, and the Dirichlettheorem. Our numerical investigations have shown that thephysical and mathematical model proposed can be usedto advantage for simulation of the propagation of a high-frequency electromagnetic wave in a medium consisting oflayers having different electrophysical properties.
2.2. Wave Equation for⇀H and Conditions on the Boundaries
in the Presence of Strong Discontinuities of the Electro-
magnetic Field. Numerical Modeling of Electrodynamic
Processes in the Surface Layer
2.2.1. Introduction. During the interaction of an externalmagnetic field and magnetic abrasive particles, the particlesare magnetized, and magnetic dipoles with the momentoriented predominantly along the field are formed. “Chains”along the force lines of the field [22, 23] appear thatperiodically act on the processable surface with a frequencyω = l/υ. A fixed elemental area of the material periodicallyexperiences the effect of the magnetic field of one direction.Actually, the frequency and duration of the pulse will bestill higher because of the rotation of the magnetic abrasiveparticle due to the presence of the moment of forces oncontact and of the friction of the particle against theprocessable part. In what follows, we will not take intoaccount the effect of rotation.
We assume that the particle velocity on the polisher isυ. If the particle radius is r, then the angular frequencyis ω = 2πυ/r, and precisely this frequency determinesthe frequency of the effect of the variable magnetic fieldcomponent due to the fact that for a ferromagnetic μ > 1.The magnetic permeability μ of ferromagnetics, which areusually used in magnetoabrasive polishing, is measured bythousands of units in weak fields. However, in polishing, theconstant external magnetic field is strong and amounts to

Physics Research International 9
0.075
0.065
0.055
0.045
0.035
0.025
0.015
0.005
−0.005
0.04 0.06 0.08 0.1 0.12 0.14 0.16
(a) Mesh
0.075
0.065
0.055
0.045
0.035
0.025
0.015
0.005
−0.005
0.04 0.06 0.08 0.1 0.12 0.14 0.16
Max: 1.293e4×105
0
−0.2
−0.4
−0.6
−0.8
−1
−1.2
−1.4
−1.6
Min: −1.747e5
Time = 1e− 9Surface: electric field, x component (V/m)
(b) Amplitude Ex
0.03
0.032
0.034
0.036
0.038
0.04
93 95 97 99 101 103 105 107
Max: 1.293e4×105
0
−0.2
−0.4
−0.6
−0.8
−1
−1.2
−1.4
−1.6
Min: −1.747e5
Time = 1e− 9Surface: electric field, x component (V/m)
×10−3
(c) Amplitude Ex
Time = 1e− 9
×10−3
0.0240.0260.028
0.030.0320.0340.0360.038
0.040.0420.0440.046
86 90 94 98 102 106 110 114−1.739
−1.498
−1.257
−1.016
−0.774
−0.533
−0.292
−0.051
Min: −1.739e5
Max: 6908.465Contour: electric field, xcomponent (V/m)
×105
(d) Isolines Ex
Time = 1e− 9Surface: electric field, y component (V/m)
0.075
0.065
0.055
0.045
0.035
0.025
0.015
0.005
−0.005
0.04 0.06 0.08 0.1 0.12 0.14 0.16
0−0.2−0.4−0.6−0.8−1
0.20.40.60.81×105
Min: −1.066e5
Max: 1.044e5
(e) Amplitude Ey
Time = 1e− 9Surface: electric field, y component (V/m)
0.03
0.032
0.034
0.036
0.038
0.04
93 95 97 99 101 103 105 107×10−3
0−0.2−0.4−0.6−0.8−1
0.20.40.60.81×105
Min: −1.066e5
Max: 1.044e5
(f) Amplitude Ey
×10−3
0.0240.0260.028
0.030.0320.0340.0360.038
0.040.0420.0440.046
86 90 94 98 102 106 110 114−0.977
−0.746
−0.516
−0.285
−0.054
0.176
0.407
0.637
0.868
Max: 9.83e4
Min: −9.767e4
Contour: electric field, ycomponent (V/m)Time = 1e− 9 ×10⁵
(g) Isolines EyFigure 7: Mesh, amplitude Ex and isolines, and amplitude Ey and isolines of the electromagnetic field strength.

10 Physics Research International
−0.25−0.15−0.05
0.050.150.250.350.450.550.650.750.850.951.051.15
×10−4
×10−4
−0.5
−0.5
−1.5
−1
−0.3−0.1 0.1 0.3 0.5 0.7 0.9 1.1 1.3 1.5 Min: −1.683
Max: 1.604×10⁵
0
0.5
1
1.5Time = 1e− 11
Surface: electric field, x component (V/m)
(a) Amplitude Ex
×105
−0.25−0.15−0.05
0.050.150.250.350.450.550.650.750.850.951.051.15
×10−4
×10−4
−0.5−0.3−0.1 0.1 0.3 0.5 0.7 0.9 1.1 1.3 1.5
Time = 1e− 11Contour: electric field, x component (V/m)
−1.6
−1.272
−0.943
−0.614
−0.286
0.043
0.372
0.7
1.029
1.358
Max: 1.522
Min: −1.6
(b) Isolines Ex
×105Time = 1e− 11Surface: electric field, y component (V/m)
−0.25−0.15−0.05
0.050.150.250.350.450.550.650.750.850.951.051.15
×10−4
×10−4−0.5−0.3−0.1 0.1 0.3 0.5 0.7 0.9 1.1 1.3 1.5
0
−0.2
−0.4
−0.6
−0.8
−1
−1.2
−1.4
−1.6
Min: −1.677
Max: 5154
(c) Amplitude Ey
×105
−0.25−0.15−0.05
0.050.150.250.350.450.550.650.750.850.951.051.15
×10−4
×10−4−0.5−0.3−0.1 0.1 0.3 0.5 0.7 0.9 1.1 1.3 1.5
−1.634
−1.461
−1.288
−1.115
−0.942
−0.77
−0.597
−0.424
−0.251
−0.078
Max: 833.3
Min: −1.634
Time = 1e− 11Contour: electric field, y component (V/m)
(d) Isolines Ey
Figure 8: Amplitude Ex and isolines and amplitude Ey and isolines of the electromagnetic field strength.
105-106 A/m, and in this case the value of μ for compounds ofiron and nickel and for Heusler alloy decreases substantially.
Because of the presence of a strong external magneticfieldH0 the “small” absolute value of μ of an abrasive particleleads to a periodic “increase” and “decrease” in the normalcomponent of the magnetic induction near the processablesurface. In the present work we used neodymium magnets(neodymium-iron-boron) with H0 > 485, 000 A/m. Themagnetic permeability of a magnetic abrasive particle basedon carbonyl iron was assumed in this case to be equal toμ1 = 100.
Due to the continuity of the normal magnetic inductioncomponent Bn1 = Bn2, where Bn1 = μ1μ0H1; Bn2 = μ2μ0H2.For example, in glasses (μ2 = 1; therefore at the boundaryof contact of the glass with the magnetic abrasive particlean additional variable magnetic field of strength H1 > H0
appears.In [24–27], magnetic field-induced effects in silicon are
considered: a nonmonotonic change in the crystal latticeparameters in the surface layer of silicon, the gettering ofdefects on the surface, the change in the sorption properties
of the silicon surface, and the change in the mobility of theedge dislocations and in the microhardness of silicon.
In [28–30], the influence of an electromagnetic field onthe domain boundaries, plasticity, strengthening, and on thereduction of metals and alloys was established.
In view of the foregoing, it is of interest to findthe relationship between the discrete-impulse actions of amagnetic field of one direction on the surface layer of theprocessable material that contains domains. According to[22], the size of domains is as follows: 0.05 μm in iron, 1.5 μmin barium ferrite; 8 μm in the MnBi compound, and 0.5–1 μm in the acicular gamma ferric oxide. According to [31],the size of a domain may reach 10−6 cm3 (obtained by themethod of magnetic metallography).
As a rule, an abrasive exhibits a distinct shape anisotropy,whereas the frequency of the effect is determined by theconcentration of abrasive particles in a hydrophobic solutionand by the velocity of its motion. We assume that on thesurface of a processable crystal the magnetic field strengthH(t) = H1sin4(ωt) +H0.
It is required to find the value of the magnetic fieldstrength in the surface layer that has the characteristics λ1, ε1,
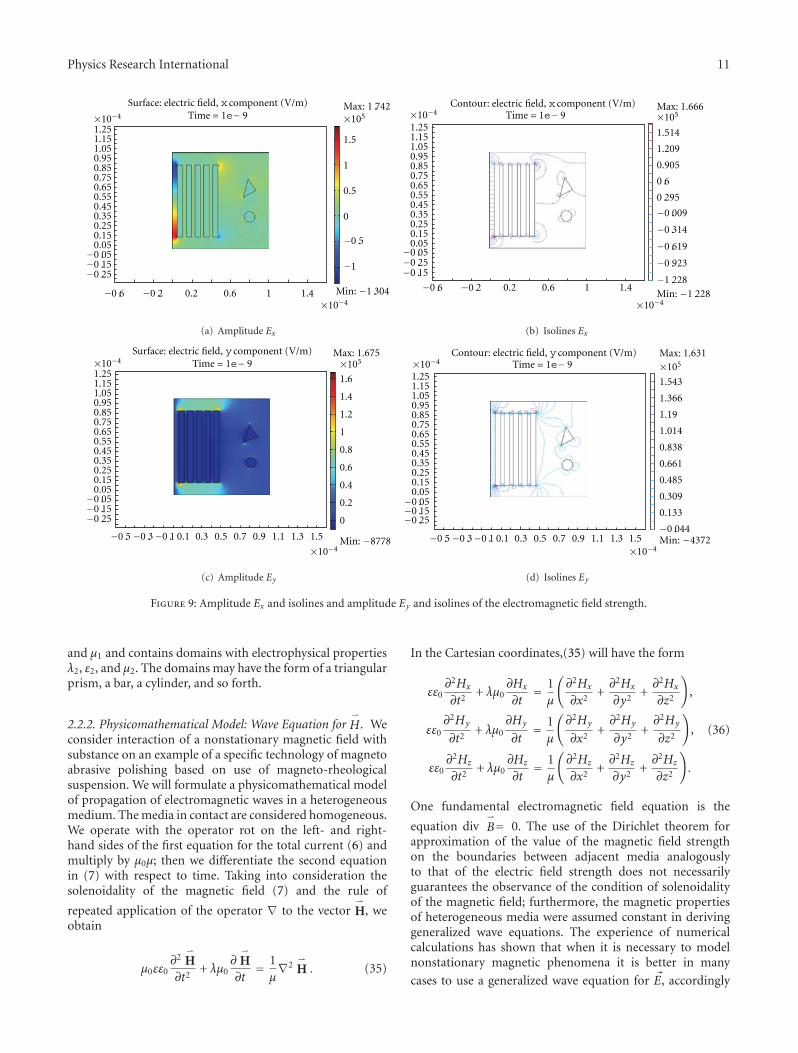
Physics Research International 11
−0.5
−1
×105
0
0.5
1
1.5
−0.25−0.15−0.05
0.050.150.250.350.450.550.650.750.850.951.051.151.25×10−4 Time = 1e− 9
Surface: electric field, x component (V/m)
−0.6 −0.2 0.2 0.6 1 1.4 Min: −1.304
Max: 1.742
×10−4
(a) Amplitude Ex
×105
−1.228
−0.923
−0.619
−0.314
−0.009
0.295
0.6
0.905
1.209
1.514
Min: −1.228
Max: 1.666
−0.6 −0.2 0.2 0.6 1 1.4
×10−4
−0.25−0.15
−0.050.050.150.250.350.450.550.650.750.850.951.051.151.25×10−4
Contour: electric field, x component (V/m)Time = 1e− 9
(b) Isolines Ex
Time = 1e− 9Surface: electric field, y component (V/m)
−0.5−0.3−0.1 0.1 0.3 0.5 0.7 0.9 1.1 1.3 1.5
1.6
1.4
1.2
1
0.8
0.6
0.4
0.2
0
Min: −8778
Max: 1.675
−0.25−0.15−0.05
0.050.150.250.350.450.550.650.750.850.951.051.151.25×10−4 ×105
×10−4
(c) Amplitude Ey
Time = 1e− 9
−0.044
0.133
0.309
0.485
0.661
0.838
1.014
1.19
1.366
1.543
Min: −4372
Max: 1.631×10⁵
−0.5−0.3−0.1 0.1 0.3 0.5 0.7 0.9 1.1 1.3 1.5
−0.25−0.15−0.05
0.050.150.250.350.450.550.650.750.850.951.051.151.25×10−4
×10−4
Contour: electric field, y component (V/m)
(d) Isolines Ey
Figure 9: Amplitude Ex and isolines and amplitude Ey and isolines of the electromagnetic field strength.
and μ1 and contains domains with electrophysical propertiesλ2, ε2, and μ2. The domains may have the form of a triangularprism, a bar, a cylinder, and so forth.
2.2.2. Physicomathematical Model: Wave Equation for⇀H . We
consider interaction of a nonstationary magnetic field withsubstance on an example of a specific technology of magnetoabrasive polishing based on use of magneto-rheologicalsuspension. We will formulate a physicomathematical modelof propagation of electromagnetic waves in a heterogeneousmedium. The media in contact are considered homogeneous.We operate with the operator rot on the left- and right-hand sides of the first equation for the total current (6) andmultiply by μ0μ; then we differentiate the second equationin (7) with respect to time. Taking into consideration thesolenoidality of the magnetic field (7) and the rule of
repeated application of the operator ∇ to the vector⇀H, we
obtain
μ0εε0∂2
⇀H
∂t2+ λμ0
∂⇀H∂t
= 1μ∇2
⇀H . (35)
In the Cartesian coordinates,(35) will have the form
εε0∂2Hx
∂t2+ λμ0
∂Hx
∂t= 1μ
(∂2Hx
∂x2+∂2Hx
∂y2+∂2Hx
∂z2
),
εε0∂2Hy
∂t2+ λμ0
∂Hy
∂t= 1μ
(∂2Hy
∂x2+∂2Hy
∂y2+∂2Hy
∂z2
),
εε0∂2Hz
∂t2+ λμ0
∂Hz
∂t= 1μ
(∂2Hz
∂x2+∂2Hz
∂y2+∂2Hz
∂z2
).
(36)
One fundamental electromagnetic field equation is the
equation div⇀B= 0. The use of the Dirichlet theorem for
approximation of the value of the magnetic field strengthon the boundaries between adjacent media analogouslyto that of the electric field strength does not necessarilyguarantees the observance of the condition of solenoidalityof the magnetic field; furthermore, the magnetic propertiesof heterogeneous media were assumed constant in derivinggeneralized wave equations. The experience of numericalcalculations has shown that when it is necessary to modelnonstationary magnetic phenomena it is better in many
cases to use a generalized wave equation for �E, accordingly

12 Physics Research International
expressing �H(t,�r) by �E(t,�r) and, if need be, to perform
backward recalculation to �H(t,�r). This approach is difficultto apply to modeling of heterogeneous media with differentmagnetic properties, when the magnetic permeability μ isdependent on coordinates.
In media with a weak heterogeneity where μ(x, y, z)is a piecewise continuous quantity, the application of theproposed method of through counting is quite justified.Indeed, the system of (13) and (36) yields that the function’sdiscontinuity on the boundaries between adjacent mediais determined by the complexes which will be called thegeneralized permeability ε∗ ≡ εμε0μ0 and the generalizedconductivity λ∗ ≡ λμμ0. Using the Direchlet theorem for ε∗
and λ∗, we obtain their values on the boundaries betweenadjacent media and the values for the electric field strengthat the discontinuity point (see (34)); here, we note that thevalue of the electric field strength is obtained without solvingMaxwell equations. In fact, at the discontinuity point, we uselinear interpolation of the function to obtain the values ofε∗, λ∗, and Ex=ξ = (1/2)[E(ξ − 0) + E(ξ + 0)]. Consequently,for piecewise continuous quantity μ(x, y, z), the applicationof the proposed method of through counting is justified. Wenote that the equality of the derivatives of the electric fieldstrength along the normal to the surface at the discontinuitypoint according to Equation (32) holds. When the wave
equation for �H is used for media with different magneticpermeabilities the condition of equality of the derivativesfails, that is,
∂Hx
∂x
∣∣∣∣x=ξ−0
/= ∂Hx
∂x
∣∣∣∣x=ξ+0
, (37)
which is a consequence of (10); therefore, the use of through-
counting schemes for the wave equation for �H is difficult.Moreover, reformulation of the boundary conditions for
equations (6) and (7), with electric field strength beingeliminated from the boundary conditions, does not evenallow prediction of the surface current direction. Indeed,
magnetic field strength⇀H is an axial vector which on
substitution �r → (−�r) must remain constant. The valueof the surface current also cannot be determined withoutknowledge of the polar vector of electric field strength. The
generalized wave equation for �E contains the term grad div �Ewhich directly allows for the influence of induced surfacecharges on the propagation of waves, the right-hand sideof the generalized wave equation has the same form as theequations of the linear elasticity theory, hydrodynamics. Wenote that the proposed method of calculation can be usedon condition that there are no built-in space charges andextraneous electromotive forces [13].
By virtue of what has been stated above, for modeling ofthe propagation of electromagnetic waves in glasses havingroughness and defects, we used system (13) with boundaryconditions (22)–(31) and (32).
2.2.3. Results of Numerical Simulation. The physicomath-ematical model developed can also efficiently be used inmodeling the propagation of electromagnetic waves in media
with complex geometries and strong electromagnetic fielddiscontinuities.
The transverse cut of a cellular structure representsa set of parallelepipeds and triangular prisms of variouscross-sections, as depicted in Figures 10(a) and 11(a). Anelectromagnetic wave propagates across the direction ofparallelepipeds and triangular prisms (channels) along thecoordinate x.
The size of the investigated two-dimensional object is14 × 20 · 10−6 m, and the sizes of the domains are 2–4 μm.The frequency of the influence of the magnetic field is ω =2π · 106, and the strength of the field is
Hx = 21 · 105sin4(2π · 106t) A
m. (38)
The electrophysical properties are as follows: of the largeparallelepiped, μ = 1, ε = 8, σ = 10−9 Ω·m; of domains,μ = 1, ε = 6, σ = 10−8 Ω·m. They correspond to theelectrophysical properties of glasses.
It was assumed that in a layer of thickness 15–20 μman electromagnetic wave propagates without attenuation;therefore, on all the faces of the large parallelepiped thefulfillment of condition (38) was considered valid. On thefaces of the parallelepiped that are parallel to the OX axiscondition (38) corresponded to the “transverse” tangentialcomponent of the wave; on the faces parallel toOY condition(38) corresponded to the normal component of the field.
The calculations were carried out with a time step of10−13 sec up to a time instant of 10−10 sec.
Figures 10(a) and 11(a) present the amplitude valuesof the magnetic field strength along Hx and Hy with acomparison scale, whereas Figures 11(b) and 11(b) presentthe corresponding isolines. An analysis of these figures showsthat at the places of discontinuity, on the wedges, forcelines of the electromagnetic field concentrate. According to[32], precisely wedges are often the sources and sinks ofthe vacancies that determine, for example, the hardness andplasticity of a solid body.
Also, we modeled the propagation of waves in media,when domains possess magnetic properties. We assumed, inthe calculations, that μ = 100; the remaining parameterscorrespond to the previous example of solution (Figure 12).
Of interest is the interaction of the electromagnetic wavewith the rough surface shown in Figures 13 and 14. Asin the previous examples, we observe the concentration ofelectromagnetic energy on angular structures.
From Figures 13 and 14, it is seen that electromagneticheating of tapered structures may occur in addition tomechanical heating in magnetic abrasive machining.
As we have mentioned above, for investigation of thepropagation of electromagnetic waves in nonmagnetic mate-rials, it is more expedient to use the generalized equation
for �E. For the purpose of illustration we give an exampleof numerical calculation of an optical knife with the wave
equation for �H (Figure 15).From Figure 15, it is seen that the actual problem of
diffraction on the optical knife remains to be solved, thatis, there is no “glow” on the optical-knife section, which isinconsistent with experimental data.

Physics Research International 13
−0.2
0
0
0.2
0.2
0.4
0.4
0.6
0.6
0.8
0.8
1
1
1.2
1.2
1.4
1.4 1.6 1.8 2 2.2 Min: −1.12
Max: −6.886
×10−5
×10−5 ×10⁻⁴
−0.7
−0.75
−0.8
−0.85
−0.9
−0.95
−1
−1.05
−1.1
Time = 1e− 10Surface: electric field, x component (V/m)
(a) Amplitude Hx
−1.109
−1.066
−1.023
−0.98
−0.937
−0.894
−0.85
−0.807
−0.764
−0.721
Min: −1.109
Max: −6.994
−0.2
0
0
0.2
0.2
0.4
0.4
0.6
0.6
0.8
0.8
1
1
1.2
1.2
1.4
1.4 1.6 1.8 2 2.2×10−5
×10−5 ×10⁻⁴Time = 1e− 10Contour: electric field, x component (V/m)
(b) Isolines
Figure 10: Amplitude Hx and isolines of the magnetic field strength.
−0.2
0
0
0.2
0.2
0.4
0.4
0.6
0.6
0.8
0.8
1
1
1.2
1.2
1.4
1.4 1.6 1.8 2 2.2
×10−5
×10−5
−0.5
−1
0
0.5
1
Min: −1.327
Max: 1.307×10⁻⁵Time = 1e− 10
Surface: electric field, y component (V/m)
(a) Amplitude Hy
Min: −1.262
Max: 1.241
−1.262
−0.998
−0.735
−0.471
−0.208
0.055
0.319
0.582
0.846
1.109
×10−5
−0.2
0
0
0.2
0.2
0.4
0.4
0.6
0.6
0.8
0.8
1
1
1.2
1.2
1.4
1.4 1.6 1.8 2 2.2
×10−5
×10−5
Time = 1e− 10Contour: electric field,
(b) Isolines
Figure 11: Amplitude Hy and isolines of the magnetic field strength.
×10−5
×10−5Time = 1e− 10
Surface: electric field, x component (V/m)
−0.7
−0.75
−0.8
−0.85
−0.9
−0.95
−1
−1.05
−1.10
0
0.2
0.2
0.4
0.4
0.6
0.6
0.8
0.8
1
1
1.2
1.2
1.4
1.4 1.6 1.8 2 2.2−0.2
×10−4
Min: −1.148
Max: −6.905
(a) Amplitude Hx
Time = 1e− 10Surface: electric field, y component (V/m)
Min: −1.386×10−5
×10−5
0
0
0.2
0.2
0.4
0.4
0.6
0.6
0.8
0.8
1
1
1.2
1.2
1.4
1.4 1.6 1.8 2 2.2−0.2
−0.5
−1
0
0.5
1.5
1
×10−5Max: 1.506
(b) Amplitude Hy
Figure 12: Amplitude Hx and Hy of the magnetic field strength.

14 Physics Research International
60
50
40
30
20
10
0
−10
−10
−20
−30
0 10 20 30 40 50 60 70 80 90 100 110
6
4
2
0
−4
−2
−5.7714× 10⁸
6.2451× 108
×108Time = 5.7e− 12
Surface: electric field, x component (V/m)
(a) Amplitude Hx
60
50
40
30
20
10
0
−10
−10
−20
−30
0 10 20 30 40 50 60 70 80 90 100 110 −5.7355× 10⁸
5.9285× 108
×108Time = 5.7e− 12
−7.2907
−5.7355
−4.1803
−2.6251
−1.0699
0.4853
2.0405
3.5957
5.1509
6.7061
Contour: electric field, x component (V/m)
(b) Isolines
Figure 13: Amplitude Hx and isolines of the magnetic field strength.
60
50
40
30
20
10
0
−10
−10
−20
−30
0 10 20 30 40 50 60 70 80 90 100 110
Time = 5.7e− 12Surface: electric field, y component (V/m)
1.1454× 10⁸
1.3922× 109
×109
1.2
1
0.8
0.6
0.4
0.2
(a) Amplitude Hx
Time = 5.7e− 12 1.3174× 109
×109
60
50
40
30
20
10
0
−10
−10
−20
−30
0 10 20 30 40 50 60 70 80 90 100 110
Contour: electric field, y component (V/m)
1.5514
0.1478
0.3037
0.4597
0.6156
0.7716
0.9275
1.0835
1.2394
1.3954
1.478× 10⁸
(b) Isolines
Figure 14: Amplitude Hy and isolines of the magnetic field strength.
0.075
0.065
0.055
0.045
0.035
0.025
0.015
0.005
−0.005
0.04 0.06 0.08 0.1 0.12 0.14
15
10
5
0
−5
−10
−15
Min: −15.587
Max: 15.835Time = 1e− 9Surface: magnetic field, x component (A/m)
(a) Amplitude Hx
0.075
0.065
0.055
0.045
0.035
0.025
0.015
0.005
−0.005
0.04 0.06 0.08 0.1 0.12 0.14 Max: −31.67
30
20
10
0
−10
−20
−30
Time = 1e− 9Surface: magnetic field, zcomponent (A/m)
Min: 31.174
(b) Amplitude Hy
Figure 15: Amplitude Hx and Hy of the magnetic field strength.

Physics Research International 15
As is known [33] in thermodynamically equilibrium sys-tems the temperature T and the electrical ϕ and chemical μcpotentials are constant along the entire system:
gradT = 0, gradϕ = 0, gradμc = 0. (39)
If these conditions are not fulfilled (grad T /= 0, gradϕ /= 0, grad μc /= 0), irreversible processes of the transfer ofmass, energy, electrical charge, and so forth appear in thesystem.
The chemical potential of the jth component is deter-mined, for example, as a change of the free energy with achange in the number of moles:
μc j =(∂F
∂nj
)T ,V
, (40)
where
dF = −SdT − PdV+⇀H d
⇀B +EdD. (41)
The last term in (41) takes into account the change in thefree energy of a dielectric due to the change in the magneticinduction. The free energy of a unit volume of the dielectricin the magnetic field in this case has the form
F(T ,D) = F0 + μμ0
⇀H2
2+ εε0
E2
2. (42)
We assume that changes in the temperature and volume ofthe dielectric are small. Then the mass flux is determinedby a quantity proportional to the gradient of the chemicalpotential or, according to (41), we obtain
qi = −Dμcgrad(⇀H d
⇀B +EdD
)= −DμcgradW , (43)
where W = μμ0(⇀H2 /2) + εε0(E2/2) is the density of the
magnetic field in the unit volume of the dielectric.In magnetic abrasive polishing on the sharp protrusions
of domains the gradients of magnetic energy are great, whichcan lead to the origination of vacancy flows.
An analysis of the results shows that the nonstationarycomponent of the full electromagnetic energy is also concen-trated in the region of fractures and wedges, that is, at thesharp angles of domains, which may lead to the improvementof the structure of the sublayer of the treated surface dueto the “micromagnetoplastic” effect. Maximum values of thenonstationary part of the total electromagnetic energy Wmax
in the sublayer corresponds to a maximum value of thefunction sin (2π · 106 t) and occur for the time instants t =(n/4)10−6 sec, where n is the integer, with the value of Wmax
for a neodymium magnet and a magnetoabrasive particle onthe basis of carboxyl iron amounting to a value of the orderof ((5)-(6))·106 J/m3. Having multipliedWmax by the volumeof a domain, vacancy, or atom, we may approximately obtainthe corresponding energy. The density of the electromagneticenergy in all of the cases is much smaller than the bondingenergy of atoms, 10−18-10−19 J. However, a periodic change inthe magnetic field in one direction leads to a ponderomotive
force that may influence the motion of various defects anddislocations to create a stable and equilibrium structure ofatoms and molecules in magnetic abrasive polishing and,on the long run, in obtaining a surface with improvedcharacteristics due to the “micromagnetoplastic” effect. Theresult of Para 2.2 were published in part [34].
3. Ion Conductors: New Closing Relationson the Boundaries of Adjacent Media
3.1. Diffusion Electric Phenomena in Electrolytes. The me-dium under discussion is assumed to consist of a nonionized solvent, an electrolyte in the form of ions and un-charged components. At first we consider infinitely dilutedelectrolytes when molecules are completely dissociated intocations and anions.
In a solution, ions are transferred by convection, dif-fusion, and migration in the presence of an electric field.Derivation of the equation for ion migration is based onthe following considerations. In a solution with molarconcentration n and diffusion coefficient Di let there be ionswith charge zi. When an ion is exposed to an electric fieldwith intensity E applied to the solution, the ion experiencesthe force zieE, which brings it into motion. The ion velocityis related to this force by the usual expression known for themotion of particles in a viscous medium:
u = γ∗i zieE, (44)
where γ∗i is the ion mobility. The latter may be expressed interms of the diffusion coefficient using the known Einsteinrelation:
γ∗i =DiF
RT. (45)
The total flux of ions of the i th kind in a moving medium inthe presence of diffusion and migration is determined by theNernst-Planck equation:
qi = niυ −Di∇ni +DiziFERT
ni. (46)
Formulas (44) and (45) have, in fact, a limited sphere ofapplicability. Indeed, Einstein’s work [35] is concerned onlywith the diffusion of a neutral impurity with its smallconcentration in a solution when the usual relations ofhydrodynamics are valid for a flow around a sphere.
In the physics of plasma, formulas (44) and (45) are basedon other considerations and provided the plasma is weaklyionized, that is, particles move independently of each other.Here, only the collision of charged particles with neutral onesis taken into account [36].
In [37, 38], for describing the diffusion and migration ofions in a partially dissociated electrolyte it is suggested to takeinto consideration their transfer by neutral molecules. In thetheory developed by Y. Kharkats [37] the expression for thetotal flux of ions is
qi = niυ −Di∇ni +DiziFERT
ni −Dzi∇nA. (47)

16 Physics Research International
Table 1: The degree of HCl electrolytical dissociation in terms ofmeasured electric conductivity α1 and E.m.f. α2.
C HCl, mole/liter 0.003 0.08 0.3 3.0 6.0 16.0
α1 0.986 0.957 0.903 — — —
α2 0.99 0.88 0.773 1.402 3.4 13.2
The last term in (47) takes into account ion transfer by aflux of neutral molecules; here the concentrations of anions,cations, and neutral dissociated molecules are determined bythe chemical equilibrium conditions
β = (n−)z+
(n+)z−
nA, (48)
where β is the dissociation equilibrium constant. If the degreeof dissociation at the prescribed total concentration n is α,then nA = (1− α)n and, consequently,
β = α2n
1− α . (49)
The dissociation constant β, unlike the degree of dissocia-tion, must not depend on concentration. However, in realpartially dissociated electrolytes those arguments for α andβ are in rather poor agreement with experiment. In [39] thedissociation degree for HCl is listed in Table 1 as a functionof concentrations, calculated in terms of measured electricconductivity α1 and e.m.f. α2.
Inspection of the table reveals that the dissociationdegrees obtained by different experimental methods coincidebest in the case of dilute solutions. In the high-concentrationrange of the electrolyte, α2 even exceeds unity, which,naturally, has no physical sense.
According to the Arrhenius theory the dissociation con-stant β for the given electrolyte at the prescribed temperatureand pressure must remain constant independently of thesolution concentration. In [40], the dissociation constants ofsome electrolytes are given at their different concentrations.Only for very weak electrolytes (solutions of ammonia andacetic acid) does the dissociation constant remain more orless constant on dilution. For strong electrolytes (potassiumchloride and magnesium sulfate), it changes by severalfoldand in no way may be considered a constant.
Of course, one may formally take into account thedependence of the dissociation constant on the electrolyteconcentration and use it in the modified Nernst-Planckequation (47) and (48) but the main drawback in describ-ing separately the diffusion and migration of ions in anelectrolyte, in D. I. Mendeleev’s opinion, lies in the factthat the interaction of particles of a dissolved substancebetween each other as well as with solvent molecules isneglected. Also, he has pointed out that not just theprocesses of formation of new compounds with solventmolecules are of importance for solutions. D. I. Mendeleev’sviewpoints have been extended by Sakhanov [40], whobelieved that in addition to the usual dissociation reactionin an electrolyte solution there also proceeds associating ofsimple molecules. Molecular associations dissociate, in their
turn, into complex and simple ions. In this case (47) willnot hold mainly because of the fact that the expressions fordiffusion, migration, and nondissociated flows of moleculesmust be determined relative to some mean liquid velocity. Inconcentrated solutions, this velocity does not coincide withthe solvent velocity and must be determined from the fluiddynamics equations of a multicomponent mixture in whichcharacteristics of its components (physical density, charge,diffusion coefficient of a complex ion) are, in fact, unknown.This is a reason why the theory of diffusion and migrationof ions for a partially dissociated electrolyte solution, with acurrent traversing through it, encounters crucial difficulties.Besides, it is rather difficult to take an account of the forceinteraction of complex cations and anions between eachother and with an external electric field. Therefore Einstein’sformula (44) will also change its form.
The main drawbacks of the theory of electrolytic disso-ciation are fully defined in collected papers “FundamentalPrinciples of Chemistry” by D. I. Mendeleev as well as in[40, 41].
In our opinion, the principal disadvantage of theapproaches considered above lies in the fact that the Nernst-Planck equation as well as its modified form for a partiallydissociated electrolyte (see (47)) are based on the hydrody-namic theory of diffusion. We shall substantiate below that itis more reasonable to use the equations of thermodynamicsof irreversible processes.
When applying the Nernst-Planck equation (see (46))and its modified forms (see (47)), it is implicitly postu-lated that cations and anions in the electrolyte solutionare different components. The equations of transfer ofcations and anions are written separately. On the otherhand, the commonly used equation of electroneutrality doesnot ensure, according to Gibbs [39], the independence ofdifferentials of cations ∂ni and anions ∂ne in a volumetricelectrolyte solution their changes are functionally related andtherefore they are identical, indiscernible components.
3.1.1. The Case of a Current Traversing a Binary FullyDissociated Electrolyte. Let us write system of equations (see(46)) in the form:
∂ne∂τ
+ v gradne = DeΔne +zeFDe
RTdiv(neE),
∂ni∂τ
+ v gradni = DiΔni +ziFDi
RTdiv(niE),
(50)
zene − zini = 0. (51)
Analogously to [39], instead of concentrations ne and ni weintroduce the molar concentration related to ne and ni by theexpressions
C = nezi= nize. (52)
Expressing ne and ni in (50) in terms of the molar concen-tration, we arrive at the following expression for the functionC:
∂C
∂τ+ υ∇C = DefΔC, (53)
Physics Research International 17
where
Def = DeDi(ze + zi)zeDe + ziDi
(54)
is the diffusion coefficient of a salt or the effective diffusioncoefficient of a binary electrolyte. Expressing the concentra-tions ne and ni in terms of the molar concentration C we findthe expression for the vector of current density J [42]:
J = (Di −De)Fzize∇C +F2zizeRT
(ziDi + zeDe)CE. (55)
In [43] it is shown that by its meaning Def is a coefficient ofmolecular diffusion. For instance, the diffusion coefficientsof copper sulfate have an intermediate value between thediffusion coefficients of copper and sulfate ions; if De =0.173 · 10−9 m2/sec and Di = 1.065 · 10−9 m2/sec, then Def =0.854 · 10−9 m2/sec. However, expression (54) does not offeran explanation of the abnormally high mobility of H andOH ions when their displacement proceeds by a croquet-likemechanism [44].
In the system of (53)–(55) no symmetry of cross termsis observed; therefore, it is difficult to take into account “thesuperposition effects.” Indeed, from (55) it is evident that themolar concentration gradients VC exert an influence on thecurrent J. On the other hand, one can see from (53) that anelectric field has no effect on the diffusion of the molecules,and therefore the Onsager reciprocal relation is disturbed.
One may raise the objection that according to the Nernst-Planck equations it follows that the concentration gradientsof cations and anions exert an influence on the potentialdistribution of an electric field [42]:
∇(ρR∇ϕ
) = −F∑i
z∇(Di∇Ci). (56)
However, relation (56) itself has been derived by Neumann[43] on the assumption that the resultant current does notdepend on the mass flow.
On derivation of the equations for diffusion and migra-tion of ions in a volumetric electrolyte solution we shallemploy the relations of the thermodynamics of irreversibleprocesses.
Finally, it is worthy of note that in plasma physics there isalso no symmetry of “the superposition effects” in describingthe ambipolar diffusion of ions, and the theory is based onthe hydrodynamic model [36].
In investigating the dynamics of an electron-hole semi-conductor plasma, the hydrodynamic model (50)-(51) is alsoused.
In our opinion, electric field-induced transfer of chargesentails transfer of their kinetic energy as well as of heatand mass, and, conversely, mass or heat transfer maysimultaneously cause, if we are concerned with the systemof charged particles, charge transfer and give rise to anelectromotive force.
3.1.2. Conclusion. To phenomenologically describe dif-fusional-electrical phenomena in electrolytes it is suggested
to use the methods of the thermodynamics of irreversibleprocesses, rather than the hydrodynamic theory of diffusionof ions, for the experimentally observable thermodynamicflows and forces without clear discernment and identificationof real ion flows and mobilities.
3.2. Landau Model. In what follows we consider ion conduc-tors that contain the electrolytic plasma with a fairly highconcentration of charged particles. The interaction of thecharged plasma particles with the external electromagneticfield and their collective interaction can theoretically beinvestigated completely only on the basis of the Boltzmannkinetic equation with a self-consistent field. In this proba-bilistic approach to the phenomena under study, one intro-duces characteristics that are average over a large ensembleof particles and are always related to the introduction ofadditional hypotheses on the properties of particles and theirinteractions and to the simplification of these properties andinteractions. We note that in many cases, for example, whenthe electrolytic plasma in liquid electrolytes is considered,there is even no basis for constructing such methods. Thedeveloped methods are usually not an efficient means ofsolving problems by virtue of the excessive complexity ofcorresponding equations.
Another general method is construction of a phe-nomenological macroscopic theory based on the generalregularities and hypotheses obtained experimentally; thisprecisely method will be developed in the present work.For many problems of applied character, consideration of aplasma as a conducting gas is sufficient. Such approximationis strictly justified only in the case of a dense plasmawhen the free path of charged particles is much smallerthan the characteristic dimension of the system and particlecollisions are of crucial importance. The velocity distributionof particles is Maxwellian; at each point, it is fully determinedby the local values of density, temperature, and macroscopicvelocity. With these conditions being observed, we can carryout, in a unified context, macroscopic phenomenologicaldescription of a gas medium, a metal and dielectric plasma,a plasma in a liquid electrolyte, or an electrolytic plasma.
The necessary condition of existence of the state oflocal thermodynamic equilibrium (LTE) of a plasma is highfrequency of collisions of plasma particles (Maxwellization)so that the plasma state undergoes no marked changes overthe period between collisions on the mean free path. Theobservance of this condition means the following: (1) theelectrons have time to transfer the energy received from theelectrostatic field to heavy particles; (2) ionization processesare nearly totally counterbalanced by recombination (theSaha equation holds true); (3) the overwhelming part ofexcited atoms gives up its energy in collisions; (4) energyexchange between particles dominates the processes in whichthe plasma energy markedly grows or diminishes.
In the LTE plasma state, it is only the radiation field(photons) that is not in equilibrium with the plasma, butthe energy loss by radiation is minor in a number ofcases compared to other mechanisms of energy transfer.With allowance for the assumptions enumerated above,
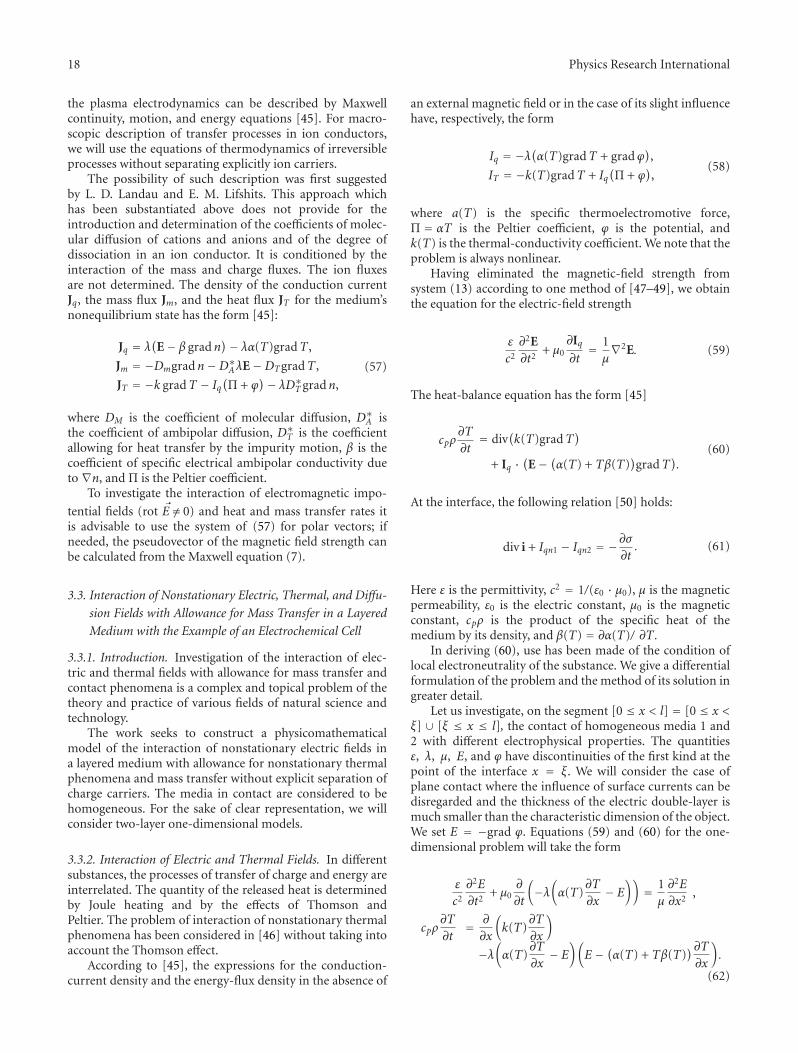
18 Physics Research International
the plasma electrodynamics can be described by Maxwellcontinuity, motion, and energy equations [45]. For macro-scopic description of transfer processes in ion conductors,we will use the equations of thermodynamics of irreversibleprocesses without separating explicitly ion carriers.
The possibility of such description was first suggestedby L. D. Landau and E. M. Lifshits. This approach whichhas been substantiated above does not provide for theintroduction and determination of the coefficients of molec-ular diffusion of cations and anions and of the degree ofdissociation in an ion conductor. It is conditioned by theinteraction of the mass and charge fluxes. The ion fluxesare not determined. The density of the conduction currentJq, the mass flux Jm, and the heat flux JT for the medium’snonequilibrium state has the form [45]:
Jq = λ(
E− β gradn)− λα(T)gradT ,
Jm = −Dmgradn−D∗AλE−DTgradT ,
JT = −k gradT − Iq(Π + ϕ
)− λD∗T gradn,
(57)
where DM is the coefficient of molecular diffusion, D∗A isthe coefficient of ambipolar diffusion, D∗T is the coefficientallowing for heat transfer by the impurity motion, β is thecoefficient of specific electrical ambipolar conductivity dueto∇n, and Π is the Peltier coefficient.
To investigate the interaction of electromagnetic impo-
tential fields (rot �E /= 0) and heat and mass transfer rates itis advisable to use the system of (57) for polar vectors; ifneeded, the pseudovector of the magnetic field strength canbe calculated from the Maxwell equation (7).
3.3. Interaction of Nonstationary Electric, Thermal, and Diffu-
sion Fields with Allowance for Mass Transfer in a Layered
Medium with the Example of an Electrochemical Cell
3.3.1. Introduction. Investigation of the interaction of elec-tric and thermal fields with allowance for mass transfer andcontact phenomena is a complex and topical problem of thetheory and practice of various fields of natural science andtechnology.
The work seeks to construct a physicomathematicalmodel of the interaction of nonstationary electric fields ina layered medium with allowance for nonstationary thermalphenomena and mass transfer without explicit separation ofcharge carriers. The media in contact are considered to behomogeneous. For the sake of clear representation, we willconsider two-layer one-dimensional models.
3.3.2. Interaction of Electric and Thermal Fields. In differentsubstances, the processes of transfer of charge and energy areinterrelated. The quantity of the released heat is determinedby Joule heating and by the effects of Thomson andPeltier. The problem of interaction of nonstationary thermalphenomena has been considered in [46] without taking intoaccount the Thomson effect.
According to [45], the expressions for the conduction-current density and the energy-flux density in the absence of
an external magnetic field or in the case of its slight influencehave, respectively, the form
Iq = −λ(α(T)gradT + gradϕ
),
IT = −k(T)gradT + Iq(Π + ϕ
),
(58)
where a(T) is the specific thermoelectromotive force,Π = αT is the Peltier coefficient, ϕ is the potential, andk(T) is the thermal-conductivity coefficient. We note that theproblem is always nonlinear.
Having eliminated the magnetic-field strength fromsystem (13) according to one method of [47–49], we obtainthe equation for the electric-field strength
ε
c2
∂2E∂t2
+ μ0∂Iq∂t= 1μ∇2E. (59)
The heat-balance equation has the form [45]
cpρ∂T
∂t= div
(k(T)gradT
)+ Iq ·
(E− (
α(T) + Tβ(T))gradT
).
(60)
At the interface, the following relation [50] holds:
div i + Iqn1 − Iqn2 = −∂σ∂t. (61)
Here ε is the permittivity, c2 = 1/(ε0 · μ0), μ is the magneticpermeability, ε0 is the electric constant, μ0 is the magneticconstant, cpρ is the product of the specific heat of themedium by its density, and β(T) = ∂α(T)/ ∂T .
In deriving (60), use has been made of the condition oflocal electroneutrality of the substance. We give a differentialformulation of the problem and the method of its solution ingreater detail.
Let us investigate, on the segment [0 ≤ x < l] = [0 ≤ x <ξ] ∪ [ξ ≤ x ≤ l], the contact of homogeneous media 1 and2 with different electrophysical properties. The quantitiesε, λ, μ, E, and ϕ have discontinuities of the first kind at thepoint of the interface x = ξ. We will consider the case ofplane contact where the influence of surface currents can bedisregarded and the thickness of the electric double-layer ismuch smaller than the characteristic dimension of the object.We set E = −grad ϕ. Equations (59) and (60) for the one-dimensional problem will take the form
ε
c2
∂2E
∂t2+ μ0
∂
∂t
(−λ
(α(T)
∂T
∂x− E
))= 1μ
∂2E
∂x2 ,
cpρ∂T
∂t= ∂
∂x
(k(T)
∂T
∂x
)−λ
(α(T)
∂T
∂x− E
)(E − (
α(T) + Tβ(T))∂T∂x
).
(62)

Physics Research International 19
Conditions (39) and (61) will be written, respectively, in theform
ε1ε0E1|x=ξ−0 − ε2ε0E2|x=ξ+0 = σ|x=ξ , (63)
λ1
(E1 − α1(T)
∂T
∂x
)∣∣∣∣x=ξ−0
− λ2
(E2 − α2(T)
∂T
∂x
)∣∣∣∣x=ξ+0
= −∂σ∂t
∣∣∣∣x=ξ
,
(64)
By differentiating (63) with respect to time and taking intoaccount (64), at the phase boundary we obtain the conditionof equality of the total currents:[
λ
(E − α(T)
∂T
∂x
)+ εε0
∂E
∂t
]∣∣∣∣x=ξ
= 0. (65)
Here and in what follows, for the arbitrary function f weadopt the notation[
f]∣∣
x=ξ = f∣∣x=ξ+0 − f
∣∣x=ξ−0. (66)
Equality (63) is a corollary of the relation limx→ ε±0 div D = ρ[50]. Taking into consideration the finiteness of the value ofthe space electric charge and the continuity of it, in the one-dimensional case we obtain[
εε0∂E
∂x
]∣∣∣∣x=ξ
= 0. (67)
Relations (65) and (67) reflect the laws of conservation andcontinuity of electric charge [45, 50]. At the contact point,we also have the equality of the temperatures and the energyfluxes [45]:
[T]|x=ξ = 0, (68)[k(T)
∂T
∂x+ λ
(α(T)
∂T
∂x− E
)(α(T)T + ϕ
)]∣∣∣∣x=ξ
= 0. (69)
Thus, in the presence of the interaction of the electric andthermal fields in a layered medium, the equality of thecharge fluxes (65), the equality of the charges (67) (whenthe conditions of quasineutrality of the contacting mediabeyond the electric double-layer are satisfied), the equality ofthe temperatures (68), and the equality of the energy fluxesmust be fulfilled at the interface of the media. In the relationsfor the charge and energy fluxes, we take into account cross-thermoelectrical phenomena.
The process of charge of the electric field is consideredon the finite time interval [0 ≤ t ≤ t0]. The initial conditionshave the form
T(x, 0) = T0(x), E(x, 0) = f1(x),∂E(x, 0)∂t
= f2(x).
(70)
We give the boundary conditions, for example, for the valuex = 0. We set the value of the total-current density to beknown (
λ
(α(T)
∂T
∂x− E
)− εε0
∂E
∂t
)∣∣∣∣x=0
= j1(t), (71)
and take into account the heat exchange at the boundaryusing the Newton relation
(k(T)
∂T
∂x+ λ
(α(T)
∂T
∂x− E
)α(T)T + ϕ
)∣∣∣∣x=0
= γ1(T − T∗)∣∣x=0,
(72)
where γ1 is the coefficient of heat exchange and T∗ is theambient temperature.
We consider the analogous relations at the right-handboundary.
3.3.3. Interaction of Electric and Thermal Fields with Al-lowance for Mass Transfer. Let us consider the nonstationarymodel of heat and mass transfer for electrochemical systemswith the example of electrolysis. For this problem, an electricdouble-layer occurs at the site of contact of the electrolytewith the metallic anode and cathode. Let us set the densityof the space charge beyond the electric double-layer of themetal-electrolyte contact to be zero at the initial instantand hence, according to [51], remain constant in the futurewhile the voltage drop in the electrodes and leads is small.The influence of the electrodes on the temperature field ofthe electrolyte will be taken into account in terms of thecoefficient of heat exchange.
Two approaches to modeling of diffusion-electrical phe-nomena have currently been developed, each of which hascertain disadvantages and advantages. The first approach[37, 38, 42] is characterized by consideration of the flows ofions of the corresponding sort in a completely or partiallydissociated electrolyte. The equations derived contain manyparameters, the reliable procedure of determination of whichis absent in the majority of cases. Furthermore, the proposedtheory fails to provide for taking into account the interactionof the cations and the anions of the dissolved substance witheach other and with the molecules of the solvent. It must alsobe borne in mind that, apart from the dissociation reaction,we have the association of simple molecules which in turnare dissociated into complex and simple ions. It is difficult todetermine the diffusion coefficients of complex ions; it is alsodifficult to take into account the force interaction of complexcations and anions with each other and with the externalelectric field. The difficulties in question become moreserious when a multicomponent electrolyte is described. Wenote that such difficulties also arise in modeling, for example,certain problems of plasma physics.
The second approach [52–56] fails to provide for theintroduction and determination of the coefficients of molec-ular diffusion of cations and anions and the degree of disso-ciation of the electrolyte. It is based on the interaction of themass and charge fluxes. The ionic flows are not determined.The model is formulated without explicit separation of thecharge carriers and the charge of an electric double layer.

20 Physics Research International
The system of equations describing the electrodynamicprocesses in the electrolyte is as follows:
ε
c2
∂2E∂t2
+ μ0∂Iq∂t= 1μ∇2E,
∂n
∂t= −div(Im),
c0ρ0∂T
∂t= −div(IT).
(73)
Here Iq, Im, and IT are the densities of the conductioncurrent and of the mass and heat fluxes which (in the case ofthe nonequilibrium state of the medium) have, respectively,the form (57) [45], where DM is the molecular diffusioncoefficient, D∗A is the ambipolar diffusion coefficient, DT isthe thermal diffusion coefficient, D∗T is the coefficient takinginto account the transfer of heat due to the motion of theimpurity, and n is the concentration of the impurity.
We give the initial
E(x, 0) = E0(x),∂E(x, 0)∂t
= E(x),
T(x, 0) = T0(x), n(x, 0) = n0(x),(74)
and boundary conditions (anode-electrolyte, x = 0):
Iq = λ
(λ∗A∂n
∂x− E
)+ λα(T)
∂T
∂x− εε0
∂E
∂t,
γ1(T − T∗) = k∂T
∂x− Iq
(Π + ϕ
)+D∗T
∂n
∂x,
kaIq(t) = DM∂n
∂x−D∗AλE +DT
∂T
∂x,
(75)
in modeling the one-dimensional problem in the region G =[0 ≤ x ≤ l] × [0 ≤ t ≤ T]. Here ka is the electrochemicalequivalent of a substance which deposits at the anode. Theanalogous conditions hold for x = l as well.
The constructed system of differential equations makesit possible to model the processes of transfer in the elec-trochemical system with allowance for the influence of anelectric double-layer; this influence directly determines thethermoelectrical and ambipolar electrodiffusion phenomenaat the boundary of the metal-electrolyte contact.
3.3.4. Numerical Modeling of Electrochemical Systems. Heatingof an Electrochemical Cell in the Case of Constant-Current andPulse Electrolysis. In electrochemical systems, the electrodesare metals as a rule. The electrical conductivity of metalsis hundreds of times higher than the specific electricalconductivity of electrolytes; therefore, one can disregard thevoltage drop in electrodes and leads. In highly conductivemetals, one can also disregard the displacement currentsand the coefficients of ambipolar diffusion and thermaldiffusion and restrict oneself to consideration of the systemof equations (73)–(75) just in the electrolyte itself.
Let us consider the process of heating of an electro-chemical medium in the case of passage of an electriccurrent with density Iq(t) through a solution of coppersulfate CuSO4·5H2O. We use copper (99.78%) as the anode.
The copper from the solution is deposited at the cathode. Weset the current efficiencies for the copper equal to 100% andthe electrochemical equivalent ke equal to 0.6588·10−6 kg/C.The dependence of the specific electrical conductivity λ(n)of the copper-plating electrolyte on the concentration ofthe copper sulfate in water is given in [57]; the dependenceof λ and k on the temperature will be considered to beinsignificant. In the calculations for CuSO4, we set DM =5 · 10−10 m2/sec, D∗A = 10−11 λ, λ∗A = 10−4 λ, ε = 70, andμ = 1 and disregard the effects of thermal diffusion. Thedistance between the cathode and the anode is L = 0.05 m.The heat capacity, the density, and the thermal-conductivitycoefficient of the electrolyte are taken to be 4.2·103 J/(kg·K),103 kg/m3, and 0.6 V/(m·K) respectively. We note that theregimes of pulse action have been considered in [58] asapplied to the processes of electrodeposition of alloys. Thisinvestigation has been carried out on the basis of a separatedescription of the transport of ions and the employmentof the Kirchhoff law for quasistationary currents in a cell.With such an approach, the displacement currents aretaken into account indirectly through introduction of thecapacitive current of the electrode and determination of theexperimental dependence of the polarization capacitance ofthe electrode on the character of the pulse action. In [58],it has been noted that neglect of the capacitive current inpulse electrolysis involves significant errors. The employ-ment of system (73)–(75) to model the process of copperplating makes it possible to consider the problems withoutintroducing the concepts of inductance and capacitance. Theobtained nonlinear system of equations is solved by thefinite-difference method analogously to [54].
We have modeled numerically the process of copperplating for a constant current and a pulse current (Figure 16).The density of the constant current was equal to 300 A/m2.The maximum density of the pulse current was also300 A/m2, while the period of traversal of the current and thebreak were equal to 0.01 sec.
Figure 16 gives the results of modeling the distributionsof the concentration of CuSo4 and the temperature fordifferent regimes of electrolysis. The measurements werecarried out within 60 sec after switching on the current. Itis seen from the figure that the concentration gradients nearthe cathode surface (x = 1) are different and depend on theregime of copper plating. In the case of nonstationary actionthey are substantially smaller than in the case of electrolysisin the regime of constant current. As has been shown in [58],this tendency also holds in the case where one and the sametotal charge passes through the electrochemical cell.
The analysis of the temperature field (Figure 16(b))shows that the temperatures of the electrolyte in the vicinityof the anode and the cathode differ significantly. Nonsym-metric heating of the electrochemical cell attributed to theam-bipolar diffusion and electrical ambipolar conductivityoccurs. The modeling results are in agreement with the dataof [59].
With the aim of measuring the temperature in thesurface layer of the electrolyte solution near the cathode andcomparing the results to the calculated data, we developedand manufactured an experimental setup. Copper anode and

Physics Research International 21
n/n
0
1.4
1.2
1
0.8
0.6
0 0.1 0.2 4.8 4.9x
(a) Distribution of the normalized concentration of CuSO4
x
T
25.2
25.1
25
0 1 2 3 4
(b) Distribution of the temperature
Figure 16: Distribution of the normalized concentration of CuSO4 and the temperature in an electrochemical cell within 60 sec afterswitching on the current. The solid curve, at constant current; the dashed curve, at pulse current. T , ◦C; x, mm.
cathode were placed in an electroplating bath with a sulfuric-acid copper-plating electrolyte. In the 1 mm thick cathode, ahole was made into which we placed a temperature-sensitiveelement. As the latter we employed a thermal resistor. Thecurrent strength in the bath was prescribed by a variableresistor.
Figure 17 gives the results of numerical modeling andthe experimental data on heating of the cathode region inrelation to the regime of current. It is seen that the increasein the density of the current (both constant and pulse)causes the temperature near the cathode surface to increase.In the anode, no increase in the temperature was observedeither in the calculations or in the experiment, which is inagreement with the data of [59]. The surface temperatureobtained in solving (73)–(75) in the regime of constantcurrent is 10–15% higher than the temperature recorded inthe experiments.
A more complicated situation occurs when we comparethe experimental data and the results of numerical modelingin the regime of pulse electrolysis. The results of theexperiments demonstrate that in the regime of pulse currentthe temperature of the electrolyte in the cathode regionincreases more than in the regime of constant current. At thesame time, the numerical calculations of the pulse electrolysisshow that the heating of the cathode region here is smallerthan for the regime of constant current. The differenceis, apparently, attributed to concentration convection [60],whose influence is substantial for high densities of thecurrent for pulse electrolysis.
In a longer term, one must take into account naturaland concentration convection and heat exchange with theambient medium. Nonetheless, despite the errors in determi-nation of the coefficients and the assumptions made in themodel, the calculation results are in qualitative agreementwith the experimental data, which makes it possible, incertain cases, to use the proposed approach for modeling ofnonstationary processes.
Results were published in part [52, 53, 55, 56, 61].
0.3
0.2
0.1
0
ΔT
200 400 600 800Iq
12
−3−4
Figure 17: Heating of the electrolyte in the cathode region as afunction of the value and kind of polarizing current: (1) constantcurrent; (2) pulse current; (3, 4) corresponding experimental data.ΔT , ◦C; Iq, A/m2.
4. Interaction of NonstationaryElectric and Thermal Fields with Allowancefor Relaxation Processes
We investigate electric and thermal fields created by macro-scopic charges and currents in continuous media. Of prac-tical interest is modeling of local heat releases in mediaon exposure to a high-frequency electromagnetic field.We should take into account the influence of the energyabsorption on the propagation of an electromagnetic wave,since the transfer processes are interrelated.
In an oscillatory circuit with continuously distributedparameters, the energy dissipation is linked [62] to thedielectric loss due to the dependence of the relative permit-tivity ε(ω) on frequency. In the general case ε is also complex,

22 Physics Research International
and the relationship between the electric displacement andelectric field vectors has the form D = ε(ω)E, where ε(ω) =ε′(ω)−iε′′(ω); here, ε′ and ε′′ are determined experimentally.As of now, the problems of dielectric heating of a continuousmedium are reduced in many cases to consideration ofan equivalent circuit based on lumped parameters, such ascapacitance, inductance, loss angle, and relative-dielectric-loss factor [63, 64], that are established experimentally.
With this approach, there arise substantial difficultiesin determining the temperature field of equivalent circuits.Also, we have polarization and the occurrence of an electricdouble-layer of a prescribed electric moment in contactof media with different properties. Equivalent circuitsin lamellar media additionally involve empirical lumpedparameters: surface capacitance and surface resistance [65].The total current can always be separated into a dissipativeor conduction current which is in phase with the appliedvoltage and a displacement current shifted in time relative tothe voltage. The exact physical meaning of these componentsof the current is largely dependent on selection of anequivalent electric circuit. A unique equivalent circuit—series or parallel connection of the capacitor, the resistor, andthe inductor—does not exist; it is determined by a more orless adequate agreement with experimental data.
In the case of electrolytic capacitors, the role of one plateis played by the electric double-layer with a specific resistancemuch higher than the resistance of metallic plates. Therefore,decrease in the capacitance with frequency is observed, forsuch capacitors, even in the acoustic-frequency range [65].Circuits equivalent to an electrolytic capacitor are very bulky:up to 12 R, L, and C elements can be counted in them;therefore, it is difficult to obtain a true value of, for example,the electrolyte capacitance. In [65] experimental methodsof measurement of the dielectric properties of electrolytesolutions at different frequencies are given and ε′ and ε′′aredetermined. The frequency dependence of dispersion andabsorption are essentially different consequences of onephenomenon: “dielectric-polarization inertia” [65]. In actualfact, the dependence ε(ω) is attributable to the presenceof the resistance of the electric double-layer and to theelectrochemical cell in the electrolytic capacitor being asystem with continuously distributed parameters, in whichthe signal velocity is a finite quantity.
Actually, ε′ and ε′′ are certain integral characteristics ofa material at a prescribed constant temperature, which aredetermined by the geometry of the sample and the propertiesof the electric double-layer. It is common knowledge thatin the case of a field arbitrarily dependent on time anyreliable calculation of the absorbed energy in terms of ε(ω)turns out to be impossible [45]. This can only be donefor a specific dependence of the field E on time. For aquasimonochromatic field, we have [45]
E(t) = 12
[E0(t)e−iωt + E∗0 (t)eiωt
],
H(t) = 12
[H0(t)e−iωt + H∗
0 (t)eiωt].
(76)
The values of E0(t) and H0(t), according to [66], must veryslowly vary over the period T = 2π/ω. Then, for absorbed
energy, on averaging over the frequency ω, we obtain theexpression [66]:
∂D(t)∂t
E(t) = 14d(ωε′(ω))d(ω)
∂
∂t
[E0(t)E∗0 (t)
]+ωε′′
2E0(t)E∗0 (t)
+ id(ωε′′(ω))
4dω
(∂E0(t)∂t
E∗0 (t)− E∗0 (t)∂t
E0(t))
,
(77)
where the derivatives with respect to frequency are takenat the carrier frequency ω. We note that for an arbitraryfunction E(t), it is difficult to represent it in the form
E(t) = a(t) cosϕ(t), (78)
since we cannot unambiguously indicate the amplitude a(t)and the phase ϕ(t). The manner in which E(t) is decomposedinto factors a and cosϕ is not clear. Even greater difficultiesappear in the case of going to the complex representationW(t) = U(t) + iV(t) when the real oscillation E(t) issupplemented with the imaginary part V(t). The arisingproblems have been considered in [67] in detail. In theindicated work, it has been emphasized that certain methodsusing a complex representation and claiming higher-than-average accuracy become trivial without an unambiguousdetermination of the amplitude, phase, and frequency.
Summing up the aforesaid, we can state that calculationof the dielectric loss is mainly empirical in character.Construction of the equivalent circuit and allowance for theinfluence of the electric double-layer and for the dependenceof electrophysical properties on the field’s frequency are onlytrue of the conditions under which they have been modeled;therefore, these are fundamental difficulties in modeling thepropagation and absorption of electromagnetic energy.
As we believe, the release of heat in media on exposure tononstationary electric fields can be calculated on the basis ofallowance for the interaction of electromagnetic and thermalfields as a system with continuously distributed parametersfrom the field equation and the energy equation which takeaccount of the distinctive features of the boundary betweenadjacent media. When the electric field interacting with amaterial medium is considered we use Maxwell equations(6)-(7). We assume that space charges are absent from thecontinuous medium at the initial instant of time and they donot appear throughout the process. The energy equation willbe represented in the form
ρCpdT
dt= div
[k(T)grad(T)
]+Q, (79)
where Q is the dissipation of electromagnetic energy.According to [68], the electromagnetic energy converted
to heat is determined by the expression
Q = ρ
[Ed
dt
(Dρ
)+H
d
dt
(Bρ
)]+ JqE. (80)
In deriving this formula, we used the nonrelativistic approxi-mation of Minkowski’s theory. If ε, μ, and ρ = const, there is

Physics Research International 23
no heat release; therefore, the intrinsic dielectric loss is linkedto the introduction of ε′(ω) and ε′′(ω). The quantity Q isaffected by the change in the density of the substance ρ(T).
A characteristic feature of high frequencies is the lagof the polarization field behind the charge in the electricfield in time. Therefore, the electric-polarization vector isexpediently determined by solution of the equation P(t +τe) = (ε − 1)ε0E(t) with allowance for the time of electricrelaxation of dipoles τe. Restricting ourselves to the firstterm of the expansion P(t + τe) in a Taylor series, from thisequation, we obtain
P(t) + τedP(t)dt
= (ε − 1)ε0E(t). (81)
The solution (81), on condition that P = 0 at the initialinstant of time, will take the form
P = (ε − 1)ε0
τe
∫ t
t0E(τ)e−(t−τ)/τedτ. (82)
It is noteworthy that (81) is based on the classical Debaymodel. According to this model, particles of a substancepossess a constant electric dipole moment. The indicatedpolarization mechanism involves partial arrangement ofdipoles along the electric field, which is opposed by theprocess of disorientation of dipoles because of thermalcollisions. The restoring “force”, in accordance with (81),does not lead to oscillations of electric polarization. It actsas if constant electric dipoles possessed strong damping.
Molecules of many liquids and solids possess the Debayrelaxation polarizability. Initially polarization aggregates ofDebay oscillators turn back to the equilibrium state P(t) =P(0) exp(−t/τe).
A dielectric is characterized, as a rule, by a large set ofrelaxation times with a characteristic distribution function,since the potential barrier limiting the motion of weaklycoupled ions may have different values [63]; therefore, themean relaxation time of the ensemble of interacting dipolesshould be meant by τe in (81).
To eliminate the influence of initial conditions andtransient processes we set t0 = −∞, E(∞) = 0, H(∞) = 0, asit is usually done. If the boundary regime acts for a fairly longtime, the influence of initial data becomes weaker with timeowing to the friction inherent in every real physical system.Thus, we naturally arrive at the problem without the initialconditions:
P = (ε − 1)ε0
τe
∫ t
−∞E(τ)e−(t−τ)/τedτ. (83)
Let us consider the case of the harmonic field E = E0 sinωt;then, using (83) we have, for the electric induction vector
D = ε0E + P = (ε− 1)ε0
τe
∫ t
−∞E(τ)e−(t−τ)/τedτ + ε0E0 sinωt
= E0(ε − 1)ε0
1 + ω2τ2e
(sinωt − ωτe cosωt)
+ ε0E0 sinωt.(84)
The electric induction vector is essentially the sum of twoabsolutely different physical quantities: the field strength andthe polarization of a unit volume of the medium.
If the change in the density of the substance is small, weobtain, from formula (80), for the local instantaneous heatrelease
Q = EdDdt
= E20(ε− 1)ε0
1 + ω2τ2e
(ω sinωt cosωt + ω2τesin2ωt
),
(85)
when we write the mean value of Q over the total period T :
Q = 12
E20(ε − 1)ε0
1 + ω2τ2e
ω2τe +λE2
2. (86)
For high frequencies (ω → ∞), heat release ceases to bedependent on frequency, which is consistent with formula(86) and experiment [63].
When the relaxation equation for the electric field is usedwe must also take account of the delay of the magnetic field,when the magnetic polarization lags behind the change in thestrength of the external magnetic field:
I(t) + τidI(t)dt
= μμ0H(t). (87)
Formula (86) is well known in the literature; it has beenobtained by us without introducing complex parameters.In the case of “strong” heating of a material where theelectrophysical properties of the material are dependent ontemperature expression (81) will have a more complicatedform and the expression for Q can only be computedby numerical methods. Furthermore, in the presence ofstrong field discontinuities, we cannot in principle obtain theexpression for Q because of the absence of closing relationsfor the induced surface charge and the surface current onthe boundaries of adjacent media; therefore, the issue ofenergy relations in macroscopic electrodynamics is difficult,particularly, with allowance for absorption.
Energy relations in a dispersive medium have repeatedlybeen considered; nonetheless, in the presence of absorption,the issue seems not clearly understood (or at least notsufficiently known), particularly in the determination of theexpression of released heat on the boundaries of adjacentmedia.
Indeed, it is known from the thermodynamics ofdielectrics that the differential of the free energy F has theform
dF = −SdT − PdV + EdD. (88)
If the relative permittivity and the temperature and volumeof the dielectric are constant quantities, from (88) we have
F(T ,D) = F0 + εε0E2
2, (89)
where F0 is the free energy of the dielectrics in the absence ofthe field.
The change of the internal energy of the dielectrics dur-ing its polarization at constant temperature and volume can

24 Physics Research International
be found from the Gibbs-Helmholtz equation. DisregardingF0 which is independent of the field strength, we can obtain
U(T ,D) = F(T ,D)− T(dF
dT
)D. (90)
If the relative dielectric constant is dependent on tempera-ture (ε(T)), we obtain
U(T ,D) = ε0E2
2+
(ε + T
(dF
dT
)D
). (91)
Expression (91) determines the change in the internal energyof the dielectric in its isothermal polarization but withallowance for the energy transfer to a thermostat, if thepolarization causes the dielectric temperature to change. Inthe works on microwave heating, that we know, (91) is notused.
A characteristic feature of high frequencies is that thepolarization field lags behind the change in the externalfield in time; therefore, the polarization vector is expedientlydetermined by solution of the equation:
P(t + τe) =(ε− 1 + T
(dε
dT
)D
)ε0E(t). (92)
With allowance for the relaxation time, that is, restrictingourselves to the first term of the expansion P(t+τe) in a Taylorseries, we obtain
P(t) + τedP(t)dT
=(ε − 1 + T
(dε
dT
)D
)ε0E(t). (93)
In the existing works on microwave heating with the use ofcomplex parameters, they disregard the dependence ε′′(T).In [69], consideration has been given to the incidence ofa one-dimensional wave from a medium with arbitrarycomplex parameters on one or two boundaries of mediawhose parameters are also arbitrary. The amplitudes ofwaves reflected from and transmitted by each boundary havebeen found. The refection, transmission, and absorptioncoefficients have been obtained from the wave amplitudes.The well-known proposition that a traditional selection ofdeterminations of the reflection, transmission, and absorp-tion coefficients from energies (reflectivity, transmissivity,and absorptivity) in the case of complex parameters ofmedia comes into conflict with the law of conservation ofenergy has been confirmed and exemplified. The necessity ofallowing for ε′′(T) still further complicates the problem ofcomputation of the dissipation of electromagnetic energy inpropagation of waves through the boundaries of media withcomplex parameters.
The proposed method of computation of local heatrelease is free of the indicated drawbacks and makes itpossible, for the first time, to construct a consistent modelof propagation of nonmonochromatic waves in a hetero-geneous medium with allowance for frequency dispersionwithout introducing complex parameters.
In closing, we note that a monochromatic wave is infinitein space and time, has infinitesimal energy absorption in amaterial medium, and transfers infinitesimal energy, which
is the idealization of real processes. However with thesestringent constraints, too, the problem of propagation ofwaves through the boundary is open and far from beingresolved even when the complex parameters of the mediumare introduced and used. In reality, the boundary betweenadjacent media is not infinitely thin and has finite dimen-sions of the electric double-layers; therefore, approachesbased on through-counting schemes for a hyperbolic equa-tion without explicit separation of the boundary betweenadjacent media are promising.
5. Ponderomotive Forces inHeterogeneous Lamellar Mediawith Absorption
It is common knowledge that the electric field strength Eis equal to the ponderomotive mechanical force per unitcharge acting at a given point of the field on a test charge(charged body). The issue of the force acting on inducedsurface charges on the boundaries remains to be solved,since there are no closing equations for σ and the chargeis not determined on the interface itself. According to [45],the tension tensor of ponderomotive forces for media withdispersion and absorption due to the dipole relaxationcannot be found in general form in a macroscopic manner atall. As we believe, solution of this problem lies in computingthe induced surface charge on the boundaries and theresultants of all tensions applied externally to the surfacewithout the necessity of reducing bulk ponderomotive forcesto tensions. The reduction of bulk forces to tensions is notnecessarily possible; therefore, this issue will be consideredin greater detail.
5.1. Reduction of Bulk Ponderomotive Forces to Tensions. If fis the bulk density of ponderomotive forces, the resultant ofall forces applied to the bodies within the volume V is
F =∫V
fdV. (94)
On the other hand, if bulk forces can be reduced to tensionsat all, the set of tensions acting externally of a closed surfaceS must be equal to the same quantity. We denote by Tn aforce acting externally per unit surface the external normal towhich is directed along n; the components of this force alongthe coordinate axes are Txn, Tyn and Tzn. Then the resultantof all tensions applied externally to the surface will be
F = �∫
sTndS. (95)
Using the Ostrogradsky-Gauss theorem and equating (94)and (95), we obtain
fx = ∂Txx∂x
+∂Txy
∂y+∂Txz∂z
,
fy =∂Tyx
∂x+∂Tyy
∂y+∂Tyz
∂z,
fz = ∂Tzx∂x
+∂Tzy
∂y+∂Tzz∂z
.
(96)

Physics Research International 25
For the bulk forces and tensions to be equivalent, it isnecessary that not only the resultant of forces applied to anarbitrary volume remains constant but the moment of theseforces be invariant as well [70]. This circumstance imposesan additional constraint on the tension-tensor components.The moment of bulk forces applied to an arbitrary volumeVis
N =∫�Rf�dV , (97)
where R is the distance from point O for which the momentof forces is determined to the element dV . Consequently, thecomponent Nx must satisfy relation (97):
Nx =∫V
(y fz − z fy
)dV
= �∫
s
(yTzn − zTyn
)dS +
∫V
(Tyz − Tzy
)dV.
(98)
The surface integral on the right is equal to the moment oftension forces Tn applied to the surface S of volume V . Themoment of these tension forces will be equal to the momentof bulk forces only in the case where the last integral onthe right is equal to zero. In view of the arbitrariness of thevolume V , this will occur only when the integrand
Tyz = Tzy (99)
is equal to zero.By repeating the same considerations for Ny and Nz, we
obtain Tzx = Txy , Txy = Tyx. Consequently, for the bulkforces and surface ponderomotive forces to be equivalent, thetension tensor must be symmetric. In anisotropic media, thetension tensor is asymmetric; therefore, direct computationof the resultant of forces in terms of tensions from formula(95) is expedient. We note that Maxwell was the first toreduce the field’s ponderomotive forces to tensions. Replace-ment of ponderomotive forces by an equivalent system oftensions makes it much easier to determine forces applied tothe volume of the electric field.
The force applied to a charged layer, given the uncom-pensated surface charge, has the form
FSi j = σ(E1i j − E2
i j
). (100)
If the layer is not charged, we have σ = 0 and FSi j = 0. Theresultant force applied to the boundary of a cell is
F = �∫
Fi jdS. (101)
The projections of fx, fy , and fz are determined accordingto (96), and in a variable electromagnetic field, we must takeinto account that fx, fy , and fz are expended in changingthe density of the momentum flux of the substance and the
electromagnetic field alike. If the forces acting only on the
substance are meant by fx, fy , fz, according to [70], we have
fx = fx −(εμ− 1
) ∂∂t
[E⇀H]x,
fy = fy −(εμ− 1
) ∂∂t
[E⇀H]y,
fz = fz −(εμ− 1
) ∂∂t
[E⇀H]z.
(102)
The expression (εμ− 1)(∂/∂t)[E⇀H] is known to be called the
Abraham force [70].If the medium is heterogeneous and the transmission
of the electromagnetic wave involves its absorption andheating, we propose the following scheme of calculatingponderomotive forces:
(1) the domain under study is subdivided into N cellswith constant properties;
(2) by the method presented in Para 1 and Para 2,we compute the surface charge σ and the surfaceponderomotive force for each cell.
In this approach, we disregard the influence of strictionforces and tensions acting only on the force distributionover the body’s volume but exerting no influence on thevalue of the resultant of all forces and on their moment[70]. Allowance for ponderomotive forces is important, forexample, for biomechanics problems.
The history of the problem of ponderomotive forcesdeveloped into a paradoxical situation where the issues ofcertain basic propositions of classical electrodynamics havebeen discussed to date [66].
6. Conclusion
The consistent physicomathematical model of propagationof an electromagnetic wave in a heterogeneous medium hasbeen constructed using the generalized wave equation andthe Dirichlet theorem. Twelve conditions at the interfaces ofadjacent media were obtained and justified without usinga surface charge and surface current in explicit form. Theconditions are fulfilled automatically in each section of theheterogeneous medium and are conjugate, which made itpossible to use through-counting schemes for calculations.For the first time the effect of concentration of “medium-frequency” waves with a length of the order of hundredsof meters at the fractures and wedges of domains of size1–3 μm has been established. Numerical calculations of thetotal electromagnetic energy on the wedges of domains wereobtained. It is shown that the energy density in the regionof wedges is maximum and in some cases may exert aninfluence on the motion, sinks, and the source of dislocationsand vacancies and, in the final run, improve the near-surfacelayer of glass due to the “micromagnetoplastic” effect.
The results of these calculations are of special importancefor medicine, in particular, when microwaves are usedin the therapy of various diseases. For a small, on the

26 Physics Research International
average, permissible level of electromagnetic irradiation, theconcentration of electromagnetic energy in internal angularstructures of a human body (cells, membranes, neurons,interlacements of vessels, etc.) is possible.
For the first time, we have constructed a consistentphysicomathematical model of interaction of nonstationaryelectric and thermal fields in a layered medium withallowance for mass transfer. The model is based on themethods of thermodynamics and on the equations of anelectromagnetic field and is formulated without explicitseparation of the charge carriers and the charge of an electricdouble-layer. We have obtained the relations for the electric-field strength and the temperature, which take into accountthe equality of the total currents and the energy fluxes,to describe the electric and thermal phenomena in layeredmedia where the thickness of the electric double-layer issmall compared to the dimensions of the object under study.
We have modeled numerically the heating of an electro-chemical cell with allowance for the influence of the electricdouble-layer at the metal-electrolyte interface. The calcula-tion results are in satisfactory agreement with experimentaldata.
Notation⇀B: Axial vector of magnetic
induction, Wb/m2
D: Electric displacement, C/m2
DM : Molecular diffusioncoefficient, m2/sec
Di: Diffusion coefficients ofanions and cations, m2/sec
DA: Ambipolar diffusioncoefficient, A/(m·kg)
D∗A : Ambipolar diffusioncoefficient, kg/(A·sec)
E: Electric field strength, V/mF: Free energy of the unit
volume of a dielectric, J/m3
F: Faraday’s constant,96.985 C/eq.
F0: Free energy of a dielectric inthe absence of a field, J/m3
J : Current density, A/m2
⇀H: Magnetic field strength, A/mh: Thickness of the electric
double-layer, mIq, Iq: Normal components of the
conduction current inmedia 1 and 2, C/(m2·sec)
iτ : Surface current, A/mi, j, k: Unit vectors of the
orthonormalized basisjtot: Total current, A/mL: Length, ml: Average distance between
ferroparticles, m
n: Unit vector normal to theinterface
n: Concentration, kg/m3
nA: Concentration of neutralmolecules, kg/m3
ni: Concentration of dissociatedmolecules, kg/m3
nm: Molar concentration,g·eq./liter
R: Universal gas constantR: Resistance, Ω·mP: Pressure, Paq: Mass flux, kg/(m2·sec)r: Radius of a particle, μmS: Interface between adjacent
mediaT : Temperature, ◦Ct: Time, secV : Volume, m3
υ: Velocity of the slip of aferroparticle over the treatedsurface, m/sec
U : Voltage, VW : Magnetic field density, J/m3
x, y, z: Cartesian coordinates;β: Equilibrium constantα: Degree of dissociationε: Relative permittivityε0: Electric constant equal to
8.58·10−12 F/mϕ: Electric potential, Vk: Boltzmann constant;λ: Electrical conductivity, Ω·mke: Electrochemical equivalent
of copper, kg/Cλ∗A(n): Coefficient of specific
electrical ambipolarconductivity, V·m3/kg
λ: Average value of electricalconductivity, Ω·m
μ: Relative permeabilityμ0: Magnetic constant equal to
4π·10−7 gf/mμc: Chemical potentialξ: Discontinuity pointρ: Specific electric charge,
C/m2
ρR: Conductanceσ : Surface density of a charge,
C/m2
ω: Angular frequency, 1/sec
∇ ≡ ∂
∂x+
∂
∂y+∂
∂z: Symbolic operator
[ f ]|x=ξ = f1|x=ξ+0− f2|x=ξ−0: Subscripts: 0, constantcomponent of a magneticfield H
1: First medium2: Second mediumn: Normal

Physics Research International 27
q: Chargem: Impurity massa: AnodeA: AmbipolarM: Moleculare: Equivalentc: Concentrationi: Number of the grid nodej: Componentmax: Maximumn, τ: Directions normal and
tangential to the interfacex: Normal component of a
vectory, z: Tangential components of a
vector at the interfacebetween adjacent media
tot: Total.
Acknowledgments
The authors express their gratitude to CorrespondingMember of the National Academy of Sciences of BelarusN.V. Pavlyukevich, Corresponding Member of the NationalAcademy of Sciences of Belarus Professor V.I. Korzyuk for auseful discussion of the work. This work war carried out withfinancial support from the Belarusian Republic Foundationfor Basic Research and from the Science Support Foundationof Poland “Kassa im. Myanowski” (2005).
References
[1] I. Monzon, T. Yonte, and L. Sanchez-Soto, “Characterizingthe reflectance of periodic lasered media,” Characterizing thereflectance of periodic lasered media, vol. 218, pp. 43–47, 2003.
[2] Y. Eremin and T. Wriedt, “Large dielectric non-sphericalparticle in an evanescent wave field near a plane surface,”Optics Communications, vol. 214, no. 1–6, pp. 39–45, 2003.
[3] W. Hu and H. Guo, “Ultrashort pulsed Bessel beams andspatially induced group-velocity dispersio,” Journal of theOptical Society of America A, vol. 19, no. 1, pp. 49–52, 2002.
[4] D. Danae, P. Bienstman, R. Bockstaele, and R. Baets, “Rigorouselectromagnetic analysis of dipole emission in periodicallycorrugated layers: the grating-assisted resonant-cavity light-emitting diode,” Journal of the Optical Society of America A,vol. 19, no. 5, pp. 871–880, 2002.
[5] J. I. Larruquert, “Reflectance enhancement with sub-quar-terwave multilayers of highly absorbing materials,” Journal ofthe Optical Society of America A, vol. 18, no. 6, pp. 1406–1414,2001.
[6] B. M. Kolundzija, “Electromagnetic modeling of compositemetallic and dielectric structures,” IEEE Transactions onMicrowave Theory and Techniques, vol. 47, no. 7, pp. 1021–1032, 1999.
[7] R. A. Ehlers and A. C. R. Metaxas, “3-D FE discontinuoussheet for microwave heating,” IEEE Transactions on MicrowaveTheory and Techniques, vol. 51, no. 3, pp. 718–726, 2003.
[8] O. Barta, J. Pistora, J. Vlcek, F. Stanek, and T. Kreml, “Mag-neto-optics in bi-gyrotropic garnet waveguide,” Opto-Elec-tronics Review, vol. 9, no. 3, pp. 320–325, 2001.
[9] J. Broe and O. Keller, “Quantum-well enhancement of theGoos-Hanchen shift for p-polarized beams in a two-prismconfiguration,” Journal of the Optical Society of America A, vol.19, no. 6, pp. 1212–1222, 2002.
[10] O. Keller, “Optical response of a quantum-well sheet: internalelectrodynamics,” Journal of the Optical Society of America B,vol. 12, no. 6, pp. 997–1005, 1995.
[11] O. Keller, “Sheet-model description of the linear opticalresponse of quantum wells,” Journal of the Optical Society ofAmerica B, vol. 12, no. 6, pp. 987–997, 1995.
[12] O. Keller, “V: local fields in linear and nonlinear optics ofmesoscopic system,” Progress in Optics, vol. 37, pp. 257–343,1997.
[13] G. A. Grinberg and V. A. Fok, “On the theory of CoastalRefraction of Electromagnetic Waves,” in Investigations onPropagation of Radio Waves, B. A. Vvedenskii, Ed., M-L. ANSSSR, 1948.
[14] N. N. Grinchik and A. P. Dostanko, “Influence of Thermal andDiffusional Processes on the Propagation of ElectromagneticWaves in Layered Materials,” Minsk: ITMO im. A. V. Luikova,NAN Belarusi, 2005.
[15] M. Born, Principles of Optics, Mir, Moscow, Russia, 1970.[16] L. Kudryavtsev, Mathematical Analysis, Mir, Moscow, Russia,
1970.[17] A. Frumkin, Electrode Processes, Nauka, Moscow, Russia, 1987.[18] A. N. Tikhonov and A. A. Samarskii, Equations of Mathemati-
cal Physics, Nauka, Moscow, Russia, 1977.[19] A. F. Kryachko et al., Theory of Scattering of Electromagnetic
Waves in the Angular Structure, Nauka, Moscow, Russia, 2009.[20] M. Leontovich, On the Approximate Boundary Conditions for
the Electromagnetic Field on the Surface of Well ConductingBodies, On the approximate boundary conditions for theelectromagnetic field on the surface of well conducting bodies,Moscow, Russia, 1948.
[21] N. N. Grinchik, A. P. Dostanko, I. A. Gishkelyuk, and Y. N.Grinchik, “Electrodynamics of layered media with boundaryconditions corresponding to the total-current continuum,”Journal of Engineering Physics and Thermophysics, vol. 82, no.4, pp. 810–819, 2009.
[22] Z. P. Shul’man and V. I. Kordonskii, Magnetorheological Effect,Nauka i Tekhnika, Minsk, Russia, 1982.
[23] M. Khomich, Magnetic-Abrasive Machining of the Manufac-tured Articles, BNTU, Minsk, Russia, 2006.
[24] M. N. Levin et al., “Activation of the surface of semiconductorsby the effect of a pulsed magnetic field,” Zh. Tekh. Fiz., vol. 73,no. 10, pp. 85–87, 2003.
[25] A. M. Orlov et al., “Magnetic- stimulated alteration of themobility of dislocations in the plastically deformed silicon ofn-type,” Fiz. Tverd. Tela, vol. 43, no. 7, pp. 1207–1210, 2001.
[26] V. A. Makara et al., “On the influence of a constant magneticfield on the electroplastic effect in silicon crystals,” Fiz. Tverd.Tela, no. 3, pp. 462–465, 2001.
[27] A. P. Rakomsin, Strengthening and Restoration of Items in anElectromagnetic Field, Paradoks, Minsk, Russia, 2000.
[28] Yu. I. Golovin et al., “Influence of weak magnetic fields on thedynamics of changes in the microhardness of silicon initiatedby low-intensity beta-irradiation,” Fiz. Tverd. Tela, vol. 49, no.5.
[29] V. A. Makara et al., “Magnetic field-induced changes in theimpurity composition and microhardness of the near-surfacelayers of silicon crystals,” Fiz. Tekh. Poluprovadn, vol. 42, no. 9,pp. 1061–1064, 2008.
[30] A. M. Orlov et al., “Dynamics of the surface dislocationensembles in silicon in the presence of mechanical and

28 Physics Research International
magnetic perturbation,” Fiz. Tverd. Tela, vol. 45, no. 4, pp.613–617, 2003.
[31] N. S. Akulov, Dislocations and Plasticity, Izd. AN BSSR, Minsk,Russia, 1961.
[32] N. S. Akulov, Ferromagnetism, ONTI, Leningrad, Russia, 1939.[33] I. P. Bazarov, Thermodynamics: Textbook for Higher Educa-
tional Establishments, Vysshaya Shkola, Moscow, Russia, 1991.[34] N. N. Grinchik et al., “Electrodynamic processes in a surface
layer in magnetoabrasive polishing,” Journal of EngeneeringPhysics and Thermodynamics, vol. 83, no. 3, pp. 638–649, 2010.
[35] A. Einstein, Elementary Theory of Brownian Motion, CollectedPapers (3), 1966.
[36] V. E. Golant et al., Fundamental Principles of Plasma Physics,Moscow, Russia, 1977.
[37] Y. Kharkats, “Dependence of the limiting diffusion-migrationcurrent on the degree of electrolyte dissociation,” Elek-trokhimiya, vol. 24, no. 4, pp. 539–541, 1988.
[38] A. Sokirko and Yu. Kharkats, “the limiting di f fus ionand migration currents as functions of the rate constants ofelectrolyte dissociation and recombination,” Elektrokhimiya,vol. 25, no. 3, pp. 331–335, 1989.
[39] D. V. Gibbs, Thermodynamics. Statistical Mechanics, Moscow,Russia, 1982.
[40] L. N. Antropov, Theoretical Electrochemistry, Moscow, Russia,1984.
[41] H. G. Hertz, Electrochemistry, New York, NY, USA, 1980.[42] V. Levich et al., Physicochemical Hydrodynamics, Moscow,
Russia, 1959.[43] J. Neumann, Electrochemical Systems, Moscow, Russia, 1977.[44] V. Skorcheletti, Theoretical Electrochemistry, Leningrad, Rus-
sia, 1969.[45] L. D. Landau and E. M. Lifshits, Theoretical Physics. Vol. 8.
Electrodynamics of Continuous Media, Moscow, Russia, 1982.[46] V. Tsurko, Tr. Inst. Mat. Nats. Akad. Nauk Belarusi, vol. 3, pp.
128–133, 1999.[47] A. I. Shvab, Elektrichestvo, no. 4, pp. 59–67, 1994.[48] A. I. Shvab and F. Imo, Elektrichestvo, no. 5, pp. 55–59, 1994.[49] N. N. Grinchik et al., Vesti Nats. Akad. Nauk Belarusi , Ser. Fiz.-
Mat. Navuk, vol. 2, pp. 66–70, 1997.[50] I. E. Tamm, Principles of the Theory of Electricity, Moscow,
Russia, 1976.[51] J. A. Stratton, The Theory of Electromagnetism, Leningrad,
Russia, 1938.[52] N. N. Grinchik, “Diffusional-electrical phenomena in elec-
trolytes,” Journal of Engineering Physics and Thermophysics,vol. 64, no. 5, pp. 497–504, 1993.
[53] N. N. Grinchik, “Electrodiffusion phenomena in electrolytes,”Inzhenerno-Fizicheskii Zhurnal, vol. 64, no. 5, pp. 610–618,1993.
[54] N. N. Grinchik et al., “Interaction of thermal and electricphenomena in polarized media,” Mat. Modelir, vol. 12, no. 11,pp. 67–76, 2000.
[55] N. N. Grinchik, Modeling of Electrical and ThermophysicalProcesses in Layered Medium, Belorusskaya Nauka Press,Minsk, Russia, 2008.
[56] N. N. Grinchik, A. N. Muchynski, A. A. Khmyl, and V.A. Tsurkob, “Finite-differences method for modeling electricdiffusion phenomena,” Matematicheskoe Modelirovanie, vol.10, no. 8, pp. 55–66, 1998.
[57] L. N. Antropov, Theoretical Electrochemistry, Moscow, Russia,1989.
[58] N. A. Kostin and O. V. Labyak, Elektrokhimiya, vol. 31, no. 5,pp. 510–516, 1995.
[59] A. I. Dikusar et al., Thermokinetic Phenomena in High-Frequency Processes, Kishinev, 1989.
[60] F. Bark, Yu. Kharkats, and R. Vedin, Elektrokhimiya, vol. 34,no. 4, pp. 434–44, 1998.
[61] N. N. Grinchik and V. A. Tsurko, “Problem of modeling of theinteraction of nonstationary electric, thermal, and diffusionfield in layered media,” Journal of Engeneering Physics andThermodynamics, vol. 75, no. 3, pp. 693–699, 2002.
[62] P. Kolesnikov, Theory and Calculation of Waveguides, light-guides, and integral-optoelectronics elements. Electrodynamicsand Theory of Waveguides, ITMO NAN Belarusi, Minsk,Russia, 2001.
[63] T. Skanavi, Dielectric Physics (Region of Weak Fields),Gostekhizdat, Moscow, Russia, 1949.
[64] P. Perre and I. W. Turner, “ A complete coupled model of thecombined microwave and convective drying of softwood in anoversized waveguid,” in Proceedings of the 10th InternationalDrying Symposium (IDS’96), vol. A, pp. 183–194, Krakow,Poland, 1996.
[65] J. Jaeger, Methods of Measurement in Electrochemistry, Moscow,Russia, 1977.
[66] Y. Barash and V. L. Ginzburg, “On the expressions ofenergy density and the release of heat in electrodynamics ofa dispersing and absorbing medium,” Uspekhi FizicheskikhNauk, vol. 118, no. 3, p. 523, 1976.
[67] D. E. Vakman and L. A. Vanshtein, “Amplitude, phase, fre-quency are the principal notions in the theory of ossillations,”Uspekhi Fizicheskikh Nauk, vol. 123, no. 4, p. 657, 1977.
[68] B.-T. Choo, Plasma in a Magnetic Field and Direct Thermal-to-Electric Energy Conversion, Moscow, Russia, 1962.
[69] I. V. Antonets, L. N. Kotov, V. G. Shavrov, and V. I.Shcheglov, “Energy characteristics of propagation of a wavethrough the boundaries of media with complex parameters,”Radiotekhnika i Elektronika, vol. 54, no. 10, pp. 1171–1183,2009.
[70] I. E. Tamm, Foundations of Electricity Theory, Nauka, Moscow,Russia, 2003.

Hindawi Publishing CorporationPhysics Research InternationalVolume 2012, Article ID 690793, 20 pagesdoi:10.1155/2012/690793
Research Article
Magneto-Optical and Magnetic Studies ofCo-Rich Glass-Covered Microwires
Alexander Chizhik and Valentina Zhukova
Departamento de Fısica de Materiales, Facultad de Quımica, Universidad del Pais Vasco, UPV/EHU, 1072,20080 San Sebastian, Spain
Correspondence should be addressed to Alexander Chizhik, [email protected]
Received 22 July 2011; Revised 10 January 2012; Accepted 18 January 2012
Academic Editor: Mitsuteru Inoue
Copyright © 2012 A. Chizhik and V. Zhukova. This is an open access article distributed under the Creative Commons AttributionLicense, which permits unrestricted use, distribution, and reproduction in any medium, provided the original work is properlycited.
The magnetization reversal process in the surface and volume areas of Co-rich glass-covered microwires has been investigated. Thestudy has been performed in the wide series of microwires with chemical composition, geometry (thickness of glass coating) withthe purpose of the tailoring of the giant magnetoimpedance effect. The comparative analysis of the magnetoelectric, magnetic,and magneto-optical experiments permits to optimise the giant magnetoimpedance ratio and elucidate the main properties of themagnetization reversal process in the different parts of the Co-rich microwire.
1. Introduction
The investigation of the magnetization reversal process inamorphous wires and microwires is one of the most impor-tant tasks related to the use of these magnetic wires in differ-ent technological devices. In particular, the intensive studiesof magnetic properties of nearly zero magnetostriction Co-rich wires and glass-covered microwires have been per-formed in relation with the giant magnetoimpedance (GMI)effect [1]. This GMI effect is of great interest in sensor appli-cation. As is well known, the origin of the GMI effect isrelated with the penetration depth of the skin effect. Conseq-uently, the investigation and comparison on the magneti-zation reversal in the surface and volume areas of the wirebecome a particular importance.
The present paper is devoted to the recent results onmagneto-optical Kerreffect and fluxmetric investigations ofthe magnetization reversal and domain structure in glass-coated microwires. Having in our laboratory the wide lineof the magnetic, magnetoelectric, and magneto-optic experi-mental techniques, we have created the new direction of thecomplex study of glass covered microwires. During last years,we have performed series of the magneto-optical investi-gations of different types of the glass covered microwires.Kerr effect and fluxmetric methods as two complementary
methods provide the complex information relatively on themagnetization reversal and magnetic domain structure inthe volume and in the surface of the microwires. Analyzingthe experimental results obtained by these two methods wecould model and predict the time and space distribution andtransformation of the tree-dimensional magnetic structureof the cylindrical-shaped microwires.
In turn, the magneto-optical set-up which we use tostudy the microwires consists of two complementary parts:Kerr effect magnetometer and Kerr effect microscopy. Takinginto account non-plane surface of the studied micorwiresthe application of the Kerr effect technique is accompaniedby the specific difficulties which were successfully overcameduring the experiments performed in our laboratory. First,the doubt relatively possible application of Kerr effect wasrelated to the possible interference which could be producedby the glass covering. This doubt was resolved: because ofextremely thin thickness the glass covering does not presentnoticeable contribution. Second, the difficult related to thelight reflection from the cylindrical surface of the microwirewas resolved by the application of the system of lenses anddiaphragms. In the same time, application of the Kerr effectmicroscopy to the study of the non-plane surface of themicrowire gave unexpected result: the series of the original
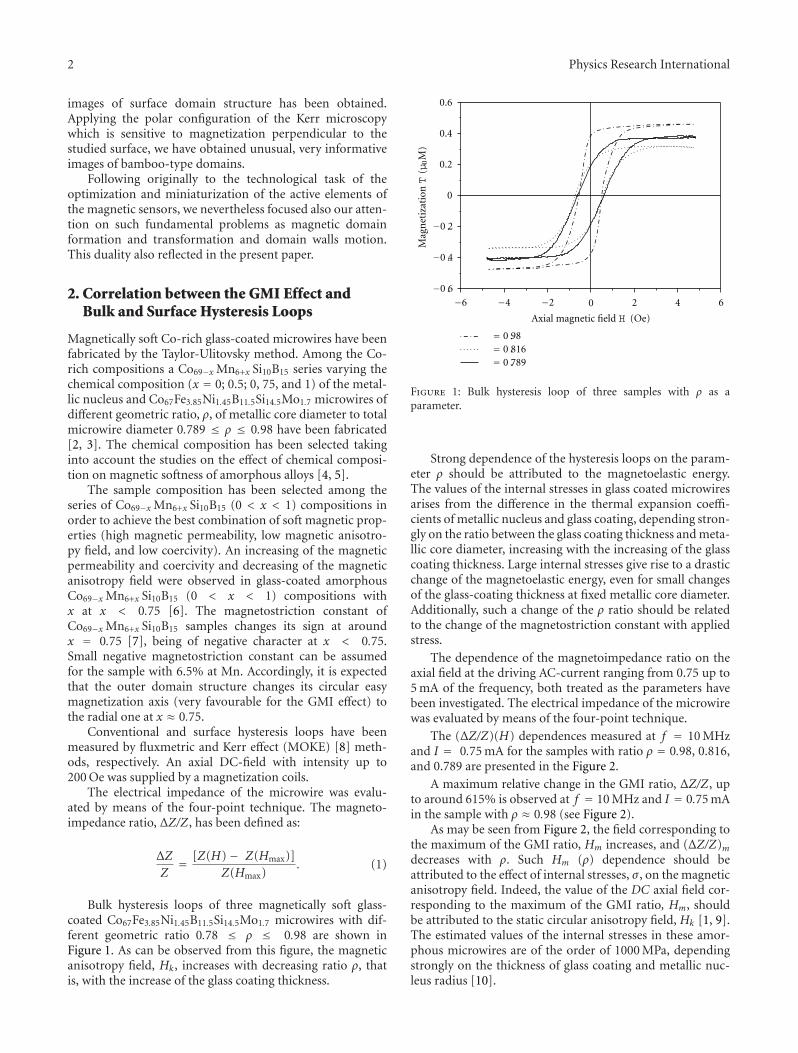
2 Physics Research International
images of surface domain structure has been obtained.Applying the polar configuration of the Kerr microscopywhich is sensitive to magnetization perpendicular to thestudied surface, we have obtained unusual, very informativeimages of bamboo-type domains.
Following originally to the technological task of theoptimization and miniaturization of the active elements ofthe magnetic sensors, we nevertheless focused also our atten-tion on such fundamental problems as magnetic domainformation and transformation and domain walls motion.This duality also reflected in the present paper.
2. Correlation between the GMI Effect andBulk and Surface Hysteresis Loops
Magnetically soft Co-rich glass-coated microwires have beenfabricated by the Taylor-Ulitovsky method. Among the Co-rich compositions a Co69−x Mn6+x Si10B15 series varying thechemical composition (x = 0; 0.5; 0, 75, and 1) of the metal-lic nucleus and Co67Fe3.85Ni1.45B11.5Si14.5Mo1.7 microwires ofdifferent geometric ratio, ρ, of metallic core diameter to totalmicrowire diameter 0.789 ≤ ρ ≤ 0.98 have been fabricated[2, 3]. The chemical composition has been selected takinginto account the studies on the effect of chemical composi-tion on magnetic softness of amorphous alloys [4, 5].
The sample composition has been selected among theseries of Co69−x Mn6+x Si10B15 (0 < x < 1) compositions inorder to achieve the best combination of soft magnetic prop-erties (high magnetic permeability, low magnetic anisotro-py field, and low coercivity). An increasing of the magneticpermeability and coercivity and decreasing of the magneticanisotropy field were observed in glass-coated amorphousCo69−x Mn6+x Si10B15 (0 < x < 1) compositions withx at x < 0.75 [6]. The magnetostriction constant ofCo69−x Mn6+x Si10B15 samples changes its sign at aroundx = 0.75 [7], being of negative character at x < 0.75.Small negative magnetostriction constant can be assumedfor the sample with 6.5% at Mn. Accordingly, it is expectedthat the outer domain structure changes its circular easymagnetization axis (very favourable for the GMI effect) tothe radial one at x ≈ 0.75.
Conventional and surface hysteresis loops have beenmeasured by fluxmetric and Kerr effect (MOKE) [8] meth-ods, respectively. An axial DC-field with intensity up to200 Oe was supplied by a magnetization coils.
The electrical impedance of the microwire was evalu-ated by means of the four-point technique. The magneto-impedance ratio, ΔZ/Z, has been defined as:
ΔZ
Z= [Z(H)− Z(Hmax)]
Z(Hmax). (1)
Bulk hysteresis loops of three magnetically soft glass-coated Co67Fe3.85Ni1.45B11.5Si14.5Mo1.7 microwires with dif-ferent geometric ratio 0.78 ≤ ρ ≤ 0.98 are shown inFigure 1. As can be observed from this figure, the magneticanisotropy field, Hk , increases with decreasing ratio ρ, thatis, with the increase of the glass coating thickness.
0 2 4 6
0
0.2
0.4
0.6
−4−6 −2−0.6
−0.4
−0.2
= 0.98= 0.816= 0.789
Axial magnetic field H (Oe)
Mag
net
izat
ionT
(μ0M
)
Figure 1: Bulk hysteresis loop of three samples with ρ as aparameter.
Strong dependence of the hysteresis loops on the param-eter ρ should be attributed to the magnetoelastic energy.The values of the internal stresses in glass coated microwiresarises from the difference in the thermal expansion coeffi-cients of metallic nucleus and glass coating, depending stron-gly on the ratio between the glass coating thickness and meta-llic core diameter, increasing with the increasing of the glasscoating thickness. Large internal stresses give rise to a drasticchange of the magnetoelastic energy, even for small changesof the glass-coating thickness at fixed metallic core diameter.Additionally, such a change of the ρ ratio should be relatedto the change of the magnetostriction constant with appliedstress.
The dependence of the magnetoimpedance ratio on theaxial field at the driving AC-current ranging from 0.75 up to5 mA of the frequency, both treated as the parameters havebeen investigated. The electrical impedance of the microwirewas evaluated by means of the four-point technique.
The (ΔZ/Z)(H) dependences measured at f = 10 MHzand I = 0.75 mA for the samples with ratio ρ = 0.98, 0.816,and 0.789 are presented in the Figure 2.
A maximum relative change in the GMI ratio, ΔZ/Z, upto around 615% is observed at f = 10 MHz and I = 0.75 mAin the sample with ρ ≈ 0.98 (see Figure 2).
As may be seen from Figure 2, the field corresponding tothe maximum of the GMI ratio, Hm increases, and (ΔZ/Z)mdecreases with ρ. Such Hm (ρ) dependence should beattributed to the effect of internal stresses, σ , on the magneticanisotropy field. Indeed, the value of the DC axial field cor-responding to the maximum of the GMI ratio, Hm, shouldbe attributed to the static circular anisotropy field, Hk [1, 9].The estimated values of the internal stresses in these amor-phous microwires are of the order of 1000 MPa, dependingstrongly on the thickness of glass coating and metallic nuc-leus radius [10].

Physics Research International 3
0 10 20 30
0
200
400
600f= 10 MHz
= 0.98= 0.816= 0.789
Axial magnetic field H (Oe)
Mag
net
oim
peda
nce
rat
ioΔZ/Z
(%)
Figure 2: Axial field dependence of ΔZ/Z at f = 10 MHz and I =0.75 mA in microwire with ρ as a parameter.
It has been demonstrated that the spatial magnetizationdistribution close to the surface is very sensitive to theinternal or applied stresses [11, 12].
It was shown that the (ΔZ/Z)(H) dependence is mainlydetermined by the type of magnetic anisotropy [12]. Circum-ferential anisotropy leads to the observation of the maximumof the real component of wire impedance (and consequentlyof the GMI ratio) as a function of the external magneticfield. In the case of axial magnetic anisotropy, the maxi-mum value of the GMI ratio corresponds to zero magneticfield [12], that is, results in monotonic decay of GMI ratiowith H . Therefore, the important contribution of the non-diagonal components of the permeability tensor is expectedfor the samples with well-defined maximum in the axial fielddependence of GMI ratio [12].
The MOKE hysteresis loop reflects the axial field depen-dence of circular magnetization (see Figure 3) in the outershell of the wire. The transverse configuration of MOKE hasbeen used. The polarized light of a He-Ne laser was reflectedfrom the microwire to the detector. The beam diame-ter was 0.8 mm. For the transverse configuration of MOKE,the intensity of the reflected light was proportional to themagnetization, which was perpendicular to the plane of inci-dent light.
Observed MOKE hysteresis loops can be interpreted inthe following way: the absence of the circular magnetizationunder axial magnetic field above 2 Oe reflects the axialalignment of the magnetization in the surface layer at thismagnetic field range. The monotonic increase of the mag-netization with decreasing the field below 2 Oe is relatedto the magnetization rotation from the axial to the circulardirection. The relatively sharp change of magnetization (ataround±0.7 Oe) could be attributed to the nucleation of newdomains with the opposite circular magnetization (appear-ance of bamboo-like domain structure), and growth of thesenew domains through the domain walls propagation, until
0 2 4
0
50
100
150
200
250
300
350
400
450
−2
−50
−4
−1
1
Ker
r in
ten
s. (
a.u
.)
Ibias =Ibias =
Ibias =Ibias = 0
MOKE hysteresis loop
Axial magnetic field H (Oe)
Mag
net
o-im
peda
nce
rat
ioΔZ/Z
(%)
2.1 mA1.6 mA
1.1 mA
Figure 3: ΔZ/Z and MOKE hysteresis loop of microwire with ρ =0.98.
the single circular domain structure with the opposite circ-ular magnetization is appeared. Further increase of H resultsin the magnetization rotation towards the axial direction.
A correlation has been observed between the (ΔZ/Z)(H)and the surface axial hysteresis loops: a maximum of GMIratio occurs approximately at the same axial magnetic fieldas the sharp change of magnetization on the MOKE loop(see Figure 3).
3. Effect of the Sample Composition andGeometry on the Bulk Hysteresis Loops
Hysteresis loops of Co-rich glass-coated microwires withsample composition as the parameter (Co69−x Mn6+x Si10B15)are shown in Figure 4 [3].
As can be observed, hysteresis loops are quite sensible toboth parameters chemical composition and sample geometry(Figure 1).
Such strong dependence of the hysteresis loops on theseparameters can be related with the magnetoelastic energy. Infact the magnetoelastic energy is given by
Kme ≈ 3/2λsσi, (2)
where λs is the saturation magnetostriction, and σi are the in-ternal stresses.
The magnetostriction constant depends on the chemicalcomposition achieving nearly zero value in amorphous Fe-Co- based alloys at about %Co/%Fe ≈ 70/5 [4, 5]. On theother hand, the estimated values of the internal stresses inthese amorphous microwires arising from the difference inthe thermal expansion coefficients of metallic nucleus andglass coating are of the order of 100–1000 MPa, dependingstrongly on the thickness of glass coating and metallic corediameter [13]. It was established that the strength of suchinternal stresses increase with increasing the glass coatingthickness. Such large internal stresses give rise to a drasticchange of the magnetoelastic energy, Kmei, even for small

4 Physics Research International
0 2 4
0
0.2
0.4
0.6
−4 −2
−0.6
−0.4
−0.2
H (Oe)
T(μ
0M
)
(a)
0 1 2 3−3 −2 −1
0
0.2
0.4
0.6
−0.6
−0.4
−0.2
H (Oe)
T(μ
0M
)
(b)
0 0.2 0.4
0
0.2
0.4
0.6
−0.6
−0.4
−0.4
−0.2
−0.2
H (Oe)
T(μ
0M
)
(c)
Figure 4: Hysteresis loops of the Co69−x Mn6+x Si10B15 microwires. x = 1 (a); x = 0, 5 (b); x = 0 (c).
changes of the glass-coating thickness at fixed metallic corediameter. Additionally, such change of the ρ-ratio should berelated to the change of the magnetostriction constant withapplied stress [14]:
λs =(μ0Ms
3
)(dHk
dσ
), (3)
where μ0 is the free space permeability equals 4π × 10−7 H/mand Ms—the saturation magnetization.
These considerations allow us to predict that any methodto change the internal stresses (by using thermal treatment,chemical etching, etc.) can change drastically magnetic ani-sotropy and consequently the hysteresis loops and the GMIbehaviour.
Thermal treatment has been realized either by Jouleheating passing along the microwire sample a DC-current of30 and 40 mA, at various times of this treatment or by con-ventional furnace annealing. This Joule heating has beenperformed without additional external field (CA) and underaxial applied magnetic field of about 100 Oe (MFA). Elec-trical contacts were made removing mechanically the glassinsulating layer at the sample edges and soldering them withthe Cu cables.
Consequently, the hysteresis loops of Co69−x Mn6+x Si10B15
(x = 0.5) has been changed after MFA treatment (seeFigure 5), and the GMI response has been improved.
Similarly, in the case of Co69−x Mn6+x Si10B15 (x = 0.5)microwire, the MFA treatment of Co67Fe3.85Ni1.45B11.5Si14.5Mo1.7
microwire also induces changes in hysteresis (see Figure 6).In this case, the external axial magnetic field applied during
the MFA treatment induces axial magnetic anisotropy, likewhat can be appreciated from Figure 6.
It is worth mentioning that appearance of Large andsingle Barkhausen jump takes place under magnetic fieldabove some critical value (denominated as switching field)and also if the sample length is above some critical value de-nominated also as critical length. The switching field dependson magnetoelastic energy determined by the strength of theinternal stresses, applied stresses and magnetostriction cons-tant. The critical length first increases with stress, but thenagain decreases.
Conventional annealing performed at Tann = 400◦C inFe74B13Si11C2 does not affect significantly the magnetic pro-perties of studied sample (see Figure 7): some decrease ofHc has been observed, while the squared character of thehysteresis loop remains unchanged (Figure 7(b)). On theother hand, stress annealing, (SA), is performed at the sameannealing conditions (Tann = 400◦C) but under appliedstress, σ = 458 MPa, results in drastic changes of the hyster-esis loop (see Figure 7(c)): hysteresis loop becomes inclinedwith a magnetic anisotropy field about 1000 A/m. A trans-verse magnetic anisotropy induced by the SA allows us topredict the existence of the magnetoimpedance effect in suchsamples.
Above-mentioned results allow us to assume that thereare few factors which can affect the GMI behaviour of theglass coated microwires such as-following:
(a) metallic nucleus chemical composition;
(b) samples geometry;
(c) thermal treatments.

Physics Research International 5
0 1 2−2 −1
0
0.2
0.4
0.6
−0.6
−0.4
−0.2
H (Oe)
T(μ
0M
)
(a)
0 0.5 1
0
0.2
0.4
0.6
−0.6
−0.4
−0.5
−0.2
−1
H (Oe)
T(μ
0M
)
(b)
Figure 5: Effect of the MFA (current annealing under axial appliedmagnetic field) treatment on hysteresis loops of Co69−x Mn6+x Si10B15
(x = 0.5) microwires: (a) as-cast; (b) MFA.
4. Effect of the Sample Composition on theSurface Hysteresis Loops
The Kerr effect experiments have been performed in micro-wires of nominal composition (Co1−x Mnx)75Si10B15 (diam-eter around 20 μm) with different content of Mn (0.07 < x <0.11) [15].
There were four schemes of the experiments, dependingon the combination of magnetic field combination and thetype of Kerr effect:
(1) transverse Kerr effect at sweeping of circular field (+axial bias field);
(2) longitudinal Kerr effect at sweeping of circular field(+ axial bias field);
(3) transverse Kerr effect at sweeping of axial field (+circular bias field);
(4) longitudinal Kerr effect at sweeping of axial field (+circular bias field).
The obtained Kerr effect loops show different shape,which can be attributed to different type of domain struc-ture and difference in the magnetization reversal process(Figure 8).
0 1
0
0.5
1
−1
−1
−0.5
As-castCA at 30 mACA at 40 mA
M/M
s
H (Oe)
(a)
0 1
0
0.5
1
−1
−1
−0.5
As-castMFA at 30 mAMFA at 40 mA
M/M
s
H (Oe)
(b)
Figure 6: Effect of CA (current annealing without additional ex-ternal magnetic field) (a) and MFA (b) treatments on bulk hysteresisloops of Co67Fe3.85Ni1.45B11.5Si14.5Mo1.7 microwires.
The transverse and longitudinal Kerr effect loops obt-ained in ac circular field for the microwire with x = 0.07 arepresented in the Figures 8(a) and 8(b). From the analysis ofthese curves, it is possible to conclude that jumps of circularmagnetization take place. The rectangular shape of trans-verse curve and the peaks in the longitudinal curve are relatedto quick rotation of magnetization in circular surface domainsimilar to large Barkhausen jump.
For the microwire with content of Mn x = 0.11, the rec-tangular shape of the magnetization reversal curve was found

6 Physics Research International
0 1 2
0
1
−2
−1
−1
H (Oe)
T(μ
0M
)
(a)
0 1 2
0
1
−2
−1
−1
H (Oe)
T(μ
0M
)
(b)
0 10 20
0
0.5
−10−20
−0.5
H (Oe)
T(μ
0M
)
(c)
Figure 7: Effect of CA and SA (stress annealing) on bulk hysteresisloops of Fe74B13Si11C2 microwire: (a) as cast; (b) conventional anne-aling; (c) stress annealing.
in ac axial field (Figures 8(c) and 8(d)). The longitudinalKerr loop reflects the change of the axial projection ofthe magnetization inside the surface area of the wire.Therefore, the sharp change of longitudinal Kerr effect(Figure 8(c)) could be attributed to a quick change of theaxial magnetization.
The transformation of transverse loops in presence of dccircular field could clarify the details of the magnetizationprocess (Figure 8(d)). The absence of signal when the axialfield is zero can be explained taking into account the absenceof a circular projection during magnetization reversal. Thatis, the magnetization reversal occurs only by domain wallsmotion between the axial domains. Under the applicationof the dc circular field, the magnetization inside the domaindeviates from the axial direction, the transverse projection
appears, and the transverse Kerr loops are observed. In thisway, the magnetization reversal process can occur by thedomain wall motion owing to the rotation of the magne-tization.
The magnetization reversal for the microwire with x =0.09 is close to that of the microwire x = 0.11, butsome peculiarities are observed (Figures 8(e) and 8(f)).The longitudinal loop obtained in ac axial field presents arectangular shape related to the change of the axial magne-tization similarly to the case of x = 0.11. At the same time,the transverse loop has the shape, which can be attributed tosuccessive rotation of magnetization and nucleation of newdomains.
The modification of the domain structure of glass-coated amorphous microwires (Co1−x Mnx)75Si10B15 couldbe ascribed to the change of the value and the sign of themagnetostriction constant. As was shown in [16], the λS ispositive for the wires with x ≥ 0.1 and negative for the wireswith x < 0.1. Taking into account that the circular magneti-zation process in the outer shell is attributed to the negativesign of the magnetostriction, and axial magnetization inouter shell is attributed to positive magnetostriction, ourmagneto-optical investigation for the wire with x = 0.07 andfor x = 0.11 is in agreement with independent examinationof the magnetostriction constant value. It is necessary to notethat the quick magnetization reversal discovered in wire withx = 0.07 can be considered like large Barkhausen jump inthe circular magnetic structure. This effect was observed inCo-rich amorphous wire when an electric current is flowingalong the wire to produce a circular magnetic field.
In spite of that for the microwire with x = 0.09 λS
is negative, the axial domain structure exists in this wire.Significant contribution of rotation of the magnetization isfound in this wire together with domain nucleation, whichsuggests that this wire occupies intermediate place betweenwires with x = 0.07 and x = 0.11.
Therefore, Co-rich microwires with different content inMn demonstrate the variety of the shape of magnetizationreversal loop, which similarly can be attributed to the changeof sigh and value of the magnetostriction. The rectangularshape of the hysteresis loop in circular magnetic field of themicrowire with x = 0.07 can be interpreted by consideringthat the magnetization process in the outer shell takes placeby large Barkhausen jumps of circular domain structure,while the rectangular shape of the Kerr hysteresis loop inaxial magnetic field of the microwire with x = 0.11 couldbe connected to large Barkhausen jumps in the axial domainstructure in the outer shell.
5. Surface Circular Bistability
Glass-covered microwires of nominal compositionCo67Fe3.85Ni1.45B11.5Si14.5Mo1.7 (metallic nucleus radiusR = 11.2μm, glass coating thickness T = 0.2μm) have beenstudied using transverse MOKE in axial and circular mag-netic field [17].
Figure 9 presents the transverse Kerr effect dependenceon the ac electric current I flowing with the frequency of
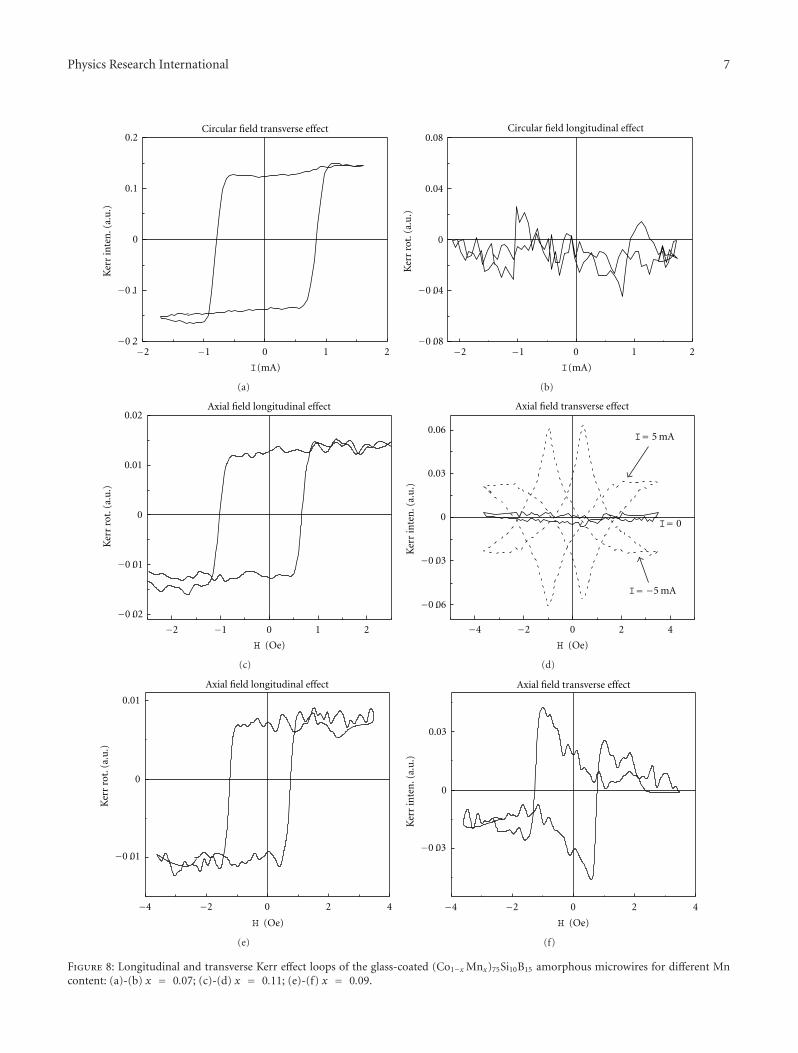
Physics Research International 7
0 1 2
0
0.1
0.2Circular field transverse effect
Ker
r in
ten
. (a.
u.)
−2 −1−0.2
−0.1
I(mA)
(a)
0 1 2
0
0.04
0.08Circular field longitudinal effect
Ker
r ro
t. (a
.u.)
−2 −1−0.08
−0.04
I(mA)
(b)
0 1 2
0
0.01
0.02Axial field longitudinal effect
Ker
r ro
t. (a
.u.)
−2 −1
−0.02
−0.01
H (Oe)
(c)
0 2 4
0
0.03
0.06
Axial field transverse effectK
err
inte
n. (
a.u
.)
−4 −2
−0.06
−0.03
I= −5 mA
I= 5 mA
I= 0
H (Oe)
(d)
0 2 4
0
0.01
Axial field longitudinal effect
Ker
r ro
t. (a
.u.)
−0.01
−4 −2
H (Oe)
(e)
0 2 4
0
0.03
Axial field transverse effect
Ker
r in
ten
. (a.
u.)
−0.03
−4 −2
H (Oe)
(f)
Figure 8: Longitudinal and transverse Kerr effect loops of the glass-coated (Co1−x Mnx)75Si10B15 amorphous microwires for different Mncontent: (a)-(b) x = 0.07; (c)-(d) x = 0.11; (e)-(f) x = 0.09.

8 Physics Research International
0 0.002
0
0.5
1
−0.002
−1
−0.5
= 0 MPaK
err
inte
nsi
ty (
a.u
.)
(a)
0 0.002
0
0.5
1
−0.002
−1
−0.5
= 120 MPa
Ker
r in
ten
sity
(a.
u.)
(b)
0 0.002
0
0.5
1
−0.002
−1
−0.5
= 240 MPa
Ker
r in
ten
sity
(a.
u.)
I(A)
(c)
Figure 9: Transverse Kerr effect dependence on ac electric current flowing with the frequency of 50 Hz through the wire for different tensilestresses: (a) 0 MPa; (b) 120 MPa; (c) 240 MPa.
50 Hz along the sample with an external tensile stress σas a parameter. The shape of hysteresis loop is perfectlyrectangular with sharp vertical areas associated with quickenough reversal of circular magnetization in the absence ofexternal tensile stress (Figure 9(a)). This reversal is a realiza-tion of circular magnetic bistability in the form of large Bark-hausen jumps between two states with opposite directions ofcircular magnetization. The external tensile stress causes thechange of switching field, HSW, (associated with the switch-ing current).
The change of the IR/IS ratio under the tensile stress isalso observed (IR is the intensity of the Kerr signal in theremanent state, and IS is the intensity of the Kerr signal in thesaturation state). The Kerr intensity is proportional to trans-verse magnetization M in the surface area of the wire. There-
fore, it is possible to consider that IR/IS = MR/MS, whereMR is the transverse saturation magnetization, and MS is thetransverse remanent magnetization.
The circular magnetic bistability is related to the magne-toelastic anisotropy in the circular direction, as the classicallongitudinal magnetic bistability [18, 19]. The circular mag-netoelastic anisotropy results in the appearance of circularmonodomain structure in the outer shell. It is known thatin negative magnetostrictive wires the axial tensile stress pro-duces circular anisotropy in the outer shell. In the presentedexperiments, this effect is reflected in the increase ofcircular remanence magnetization and in the increase of thesquarness of the hysteresis loops in presence of tensile stress.
The tensile stress-induced increase of circular switchingfield could be explained taking into account the strong
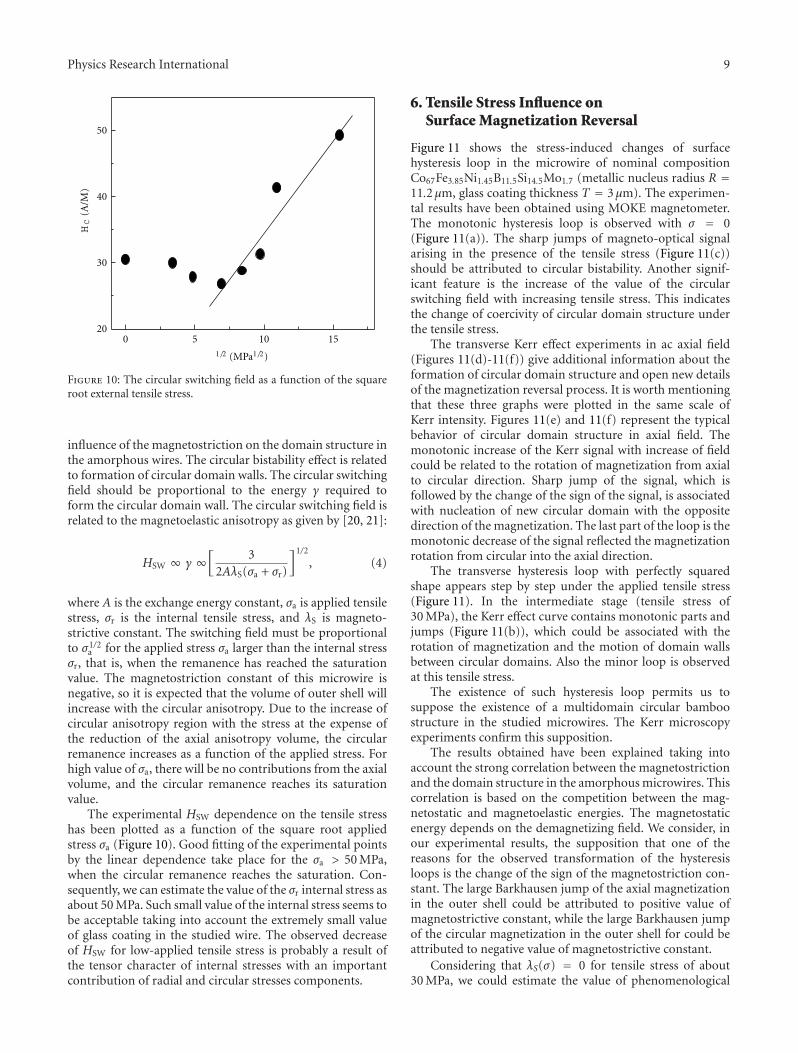
Physics Research International 9
0 5 10 1520
30
40
50
1/2 (MPa1/2)
HC
(A/M
)
Figure 10: The circular switching field as a function of the squareroot external tensile stress.
influence of the magnetostriction on the domain structure inthe amorphous wires. The circular bistability effect is relatedto formation of circular domain walls. The circular switchingfield should be proportional to the energy γ required toform the circular domain wall. The circular switching field isrelated to the magnetoelastic anisotropy as given by [20, 21]:
HSW ∞ γ ∞[
32AλS(σa + σr)
]1/2
, (4)
where A is the exchange energy constant, σa is applied tensilestress, σr is the internal tensile stress, and λS is magneto-strictive constant. The switching field must be proportionalto σ1/2
a for the applied stress σa larger than the internal stressσr, that is, when the remanence has reached the saturationvalue. The magnetostriction constant of this microwire isnegative, so it is expected that the volume of outer shell willincrease with the circular anisotropy. Due to the increase ofcircular anisotropy region with the stress at the expense ofthe reduction of the axial anisotropy volume, the circularremanence increases as a function of the applied stress. Forhigh value of σa, there will be no contributions from the axialvolume, and the circular remanence reaches its saturationvalue.
The experimental HSW dependence on the tensile stresshas been plotted as a function of the square root appliedstress σa (Figure 10). Good fitting of the experimental pointsby the linear dependence take place for the σa > 50 MPa,when the circular remanence reaches the saturation. Con-sequently, we can estimate the value of the σr internal stress asabout 50 MPa. Such small value of the internal stress seems tobe acceptable taking into account the extremely small valueof glass coating in the studied wire. The observed decreaseof HSW for low-applied tensile stress is probably a result ofthe tensor character of internal stresses with an importantcontribution of radial and circular stresses components.
6. Tensile Stress Influence onSurface Magnetization Reversal
Figure 11 shows the stress-induced changes of surfacehysteresis loop in the microwire of nominal compositionCo67Fe3.85Ni1.45B11.5Si14.5Mo1.7 (metallic nucleus radius R =11.2μm, glass coating thickness T = 3μm). The experimen-tal results have been obtained using MOKE magnetometer.The monotonic hysteresis loop is observed with σ = 0(Figure 11(a)). The sharp jumps of magneto-optical signalarising in the presence of the tensile stress (Figure 11(c))should be attributed to circular bistability. Another signif-icant feature is the increase of the value of the circularswitching field with increasing tensile stress. This indicatesthe change of coercivity of circular domain structure underthe tensile stress.
The transverse Kerr effect experiments in ac axial field(Figures 11(d)-11(f)) give additional information about theformation of circular domain structure and open new detailsof the magnetization reversal process. It is worth mentioningthat these three graphs were plotted in the same scale ofKerr intensity. Figures 11(e) and 11(f) represent the typicalbehavior of circular domain structure in axial field. Themonotonic increase of the Kerr signal with increase of fieldcould be related to the rotation of magnetization from axialto circular direction. Sharp jump of the signal, which isfollowed by the change of the sign of the signal, is associatedwith nucleation of new circular domain with the oppositedirection of the magnetization. The last part of the loop is themonotonic decrease of the signal reflected the magnetizationrotation from circular into the axial direction.
The transverse hysteresis loop with perfectly squaredshape appears step by step under the applied tensile stress(Figure 11). In the intermediate stage (tensile stress of30 MPa), the Kerr effect curve contains monotonic parts andjumps (Figure 11(b)), which could be associated with therotation of magnetization and the motion of domain wallsbetween circular domains. Also the minor loop is observedat this tensile stress.
The existence of such hysteresis loop permits us tosuppose the existence of a multidomain circular bamboostructure in the studied microwires. The Kerr microscopyexperiments confirm this supposition.
The results obtained have been explained taking intoaccount the strong correlation between the magnetostrictionand the domain structure in the amorphous microwires. Thiscorrelation is based on the competition between the mag-netostatic and magnetoelastic energies. The magnetostaticenergy depends on the demagnetizing field. We consider, inour experimental results, the supposition that one of thereasons for the observed transformation of the hysteresisloops is the change of the sign of the magnetostriction con-stant. The large Barkhausen jump of the axial magnetizationin the outer shell could be attributed to positive value ofmagnetostrictive constant, while the large Barkhausen jumpof the circular magnetization in the outer shell for could beattributed to negative value of magnetostrictive constant.
Considering that λS(σ) = 0 for tensile stress of about30 MPa, we could estimate the value of phenomenological

10 Physics Research International
0 0.002
0
0.5
1
−1
−0.5
= 0
−0.002
Ker
r in
ten
sity
(a.
u.)
(a)
0 0.002
0
0.5
1
−1
−0.5
= 30 MPa
−0.002
Ker
r in
ten
sity
(a.
u.)
(b)
0 0.002
0
0.5
1
−1
−0.5
= 300 MPa
−0.002
Ker
r in
ten
sity
(a.
u.)
(c)
0 1 2
0
0.5
1
−1
−0.5
0 MPa
−2 −1
(d)
0 1 2
0
0.5
1
−1
−0.5
75 MPa
−2 −1
(e)
0 1 2
0
0.5
1
−1
−0.5
150 MPa
−2 −1
(f)
H axial (Oe)I(A)
(a)
(b)
(c)
= 0
= 30 MPa
= 300 MPa
20μm
Figure 11: Transverse Kerr-effect dependencies: (a)-(c) on the electric current flowing through the wire in the presence of tensile stress;(d)-(f) on the axial magnetic field in the presence of tensile stress. Inset: circular domain structure in presence of external tensile stress inmicrowire.

Physics Research International 11
2
(a)
1
2
3 4
5
67 8
(c)
1
3
2
1
2
3
4
5
6
7
8
(b)2
1
3
0
−1
−0.5
0
0.5
1
−1
−0.5
0
0.5
1
−1
−2
−0.5
0
0.5
1
Ker
r in
ten
sity
(a.
u.)
Ker
r in
ten
sity
(a.
u.)
Ker
r in
ten
sity
(a.
u.)
H axial (Oe)
Figure 12: Transverse Kerr effect dependence on the axial magnetic field under the presence of HF electric current (4 kHz) (a)—(c): (a)0 mA, (b) 0.76 mA, and (c) 1.35 mA.
A constant for glass-covered wires to be about 3 × 10⁻⁹ MPa.This value differs from the value of A for conventional wiresand ribbons (10−10 MPa). The possible reason for this differ-ence is additional internal stress introduced by glass coating.
The increase of the tensile stress causes the increase of thevalue of the circular projection of the magnetization in theouter shell of the microwire, which reflects on the coerciveproperties of the domain structure. The change of the sign ofthe magnetostriction constant and its small value are crucialfor the observation of changes of the type of the domainstructure and for its high sensitivity to external stresses.
For the analysis of our results, we used the core-shellmodel developed for Co-rich amorphous wires of a finitelength [22]. The demagnetizing field of surface magneticcharges can arise near the wire ends for the case of finitelength wires. The magnetostatic energy of the magneticcharges could be reduced by twisting, of magnetization nearthe wire ends. Due to this twisting the intermediate areawith circular and axial projections of magnetization couldexist between the inner core and the outer shell. Taking intoaccount the strong correlation between the magnetization inthe inner core and the outer shell the appearance of domainwalls between circular domains could be energetically favor-able in order to diminish the magnetostatic energy in wholevolume of the wire.
The stability of multidomain circular structure in thenearly zero magnetostrictive composition could be reason-able when the external stresses are small enough because of
the competition between the magnetostatic and the magne-toelastic energy at the condition, when the magnetoelasticenergy is low enough. The increase of the external tensilestress makes the multidomain structure nonstable, due tothe increase of the domain wall energy. Applying additionalexternal stress, we increase the magnetoelastic energy and,consequently, the domain wall energy. At such conditionsthe bamboo domain structure disappears, and single circulardomain state is observed (see domain images in Figure 11).
7. Influence of High-Frequency ElectricCurrent on Surface Magnetization Reversal
Figure 12 shows the influence of HF electric current ( f =4 kHz) flowing along the microwire on the MOKE depen-dence on the axial magnetic field in the microwire of nom-inal composition Co67Fe3.85Ni1.45B11.5Si14.5Mo1.7 (metallicnucleus radius R = 8.6μm, glass coating thickness T =0.6μm).
The value of the circular magnetic field on the surfaceof the wire could be obtained using the formula for circum-ferential field Hcirc = Ir/2πR2 (for r = R). The value of Hcirc
is 0.3 Oe for the value of the ac electric current of 1.35 mA.The experimental setup was tuned in such a way, that thehigh-frequency signal has been cut by the special filter andtherefore we observed only the low-frequency changes ofthe circular magnetization. Our experiments show that the
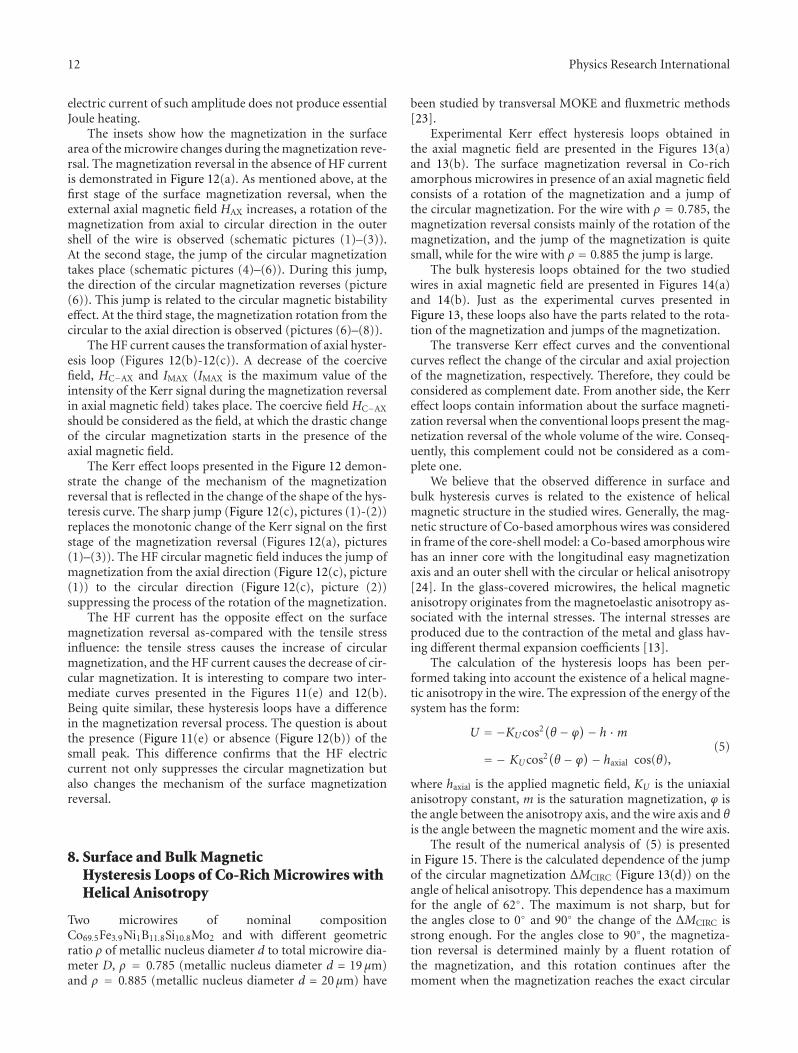
12 Physics Research International
electric current of such amplitude does not produce essentialJoule heating.
The insets show how the magnetization in the surfacearea of the microwire changes during the magnetization reve-rsal. The magnetization reversal in the absence of HF currentis demonstrated in Figure 12(a). As mentioned above, at thefirst stage of the surface magnetization reversal, when theexternal axial magnetic field HAX increases, a rotation of themagnetization from axial to circular direction in the outershell of the wire is observed (schematic pictures (1)–(3)).At the second stage, the jump of the circular magnetizationtakes place (schematic pictures (4)–(6)). During this jump,the direction of the circular magnetization reverses (picture(6)). This jump is related to the circular magnetic bistabilityeffect. At the third stage, the magnetization rotation from thecircular to the axial direction is observed (pictures (6)–(8)).
The HF current causes the transformation of axial hyster-esis loop (Figures 12(b)-12(c)). A decrease of the coercivefield, HC−AX and IMAX (IMAX is the maximum value of theintensity of the Kerr signal during the magnetization reversalin axial magnetic field) takes place. The coercive field HC−AX
should be considered as the field, at which the drastic changeof the circular magnetization starts in the presence of theaxial magnetic field.
The Kerr effect loops presented in the Figure 12 demon-strate the change of the mechanism of the magnetizationreversal that is reflected in the change of the shape of the hys-teresis curve. The sharp jump (Figure 12(c), pictures (1)-(2))replaces the monotonic change of the Kerr signal on the firststage of the magnetization reversal (Figures 12(a), pictures(1)–(3)). The HF circular magnetic field induces the jump ofmagnetization from the axial direction (Figure 12(c), picture(1)) to the circular direction (Figure 12(c), picture (2))suppressing the process of the rotation of the magnetization.
The HF current has the opposite effect on the surfacemagnetization reversal as-compared with the tensile stressinfluence: the tensile stress causes the increase of circularmagnetization, and the HF current causes the decrease of cir-cular magnetization. It is interesting to compare two inter-mediate curves presented in the Figures 11(e) and 12(b).Being quite similar, these hysteresis loops have a differencein the magnetization reversal process. The question is aboutthe presence (Figure 11(e) or absence (Figure 12(b)) of thesmall peak. This difference confirms that the HF electriccurrent not only suppresses the circular magnetization butalso changes the mechanism of the surface magnetizationreversal.
8. Surface and Bulk MagneticHysteresis Loops of Co-Rich Microwires withHelical Anisotropy
Two microwires of nominal compositionCo69.5Fe3.9Ni1B11.8Si10.8Mo2 and with different geometricratio ρ of metallic nucleus diameter d to total microwire dia-meter D, ρ = 0.785 (metallic nucleus diameter d = 19 μm)and ρ = 0.885 (metallic nucleus diameter d = 20 μm) have
been studied by transversal MOKE and fluxmetric methods[23].
Experimental Kerr effect hysteresis loops obtained inthe axial magnetic field are presented in the Figures 13(a)and 13(b). The surface magnetization reversal in Co-richamorphous microwires in presence of an axial magnetic fieldconsists of a rotation of the magnetization and a jump ofthe circular magnetization. For the wire with ρ = 0.785, themagnetization reversal consists mainly of the rotation of themagnetization, and the jump of the magnetization is quitesmall, while for the wire with ρ = 0.885 the jump is large.
The bulk hysteresis loops obtained for the two studiedwires in axial magnetic field are presented in Figures 14(a)and 14(b). Just as the experimental curves presented inFigure 13, these loops also have the parts related to the rota-tion of the magnetization and jumps of the magnetization.
The transverse Kerr effect curves and the conventionalcurves reflect the change of the circular and axial projectionof the magnetization, respectively. Therefore, they could beconsidered as complement date. From another side, the Kerreffect loops contain information about the surface magneti-zation reversal when the conventional loops present the mag-netization reversal of the whole volume of the wire. Conseq-uently, this complement could not be considered as a com-plete one.
We believe that the observed difference in surface andbulk hysteresis curves is related to the existence of helicalmagnetic structure in the studied wires. Generally, the mag-netic structure of Co-based amorphous wires was consideredin frame of the core-shell model: a Co-based amorphous wirehas an inner core with the longitudinal easy magnetizationaxis and an outer shell with the circular or helical anisotropy[24]. In the glass-covered microwires, the helical magneticanisotropy originates from the magnetoelastic anisotropy as-sociated with the internal stresses. The internal stresses areproduced due to the contraction of the metal and glass hav-ing different thermal expansion coefficients [13].
The calculation of the hysteresis loops has been per-formed taking into account the existence of a helical magne-tic anisotropy in the wire. The expression of the energy of thesystem has the form:
U = −KUcos2(θ − ϕ)− h ·m= − KUcos2(θ − ϕ)− haxial cos(θ),
(5)
where haxial is the applied magnetic field, KU is the uniaxialanisotropy constant, m is the saturation magnetization, ϕ isthe angle between the anisotropy axis, and the wire axis and θis the angle between the magnetic moment and the wire axis.
The result of the numerical analysis of (5) is presentedin Figure 15. There is the calculated dependence of the jumpof the circular magnetization ΔMCIRC (Figure 13(d)) on theangle of helical anisotropy. This dependence has a maximumfor the angle of 62◦. The maximum is not sharp, but forthe angles close to 0◦ and 90◦ the change of the ΔMCIRC isstrong enough. For the angles close to 90◦, the magnetiza-tion reversal is determined mainly by a fluent rotation ofthe magnetization, and this rotation continues after themoment when the magnetization reaches the exact circular
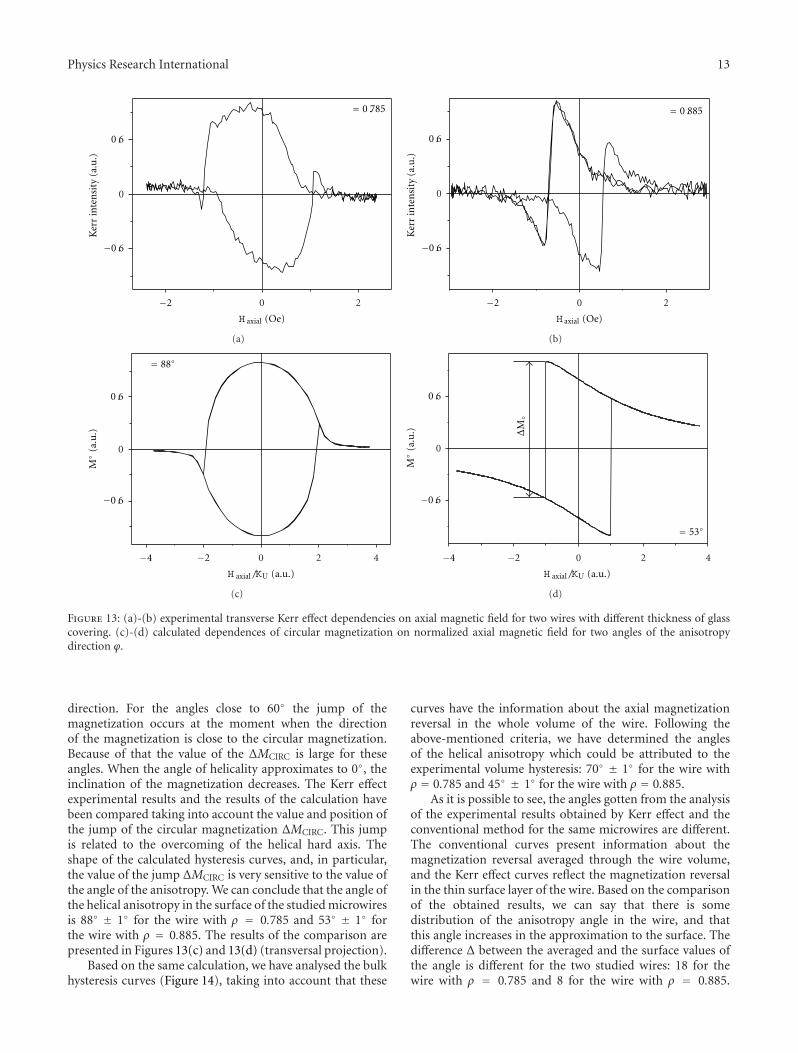
Physics Research International 13
0
0.6
−0.6
Ker
r in
ten
sity
(a.
u.)
= 0.785
20−2
H axial (Oe)
(a)
0
0.6
−0.6
20−2
= 0.885
Ker
r in
ten
sity
(a.
u.)
H axial (Oe)
(b)
0
0.6
−0.6
= 88◦
2 40−2−4
M◦
(a.u
.)
H axial/KU (a.u.)
(c)
0
0.6
−0.6
2 40−2−4
= 53◦
H axial/KU (a.u.)
ΔM◦
M◦
(a.u
.)
(d)
Figure 13: (a)-(b) experimental transverse Kerr effect dependencies on axial magnetic field for two wires with different thickness of glasscovering. (c)-(d) calculated dependences of circular magnetization on normalized axial magnetic field for two angles of the anisotropydirection ϕ.
direction. For the angles close to 60◦ the jump of themagnetization occurs at the moment when the directionof the magnetization is close to the circular magnetization.Because of that the value of the ΔMCIRC is large for theseangles. When the angle of helicality approximates to 0◦, theinclination of the magnetization decreases. The Kerr effectexperimental results and the results of the calculation havebeen compared taking into account the value and position ofthe jump of the circular magnetization ΔMCIRC. This jumpis related to the overcoming of the helical hard axis. Theshape of the calculated hysteresis curves, and, in particular,the value of the jump ΔMCIRC is very sensitive to the value ofthe angle of the anisotropy. We can conclude that the angle ofthe helical anisotropy in the surface of the studied microwiresis 88◦ ± 1◦ for the wire with ρ = 0.785 and 53◦ ± 1◦ forthe wire with ρ = 0.885. The results of the comparison arepresented in Figures 13(c) and 13(d) (transversal projection).
Based on the same calculation, we have analysed the bulkhysteresis curves (Figure 14), taking into account that these
curves have the information about the axial magnetizationreversal in the whole volume of the wire. Following theabove-mentioned criteria, we have determined the anglesof the helical anisotropy which could be attributed to theexperimental volume hysteresis: 70◦ ± 1◦ for the wire withρ = 0.785 and 45◦ ± 1◦ for the wire with ρ = 0.885.
As it is possible to see, the angles gotten from the analysisof the experimental results obtained by Kerr effect and theconventional method for the same microwires are different.The conventional curves present information about themagnetization reversal averaged through the wire volume,and the Kerr effect curves reflect the magnetization reversalin the thin surface layer of the wire. Based on the comparisonof the obtained results, we can say that there is somedistribution of the anisotropy angle in the wire, and thatthis angle increases in the approximation to the surface. Thedifference Δ between the averaged and the surface values ofthe angle is different for the two studied wires: 18 for thewire with ρ = 0.785 and 8 for the wire with ρ = 0.885.

14 Physics Research International
= 0.785
−0.5
0
0.5
20−2
MA
X(a
.u.)
H axial (Oe)
(a)
= 0.885
−0.5
0
0.5
20−2
MA
X(a
.u.)
H axial (Oe)
(b)
70◦
0
0.6
−0.6
20−2
MA
X(a
.u.)
H axial/KU (a.u.)
(c)
45◦
0
0.6
−0.6
20−2
MA
X(a
.u.)
H axial/KU (a.u.)
(d)
Figure 14: (a)-(b) experimental bulk dependencies on axial magnetic field for the two wires with different thickness of glass covering. (c)-(d)calculated dependencies of axial magnetization on normalized axial magnetic field for two angles of anisotropy direction ϕ.
0 20 40 60 80
0
0.4
0.8
1.2
1.6
Angle of helical anisotropy (deg)
Jum
p of
cir
c. m
agn
.ΔM◦
(a.u
.)
Figure 15: Calculated dependence of the jump of the circularmagnetization ΔMCIRC on the angle of helical anisotropy ϕ.
It could mean that the distribution of the anisotropy angleis more inhomogeneous for the wire with ρ = 0.785. In turn,it is related to the different distribution of the internal stressinside the wire.
Frequency dependence of the coercive field has beenstudied for the wire with ρ = 0.885 using the conventionaland Kerr effect techniques. The results of the conventionalexperiments are presented in Figure 16. Frequency depen-dence of the coercive field HC has been analyzed using thecalculations presented in [25]. It was shown that the resultof the solution of the equation of domain wall motion in thefollowing relation has been obtained [26]:
HCD = HCO +4 f H0(L + 2ISA)
K, (6)
where HCD is the dynamic switching field, HCO is the staticcoercive field, f is the frequency of the magnetic field, H0
is the amplitude of the magnetic field, L is the dampingcoefficient, IS is the saturation magnetization, K is the elastic

Physics Research International 15
0 100 200 300 400 500
0.9
1
1.1
HC
(Oe)
f(Hz)
Figure 16: Dependence of the volume coercive field on thefrequency of magnetic field for the wire with ρ = 0.885.
coefficient, and A is a proportionality constant. This lineardependence of the coercive field on frequency could be des-cribed in terms of domain nucleation mechanism. The nu-cleation process is associated with the overcoming of theenergy barrier. Thermoactivation mechanism of the over-coming was satisfactorily employed for the explanation ofthe coercive field fluctuations observed in amorphous wires.Frequency of the applied field in this way affects the value ofthe coercive field. The experimental dependence of the coer-cive field on the frequency fits well the linear function thatgives us possibility to conclude that the above mechanism ofmagnetization reversal could be applied to this experiment.
Kerr effect dependencies also changed when the fre-quency of the axial magnetic field increased. But the transfor-mation of the surface curves differs from the transformationof the bulk curves. Figure 17(a) demonstrates the observeddecrease of HC−MO and the increase of IMAX (HC−MO shouldbe considered as the field at which the drastic change of thecircular magnetization starts, IMAX is the maximal intensityof the Kerr signal during the magnetization reversal). Takinginto account that the Kerr intensity is proportional to thetransverse magnetization in the surface area of the wire,IMAX∼MMAX, where MMAX is the maximal value of thetransverse (circular) magnetization.
Analyzing the results obtained in the Kerr effect experi-ments, we consider that the magnetization reversal processin the surface area of the wire occurs as the formationof a circular domain in the outer shell. The coercive fieldHC−MO is, respectively, determined by the circular domainnucleation. The expression for HC−MO can be presented as[26]
HC−MO = α
MMAX− NMMAX, (7)
where the first term is related to losses of energy at nucleationprocess and the second term to the demagnetizing field ofthe nucleus (N is the demagnetizing factor). We consider,within numerical factor, that α = σ/υ1/3, where σ is energyof domain wall, υ is critical volume of the nucleus.
0.8
1
1.2
0 100 200 300 400 5000.4
0.5
0.6
f(Hz)
I max
(a.u
.)
HC
–MO
(Oe)
(a)
1.2 1.6 2
240
280
320
360
1/I 2 (a.u.)max
HC
–MO
/Im
ax(a
.u.)
(b)
Figure 17: (a) HC−MO and IMAX dependencies on frequency ofmagnetic field for ρ = 0.885; (b) HC−MO/MMAX dependence on1/MMAX2 .
To verify the above-mentioned assumption regarding themechanism of the magnetization reversal in the outer shell ofthe microwire, the HC−MO/IMAX dependence on 1/IMAX2 hasbeen plotted (Figure 17(b)). Taking into account that IMAX∼MMAX, this dependence could be considered as the analogyof HC−MO/MMAX (1/MMAX2 ) dependence. Good fitting of theexperimental points by the linear function demonstrates thestrong relation between the HC−MO and the MCIRC.
The strong difference of the frequency dependence ofthe HC and HC−MO means that the magnetization reversalhappens independently enough in the surface and in thevolume of the wire. HC−MO is smaller than HC. Therefore,the nucleation starts in the surface in the moment whenthe circular projection of the magnetization reaches thesufficient value. This value of this circular projection isthe key parameter which changes with the magnetic fieldfrequency. We suppose that one of the possible reasonsof this change is the following one. The increase of thefrequency means the growth of the velocity of the increaseof the magnetic field dH/dt. Therefore, the magnetic fieldincreases more quickly for the higher frequency. The quickerincrease of magnetic field causes the quicker increase of thecircular magnetization. Therefore, for the higher frequency

16 Physics Research International
1
0.5
0
−0.5
−1
−2 0 2
Ker
r in
ten
sity
(a.
u.)
H axial (Oe)
(a)
1
0.5
0
−0.5
−1
−2 0 2
H axial (Oe)
(b)
1
0.5
0
−0.5
−1
−2 0 2
Ker
r in
ten
sity
(a.
u.)
H axial (Oe)
(c)
1
0.5
0
−0.5
−1
−2 0 2
H axial (Oe)
(d)
Figure 18: Transverse Kerr effect dependence on the magnetic field applied along the microwire axis in the presence of torsion stress. (a)τ = −22 π rad m−1, (b) τ = −2.2π rad m−1, (c) τ = 0, and (d) τ = 8.9π rad m−1. Insets: schematically pictures of the inclination of the axisof helical anisotropy induced by the torsion stress.
the magnetization could reach the larger value in themoment when the domain nucleus becomes the stable one,that is, in the moment close to the nucleation. Finally, therelation of the dH/dt and the probability of the nucleationare realized in the decrease of the HC−MO with frequency.
We consider that the surface magnetization reversalis determined mainly by the nucleation mechanism. Thesharpness of the ΔMCIRC jump (Figure 13(b)) and our earlyKerr microscopy study of the magnetization reversal inamorphous wires [27] permit us to make such conclusion.
Equation (7) is used in general for the temperaturedependence of the coercive field. Earlier we have used it forthe frequency dependence of the coercive field [28], and webelieve that this application is reasonable taking into accountthe similar character of the influence of the temperature andfrequency on the probability of the domain nucleation.
For the determination of the angle of helical anisotropy,we applied the calculation which did not include the domainwall motion, while for the frequency experiments we usethe equation which takes into account the nucleation anddomain wall motion. For the studied case, the shape of thehysteresis curve and, particularly, the value and the positionof the ΔMCIRC jump, which is the value we used in theanalysis, are determined mainly by the direction of the helicalanisotropy and to a lesser degree, by the details of the domainwall motion. But for the dependencies of the coercive field
on the frequency, the features of the magnetization reversalbecome important, Such as known [25], the change of thefrequency of the external magnet field influences strongly onthe mechanism of the magnetic reversal in the wires.
9. Torsion Stress-Induced Transformation ofSurface Magnetic Structure
The process of surface magnetization reversal in the presenceof torsion stress of different amplitudes and directionshas been studied in microwire of nominal composition ofCo69.5Fe3.9Ni1B11.8Si10.8Mo2 (ρ = 0.79) (Figure 18) [29].
The magnetization reversal in the surface area of thewires has been studied by transverse magneto-optical Kerreffect method in the presence of axial magnetic field. Thetorsion stress up to 40 π rad m−1 has been applied during theexperiments.
The surface magnetization reversal consists of two steps:the magnetization rotation from axial to circular direction inthe outer shell following by the magnetization jump betweentwo states with opposite directions of surface circular mag-netization. The applied torsion stress induces strong trans-formation of the surface hysteresis loops. The most essen-tial feature of this transformation is a stress-induced change
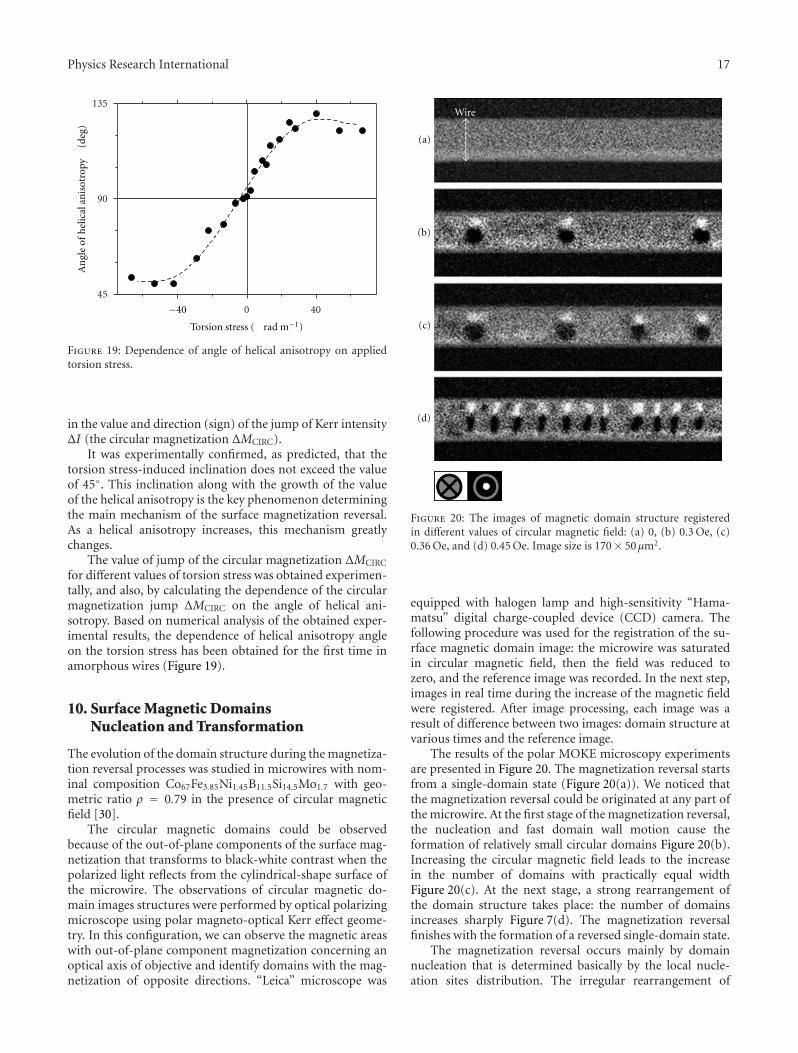
Physics Research International 17
0 40
45
90
135
Torsion stress ( rad m−1)
−40
An
gle
of h
elic
al a
nis
otro
py(d
eg)
Figure 19: Dependence of angle of helical anisotropy on appliedtorsion stress.
in the value and direction (sign) of the jump of Kerr intensityΔI (the circular magnetization ΔMCIRC).
It was experimentally confirmed, as predicted, that thetorsion stress-induced inclination does not exceed the valueof 45◦. This inclination along with the growth of the valueof the helical anisotropy is the key phenomenon determiningthe main mechanism of the surface magnetization reversal.As a helical anisotropy increases, this mechanism greatlychanges.
The value of jump of the circular magnetization ΔMCIRC
for different values of torsion stress was obtained experimen-tally, and also, by calculating the dependence of the circularmagnetization jump ΔMCIRC on the angle of helical ani-sotropy. Based on numerical analysis of the obtained exper-imental results, the dependence of helical anisotropy angleon the torsion stress has been obtained for the first time inamorphous wires (Figure 19).
10. Surface Magnetic DomainsNucleation and Transformation
The evolution of the domain structure during the magnetiza-tion reversal processes was studied in microwires with nom-inal composition Co67Fe3.85Ni1.45B11.5Si14.5Mo1.7 with geo-metric ratio ρ = 0.79 in the presence of circular magneticfield [30].
The circular magnetic domains could be observedbecause of the out-of-plane components of the surface mag-netization that transforms to black-white contrast when thepolarized light reflects from the cylindrical-shape surface ofthe microwire. The observations of circular magnetic do-main images structures were performed by optical polarizingmicroscope using polar magneto-optical Kerr effect geome-try. In this configuration, we can observe the magnetic areaswith out-of-plane component magnetization concerning anoptical axis of objective and identify domains with the mag-netization of opposite directions. “Leica” microscope was
Wire
(a)
(b)
(c)
(d)
Figure 20: The images of magnetic domain structure registeredin different values of circular magnetic field: (a) 0, (b) 0.3 Oe, (c)0.36 Oe, and (d) 0.45 Oe. Image size is 170× 50μm2.
equipped with halogen lamp and high-sensitivity “Hama-matsu” digital charge-coupled device (CCD) camera. Thefollowing procedure was used for the registration of the su-rface magnetic domain image: the microwire was saturatedin circular magnetic field, then the field was reduced tozero, and the reference image was recorded. In the next step,images in real time during the increase of the magnetic fieldwere registered. After image processing, each image was aresult of difference between two images: domain structure atvarious times and the reference image.
The results of the polar MOKE microscopy experimentsare presented in Figure 20. The magnetization reversal startsfrom a single-domain state (Figure 20(a)). We noticed thatthe magnetization reversal could be originated at any part ofthe microwire. At the first stage of the magnetization reversal,the nucleation and fast domain wall motion cause theformation of relatively small circular domains Figure 20(b).Increasing the circular magnetic field leads to the increasein the number of domains with practically equal widthFigure 20(c). At the next stage, a strong rearrangement ofthe domain structure takes place: the number of domainsincreases sharply Figure 7(d). The magnetization reversalfinishes with the formation of a reversed single-domain state.
The magnetization reversal occurs mainly by domainnucleation that is determined basically by the local nucle-ation sites distribution. The irregular rearrangement of

18 Physics Research International
(a)
(b)
(c)
(d)
(e)
50μm
Figure 21: Photographs of circular domain formation and domain walls propagation in the presence of circular field of constant amplitudeand increasing time duration, I = 0.38 mA, HAX = 0.27 Oe. (a) t = 0, (b) t = 310 msec, (c) t = 372 msec, (d) t = 434 msec, and (e)t = 496 msec.
the circular domain structure takes place during the mag-netization reversal that was not observed earlier in amor-phous magnetic microwires. The circular magnetic domainnucleation in amorphous microwires could be describedsuccessfully by the thermoactivated mechanism.
11. Observation of Circular GiantBarkhausen Jumps
First, surface magnetization reversal has been studied usingMOKE magnetometer as a function of circular magneticfield in the presence of axial DC bias field in microwirewith nominal composition Co67Fe3.85Ni1.45B11.5Si14.5Mo1.7
(ρ = 0.79) [31]. The jumps of the circular magnetization,associated with Barkhausen jumps, have been observed.These jumps are related to the mentioned effect of circularmagnetic bistability. It was found that the application of theaxial magnetic field transforms the hysteresis curve in sucha way, that the jump of the circular magnetization becomessharper. Observed change of the hysteresis loop is related tothe transformation of the helical magnetic structure inducedby the axial magnetic field. In the presence of the axial fieldof some special value, the jump occurs between two circularlymagnetized states.
We have two processes with different velocities of themagnetization reversal. We assume that this difference invelocity reflects the difference in the process of domain nucl-eation and domain walls propagation. To verify this supposi-tion and to elucidate the details of the Barkhausen jumps,we have performed the MOKE microscope experiments(Figure 21).
Observation of the circular magnetic domain structuresin microwires was performed by an optical polarizing micro-scope to detect the longitudinal MOKE. A Carl Zeiss Jenapol
microscope was equipped with Xe-lamp and a Cool SNAP(Princeton Instruments) high-sensitivity camera having a1300 × 1030 pixels, cooled CCD element. The magneticcontrast of the domain structure was improved by imageprocessing software based on LABVIEW.
Figure 21 shows the surface magnetization reversal forthe case of HAX /= 0. The successive increase of the timeduration of the constant circular magnetic field inducesthe nucleation of solitary circular domain following by thepropagation of the domain wall moving for a long distancealong the microwire. This scenario could be considered asclassical realization of the giant Barkhausen jump.
Using the axial magnetic field as a unique externalparameter, we have achieved that the surface magnetizationreversal realizes in the form of sharp giant Barkhausen jumpmagnetic microwires. We have demonstrated for the firsttime that this jump is characterized by the quick motionof the solitary domain wall which overpasses long distancesof about hundreds of micrometers. We have shown that theextensive motion of the solitary domain wall really exists inmagnetic wires, and that it is the determinative constituentof the surface giant Barkhausen jump.
12. Conclusions
The high GMI ratio can be observed in thin glass-coatedferromagnetic microwires with adequate chemical compo-sition and geometry. Changing both parameters, we areable to tailor the GMI ration in Co-rich microwires. Itwas found that the induced transverse magnetic anisotropyallows us to predict the existence of the magneto-impedanceeffect. Application of the MOKE method allowed to correlatethe axial magnetic field dependences of GMI ratio andMOKE hysteresis loops: a maximum of GMI ratio occurs

Physics Research International 19
approximately at the same field as the sharp change of thecircular magnetization on the surface loop.
Taking into account the essential role of the helical mag-netic anisotropy in the GMI effect, the magnetization reversalhas been studied in the Co-rich microwires with helical mag-netic structure. The value of the angle of the helical anisotro-py in the surface and in the volume of the wires was deter-mined. Also, it was found that the increase of the frequen-cy of the external axial magnetic field induces the change ofthe coercive properties in the volume and in the surface ofthe microwire: the coercive field of the surface magnetic stru-cture decreases with the frequency of the magnetic field whenthe volume coercive field increases. The surface coercive fieldis mainly determined by the value of the magnetization in theouter shell of the wire.
The surface and bulk measurements of Co-richmicrowires with different chemical composition (especially,the different Mn content) demonstrate the variety ofthe shapes of magnetization reversal loops, that can beattributed to the change of sign of the magnetostriction.The rectangular shape of the surface hysteresis loop incircular magnetic field of the microwire with x = 0.07 canbe interpreted by considering that the magnetization processtakes place by large Barkhausen jump of circular domainstructure, while the rectangular shape of the hysteresis loopin axial magnetic field of the microwire with x = 0.11 couldbe attributed to the large Barkhausen jump within the axialdomain structure.
The circular bistability and related circular giant Bark-hausen jump are the basic effects which determine the char-acter of the surface magnetization reversal. The giant Bark-hausen jump is followed by the formation of the circulardomain structure at the surface of the microwire. At thespecial conditions the long-distance motion of the solitarycircular domain wall is observed as a classical realization ofthe giant Barkhausen jump.
The strong transformation of the surface domain struc-ture takes place in the presence of tensile and torsion externalstresses. The direct relation between the angle of helical anis-otropy and the value of the torsion stress has been estab-lished. The limit values of the angle of the helical anisotropyhave been experimentally determined.
References
[1] L. V. Panina and K. Mohri, “Magneto-impedance effect in am-orphous wires,” Applied Physics Letters, vol. 65, no. 9, pp.1189–1191, 1994.
[2] V. Zhukova, A. Chizhik, A. Zhukov, A. Torcunov, V. Larin, andJ. Gonzalez, “Optimization of giant magnetoimpedance in Co-rich amorphous microwires,” IEEE Transactions on Magnetics,vol. 38, no. 5 I, pp. 3090–3092, 2002.
[3] A. Zhukov, V. Zhukova, J. M. Blanco, and J. Gonzalez, “Recentresearch on magnetic properties of glass-coated microwires,”Journal of Magnetism and Magnetic Materials, vol. 294, no. 2,pp. 182–192, 2005.
[4] A. Zhukov, J. Gonzalez, M. Vazquez, V. Larin, and A. Torcun-ov, “Nanocrystalline and amorphous magnetic microwires,”in Encyclopedia of Nanoscience and Nanotechnology, H. S.
Nalwa, Ed., vol. 23, chapter 62, pp. 1–22, American ScientificPublishers, 2004.
[5] R. Hasegawa, “Nonmagnetostrictive glassy Co-Fe-Ni-Mo-B-Sialloys,” Journal of Applied Physics, vol. 53, no. 11, pp. 7819–7821, 1982.
[6] A. Zhukov, J. M. Blanco, J. Gonzalez, M. J. G. Prieto, E. Pina,and M. Vazquez, “Induced magnetic anisotropy in Co-Mn-Si-B amorphous microwires,” Journal of Applied Physics, vol. 87,no. 3, pp. 1402–1409, 2000.
[7] A. F. Cobeno, A. Zhukov, A. R. De Arellano-Lopez et al., “Phy-sical properties of nearly zero magnetostriction Co-rich glass-coated amorphous microwires,” Journal of Materials Research,vol. 14, no. 9, pp. 3775–3783, 1999.
[8] A. Chizhik, J. Gonzalez, A. Zhukov, and J. M. Blanco, “Magne-tization reversal of Co-rich wires in circular magnetic field,”Journal of Applied Physics, vol. 91, no. 1, pp. 537–539, 2002.
[9] M. Knobela, C. Gomez-Polo, and M. Vazquez, “Evaluationof the linear magnetostriction in amorphous wires using thegiant magneto-impedance effect,” Journal of Magnetism andMagnetic Materials, vol. 160, pp. 243–244, 1996.
[10] J. Velazquez, M. Vazquez, and A. P. Zhukov, “Magnetoelasticanisotropy distribution in glass-coated microwires,” Journal ofMaterials Research, vol. 11, no. 10, pp. 2499–2505, 1996.
[11] A. F. Cobeo, A. Zhukov, J. M. Blanco, and J. Gonzalez, “Giantmagneto-impedance effect in CoMnSiB amorphous micro-wires,” Journal of Magnetism and Magnetic Materials, vol. 234,no. 3, pp. L359–L365, 2001.
[12] N. A. Usov, A. S. Antonov, and A. N. Lagar’kov, “Theory ofgiant magneto-impedance effect in amorphous wires with dif-ferent types of magnetic anisotropy,” Journal of Magnetism andMagnetic Materials, vol. 185, no. 2, pp. 159–173, 1998.
[13] J. Velazquez, M. Vazquez, and A. P. Zhukov, “Magnetoelasticanisotropy distribution in glass-coated microwires,” Journal ofMaterials Research, vol. 11, no. 10, pp. 2499–2505, 1996.
[14] J. Gonzalez, K. Kułakowski, P. Aragoneses, J. M. Blanco, and E.Irurieta, “Stress dependence of bistability in a zero-magnetost-rictive amorphous wire,” Journal of Materials Science, vol. 30,no. 20, pp. 5173–5177, 1995.
[15] J. Gonzalez, A. Chizhik, A. Zhukov, and J. M. Blanco, “Surfacemagnetic behavior of nearly zero magnetostrictive Co-richamorphous microwires,” Journal of Magnetism and MagneticMaterials, vol. 258-259, pp. 177–182, 2003.
[16] F. B. Humphrey, K. Mohri, J. Yamasaki, H. Kawamura, R. Mal-mhall, and I. Ogasawara, “Large barkhausen discontinuities inco-based amorphous wires with negative magnetostriction,”in Magnetic Properties of Amorphous Metals, A. Hernando, V.Madurga, M. C. Sanchez-Trujillo, and M. Vazquez, Eds., p.110, North-Holland, Amsterdam, The Netherlands, 1987.
[17] A. Chizhik, C. Garcia, J. Gonzalez, A. Zhukov, and J. M. Blan-co, “Study of surface magnetic properties in Co-rich amor-phous microwires,” Journal of Magnetism and Magnetic Mate-rials, vol. 300, no. 1, pp. e93–e97, 2006.
[18] B. K. Ponomarev and A. P. Zhukov, “Fluctuations of start fieldexhibited by amorphous alloy,” Soviet Physics, Solid State, vol.26, p. 2974, 1984.
[19] K. Mohri and S. Takeuchi, “Sensitive bistable magnetic sensorsusing twisted amorphous magnetostrictive ribbons due to Ma-tteucci effect,” Journal of Applied Physics, vol. 53, no. 11, pp.8386–8388, 1982.
[20] L. Kraus, S. N. Kane, M. Vazquez et al., “Tensor components ofthe magnetization in a twisted Fe-rich amorphous wire,” Jour-nal of Applied Physics, vol. 75, no. 10, pp. 6952–6954, 1994.

20 Physics Research International
[21] J. Gonzalez, N. Murillo, V. Larin, J. M. Barandiaran, M. Vazq-uez, and A. Hernando, “Magnetoelastic behavior of glass-covered amorphous ferromagnetic microwire,” IEEE Transac-tions on Magnetics, vol. 33, no. 3, pp. 2362–2365, 1997.
[22] V. Zhukova, N. A. Usov, A. Zhukov, and J. Gonzalez, “Lengtheffect in a Co-rich amorphous wire,” Physical Review B, vol.65, no. 13, Article ID 134407, 7 pages, 2002.
[23] A. Chizhik, J. M. Blanco, A. Zhukov et al., “Surface and bulkmagnetic hysteresis loops of Co-rich glass covered micro-wires,” IEEE Transactions on Magnetics, vol. 42, no. 12, pp.3889–3892, 2006.
[24] M. Vazquez and A. Hernando, “A soft magnetic wire for sensorapplications,” Journal of Physics D, vol. 29, no. 4, pp. 939–949,1996.
[25] A. Zhukov, M. Vazquez, J. Velazquez, C. Garcıa, R. Valenzuela,and B. Ponomarev, “Frequency dependence of coercivity inrapidly quenched amorphous materials,” Materials Science andEngineering A, vol. 226–228, pp. 753–756, 1997.
[26] H. Kronmuller, “Micromagnetic background of hard mag-netic materials,” in Supermagnets, Hard Magnetic Materials, G.J. Long and F. Grandjean, Eds., p. 461, Kluwer Academic, Dod-recht, The Netherlands, 1991.
[27] A. Chizhik, J. Gonzalez, J. Yamasaki, A. Zhukov, and J. M.Blanco, “Vortex-type domain structure in Co-rich amorphouswires,” Journal of Applied Physics, vol. 95, no. 5, pp. 2933–2935,2004.
[28] A. Chizhik, A. Zhukov, J. Gonzalez, and J. M. Blanco, “Mag-neto-optical investigation of high-frequency electric currentinfluence on surface magnetization reversal in Co-rich amor-phous microwires,” Journal of Applied Physics, vol. 97, no. 7,Article ID 073912, pp. 1–6, 2005.
[29] A. Chizhik, J. Gonzalez, P. Gawronski, K. Kulakowski, A. Zhu-kov, and J. M. Blanco, “Torsion and tension stress inducedtransformation of surface magnetic structure in Co-rich amo-rphous microwires,” Journal of Non-Crystalline Solids, vol. 353,no. 8-10, pp. 935–937, 2007.
[30] A. Chizhik, A. Zhukov, A. Stupakiewicz, A. Maziewski, J. M.Blanco, and J. Gonzalez, “Kerr microscopy study of magneticdomain structure changes in amorphous microwires,” IEEETransactions on Magnetics, vol. 45, no. 10, Article ID 5257388,pp. 4279–4281, 2009.
[31] A. Chizhik, A. Stupakiewicz, A. Maziewski, A. Zhukov, J. Gon-zalez, and J. M. Blanco, “Direct observation of giant Barkhau-sen jumps in magnetic microwires,” Applied Physics Letters,vol. 97, no. 1, Article ID 012502, 2010.

Hindawi Publishing CorporationPhysics Research InternationalVolume 2012, Article ID 165849, 4 pagesdoi:10.1155/2012/165849
Research Article
Sintering of Soft Magnetic Material underMicrowave Magnetic Field
Sadatsugu Takayama,1 Jun Fukushima,1 Junichi Nishijo,2 Midori Saito,2
Saburo Sano,3 and Motoyasu Sato1
1 National Institute for Fusion Science, 322-6 Orochi-cho, Toki-shi, Gifu 509-5292, Japan2 Institute for Molecular Science, 38 Nishigo-Naka, Myodaiji, Okazaki-shi, Aichi 444-8585, Japan3 National Institute of Advanced Industrial Science and Technology, 2266-98 Anagahora, Shimoshidami, Moriyama-ku,Nagoya, Aichi 463-8560, Japan
Correspondence should be addressed to Sadatsugu Takayama, [email protected]
Received 1 August 2011; Revised 2 January 2012; Accepted 12 January 2012
Academic Editor: Arcady Zhukov
Copyright © 2012 Sadatsugu Takayama et al. This is an open access article distributed under the Creative Commons AttributionLicense, which permits unrestricted use, distribution, and reproduction in any medium, provided the original work is properlycited.
We have developed a simple process for sintering of soft magnetization materials using microwave sintering. The saturatedmagnetization (Ms) of sintered magnetite was 85.6 emu/g, which was as high as 95% of magnetite before heating (90.4 emu/g).On the other hand, the averaged remanence (Mr) and coercivity (Hc) of the magnetite after heating were 0.17 emu/g and 1.12 Oeunder measuring limit of SQUID, respectively. For the sintering process of soft magnetic materials, magnetic fields of microwavehave been performed in nitrogen atmosphere. Therefore, a microwave single-mode system operating at a frequency of 2.45 GHzand with a maximum power level of 1.5 kW was used. We can sinter the good soft magnetic material in microwave magneticfield. The sample shrank to 82% theoretical density (TD) from 45%TD of green body. The sintered sample was observed themicrostructure by TEM and the crystal size was estimated the approximate average size is 10 nm.
1. Introduction
Sintering of magnetite (Fe3O4) with nanocrystals has longbeen of great interest because of their immense technologicalapplications especially in the magnet, motor, and electricparts. Nanoparticles with superparamagnetic properties havegreat potential to achieve such desirable properties.
Recently, various methods have been developed to syn-thesize Fe3O4 particles in nanometer size range. Thesemethods were the electrochemical synthesis [1], the reactivemagnetron sputtering [2], chemical reaction [3], and soon. However, the magnetic properties of magnetite-basednanoparticles or films highly depend upon the synthesisprocedure.
Microwave irradiation to materials is a new comer forour civilization with a history of only half century. Thetemperatures of the surroundings are colder than that oftargets, that can easily be imagined by a home microwaveoven. It clearly suggests that the energy transfer mechanism
in microwave heating is quite different from the traditionalheating process. Roy et al. reported sintering of metalpowders by microwave in 1999 [4] and decrystallizationof ferrite magnetic materials by microwave magnetic fieldheating in 2002 [5]. Therefore, we have studied the sinteringof soft magnetization under microwave heating.
2. Experimental Setup
The samples had been heated by magnetic field of microwave.Figure 1 shows a schematic drawing of experimental setupof magnetic field heating of 2.45 GHz microwave. Themagnetic or electric fields of microwave can be separatedon positions in the single-mode cavity. High-frequencyalternated magnetic field was applied to a sample placedon the magnetic field node in the TE103 single-modecavity with the cross-section of 27.2 mm × 85 mm. Thegenerator, PRJ-1000L, Ewig Co., Ltd., supplied microwave tothe cavity at the frequency 2.45 GHz. The microwave power

2 Physics Research International
Microwave
generator
IsolatorDirectional coupler
Cavity
IrisSample
0 0.5 1 1.5
Dummy
load
Plunger
Thermal insulation
2.45 GHz, 1.5 kW
Figure 1: The schematic drawing of experimental setup of microwave heating.
varied from 50 to 1500 watts controlling by the DC powersupply which consisted of AC-DC inverter. The infraredpyrometer, IGAR12-LO, IMPAC Infrared Co., Ltd., measuredthe temperature of the sample through the 6 mm hole drilledthrough the end plunger of cavity. The waveguide wasevacuated to 10−4 Pa by turbo molecular pump with 100 L/spumping speed and changed to nitrogen gas in the cavity.During the heating, nitrogen gas was flowing in cavity.
The samples were prepared by uniaxial pressing ofmagnetite powder (FEO07PB) with the purity of 99 weight%from Kojundo Chemical Laboratory Co., Ltd., Japan. Thesample density was up to 45% of the theoretical density(TD) by geometrical method. The grain size of the magnetitewas less than 1 micrometer. The size of the sample was8 mm diameter and 4 mm thick pellet of 0.5 (g) that wassmall enough not to disturb the criterion for fundamentalresonance in the cavity. The four samples were put in themagnetic field maxima in the cavity supported by thermalinsulator made of a lightweight alumina silica fiber board.
3. Experimental
The graphs in Figure 2 show a typical progress of pro-cess temperatures measured during microwave heating ofmagnetite samples. The microwave power was controlledmanually. The microwave power shows remainder of inputpower and reflex power. For sintering experiments, themagnetite powder compacts were heated to the sinteringtemperature of 1000◦C for 10 min followed by 70 min soaktime. In initial step heating during the first 30 min, thesample temperature was dramatically changing. Thereafter,the sample temperature was settling and microwave powerwas lower as 270 watt.
Figure 3 shows a magnetite sample sintered by using H-filed of microwaves at 1000◦C. The sample shrank to 6.2 mmdiameter from 8 mm diameter for sintering. The sinteredsample was found to be oxidized on the only surface. Thelinear shrinkage of the sample was 17% and no remarkablechange in the shape was observed. The sample shrank to 82%theoretical density (TD) from 45%TD of green body.
Figure 4 shows the X-ray diffraction profile of the mag-netite after heating at 1000◦C. It shows Bragg reflections of
0
200
400
600
800
1000
1200
0 10 20 30 40 50 60 70 80
Microwave powerTemperature
Time (min)
Tem
pera
ture
(◦ C
)
Figure 2: The typical progress of process temperature measuredduring microwave heating.
both magnetite and hematite. The surface of sample wasoxidized because the nitrogen gas was flowing in cavityduring heating.
The high-resolution transmission electron microscope(TEM; a JEOL JEM-3200) observed the images of the originalmagnetite powder before heating and those excited in theselected magnetic field. The original crystal can see the well-ordered lattice patterns over the whole crystal; therefore theoriginal crystal has flat and homogeneous surfaces. Figure 5shows TEM image and selected area electron diffractionpattern. The sample heated in the magnetic field exhibitsthe presence of randomly oriented nano-crystal. The crystalsizes of this sample are of approximate average size 10 nm.The randomness of the lattice orientation indicates thatthe particle-particle magnetic interaction is negligible in

Physics Research International 3
Figure 3: The picture of magnetite sintered by using magnetic fieldof microwave at 1000◦C.
Inte
nsi
ty (
a.u
.)
2
20 25 30 35 40 45 50 55 60
2
4
6
8
10
12
14
0
Figure 4: X-ray diffraction of samples heated by magnetic field at1000◦C.
the heating cooling process. If each magnetic domain shouldbe highly excited by application of the oscillating magneticfield, cohesive rotation of the domains can be inducedsynchronously with the oscillating field. It is very interestingthat the temperature increase in the sample is accelerated ata temperature close to the Curie point and never rises above1000◦C but it is well below the melting point of 1535◦C.
The macroscopic magnetizations of samples were mea-sured by SQUID without zero correction (Quantum DesignMPMS-XL7). Figure 6 shows the hysteresis loop of magnetiteat 300 K. As can be seen in Figure 6, the saturated magne-tization (Ms) of sintered magnetite was 85.6 emu/g, whichwas as high as 95% of magnetite before heating (90.4 emu/g).
(a)
(b)
Figure 5: TEM image of magnetite sintered by using magnetic fieldof microwave at 1000◦C.
The averaged remanence (Mr) and coercivity (Hc) of themagnetite before heating were 11.74 emu/g and 108.9 Oe,respectively. On the other hand, the averaged remanence(Mr) and coercivity (Hc) of the magnetite after heating were0.17 emu/g and 1.12 Oe under measuring limit of SQUID,respectively. Their Mr value and Hc value of sintered samplebecame two digits smaller than raw sample for heating bymagnetic field of microwave.
4. Conclusion
We have developed a simple process for sintering of softmagnetization materials. For the sintering process of softmagnetic materials, magnetic fields of microwave have beenperformed in nitrogen atmosphere. Therefore, a microwave

4 Physics Research International
0 1000 2000 3000
Before heatingAfter heating
Magnetic field (Oe)
0
50
100
M(e
mu
/g)
−3000 −2000 −1000−100
−50
(a)
0
0.2
0.4
0 0.5 1 1.5 2
Magnetic field (Oe)
0.14
1.33
−0.2
−0.4
−2 −1.5 −1 −0.5
−0.2
−0.91
M(e
mu
/g)
(b)
Figure 6: (a) The hysteresis loop of the magnetite sintered by usingmagnetic field of microwave at 1000◦C. (b) The Mr and Hc of themagnetite sintered by using magnetic field of microwave at 1000◦C.
single-mode system operating at a frequency of 2.45 GHzand with a maximum power level of 1.5 kW was used. Wecan sinter the good soft magnetic material in microwavemagnetic field. The sample shrank to 82% theoretical density(TD) from 45%TD of green body. The sintered sample wasobserved the microstructure by TEM and the crystal size wasestimated the approximate average size is 10 nm.
Using microwave sintering, the Ms of sintered magnetitewas 85.6 emu/g, which was as high as 95% of raw magnetitewith 90.4 emu/g. On the other hand, the Mr and Hc of themagnetite after heating were 0.17 emu/g and 1.12 Oe undermeasuring limit of SQUID, respectively.
From TEM and SQUID data, it is suggested that thesintered magnetite under magnetic field of microwave hassuper-ferrimagnetism.
We expect that it is used in transformer or electro-magnetic cores. The macroscopic magnetization of sinteredbody using microwave can easily reverse direction withoutdissipating much energy, that is, hysteresis losses. Becauseof their comparatively low losses, they are extensively usedin the cores of transformers and electromagnetic cores inapplications such as car industrials.
References
[1] L. Cabrera, S. Gutierrez, N. Menendez, M. P. Morales, and P.Herrasti, “Magnetite nanoparticles: electrochemical synthesisand characterization,” Electrochimica Acta, vol. 53, no. 8, pp.3436–3441, 2008.
[2] L. Pan, G. Zhang, C. Fan et al., “Fabrication and character-ization of Fe3O4 thin films deposited by reactive magnetronsputtering,” Thin Solid Films, vol. 473, no. 1, pp. 63–67, 2005.
[3] H. K. Lee, S. H. Do, S. H. Kong et al., “The role of magnetitenano particle (MNP) to oxidize nitrobenzene using heteroge-neous fenton reaction,” in Proceedings of the World Congress onEngineering and Computer Science (WCECS ’10), vol. 2, 2010.
[4] R. Roy, D. Agrawal, J. Cheng, and S. Gedevanlshvili, “Full sin-tering of powdered-metal bodies in a microwave field,” Nature,vol. 399, no. 6737, pp. 668–670, 1999.
[5] R. Roy, R. Peelamedu, L. Hurtt, J. Cheng, and D. Agrawal,“Definitive experimental evidence for Microwave Effects: radi-cally new effects of separated E and H fields, such as decrystal-lization of oxides in seconds,” Materials Research Innovations,vol. 6, no. 3, pp. 128–140, 2002.

Hindawi Publishing CorporationPhysics Research InternationalVolume 2012, Article ID 632016, 7 pagesdoi:10.1155/2012/632016
Research Article
Metamagnetic Phase Transitions in(Sm0.5Gd0.5)0.55Sr0.45MnO3 Ceramics
Fedor N. Bukhanko
Department of Electronic Properties of Metals, Donetsk Physical and Technical Institute NASU, Donetsk 83114, Ukraine
Correspondence should be addressed to Fedor N. Bukhanko, [email protected]
Received 4 August 2011; Revised 18 January 2012; Accepted 18 January 2012
Academic Editor: Manh-Huong Phan
Copyright © 2012 Fedor N. Bukhanko. This is an open access article distributed under the Creative Commons Attribution License,which permits unrestricted use, distribution, and reproduction in any medium, provided the original work is properly cited.
The temperature dependences of ac magnetic susceptibility of the (Sm0.5Gd0.5)0.55Sr0.45MnO3 ceramics provide evidence of theformation of a mixed insulating state with a specific quantum-disordered phase, in which the domains with a long-rangeantiferromagnetic order dominate at temperatures below TN
∼= 48, 5 K. Irreversible metamagnetic phase transition in theferromagnetically ordered state is carried out at the critical field Hc1 ∼ 25 kOe which remains constant in the temperature rangefrom 4.2 K to 60 K. From the analysis of the magnetization isotherms, the conclusion can be made about a spontaneous phasetransition into the state with charge and orbital ordering at temperatures below the critical value TCO ∼ 60 K. It is supposed thatshort-range charge correlations exist in unusually large interval of temperatures∼90 K at temperatures aboveTCO that considerablyexceeds the area of existence of local orbital correlations ∼50 K.
1. Introduction
Change of the average radius 〈rA〉 of a rare-earth ion replac-ing lanthanum in A-positions of perofskite-like matrixes inR0.55Sr0.45MnO3 (R = Sm, Eu, Gd) manganites leads to thebicritical phase diagram where the metallic ferromagneticphase is separated from the dielectric antiferromagneticphase with charge/orbital (CO/OO) ordering by the firstorder phase transition [1, 2]. Prominent features whichshould be observed in experiment close to bicritical pointhave been predicted: (1) phase transition from a paramag-netic state in the ferromagnetic should be the of first order;(2) the critical temperatures of phase transitions TCO and Tc
close to bicrytical point should decrease sharply; (3) highsensibility of the sample to external magnetic field near tointerphase boundary. These effects arise because of hugefluctuation of several order parameters related to bicriticalbehavior, which sharply amplifies near to boundary of twophases, where more than two order parameters meet. As aresult of the local lattice distortion in R0.55Sr0.45MnO3, largestructural disorder enhances the phase fluctuation betweenferromagnetic metal and charge/orbital-ordered insulatorand suppresses their long-range orders [3–5].
The transition between a ferromagnetic (FM) metal andan insulator with short-range charge/orbital correlation in-duced by the change of average radius 〈rA〉 has been investi-gated for the single crystals (Sm1-y Gdy)0.55Sr0.45MnO3 (0 ≤y ≤ 1) [6]. A systematic study indicates that the long-rangeferromagnetic order is kept up to y ∼0.5 (corresponding toR = Eu) with Tc reduced from ∼130 K to ∼50 K, while itchanges to a spin-glass-like insulator for y≥ 0.6. Strong com-petition was found between long-range ferromagnetic orderand paramagnetic disorder or a spin-glass-like insulator withshort-range charge/orbital correlation, being controlled bychanges of the average radius 〈rA〉 or the external magneticfield. No macroscopic phase separation is discerned whenhigh-quality single-crystal specimens are used.
The results of measurements of magnetic susceptibilityχ(T) and magnetization isotherms M(H) in the samplesof ceramics of (Sm0.5Gd0.5)0.55Sr0.45MnO3 in strong staticand pulse magnetic fields essentially differ from the samemeasurements made earlier on the single crystals. It is sup-posed that the reason of a significant disparity of magneticproperties of these systems is the various nature of theground state in single crystals and the ceramics, related todifferent values of the structural disorder.

2 Physics Research International
2. Experimental Procedures
In this work, the ceramic samples of(Sm1-y Gdy)0.55Sr0.45MnO3 (0 ≤ y ≤ 1) were preparedusing the standard solid-state reaction technique. In briefdescription, homogeneous powders were heat treatedduring three stages at temperatures of 1000, 1100◦C for10 h, and 1150◦C for 24 h with intermediate grinding ofas-obtained products. Compacted under pressure of 10kbar, pellets were sintered in air at 1150◦C for 10 h withsucceeding temperature drop to the room temperature at therate of 70◦C/hour. Temperature dependences of magneticsusceptibility χ(T) were measured by induction method atfrequencies of 1, 5, 7, and 10 kHz in the temperature rangeof 4,2–100 K with the help of PPMS-10. Field dependencesof magnetization M(H) have been measured in an intervalof temperatures of 4,2–200 K in the strong pulse and staticmagnetic fields. Measurements in pulse fields to 300 kOeat temperatures varied from 20 to 200 K were made bynonindustrial pulse magnetometer, and measurements instatic fields to 80 kOe at 4,2 K have been carried out byapplication of vibrating magnetometer VSM EGG, PrincetonAppplied Reserch.
3. Experimental Results and Discussion
According to [6], in the (Sm1-y Gdy)0.55Sr0.45MnO3 singlecrystals, the metal ferromagnetic ground state is saved withgrowth of Gd content only in the range of concentrationof 0 ≤ y ≤ 0.5. The further increase of y results in thefirst-order phase transition in dielectric low-temperaturestate with characteristic signs of spin-glass phase. Unlikethe results of article [2], in the given work, the metalferromagnetic phase was destroyed completely already fory = 0.5, that is, associated apparently with larger structuraldisorder of ceramic samples. Results of measurement ofthe temperature dependence of ac magnetic susceptibilityof (Sm0.5Gd0.5)0.55Sr0.45MnO3 gave evidences of formationof long-range antiferromagnetic structure in the sampleswith the critical temperature TN
∼= 48, 5 K. The sharp peakof ac magnetic susceptibility close to 48,5 K is observedindependently of the frequency of measurement (Figure 1)and with a small temperature hysteresis∼2 K, which stronglydiffers from a wide peak χ(T) in the vicinity of TG ≈ 45 Kfor single crystals [6]. The same sharp peak of magneticsusceptibility had been observed earlier in various antiferro-magnets with Heisenberg, XY and Ising type of interaction,on magnetic lattices of dimensionality 1, 2, and 3 [7]. Atdecrease of the temperature, there is fast growth of χ(T) forT ≥ TN and then a sharp drop of the susceptibility wasfound for T ≤ TN. As shown in Figure 1, sharp peak ofmagnetic susceptibility is imposed on continuous paramag-netic increase of a susceptibility with the temperature dropin the wide temperature interval. The magnetic susceptibilityintensively rises with fall of temperature of the sampleand diverges near to absolute zero of temperatures, thatis, characteristic for quantum phase transitions in low-dimensional quantum Heisenberg antiferromagnets with thestructural disorder [8–10]. In this phase, low-temperature
0.009
0.008
0.007
0.006
0.005
0.004
0.003
0.0020 20 40 60 80 100
(em
u/g
)
7 kHz1 kHz
T (K)
Figure 1: Initial ac magnetic susceptibility curves χ(T) in the(Sm0.5Gd0.5)0.55Sr0.45MnO3 ceramics in zero external magnetic field.
uniform susceptibility diverges algebraically with nonuni-versal exponents. This is a signature that the quantum-disordered phase is a quantum Griffiths phase. Superpositionof two various contributions to a low-temperature magneticsusceptibility testifies to the inhomogeneity nature of theground state of the (Sm0.5Gd0.5)0.55Sr0.45MnO3 ceramics ina zero external magnetic field. Apparently, in these ceramicsamples, long-range antiferromagnetism coexists with short-range magnetic correlations in the large temperature intervalnear absolute zero. It is supposed that the mixed insulatingstate with a special feature of a quantum-disordered phasewith dominating domains of long-range antiferromagnetismis found in the (Sm0.5Gd0.5)0.55Sr0.45MnO3 ceramics at thetemperatures below TN
∼= 48, 5 K. Similar mixed state closeto quantum critical point had been discovered recently in theLa2/3Ca1/3Mn1-x GaxO3 manganites in the vicinity of a metal-insulator transition [11, 12].
The variation of an external static magnetic field in aninterval ±6 T at 4,2 K had led to irreversible destructionof mixed phase accompanied by formation of the steadyferromagnetic phase (Figure 2). Field-induced stable FMphase was formed as a result of continuous metamagneticphase transition induced by growth of an external magneticfield to extremely small critical value Hc1 = 25 kOe with asharp increase in magnetization M(H) in the form of a stepin height ΔM. The further increase of the field to 60 kOeresulted only in insignificant growth of magnetization. At themagnetic field reduction, the induced ferromagnetic phase issaved up to zero field. The subsequent variation field in aninterval ±15 kOe has allowed receiving of a wide hysteresisloop corresponding apparently to an anisotropic ferromag-netic state of the sample at 4,2 K. A distinction of the receivedmagnetization curve M(H) at 4.2 K is large width of thehysteresis loop (∼4,4 kOe), which corresponds to coercivefield Hc
∼= 2, 2 kOe, and rather small size of magnetization ofsaturation in the field of 60 kOe∼60 emu/g, related evidentlywith the canted state of the manganese spins.
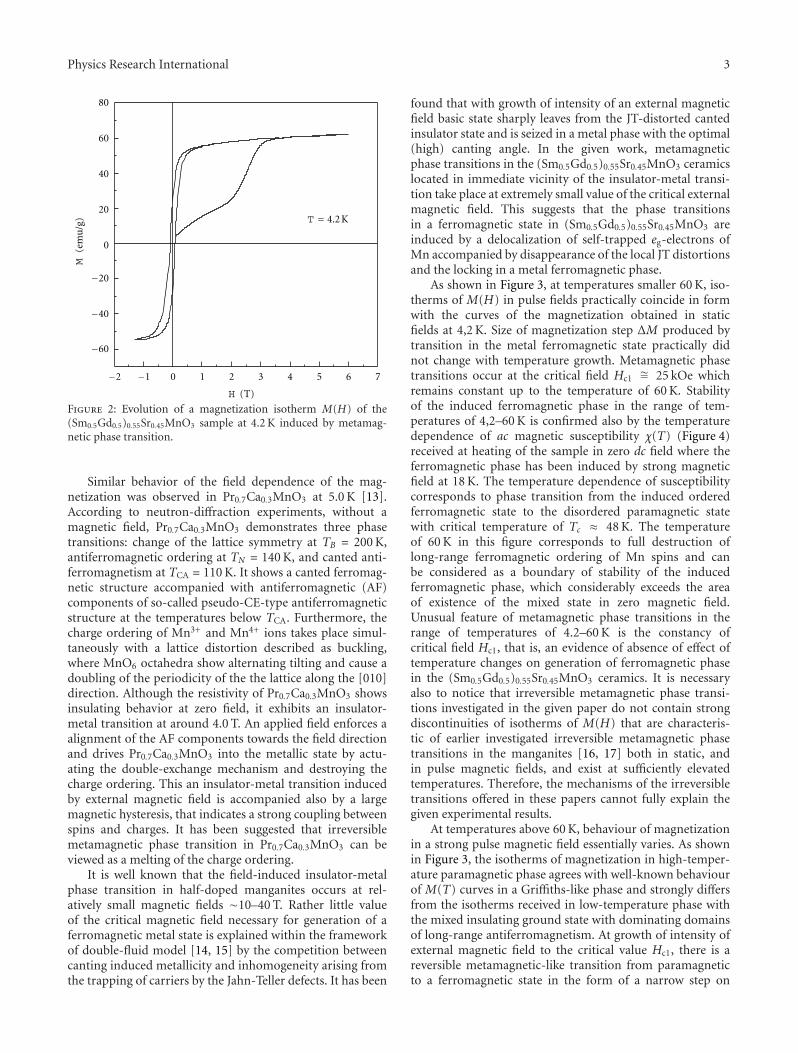
Physics Research International 3
80
60
40
20
0
−20
−40
−60
−2 −1 0 1 2 3 4 5 6 7
T = 4.2 K
H (T)
M(e
mu
/g)
Figure 2: Evolution of a magnetization isotherm M(H) of the(Sm0.5Gd0.5)0.55Sr0.45MnO3 sample at 4.2 K induced by metamag-netic phase transition.
Similar behavior of the field dependence of the mag-netization was observed in Pr0.7Ca0.3MnO3 at 5.0 K [13].According to neutron-diffraction experiments, without amagnetic field, Pr0.7Ca0.3MnO3 demonstrates three phasetransitions: change of the lattice symmetry at TB = 200 K,antiferromagnetic ordering at TN = 140 K, and canted anti-ferromagnetism at TCA = 110 K. It shows a canted ferromag-netic structure accompanied with antiferromagnetic (AF)components of so-called pseudo-CE-type antiferromagneticstructure at the temperatures below TCA. Furthermore, thecharge ordering of Mn3+ and Mn4+ ions takes place simul-taneously with a lattice distortion described as buckling,where MnO6 octahedra show alternating tilting and cause adoubling of the periodicity of the the lattice along the [010]direction. Although the resistivity of Pr0.7Ca0.3MnO3 showsinsulating behavior at zero field, it exhibits an insulator-metal transition at around 4.0 T. An applied field enforces aalignment of the AF components towards the field directionand drives Pr0.7Ca0.3MnO3 into the metallic state by actu-ating the double-exchange mechanism and destroying thecharge ordering. This an insulator-metal transition inducedby external magnetic field is accompanied also by a largemagnetic hysteresis, that indicates a strong coupling betweenspins and charges. It has been suggested that irreversiblemetamagnetic phase transition in Pr0.7Ca0.3MnO3 can beviewed as a melting of the charge ordering.
It is well known that the field-induced insulator-metalphase transition in half-doped manganites occurs at rel-atively small magnetic fields ∼10–40 T. Rather little valueof the critical magnetic field necessary for generation of aferromagnetic metal state is explained within the frameworkof double-fluid model [14, 15] by the competition betweencanting induced metallicity and inhomogeneity arising fromthe trapping of carriers by the Jahn-Teller defects. It has been
found that with growth of intensity of an external magneticfield basic state sharply leaves from the JT-distorted cantedinsulator state and is seized in a metal phase with the optimal(high) canting angle. In the given work, metamagneticphase transitions in the (Sm0.5Gd0.5)0.55Sr0.45MnO3 ceramicslocated in immediate vicinity of the insulator-metal transi-tion take place at extremely small value of the critical externalmagnetic field. This suggests that the phase transitionsin a ferromagnetic state in (Sm0.5Gd0.5)0.55Sr0.45MnO3 areinduced by a delocalization of self-trapped eg-electrons ofMn accompanied by disappearance of the local JT distortionsand the locking in a metal ferromagnetic phase.
As shown in Figure 3, at temperatures smaller 60 K, iso-therms of M(H) in pulse fields practically coincide in formwith the curves of the magnetization obtained in staticfields at 4,2 K. Size of magnetization step ΔM produced bytransition in the metal ferromagnetic state practically didnot change with temperature growth. Metamagnetic phasetransitions occur at the critical field Hc1
∼= 25 kOe whichremains constant up to the temperature of 60 K. Stabilityof the induced ferromagnetic phase in the range of tem-peratures of 4,2–60 K is confirmed also by the temperaturedependence of ac magnetic susceptibility χ(T) (Figure 4)received at heating of the sample in zero dc field where theferromagnetic phase has been induced by strong magneticfield at 18 K. The temperature dependence of susceptibilitycorresponds to phase transition from the induced orderedferromagnetic state to the disordered paramagnetic statewith critical temperature of Tc ≈ 48 K. The temperatureof 60 K in this figure corresponds to full destruction oflong-range ferromagnetic ordering of Mn spins and canbe considered as a boundary of stability of the inducedferromagnetic phase, which considerably exceeds the areaof existence of the mixed state in zero magnetic field.Unusual feature of metamagnetic phase transitions in therange of temperatures of 4.2–60 K is the constancy ofcritical field Hc1, that is, an evidence of absence of effect oftemperature changes on generation of ferromagnetic phasein the (Sm0.5Gd0.5)0.55Sr0.45MnO3 ceramics. It is necessaryalso to notice that irreversible metamagnetic phase transi-tions investigated in the given paper do not contain strongdiscontinuities of isotherms of M(H) that are characteris-tic of earlier investigated irreversible metamagnetic phasetransitions in the manganites [16, 17] both in static, andin pulse magnetic fields, and exist at sufficiently elevatedtemperatures. Therefore, the mechanisms of the irreversibletransitions offered in these papers cannot fully explain thegiven experimental results.
At temperatures above 60 K, behaviour of magnetizationin a strong pulse magnetic field essentially varies. As shownin Figure 3, the isotherms of magnetization in high-temper-ature paramagnetic phase agrees with well-known behaviourof M(T) curves in a Griffiths-like phase and strongly differsfrom the isotherms received in low-temperature phase withthe mixed insulating ground state with dominating domainsof long-range antiferromagnetism. At growth of intensity ofexternal magnetic field to the critical value Hc1, there is areversible metamagnetic-like transition from paramagneticto a ferromagnetic state in the form of a narrow step on

4 Physics Research International
0.2
0.1
0
−0.1
0.2
0.1
0
−0.1
0.2
0.1
0
−0.1
0.2
0.1
0
−0.1
0.2
0.1
0
−0.1
−30 0 30 60 90 120 150 180H (kOe)
T = 110 K
T = 80 K
T = 60 K
T = 40 K
T = 20 K
Mag
net
izat
ion
(a.
u.)
Mag
net
izat
ion
(a.
u.)
Mag
net
izat
ion
(a.
u.)
Mag
net
izat
ion
(a.
u.)
Mag
net
izat
ion
(a.
u.)
Figure 3: Evolution of magnetization isotherms M(H) of the (Sm0.5Gd0.5)0.55Sr0.45MnO3 ceramics in the pulse magnetic fields for tempera-tures of 20–110 K.
120
100
80
60
40
20
0
20 40 60 80 100 120 140 160 180
(em
u/g
)
T (K)
Figure 4: Temperature dependence of the ac magnetic susceptibility χ(T) of the ceramics (Sm0.5Gd0.5)0.55Sr0.45MnO3 obtained after meta-magnetic phase transition at 18 K.

Physics Research International 5
1
0.8
0.6
0.4
0.2
0
0 20 40 60 80 100 120 140 160 180T (K)
Tco = 60 K
T∗ = 150 KΔM
(a.u
.)
Figure 5: Temperature dependence of magnetization step height ΔM(T) at the metamagnetic phase transitions in the(Sm0.5Gd0.5)0.55Sr0.45MnO3 ceramics induced in the temperature interval of 18–165 K.
25
20
15
10
5
0
0 20 40 60 80 100 120 140
T (K)
Tco = 60 K
ΔH
c(k
Oe)
Figure 6: Temperature dependence of field hysteresiswidth ΔHc of the metamagnetic phase transitions in the(Sm0.5Gd0.5)0.55Sr0.45MnO3 ceramics induced in the temperatureinterval of 18–165 K.
M(H) curve accompanied by field hysteresis at reductionof magnetic field intensity with critical field Hc2 /= 0 belowwhich the sample comes back to the initial paramagneticstate. The values of critical fields Hc1 and Hc2 practicallylinearly increase at temperatures above 80 K, whereas adifference of critical fields ΔHc = Hc1 − Hc2 decreaseswith the temperature rising and reaches zero near 110 K.At the further rise in temperature, the field-induced phasetransition looked like a narrow step of magnetization ΔM(T)without field hysteresis, which was displaced linearly ontemperature towards stronger fields and disappeared attemperatures above 150 K (Figure 5). At temperatures above150 K corresponding to top boundary T∗ of Griffiths-likephase, we observed only linear increase in magnetizationwith field growth, characteristic for a usual paramagneticphase. Unusual behaviour of magnetization isotherms attemperatures above 60 K apparently is caused by growth oflocal charge/orbital correlations with the temperature drop
160
140
120
100
80
60
40
20
0
0 20 40 60 80 100 120
T(K
)
H (kOe)
−H c1
−H c2
PM
FM
Figure 7: Magnetic H-T phase diagram of the(Sm0.5Gd0.5)0.55Sr0.45MnO3 ceramics, received in strong pulsemagnetic fields.
to the critical value TCO∼= 60 K associated with transition
of the sample to a state with long-range charge-ordering.The strong magnetic field destroys both long-range charge-ordering state (T < TCO) and the state with short-rangecharge/orbital correlation (T > TCO) that results in field-induced phase transitions found in this work. It is possible toassume that sharp falling to zero of width of a hysteresis ΔHc
of the critical fields of metamagnetic phase transition withgrowth of temperature (Figure 6) is related to destructionof local correlations of orbital order ξOO(T) at temperaturesabove 110 K, whereas field-induced magnetization step ΔM,falling to zero in the range of temperatures of 60–150 K,implies destruction of local charge-order and reduction tozero of the correlation length ξCO(T) at the temperatureT∗ ∼= 150 K. Magnetic H-T phase diagramme of the(Sm0.5Gd0.5)0.55Sr0.45MnO3 ceramics had been received instrong pulse magnetic fields (Figure 7).

6 Physics Research International
0.004
0.002
0
50 60 70 80 90
0.018
0.012
0
30 35 40 45 50
0.03
0.02
0.01
0
10 20 30 40 50
65 K
80 K
110 K
H (kOe)
H (kOe)
H (kOe)
dM
/dH
(a.
u.)
dM
/dH
(a.
u.)
dM
/dH
(a.
u.)
0.006
Figure 8: Field dependences of derivative of magnetization dM/dH received near to critical field Hc1 of transition in a ferromagnetic stateat temperatures above TCO
∼= 60 K.
Special interest is represented by additional step structureof magnetization isotherms M(H) close to critical field Hc1
where charge/orbital correlations are broken, received onlyin the rapid pulse fields with sweep rate of magnetic field≥2 T/μs. In experiment, an existence of one or two smallnarrow steps of the magnetization was shown, which arisewith growth of magnetic field near to critical value Hc1 andare absent in hysteresis curves at field reduction close to Hc2.More clearly, this feature is shown in field dependences ofmagnetization derivative dM/dH close to Hc1 in the form ofadditional narrow peaks of the derivative, having by the basispeak in width ∼20 kOe (Figure 8). These steps of isothermsof magnetization exist only at temperatures lower 110 K thatallows us to assume that the reason of their occurrence isdestruction of short-range orbital correlations forming thedomain structure of JT distortions of a crystal lattice forT < 110 K. In vicinity of TCO
∼= 60 K, there is a splittingof dM/dH single peak evidently connected with existence ofclose TCO incommensurate lattice modulation of an elasticfield JT distortions with wave number incommensurate withthe lattice constant.
4. Conclusion
The results of measurement of the temperature dependencesof ac magnetic susceptibility χ(T) of the(Sm0.5Gd0.5)0.55Sr0.45MnO3 ceramics illustrate formationof the mixed insulating state with a special feature of aquantum-disordered phase with dominating domains witha long-range antiferromagnetism at the temperatures belowTN
∼= 48, 5 K. In extremely weak magnetic field Hc1∼=
25 kOe, field-induced irreversible metamagnetic phasetransition from a mixed insulating state to metallic ferromag-netic one was found out, being related to destroy of long-range charge/orbital correlation which amplifies the localantiferromagnetic correlations of Mn spins. From theanalysis of isotherms of magnetization, the conclusion wasmade about spontaneous phase transition with charge/orbital ordering at temperatures below the critical valueTCO
∼= 60 K. At temperatures above 60 K, there arereversible field-induced metamagnetic-like transitions inthe ferromagnetic state, related to destroy of short-rangecharge/orbital correlations. It is supposed that nanoscalecorrelations of a charge exist in unusually large interval of

Physics Research International 7
temperatures ∼90 K at temperatures above TCO that con-siderably surpasses area of existence of short-range orbitalcorrelations ∼50 K, creating an elastic field Jahn-Teller de-formations of the crystal lattice. An additional steps structureof magnetization isotherms close to Hc1 was found, whichexist only at magnetization in very fast pulse fields withsweep rate of magnetic field ≥2 T/μs. It is supposed theexistence of close to TCO incommensurate lattice modulationof elastic field JT distortions with wave number incommen-surate with the lattice constant.
References
[1] Y. Tokura, “Critical features of colossal magnetoresistive man-ganites,” Reports on Progress in Physics, vol. 69, no. 3, pp. 797–851, 2006.
[2] S. Murakami and N. Nagaosa, “Colossal magnetoresistance inmanganites as a multicritical phenomenon,” Physical ReviewLetters, vol. 90, no. 19, Article ID 197201, 4 pages, 2003.
[3] Y. Motome, N. Furukawa, and N. Nagaosa, “Competingorders and disorder-induced insulator to metal transition inmanganites,” Physical Review Letters, vol. 91, no. 16, Article ID167204, 4 pages, 2003.
[4] H. Aliaga, D. Magnoux, A. Moreo, D. Poilblanc, S. Yunoki, andE. Dagotto, “Theoretical study of half-doped models for man-ganites: fragility of CE phase with disorder, two types of colos-sal magnetoresistance, and charge-ordered states for electron-doped materials,” Physical Review B, vol. 68, no. 10, Article ID104405, 14 pages, 2003.
[5] J. Burgy, M. Mayr, V. Martin-Mayor, A. Moreo, and E. Dagotto,“Colossal effects in transition metal oxides caused by intrinsicinhomogeneities,” Physical Review Letters, vol. 87, no. 27,Article ID 277202, 4 pages, 2001.
[6] Y. Tomioka, Y. Okimoto, J. H. Jung, R. Kumai, and Y. Tokura,“Critical control of competition between metallic ferromag-netism and charge/orbital correlation in single crystals ofperovskite manganites,” Physical Review B, vol. 68, no. 9,Article ID 094417, 7 pages, 2003.
[7] L. J. de Jongh and A. R. Miedema, “Experiments on simplemagnetic model systems,” Advances in Physics, vol. 23, no. 1,pp. 1–260, 1974.
[8] T. Vojta and J. Schmalian, “Quantum Griffiths effects initinerant Heisenberg magnets,” Physical Review B, vol. 72, no.4, Article ID 045438, 6 pages, 2005.
[9] A. A. Zvyagin, “Quantum phase transitions in low-dimen-sional quantum spin systems with incommensurate magneticstructures,” Physical Review B, vol. 72, no. 6, Article ID 064419,8 pages, 2005.
[10] A. W. Sandvik, “Quantum criticality and percolation in dimer-diluted two-dimensional antiferromagnets,” Physical ReviewLetters, vol. 96, no. 20, Article ID 207201, 4 pages, 2006.
[11] J. L. Alonso, L. A. Fernandez, F. Guinea, V. Laliena, and V.Martin-Mayor, “Interplay between double-exchange, superex-change, and Lifshitz localization in doped manganites,” Physi-cal Review B, vol. 66, no. 10, Article ID 104430, 6 pages, 2002.
[12] J. M. de Teresa, P. A. Algarabel, C. Ritter et al., “Possible quan-tum critical point in La2/3Ca1/3Mn1−xGaxO3,” Physical ReviewLetters, vol. 94, no. 20, Article ID 207205, 4 pages, 2005.
[13] H. Yoshizawa, H. Kawano, Y. Tomioka, and Y. Tokura, “Neu-tron-diffraction study of the magnetic-field-induced metal-insulator transition in Pr0.7Ca0.3MnO3,” Physical Review B, vol.52, no. 18, pp. R13145–R13148, 1995.
[14] T. V. Ramakrishnan, H. R. Krishnamurthy, S. R. Hassan, andG. V. Pai, “Theory of insulator metal transition and colossalmagnetoresistance in doped manganites,” Physical ReviewLetters, vol. 92, no. 15, Article ID 157203, 4 pages, 2004.
[15] O. Cepas, H. R. Krishnamurthy, and T. V. Ramakrishnan,“Doping and field-induced insulator-metal transitions in half-doped manganites,” Physical Review Letters, vol. 94, no. 24,Article ID 247207, 4 pages, 2005.
[16] L. Ghivelder, R. S. Freitas, M. G. das Virgens et al., “Abruptfield-induced transition triggered by magnetocaloric effect inphase-separated manganites,” Physical Review B, vol. 69, no.21, Article ID 214414, 5 pages, 2004.
[17] D. S. Rana, D. G. Kuberkar, and S. K. Malik, “Field-inducedabrupt change in magnetization of the manganite compounds(LaR)0.45(CaSr)0.55MnO3 (R = Eu and Tb),” Physical Review B,vol. 73, no. 6, Article ID 064407, 6 pages, 2006.

Hindawi Publishing CorporationPhysics Research InternationalVolume 2012, Article ID 591839, 9 pagesdoi:10.1155/2012/591839
Review Article
Novel Applications of Ferrites
Raul Valenzuela
Departamento de Materiales Metalicos y Ceramicos, Instituto de Investigaciones en Materiales,Universidad Nacional Autonoma de Mexico, P.O. Box 70360, Coyoacan 04510, Mexico City, DF, Mexico
Correspondence should be addressed to Raul Valenzuela, [email protected]
Received 26 July 2011; Accepted 21 December 2011
Academic Editor: Arcady Zhukov
Copyright © 2012 Raul Valenzuela. This is an open access article distributed under the Creative Commons Attribution License,which permits unrestricted use, distribution, and reproduction in any medium, provided the original work is properly cited.
The applications of ferrimagnetic oxides, or ferrites, in the last 10 years are reviewed, including thin films and nanoparticles.The general features of the three basic crystal systems and their magnetic structures are briefly discussed, followed by themost interesting applications in electronic circuits as inductors, in high-frequency systems, in power delivering devices, inelectromagnetic interference suppression, and in biotechnology. As the field is considerably large, an effort has been made toinclude the original references discussing each particular application on a more detailed manner.
1. Introduction
Ferrites are a large class of oxides with remarkable magneticproperties, which have been investigated and applied duringthe last ∼50 years [1]. Their applications encompass an im-pressive range extending from millimeter wave integratedcircuitry to power handling, simple permanent magnets, andmagnetic recording. These applications are based upon thevery basic properties of ferrites: a significant saturation ma-gnetization, a high electrical resistivity, low electrical losses,and a very good chemical stability. Ferrites can be obtained inthree different crystal systems by many methods, and thefeasibility to prepare a virtually unlimited number of solidsolutions opens the means to tailor their properties for manyapplications. For many applications, ferrites cannot be sub-stituted by ferromagnetic metals; for other, ferrites oftencompete with metals on economic reasons.
The possibility of preparing ferrites in the form of nano-particles has open a new and exciting research field, with rev-olutionary applications not only in the electronic technologybut also in the field of biotechnology.
In this paper, the applications of ferrites developed in thelast 10 years are briefly described.
2. Ferrites
2.1. Spinels. Spinel ferrites possess the crystal structure of thenatural spinel MgAl2O4, first determined by Bragg [2]. This
structure is particularly stable, since there is an extremelylarge variety of oxides which adopt it, fulfilling the conditionsof overall cation-to-anion ratio of 3/4, a total cation valencyof 8, and relatively small cation radii. Spinel structure isshown in Figure 1. Cation valency combinations known are2, 3 (as in Ni2+Fe3+
2 O4); 2, 4 (as in Co2GeO4); 1, 3, 4 (as inLiFeTiO4); 1, 3 (as in Li0.5Fe2.5O4); 1, 2, 5 (as in LiNiVO4); 1,6 (as in Na2WO4). In ferrites with applications as magneticmaterials, Al3+ has usually been substituted by Fe3+. An im-portant ferrite is magnetite, Fe2+Fe3+
2 O4 (typically referredas Fe3O4), probably the oldest magnetic solid with practicalapplications and currently a very active research field, dueto the fascinating properties associated with the coexistenceof ferrous and ferric cations. Another important material byits structure, as well as by its applications in audio recordingmedia, is maghemite or γ-Fe2O3, which can be consideredas a defective spinel � 1/3Fe3+
8/3O4, where � represents vaca-ncies on cation sites.
The overall symmetry of oxygens is fcc (face centeredcubic), which defines two types of interstitial sites: 64tetrahedral sites and 32 octahedral sites, for a unit cell con-taining 8 times the basic formula AB2O4. Only one-eighth oftetrahedral sites and half of octahedral sites are occupied bycations. The space group is Fd3m.
In MgAl2O4, Al and Mg cations occupy the octahedraland tetrahedral sites, respectively. This cation distribu-tion, known as a normal spinel, is usually indicated as
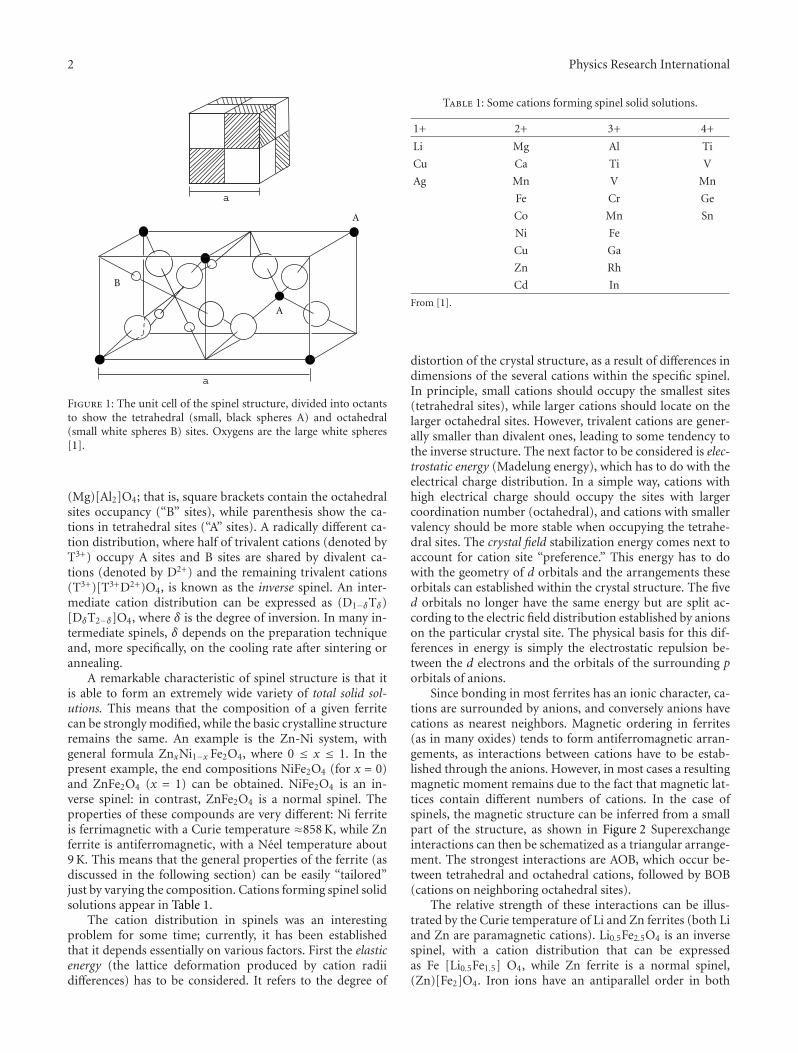
2 Physics Research International
A
A
B
a
a
Figure 1: The unit cell of the spinel structure, divided into octantsto show the tetrahedral (small, black spheres A) and octahedral(small white spheres B) sites. Oxygens are the large white spheres[1].
(Mg)[Al2]O4; that is, square brackets contain the octahedralsites occupancy (“B” sites), while parenthesis show the ca-tions in tetrahedral sites (“A” sites). A radically different ca-tion distribution, where half of trivalent cations (denoted byT3+) occupy A sites and B sites are shared by divalent ca-tions (denoted by D2+) and the remaining trivalent cations(T3+)[T3+D2+)O4, is known as the inverse spinel. An inter-mediate cation distribution can be expressed as (D1−δTδ)[DδT2−δ]O4, where δ is the degree of inversion. In many in-termediate spinels, δ depends on the preparation techniqueand, more specifically, on the cooling rate after sintering orannealing.
A remarkable characteristic of spinel structure is that itis able to form an extremely wide variety of total solid sol-utions. This means that the composition of a given ferritecan be strongly modified, while the basic crystalline structureremains the same. An example is the Zn-Ni system, withgeneral formula ZnxNi1−x Fe2O4, where 0 ≤ x ≤ 1. In thepresent example, the end compositions NiFe2O4 (for x = 0)and ZnFe2O4 (x = 1) can be obtained. NiFe2O4 is an in-verse spinel: in contrast, ZnFe2O4 is a normal spinel. Theproperties of these compounds are very different: Ni ferriteis ferrimagnetic with a Curie temperature ≈858 K, while Znferrite is antiferromagnetic, with a Neel temperature about9 K. This means that the general properties of the ferrite (asdiscussed in the following section) can be easily “tailored”just by varying the composition. Cations forming spinel solidsolutions appear in Table 1.
The cation distribution in spinels was an interestingproblem for some time; currently, it has been establishedthat it depends essentially on various factors. First the elasticenergy (the lattice deformation produced by cation radiidifferences) has to be considered. It refers to the degree of
Table 1: Some cations forming spinel solid solutions.
1+ 2+ 3+ 4+
Li Mg Al Ti
Cu Ca Ti V
Ag Mn V Mn
Fe Cr Ge
Co Mn Sn
Ni Fe
Cu Ga
Zn Rh
Cd In
From [1].
distortion of the crystal structure, as a result of differences indimensions of the several cations within the specific spinel.In principle, small cations should occupy the smallest sites(tetrahedral sites), while larger cations should locate on thelarger octahedral sites. However, trivalent cations are gener-ally smaller than divalent ones, leading to some tendency tothe inverse structure. The next factor to be considered is elec-trostatic energy (Madelung energy), which has to do with theelectrical charge distribution. In a simple way, cations withhigh electrical charge should occupy the sites with largercoordination number (octahedral), and cations with smallervalency should be more stable when occupying the tetrahe-dral sites. The crystal field stabilization energy comes next toaccount for cation site “preference.” This energy has to dowith the geometry of d orbitals and the arrangements theseorbitals can established within the crystal structure. The fived orbitals no longer have the same energy but are split ac-cording to the electric field distribution established by anionson the particular crystal site. The physical basis for this dif-ferences in energy is simply the electrostatic repulsion be-tween the d electrons and the orbitals of the surrounding porbitals of anions.
Since bonding in most ferrites has an ionic character, ca-tions are surrounded by anions, and conversely anions havecations as nearest neighbors. Magnetic ordering in ferrites(as in many oxides) tends to form antiferromagnetic arran-gements, as interactions between cations have to be estab-lished through the anions. However, in most cases a resultingmagnetic moment remains due to the fact that magnetic lat-tices contain different numbers of cations. In the case ofspinels, the magnetic structure can be inferred from a smallpart of the structure, as shown in Figure 2 Superexchangeinteractions can then be schematized as a triangular arrange-ment. The strongest interactions are AOB, which occur be-tween tetrahedral and octahedral cations, followed by BOB(cations on neighboring octahedral sites).
The relative strength of these interactions can be illus-trated by the Curie temperature of Li and Zn ferrites (both Liand Zn are paramagnetic cations). Li0.5Fe2.5O4 is an inversespinel, with a cation distribution that can be expressedas Fe [Li0.5Fe1.5] O4, while Zn ferrite is a normal spinel,(Zn)[Fe2]O4. Iron ions have an antiparallel order in both

Physics Research International 3
A
B
B
B
1/4 a
Figure 2: Detail of the A and B sites around an oxygen, to show ABand BB interactions.
ferrites, but as they both occupy octahedral sites, they com-pensate completely in Zn ferrite. In the case of Li ferrite, theyhave also an antiparallel order, but they belong to differentsublattices, with different number. As a result, Zn ferrite isanti-ferromagnetic (with zero resulting magnetization), andLi ferrite is ferromagnetic, with a magnetization (per formulaunit) of about 0.5 Bohr magneton (close to 0 K). The strengthof interactions is apparent in the transition temperatures: theCurie point for Li ferrite is the highest observed in spinels958 K, while Neel temperature for Zn ferrite is the lowest inspinels 9 K.
An interesting system is ZnxNi1−xFe2O4, which is normalfor Zn and inverse for Ni. The general site occupancy can beexpressed as: (ZnxFe1−x)[Ni1−xFe1+x]O4. The compositionvaries from Ni ferrite (x = 0) to Zn ferrite (x = 1). Startingwith Ni ferrite, the decrease in x occurs as if Zn enteringin A sites “push” Fe toward B sites, filling the octahedralsites left by the decreasing Ni ions. As in all inverse ferrites,the low-temperature global magnetization depends on thedivalent cation (as Fe ions are antiparallel). The presence ofZn decreases the magnetization in A sublattice and increasesthe B sublattices. The addition of a paramagnetic cationthus leads to an increase in total magnetization! However,as Zn increases in A sites, AOB interaction weakens, and forx ≈ 0.65, BOB interaction is comparable to AOB interactionleading to a triangular structure (known as Yafet-Kittel [3]).
The Curie temperature shows also a large variation withcomposition for ZnNi ferrites, TC = 858 K for x = 0 (Ni fer-rite), and as mentioned above, Zn ferrite is antiferromag-netic, with TN = 9 K.
2.2. Garnets. The crystal structure is that of the garnet mi-neral, Mn3Al2Si3O12. The magnetic garnets include Fe3+
instead of Al and Si, and a rare earth cation (R) substitutesMn, to give the general formula R3Fe5O12 for ferromagneticgarnets [4, 5]. The crystal structure has cubic symmetryand is relatively complex; the unit cell has 8 formula units(160 atoms) and belongs to the space group Oh
10-Ia3d. In
contrast with spinels, the oxygen sublattice is not a close-packed arrangement, but it is better described as a polyhedracombination. Three kinds of cation sites exist in this struc-ture: dodecahedral (eightfold), octahedral (sixfold), and te-trahedral (fourfold) sites. Rare earth cations, R, occupy thelargest, dodecahedral sites, while Fe3+ cations distributeamong the tetra- and octahedral places. The cation distribu-tion is generally expressed as {R3}(Fe3)[Fe2]O12; {} bracketdenotes dodecahedral sites, () parenthesis are used for te-trahedral site occupancy, and octahedral sites are indicatedby square brackets []. Rare earth cations (from La3+ to Lu3+)enter the dodecahedral sites, and as spinels, garnets can formtotal solid solutions. A wide variety of cation substitutionshas been reported [6]. Yttrium iron garnet, Y3Fe5O12 alsoknown as “YIG,” has remarkable magnetic properties.
The magnetic structure of garnets can be described bythree magnetic sublattices, with a superexchange interactionthrough oxygens. Dodecahedral and octahedral ions are pa-rallel, while tetrahedral cations adopt an antiparallel orienta-tion. At very low temperatures, global magnetization (performula unit) is roughly (3 μR-μFe), where μR and μFe are therare earth and the iron magnetic moments, respectively. Thedifferences in thermal behavior among the three sublatticeslead to the compensation of magnetic moments. As tempera-ture increases, the magnetization in each sublattice is affectedby the thermal agitation and decreases. This reduction inmagnetization is slow in iron sublattices, but, due to itslarger size, the decrease is quite steeply in the dodecahe-dral sublattice. At a certain temperature, the reduction inmagnetization in rare earth sublattice exactly compensatesthe difference between octa- and tetrahedral sublattice, andglobal magnetization exhibits a zero value. For GdIG, thistemperature is 300 K. The fact that magnetic structure isdominated by iron sublattices can also be observed in theCurie temperature: virtually all iron garnets show the sametransition point (∼560 K).
2.3. Hexaferrites. All of hexagonal ferrites are synthetic; bari-um hexaferrite (BaFe12O19) possesses the same structure asthe natural mineral magnetoplumbite, of approximate for-mula PbFe7.5Mn3.5Al0.5Ti0.5O19. Rather than sharing a com-mon crystal structure, hexaferrites are a family of relatedcompounds with hexagonal and rhombohedral symmetry.The main compositions can be represented in the uppersection of the MeO-Fe2O3-BaO ternary phase diagram. Me isa divalent cation such as Ni, Mg, Co, Fe, Zn, Cu, for instance.All the magnetic hexaferrites are found on the BaFe12O19-Me2Fe4O8 and BaFe12O19-Me2BaFe12O22 joins (Figure 3).If the end members are designated as M (BaFe12O19), S(Me2Fe4O8), and Y (Me2BaFe12O22); the joins are M-S andM-Y, respectively. Some of the main compositions are foundin Table 2.
Hexaferrites can also form an extensive variety of solidsolutions. Ba can be substituted by Sr, Ca, and Pb. Fe3+ canbe substituted by trivalent cations such as Al, Ga, In, Sc [8],or by a combination of divalent + tetravalent cations, suchas Co2+ + Ti4+. A more complete account of these solid sol-utions can be found in [1].

4 Physics Research International
Table 2: Formulae of some hexaferrites and their formation fromend members of the ternary phase diagram.
Designation Formula
M BaFe12O19
Y Ba2Me2Fe12O22
W (MS) BaMe2Fe16O27
X (M2S) Ba2Me2Fe28O46
U (M2Y) Ba4Me2Fe36O60
Z (M2Y2) Ba6Me4Fe48O82
S=F = Me2Fe4O8
70
80
90
60 40
30
20
10
”
”
Fe2O3
M
U
X
WZ
Y
M2m Yn
BaO
M6S
M4S
M2Y5
M2Y3
M2Y4M2Y6
10203040
MeO
Fe2O3
Ba2Fe8O14
BaFe2O4
Figure 3: Upper triangle of the Fe2O3-BaO-MeO phase diagramshowing the several compositions of hexaferrites [7].
The magnetic structure in hexaferrites is complex,as a consequence of their complex crystal structure. InBaFe12O19, iron ions occupy five different sublattices, witha total magnetization 20 μB per formula unit, at low T . Adetailed analysis of magnetic and crystal structures can befound in (9). The most interesting feature of hexaferrites istheir high coercivity.
2.4. Preparation of Ferrites. Ferrites were first prepared byceramic methods, involving milling, mixing, pressing, sin-tering, and finishing as basic operations, to obtain bulk ma-terials with grains in the micrometric scale. However, as aresult of the general current tendency to circuit integrationand miniaturization, ferrites are prepared in the form ofthick and thin films and, more recently, as nanostructuredmaterials.
Ferrite thin films can be polycrystalline or epitaxial films.Major methods to obtain ferrite thin films are electroplating(or ferrite plating) [9], magnetron sputtering (single andmultitarget) [10], pulsed laser deposition [11], and molec-ular beam epitaxy [12]. A detailed account of epitaxial ferritefilms can be found in [13].
An additional route to tuning ferrite properties for spec-ific applications is the production of heterostructures, that is,
the artificial layering of ferrites with isostructural and non-isostructural materials, such as Fe3O4/NiO (53), Fe3O4/CoO(56), and (Mn,Zn)Fe2O4/Co Fe2O4 [14], and incorporatingthem into planar devices. The combination of ferrite layerswith piezoelectric layers is leading to new and excitingapplications, as reported below.
By reducing the scale to the nanometric size, new andtechnologically interesting properties have been obtained.Nanocrystalline magnetic materials have been obtained by avariety of methods, such as coprecipitation [15], hydrother-mal [16], sonochemical [17], citrate precursor [18], sol-gel[19], mechanical alloying [20], shock wave [21], reverse mi-celle [22], forced hydrolysis in a polyol [23], and even byusing egg white as an aqueous medium [24].
The preparation methods of ferrites for applications inbiotechnology are reported below.
3. Novel Applications of Ferrites
3.1. Inductors. Ferrites are primarily used as inductive com-ponents in a large variety of electronic circuits such as low-noise amplifiers, filters, voltage-controlled oscillators, im-pedance matching networks, for instance. Their recent ap-plications as inductors obey, among other tendencies, to thegeneral trend of miniaturization and integration as ferritemul-tilayers for passive functional electronic devices. Themultilayer technology has become a key technology formass production of integrated devices; multilayers allow ahigh degree of integration density. Multilayer capacitors pen-etrated the market a few decades ago, while inductors startedin the 1980s. The basic components to produce the induc-tance are a very soft ferrite and a metallic coil.
In addition, to provide a high permeability at the opera-tion frequency, the ferrite film should be prepared by a pro-cess compatible with the integrated circuit manufacturingprocess. Sputtering provides films with high density, but thecomposition is sometimes difficult to control with accuracy,and the annealing processes can attain high temperatures.Pulsed laser deposition leads to high-quality films; however,a method involving the preparation of the ferrite film by acombination of sol-gel and spin-coating seems easier andwith a lower cost [25].
Layered samples of ferrites with piezoelectric oxides canlead to a new generation of magnetic field sensors. The basisof their performance is the capability of converting magneticfields into electrical voltages by a two-step process. First, themagnetic field produces a mechanical strain on the magneticmaterial (due to its magnetostriction); this strain then in-duces a voltage in the piezoelectric layer. These sensors canprovide a high sensitivity, miniature size, and virtually zeropower consumption. Sensors for ac and dc magnetic fields, acand dc electric currents, can be fabricated. Sensors based onnickel ferrite (Ni1−x ZnxFe2O4 with x = 1–0.5)/lead zirco-nate-titanate (PbZr0.52Ti0.48O3) have shown an excellent per-formance [26]. Both ferrite and zirconate-titanate films areprepared by tape casting; typically, 11 ferrite layers were com-bined with 10 piezoelectric layers (both layers 18 μm thick,3 × 6 mm2 area).
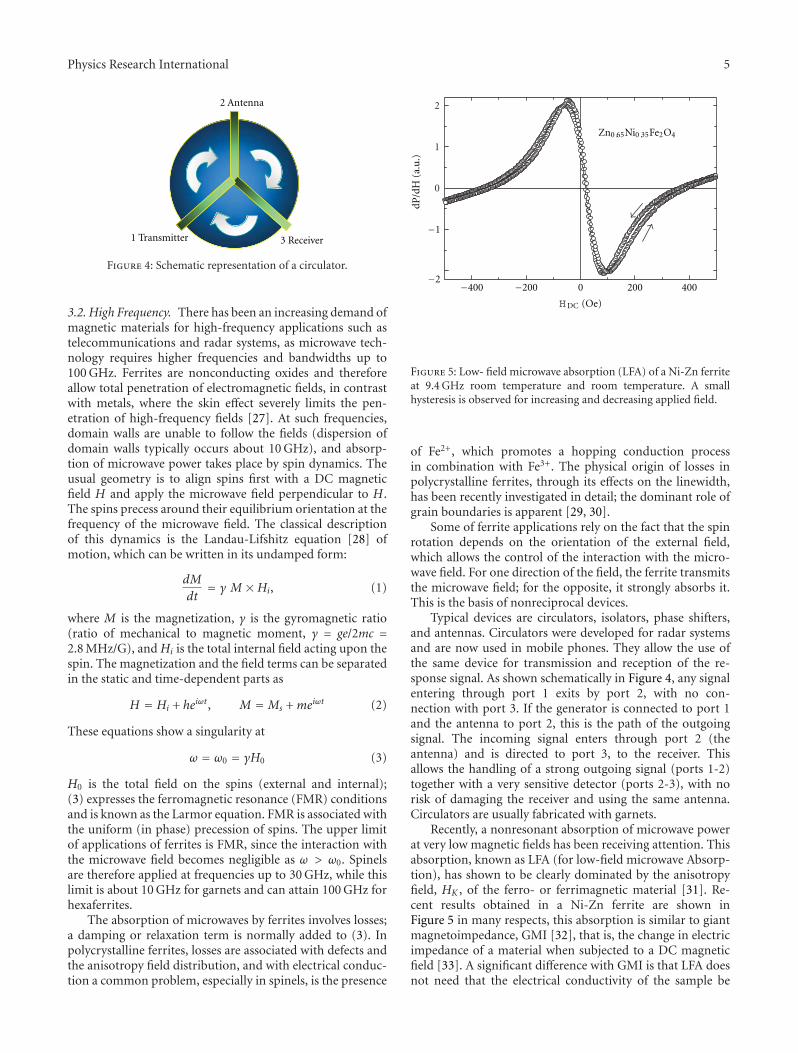
Physics Research International 5
2 Antenna
1 Transmitter 3 Receiver
Figure 4: Schematic representation of a circulator.
3.2. High Frequency. There has been an increasing demand ofmagnetic materials for high-frequency applications such astelecommunications and radar systems, as microwave tech-nology requires higher frequencies and bandwidths up to100 GHz. Ferrites are nonconducting oxides and thereforeallow total penetration of electromagnetic fields, in contrastwith metals, where the skin effect severely limits the pen-etration of high-frequency fields [27]. At such frequencies,domain walls are unable to follow the fields (dispersion ofdomain walls typically occurs about 10 GHz), and absorp-tion of microwave power takes place by spin dynamics. Theusual geometry is to align spins first with a DC magneticfield H and apply the microwave field perpendicular to H .The spins precess around their equilibrium orientation at thefrequency of the microwave field. The classical descriptionof this dynamics is the Landau-Lifshitz equation [28] ofmotion, which can be written in its undamped form:
dM
dt= γ M ×Hi, (1)
where M is the magnetization, γ is the gyromagnetic ratio(ratio of mechanical to magnetic moment, γ = ge/2mc =2.8 MHz/G), and Hi is the total internal field acting upon thespin. The magnetization and the field terms can be separatedin the static and time-dependent parts as
H = Hi + heiωt, M =Ms +meiωt (2)
These equations show a singularity at
ω = ω0 = γH0 (3)
H0 is the total field on the spins (external and internal);(3) expresses the ferromagnetic resonance (FMR) conditionsand is known as the Larmor equation. FMR is associated withthe uniform (in phase) precession of spins. The upper limitof applications of ferrites is FMR, since the interaction withthe microwave field becomes negligible as ω > ω0. Spinelsare therefore applied at frequencies up to 30 GHz, while thislimit is about 10 GHz for garnets and can attain 100 GHz forhexaferrites.
The absorption of microwaves by ferrites involves losses;a damping or relaxation term is normally added to (3). Inpolycrystalline ferrites, losses are associated with defects andthe anisotropy field distribution, and with electrical conduc-tion a common problem, especially in spinels, is the presence
0
1
2
−1
−2 −200−400 0 200 400
dP/d
H (
a.u
.)
Zn0.65Ni0.35Fe2O4
HDC (Oe)
Figure 5: Low- field microwave absorption (LFA) of a Ni-Zn ferriteat 9.4 GHz room temperature and room temperature. A smallhysteresis is observed for increasing and decreasing applied field.
of Fe2+, which promotes a hopping conduction processin combination with Fe3+. The physical origin of losses inpolycrystalline ferrites, through its effects on the linewidth,has been recently investigated in detail; the dominant role ofgrain boundaries is apparent [29, 30].
Some of ferrite applications rely on the fact that the spinrotation depends on the orientation of the external field,which allows the control of the interaction with the micro-wave field. For one direction of the field, the ferrite transmitsthe microwave field; for the opposite, it strongly absorbs it.This is the basis of nonreciprocal devices.
Typical devices are circulators, isolators, phase shifters,and antennas. Circulators were developed for radar systemsand are now used in mobile phones. They allow the use ofthe same device for transmission and reception of the re-sponse signal. As shown schematically in Figure 4, any signalentering through port 1 exits by port 2, with no con-nection with port 3. If the generator is connected to port 1and the antenna to port 2, this is the path of the outgoingsignal. The incoming signal enters through port 2 (theantenna) and is directed to port 3, to the receiver. Thisallows the handling of a strong outgoing signal (ports 1-2)together with a very sensitive detector (ports 2-3), with norisk of damaging the receiver and using the same antenna.Circulators are usually fabricated with garnets.
Recently, a nonresonant absorption of microwave powerat very low magnetic fields has been receiving attention. Thisabsorption, known as LFA (for low-field microwave Absorp-tion), has shown to be clearly dominated by the anisotropyfield, HK , of the ferro- or ferrimagnetic material [31]. Re-cent results obtained in a Ni-Zn ferrite are shown inFigure 5 in many respects, this absorption is similar to giantmagnetoimpedance, GMI [32], that is, the change in electricimpedance of a material when subjected to a DC magneticfield [33]. A significant difference with GMI is that LFA doesnot need that the electrical conductivity of the sample be

6 Physics Research International
of metallic type. No practical applications of LFA have beenproposed, so far; however, it is possible to expect that similarapplications to GMI can be made (sensors for magneticfield, DC electric current, mechanical stress, etc.), with theadditional advantages over classic GMI of high frequenciesand insulator magnetic materials.
3.3. Power. Power applications of ferrites are dominated bythe power supplies for a large variety of devices such as com-puters, all kinds of peripherals, TV and video systems, andall types of small and medium instruments. The main ap-plication is in the systems known as switched-mode powersupplies (SMPSs). In this application, the mains power signalis first rectified it is then switched as regular pulses (typicallyrectangular) at a high frequency to feed into a ferrite tran-sformer, and finally it is rectified again to provide therequired power to the instrument. An increase in power de-livery and efficiency can be obtained by increasing the work-ing frequency of the transformer.
A recent approach to increase efficiency of the ferritecores is based on the decrease of eddy currents, by increasingresistivity. Beside the use of nonconducting additives thatlocate preferentially on grain boundaries (and limit the in-tergrain conductivity), MnZn and NiZn are combined asMnxNi0.5−xZn0.5Fe2O4 and obtained through a citrate pre-cursor method [34].
An additional difficulty appears in the case of power ap-plications at high temperature, as is the case of some auto-motive power devices. Due to the closeness to the car engine,the working temperature increases from the usual 80–100◦Cfor standard applications, to 140◦C. A proposed solution in-volves the modification of the MnZn ferrites (used previ-ously for these applications) in order to produce a higherfraction of Fe2+ [35], such as (Mn0.76Zn0.17Fe2+
0.07)Fe2O4.This ferrous concentration presents a minimum in the ma-gnetocrystalline anisotropy close to 140◦C, and therefore, aminimum in losses appears at this temperature. The changeis obtained through a careful control of the oxidation atmo-sphere during sintering and cooling.
As in all other applications, a strong need for miniatur-ization has also marked the developments in this area in thelast few years. In addition to standard methods to obtain fer-rite thin films (such as sputtering, laser ablation, sol-gel),screen or stencil printed ceramic-polymer composites havebeen investigated [36], combining the remarkable magneticproperties of ferrites with the processability of polymer thickfilms. These polymer thick films can be cured at temperaturesabout 200◦C or less, leaving only the polymer binder and theferrite filler. This technique allows the fabrication of highlyintegrated power circuits. The coil is obtained by patterningcopper on a flexible polyimide substrate; the ferrite-polymercomposite film is then printed above and below the planeof the coil. The magnetic ceramic filler is formed by MnZnferrite particles about 10 μm, obtained by a standard method.The inductance value remains stable up to 124 MHz.
A different method based on a batch-fabrication methodof 3D transformers and inductors has also been proposed[37]. The magnetic core is made of two half magneticpieces and a printed circuit board (or flexi foil) carrying the
electric windings around the core. The 3D ferrite cores aremicrostructured out of a 1 mm thick ferrite wafer using anewly developed batch-type micropowder blasting process[38]. These transformers are well suited for low-powerapplications at working frequencies up to 1 MHz.
Losses in ferrites depend essentially on hysteresis loss atlow frequencies, conductivity (or eddy current) loss, and re-laxation-resonance loss at high frequencies; their modeling iscomplex. A model based on the Preisach theory [39] hasbeen applied to predict the hysteretic behavior of soft ferritesfor applications in power electronics [40], with good resultsat low frequencies. On the other hand, by using a networkmodel based on the total energy loss (not only hysteresisloss), a good agreement with experimental results for power,signal, and electromagnetic interference has been found [41].The approach offers a mechanism for the inclusion of pa-rameters such as temperature or stress variations.
3.4. Electromagnetic Interference (EMI) Suppression. The sig-nificant increase in the amount of electronic equipment suchas high-speed digital interfaces in notebooks and computers,digital cameras, scanners, and so forth, in small areas, hasseriously enhanced the possibility of disturbing each otherby electromagnetic interference (EMI). In particular, the fastdevelopment of wireless communications has led to inter-ference induced by electric and magnetic fields. Electro-magnetic interference can be defined as the degradation inperformance of an electronic system caused by an electro-magnetic disturbance [42]. The noise from electric devices isusually produced at frequencies higher than circuit signals.To avoid, or at least reduce EMI, suppressors should work aslow-pass filters, that is, circuits that block signals with freq-uencies higher than a given frequency value.
There are several approaches to build EMI suppressors:soft ferrites [43], ferromagnetic metals [44], ferromagneticmetal/hexaferrite composites [45], encapsulated magneticparticles [46], and carbon nanotube composites [47].
Ferrite components for EMI suppressors have been usedfor decades. In the recent years, however, there have been spe-cial needs for these materials as a consequence of the mini-aturization trends, increase in integration density, and in-crease in higher clock frequency, especially in communica-tion, computing, and information technologies. Ferrite mul-tilayer components have been developed as a response tothese needs, formed essentially by a highly conductive layerembedded in a ferrite monolithic structure, produced by cer-amic coprocessing technologies. Typically, Ni-Zn ferrites areused for the 20–200 MHz frequency range. Multilayer sup-pressors behave like a frequency-dependent resistor; at lowfrequencies, losses in the ferrite are negligible. As frequencyincreases, losses increase also, and, as ferromagnetic reso-nance is approached, the inductor behaves as a frequency-independent resistor and no longer as an inductor.
Hexaferrites represent an interesting alternative to cubicferrites as EMI suppressor components; they possess higherresonance frequencies, relatively high permeabilities (atmicrowave frequencies), and high electrical resistivities.Metallic ferromagnets, in contrast, show a larger saturation

Physics Research International 7
magnetization, but, as frequency increases, they exhibit astrong decrease in permeability due to eddy currents How-ever, in combination with hexaferrites, they have shown astrong potential for EMI suppressor devices [45]. Co2Zand Zn2Y hexaferrite particles (10–30 μm), mixed with me-tallic Ni particles (2-3 μm), and prepared with a polymer(polyvinylidene fluoride) by hot pressing at low temperatureled to high shield effectiveness.
Carbon nanotube-polystyrene foam composites haveshown a high EMI shielding effectiveness based on a mecha-nism associated with the reflection of electromagnetic radia-tion [48]; no magnetic material is used.
Ferrite nanoparticles in combination with carbon nan-otubes can efficiently absorb microwave radiation. Carbonnanotubes/CoFe2O4 spinel nanocomposite was fabricated bya chemical vapor deposition method using CoFe2O4 nano-particles as catalysts [46]. The microwave absorption (2–18 GHz range) was enhanced. For carbon nanotubes, dielec-tric loss contributes to the energy loss of electromagneticwaves, while, for pure Co ferrite, the effects of microwaveabsorption are associated with magnetic losses, but both iso-lated mechanisms are poor absorbers. For the nanocompos-ites, however, the microwave absorption improves becauseof a better match between the dielectric loss and the mag-netic loss, which originates from the combination of para-magnetic nanotubes and ferromagnetic material. The dis-persed CoFe2O4 nanoparticles absorb the microwave signalsby resonance effects due to shape anisotropy and dipolarinteractions between particles. Such effects are weakened incongregated particles.
3.5. Biosciences. Magnetic materials in the form of nanopar-ticles, mainly magnetite (Fe3O4), are present in various liv-ing organisms [49] and can be used in a number of ap-plications. Magnetic nanoparticles can, of course, be pre-pared in the laboratory by means of the well-known me-thods; however, magnetic biogenic particles have betterproperties than synthetic ones: they have a definite sizerange and width/length ratio and high chemical purity, theyare almost perfect crystallographically, and sometimes theypossess unusual crystallographic morphologies. Extracellularproduction of nanometer magnetite particles by varioustypes of bacteria has been described [50]. In many cases, thebiogenic particles retain a lipid layer which makes them verystable and easily biocompatible.
Many biotechnological applications have been developedbased on biogenic and synthetic magnetic micro- and nano-particles [51]. Magnetic nanoparticles have been used toguide radionuclides to specific tissues. An approach hasbeen developed to directly label a radioisotope with ferriteparticles [52] in in vivo liver tissue in rats. Therapeutic ap-plications are feasible by further conjugation with othermedicals.
In magnetic resonance imaging (MRI), magnetite super-paramagnetic particles are selectively associated with healthyregions of some tissues (liver, for instance); since these pa-rticles change the rate of proton decay from the excited to theground state (which is the basis of MRI), a different, dark-
er contrast is obtained from these healthy regions of tissue[53, 54].
Thermal energy from hysteresis loss of ferrites can beused in hyperthermia, that is, the heating of specific tissuesor organs for treatment of cancer. The temperature in tu-mor tissues rises and becomes more sensitive to radio- orchemotherapy. In addition of magnetite [55], several spinelferrites (M–Zn, with M = Mn, Co, Fe2+, and Fe2+–Mn) areunder investigation [56] as well as hexaferrites [57].
Enzymes, oligonucleotides, antibodies, and other biolog-ically active compounds can be immobilized, as an importanttechnique used in biotechnology. Such immobilized com-pounds can be targeted to a specific place or can be removedfrom the system by using an external magnetic field. Thecom-pounds can exert their activity on the specific place ortissue or can be used as affinity ligands to trap the cells ortarget molecules [58].
Magnetic nanoparticles can also be used in a variety ofapplications: modification, detection, isolation, and study ofcells [59], and isolation of biologically active compounds[60], for instance.
4. Conclusions
Ferrites have been studied and applied for more than 50 yearsand are considered as well-known materials with “mature”technologies ranging from hard magnets to magnetic record-ing and to microwave devices. However, the advances inapplications and fabrication technologies in the last 10 yearshave been impressive. Bulk ferrites remain a key group of ma-gnetic materials, while nanostructured ferrites show a dra-matic promise for applications in even significantly widerfields.
References
[1] R. Valenzuela, Magnetic Ceramics, Cambridge UniversityPress, 2005.
[2] W. H. Bragg, “The structure of the spinel group of crystals,”Philosophical Magazine, vol. 30, no. 176, pp. 305–315, 1915.
[3] Y. Yafet and C. Kittel, “Antiferromagnetic arrangements in fer-rites,” Physical Review, vol. 87, no. 2, pp. 290–294, 1952.
[4] F. Bertaut and F. Forrat, “Structure des ferrites ferrimagne-tiques des terres rares,” Comptes Rendus de l’Academie des Scie-nces, vol. 242, pp. 382–384, 1956.
[5] S. Geller and M. A. Gilleo, “The crystal structure and ferrimag-netism of yttrium-iron garnet, Y3Fe2(FeO4)3,” Journal of Phy-sics and Chemistry of Solids, vol. 3, no. 1-2, pp. 30–36, 1957.
[6] M. A. Gilleo, “Ferromagnetic Insulators: garnets,” in Ferroma-gnetic Materials, E. R. Wohlfarth, Ed., vol. 2, North Holland,The Netherlands, 1980.
[7] G. Wrinkler, “Crystallography, chemistry and technology offerrites,” in Magnetic Properties of Materials, J. Smit, Ed., p. 20,McGraw-Hill, London, UK, 1971.
[8] G. Albanese, M. Carbucicchio, and A. Deriu, “Substitution ofFe3+ by Al3+ in the trigonal sites of M-type hexagonal ferrites,”Il Nuovo Cimento B, vol. 15, no. 2, pp. 147–158, 1973.
[9] M. Abe, Y. Kitamoto, K. Matsumoto, M. Zhang, and P. Li, “Ul-trasound enhanced ferrite plating; bringing breakthroughin ferrite coating synthesized from aqueous solution,” IEEETransactions on Magnetics, vol. 33, no. 5, pp. 3649–3651, 1997.

8 Physics Research International
[10] J. J. Cuomo, R. J. Gambino, J. M. E. Harper, J. D. Kuptsis, andJ. C. Webber, “Significance of negative ion formation in sput-tering and sims analysis,” Journal of Vacuum Science & Tech-nology, vol. 15, no. 2, pp. 281–287, 1978.
[11] D. Dijkkamp, T. Venkatesan, X. D. Wu et al., “Preparation ofY-Ba-Cu oxide superconductor thin films using pulsed las-er evaporation from high Tc bulk material,” Applied PhysicsLetters, vol. 51, no. 8, pp. 619–621, 1987.
[12] D. M. Lind, S. D. Berry, G. Chern, H. Mathias, and L. R. Test-ardi, “Growth and structural characterization of Fe3O4 andNiO thin films and superlattices grown by oxygen-plasma-as-sisted molecular-beam epitaxy,” Physical Review B, vol. 45, no.4, pp. 1838–1850, 1992.
[13] Y. Suzuki, “Epitaxial spinel ferrite thin films,” Annual Reviewof Materials Science, vol. 31, pp. 265–289, 2001.
[14] Y. Suzuki, R. B. Van Dover, E. M. Gyorgy, J. M. Phillips, andR. J. Felder, “Exchange coupling in single-crystalline spinel-structure (Mn,Zn)Fe2O4/CoFe2O4 bilayers,” Physical ReviewB, vol. 53, no. 21, pp. 14016–14019, 1996.
[15] J. M. Yang, W. J. Tsuo, and F. S. Yen, “Preparation of ultrafinenickel ferrite powders using mixed Ni and Fe tartrates,” Journalof Solid State Chemistry, vol. 145, no. 1, pp. 50–57, 1999.
[16] J. Zhou, J. Ma, C. Sun et al., “Low-temperature synthesis ofNiFe2O4 by a hydrothermal method,” Journal of the AmericanCeramic Society, vol. 88, no. 12, pp. 3535–3537, 2005.
[17] K. V. P. M. Shafi, Y. Koltypin, A. Gedanken et al., “Sonochemi-cal preparation of nanosized amorphous NiFe2O4 particles,”Journal of Physical Chemistry B, vol. 101, no. 33, pp. 6409–6414, 1997.
[18] S. Prasad and N. S. Gajbhiye, “Magnetic studies of nanosizednickel ferrite particles synthesized by the citrate precursortechnique,” Journal of Alloys and Compounds, vol. 265, no. 1-2,pp. 87–92, 1998.
[19] D. -H. Chen and X. -R. He, “Synthesis of nickel ferrite nano-particles by sol-gel method,” Materials Research Bulletin, vol.36, no. 7-8, pp. 1369–1377, 2001.
[20] Y. Shi, J. Ding, X. Liu, and J. Wang, “NiFe2O4 ultrafine particlesprepared by co-precipitation/mechanical alloying,” Journal ofMagnetism and Magnetic Materials, vol. 205, no. 2, pp. 249–254, 1999.
[21] J. Liu, H. He, X. Jin, Z. Hao, and Z. Hu, “Synthesis of nanosizednickel ferrites by shock waves and their magnetic properties,”Materials Research Bulletin, vol. 36, no. 13-14, pp. 2357–2363,2001.
[22] A. Kale, S. Gubbala, and R. D. K. Misra, “Magnetic behavior ofnanocrystalline nickel ferrite synthesized by the reverse micelletechnique,” Journal of Magnetism and Magnetic Materials, vol.277, no. 3, pp. 350–358, 2004.
[23] Z. Beji, T. Ben Chaabane, L. S. Smiri et al., “Synthesis of nickel-zinc ferrite nanoparticles in polyol: morphological, structuraland magnetic studies,” Physica Status Solidi A, vol. 203, no. 3,pp. 504–512, 2006.
[24] S. Maensiri, C. Masingboon, B. Boonchom, and S. Seraphin,“A simple route to synthesize nickel ferrite (NiFe2O4) nano-particles using egg white,” Scripta Materialia, vol. 56, no. 9,pp. 797–800, 2007.
[25] C. Yang, F. Liu, T. Ren et al., “Fully integrated ferrite-based in-ductors for RF ICs,” Sensors and Actuators A, vol. 130-131, pp.365–370, 2006.
[26] Y. K. Fetisov, A. A. Bush, K. E. Kamentsev, A. Y. Ostashchenko,and G. Srinivasan, “Ferrite-piezoelectric multilayers for mag-netic field sensors,” IEEE Sensors Journal, vol. 6, no. 4, ArticleID 1661574, pp. 935–938, 2006.
[27] M. Pardavi-Horvath, “Microwave applications of soft ferrites,”Journal of Magnetism and Magnetic Materials, vol. 215, pp.171–183, 2000.
[28] L. D. Landau and E. Lifshitz, “On the theory of the dispersionof magnetic permeability in ferromagnetic bodies,” Physik Z.Sowjetunion, vol. 8, pp. 153–169, 1935.
[29] N. Mo, Y. Y. Song, and C. E. Patton, “High-field microwaveeffective linewidth in polycrystalline ferrites: physical originsand intrinsic limits,” Journal of Applied Physics, vol. 97, no. 9,Article ID 093901, pp. 1–9, 2005.
[30] N. Mo, J. J. Green, P. Krivosik, and C. E. Patton, “The lowfield microwave effective linewidth in polycrystalline ferrites,”Journal of Applied Physics, vol. 101, no. 2, Article ID 023914,2007.
[31] R. Valenzuela, R. Zamorano, G. Alvarez, M. P. Gutierrez, andH. Montiel, “Magnetoimpedance, ferromagnetic resonance,and low field microwave absorption in amorphous ferromag-nets,” Journal of Non-Crystalline Solids, vol. 353, no. 8–10, pp.768–772, 2007.
[32] H. Montiel, G. Alvarez, I. Betancourt, R. Zamorano, and R.Valenzuela, “Correlations between low-field microwave ab-sorption and magnetoimpedance in Co-based amorphous rib-bons,” Applied Physics Letters, vol. 86, no. 7, Article ID 072503,pp. 1–3, 2005.
[33] M. Knobel, M. Vazquez, and L. Kraus, “Giant Matgneto-impedance,” in Handbook of Magnetic Materials, K. H. J. Busc-how, Ed., vol. 15, p. 497, Elsevier Science, 2003.
[34] A. Verma, M. I. Alam, R. Chatterjee, T. C. Goel, and R. G. Men-diratta, “Development of a new soft ferrite core for power ap-plications,” Journal of Magnetism and Magnetic Materials, vol.300, no. 2, pp. 500–505, 2006.
[35] V. Zaspalis, V. Tsakaloudi, E. Papazoglou, M. Kolenbrander, R.Guenther, and P. V. D. Valk, “Development of a new MnZn-ferrite soft magnetic material for high temperature power ap-plications,” Journal of Electroceramics, vol. 13, no. 1–3, pp.585–591, 2004.
[36] E. J. Brandon, E. E. Wesseling, V. Chang, and W. B. Kuhn,“Printed microinductors on flexible substrates for power ap-plications,” IEEE Transactions on Components and PackagingTechnologies, vol. 26, no. 3, pp. 517–523, 2003.
[37] F. Amalou, E. L. Bornand, and M. A. M. Gijs, “Batch-typemillimeter-size transformers for miniaturized power applica-tions,” IEEE Transactions on Magnetics, vol. 37, no. 4, pp. 2999–3003, 2001.
[38] E. Belloy, S. Thurre, E. Walckiers, A. Sayah, and M. A. M. Gijs,“Introduction of powder blasting for sensor and microsystemapplications,” Sensors and Actuators. A, vol. 84, no. 3, pp. 330–337, 2000.
[39] F. Preisach, “Uber die magnetische Nachwirkung,” Zeitschriftfur Physik, vol. 94, no. 5-6, pp. 277–302, 1935.
[40] M. Angeli, E. Cardelli, and E. Della Torre, “Modelling of ma-gnetic cores for power electronics applications,” Physica B, vol.275, no. 1–3, pp. 154–158, 2000.
[41] P. R. Wilson, J. N. Ross, and A. D. Brown, “Modeling freq-uency-dependent losses in ferrite cores,” IEEE Transactions onMagnetics, vol. 40, no. 3, pp. 1537–1541, 2004.
[42] G. Stojanovic, M. Damnjanovic, V. Desnica et al., “High-per-formance zig-zag and meander inductors embedded in ferritematerial,” Journal of Magnetism and Magnetic Materials, vol.297, no. 2, pp. 76–83, 2006.
[43] Z. W. Li, L. Guoqing, L. Chen, W. Yuping, and C. K. Ong,“Co2+Ti4+ substituted Z-type barium ferrite with enhancedimaginary permeability and resonance frequency,” Journal ofApplied Physics, vol. 99, no. 6, Article ID 063905, 2006.

Physics Research International 9
[44] Y. B. Feng, T. Qiu, C. Y. Shen, and X. -Y. Li, “Electromagneticand absorption properties of carbonyl iron/rubber radar ab-sorbing materials,” IEEE Transactions on Magnetics, vol. 42, no.3, pp. 363–368, 2006.
[45] B. W. Li, Y. Shen, Z.-X. Yue, and C.-W. Nan, “Enhanced mi-crowave absorption in nickel/hexagonal-ferrite/polymer com-posites,” Applied Physics Letters, vol. 89, no. 13, Article ID132504, 2006.
[46] R. C. Che, C. Y. Zhi, C. Y. Liang, and X. G. Zhou, “Fabricationand microwave absorption of carbon nanotubes CoFe2O4 spi-nel nanocomposite,” Applied Physics Letters, vol. 88, no. 3,Article ID 033105, pp. 1–3, 2006.
[47] C. Xiang, Y. Pan, X. Liu, X. Sun, X. Shi, and J. Guo, “Micro-wave attenuation of multiwalled carbon nanotube-fused silicacomposites,” Applied Physics Letters, vol. 87, no. 12, Article ID123103, pp. 1–3, 2005.
[48] Y. Yang, M. C. Gupta, K. L. Dudley, and R. W. Lawrence,“Novel carbon nanotube—Polystyrene foam composites forelectromagnetic interference shielding,” Nano Letters, vol. 5,no. 11, pp. 2131–2134, 2005.
[49] H. A. Lowenstam, “Magnetite in denticle capping in recentchitons (Polyplacophora),” Bulletin Geological Society of Amer-ica, vol. 73, no. 4, pp. 435–438, 1962.
[50] C. Zhang, H. Vali, C. S. Romaner, T. J. Phelps, and S. V. Liu,“Formation of single-domain magnetite by a thermophilicbacterium,” American Mineralogist, vol. 83, no. 11-12, pp.1409–1418, 1998.
[51] I. Safarık and M. Safarıkova, “Magnetic nanoparticles andbiosciences,” Monatshefte fur Chemie, vol. 133, no. 6, pp. 737–759, 2002.
[52] C. M. Fu, Y. F. Wang, Y. F. Guo, T. Y. Lin, and J. S. Chiu, “In vivobio-distribution of intravenously injected Tc-99 m labeledferrite nanoparticles bounded with biocompatible medicals,”IEEE Transactions on Magnetics, vol. 41, no. 10, pp. 4120–4122,2005.
[53] C. R. Martin and D. T. Mitchell, “Nanomaterials in analyticalchemistry,” Analytical Chemistry, vol. 70, no. 9, pp. 322A–327A, 1998.
[54] T. C. Yeh, W. Zhang, S. T. Ildstad, and C. Ho, “In vivo dynamicMRI tracking of rat T-cells labeled with superparamagneticiron-oxide particles,” Magnetic Resonance in Medicine, vol. 33,no. 2, pp. 200–208, 1995.
[55] A. Jordan, R. Scholz, K. Maier-Hauff et al., “Presentation of anew magnetic field therapy system for the treatment of humansolid tumors with magnetic fluid hyperthermia,” Journal ofMagnetism and Magnetic Materials, vol. 225, no. 1-2, pp. 118–126, 2001.
[56] J. Giri, P. Pradhan, T. Sriharsha, and D. Bahadur, “Preparationand investigation of potentiality of different soft ferrites forhyperthermia applications,” Journal of Applied Physics, vol. 97,no. 10, Article ID 10Q916, pp. 1–3, 2005.
[57] D. H. Kim, S. H. Lee, K. N. Kim, K. M. Kim, I. B. Shim, andY. K. Lee, “Temperature change of various ferrite particles withalternating magnetic field for hyperthermic application,” Jour-nal of Magnetism and Magnetic Materials, vol. 293, no. 1, pp.320–327, 2005.
[58] T. Matsunaga and S. Kamiya, “Use of magnetic particles iso-lated from magnetotactic bacteria for enzyme immobiliza-tion,” Applied Microbiology and Biotechnology, vol. 26, no. 4,pp. 328–332, 1987.
[59] I. Safarık and M. Safarıkova, “Use of magnetic techniques forthe isolation of cells,” Journal of Chromatography B, vol. 722,no. 1-2, pp. 33–53, 1999.
[60] K. Sode, S. Kudo, T. Sakaguchi, N. Nakamura, and T. Mat-sunaga, “Application of bacterial magnetic particles for highlyselective mRNA recovery system,” Biotechnology Techniques,vol. 7, no. 9, pp. 688–694, 1993.

Hindawi Publishing CorporationPhysics Research InternationalVolume 2012, Article ID 730812, 4 pagesdoi:10.1155/2012/730812
Research Article
Investigation of Multicritical Phenomena in ANNNI Modelby Monte Carlo Methods
A. K. Murtazaev1, 2 and J. G. Ibaev1
1 Institute of Physics, Daghestan Scientific Center of RAS, Yaragskogo Street 94, Makhachkala 367003, Russia2 Daghestan State University, Gadzhieva Street 43a, Makhachkala 367025, Russia
Correspondence should be addressed to J. G. Ibaev, [email protected]
Received 20 July 2011; Accepted 16 December 2011
Academic Editor: Vladimir Shavrov
Copyright © 2012 A. K. Murtazaev and J. G. Ibaev. This is an open access article distributed under the Creative CommonsAttribution License, which permits unrestricted use, distribution, and reproduction in any medium, provided the original work isproperly cited.
The anisotropic Ising model with competing interactions is investigated in wide temperature range and |J1/J| parameters by meansof Monte Carlo methods. Static critical exponents of the magnetization, susceptibility, heat capacity, and correlation radius arecalculated in the neighborhood of Lifshitz point. According to obtained results, a phase diagram is plotted, the coordinates ofLifshitz point are defined, and a character of multicritical behavior of the system is detected.
1. Introduction
Apart from problems of critical phenomena, more complexphenomena observed near the diagram special points ofsystem states, where the lines of different order phase tran-sitions cross, are heavily emphasized [1]. These phenomena,conditionally named “multicritical,” are possible in thosesystems, where a symmetry and interparticle interactionassumes several types of ordering. Similar phenomenaare observed in a mixture of gases, liquids, ferroelectrics,magnetics, and so forth.
An experimental investigation of the multicritical phe-nomena is more complex than theoretical. This complexityhas to do with the fact that in the neighborhood of mul-ticritical point, a region with different strongly developedfluctuations broadens, and the crossovers are probable [2].
A theoretical study of multicritical phenomena resultsin complex nonlinear differential equations. Exact analyticalsolution of these equations also entails great difficulties [3].In this connection the methods of computational physics(Monte Carlo method (MC)) and molecular dynamics(MD) became basic techniques to study those equations atpresent. In practice, for description of such complex systems,different models are used. The simplest and effective oneamong them is anisotropic Ising model with competinginteractions with second nearest neighbors (ANNNI model,
Figure 1). We plot a phase diagram for this model and studya character of the critical behavior in Lifshitz point using thestandard method of Monte Carlo.
2. Model
ANNNI model appeared in the static physics in the secondhalf of XX century for explanation of the spiral magneticorder in heavy rear-earth metals [4]. Its Hamiltonian inperfect cubic lattice has the following form:
HANNNI = −J∑i, j
sis j + J1∑i
sisi+1, (1)
where si = ±1, J denotes the parameter of exchangeinteraction of neighboring spin pairs, and J1 > 0 isthe parameter of antiferromagnetic exchange of neighborsfollowing the nearest neighbor along Z axis.
A topology of T − |J1/J| phase diagram includes threeregions for three-dimensional case (3D), which are crossingin multicritical Lifshitz point [5]. The system is paramagneticat high temperatures and is ferromagnetic at low T and small|J1/J|; when |J1/J| has sufficiently large values, the modulatedphases are generated (Figure 2).
According to the literature data when temperaturedecreasing ANNNI model undergoes the second-order phase

2 Physics Research International
J1
J
J
J
Figure 1: Anisotropic model with competing interactions.
0.1 0.2 0.3 0.4 0.5 0.6 0.7 0.8 0.9 12.6
2.8
3
3.2
3.4
3.6
3.8
4
4.2
4.4
LP
P
F
9/64
3/32
5/32
11/643/16
13/64 7/32
15/64
1/4AF
|J1/J|
k BT/|J|
Figure 2: Phase diagram of anisotropic Ising model with competinginteractions (by the data of [6]).
transition from paramagnetic state to the nearest orderedstate, and a transition “ferromagnetic-modulated state” is thefirst-order transition [7].
For description of a phase behavior of studied model, weused approximated theoretical methods including high- andlow-temperature expansions [8], the mean-field theory [9],and other theoretical approximations [10].
The Monte Carlo modeling [11] mainly was carried outin a region of “ferromagnetic-paramagnetic” transition upto the Lifshitz point [12], but a precise determination of thetransition in the point and its nearest neighborhood remainsunsolved.
According t data in [6, 12], a critical behavior of thesystems with modulated structures at small values of |J1/J|is described by the Ising universality class of the criticalbehavior. When increasing |J1/J| a crossover to the criticalbehavior typical for the Lifshitz point occurs and from it toXY-critical behavior.
3. Method of Investigation
The cubic systems with periodic boundary conditions andsizes L × L × L, L = 12 ÷ 64 were used for investigationof multicritical phenomena in the vicinity of the Lifshitzpoint. Spin number in studied systems was Neff = 512 ÷262144. Markov chains of τ = 1000τ0 length (τ0 = 104
MC-step/spin is a length of nonequilibrium part) weregenerated on the computer. The thermodynamic parametersof the system were calculated by averaging along this chain.Moreover, the averaging was carried out by 1000 differentinitial configurations. An error of obtained results does notexceed the sizes of symbols used in Figures.
The temperature dependences of the heat capacity andsusceptibility were derived by means of expressions [9]
C =(NK2
)(⟨U2⟩− 〈U〉2
),
χ = (NK)(⟨m2⟩− 〈m〉2
),
(2)
where K = |J|/kBT ; U denotes the intrinsic energy; m in-dicates the magnetization.
The critical temperature was estimated by the Bindercumulant method. According to the finite-size scaling theory(FSS) [13], the cumulants
UL = 1−⟨m4
⟩3〈m2〉2 , (3)
for systems with different sizes L, cross in a critical point Tc.Plotting the UL temperature dependences for systems withdifferent sizes L, one can estimate the critical temperaturesof systems. Critical temperatures values calculated by thismethod for different values of |J1/J| are presented in Table 1.
The critical parameters of the magnetization, susceptibil-ity, and correlation radius were estimated from a ratio of FSStheory [14].
For calculation of the magnetic properties of modulatedregion, we used a value
MZ = 1L2
L∑x,y
Sx,y,z, (4)
being the averaged magnetization of the layer, which isperpendicular to Z axis.
The values of a wave number and a character ofamplitude and phase modulation were detected by means ofmathematical apparatus of the spectral analysis based on theFourier transformations [15].
4. Results and Discussion
Using Fourier transformations, we succeeded, with suffi-ciently high accuracy, to calculate the existence domains ofmodulated phases with different values of the wave lengthand estimate a stability of the modulated phases. If ontheir Fourier transforms, there are observed clearly definedpeaks at a value of k, one can consider with confidencethat the structure is stable in the given temperature rangeand ratio of interaction constants. The appearance of side

Physics Research International 3
Table 1: Critical parameters of the ANNNI model.
|J1/J| Tc α/ν β/ν γ/ν 1/ν α β γ ν
0,271 3,736(1) 0,352 0,431 2,499 1,799 0,196(4) 0,240(4) 1,389(6) 0,556(6)
0,272 3,732 0,379 0,429 2,719 1,903 0,199 0,225 1,427 0,525
0,273 3,728 0,420 0,422 2,880 2,055 0,203 0,206 1,403 0,487
0,274 3,724 0,460 0,421 3,053 2,183 0,211 0,193 1,398 0,458
0,275 3,726 0,449 0,422 3,002 2,125 0,211 0,199 1,414 0,471
0,276 3,727 0,461 0,422 3,117 2,225 0,207 0,189 1,400 0,449
Ising 4,511 0,113 0,3258 1,239 0,63
8 16 32 640.125
0.25
0.5
L
m
Figure 3: Log-log scale dependence of the magnetization.
peaks above and below the main maximum on the Fouriertransformations indicates that the system is in a regionof transition from one modulated structure to another. Atransition of the system from a modulated phase into theparamagnetic phase can be detected by a sharp increase ofpeaks on the Fourier transformations, what confirms thecontinuity of its spectrum.
Generalizing the obtained results, we plotted a |J1/J|,kBT/|J| phase diagram (Figure 2). The second-order phasetransition dependences were calculated by the Binder cumu-lants method, and lines of transitions in the modulatedregion were derived by the results of Fourier analysis.A temperature in which uneven change in wave numberof modulated structures occurs was taken as a transitiontemperature.
As it is evident from plotted phase diagram, the multicrit-ical Lifshitz point is revealed in the intervals 0, 27 < |J1/J| <0, 28 and 3, 74 < T < 3, 72. Therefore, all experimental dataof the critical parameters presented in the work belong to thegiven range of parameter change of |J1/J| and T .
To determine the critical exponents, we plotted the log-log scale curves for the dependences of thermodynamicparameters on system linear sizes at T = Tc. Figures 3 and 4present the characteristic dependences of magnetization andparameters ofVi at i = 1, 2, 3 on linear sizes at |J1/J| = 0, 273.As it is clear from Figures, all points on curves lie down astraight line within an error. The inclination of line detects
16 32 64
4
16
64
256
1024
L
i= 1i= 2i= 3
Vi
Figure 4: Log-log scale dependence of Vi on the system linear sizes.
the values of β/ν in Figure 3 and of 1/ν in Figure 4. By thesame dependences the values of α/ν and γ/ν were defined.The obtained values of the critical exponents are shown inTable 1.
According to data in the Table 1, a character of change ofcritical parameters up to |J1/J| < 0, 274 is the same as in work[6]. Such a behavior is connected with the crossover from thecritical behavior to the multicritical and inversely. Obviously,behavior of critical parameters at |J1/J| > 0, 274 is due tothe fact that our system starts to aberrate from multicriticalbehavior, and, consequently, the Lifshitz point is localized inrange of |J1/J| = 0, 274 and T = 3, 724.
It should be observed that, in this work, unlike previouswork [6], the critical exponents of correlation radius areestimated. A change of ν values with increase in |J1/J|,probably, has to do with the region that with stronglydeveloped fluctuations widens at approximation to themulticritical point.
In conclusion, let us note that a critical behavior ofmajority of crystals in the vicinity of phase transitions differsfrom being predicted for corresponding universality classes.A reason for such behavior is various anisotropic and com-petitive interactions existing in real systems. A considerationof all possible kinds of anisotropy and interactions can

4 Physics Research International
lead to the multicritical phenomena, which appear on thephase diagrams as intersection point of phase transitionscurves (a typical example—the Lifshitz point). Therefore,the investigation of similar phenomena is also importantcondition for studying the critical phenomena. A design ofnew methods of investigation and algorithms of modeling forestimation of multicritical phenomena can favour the studynot only of the Lifshitz point neighborhoods but amplify theapplication of Monte Carlo methods for research of morecomplex systems.
Acknowledgment
Support by RFBR (no. 09-02-96506), and PHCP (no. Π554and no. 02.740.11.03.97) is acknowledged.
References
[1] P. A. Fleury, “Phase transitions, critical phenomena, and in-stabilities,” Science, vol. 211, no. 4478, pp. 125–131, 1981.
[2] M. A. Anisimov, E. E. Gorodetskii, and V. M. Zaprudskii,“Phase transitions with coupled order parameters,” Sovietphysics, Uspekhi, vol. 24, pp. 57–75, 1981.
[3] Yu. A. Izumov and V. M. Siromyatnikov, Phase Transitions andCrystal Symmetry, Springer, 1984.
[4] W. Selke, “The ANNNI model—theoretical analysis and ex-perimental application,” Physics Reports, vol. 170, no. 4, pp.213–264, 1988.
[5] R. M. Hornreich, M. Luban, and S. Shtrikman, “Critical be-havior at the onset of k→ -space instability on the λ line,”Physical Review Letters, vol. 35, no. 25, pp. 1678–1681, 1975.
[6] A. K. Murtazaev and Z. G. Ibaev, “Critical properties of theanisotropic ising model with competing interactions,” Journalof Experimental and Theoretical Physics, vol. 113, no. 1, pp.106–112, 2011.
[7] A. Gendiar and T. Nishino, “Phase diagram of the three-dimensional axial next-nearest-neighbor Ising model,” Phys-ical Review B, vol. 71, no. 2, Article ID 024404, 7 pages, 2005.
[8] S. Redner and H. E. Stanley, “Helical order and its onset at theLifshitz point,” Physical Review B, vol. 16, no. 11, pp. 4901–4906, 1977.
[9] P. Peczak, A. M. Ferrenberg, and D. P. Landau, “High-accuracy Monte Carlo study of the three-dimensional classicalHeisenberg ferromagnet,” Physical Review B, vol. 43, no. 7, pp.6087–6093, 1991.
[10] P. Bak and J. Von Boehm, “Ising model with solitons, phasons,and ‘the devil’s staircase’,” Physical Review B, vol. 21, no. 11,pp. 5297–5308, 1980.
[11] K. Kaski and W. Selke, “Monte Carlo coarse graining for thethree-dimensional axial next-nearest-neighbor Ising model,”Physical Review B, vol. 31, no. 5, pp. 3128–3130, 1985.
[12] M. Pleimling and M. Henkel, “Anisotropic scaling and gener-alized conformal invariance at Lifshitz points,” Physical ReviewLetters, vol. 87, no. 12, Article ID 125702, 4 pages, 2001.
[13] K. Binder, “Critical properties from Monte Carlo Coarsegraining and renormalization,” Physical Review Letters, vol. 47,no. 9, pp. 693–696, 1981.
[14] A. K. Murtazaev, I. K. Kamilov, and K. K. Aliev, “Finite-sizescaling and critical exponents of the real antiferromagneticmodel,” Journal of Magnetism and Magnetic Materials, vol. 204,no. 1, pp. 151–158, 1999.
[15] R. J. Elliott, “Phenomenological discussion of magnetic order-ing in the heavy rare-earth metals,” Physical Review, vol. 124,no. 2, pp. 346–353, 1961.
Hindawi Publishing CorporationPhysics Research InternationalVolume 2012, Article ID 232864, 13 pagesdoi:10.1155/2012/232864
Review Article
Softening the “Crystal Scaffold” for Life’s Emergence
Gargi Mitra-Delmotte1 and Asoke Nath Mitra2
1 39 Cite de l’Ocean, Montgaillard, 97400 St. Denis, Reunion2 Department of Physics, Delhi University, 244 Tagore Park, Delhi 110009, India
Correspondence should be addressed to Gargi Mitra-Delmotte, [email protected] Asoke Nath Mitra, [email protected]
Received 1 August 2011; Accepted 13 November 2011
Academic Editor: Manh-Huong Phan
Copyright © 2012 G. Mitra-Delmotte and A. N. Mitra. This is an open access article distributed under the Creative CommonsAttribution License, which permits unrestricted use, distribution, and reproduction in any medium, provided the original work isproperly cited.
Del Giudice’s group studies how water can organize on hydrophilic surfaces forming coherent domains (loaning energy from thequantum vacuum), plus quasifree electrons, whose excitations produce cold vortices, aligning to ambient fields. Their electricand magnetic dipolar modes can couple to oscillatory (electric-organic dipoles) and/or rotary (magnetic-mineral dipoles), besidesresponding to magnetic potentials. Thus, imprinted electromagnetic patterns of catalytic colloids—compared with Cairns-Smith’s“crystal scaffold”—on their structured water partners could have equipped the latter with a selection basis for “choosing”their context-based “soft-matter” (de Gennes) replacements. We consider the potential of the scenario of an external controlon magnetic colloids forming in the Hadean hydrothermal setting (of Russell and coworkers)—via a magnetic rock field—conceptually enabling self-assembly, induction of asymmetries, response effects towards close-to-equilibrium dynamics, andassociative networks, besides providing a coherent environment for stabilizing associated symmetry-broken quanta and theirfeedback interactions with those of coherent water domains, to address the emergence of metabolism and replication.
1. Introduction
1.1. Revisiting Cairns-Smith’s “Arch” Metaphor for Soft LivingSystems. Life’s efficient use of the colloid-gel state, combin-ing the best from the structured world of solids with thesoftness and fluidity of the liquid state, strongly supports itsorigins in such a setting [1–4]. Again as the cell’s syntheticmachinery reveals a hierarchy of organic compounds ofprogressively increasing complexity, approaches to the emer-gence of life have traditionally centered on organic-basedassemblies. These approaches can broadly be distinguishedin terms of the targeted location on the machinery: thecore comprising simpler organics woven in cycles of smallmetabolic reactions, or the periphery, consisting of organicswith specialized functions. Typically, theories proposing thatthe metabolic wing of life had preceded the replicating onefocus on the simpler core reactions that could have beenhosted on assemblies of either organics [5] or colloidalinorganic compounds [6], as running the simple (core)cycles in the reverse (reductive) mode can shed light on theplausible links between the transfer of electrons from higher
to lower states of energy and the emergence of life in theHadean conditions of disequilibrium [7–9]. “Replicators” in“metabolism-first” approaches are thought to have graduallyemerged as feedback type correlations emerged betweennetworks, eventually leading to the code [10, 11]. Thesescenarios are based on the sound premise that the efficientcapture of energy, released from the primordial reactionnetworks, would have awaited the emergence of order in thehosting surfaces [12]. Still, plausible stages as to how thiscame about and enabled the quantitative reproduction ofinformation do need to be chartered. At the other extreme,theories proposing that the replicating wing appeared firstfocus on the complex organics on the periphery of thereaction nets. Although their principle of targeting thefunction is a sound one, these proposals face a dilemma onaccount of the assumed association of these functions withcomplex organic structures (whose synthesis they attempt)as their peripheral location indicates that they must havearisen later. And even if it were possible to accomplish theHerculean task of construing a suitable geochemical settingin the Hadean that could be argued to meet the requirements

2 Physics Research International
for producing ample amounts of the complex buildingblocks, directly from very basic organic units, the conceptualbridge as to how the complex biomolecules associated withbiofunctions came to be formed from the simpler organicsin the core would remain unaddressed. By uncoupling theorganic structure-function association, Cairns-Smith [13]proposes the analogy to the “arch” metaphor as a way outof this impasse, suggesting that in the Hadean, availablenonorganic predecessors that could have accomplished thesefunctions may have started the cycle and thus offereda functional basis of selection for takeover by the bio-organics. His novel theory posits that clay minerals were thefirst self-replicating living forms where genetic informationwas encoded in patterns like random sequences of stackedmineral layers (instead of nucleotide bases), crystal growthdefects, aperiodic distributions of ions, and so forth. Itsmain hurdle is that the rigid framework of hard crystals isseen as conceptually incompatible with evolving dissipativedynamical structures.
Nevertheless, the intuitive argument of a “readily avail-able” mineral scaffold [13] could be expanded in the sense ofa lowest common denominator (LCD) template having thebasic functional attributes of living systems in their simplestform, where a synthesis of mineral-based approaches couldexplain how energy (associated with metabolism) and infor-mation (associated with replication) became synonymous incomplex biomatter [14]. For instance, although crystallineorder is typically associated with rigid geometrical patterns,we need to study the carriers of its information, to lookfor an aspect of its ordering that could be compatible withmotion, towards the dynamical interception of energy bycatalytic colloidal surfaces. It is therefore pertinent to look atthe correspondence between the “global motions” of enzymecomponents and the collective vibrations of the crystal lattice[15]. Also, the capacity to capture the released energy andstretch its residence time and prevent its fast dissipationto the sink is difficult to imagine in terms of far-from-equilibrium examples, such as turbulent flows that have noobvious coherent connection between the microscopic andmacroscopic flows. Now, a coherent-ordering mechanismassociated with an inorganic colloidal scaffold could havecompatibility with both requirements, and this extendedsoft template (c.f. [13]), with an essential role for structuredwater as a fountainhead for life, forms our premise. Formeeting this demand, we need a mechanism providing long-range correlations as in condensed matter physics (CMP)via association of ordered structures with the colloidal-gelstate.
1.2. QFT/QED: A Basis for Correlated Components andInteraction Space. A glimpse of a kind of stable yet dynamicorder in an open system that could have enabled suchinterception can be from the many-body model proposedby Umezawa et al. [16, 17] which states [18] that “inany material in CMP any particular information is carriedby certain ordered patterns maintained by certain longrange correlations mediated by massless quanta. It lookedto me (Umezawa) that this is the only way to memorize
some information; memory is a particular pattern of ordersupported by long range correlations.” Indeed, Frohlich’s[19] landmark proposal suggests how a continuous supplyof energy should lead to the establishment of coherentorder over macroscopic distances via long-range phasecorrelations between molecules. Upon pumping, excitationsof the densely packed particles with electric and elasticinteractions are expected to lead to vibrations building upinto collective modes of photons, phonons, and so forth thisgenerates a coherent dipolar wave motion which exchangesenergy with the surrounding electromagnetic field. And,being coherent, this energy gets stored in an ordered manner(not thermalized). Importantly, the electromagnetic fieldcoupled to the dipolar biomolecules plays a key role inmediating their coupled interactions.
Now, this picture of correlated components connectedvia an environmental (electromagnetic) field obviouslycalls for a paradigm shift from the conventional pictureof independent system parts that could be isolated fromeach other, and also the environment to keep thermaleffects at bay. Traditionally complex biosystems are dealtwith either thermodynamic or causal-dynamical approaches.Now, while holistic approaches like the former miss outon microscopic details in their search for global princi-ples, reductionist ones like the latter lose sight of holisticfeatures like coherence. Furthermore, features like coher-ence demand a knowledge of the underlying manifoldsof the interactions, that is, the structure of the space inwhich the components are interacting. Although causal-dynamical approaches can provide such a description, toomuch “reductionism” associated with them interferes witha holistic formulation; in contrast, thermodynamics is waytoo macroscopic for adequate descriptions of underlyinginteracting fields. In this context, quantum electrodynamics(QED)—the acknowledged “Queen” of all quantum fieldtheories (QFTs)—has a natural in-built holistic featurewithout losing out on causality which is needed to addresshierarchical description all the way from microscopic tomacroscopic domains [20] (For a flavour of this vast subject,the reader is referred to a tutorial [21] elsewhere). As notedby the Del Giudice group, the field environment, crucial forthe dynamics of the correlated particles, finds a powerfulrepresentation in the QFT language of “vacuum” (originallyformulated for empty space). Now, while a modern formof QFT predicts the existence of infinitely many minima(degenerate vacuum), the former nevertheless owes its originto its simplest form, namely the so-called unique vacuum—the single state of lowest energy. The time evolution ofthese degenerate vacua on the other hand follows a morecomplex pattern of symmetry principles than the onefollowed by system components in empty space (governedby Euler-Lagrangian equation). And different patterns oftime evolution of the vacua, characterized by breakingof conventional symmetries—especially time reversal—ascompared to that of the system components in empty space,allow for a description of the evolution of the system acrossits vacua in an irreversible (biolike) fashion [22–24]. In thisscenario, the “phase transitions” of the system are seen astypical QED symmetry-breaking effects corresponding to the

Physics Research International 3
different vacua that are imprinted on the dynamics of itscomponents [25].
Del Giudice and Tedeschi [26] further argue that thearchetypal framework of a crowded chemical reactor ofrandomly colliding independent molecules (range of fewangstroms only) cannot explain how, despite crowding,living matter components detect each other from afar andinteract via long sequences of biochemical reactions, withsharply defined space-time order. Also, in a chemical reactor,released energy gets dissipated as heat, that is, increasedkinetic energy of randomly moving molecules, leading toincrease in entropy and wild temperature fluctuations. Incontrast, in living matter, where energy gets stored forcarrying out different functions, its supply seems to fit inwith a wave-like QED scenario (see Section 2) of a movingelectromagnetic field whose frequency depends on the coher-ence strength of the medium and therefore can attract “cores-onating” molecules. In this way, as energy gets capturedin a coherent medium, its coherent domain expands (byadding more and more field-coupled molecules), while freshelectromagnetic oscillations are added to the existing ones;thus, by mutual feedback, the process multiplies rapidly. Thisscenario ensures growth and order at very low entropy [27]at almost constant temperature (Section 2). And by virtueof the fact that the intensity of the coupled electromagneticfield is inversely proportional to the difference of their oscil-lation frequencies, so that only molecules whose oscillationfrequencies are nearly resonant attract themselves strongly, adynamic basis to the origin of the selective-recognition codesorchestrating the bioreactions (hitherto accepted as dogma)is achieved [28].
1.3. Outline of Paper. These insights lead to the intriguingpossibility that the colloidal state can also show propertiesassociated with crystal lattices, and when seen from thisangle, the two approaches seem to converge, with colloidalminerals participating in a functional template as a basis forselection of biomolecules—from simpler building units toincreasingly complex ones (like membrane phospholipids,proteins, carbohydrates, nucleic acids, etc.)—and also theirmutual interactions. Indeed, this is in addition to theircapacity to act as catalytic soft surfaces, compatible withdynamics. Thus, the following may be outlined:
(1) we briefly review the scenario of water domainsorganized on hydrophilic colloidal surfaces envisagedby Del Giudice and coworkers [29] as to how thesedissipative structures forming by coherent dynamicscan show a reducing nature and effects electromag-netic potentials (instead of fields) can exert on asystem with long-range phase correlations, beforeconcluding this section with a brief historical per-spective on QED developments (Section 2);
(2) water being the common denominator in the hypoth-esized Hadean scenario and in the present day lifeforms, we consider how mineral colloids can pro-vide a correspondence with the collective responsebehaviour [30] of complex biological molecules.Analogous to H-field induced associative networks
with ferrofluids, we look at the “mound scenario”[7] where magnetic iron-sulphur colloids can besimilarly controlled with a (spatially varying) fieldfrom magnetic rocks [31, 32]. In a thermody-namic description, the symmetry-broken patternsof hypothesized field-driven mineral colloid assem-blies and ATP-driven soft biomatter are compared(Section 3);
(3) we point out how the presence of two differentdipolar modes could have implications for water CDsto have acted as the “scaffold” enabling “takeover”(Section 4);
(4) we consider how the paradigm of a soft “scaffold” (cf.[13]) of field-controlled catalytic-mineral colloidsenrobed in organized water [26] could address theentangled emergence of both (metabolic and repli-cating) wings of life (Section 5);
(5) conclusions and scope (Section 6).
2. Dissipative Coherent Domains and VectorPotential Effects
Having appreciated the relevance of a coherent system ofphase-correlated components, for being in a position tointercept energy as in life processes, one also sees the hugejump needed for a molecular assembly (as in conventionalorigin-of-life approaches)—an uncorrelated ensemble—tomake, in order to achieve that status. To that end, Del Giudiceand coworkers [25, 27–29] consider the unique role of waterin living systems (that accounts for 70% in weight and 99% inmolar weight). In fact, the ordering of water, leading to whatis called exclusion zones in the presence of structure makerslike PEG or natural ones like carbohydrates, has for longbeen exploited for the stabilization of biomolecules for invitro and in vivo purposes [33]. In contrast to ordinary water,interfacial water close to hydrophilic biosurfaces, studied indetail by Pollack’s group, has been found to have a numberof anomalous properties. Apart from resisting penetrationof solutes, this exclusion zone (EZ) is associated with chargeseparation; the structured zone itself is negatively charged,while protons concentrated in the region beyond are freeto diffuse, as dictated by the local electric gradient [3]. Theboundary between EZ and normal water forms a redox pilethanks to the negative electric potential of the former of theorder of 100 mV relative to the latter. Remarkably, the growthof this zone has been found to be induced upon exposureto light radiation, thus making this energetic pathway acentral protagonist for the origin of life. What is more,fluorescing exclusion zones show the possibility of electronictransitions, with implications for protometabolic processes;recall that energy of the order of soft X-rays is required toionize a water molecule (ionization potential 12.60 eV [29]).And the diffusing protons—a by-product of the thus built-up exclusion zone—enable the process of coalescence bybalancing the inter particle repulsion (owing to negativelycharged structured water envelopes on the biomolecules),forming ordered arrays. This is indeed consistent with the
4 Physics Research International
observation that increasing the light intensity diminishesthe distance between microparticles [3]. But this scenario oforderly motion is at variance with the conventional picture ofwater with uncorrelated rotations and thermal effects [34],which is typically described with two-body interactions atrelatively large distances. On the other hand, at much smallerrelative distances, the opposite scenario dominates. Namely,the N-body interactions become increasingly dominantas r becomes smaller, when radiative corrections acquireincreasing dominance giving rise to time-dependent e.m.fluctuations (necessarily coherent as against thermal effects).
These observations therefore have a natural interpre-tation in terms of the QED-based “coherence domain”(CD) theory [26, 35] in which charged system componentsare coupled to the e.m. field. CD theory makes use of anew collective ground state of the structured water (withentrapped e.m. fields) whose features differ from those ofthe isolated molecular ground state water (the incoherent gasphase). The noncoherent and coherent states are separatedby an energy gap (λCD = hc/Eex = 0.1 m), correspondingto the infrared region, where Eex = 12.06 eV is the energyof the excited state of water molecules. In this manner,this ubiquitous molecule gives rise to a “coherence trap,”eventually leading to a larger coherence unit [26, 34], wherethe water CD offers a reservoir of almost free electrons thatare excitable at each step of metabolism with a concomitantreduction of entropy. Now, QFT, as distinguished from mere(single-particle) quantum mechanics, is characterized byan uncertainty relation connecting the number N of fieldquanta (unspecified) and a “phase” Φ which—unlike theusual phase of wave-like motion in quantum mechanics—describes something more subtle, namely the (coherent)“rhythm” (a la Del Giudice) of the field oscillations as awhole. This uncertainty relation [36] in QFT which reads as
ΔNΔΦ ≥ �
2(1)
plays an important part in determining the collective coher-ence measure (Φ) of the aggregate of the bioparticles (vis-a-vis their number N) under the influence of the ambiente.m. field. A second uncertainty relation brings in the zero-point energy, or the energy of the quantum vacuum, whichis best illustrated by the harmonic oscillator problem inquantum mechanics, namely, �ω/2, plays a subtle but crucialrole in energy book keeping in the physics of biosystems. Thisconcept shows up rather dramatically when a large numberof (incoherent) particles undergo a “phase transition” downto an ordered state with a decrease in entropy. This processmust be accompanied by the release of a certain amountof heat energy (so as not to violate the second law ofthermodynamics). And the source of this energy is preciselythe zero point quantum vacuum energy noted above.
As another interesting observation, Ho [37] has inferredthe presence of coherent domains in embryos servingas detectors for the Aharanov-Bohm effect in a suitablydesigned setup. The abnormality profiles of these embryosmatch those exposed to weak static magnetic fields, pointingto the sensitivity of the former batch to the vector potential inan essentially field-free region. The significance of this subtle
effect has been interpreted by Brizhik et al. [38] in termsof nonlinearity of the corresponding Schrodinger equation.For a quick derivation, reinterpret the usual momentum pas kinetic momentum, on the lines of its energy counterpartwhich admits of a division in terms of kinetic and potentialenergies. Now, the corresponding “potential momentum”involves the e.m. vector potential A in the form eA where eis the charge of the concerned particle, so that the kineticmomentum becomes (p − eA), and the usual kinetic energyterm p2/2m term gets replaced by (p − eA)2/2m. Now, for alinear (perturbative or 1st order) dependence onA, the phaseφ can be simply “gauged away” (i.e., trivially eliminated),so that only a noncoherent description of the state remains!But with a more complete (nonlinear) dependence on A,one has the more interesting possibility that the phase φcan no longer be eliminated and depends directly on A,thus producing a coherence effect, while the “mundane”amplitude Ψ0 has a more or less “classical” (noncoherentlike) dependence on the fields E and H [38]. Note also thatthe phase φ is directly connected to the Aharanov-Bohmeffect (recall the definition of its characteristic phase shift)!
To sum up the findings with a historical perspective, itis good to recall that the unique vacuum was the source offundamental discoveries in the middle of the last century,such as the “Lamb shift,” which had generated novel ideasof renormalization of the vacuum, as well as second-and higher-order electromagnetic corrections, leading toincredible agreement with experiment up to one in 1012!In the excitement of these dramatic discoveries however,the potential powers of the e.m. field for impacting other(less exotic) phenomena somehow got lost sight (due to lackof immediate motivation?). In this respect, an importantphenomenon—first recognized by the Italian group of DelGuidice and coworkers—concerns the role of QED as an(ubiquitous) ambient field making its impact on biomatterat the more earthly “first-order level” itself, even withoutgoing into such fancy second-order corrections! What DelGiudice’s group recognized was that in the ambient interac-tion of the e.m. field with biomatter, its vacuum is alreadyin a highly degenerate form, together with its features ofsymmetry breaking and the presence of long-range Nambu-Goldstone (NG) bosons [27, 28, 39]. This interaction is bestexpressed in terms of the e.m. potentials A, φ (which havelonger ranges than the corresponding field quantities E andH). It seems surprising that this elementary form of e.m.interaction with biomatter which is otherwise quite basic wasnot considered earlier in the literature in such a “holistic”form.
3. Water Organized on Biomatter versusField-Controlled Mineral Colloids
The above framework for stable dissipative structure for-mation and storage of energy in coherent form bringsabout a synthesis of energy and information (!) that seemshighly relevant for water, which is capable of changing itssupramolecular organization depending upon its interactionwith the environment. This is thanks to the special properties
Physics Research International 5
of the electronic spectrum of the ubiquitous molecule—theirproposed candidate providing the “hardware.” As discussedabove [38], the vector potential A—the “brain” behindthe coherent arrays (of e.m. field-entrapped CDs)—alreadyoffers a “switch” for controlling the phase of the coherentsystem, with a range of implications for living organisms,such as global selection mechanisms and communicationnetworks. But, as water in the coherent organized staterequires a hydrophilic surface for its structuring, this maywell also hold the key to how the “takeover” from mineralsby organics [13] had come about, its collaborating presencebeing a common factor in both scenarios—hypothesizedmineral colloids in the Hadean and organic living systemstoday. In particular, we refer to the dynamical basis ofselection via the e.m.f. mediated resonancebasis of attractionof molecules ([24, 26–28], Section 2). Now, since life is ahistorical phenomenon, the question of how the phase ofthe coherent water system could have been manipulatedmust hence be intimately entangled with the properties, thenature, and the workings of these “eccentric” biomoleculesthat “took over” from their inorganic ancestors. In addition,noncovalent interactions between the complex molecules,like lipids, proteins, carbohydrates, and nucleic acids, viaa variety of recognition modes—that underlie biologicallanguage—frequently appear in myriad conserved patternsfor propagating information observable across kingdoms oflife. Instead of life’s emergence based on the single origins ofonly one of these complex forms in a suitable geochemicalsetting (where the issue of how these associations might havehappened would have to be either postponed or skipped),the picture gels with that of gradually building up organicnetworks within a special microenvironment that couldallow time for associations between molecules and laterbetween types of molecular networks to occur [10, 11].And a dynamic superscaffold comprising organized waterdomains (see Section 2) could have selected different kindsof specialized organics to replace its components carryingout different functional roles; this scenario entails thatassociations between complex biomolecules came about bythese substitutions.
3.1. Soft-Matter and Large Response Functions: A “Thermody-namic” Description. We start with a phenomenological (a lastatistical mechanics) description urging that the attributesof what has come to be known as “soft matter” coined byde Gennes [30] be reviewed in the light of the “principleof biological continuity” (see, e.g., [40]). One could ask ifmineral-like clusters (iron sulphur, etc.) have been aroundfor “more reasons” than the huge list already compiledhitherto [41] (see Section 3.2 next). Had a soft mineral-containing scaffold given residence to a quasiparticle/s,which was equally comfortable in association with its organicsuccessor, providing the same pattern of dynamic functional“goods”? Again, the huge advances in the materials sciencessector show couplings between different d.o.fs (magnetic,elastic, thermal, etc.), as in those of biomolecular systems[42] and raise the possibility of similar patterns in mineralcolloidal particles [43]. In fact, thermally stable mineral
liquid crystalline phases are of interest as they can beelectronrich in contrast to organic ones and therefore possesspronounced electrical, optical, and magnetic properties [44].Now, the collective nature of the “large response functions”[30] underlies the susceptibility of complex biomatter tosmall external perturbations. In fact, the main aspects of softmatter: response functions, noncovalent weak interactions,and entropic forces, play a key role in biological organizationand close-to-equilibrium dynamics. Its emergence seemshard to imagine from very simple organics at the core(that could be traced to primordial abiogenics) unless thistransition can be in principle addressed in a continuousdeterministic manner. Guided by Cairns-Smith’s paradigmthat any material with this potential was fine so long as itwas readily available, we suggest that a template comprisingmineral colloids [32] could have realized these functions.In particular, one may recall that fields can carry signaturessuch as sensitive material responses, indicating how acoherent source can supply energy to matter to sustainan isothermal, symmetry-broken aperiodic assembly subjectto random fluctuations. At a macroscopic level, a goodexample was provided by Breivik [45] who showed howmagnetic information transfer (via self-assembled 3 mm-sized magnets) helps encode a sequence of independent andidentically distributed random variables [46], underlyinglife’s information-rich aperiodic order [47]. For an extensionof this to the nanoscale, consider field-induced aggregatesobserved in ferrofluid dispersions [48, 49], described asa phase separation of a particle-concentrated phase froma dilute one [50]. These close-to-equilibrium structures(requiring about tens of milli Tesla fields for their formation)are dissipative in nature, breaking up when the field isswitched off, and offer a basis for slowly changing patterns asin soft biomatter. The external H-field breaks the rotationalsymmetry of the dispersed and disoriented single-domainparticles that are subject to thermal fluctuations from thebath and imposes a directional order. Again, Dyson’s [51]use of field-accreted matter for simulating “analog life,”gives an instructive edge to magnetism-based proposals, forexample, implementation of Boltzmann machine type ofneural network based on interspin exchange interactions ina spin glass [52] and associative memory simulations, usingparticle-particle dipolar interactions in nanocolloids [53].
3.2. Rock Magnetism and Magnetic Colloids in “MoundScenario”. Similarly, as magnetic rocks are a good providerof moderate H-fields for accretion of nanoparticles formingon the Hadean Ocean Floor [31], this brings us to thealkaline seepage site mound scenario [6, 54, 55], illustrated inFigure 1 (reproduced with permission from Russell and Mar-tin [7]; Russell et al. [54]). Here, negatively charged colloidalmineral greigite forming under alkaline mound conditions(as pH well above 3 [56]) does resemble an aqueous-basedferrofluid. Significantly, the key to stabilizing its colloidal-gel state lies with organics [57]. And the strong structuralsimilarities between iron-sulphur clusters in enzymes andtheir mineral counterparts that were likely to have beenpresent on the primordial ocean floor underly the interest in

6 Physics Research International
Cool, carbonic Hadean Ocean ≤20◦C pH ~5
HPO2−4
CH4 CH3COO−/CH4 + H2O
CH3COO−
CO2CO2
H2
Fe2+ H+
H+ Ni2+
FeS
NiS
FeSNiS
2H2
Temperature, redox, pH gradientH+ gives protonmotive force
Ocean
Crust
HS−
H2 NH3
MoS2−4
Reduced, alkaline hydrothermal solution~120◦C, pH ~11
Retained organic
precursors
FeIII
Figure 1: The hydrothermal mound as an acetate and methane generator. Steep physicochemical gradients are focused at the margin ofthe mound (see text also [54] for details). The inset (cross-section of the surface) illustrates the sites where anionic-organic molecules areproduced, constrained, react, and automatically organize to emerge as protolife (from Russell and Martin [7] and Russell et al. [54], withpermission).
sea-floor hydrothermal systems [7]. Clusters of iron-sulphurare seen ubiquitously across living systems (despite theirpredominantly organic basis) and carry out a variety of roles,such as electron transfer, radical generation, sulfur donation,and control of protein conformational changes associatedwith signal transduction, to name some [58–61]. In fact,spin polarization and spin coupling are key characteristicsof the sulphur-bridged complexes, embedded within theseancient bioconstructs [62]. The spins on metal sites in di-to polynuclear iron sulphur clusters are coupled via what iscalled Heisenberg exchange coupling, which typically favorsantiferromagnetic alignment of neighbor spins. This incombination with valence delocalization within the clusterhelps bring about coupling of different degrees of freedomand add to the complexity of the system [62]. Ligand bindingcan thus affect not only the electronic distribution, butalso the pattern of spin alignment, and hence the net totalspin state [63]. The complex web of interactions—orbitalinteractions, electron delocalization, and spin coupling—in the iron-sulphur clusters [64] shows the likelihood of asimilar profile for magnetic mineral colloids in the moundmembranes.
In the mound scenario, colloidal membrane surfaces,envisaged as hosting simple metabolic cycles, comprise ofiron-sulphide minerals, such as mackinawite and greigite,which along with some other transition metal compoundscould have been geochemically available for carrying out
similar catalytic type of functions and acted as protometabol-ically relevant catalysts [7, 55, 65]. Not only that, butalso the confrontation of geofluids at different pH acrossprecipitating colloidal FeS membranes also provides insightsinto the essential dependence of biological processes ona proton-motive force (chemiosmotic gradient) across cellmembranes, which is a more or less invariant mechanism ofenergy conversion across living forms [66].
The “mound scenario” thus weaves together the keymaterial patterns highly relevant to life processes—softcolloid gel state, catalytic enzyme-like iron-sulphur clusters(for primordial metabolism), plausible abiogenic reactions(with passage of electrons to lower energy states), and naturalgradients (of redox, pH, and temperature), to name some—into a persuasive geochemical location on the Hadean OceanFloor. It gives a plausible account of how key abiogenicscould have accumulated [67] and coordinated with eachother [10] in membranous inorganic compartments, as wellas dynamically ordered framboidal reaction sacs [68], thelatter forming through interplay of attractive and repulsiveforces (cf. [69]). Indeed, spherical, ordered aggregates offramboidal pyrite about 5 μm in diameter were found infossil hydrothermal chimneys [70–73], see Figures 2(a) and2(b), that seemed to have grown inorganically from thespherical shells of FeS gel. Furthermore, Russell and cowork-ers [70] have noted the size similarities of the magnetosomecrystals to that of pyrite crystallites (∼100 nm in diameter)

Physics Research International 7
0.25 mm
(a) Small vent
1 mm
(b) Sheaves
Figure 2: Framboids in chimneys: (a) small pyrite vent structure: reflected ore microscopy of transverse section shows a central area ofempty black spaces plus (grey) fine framboidal pyrite and a fine euhedral authigenic rim surrounded by baryte, with minor pyrite; (b) Sheafsystem, formed from coalescing rods of anastomosing microcrystalline pyrite. Black areas are empty spaces; central regions are framboidalpyrite with an exterior of crystalline pyrite. (Labelled pictures given by Dr. Adrian Boyce are reproduced with his kind permission; source:Boyce et al. [71, 72, 80]).
comprising the interior of framboids that appeared to havegrown inorganically from spherical shells of iron-sulphidegel; their earlier stages would have comprised reduced formsof framboidal iron sulphide, just as in iron-sulphide-bearingbacteria. Here, the quasiperiodic organization associatedwith naturally formed framboids [74] is intriguing in viewof their resemblance to the well-studied dynamic order inlaboratory-made quasicrystals. These form via an accretion-based mechanism [75] and show unusual combinations ofproperties (resembling living matter). Thus, the observationof scale-free framboids rekindles the long-standing interestin these forms for the origins of life [76], providing as theydo, an opportunity to study the surface-minimized packingof colloidal spheres as independent dynamical components[46]. Wilkin and Barnes [56] explain the formation/stabilityof micro meter-sized framboids, using an interplay of neg-atively charged repulsive and magnetically attractive forces,where a size >100 nm would orient crystals to the weak geo-magnetic field ∼70 microTesla. Extrapolation of this to themilli-Tesla scale (via a local field from magnetic rocks) showsthe feasibility of nanoscale aggregates, analogous to ferrofluidones. This conjecture [31], inspired by chimneys showingframboids (plate 2 of [73]), gets support from observationsof fractal greigite framboids [77] which independently affirmthe natural propensity of this mineral towards an aperiodic,nested organization.
As to the possible relevance of these observations to thecoherent dynamics discussed in the previous sections, wenote in passing that a correspondence exists between fractalstructures and the algebra of “q-deformed” coherent states(Fock-Bargmann Representation); see Vitiello [78, 79] fordetails. While this is beyond the scope of the present paper,
this is an interesting way to describe the emergence of long-range correlations at the global (mesoscopic/macro) levelfrom local (microscopic) deformation patterns.
3.3. Environment as a Field: “Taming the Noisy Shrew”. Now,the scenario of a magnetic template for “soft biomatter”unfolds a novel role for the environment. Here, far from beingsolely a harbinger of perturbative influences, the environ-ment holds the controls for the assembly process itself: thefield enables the superparamagnetic particles to overcomethermal fluctuations so that in the resulting aggregates, thecomponents are held together by reversible weak dipolarinteractions. Thus, in contrast to crystal lattices, the softassemblies seem conceptually compatible with dynamics andwould have remained intact, even if the “layers” of theaggregates were used as surfaces for adsorption (e.g., byabiogenics) or as passages to diffusively migrating particles.For an H-field can connect the response-to-field variations(i.e., susceptibility) and the correlators between interactingspins via the fluctuation-dissipation theorem (FDT). And,for gradual flux changes to be consistent with effectivelyisotropic local surroundings for particles (diffusing throughthe field-induced aggregates), moderate gradients in themound may have sufficed (cf. [55]). Sure enough, the weakmagnetic dipolar interactions between the latter and thoseforming the “layers” have a striking resemblance to therecognition-based movement in transcription and transla-tional processes. Note that the same patterns of diffusivemigration through assemblies also map with the ATP-drivenmigration of biomolecular motors on cytoskeletal proteinnetworks. Next, to consider coupling of scalar chemicalreactions with vector processes like diffusion [81], let us

8 Physics Research International
extend surface-transfer reactions envisaged in ligand shellsof adjacent transition metal elements on crystal surfaces[82] to “template” layers of magnetically ordered particles(cf. [10]). Now, within a common FDT framework forasymmetric movements, binding to nonmagnetic ligands(e.g., organics) would increase the net potential energybarrier of the particles for interacting with their “template”partners compared to their unbound counterparts. Thus,greater diffusive exploration of the organic bound particles(as in biomolecular motors) contrasts with the entrapmentof the unshielded ones into an expanding network ofdipolar interactions (as in growth phenomena). Note thatthe isothermal, cyclic switching between different entropicstates in molecular motors is pictured here using a gentleflux gradient (nonhomogeneous rock H-field) periodicallyperturbed by local H-fields of “template” partners, leadingto alternating high- and low-“template” affinity states due tothe dipole’s magnetic degree of freedom [31]. In contrast tothese first-order-like phase transitions, the superimpositionof a gentle temperature gradient on field-induced structuresresults in a decrease in magnetization (a second-order phasetransition) of a diffusing dipole (cf. [83]). Here, changesin susceptibility seem a plausible response mechanism forharnessing various fluxes in the mound, enveloped by furthercolloidal/mineral precipitates. In this context, the coupledd.o.fs in biomatter ([42], see Section 3.1) have a strongresemblance to the secondary effects of magnetism in a sub-stance arising as a consequence of couplings between its dif-ferent physical properties: magnetocaloric, magnetoelectric,magnetooptic, and magnetostriction [84]. Hence similarly,via the fluctuation-dissipation response mechanism, thesecouplings could have enabled the environment to harnessany gentle gradients using its field as a “switch.” In addition,the passage of charges is expected owing to gradients in themound, which would induce a magnetic field. The scenarioof the latter interacting with the rock field at the base ofthe mound, and leading to a (reversible) homopolar-motor-like rotation of conducting assembly components, does seemreminiscent of the rotatory ATP-driven pumps that arethought to be amongst the early-evolved mechanisms.
3.3.1. Chirality (Naaman and Rosenberg): Mound Scenario.All along, the constructive use of noise (via FDT) is possiblethanks to the magnetic asymmetry of the assembly. TheirATP-driven soft-matter counterparts in living systems, how-ever, employ chiral molecules for achieving ratchet effects.A causal connection to understand this correspondencecould be given in terms of spin-polarized electrons (as in[85]). This is also consistent with the geochemical-basedview of life’s origin [54], which posits that life emergedon the surface of a wet planet (likely earth) once the earlyevolved mechanisms were set in place (mechanisms requiringlight, such as photosynthesis, therefore evolved later in thisscenario, which makes it relevant to consider interactionswith chirality ingredients like circularly polarized light forlater stages of evolution). Briefly, the work of Naamanand coworkers [85, 86] reveals how co-operative effectscan endow assemblies of chiral dipolar molecules with the
capacity to selectively discriminate between spins pointing“up” or “down.” A similar spin-filtering effect is achievedin spintronics by applying an external field to inducemagnetization in ferromagnetic thin films. On the otherhand, the magnetization in its biological counterpart—layered organization of dipolar chiral molecules—is basedon two stages: (1) the magnetic field created by transfer ofcharge (electron or hole) through chiral molecules aligns themagnetic dipole of the charge transferred; (2) then exchangeinteractions in the layered domain keeps them aligned (thespin-orbit interaction is negligible here). Furthermore, in animportant study, Rosenberg [87] has shown how chiralitycan affect reactions in the presence of spin-polarized elec-trons, provided by radiating the magnetic substrate bindingthe organics. The requirements for producing low-energyspin-polarized electrons—ionizing radiation and a magneticsubstrate—seem to match with the “infrastructure” availableat the base of the mound. In addition to the presenceof high levels of radioactivity and the reducing conditionsprevailing in the Hadean Earth’s crust, Ostro and Russell(unpublished results 2008) have described how iron andiron-nickel particles derived from the subhypervelocity fluxof iron and NiFe-metal containing chondritic meteorites andmicrometeorites, and distributed on the ocean floor, wouldbe partially scattered throughout the mound (see [31]).The invasion of the mound by magnetized extraterrestrialmaterials would have been further reinforced by secondarymagnetization of the magnetite produced as an alterationproduct at the base of the mound [31] as a consequenceof serpentinization [88]. The plausibility of having spin-polarized electrons in the mound then throws up theintriguing correspondence between the available carriersof the spin-polarized electrons—the field-ordered magneticdipolar colloids [31, 32] and structured water [3, 24, 27–29]—and the assemblies of chiral dipolar biological replace-ments which show magnetic behaviour upon polarizedcharge transfer [86]. Indeed, recent results demonstrate thatmackinawite, which is isostructural with high-temperatureFe-based superconductors, also shows similar magneticprofiles, thus leading to the conjecture that this importantcomponent of the “mound scenario” may well be one of thesimplest among Fe-based superconductors [89].
4. QFT Scenario: Two Modes of WaterCD “Scaffold”
Albeit described above (Section 3) at a “stat mech” (ther-modynamic) level, one repeatedly encounters analogies ofcollective behaviour (many coupled spins versus many cou-pled atoms), where symmetry-broken patterns in inorganiccolloids show matching correspondences with their biolog-ical counterparts. This scenario is fully compatible witha QFT description, with merely a change from imaginary(Matsubara) “time” to real time, a la Feynman, the system,as the carriers of ordering information. With the “ordering,”there is effectively a freezing of the d.o.fs of some elementary(microscopic) components, leading to a coherent, collective(macroscopic) quantum behaviour called the ordered pat-tern (see [21, 24, 39]). One can also check that the rotational

Physics Research International 9
symmetry-broken N-G-bosons (magnons) seem to be morerelevant to dynamical biological systems (see the applicationof rotational symmetry breaking via electric dipoles in thedissipative brain model of Vitiello [90]), rather than thetranslational symmetry-broken phonons—N-G bosons inthe crystal context. Nevertheless, the quasiparticles associ-ated with the symmetry-broken organization patterns couldhold the key to how the “takeover” [15] from inorganic-magnetic dipolar to organic-electric dipolar nature cameabout, the association with interfacial water CDs beingcommon to both scenarios.
We have already seen in Section 2 how organized watercan exhibit crystal-like collective properties, where a deepreshuffling of its electron clouds allows it to act as anelectron donor. Water CDs can act like machines and collectenergy—even noncoherent sources like thermal noise—andstore in a coherent form and even include “guest molecules”[26]. Further, the association of coherent water CDs witha reservoir of quasifree electrons enables the production ofmetastable coherent-excited states [91]. Thus, when excitedby some externally supplied energy, the ensemble of quasifreeelectrons executes rotational motion (as cold vortices) withquantized magnetic moments that can align to ambientmagnetic fields; their stability is ensured by their “cold”coherent nature, preventing thermal decay [26]. Thus, thewater CDs can be associated with both electric (oscillatory)and magnetic (rotatory) dipoles. Now, the criterion for a“guest” molecule to gain entry into the CD “machine” isthat of a matching frequency to that of the CD host via its(lowest order) radiative dipole. And interfacial water CDs—capable of both kinds of absorption/emission exchanges—can provide a powerful scaffold mechanism for swappingbetween inorganic (magnetic-rotatory dipolar) and organic(electric-oscillatory dipolar) colloidal organizations. This issince being coherent systems, their phase can be tuned by anexternal e.m. potential [35, 38]. Thus, for consistency withthe principle of biological continuity, e.m. potentials associ-ated with quasiparticles, arising from the various symmetry-breaking contexts in biological organization today, hadto be similarly linked to mineral-based ancestors in theHadean, for enabling the envisaged “takeover” [13]. Again,the correspondences between the hypothetical Hadean andbiological scenarios (Section 3) provide functional contextsfor energy dissipation; here, the thermodynamic-FDT basisof description can be checked for their compatibility withcoherent exchanges with water CDs. The latter can increasetheir coherent stores even by accepting incoherent thermalnoise, the requirement for release being that the “guest” pro-vides a matching frequency (see above). Evidently though,the organics could not “takeover” all the functions, such aselectron transfers and sensing (see below).
5. Metabolism, Replication, and Sensing
Magnetic networks also provide a conceptual platformfor bringing together a variety of mechanisms—such asharnessing different fluxes (since further colloidal/mineralprecipitates could envelop the mound)—as an alternative
to say, awaiting the emergence of the elaborate geneticsetup enabling lateral gene transfers. For in principle thepresence of magnetic-dipolar modes in water CDs offersa mechanism for a framboid-like scalingup of magneticassemblies, permitting their navigation to zones with weakerfield intensities. And we speculate that once the weakgeomagnetic field started to develop, similarly organizedorganic replacements could have disembarked from themound. The former also offers a plausible response-basedmechanism for navigation. Note the similarity between thepassage of a mag-netosome-containing bacterium, movingin response to the extremely low-frequency geomagneticfield [92] (although by sensing changes in the inclinationmagnitude increasing from the equator to the poles) andthe scaled-down scenario of ligand-bound superparamagneticparticles traversing a field-induced aggregate in response to(gentle changes in flux lines due to) an external moderateH-field [31]. For bacteria do use these cell components ascompasses [93–95] that help to orient them to the geomag-netic field, as they navigate through waters. Interestingly,magnetosomes are composed of ordered magnetite crystals,as well as greigite ones, albeit less frequently [96, 97]. Theirancient origins can be appreciated from the conjecture that“Magnetoreception may well have been among the firstsensory systems to evolve” based on the universal presenceof single-domain crystals of magnetite across many speciesand groups of organisms, ranging from bacteria throughhigher vertebrates that exploit the geo-magnetic field fororientation, navigation, and homing [98, 99]. In addition,different magnetite-based models of biological magnetic-torque transducers have been proposed as a basis for sensingand transducing magnetic-field changes via direct/indirectcoupling to mechanosensitive ionchannels [100]. Indeed, toquote from Kopp and Kirschvink [101], “The magnetosomebattery hypothesis suggests the possibility that the magne-tosome arose first as an iron sulfide-based energy storagemechanism that was later exapted for magnetotaxis and stilllater adapted for the use of magnetite.”
The gradual substitutions of colloidal magnetic networksbound by weak dipolar interactions could conceptuallyexplain how recognition-based communication language(e.g., complementary base pairing, enzyme substrate, etc.)may have arisen in water-coated bionetworks bound bynoncovalent, weak recurring bonds (H-bonds, van derWaals); note the capacity of the latter to undergo sol-geltransformations, like reversible magnetic gels. Further, asstructure (shape, polarity, etc.) dictates interactions, onewonders if incorporation of substitutes had not been aninformation-registering mechanism of a coherent ancestorleading to the structure-function associations across biol-ogy, the “contents” being different functions in differentstructural (memory) addresses. Now, the emergence ofa digital form of storing information in this scenario—where associative networks were available [31]—is likelyto have been a later development that can be understoodin terms of connections developing between networks [10,11]. Nevertheless, a magnetic environment proposed byus (see [102]) can provide a basis [32] for Patel’s [103]proposal of a quantum search leading to a digital mechanism
10 Physics Research International
if a coherent ancestor indeed brought forth life, that is.Other workers have also provided arguments involving iron-sulphur minerals [104] and the colloid state [105] thatsupport a quantum basis for the origins of life.
6. Conclusions and Scope
Cairns-Smith’s crystal scaffold is softened via field-responsivecolloids to conceptually access the “replicator” in twostages: (1) an environmental field enabled the assembly,induction of asymmetries, response effects for close-to-equilibrium dynamics, and associative networks of magneticcolloids, besides providing a coherent environment forstabilizing associated (a variety of) symmetry-broken quantaand their feedback-interactions with those of the coherentwater domains; (2) analogue processes in a coherent water-mineral-colloid assembly are speculated to have enabled the“leap” to digital form of information processing. In this newscenario, the catalytic activity and soft-matter patterns arosefrom field-responsive mineral colloids, whereas energy cap-ture (from protometabolic reactions and a variety of fluxes)and storage in far-from-equilibrium dissipative structureswas throughout associated with the coherent water domainsorganized on the colloidal inorganic or organic surfaces.This might provide insights into the entangled origins of thereplicating and metabolic wings of life.
Indeed, in this manner, Nobel Laureate Albert Szent-Gyorgyi’s view of life being “an electron looking for a placeto rest” can be seen to be consistent with CO2 as its eventualdestination [55] and the essentially organic nature of life.Again, in the words of the father of modern biochemistry,if “water was dancing to the tune of solids”—with tunesas the associated e.m. potentials—this “dance” would havecontinued uninterrupted if organic replacements of theinorganic ancestors had played the same “tune.’’
Acknowledgments
The authors are grateful to Professors Michael Russell andKirt Robinson for bringing the work of the Naaman’s groupto their notice and Dr. Adrian Boyce for kindly providing hislabeled framboid pictures. They are grateful to the refereefor his careful reading of the paper, leading to preciseinsertions of appropriate references. They thank ProfessorMichael Russell for inspiration and support (data and figuresplus key references, e.g., Brizhik et al. [38]; Carmeli et al.[85]; Kwon et al. [89]). They also are grateful to Dr. Jean-Jacques Delmotte for providing financial and infrastructuralsupport.
References
[1] M. J. Russell, R. M. Daniel, A. J. Hall, and J. A. Sherring-ham, “A hydrothermally precipitated catalytic iron sulphidemembrane as a first step toward life,” Journal of MolecularEvolution, vol. 39, no. 3, pp. 231–243, 1994.
[2] J. T. Trevors and G. H. Pollack, “Hypothesis: the origin oflife in a hydrogel environment,” Progress in Biophysics andMolecular Biology, vol. 89, no. 1, pp. 1–8, 2005.
[3] G. H. Pollack, X. Figueroa, and Q. Zhao, “Molecules,water, and radiant energy: new clues for the origin of life,”International Journal of Molecular Sciences, vol. 10, no. 4, pp.1419–1429, 2009.
[4] J. T. Trevors, “The composition and organization of cyto-plasm in prebiotic cells,” International Journal of MolecularSciences, vol. 12, no. 3, pp. 1650–1659, 2011.
[5] H. J. Morowitz, “A theory of biochemical organization,metabolic pathways, and evolution,” Complexity, vol. 4, no.6, pp. 39–53, 1999.
[6] M. J. Russell and N. T. Arndt, “Geodynamic and metaboliccycles in the Hadean,” Biogeosciences, vol. 2, no. 1, pp. 97–111, 2005.
[7] M. J. Russell and W. Martin, “The rocky roots of the acetyl-CoA pathway,” Trends in Biochemical Sciences, vol. 29, no. 7,pp. 358–363, 2004.
[8] H. Morowitz and E. Smith, “Energy flow and the organiza-tion of life,” Complexity, vol. 13, no. 1, pp. 51–59, 2007.
[9] N. Lane, J. F. Allen, and W. Martin, “How did LUCA make aliving? Chemiosmosis in the origin of life,” BioEssays, vol. 32,no. 4, pp. 271–280, 2010.
[10] E. J. Milner-White and M. J. Russell, “Polyphosphate-peptidesynergy and the organic takeover at the emergence of life,”Journal of Cosmology, vol. 10, pp. 3217–329, 2010.
[11] S. D. Copley, E. Smith, and H. J. Morowitz, “A mechanismfor the association of amino acids with their codons andthe origin of the genetic code,” Proceedings of the NationalAcademy of Sciences of the United States of America, vol. 102,no. 12, pp. 4442–4447, 2005.
[12] J. Trefil, H. J. Morowitz, and E. Smith, “The Origin of life,”American Scientist, vol. 97, no. 3, pp. 206–213, 2009.
[13] A. G. Cairns-Smith, Seven Clues to the Origin of Life,Cambridge University Press, 1985.
[14] C. J. Davia, “Life, catalysis and excitable media: a dynamicsystems approach to metabolism and cognition,” in TheEmerging Physics of Consciousness, J. Tuszynski, Ed., Springer,Heidelberg, Germany, 2006.
[15] A. G. Cairns-Smith, “Chemistry and the missing era ofevolution,” Chemistry, vol. 14, no. 13, pp. 3830–3839, 2008.
[16] L. M. Ricciardi and H. Umezawa, “Brain and physics ofmany-body problems,” Biological Cybernetics, vol. 4, no. 2,pp. 44–48, 1967.
[17] C. I. J. M. Stuart, Y. Takahashi, and H. Umezawa, “On thestability and non-local properties of memory,” Journal ofTheoretical Biology, vol. 71, no. 4, pp. 605–618, 1978.
[18] W. J. Freeman and G. Vitiello, “Dissipation and spontaneoussymmetry breaking in brain dynamics,” Journal of Physics A,vol. 41, no. 30, Article ID 304042, 2008.
[19] H. Frohlich, “Longrange coherence and energy storagein biological systems,” International Journal of QuantumChemistry, vol. 2, pp. 641–649, 1968.
[20] E. del Giudice, R. M. Pulselli, and E. Tiezzi, “Thermody-namics of irreversible processes and quantum field theory:an interplay for the understanding of ecosystem dynamics,”Ecological Modelling, vol. 220, no. 16, pp. 1874–1879, 2009.
[21] A. N. Mitra, “QFT in physical systems:condensed matter tolife sciences,” http://arxiv.org/abs/arXiv:1108.0303.
[22] S. D. Filippo and G. Vitiello, “Vacuum structure for unstableparticles,” Lettere Al Nuovo Cimento Series 2, vol. 19, no. 3,pp. 92–96, 1977.
[23] E. Celeghini, M. Rasetti, and G. Vitiello, “Quantum dissipa-tion,” Annals of Physics, vol. 215, no. 1, pp. 156–170, 1992.

Physics Research International 11
[24] M. Blasone, P. Jizba, and G. Vitiello, Quantum Field Theoryand Its Macroscopic Manifestations, Imperial College Press,London, UK, 2011.
[25] E. del Giudice, G. Preparata, and G. Vitiello, “Water as a freeelectric dipole laser,” Physical Review Letters, vol. 61, no. 9,pp. 1085–1088, 1988.
[26] E. del Giudice and A. Tedeschi, “Water and autocatalysis inliving matter,” Electromagnetic Biology and Medicine, vol. 28,no. 1, pp. 46–52, 2009.
[27] E. del Giudice, S. Doglia, M. Milani, and G. Vitiello,“A quantum field theoretical approach to the collectivebehaviour of biological systems,” Nuclear Physics, Section B,vol. 251, no. C, pp. 375–400, 1985.
[28] E. del Giudice, S. Doglia, M. Milani, and G. Vitiello,“Electromagnetic field and spontaneous symmetry breakingin biological matter,” Nuclear Physics, Section B, vol. 275, no.2, pp. 185–199, 1986.
[29] E. del Giudice, P. R. Spinetti, and A. Tedeschi, “Waterdynamics at the root of metamorphosis in living organisms,”Water, vol. 2, pp. 566–586, 2010.
[30] P.-G. de Gennes, “Soft matter: more than words,” Soft Matter,vol. 1, no. 1, p. 16, 2005.
[31] G. Mitra-Delmotte and A. N. Mitra, “Magnetism, entropy,and the first nano-machines,” Central European Journal ofPhysics, vol. 8, no. 3, pp. 259–272, 2010.
[32] G. Mitra-Delmotte and A. N. Mitra, “Magnetism, FeScolloids, and the origins of life,” in The Legacy of AlladiRamakrishnan in the Mathematical Sciences, K. Alladi, J. R.Klauder, and C. R. Rao, Eds., Springer, New York, NY, USA,2010.
[33] N. V. Katre, “The conjugation of proteins with polyethyleneglycol and other polymers. Altering properties of proteins toenhance their therapeutic potential,” Advanced Drug DeliveryReviews, vol. 10, no. 1, pp. 91–114, 1993.
[34] R. Arani, I. Bono et al., “QED Coherence and the thermody-namics of the Water,” International Journal of Modern PhysicsB, vol. 9, pp. 1813–1841, 1995.
[35] E. del Guidice and G. Vitiello, “Role of the electromagneticfield in the formation of domains in the process of symmetry-breaking phase transitions,” Physical Review A, vol. 74, no. 2,Article ID 022105, 2006.
[36] L. Leplae and H. Umezawa, “Dynamical rearrangement ofsymmetries - III - Superconductivity,” Il Nuovo Cimento A,vol. 44, no. 2, pp. 410–426, 1966.
[37] M. W. Ho, “Towards a theory of the organism,” IntegrativePhysiological and Behavioral Science, vol. 32, no. 4, pp. 343–363, 1997.
[38] L. Brizhik, E. del Giudice, S. E. Jørgensen, N. Marchettini,and E. Tiezzi, “The role of electromagnetic potentials in theevolutionary dynamics of ecosystems,” Ecological Modelling,vol. 220, no. 16, pp. 1865–1869, 2009.
[39] H. Umezawa, Advanced Field Theory: Micro, Macro, andThermal Physics, AIP, New York , NY, USA, 1993.
[40] N. Lahav, S. Nir, and A. C. Elitzur, “The emergence of life onEarth,” Progress in Biophysics and Molecular Biology, vol. 75,no. 1-2, pp. 75–120, 2001.
[41] H. Beinert, “Iron-sulfur proteins: ancient structures, still fullof surprises,” Journal of Biological Inorganic Chemistry, vol. 5,no. 1, pp. 2–15, 2000.
[42] F. W. Cope, “A review of the applications of solid state physicsconcepts to biological systems,” Journal of Biological Physics,vol. 3, no. 1, pp. 1–41, 1975.
[43] J. Hemberger, P. Lunkenheimer, R. Fichtl, S. Weber,V. Tsurkan, and A. Loidl, “Multiferroicity and colossal
magneto-capacitance in Cr-thiospinels,” Phase Transitions,vol. 79, no. 12, pp. 1065–1082, 2006.
[44] J.-C. P. Gabriel and P. Davidson, “Mineral liquid crystalsfrom self-assembly of anisotropic nanosystems,” Topics inCurrent Chemistry, vol. 226, pp. 119–172, 2003.
[45] J. Breivik, “Self-organization of template-replicating poly-mers and the spontaneous rise of genetic information,”Entropy, vol. 3, no. 4, pp. 273–279, 2001.
[46] C. E. Shannon, “A mathematical theory of communication,”Bell System Technical Journal, vol. 27, pp. 379–423, and 623–656, 1948.
[47] E. Schrodinger, What is Life? Cambridge University Press,Cambridge, UK, 1944.
[48] R. W. Chantrell, A. Bradbury, J. Popplewell, and S. W.Charles, “Agglomerate formation in a magnetic fluid,” Jour-nal of Applied Physics, vol. 53, no. 3, pp. 2742–2744, 1982.
[49] A. Y. Zubarev, J. Fleischer, and S. Odenbach, “Towards atheory of dynamical properties of polydisperse magneticfluids effect of chain-like aggregates,” Physica A, vol. 358, no.2-4, pp. 475–491, 2005.
[50] J. Li, Y. Huang, X. Liu, Y. Lin, L. Bai, and Q. Li, “Effectof aggregates on the magnetization property of ferrofluids:a model of gaslike compression,” Science and Technology ofAdvanced Materials, vol. 8, no. 6, pp. 448–454, 2007.
[51] F. J. Dyson, “Is life analog or digital?” Edge, vol. 82, 2001.[52] J. M. Goodwin, B. E. Rosen, and J. J. Vidal, “Image
recognition and reconstruction using associative magneticprocessing,” International Journal of Pattern Recognition andArtificial Intelligence, vol. 6, no. 1, pp. 157–177, 1992.
[53] R. Palm and V. Korenivski, “A ferrofluid-based neuralnetwork: design of an analogue associative memory,” NewJournal of Physics, vol. 11, Article ID 023003, p. 30, 2009.
[54] M. J. Russell, A. J. Hall, A. J. Boyce, and A. E. Fallick, “Onhydrothermal convection systems and the emergence of life,”Economic Geology, vol. 100, no. 3, pp. 419–438, 2005.
[55] W. Nitschke and M. J. Russell, “Hydrothermal focusing ofchemical and chemiosmotic energy, supported by delivery ofcatalytic Fe, Ni, Mo/W, Co, S and Se, forced life to emerge,”Journal of Molecular Evolution, vol. 69, no. 5, pp. 481–496,2009.
[56] R. T. Wilkin and H. L. Barnes, “Formation processes offramboidal pyrite,” Geochimica et Cosmochimica Acta, vol. 61,no. 2, pp. 323–339, 1997.
[57] D. Rickard, I. B. Butler, and A. Oldroyd, “A novel ironsulphide mineral switch and its implications for earth andplanetary science,” Earth and Planetary Science Letters, vol.189, no. 1-2, pp. 85–91, 2001.
[58] J. F. Allen, “Redox control of transcription: sensors, responseregulators, activators and repressors,” FEBS Letters, vol. 332,no. 3, pp. 203–207, 1993.
[59] M. K. Johnson, “Iron-sulfur proteins,” in Encyclopedia ofInorganic Chemistry, B. B. King, Ed., vol. 4, pp. 1896–1915,Wiley, Chichester, UK, 1996.
[60] H. Beinert, R. H. Holm, and E. Munck, “Iron-sulfur clusters:nature’s modular, multipurpose structures,” Science, vol. 277,no. 5326, pp. 653–659, 1997.
[61] F. Baymann, E. Lebrun, M. Brugna, B. Schoepp-Cothenet,M. T. Giudici-Orticoni, and W. Nitschke, “The redox proteinconstruction kit: pre-last universal common ancestor evolu-tion of energy-conserving enzymes,” Philosophical Transac-tions of the Royal Society B, vol. 358, no. 1429, pp. 267–274,2003.
[62] L. Noodleman and D. A. Case, “Density-functional theory ofspin polarization and spin coupling in iron-sulfur clusters,”

12 Physics Research International
Advances in Inorganic Chemistry, vol. 38, no. C, pp. 423–470,1992.
[63] L. Noodleman, T. Lovell, T. Liu, F. Himo, and R. A.Torres, “Insights into properties and energetics of iron-sulfur proteins from simple clusters to nitrogenase,” CurrentOpinion in Chemical Biology, vol. 6, no. 2, pp. 259–273, 2002.
[64] L. Noodleman, C. Y. Peng, D. A. Case, and J. M. Mouesca,“Orbital interactions, electron delocalization and spincoupling in iron-sulfur clusters,” Coordination ChemistryReviews, vol. 144, pp. 199–244, 1995.
[65] S. E. McGlynn, D. W. Mulder, E. M. Shepard, J. B. Brod-erick, and J. W. Peters, “Hydrogenase cluster biosynthesis:organometallic chemistry nature’s way,” Dalton Transactions,no. 22, pp. 4274–4285, 2009.
[66] M. J. Russell and A. J. Hall, “The emergence of life from ironmonosulphide bubbles at a submarine hydrothermal redoxand pH front,” Journal of the Geological Society, vol. 154, no.3, pp. 377–402, 1997.
[67] M. J. Russell and A. J. Hall, “The onset and early evolution oflife,” in Evolution of Early Earth’s Atmosphere, Hydrosphere,and Biosphere—Constraints from Ore Deposits, S. E. Keslerand H. Ohmoto, Eds., vol. 198, pp. 1–32, Geological Societyof America, 2006.
[68] M. J. Russell, A. J. Hall, and D. Turner, “In vitro growthof iron sulphide chimneys: possible culture chambers fororigin-of-life experiments,” Terra Nova, vol. 1, no. 3, pp. 238–241, 1989.
[69] B. A. Grzybowski, C. E. Wilmer, J. Kim, K. P. Browne, andK. J. M. Bishop, “Self-assembly: from crystals to cells,” SoftMatter, vol. 5, no. 6, pp. 1110–1128, 2009.
[70] M. J. Russell, A. J. Hall, and A. P. Gize, “Pyrite and the originof life,” Nature, vol. 344, no. 6265, p. 387, 1990.
[71] A. J. Boyce, M. L. Coleman, and M. J. Russell, “Formation offossil hydrothermal chimneys and mounds from Silvermines,Ireland,” Nature, vol. 306, no. 5943, pp. 545–550, 1983.
[72] A. J. Boyce, Exhalation, sedimentation and sulphur isotopegeochemistry of the silvermines Zn + Pb + Ba deposits, CountyTipperary, Ireland, Ph.D. thesis, University of Strathclyde,Glasgow, U.K., 1990.
[73] R. C. L. Larter, A. J. Boyce, and M. J. Russell, “Hydrothermalpyrite chimneys from the Ballynoe baryte deposit, Silver-mines, County Tipperary, Ireland,” Mineralium Deposita, vol.16, no. 2, pp. 309–317, 1981.
[74] H. Ohfuji and J. Akai, “Icosahedral domain structure offramboidal pyrite,” American Mineralogist, vol. 87, no. 1, pp.176–180, 2002.
[75] A. S. Keys and S. C. Glotzer, “How do quasicrystals grow?”Physical Review Letters, vol. 99, no. 23, Article ID 235503,2007.
[76] Z. Sawlowicz, “Framboids: from their origin to application,”Prace Mineralogiczne, vol. 88, pp. 1–80, 2000.
[77] A. Preisinger and S. Aslanian, “The formation of framboidalgreigites in the Black Sea,” Geophysical Research Abstracts,vol. 6, Article ID 02702, (SRef-ID: 1607-7962/gra/EGU04-A-02702), 2004.
[78] G. Vitiello, “Coherent states, fractals and brain waves,” NewMathematics and Natural Computation, vol. 5, pp. 245–264,2009.
[79] G. Vitiello, “Fractals and the fock-bargmann representationof coherent states,” in Quantum Interaction, P. Bruza, D. Sofgeet al., Eds., pp. 6–16, Springer, Berlin, Germany, 2009.
[80] Boyce, Exhalation, sedimentation and sulphur isotope geo-chemistry of the Silvermines Zn + Pb + Ba deposits, County
Tipperary, Ireland, Ph.D. thesis, University of Strathclyde,Glasgow, UK, 1990.
[81] G. Nicolis and I. Prigogine, “Symmetry breaking and pat-tern selection in far-from-equilibrium systems,” ProceedingsNational Academy of Sciences, vol. 78, no. 2, pp. 659–663,1981.
[82] G. Wachtershauser, “Before enzymes and templates: theoryof surface metabolism,” Microbiological Reviews, vol. 52, no.4, pp. 452–484, 1988.
[83] S. Duhr and D. Braun, “Thermophoretic depletion followsboltzmann distribution,” Physical Review Letters, vol. 96, no.16, Article ID 168301, 2006.
[84] E. du T. de Lacheisserie, G. Gignoux, and M. Schlenker,Eds., Magnetism—Fundamentals, Springer, Grenoble Sci-ences, 2005.
[85] I. Carmeli, V. Skakalova, R. Naaman, and Z. Vager, “Magneti-zation of chiral monolayers of polypeptide: a possible sourceof magnetism in some biological membranes,” AngewandteChemie, vol. 41, no. 5, pp. 761–764, 2002.
[86] R. Naaman and Z. Vager, “Spin selective electron trans-mission through monolayers of chiral molecules,” Topics inCurrent Chemistry, vol. 298, pp. 237–257, 2011.
[87] R. A. Rosenberg, “Spin-polarized electron induced asym-metric reactions in chiral molecules,” Topics in CurrentChemistry, vol. 298, pp. 279–306, 2011.
[88] M. J. Russell, A. J. Hall, and W. Martin, “Serpentinization asa source of energy at the origin of life,” Geobiology, vol. 8, no.5, pp. 355–371, 2010.
[89] K. D. Kwon, K. Refson, S. Bone et al., “Magnetic orderingin tetragonal FeS: evidence for strong itinerant spin fluctu-ations,” Physical Review B, vol. 83, no. 6, Article ID 064402,2011.
[90] G. Vitiello, “The dissipative brain,” in Brain and Being. At theBoundary between Science, Philosophy, Language and Arts, G.Globus, K. H. Pribram, and G. Vitiello, Eds., pp. 108–129,John Benjamins, Amsterdam, The Netherlands, 2004.
[91] E. del Giudice and G. Preparata, “A new QED pictureof water: understanding a few fascinating phenomena,” inMacroscopic Quantum Coherence, Sassaroli et al., Ed., pp.108–129, World Scientific, Singapore, 1998.
[92] J. L. Kirschvink, A. Kobayashi-Kirschvink, J. C. Diaz-Ricci,and S. J. Kirschvink, “Magnetite in human tissues: a mecha-nism for the biological effects of weak ELF magnetic fields,”Bioelectromagnetics, Supplement, vol. 1, pp. 101–113, 1992.
[93] M. Posfai, P. R. Buseck, D. A. Bazylinski, and R. B. Frankel,“Iron sulfides from magnetotactic bacteria: structure, com-position, and phase transitions,” American Mineralogist, vol.83, no. 11-12, pp. 1469–1481, 1998.
[94] M. Posfai, K. Cziner, E. Marton et al., “Crystal-size distribu-tions and possible biogenic origin of Fe sulfides,” EuropeanJournal of Mineralogy, vol. 13, no. 4, pp. 691–703, 2001.
[95] M. Posfai, B. M. Moskowitz, B. Arato et al., “Properties ofintracellular magnetite crystals produced by Desulfovibriomagneticus strain RS-1,” Earth and Planetary Science Letters,vol. 249, no. 3-4, pp. 444–455, 2006.
[96] J. Reitner, J. Peckmann, A. Reimer, G. Schumann, and V.Thiel, “Methane-derived carbonate build-ups and associatedmicrobial communities at cold seeps on the lower Crimeanshelf (Black Sea),” Facies, vol. 51, no. 1-4, pp. 66–79, 2005.
[97] S. L. Simmons, D. A. Bazylinski, and K. J. Edwards, “South-seeking magnetotactic bacteria in the Northern Hemisphere,”Science, vol. 311, no. 5759, pp. 371–374, 2006.
Physics Research International 13
[98] J. L. Kirschvink, M. M. Walker, and C. E. Diebel, “Magnetite-based magnetoreception,” Current Opinion in Neurobiology,vol. 11, no. 4, pp. 462–467, 2001.
[99] J. L. Kirschvink and J.W. Hagadorn, “10 A grand unified the-ory of biomineralization,” in Biomineralization, E. Bauerlein,Ed., pp. 139–150, Wiley-VCH Verlag GmbH, Weinheim,Germany, 2000.
[100] M. Winklhofer and J. L. Kirschvink, “A quantitative assess-ment of torque-transducer models for magnetoreception,”Journal of the Royal Society Interface, vol. 7, no. 2, pp. S273–S289, 2010.
[101] R. E. Kopp and J. L. Kirschvink, “The identification and bio-geochemical interpretation of fossil magnetotactic bacteria,”Earth-Science Reviews, vol. 86, no. 1–4, pp. 42–61, 2008.
[102] Z. Merali, “Was life forged in a quantum crucible?” NewScientist, vol. 196, no. 2633, pp. 6–7, 2007.
[103] A. Patel, “Quantum algorithms and the genetic code,”Pramana, vol. 56, no. 2-3, pp. 367–381, 2001.
[104] N. Haydon, S. E. McGlynn, and O. Robus, “Speculationon quantum mechanics and the operation of life givingcatalysts,” Origins of Life and Evolution of Biospheres, vol. 41,no. 1, pp. 35–50, 2011.
[105] J. T. Trevors and L. Masson, “Quantum microbiology,”Current Issues in Molecular Biology, vol. 13, pp. 43–50, 2011.
Hindawi Publishing CorporationPhysics Research InternationalVolume 2012, Article ID 794171, 5 pagesdoi:10.1155/2012/794171
Research Article
Tailoring of Magnetocaloric Effect in Ni45.5Mn43.0In11.5
Metamagnetic Shape Memory Alloy
W. O. Rosa,1, 2 L. Gonzalez,1 J. Garcıa,1 T. Sanchez,1 V. Vega,1 Ll. Escoda,3 J. J. Sunol,3
J. D. Santos,1 M. J. P. Alves,2 R. L. Sommer,2 V. M. Prida,1 and B. Hernando1
1 Departamento de Fısica, Universidad de Oviedo, Calvo Sotelo s/n, 33007 Oviedo, Spain2 Centro Brasileiro de Pesquisas Fısicas, Rua Dr. Xavier Sigaud, 150, Urca, 22290-180 Rio de Janeiro RJ, Brazil3 Girona University, Campus Montilivi, ed. PII, Lluıs Santalo s/n, 17003 Girona, Spain
Correspondence should be addressed to W. O. Rosa, [email protected]
Received 2 August 2011; Revised 7 November 2011; Accepted 7 November 2011
Academic Editor: Manh-Huong Phan
Copyright © 2012 W. O. Rosa et al. This is an open access article distributed under the Creative Commons Attribution License,which permits unrestricted use, distribution, and reproduction in any medium, provided the original work is properly cited.
We investigate the direct and inverse magnetocaloric effect in Ni45.5Mn43.0In11.5 Heusler alloy ribbons comparing the resultsobtained for the as-quenched sample with the ones after different annealing procedures. An enhancement and shift of the entropymaximum to near room temperature is observed in all annealed samples. A remarkable magnetocaloric effect is observed insamples with short-time treatment (10 minutes) and at the lowest annealing temperature. We show that the suppressing ofuncompensated martensitic transition and thermal hysteresis are both influenced by the heat treatment. Also, an improvementon Curie’s temperature is observed and, at low magnetic field, it has been risen up to 310 K. Our results demonstrate that themartensitic transformation is highly sensitive to the applied magnetic field and also to the annealing treatment, which means thatthe magnetocaloric effect can be tuned showing different behaviors for each sample.
1. Introduction
Many first-order phase transition materials have been foundto exhibit giant magnetocaloric effect (MCE) [1–3]. Cur-rently, the search for a cheap magnetic material whichexhibit a large MCE that works in the temperature rangeof 100 up to 300 K for a magnetic field variation of ΔH =10 kOe is carried out. The most extensively studied Heusleralloys have those of the Ni-Mn-Ga system, neverthelessto overcome some of the problems related with practicalapplications (such as the high cost of Gallium and theusually low martensitic transformation temperature), thesearch for Ga-free alloys has been recently attempted. Inorder to reduce such costs and to improve the martensitictransition temperature, the substitution of Ga is proposedand, in particular, by introducing In or Sn [4–7].
These ferromagnetic shape memory alloys (FSMA)exhibit ferromagnetic and shape memory effect simul-taneously. The ferromagnetic shape memory effect canbe controlled by temperature, stress, and by magneticfield. Recently, Ni-Mn-In Heusler alloys have drawn much
attention due to their potential as ferromagnetic shapememory alloys, which undergo a thermoelastic martensitictransformation (MT) from parent austenitic phase to amartensitic one on cooling [8]. These alloys exhibit notablesensitivity of MT to the applied magnetic field, they seemto be among the most suitable for the room temperature(RT) applications for example, in micro and nanomechanicsdevices and in alternative energy technologies, due to thegiant magnetocaloric effect (MCE) observed in this alloys[9, 10]. Moreover, some authors have reported that suchFSMAs also present giant magnetoresistance (GMR) due tothe first-order phase transition, which can undergo a GMRvariation of around 80% [11].
In this work, we present the influence of differentannealing treatments on the martensitic transition andmagnetic entropy change in a nonstoichiometric Ni-Mn-InHeusler alloy ribbon in order to tailor the MCE around RT.These alloys are of particular interest due to the existenceof both direct and inverse magnetocaloric effect in a rathernarrow temperature interval. The value of the entropy
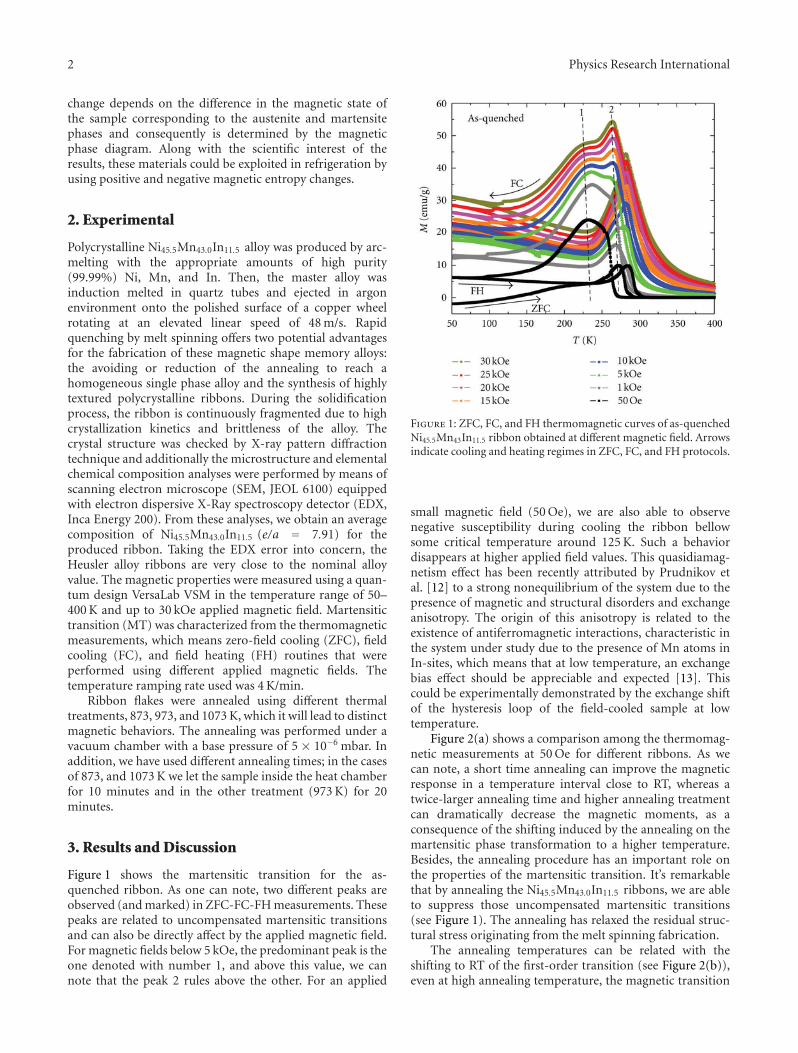
2 Physics Research International
change depends on the difference in the magnetic state ofthe sample corresponding to the austenite and martensitephases and consequently is determined by the magneticphase diagram. Along with the scientific interest of theresults, these materials could be exploited in refrigeration byusing positive and negative magnetic entropy changes.
2. Experimental
Polycrystalline Ni45.5Mn43.0In11.5 alloy was produced by arc-melting with the appropriate amounts of high purity(99.99%) Ni, Mn, and In. Then, the master alloy wasinduction melted in quartz tubes and ejected in argonenvironment onto the polished surface of a copper wheelrotating at an elevated linear speed of 48 m/s. Rapidquenching by melt spinning offers two potential advantagesfor the fabrication of these magnetic shape memory alloys:the avoiding or reduction of the annealing to reach ahomogeneous single phase alloy and the synthesis of highlytextured polycrystalline ribbons. During the solidificationprocess, the ribbon is continuously fragmented due to highcrystallization kinetics and brittleness of the alloy. Thecrystal structure was checked by X-ray pattern diffractiontechnique and additionally the microstructure and elementalchemical composition analyses were performed by means ofscanning electron microscope (SEM, JEOL 6100) equippedwith electron dispersive X-Ray spectroscopy detector (EDX,Inca Energy 200). From these analyses, we obtain an averagecomposition of Ni45.5Mn43.0In11.5 (e/a = 7.91) for theproduced ribbon. Taking the EDX error into concern, theHeusler alloy ribbons are very close to the nominal alloyvalue. The magnetic properties were measured using a quan-tum design VersaLab VSM in the temperature range of 50–400 K and up to 30 kOe applied magnetic field. Martensitictransition (MT) was characterized from the thermomagneticmeasurements, which means zero-field cooling (ZFC), fieldcooling (FC), and field heating (FH) routines that wereperformed using different applied magnetic fields. Thetemperature ramping rate used was 4 K/min.
Ribbon flakes were annealed using different thermaltreatments, 873, 973, and 1073 K, which it will lead to distinctmagnetic behaviors. The annealing was performed under avacuum chamber with a base pressure of 5 × 10⁻⁶ mbar. Inaddition, we have used different annealing times; in the casesof 873, and 1073 K we let the sample inside the heat chamberfor 10 minutes and in the other treatment (973 K) for 20minutes.
3. Results and Discussion
Figure 1 shows the martensitic transition for the as-quenched ribbon. As one can note, two different peaks areobserved (and marked) in ZFC-FC-FH measurements. Thesepeaks are related to uncompensated martensitic transitionsand can also be directly affect by the applied magnetic field.For magnetic fields below 5 kOe, the predominant peak is theone denoted with number 1, and above this value, we cannote that the peak 2 rules above the other. For an applied
Figure 1: ZFC, FC, and FH thermomagnetic curves of as-quenchedNi45.5Mn43In11.5 ribbon obtained at different magnetic field. Arrowsindicate cooling and heating regimes in ZFC, FC, and FH protocols.
small magnetic field (50 Oe), we are also able to observenegative susceptibility during cooling the ribbon bellowsome critical temperature around 125 K. Such a behaviordisappears at higher applied field values. This quasidiamag-netism effect has been recently attributed by Prudnikov etal. [12] to a strong nonequilibrium of the system due to thepresence of magnetic and structural disorders and exchangeanisotropy. The origin of this anisotropy is related to theexistence of antiferromagnetic interactions, characteristic inthe system under study due to the presence of Mn atoms inIn-sites, which means that at low temperature, an exchangebias effect should be appreciable and expected [13]. Thiscould be experimentally demonstrated by the exchange shiftof the hysteresis loop of the field-cooled sample at lowtemperature.
Figure 2(a) shows a comparison among the thermomag-netic measurements at 50 Oe for different ribbons. As wecan note, a short time annealing can improve the magneticresponse in a temperature interval close to RT, whereas atwice-larger annealing time and higher annealing treatmentcan dramatically decrease the magnetic moments, as aconsequence of the shifting induced by the annealing on themartensitic phase transformation to a higher temperature.Besides, the annealing procedure has an important role onthe properties of the martensitic transition. It’s remarkablethat by annealing the Ni45.5Mn43.0In11.5 ribbons, we are ableto suppress those uncompensated martensitic transitions(see Figure 1). The annealing has relaxed the residual struc-tural stress originating from the melt spinning fabrication.
The annealing temperatures can be related with theshifting to RT of the first-order transition (see Figure 2(b)),even at high annealing temperature, the magnetic transition

Physics Research International 3
50 100 150 200 250 300 350 4000
10
2030
4050
60
T (K)
ΔH = 50 Oe
M(e
mu
/g)
(a)
50 100 150 200 250 300 350 400
T (K)
ΔH = 30 kOe
As-quenchedAnnealed (873 K)
Annealed (973 K)
Annealed (1073 K)
010203040506070
M(e
mu
/g)
(b)
Figure 2: Temperature dependence of magnetization of as-quenched and annealed Ni45.5Mn43.0In11.5 ribbons at 873 K, 973 K,and 1073 K obtained at a field of 50 Oe (a) and 30 kOe (b).
cannot be observed in the temperature range of 50–400 K foran applied magnetic field of 30 kOe. Other feature relatedto the different annealing temperatures is the reduction ofthe thermal hysteresis. In this case, as higher the annealingtemperature, smaller is the thermal hysteresis.
This behavior could be explained by the annealinginfluence due to the increase in the grain size and crystaldefects, along with the variation of internal stresses inducedduring the quenching process. It is also worth mentioningthat the excess of Mn atoms, in this non stoichiometricHeusler alloy, are located in different sites leading toexchange interactions very sensitive to the Mn—Mn distancethat could be modified by the annealing process.
The evaluation of the magnetocaloric effect has beenestimated by the entropy variation, which was calculatedusing the Maxwell’s relation [14]
ΔSM(T)H =∫ H
0
[∂M(T)∂T
]HdH , (1)
where ∂M/∂T is obtained directly from thermomagneticmeasurements (ZFC-FC-FH). Such route to perform thecalculations makes their accuracy improved since there isno need to extrapolate points, like in the case of isothermalcurves, therefore the derivatives of thermomagnetic mea-surements are directly proportional to the entropy variation.
Figure 3 shows the entropy variation for ribbons withdifferent annealing procedures. A very remarkable improve-ment is seen in the ribbon annealed for 10 minutes at873 K. The entropy variation in this case had shown anenhancement on the order of 5 times higher than in theas-quenched ribbon, which is a dramatic feat. In addition,
the temperature value at which the inverse magnetocaloriceffect achieves its maximum is shifted from 276 K up to284 K in this case. Thus, this first annealing is provedto be able to enhance the inverse magnetocaloric effectand shift the temperature where its maximum occurs by8 K. The annealed ribbon at 973 K presents practically thesame entropy variation as the as-quenched one, nonetheless,the temperature where the inverse magnetocaloric effectachieves its maximum is, in this case, in the range of RTachieving a value of 307 K. Hence, we obtain using suchannealing procedure an impressive temperature shift by31 K, nevertheless, the inverse magnetocaloric effect is notenhanced like in the previous case. Finally, at 1073 K, it isobserved that the entropy variation decreases drastically andthe inverse magnetocaloric effect reaches its maximum at386 K, well above the RT, but the effect is not improvedcomparing with the other cases. Other feature that is alsoobserved in the sample annealed at 1073 K is the factthat the magnetic phase transition from ferromagnetic toparamagnetic is not displayed since such thermal treatmentshifts the Curie temperatures to a higher value, which isfound to be above 400 K and, then, we are not able to seethis transition due to our equipment limitation.
The refrigerant capacity (q) is defined by [15]
q =∫ T2
T1
ΔS(T)HdT , (2)
where T1 and T2 are the temperatures of cold and hotreservoir of the refrigeration cycle, respectively. The valueof q can be obtained by performing the integration overthe full width at half maximum (FWHM) in a ΔS-T curve,according to literature [16]. The different thermally treatedribbons display different refrigerant capacities being 54.8 J/kg(as-quenched), 163.6 J/kg (873 K), 44.6 J/kg (973 K), and17.6 J/kg (1073 K). Comparing the entropy variation for as-quenched and annealed at 973 K, one should expect thatthe refrigerant capacities would be similar. However, thepresence of uncompleted martensitic transformation in as-quenched ribbon produces a broader entropy peak and thusthe increasing in the refrigerant capacity in such sample.In fact, this reduction in the refrigerant capacity for thesample annealed at 973 K is also due to the range ofworking temperatures T1 and T2 that, in such specific case, isnarrower than all the previous samples, reducing the workingtemperature interval. For another annealed ribbon (873 K),the refrigerant capacity was rather increased comparing tothe other two. An improvement of around 70% has beenobserved.
4. Conclusions
In conclusion, we have studied the magnetostructural andmagnetocaloric properties of a Ni45.5Mn43.0In11.5 ferromag-netic shape memory alloy with ribbon shape and the effectof different annealing treatments. The short annealing at873 K proved to be the best choice to achieve a high entropyvariation, however, the other annealings, at 973 and 1073 K,showed to be very efficient to shift the martensitic transition
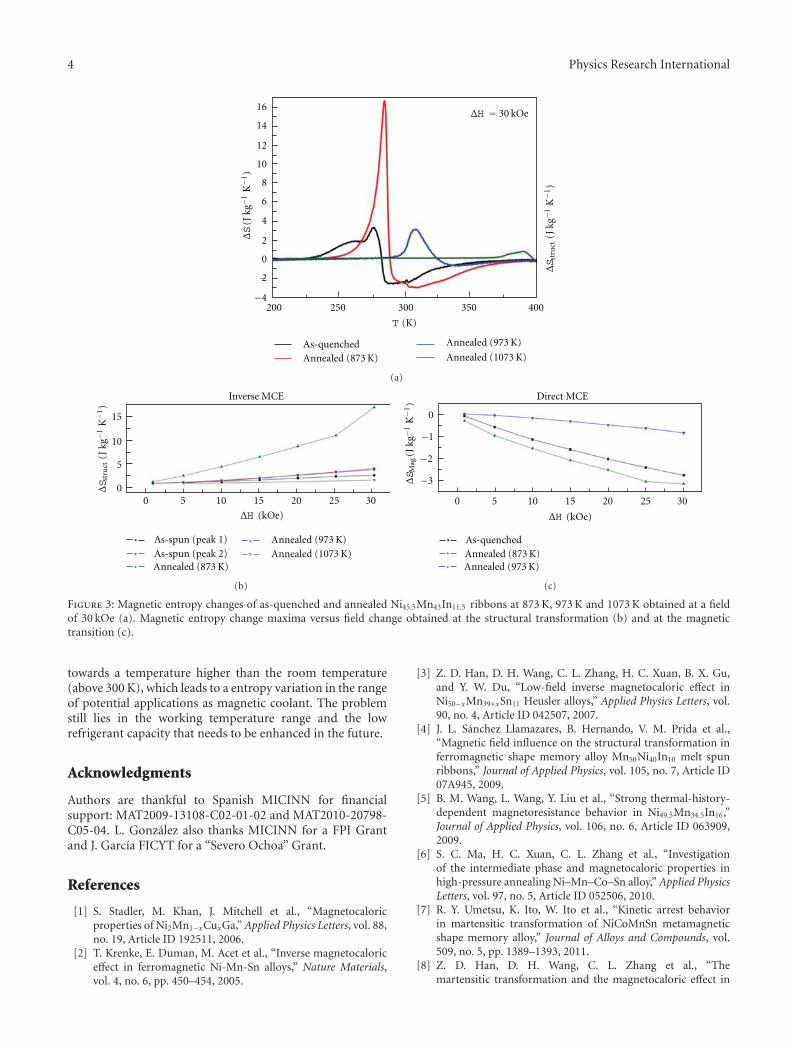
4 Physics Research International
−4
−20
2
4
6
8
10
12
14
16
200 250 300 350 400
ΔS
(J k
g−1
K−1
)
T (K)
ΔH = 30 kOe
As-quenchedAnnealed (873 K)
Annealed (973 K)
Annealed (1073 K)
ΔS s
tru
ct(J
kg−
1K−1
)
(a)
0
5
10
15
0 5 10 15 20 25 30
Inverse MCE
As-spun (peak 1)
As-spun (peak 2)
ΔH (kOe)
ΔS s
tru
ct(J
kg−
1K−1
)
Annealed (873 K)
Annealed (973 K)
Annealed (1073 K)
(b)
0 5 10 15 20 25 30
As-quenched
ΔS M
ag(J
kg−
1K−1
)
Annealed (873 K)Annealed (973 K)
−3
−2
−1
0
Direct MCE
ΔH (kOe)
(c)
Figure 3: Magnetic entropy changes of as-quenched and annealed Ni45.5Mn43In11.5 ribbons at 873 K, 973 K and 1073 K obtained at a fieldof 30 kOe (a). Magnetic entropy change maxima versus field change obtained at the structural transformation (b) and at the magnetictransition (c).
towards a temperature higher than the room temperature(above 300 K), which leads to a entropy variation in the rangeof potential applications as magnetic coolant. The problemstill lies in the working temperature range and the lowrefrigerant capacity that needs to be enhanced in the future.
Acknowledgments
Authors are thankful to Spanish MICINN for financialsupport: MAT2009-13108-C02-01-02 and MAT2010-20798-C05-04. L. Gonzalez also thanks MICINN for a FPI Grantand J. Garcıa FICYT for a “Severo Ochoa” Grant.
References
[1] S. Stadler, M. Khan, J. Mitchell et al., “Magnetocaloricproperties of Ni2Mn1−xCuxGa,” Applied Physics Letters, vol. 88,no. 19, Article ID 192511, 2006.
[2] T. Krenke, E. Duman, M. Acet et al., “Inverse magnetocaloriceffect in ferromagnetic Ni-Mn-Sn alloys,” Nature Materials,vol. 4, no. 6, pp. 450–454, 2005.
[3] Z. D. Han, D. H. Wang, C. L. Zhang, H. C. Xuan, B. X. Gu,and Y. W. Du, “Low-field inverse magnetocaloric effect inNi50−xMn39+xSn11 Heusler alloys,” Applied Physics Letters, vol.90, no. 4, Article ID 042507, 2007.
[4] J. L. Sanchez Llamazares, B. Hernando, V. M. Prida et al.,“Magnetic field influence on the structural transformation inferromagnetic shape memory alloy Mn50Ni40In10 melt spunribbons,” Journal of Applied Physics, vol. 105, no. 7, Article ID07A945, 2009.
[5] B. M. Wang, L. Wang, Y. Liu et al., “Strong thermal-history-dependent magnetoresistance behavior in Ni49.5Mn34.5In16,”Journal of Applied Physics, vol. 106, no. 6, Article ID 063909,2009.
[6] S. C. Ma, H. C. Xuan, C. L. Zhang et al., “Investigationof the intermediate phase and magnetocaloric properties inhigh-pressure annealing Ni–Mn–Co–Sn alloy,” Applied PhysicsLetters, vol. 97, no. 5, Article ID 052506, 2010.
[7] R. Y. Umetsu, K. Ito, W. Ito et al., “Kinetic arrest behaviorin martensitic transformation of NiCoMnSn metamagneticshape memory alloy,” Journal of Alloys and Compounds, vol.509, no. 5, pp. 1389–1393, 2011.
[8] Z. D. Han, D. H. Wang, C. L. Zhang et al., “Themartensitic transformation and the magnetocaloric effect in
Physics Research International 5
Ni50−xMn38+xIn12 alloys,” Solid State Communications, vol.146, no. 3-4, pp. 124–127, 2008.
[9] W. Ito, Y. Imano, R. Kainuma, Y. Sutou, K. Oikawa, and K.Ishida, “Martensitic and magnetic transformation behaviorsin Heusler-type NiMnIn and NiCoMnIn metamagnetic shapememory alloys,” Metallurgical and Materials Transactions A,vol. 38, no. 4, pp. 759–766, 2007.
[10] B. Hernando, J. L. Sanchez Llamazares, V. M. Prida et al.,“Magnetocaloric effect in preferentially textured Mn50Ni40In10
melt spun ribbons,” Applied Physics Letters, vol. 94, no. 22,Article ID 222502, 2009.
[11] S. Y. Yu, Z. H. Liu, G. D. Liu et al., “Large magnetoresistancein single-crystalline Ni50 Mn50−xInx alloys (x= 14−16) uponmartensitic transformation,” Applied Physics Letters, vol. 89,no. 16, Article ID 162503, 2006.
[12] V. N. Prudnikov, A. P. Kazakov, I. S. Titov et al., “Quasi-diamagnetism and exchange anisotropy in Ni-Mn-In-CoHeusler alloys,” Physics of the Solid State, vol. 53, no. 3, pp.490–493, 2011.
[13] X. G. Zhao, C. C. Hsieh, J. H. Lai et al., “Effects of annealingon the magnetic entropy change and exchange bias behaviorin melt-spun Ni-Mn-In ribbons,” Scripta Materialia, vol. 63,no. 2, pp. 250–253, 2010.
[14] T. Hashimoto, T. Numasawa, M. Shino, and T. Okada, “Mag-netic refrigeration in the temperature range from 10 K to roomtemperature: the ferromagnetic refrigerants,” Cryogenics, vol.21, no. 11, pp. 647–653, 1981.
[15] K. A. Gschneidner, V. K. Pecharsky, A. O. Pecharsky, and C.B. Zimm, “Recent developments in magnetic refrigeration,”Materials Science Forum, vol. 315-317, pp. 69–76, 1999.
[16] D. L. Schlagel, W. M. Yuhasz, K. W. Dennis, R. W. McCal-lum, and T. A. Lograsso, “Temperature dependence of thefield-induced phase transformation in Ni50Mn37Sn13,” ScriptaMaterialia, vol. 59, no. 10, pp. 1083–1086, 2008.

Hindawi Publishing CorporationPhysics Research InternationalVolume 2012, Article ID 323279, 8 pagesdoi:10.1155/2012/323279
Research Article
Correlation between the Magnetoresistance,IR Magnetoreflectance, and Spin-Dependent Characteristics ofMultilayer Magnetic Films
V. G. Kravets
Institute for Information Recording, National Academy of Sciences of Ukraine, 2 Shpak Street, Kiev 03113, Ukraine
Correspondence should be addressed to V. G. Kravets, vasyl [email protected]
Received 27 July 2011; Accepted 25 October 2011
Academic Editor: Manh-Huong Phan
Copyright © 2012 V. G. Kravets. This is an open access article distributed under the Creative Commons Attribution License, whichpermits unrestricted use, distribution, and reproduction in any medium, provided the original work is properly cited.
We present the experimental results on magnetorefractive effect (MRE) in ferromagnetic metal-metal and metal-insulator multi-layer films of different composition and different type of magnetoresistive effects. The shape and magnitude of the MRE depend-ences are found to be very sensitive to the spin-dependent scattering parameters and the effective polarization of the electrondensity of state around the Fermi level. A study of an MRE in multilayered films is shown to be sufficient for direct extracting ofthe spin-dependent relaxation times of electron (for GMR-like samples) and energy dependence of the tunnel spin-polarizationdensity of states near the Fermi level for layered TMR films. It is proposed to use the magnetorefractive effect as a noncontact probeof magnetoresistive effects in thin magnetic films through investigations of the field-dependent reflection behaviors of multilayeredfilms in the IR region.
1. Introduction
The discovery [1, 2] of the giant magnetoresistance (GMR)effect has led to many technological applications, especiallyin data storage devices such as GMR read heads, magne-toresistive random access memory, and in magnetic sensors[3, 4]. The GMR effect reflects changes in resistivity as resultof spin-dependent scattering of two spin channels acrossthe interfaces between the magnetic and nonmagnetic metallayers (i.e., GMR effect) or magnetic and insulating layers(i.e., tunneling magnetoresistance) [5]. The key property ofthese materials is the reduction of their electrical resistivityin magnetic field. Tunneling magnetoresistance effect (TMR)draws much attention for its fascinating transport propertiesand industrial applications [4, 5].
The most common method of measuring magnetoresis-tance (MR) involves passing an electrical current through thesample via a four-point probe. On the other hand, Jacquetand Valet [6] proposed and demonstrated an alternativenoncontact method for the measurement of magnetotrans-port effects using electromagnetic radiation of infrared (IR)spectral region. It relies on the fact that at IR wavelengths
the optical properties in metals depend mainly on electrontransition within the conduction band (intraband transi-tions). The method is based on the magnetorefractive effect(MRE). The MRE is the variation of the complex refractiveindex (dielectric function) of a material due to a change inits conductivity at IR frequencies when a magnetic field isapplied. MRE opens a new stage in magnetooptics (MO)because it is not connected with spin-orbit interaction. MREis an even MO effect, namely, it is linear with magnetizationsquared, like GMR. Moreover, the MRE is sufficiently largerin the IR region than the corresponding MO values [6–8].Infrared transmission or reflection spectroscopy can providea direct tool for probing the spin-dependent conductivity inGMR and TMR samples [6–11].
The MRE of ferromagnetic/nonmagnetic metal multi-layer and granular films has been a field of intensive studiesover the last decade. This interest in MRE was motivatedby three aspects: (i) its importance as an experimentalnoncontact (in situ) magnetoresistance tool, (ii) its being ameans of measuring the spin-dependent characteristics offerromagnetic (FM) materials, and (iii) its application inmagnetooptical crystal. The main advantages of the MRE

2 Physics Research International
over other techniques are following: (i) the surface sensitivitywith typical information depth of ∼10–30 nm; (ii) a timeresolution can be down to the subpicosecond regime [6, 8];(iii) a reasonable spatial resolution tends to ∼1–10 μm [6,11]; (iv) using robust and inexpensive experimental setups.
The full quantitative MRE information is generally notlinked by simple analytic formulas to the material properties,which are the dielectric function of all involved layers andtheir GMR or TMR values. Moreover, the literature is al-most exclusively limited to the MRE in multilayer and granu-lar films with GMR effect. The magnetotransport character-ization of metal-dielectric multilayers (TMRs) is more dif-ficult than continuous metallic multilayer (GMR), and hencethere is a great tendency to develop a noncontact methodfor studying their electrical behaviors. The spin-dependentcharacteristics extracted from modeling of the MRE are alsoimportant in fundamental research. From a microscopicpoint of view the MRE in layered TMR films is due to theinterplay of the exchange interaction leading to a splitting ofthe bands and the spin-dependent density of states aroundthe Fermi level.
In this work we have measured the MRE of CoFe/Cumultilayer films with GMR effect and of CoFe/Al2O3 filmswith TMR effect. Measurements are made in reflection modewhich is the most likely mode for practical remote sensingof magnetoresistance effects. The good agreement at middleIR wavelengths between electrical magnetotransport mea-surements and noncontact magnetorefractive effect demon-strates the possibilities of using IR reflection spectroscopyfor the characterization of giant magnetoresistive systems.We have chosen the multilayer structures with low values ofmagnetoresistance for checking the sensitivity of magnetore-fractive effect. It was shown that the spin-dependent scat-tering times τ↑ and τ↓ (or mean free path) of majority andminority electrons can be directly extracted from the MREdependences in the IR region. We also demonstrate how alow-energy spectrum of the tunnel spin-dependent densityof states around of the Fermi level for layered TMR filmscan be reconstructed from its magnetoreflective spectrum.This can be done by modeling the MRE dependences as aneffective polarization, Peff(E), and extracting the optical con-ductivities of the different layers from the reflection spectra.Our results demonstrate direct schedule for obtaining theenergy dependence of the spin-polarization density of statesnear the Fermi level.
2. Experimental Techniques
The choice of the CoFe/Cu(Al2O3)-based film structures wasmotivated by the fact that spin polarization of the CoFealloy exceeds those in Co and Fe, while nonmagnetic Cudemonstrates excellent electrical conductivity and insulatingAl2O3 provides a low tunneling barrier and high values of theTMR. The multilayer films were prepared by dc magnetronsputtering at ∼10−4 Torr Ar gas pressure. The films were de-posited on glass and Si substrates using two targets of CoFeand Cu or Al2O3. For the ferromagnetic layers we usedCo75Fe25 target which is a soft magnetic alloy. The roomtemperature GMR was measured using standard four-point
probe technique in magnetic fields of up to 8 kOe withboth current and applied magnetic field H in the filmsplane. For TMR measurements a 50 nm thick CoFe layer wasdeposited onto glass (Si) substrates in the form of stripe 10×20 mm2. Then the [CoFe(1.6 nm)/Al2O3(3 nm)]10 multi-layer structures were sputtered onto the center of the CoFe(50 nm) film in form of stripe 10×10 mm2. On top of devicessecond electrode CoFe (50 nm) was formed in the rectangu-lar shape 10 × 20 mm2 perpendicular to the long axis ofthe first thick CoFe layer. In process of TMR measurementsthe magnetic field was oriented perpendicular to the currentdirection and parallel to the film plane.
A Bruker IFS 113 Fourier transform spectrometer wasemployed to study reflectance spectra of multilayer struc-tures at 300 K in the mid-IR range from 2.0 to 25 μm. TheIR radiation was focused onto the sample placed in theelectromagnet gap. The magnetoreflectance was determinedby analogy with the magnetoresistive effect: Δρ/ρ = (ρ(H)−ρ(H = 0))/ρ(H = 0), and ΔR/R = (R(H) − R(H = 0))/R(H = 0). These functions describe the changes in the elec-trical resistivity Δρ/ρ and light reflectivity ΔR/R of a materialin an external magnetic field. The magnetic field was orientedperpendicular to the IR propagation direction and parallel tothe film plane. The magnetic field strength was varied from 0to 4.0 kOe. The angle of incidence of light on the sample wasclosed to ∼45◦. The incoming light was polarized in plane ofincidence (p-polarization) using a KRS-5 grid polarizer. TheIR reflection spectra were taken for all samples at least 100scans in the spectral range 2.0–25 μm and with resolution of4 cm−1.
3. Experimental Results and Their Discussions
The MRE spectra of the [CoFe(2 nm)/Cu(1.2 nm)]10 mul-tilayers are presented in Figure 1(a). These spectra have abroad positive peak at short wavelengths (2–6 μm) followedby a crossover into a reduced reflection region resulting innegative MRE at longer wavelengths. ΔR/R spectra of CoFe/Cu multilayer films reveal deep minima at λ ∼ 20-21μm(Figure 1(a)). As the magnetic field increases from 1.2 to3.75 kOe, ΔR/R grows in absolute magnitude nonlinearlyfrom ∼0.3 to ∼1.1%. The decrease of the reflectivity in anapplied magnetic field is consistent with the increase in elec-trical conductivity resulting from the magnetically inducedmodification of the scattering of the Drude-like free elec-trons. The lowest value of the MRE spectrum located ata wavelength λ ∼ 20.7μm, which is far away from theshort wavelength region where interband transitions are im-portant.
Figure 1(b) shows the dependence of MRE for[CoFe(1.6 nm)/Al2O3(3 nm)]10 multilayer films. The MREgoes down with increasing wavelength of the incident IRprobe light and reaches the maximal negative value at wave-lengths λ ∼ 13-14μm. It can be seen that absolute value ofthe MRE tends to value of ∼0.5% in the magnetic field ofH = 3.75 kOe. Note that the MRE demonstrates a nonlineardependence on the magnetic field H and the function ΔR/Rbecomes positive (changes its sign) in the low wavelengthregion 2.0–5 μm due to contribution of the interband

Physics Research International 3
5 10 15 20 25
0
0.2
0.4
0.6
−1.2
−0.8
−0.6
−0.4
−0.2
−1
Wavelength (μm)
ΔR/R
(%)
H = 1.2 kOe
H = 2.5 kOe
H = 3.57 kOe
(a)
5 10 15 20 2530
40
50
60
70
R(%
)
Wavelength (μm)
5 10 15 20 25
Wavelength (μm)
H = 1.2 kOe
H = 2.5 kOe
H = 3.57 kOe
0
0.1
0.2
−0.5
−0.1
−0.4
−0.3
−0.2
ΔR/R
(%)
(b)
Figure 1: The experimental MRE spectra for [CoFe(2 nm)/Cu(1.2 nm)]10 (a) and [CoFe(1.6 nm)/Al2O3(3 nm)]10 (b) multi-layer films, H = 1.2, 2.5, and 3.75 kOe. Inset of (b): the IR reflectionspectra of the CoFe/Al2O3 multilayer films.
electron transitions. Thus, the competition between the in-traband and interband contributions leads to a change ofsign of MRE as a function of wavelength. This experimentalfact contradicts to the predictions of the Drude model [6–10], where the intraband contribution into the conductivityis considered only. Due to such contribution the MRE curvealways keeps the same sign. It means that the main mech-anism of electron transport in the metal-metal and metal-insulating multilayer structures is the s-d exchange scattering[5]. The shape of the MRE curves as a function of wavelengthis therefore sensitive to the s- and d-dependent electronscattering parameters, which determine the GMR and TMReffects.
The IR reflection spectra of the CoFe/Al2O3 multilayerfilms (inset of Figure 1(b)) display the complex structure as-sociated with the phonon vibrations in oxide layers. For thespectral region 5–20 μm the reflectivity R(λ) of multilayersbecomes similar to the spectrum of the pure Al2O3. Rest-strahlen band of high reflectivity between ∼5 and 20 μm isvisible. R(λ) spectra show pronounced features at λ ∼ 5.0–7.5 and 17-18μm which can be assigned to the longitudinaloptical (LO) and transverse optical (TO) vibration modesof aluminium oxide which is in agreement with previousstudies [11]. It should be pointed out that the value of λLO,where the reflectivity tends to its minimum, is shifted tolower wavelengths with respect to Al2O3, and the reflectivitybetween LO and TO modes does not reaches the value R ≈100%.
Figure 2 shows the high correlation between the electricalmeasured GMR (TMR) and the optically measured MRE forCoFe/Cu and CoFe/Al2O3 multilayer films. The differencesin the nonmagnetic layer Cu or Al2O3 lead to differentvalues of the magnetoresistive effect (Figure 2(a)). Themaximum value of magnetoresistance of about ∼12.5% and∼2.5% in the magnetic field H = 8.2 kOe is observedfor CoFe/Cu and CoFe/Al2O3 multilayer films, respectively.The measurements of the MRE profiles were carried outat fixed wavelength when the magnetoreflectance reaches amaximum. The experiment was performed by direct record-ing of the changes in the reflected intensity as a functionof applied magnetic field at λ ∼ 20.7μm and λ ∼ 13.5μmfor CoFe/Cu and CoFe/Al2O3 multilayer films, respectively(Figure 2(b)). It has been previously shown [9, 11] that thecorrelation between the GMR and MRE should be most evi-dent at extreme wavelengths where the MRE reproduces themaximum values. These dependences (Figures 2(a) and 2(b))clearly show the possibility to perform noncontact magneto-transport measurements on the samples with giant and tun-neling magnetoresistance by measuring the variation of theirreflected intensity in magnetic field at fixed wavelength, λ.Note that the absolute magnitude of MRE in CoFe/Cu multi-layer films is higher than that in CoFe/Al2O3 films and thistrend is consistent with GMR (TMR) dependences.
4. Theoretical Treatments
4.1. MRE Effect in Metallic Magnetoresistive Samples withGMR. To interpret our results we have performed simula-tions of the MRE for two different systems and their depend-ence on the scattering and carries characteristics of the differ-ent type of magnetoresistance. The calculations of the reflec-tion, transmission, and absorption spectra are performedusing a 2 × 2 characteristic transfer matrix for N numberof parallel, homogeneous, isotropic layers [13]. This formal-ism takes into account the multiple reflections on the inter-faces of the multilayer film and could also be used tocalculate the MRE in different multilayer structures. Theoptical response of every layer describes by a complexeffective index of refraction. We have simulated the MRE of[CoFe(2 nm)/Cu(1.2 nm)]10 multilayers using the frequen-cy- and spin-dependent conductivity for FM film. Con-ductivity σ(ω) of the FM layer is a sum of the Drude

4 Physics Research International
0 6 8
0
−2−14
−12
−10
−8
−6
−4
−2
2 4
H (kOe)
Δ/
(%)
CoFe/Al2O3
CoFe/Cu
(a)
CoFe/Al2O3
CoFe/Cu
0 3 4
0
1 2
H (kOe)
−1
−0.8
−0.6
−0.4
−0.2
ΔR/R
(%)
(b)
Figure 2: (a) The experimental Δρ/ρ data of [CoFe(2 nm)/Cu(1.2 nm)]10 and [CoFe(1.6 nm)/Al2O3(3 nm)]10 multilayer films;(b) measured MRE versus magnetic field at fixed wavelength (λ =20.7μm) for [CoFe(2 nm)/Cu(1.2 nm)]10 and (λ = 13.5μm) for[CoFe(1.6 nm)/Al2O3(3 nm)]10 multilayer films.
contributions from majority- and minority-spin electrons[7, 8, 14]:
σ(ω) = σ↑(ω) + σ↓(ω) = σ↑(ω = 0)1 + iωτ↑
+σ↓(ω = 0)1 + iωτ↓
(1)
in which σ↑(↓)(ω = 0) and τ↑(↓) are the spin-dependent dcconductivity and relaxation times, respectively. This conduc-tivity is given by σ↑(↓)(ω = 0) = n↑(↓)e2τ↑(↓)/m, wheren↑(↓) are spin-dependent conduction electron density andm is the mass of an electron. In ferromagnetic alloy CoFeelectronic bands are exchange split, which implies different
Fermi wavevectors for the spin-up and spin-down electrons,k↑(↓)F . The values k↑F ∼ 7.5 nm−1 and k↓F ∼ 4.5 nm−1 were
determined assuming a free electron gas [15, 16], and themagnitude of n↑(↓) can be estimated from the relation n↑(↓) =(k↑(↓)
F )3/3π2. We have introduced the spin-asymmetry para-
meter α0, which is defined as the ratio between the spin-up and spin-down relaxation times for zero magnetic field,α0 = τ↑0 /τ
↓0 . These average spin-dependent scattering times
for spin-up and spin-down connect to the spin-independentscattering time, τ f , in the ferromagnetic CoFe: τ−1
f =((τ↑0 )
−1+ (τ↓0 )
−1)/2. For fitting experimental results the fol-
lowing parameters were chosen according to literature data[8, 12, 14]: τ f = 1.25 × 10⁻¹⁴ s closed to the relaxation timeof pure Co, α0 = 3 the spin-asymmetry parameter, τn =τCu = 2.5 × 10⁻¹⁴ s the spin-independent scattering time inthe nonmagnetic layer, Cu. In the external magnetic field the
spin-dependent relaxation time changes as a τ↑(↓) = τ↑(↓)0 (1±
α). The parameter α is connected to the GMR: Δρ/ρ = α0α−α/(α0 +1). This expression for Δρ/ρ results from (1) at ω = 0,including the spin-asymmetry parameter α0. Thus we haveall parameters to calculate the spin-dependent conductivityin the middle IR region for ferromagnetic materials. In thenext step, the Drude’s model was employed to find the com-plex refractive index for CoFe and Cu layers:
n f − ik f =√ε f r − iσ(ω)
ε0ω, (2a)
nn − ikn =√√√√εnr − iω2
pτn
ω(1− iωτn). (2b)
Here,ωp = 1.0×10¹⁶ s−1 is the “quasifree” plasma frequencyof Cu [12], ε0 = 8.85 × 10⁻¹² A s/V m is the permittivityof free space, ε f r , and εnr is the relative dielectric constantof the CoFe and Cu layer, respectively, which is contributedby bound electrons. For the highly conducting films used inour model we can set values ε f r , εnr equal to 1; they do notinfluence on the complex optical constants of ferromagneticCoFe, n f − ik f and nonmagnetic Cu, nn − ikn films.
Figure 3(a) shows the theoretical MRE spectra forCoFe/Cu multilayer films. It is shown that the wavelengthsdependence of ΔR/R can be explained quite well, and our fitis satisfactory for spectral region 2–25 μm. In order to exactlyreproduce the shape of MRE we modified the effective Drudeparameters. According to [17] the spin-dependent relaxation
time τ0↑(↓) is multiplied by function of [(�ω− E↑(↓)
F )/E↑(↓)F ]
2
which includes the contributions from interband electronstransitions into MRE effect. Due to such dependence theMRE changes the sign from positive to negative values atshort wavelengths.
The shape of the MRE curves as a function of wavelengthis more sensitive to the spin-dependent scattering parametersthat determine the GMR. The most important parametersin determining the MRE response are ωτ↑(↓), the productof the angular frequency of the IR radiation and relaxationtimes appropriate to spin-up and spin-down. It is instructiveto consider typical values of the critical parameter ωτ↑(↓) at

Physics Research International 5
0 10 15 20 25
0
0.2
0.4
5
−1.2
−1
−0.8
−0.6
−0.4
−0.2
ΔR/R
(%)
Wavelength (μm)
= 1
Δ / = −4.1 % (H = 1.2 kOe)Δ / = −7 % (H = 2.5 kOe)Δ / = −9.2 % (H = 3.75 kOe)
f = 1
(a)
H = 1.2 kOeH = 2.5 kOeH = 3.57 kOe
0 10 15 20 25
0
0.1
0.2
5
−0.5
−0.4
−0.3
−0.2
−0.1
ΔR/R
(%)
Wavelength (μm)
(b)
Figure 3: The theoretical MRE spectra for [CoFe(2 nm)/Cu(1.2 nm)]10 (a) and [CoFe(1.6 nm)/Al2O3(3 nm)]10 (b) multi-layer films, H = 1.2, 2.5, and 3.75 kOe.
certain points in the MRE curves. From theoretical point ofview [10, 18] the MRE curves are predicted to cross zerovalues at the frequencies: ω1τ↑ ≈ 1 and ω2τ↓ ≈ 1. Fromdependences represented in Figure 1(a) we can estimate thevalue of τ↓ ≈ 4.4 × 10⁻¹⁵ s. As the wavelength is increasedthe MRE reaches the maximal absolute value where ωτ f ≈1. The extracted value of τ f ≈ 1.12 × 10⁻¹⁴ s is con-sistent with literature data (τ f ≈ 1.25 × 10⁻¹⁴ s [12]).The measured spectral region is restricted by 25 μm, andthe MRE curves do not cross again the zero value where
Table 1: Comparison of the theoretical and extracted from MREspectra spin-dependent parameters for the CoFe/Cu multilayerfilms.
ParametersTheoretical data
[8, 12]Experimental data
(MRE)
Average scatteringtime: τ f
1.25× 10⁻¹⁴ s 1.12× 10⁻¹⁴ s
Spin-dependentscattering times:spin-up τ↑
1.6× 10⁻¹⁴ s 1.1× 10⁻¹⁴ s
spin-down τ↓ 4.6× 10⁻¹⁵ s 4.4× 10⁻¹⁵ s
ω1τ↑ ≈ 1. This result shows immediately the effect of thetwo separate spin directions on the total MRE spectra. Therelationship between the relaxation time and GMR dependson the specific scattering mechanism; for example, a highGMR may be the result of a very long τ↑ or a very shortτ↓. The comparison between theoretical and experimentalspin-dependent scattering parameters as extracted from theexperimental MRE are presented in Table 1. Thus, we haveshown that the known dependence of MRE enables a directextraction of spin-dependent relaxation times τ↑(↓) (or meanfree path) without fitting parameters. Such extraction ofτ0↑(↓) is possible due to crossing the MRE curves of zero
values.
4.2. MRE Effect in Al2O3-Based Magnetic Tunnel Junctions.We now turn to the investigation and discussion of theMRE in [CoFe(1.6 nm)/Al2O3(3 nm)]10 multilayer filmswith TMR effect. TMR originates from the difference in thedensity of states (DOS) at the EF between spin-up N↑(EF)and spin-downN↓(EF) electrons. In order to fit the TMR data(Figure 2(a)) we have used the known Julliere law for multi-layer films [19]. According to this model of spin polarizedtunneling [19, 20], TMR is given by
Δρ
ρ= ρ(H)− ρ(0)
ρ(0)= 2P1P2
1 + P1P2, (3)
where ρ(0) and ρ(H) are the junction resistance for theantiparallel and parallel magnetisation configurations of thetwo ferromagnetic layers, respectively. P1 and P2 are thespin polarization of the two FM materials (for our struc-tures, P1 = P2): P = (N↑−N↓)/(N↑+N↓). From modelling theTMR data (3) we obtained the effective tunnel spin-polari-zation Peff equal to ∼11%. This value is lower than thespin-polarization of Fe (P ∼ 44%) and Co (P ∼ 35%),and Co50Fe50 (P ∼ 55%) films, respectively [20]. The low-er values of Peff are probably the result of following factors.(1) The tunnelling spin polarization is not only determin-ed by the properties of the FM layers but also dependson the electronic structure of the insulator and ferromag-netic/insulator interfaces. (2) A number of different pro-cesses may contribute to the variation of TMR, such asthe spin-dependent electronic structure of the FM layers,inelastic scattering by defect/impurity states in the barrier,and electron-phonon, electron-magnon, and electron-elec-tron interactions. The decrease in TMR is also caused by

6 Physics Research International
oxidization of FM layers and roughness of surface at inter-faces.
Our investigation of the MRE of CoFe/Al2O3 multilayerhas shown that magnetoreflectance (ΔR/R) is more sensitiveto the abovementioned factors than magnetoresistance(Δρ/ρ). TMR as a function of P1,2 is independent fromenergy (the values P1,2 are taken at fixed energy, EF). In meas-ured MRE dependences for layered TMR films the functionsP1,2 stay energy dependent. To model the MRE in CoFe/Al2O3 multilayer films, it can be logical to consider the spin-dependent conductivity of two FM layers (1). The tunnelconductivity increases when the magnetizations of the twoFM layers are parallel than when they are antiparallel. Ana-lyzing the results in the same way as for TMR the differencein conductivity can be defined as
Δσ(ω)σ(ω)
= σ(ω,H)− σ(ω,H = 0)σ(ω,H)
= − 2P1(ω)P2(ω)1 + P1(ω)P2(ω)
,
(4)
where the polarizations P1(ω) = P2(ω) = P(ω) are connect-ed to Δρ/ρ at ω = 0 (3). Since spin-flip scattering is neglect-ed, the total conductivity is comprised of two independentelectron-tunneling transitions associated with two spinpopulations.
According to the Hagen-Rubens relation [7, 14], theGMR (TMR) and MRE effects are connected to each otherand the reflectivity is a function of the conductivity at lowenergies, σ(ω), R = 1− 2[2ε0ω/σ(ω)]1/2, where ε0 is the per-mittivity of free space. The change in reflectivity ΔR/R can beobtained as a first derivation of R(λ):
ΔR
R= [2ε0ω/σ(ω)]1/2
1− [2ε0ω/σ(ω)]1/2 ×Δσ(ω)2σ(ω)
= −1− RR
× Δσ(ω)2σ(ω)
.
(5)
It is evident from (5) that ΔR/R depends on magneto-con-ductivity (Δσ(ω)/σ(ω)). Thus, substituting the wavelengthdependence of R(λ) and Δσ(ω)/σ(ω) in a Hagen-Rubensrelation we can accurately describe the MRE in metal-insu-lating multilayer and find the correlation between the mag-netorefractive and magnetoresistive effects (ω → 0). Com-bining (4) and (5), leads to a definition for a fractionalchange in magnetoreflectance as
ΔR
R= 1− R
R× Δσ(ω)
2σ(ω)= −1− R
R
P1(ω)P2(ω)1 + P1(ω)P2(ω)
. (6)
This expression shows the proportionality between MRE andpolarizations P(ω) in ferromagnetic/dielectric multilayerfilms. In the present analysis the reflectivity of the multilayercan be obtained using Fresnel’s reflection and transmissioncoefficients [13]. The complex refractive index of CoFethin film can be extracted from (2a). In the midinfraredregion, where optical phonons can be excited, the dielectricfunction εd of insulating Al2O3 can be approximated by aphenomenological Lorentz oscillator model [21, 22]:
εd = ε∞∏j
νLO j2 − ν2 − iνγLO j
νTO j2 − ν2 − iνγTO j
, (7)
0 0.05 0.1 0.15 0.2 0.250
2
4
6
8
10
12
Energy (eV)
Theory
Peff
(E)
(%)
EF
−0.05
Experimental
Figure 4: Effective tunnel spin polarization versus energy withrespect to EF , extracted from the MRE and reflectivity measure-ments for [CoFe(1.6 nm)/Al2O3(3 nm)]10 multilayer films: experi-mental and simulated data.
where ε∞ is the high-frequency dielectric function. The vi-brating frequencies and Lorentz widths of the LO and TOmodes are νLO j , νTO j and γLO j , γTO j , respectively. For ourcalculation only two pairs of phonon modes (LO/TO, j =1, 2) were considered. The abovementioned parameters weretaken from [21, 22].
Figure 3(b) displays the theoretical magnetoreflectanceof the CoFe/Al2O3 multilayer films as a function of the wave-length for different values of tunnel magnetoresistance(magnetic field), Δρ/ρ (Figure 2(a)). The shape and spectralposition of the dips for the MRE spectra (Figure 1(b)) arewell described by our theoretical model (Figure 3(b)). Inspectral region of 12–14 μm the absolute value of ΔR/R be-comes maximal.
It was shown above that the TMR dependence(Figure 2(a)) is connected only with the electron states nearthe Fermi level. For MRE there is a substantial contributionof electrons which tunnel from the occupied states belowEF of one FM layer into the empty states above EF of theother FM layer. The effective polarization Peff(E) of the CoFelayer can be obtained by fitting the magnetoreflectance ΔR/R(Figure 3(b)) as a function of Δσ(ω)/σ(ω) using (5). Theexperimental and simulated tunnelling spin-polarizationspectra of the CoFe/Al2O3 multilayers are shown inFigure 4. The experimental data for Peff(E) were obtain-ed from optical reflectance, R(λ) (inset of Figure 1(b)), andmagnetoreflectance,ΔR/R, dependences using the expression(6). It is worth noting that we determined the Peff(E) only inspectral region where the MRE has negative values. In thisregion we can use the Drude-like model for spin-dependentconductivities (1). Both experiment and theory suggestthat the Fermi level falls in a region of maximal density ofelectron states. The measured and simulated spectra show

Physics Research International 7
a similar profile of Peff(E) around the Fermi level. However,some differences between simulated and measured data areobserved. In particular, the simulated peak in Peff(E) at EFis sharper than in the experimental spectra. The measuredPeff(E) seems displaced towards positive energy as comparedto the simulated spectra (Figure 4). This discrepancy couldbe related to the features in ΔR/R and R spectra which havebeen attributed to scattering of light at defects in amorphousAl2O3 matrix. The maximal values of Peff(E) extracted fromMRE and TMR data (7), (3) at the Fermi level are in goodagreement. The Peff(E) at EF is the largest (Peff(EF) ≈ 11%from fitting TMR data) and is reduced below and above EF .The value of Peff(EF) exhibits small spin polarizations incomparison to pure CoFe alloy due to the particle oxidationof the CoFe surfaces. The Peff(E) is found to be moststrongly reduced bellow EF . The Peff(E) is associated withthe filled (unfilled) states near (above) EF of the CoFe/Al2O3
emitter or receiver interfaces. We determined the Peff(E)only for energies about 0.2 eV below EF because of the negli-gible contribution to the tunnelling from the deepest elec-tron states. Note that the spin-dependent tunnelling DOSof Co/Al2O3 film extracted from the magnetocurrent oftransistor-like devices and reported in [23, 24] shows a pro-file similar to our spectra (Figure 4).
5. Conclusions
We report experimental and theoretical study of the field-dependent IR magnetoreflectivity for CoFe/Cu and CoFe/Al2O3 multilayer films. It was found a good correlationbetween GMR (TMR) and MRE as a function of the appliedmagnetic field which clearly displays the possibility ofperforming noncontact magnetotransport measurements bymeasuring the variation of the IR reflected from samples in-tensity of light at fixed wavelengths with high surface resolu-tion (in case of focusing light to size of λ). The shape ofthe MRE curves as a function of wavelength is sensitive tothe spin-dependent scattering parameters (in case of theGMR) and spin-dependent density of states at the EF forlayered TMR films. Experimental results show that the MREis sensitive to this fundamental parameter rather than justthe magnitude of the magnetoresistance. The accurate fittingof the shape of the MRE curve as a function of wavelengthallows determining the spin-dependent relaxation time,τ↑(↓), for films possessing GMR effect. The effective tunnelspin polarization Peff(E) versus energy can be extracted fromthe experimental dependences of MRE spectrum and reflec-tivity for CoFe/Al2O3 multilayer films.
This study is of primary importance for applications ofsuch materials in spintronics devices and magnetophotoniccrystals.
References
[1] M. N. Baibich, J. M. Broto, A. Fert et al., “Giant magnetore-sistance of (001)Fe/(001)Cr magnetic superlattices,” PhysicalReview Letters, vol. 61, no. 21, pp. 2472–2475, 1988.
[2] G. Binasch, P. Grunberg, F. Saurenbach, and W. Zinn, “En-hanced magnetoresistance in layered magnetic structures with
antiferromagnetic interlayer exchange,” Physical Review B, vol.39, no. 7, pp. 4828–4830, 1989.
[3] B. Dieny, B. A. Gurney, S. E. Lambert et al., “Magnetoresistivesensor based on the spin valve effect,” US patent 5206590,1993.
[4] C. Chappert, A. Fert, and F. N. van Dau, “The emergence ofspin electronics in data storage,” Nature Materials, vol. 6, no.11, pp. 813–823, 2007.
[5] A. Fert, A. Barthelemy, and F. Petroff, “Spin transport in mag-netic multilayers and tunnel junctions,” in Nanomagnetism:Ultrathin Films, Multilayers and Nanostructures, D. M. Millsand J. A. C. Bland, Eds., chapter 6, Elsevier, Amsterdam, TheNetherlands, 2006.
[6] J. C. Jacquet and T. Valet, “A new magnetooptical effect dis-covered on magnetic multilayers: the magnetorefractiveeffect,” in Magnetic Ultrathin Films, Multilayers and Surfaces,E. Marinero, Ed., pp. 477–490, Materials Research Society,Pittsburg, Pa, USA, 1995.
[7] V. G. Kravets, D. Bozec, J. A. D. Matthew et al., “Correlationbetween the magnetorefractive effect, giant magnetoresis-tance, and optical properties of Co-Ag granular magneticfilms,” Physical Review B, vol. 65, no. 5, Article ID 054415, 9pages, 2002.
[8] J. van Driel, F. R. De Boer, R. Coehoorn, and G. H. Rietjens,“Magnetic linear dichroism of infrared light in ferromagneticalloy films,” Physical Review B, vol. 60, no. 10, pp. R6949–R6952, 1999.
[9] R. T. Mennicke, D. Bozec, V. G. Kravets, M. Vopsaroiu, J.A. D. Matthew, and S. M. Thompson, “Modelling the mag-netorefractive effect in giant magnetoresistive granular andlayered materials,” Journal of Magnetism and Magnetic Mate-rials, vol. 303, no. 1, pp. 92–110, 2006.
[10] A. B. Granovsky, I. V. Bykov, E. A. Gan’shina et al., “Mag-netorefractive effect in magnetic nanocomposites,” Journal ofExperimental and Theoretical Physics, vol. 96, no. 6, pp. 1104–1112, 2003.
[11] V. G. Kravets, L. V. Poperenko, and A. F. Kravets, “Magnetore-flectance of ferromagnetic metal-insulator granular films withtunneling magnetoresistance,” Physical Review B, vol. 79, no.14, Article ID 144409, 2009.
[12] M. Vopsaroiu, D. Bozec, J. A. D. Matthew, S. M. Thompson,C. H. Marrows, and M. Perez, “Contactless magnetoresistancestudies of Co/Cu multilayers using the infrared magnetore-fractive effect,” Physical Review B, vol. 70, no. 21, Article ID214423, 7 pages, 2004.
[13] M. Born and E. Wolf, Principles of Optics, Cambridge Univer-sity Press, Cambridge, UK, 1999.
[14] A. V. Sokolov, Optical Properties of Metals, Blackie, Glasgow,UK, 1967.
[15] C. Kittel, Introduction to Solid State Physics, Wiley, New York,NY, USA, 1995.
[16] M. Julliere, “Tunneling between ferromagnetic films,” PhysicsLetters A, vol. 54, no. 3, pp. 225–226, 1975.
[17] K. H. Bennemann, Ed., Nonlinear Optics in Metals, ClarendonPress, Oxford, UK, 1998.
[18] V. G. Kravets, D. Bozec, J. A. D. Matthew, and S. M.Thompson, “Calculation of the magnetorefractive effect ingiant magnetoresistive granular films,” Journal of AppliedPhysics, vol. 91, no. 10, pp. 8587–8590, 2002.
[19] J. C. Slonczewski, “Conductance and exchange coupling oftwo ferromagnets separated by a tunneling barrier,” PhysicalReview B, vol. 39, no. 10, pp. 6995–7002, 1989.
[20] E. Y. Tsymbal, O. N. Mryasov, and P. R. LeClain, “Spin-dependent tunneling in magnetic tunnel junctions,” Journal ofPhysics: Condensed Matter, vol. 15, pp. R109–R142, 2003.
8 Physics Research International
[21] M. Schubert, T. E. Tiwald, and C. M. Herzinger, “Infrareddielectric anisotropy and phonon modes of sapphire,” PhysicalReview B, vol. 61, no. 12, pp. 8187–8201, 2000.
[22] V. G. Kravets, “Polaron interpretation of the magnetore-flectance effect in insulating α-Al2O3,” Physical Review B, vol.72, no. 6, Article ID 064303, 2005.
[23] B. G. Park, T. Banerjee, J. C. Lodder, and R. Jansen, “TunnelSpin polarization versus energy for clean and doped Al2O3
barriers,” Physical Review Letters, vol. 99, no. 21, Article ID217206, 2007.
[24] S. O. Valenzuela, D. J. Monsma, C. M. Marcus, V. Narayana-murti, and M. Tinkham, “Spin polarized tunneling at finitebias,” Physical Review Letters, vol. 94, no. 19, Article ID 196601,2005.