advanced m&s applied to analysis techniques for supporting decision makers … ·...
TRANSCRIPT

Advanced M&S applied to
Analysis Techniques for
Supporting Decision Makers in
Multi-Job Management in an
Aeronautical IndustryAuthor: Enrico Briano
Advisor: Prof. Agostino G. Bruzzone
MISS Genoa Center - DIPTEM
Co-Advisors: Matteo Cecada
Giorgio Garassino
Piaggio Aero Industries
Francesco Longo
University of Calabria
Goals of the Research
The main goal of the Research is to reduce
the Assembling Line Lead Time. In order to
reach this goal is requested to:
• Identify and Analyze Criticalities
• Reorganize all the Phases of the
Production Process
• Evaluate the Impact of all the Stochastic
Phenomena
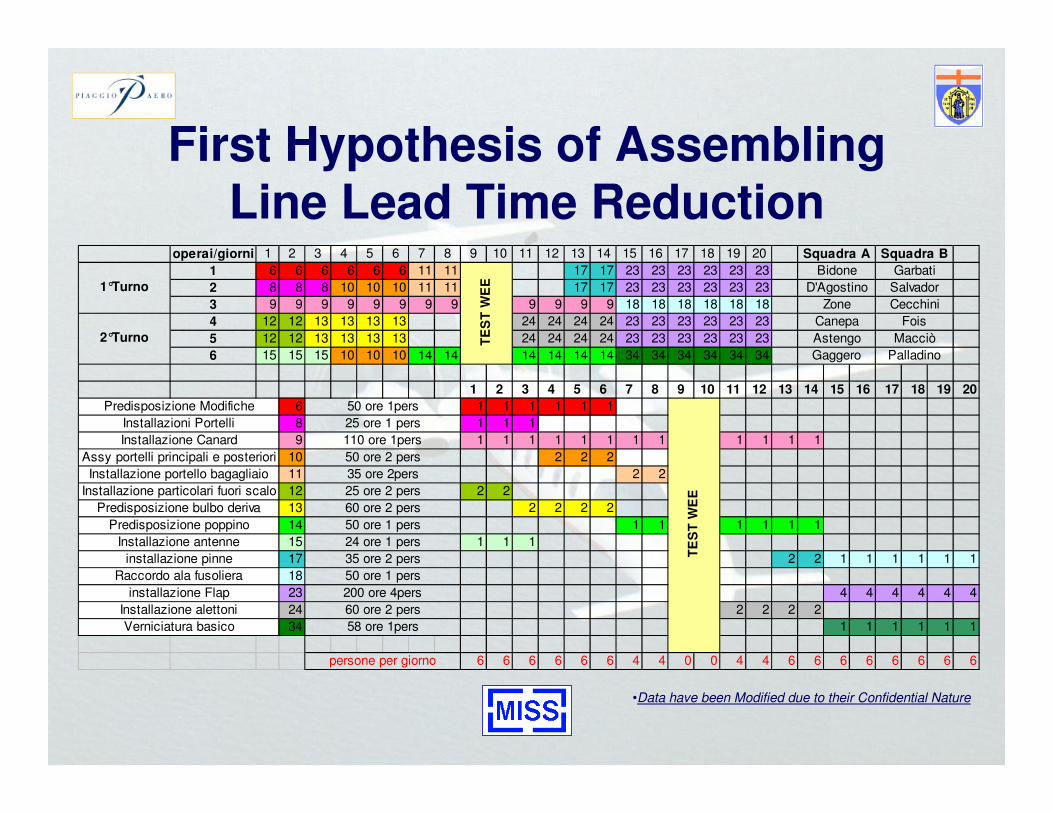
First Hypothesis of Assembling
Line Lead Time Reductionoperai/giorni 1 2 3 4 5 6 7 8 9 10 11 12 13 14 15 16 17 18 19 20
1 6 6 6 6 6 6 11 11 17 17 23 23 23 23 23 23
2 8 8 8 10 10 10 11 11 17 17 23 23 23 23 23 23
3 9 9 9 9 9 9 9 9 9 9 9 9 18 18 18 18 18 18
4 12 12 13 13 13 13 24 24 24 24 23 23 23 23 23 23
5 12 12 13 13 13 13 24 24 24 24 23 23 23 23 23 23
6 15 15 15 10 10 10 14 14 14 14 14 14 34 34 34 34 34 34
1 2 3 4 5 6 7 8 9 10 11 12 13 14 15 16 17 18 19 20
6 1 1 1 1 1 1
8 1 1 1
9 1 1 1 1 1 1 1 1 1 1 1 1
10 2 2 2
11 2 2
12 2 2
13 2 2 2 2
14 1 1 1 1 1 1
15 1 1 1
17 2 2 1 1 1 1 1 1
18
23 4 4 4 4 4 4
24 2 2 2 2
34 1 1 1 1 1 1
6 6 6 6 6 6 4 4 0 0 4 4 6 6 6 6 6 6 6 6
Squadra B
Garbati
Salvador
Cecchini
Assy portelli principali e posteriori
Squadra A
Bidone
D'Agostino
Zone
TE
ST
WE
E
Canepa
Astengo
Gaggero
Fois
Macciò
Palladino
TE
ST
WE
E
Installazione portello bagagliaio
Installazione particolari fuori scalo
Installazione alettoni
2°Turno
Predisposizione Modifiche
Installazioni Portelli
Installazione Canard
Installazione antenne
installazione pinne
Raccordo ala fusoliera
1°Turno
50 ore 1pers
Predisposizione bulbo deriva
Predisposizione poppino
25 ore 1 pers
110 ore 1pers
50 ore 2 pers
35 ore 2pers
25 ore 2 pers
60 ore 2 pers
installazione Flap
persone per giorno
200 ore 4pers
60 ore 2 pers
58 ore 1persVerniciatura basico
50 ore 1 pers
24 ore 1 pers
35 ore 2 pers
50 ore 1 pers
•Data have been Modified due to their Confidential Nature
Methodology
• Build Simulators and Models devoted to analyzeRisks and Criticalities
• Development and Analysis of the Assembling LineSystems in order to:– Reduce the Aircraft Mean Lead Time from 6 to 4 Months
– Reduce WIP
– Decrease the Number of Aicrafts simoultaneously present inthe Assembling Line
– Save a significant amount of Money in terms of BankingInterests
– Distribute better Resources on Planes
– Have a Positive impact on the Company Cash Flow
Station 8
Slipway
Station 8 bis
Initial
Arrangements
Station 7
Assembling
Station 7 bis
Moving Parts
and Fillings
Station 8 ter
Interiors
Trimming
Final Tests
2 Stations
Station 4
Final Interiors
Assembling
Station 5 bis
Functional Tests
Station 5
High Value
Components
Station 6 bis
Painting
Station 6
Installations
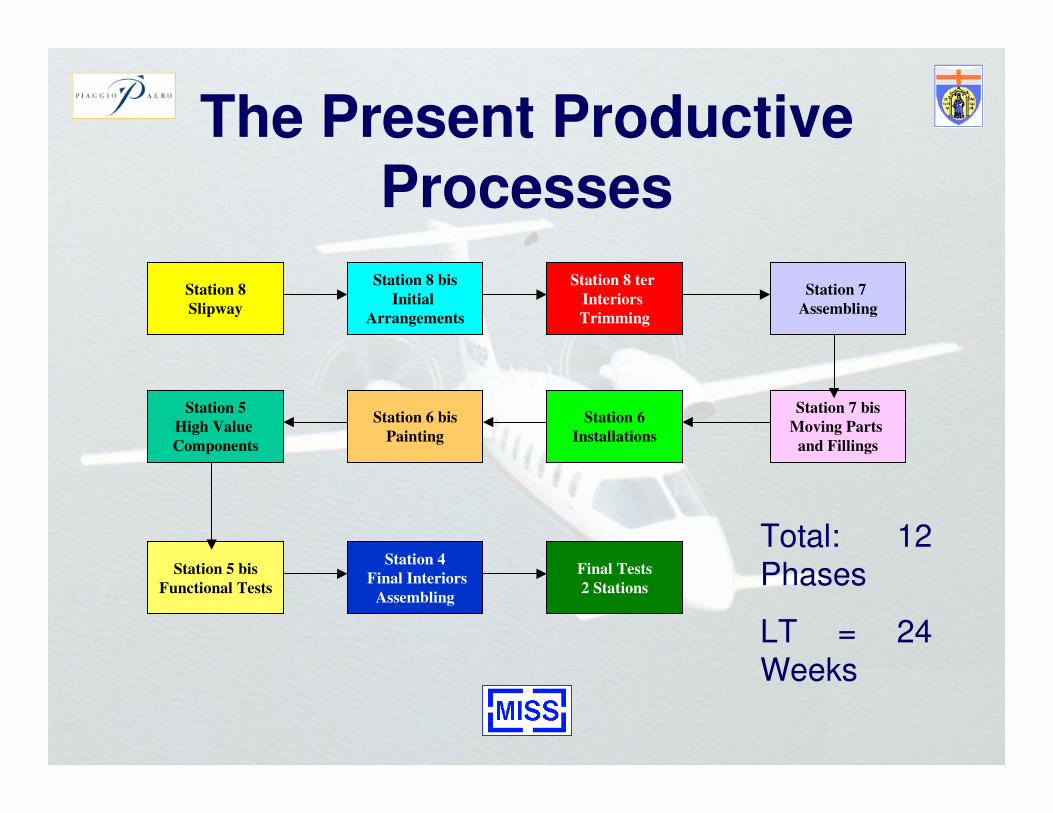
The Present Productive
Processes
Total: 12
Phases
LT = 24
Weeks
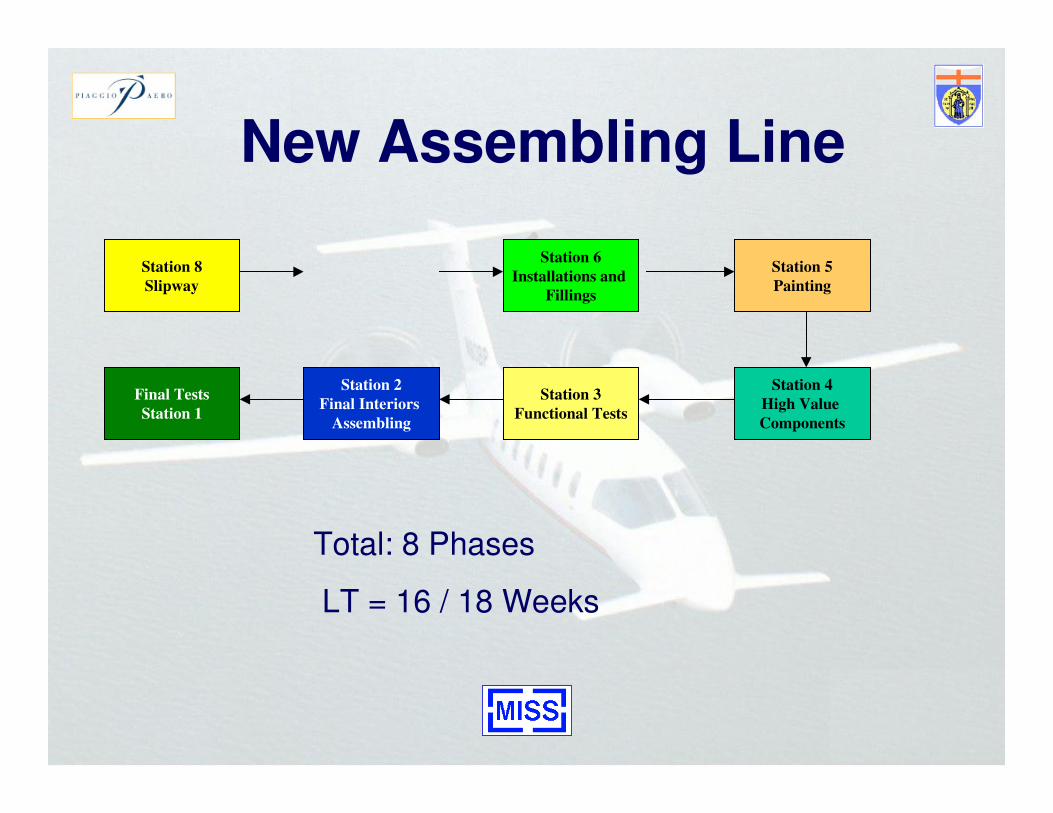
New Assembling Line
Station 8
Slipway
Final Tests
Station 1
Station 2
Final Interiors
Assembling
Station 3
Functional Tests
Station 4
High Value
Components
Station 5
Painting
Station 6
Installations and
Fillings
Total: 8 Phases
LT = 16 / 18 Weeks
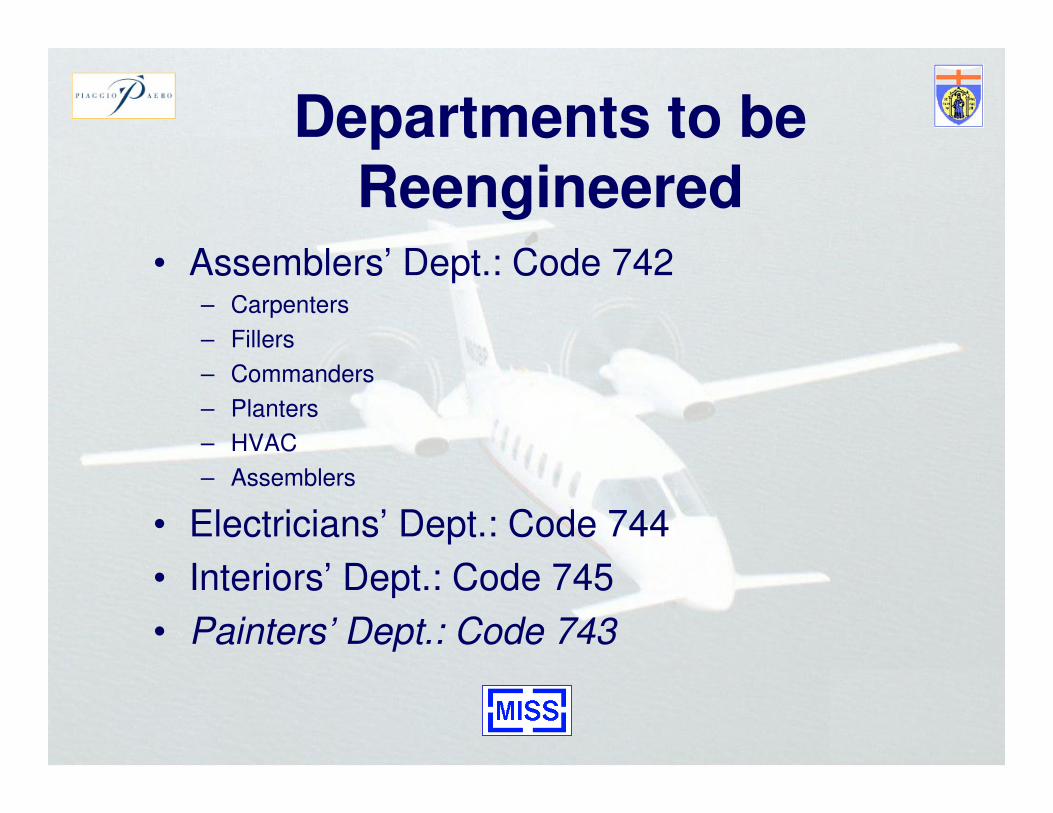
Departments to beReengineered
• Assemblers’ Dept.: Code 742– Carpenters
– Fillers
– Commanders
– Planters
– HVAC
– Assemblers
• Electricians’ Dept.: Code 744
• Interiors’ Dept.: Code 745
• Painters’ Dept.: Code 743
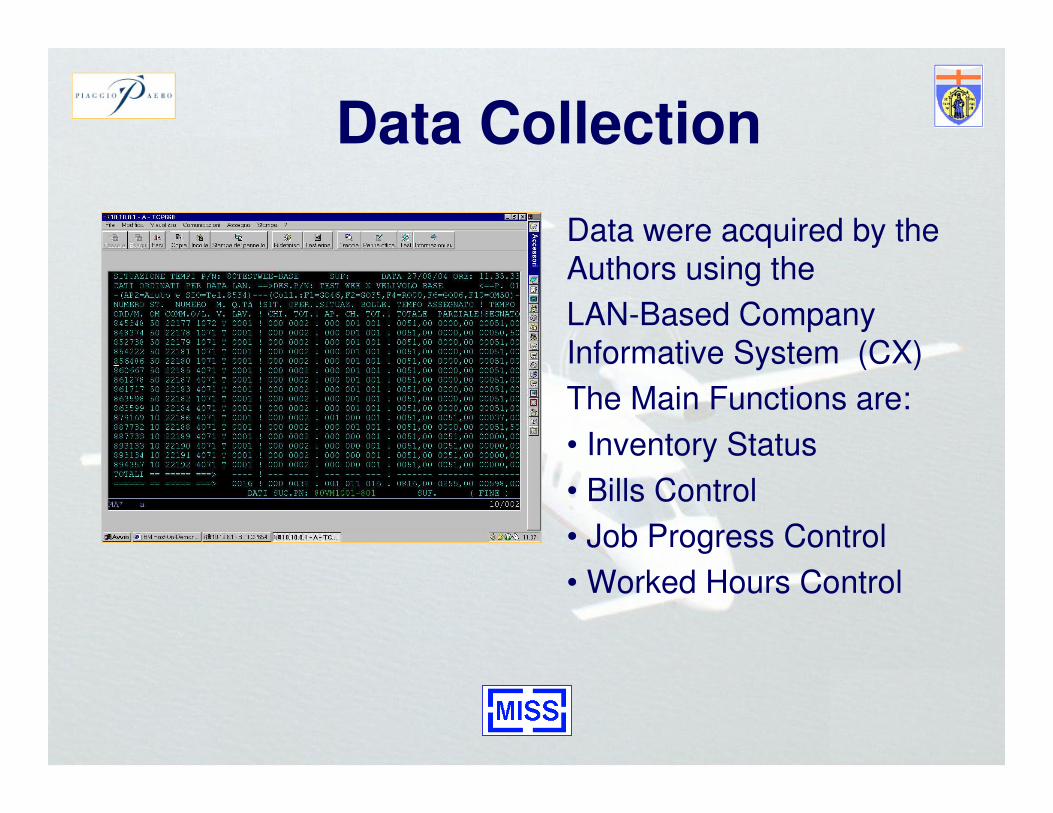
Data Collection
Data were acquired by the
Authors using the
LAN-Based Company
Informative System (CX)
The Main Functions are:
• Inventory Status
• Bills Control
• Job Progress Control
• Worked Hours Control
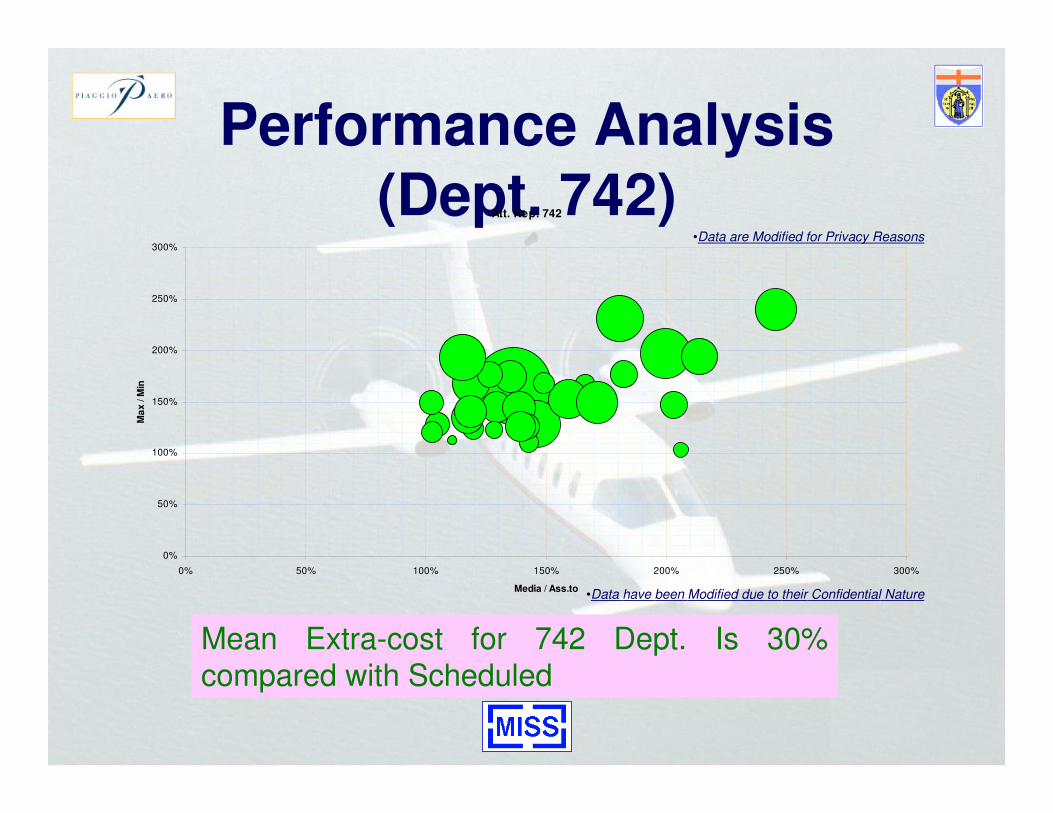
Performance Analysis(Dept. 742)Att. Rep. 742
0%
50%
100%
150%
200%
250%
300%
0% 50% 100% 150% 200% 250% 300%
Media / Ass.to
Ma
x / M
in
•Data are Modified for Privacy Reasons
Mean Extra-cost for 742 Dept. Is 30%compared with Scheduled
•Data have been Modified due to their Confidential Nature
“Solar” Simulator
•VBA Simulator based on the real Job Completion Time
•Dates extracted from the Bills start and finishing time(CX)
•Mean Airplane Lead Time overestimated based onstatitistical analysis
•Necessity to validate data and to develop a more
detailed model
M.A.C.A.C.O. Simulator
• Stochastic Discrete Event Simulator
• Job Duration-Based historical data (from Aircrafts NC
1077 to NC 1086) and experts estimation by beta
distribution
• Production Process Model using concurrent PERT for
each plane considering resources and constraints
• C++ built and animated
• Stochasticity provided by different probabilitydistribution; deterministic case is also allowed
• Allows formulating What-If Analysis on Criticalitiesand Bottlenecks by variating Input Data
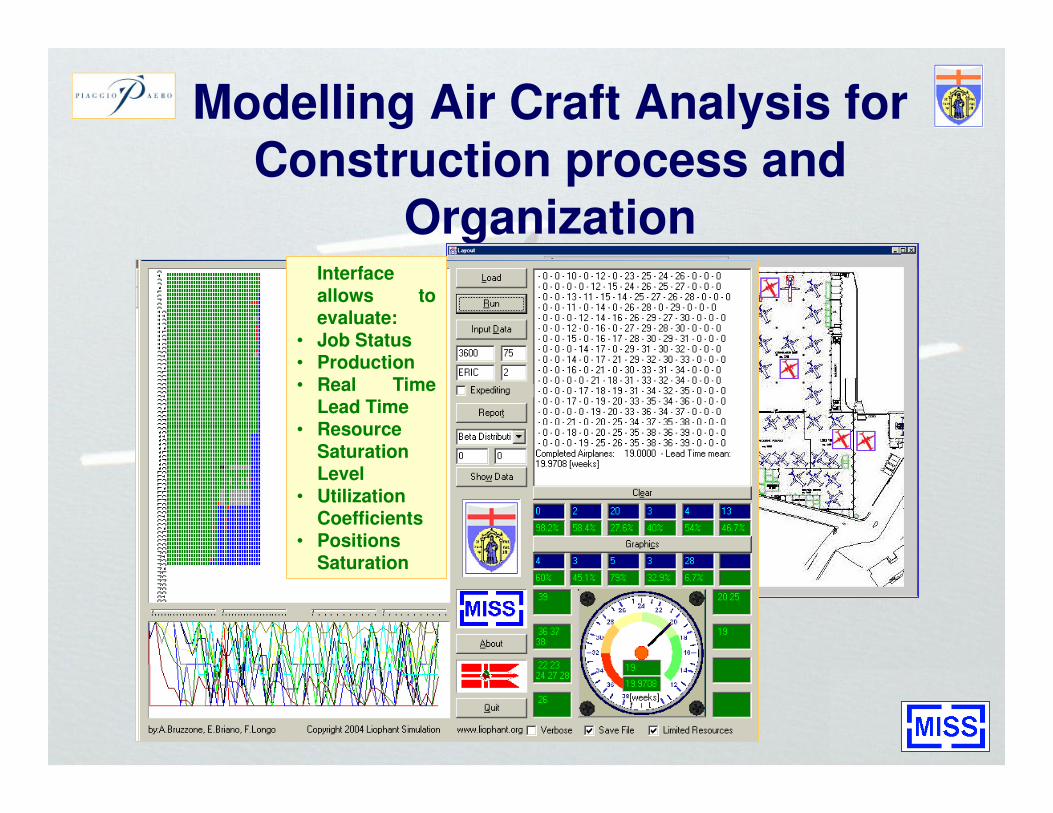
Modelling Air Craft Analysis for
Construction process and
OrganizationInterface
allows toevaluate:
• Job Status• Production
• Real TimeLead Time
• Resource
SaturationLevel
• UtilizationCoefficients
• PositionsSaturation
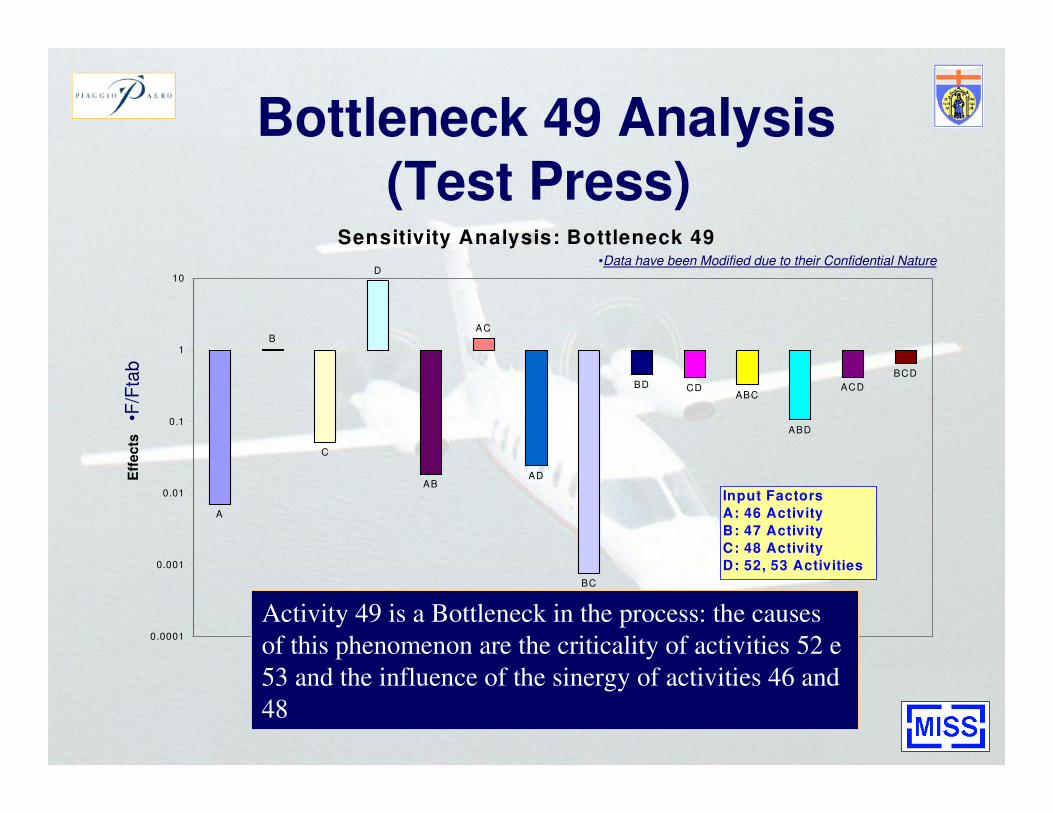
Bottleneck 49 Analysis(Test Press)
Sensitivity Analysis: Bottleneck 49
A
B
C
D
AB
AC
AD
BC
BD CDABC
ABD
ACD
BCD
0.0001
0.001
0.01
0.1
1
10
Eff
ec
ts
Input Factors
A: 46 Activity
B: 47 Activity
C: 48 Activity
D: 52, 53 Activities
•F/F
tab
Activity 49 is a Bottleneck in the process: the causes
of this phenomenon are the criticality of activities 52 e
53 and the influence of the sinergy of activities 46 and
48
•Data have been Modified due to their Confidential Nature
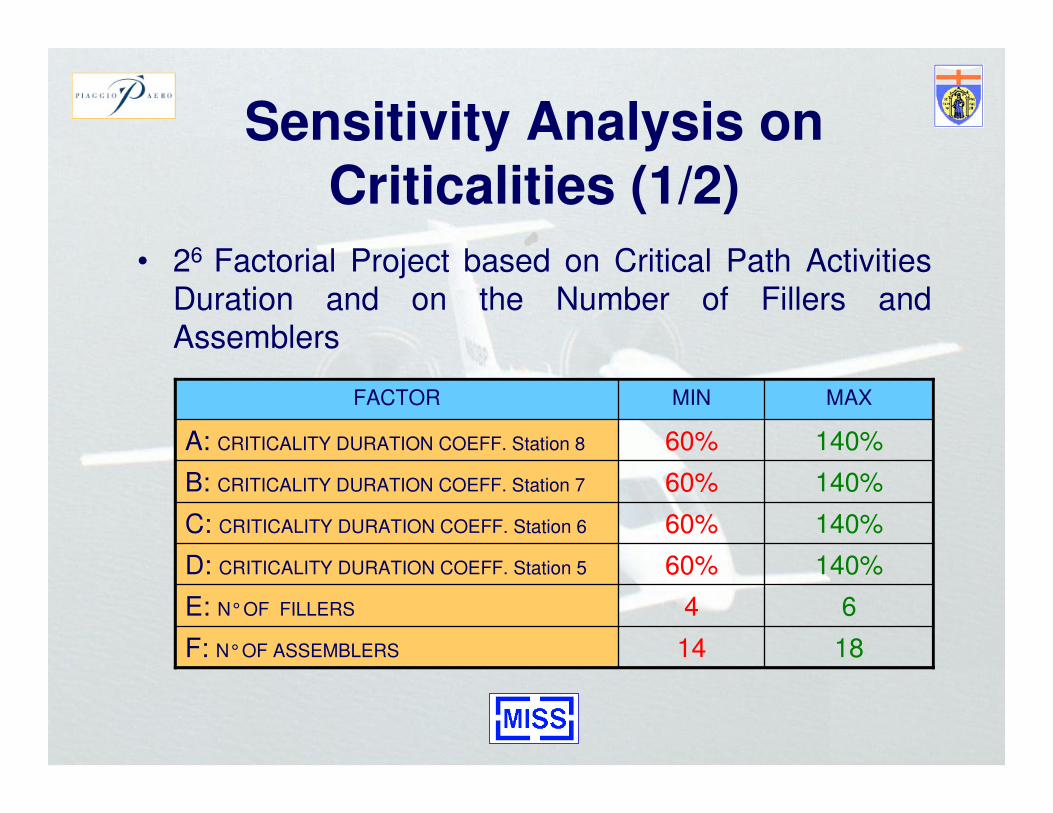
Sensitivity Analysis on
Criticalities (1/2)
• 26 Factorial Project based on Critical Path Activities
Duration and on the Number of Fillers andAssemblers
1814F: N° OF ASSEMBLERS
64E: N° OF FILLERS
140%60%D: CRITICALITY DURATION COEFF. Station 5
140%60%C: CRITICALITY DURATION COEFF. Station 6
140%60%B: CRITICALITY DURATION COEFF. Station 7
140%60%A: CRITICALITY DURATION COEFF. Station 8
MAXMINFACTOR
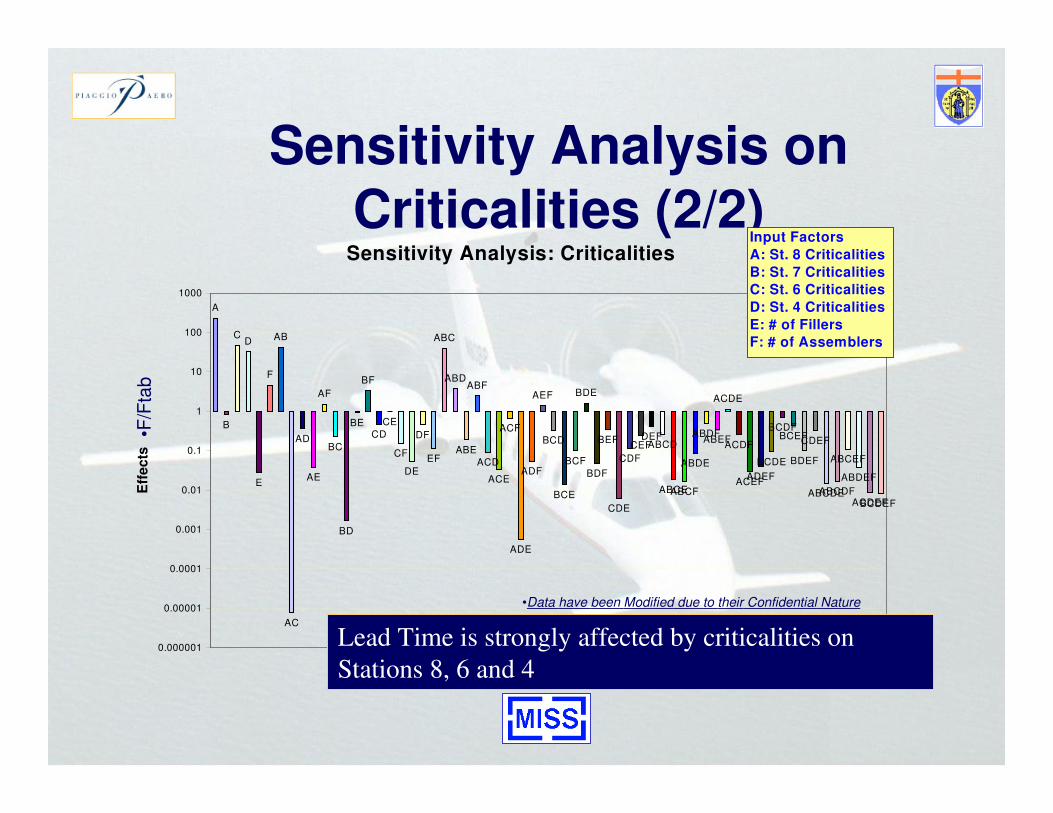
Sensitivity Analysis on
Criticalities (2/2)Sensitivity Analysis: Criticalities
A
B
CD
E
F
AB
AC
AD
AE
AF
BC
BD
BE
BF
CD
CE
CF
DE
DF
EF
ABC
ABD
ABE
ABF
ACD
ACE
ACF
ADE
ADF
AEF
BCD
BCE
BCF
BDE
BDF
BEF
CDE
CDF
CEFDEF
ABCD
ABCEABCF
ABDE
ABDFABEF
ACDE
ACDF
ACEFADEF
BCDE
BCDFBCEF
BDEF
CDEF
ABCDEABCDF
ABCEF
ABDEF
ACDEFBCDEF
0.000001
0.00001
0.0001
0.001
0.01
0.1
1
10
100
1000
Eff
ec
ts
Input Factors
A: St. 8 Criticalities
B: St. 7 Criticalities
C: St. 6 Criticalities
D: St. 4 Criticalities
E: # of Fillers
F: # of Assemblers
•F/F
tab
Lead Time is strongly affected by criticalities on
Stations 8, 6 and 4
•Data have been Modified due to their Confidential Nature
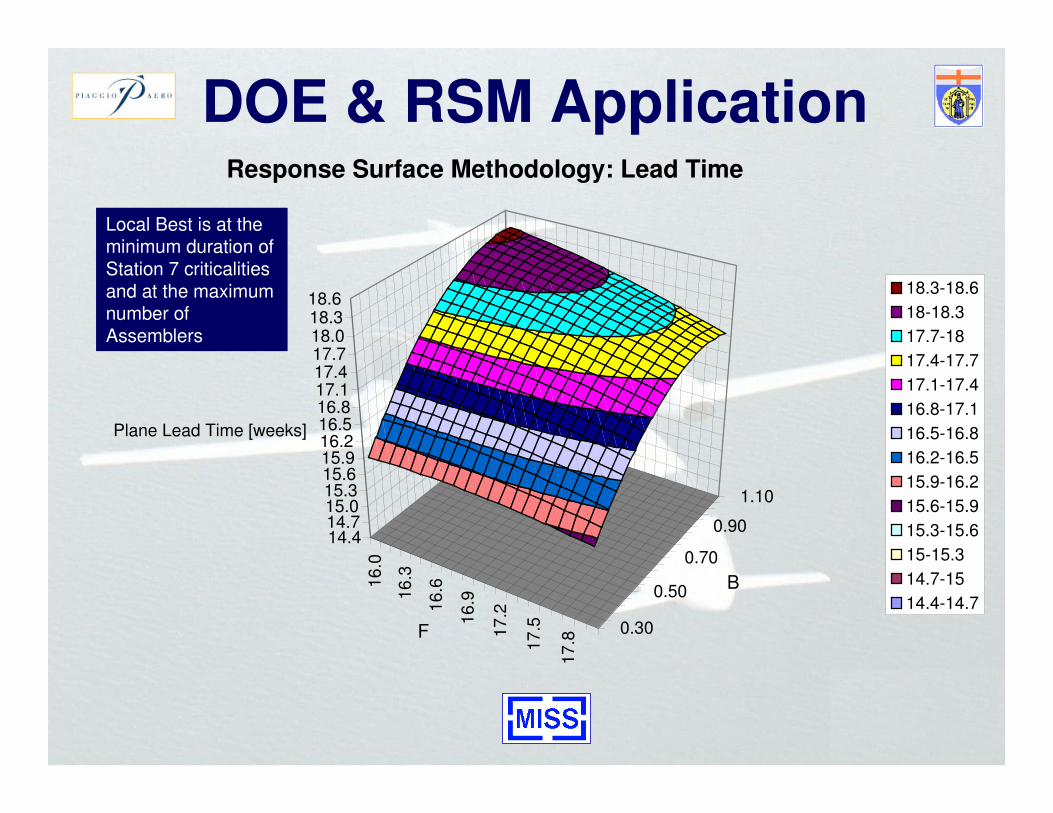
DOE & RSM Application
16.0
16.3
16.6
16.9
17.2
17.5
17.8
0.30
0.50
0.70
0.90
1.10
14.414.715.015.315.615.916.216.516.817.117.417.718.018.318.6
Plane Lead Time [weeks]
F
B
Response Surface Methodology: Lead Time
18.3-18.6
18-18.3
17.7-18
17.4-17.7
17.1-17.4
16.8-17.1
16.5-16.8
16.2-16.5
15.9-16.2
15.6-15.9
15.3-15.6
15-15.3
14.7-15
14.4-14.7
Local Best is at theminimum duration of
Station 7 criticalities
and at the maximumnumber of
Assemblers
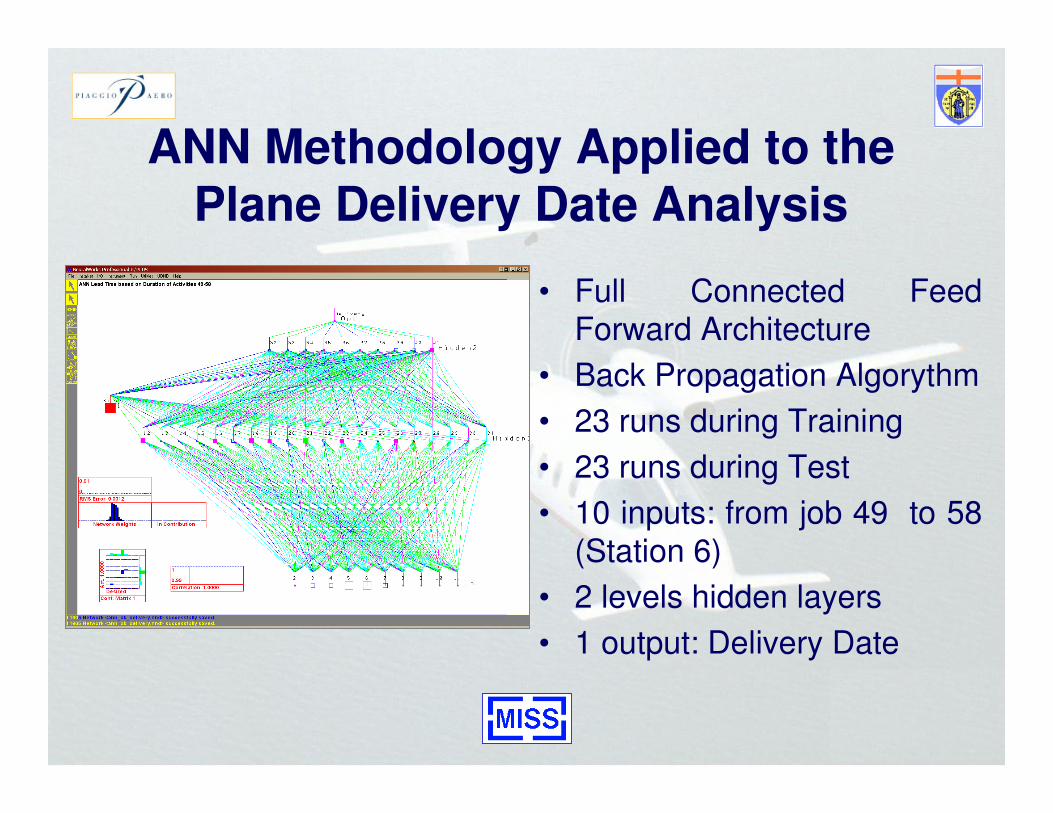
ANN Methodology Applied to thePlane Delivery Date Analysis
• Full Connected FeedForward Architecture
• Back Propagation Algorythm
• 23 runs during Training
• 23 runs during Test
• 10 inputs: from job 49 to 58
(Station 6)
• 2 levels hidden layers
• 1 output: Delivery Date
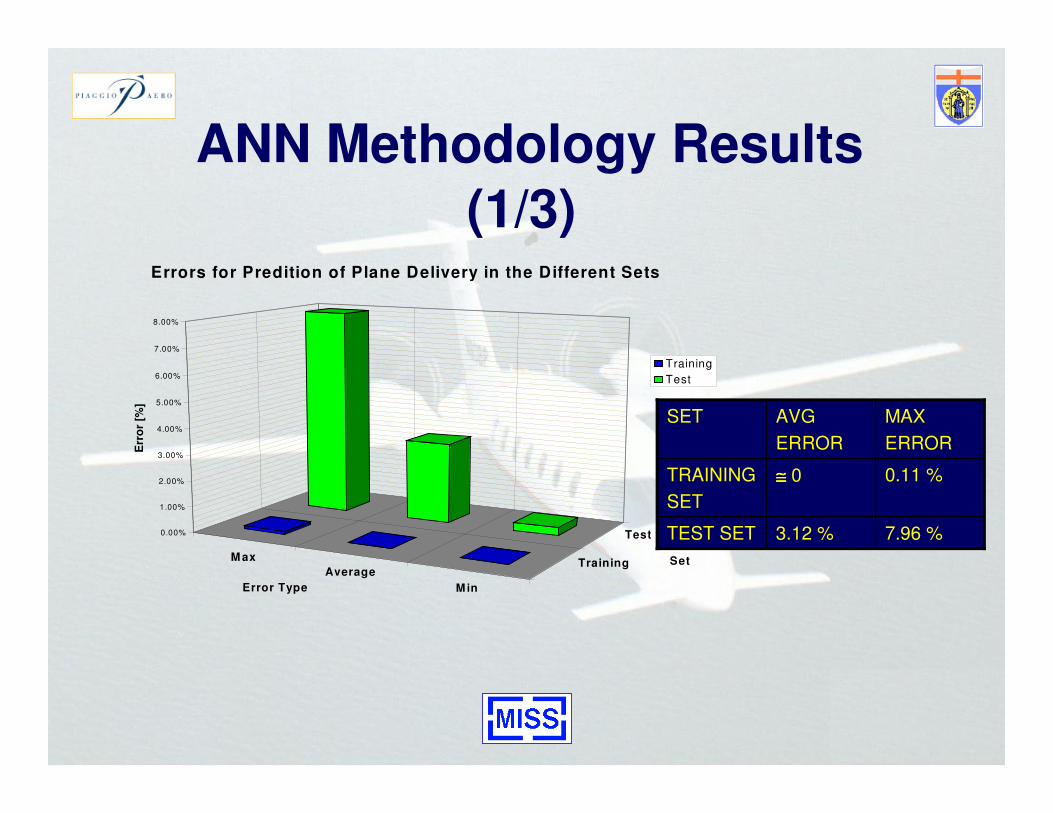
ANN Methodology Results
(1/3)
M ax
Average
Min
Training
Test0.00%
1.00%
2.00%
3.00%
4.00%
5.00%
6.00%
7.00%
8.00%
Err
or
[%]
Error Type
Set
Errors for Predition of Plane Delivery in the Different Sets
Training
Test
7.96 %3.12 %TEST SET
0.11 %≅≅≅≅ 0TRAINING
SET
MAX
ERROR
AVG
ERROR
SET
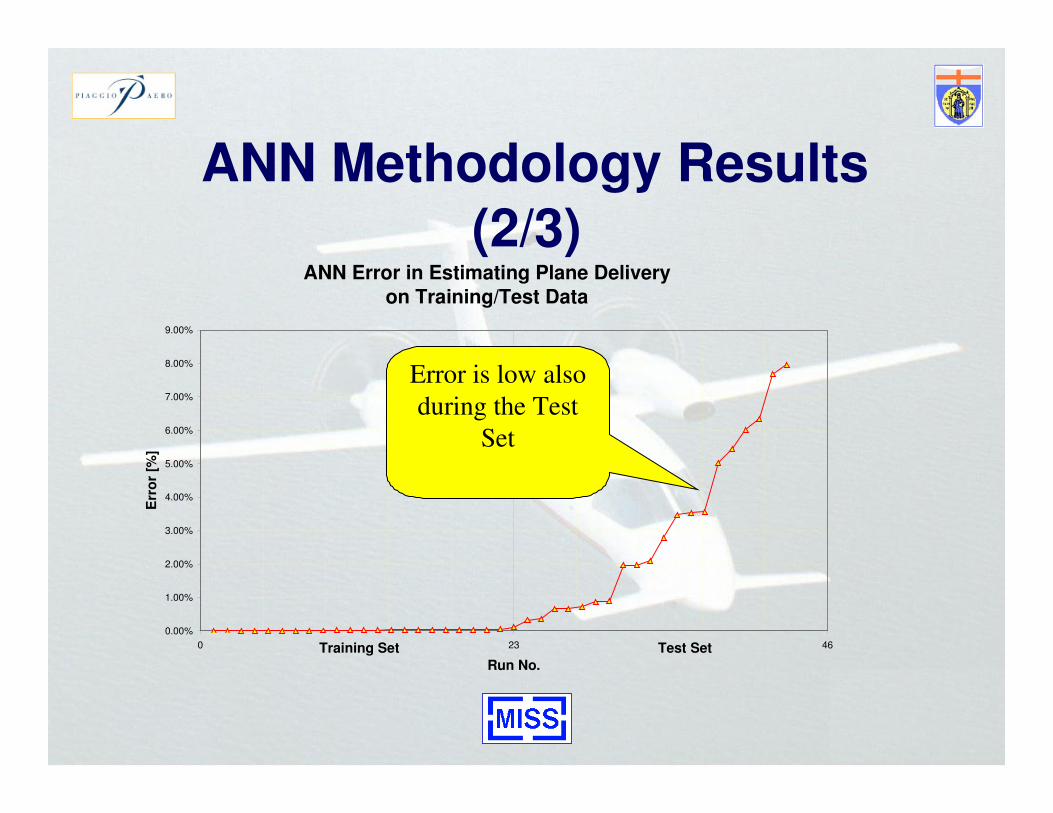
ANN Methodology Results
(2/3)ANN Error in Estimating Plane Delivery
on Training/Test Data
0.00%
1.00%
2.00%
3.00%
4.00%
5.00%
6.00%
7.00%
8.00%
9.00%
0 23 46
Run No.
Err
or
[%]
Test SetTraining Set
Error is low also
during the Test
Set
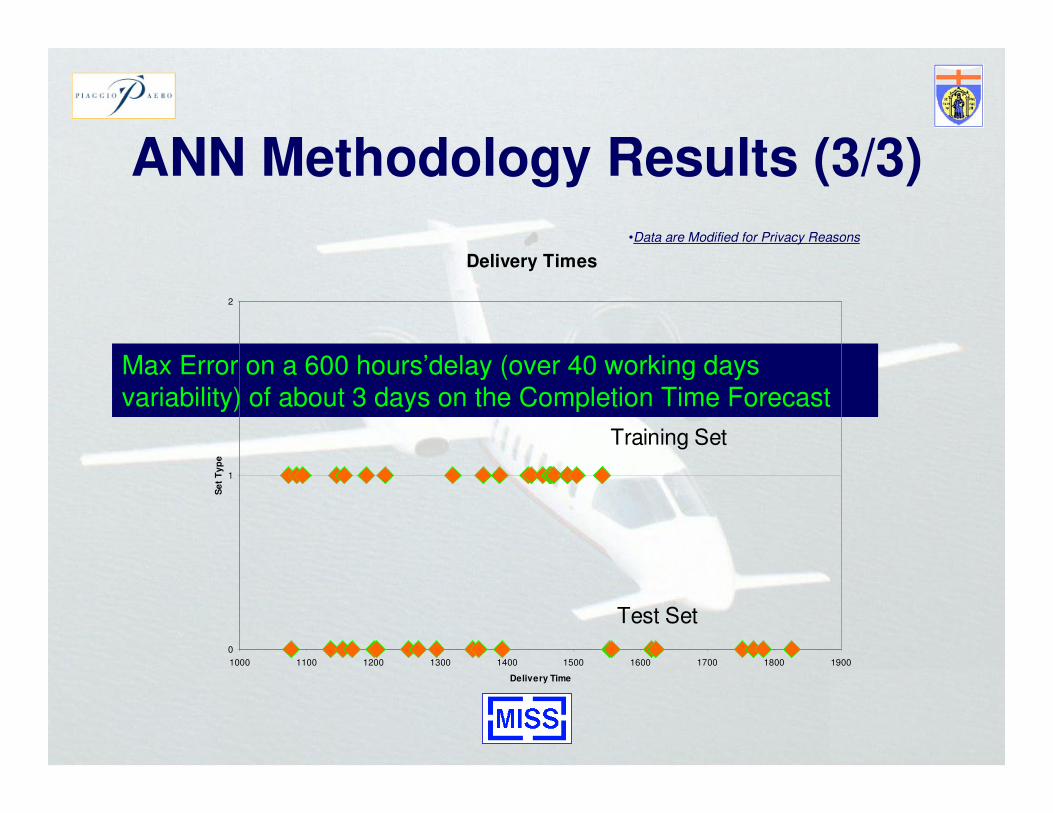
ANN Methodology Results (3/3)
•Data are Modified for Privacy Reasons
Max Error on a 600 hours’delay (over 40 working days
variability) of about 3 days on the Completion Time Forecast
Delivery Times
0
1
2
1000 1100 1200 1300 1400 1500 1600 1700 1800 1900
Delivery Time
Se
t T
yp
e
Training Set
Test Set
Conclusions• Developed Simulation has been successfully validated
on the P180 Assembling Line Scenario
• Simulation was able to identify a solution to guarantee
18 Weeks Lead Time without Manpower and
Machinery Costs increase
• This Analysis has demonstrated the possibility of:
• 15% WIP Reduction
• 25% – 33% Off Planes inside the Assembling Line
• Saving 21.5k€/Plane on financial fees