advanced multi-residue screening in veterinary drug
TRANSCRIPT

INTRODUCTION
A wide variety of veterinary drugs are currently available for antibiotic use in livestock around the world. In many countries, including EU member states and the US, testing for these compounds in animal based food products is mandatory and the permissible concentration levels are strictly regulated. Due to the complexity of matrices (e.g. muscle tissues, urine, milk) and the large number of potential analytes, it is beneficial to use a generic analytical method applicable to a diverse range of samples, which can be reprocessed post-acquisition if ‘food scares’ arise.
Traditionally, veterinary drug residues in biological matrices are analyzed by microbiological or immuno-chemical techniques. While these tests can provide a rapid and cost effective screening method for certain classes of compound, they are generally only suitable for one analyte or class, or do not give quantitative results. Currently, therefore, a large number of single residue or group-specific methods of analysis are required in order to analyze a wide array of veterinary drugs.
HPLC with UV or fluorescence detection has been used for quantitation and confirmation of screening results for some time, but in order to obtain sufficient sensitivity and selectivity, extensive cleanup of the samples is often required. More recently, in response to and in anticipation of stricter legislation, many analysts have taken advantage of the increased quantitative and confirmatory capabilities of LC-MS/MS. However, the increased experimental setup and inherently selective nature of multiple reaction monitoring (MRM) type experiments are restrictive when analytes of interest have not been targeted in the initial sample analysis. This makes post acquisition reprocessing and the discovery of unknown contaminants practically impossible.
This application note demonstrates the feasibility of a truly generic LC-MS method for the analysis of potentially unlimited contaminants with minimal sample preparation. UPLC-ToF MS offers several advantages for such analysis over other techniques. The Waters®
ACQUITY UPLC™ system utilizes novel column packing material with a 1.7 μm particle size, operated at elevated pressure to obtain maximum speed and resolution from a chromatographic run(1). The Waters LCT Premier™ oa-ToF mass spectrometer with W-Optics and DRE offers unparalleled full spectral sensitivity with <3ppm mass accuracy across a wide dynamic range. The data produced by this combination is rich in information, and has the advantage of being untargeted. Waters ChromaLynx™ Application Manager, an optional feature of Waters MassLynx™Software, quickly and efficiently deconvolutes mass spectra from complex chromatograms to present the user with a readily accessible and easy to interpret dataset. Screening is carried out by comparison to a limitless library of experimental and/or theoretical spectra and further confirmation of identified compounds is presented at-a-glance by accurate mass scoring.
Waters ACQUITY UPLC with LCT Premier Mass Spectrometer.
J.A. van Rhijn1, C. Bourgeon1, J.J.P.Lasaroms1, E. Oosterink1 and D. McMillan2
1RIKILT Institute of Food Safety, Wageningen, The Netherlands2Waters Corp. MS Technologies Centre, Manchester, UK.
ADVANCED MULTI-RESIDUE SCREENING IN VETERINARY DRUG
ANALYSIS USING UPLC™-ToF MS

METHODS
Sample PreparationMilk (1mL) was mixed with acetonitrile (1mL) to effect precipitation of proteins. The supernatant was isolated and diluted five-fold with water and was ultrafilteredover a disposable UF device with a molecular weight cut-off (MWCO) of 30 kDa. An aliquot of 16.6 μL of the ultrafiltrate was injected in the UPLC-ToF system without further sample purification.Extracted matrix matched standard solutions were prepared with 41 compounds from five classes (tetracyclins, sulfonamides, quinolones, macrolidesand benzimidazoles) at 0.5, 1, 2, 5, 10, 25, 50 and 100 μg/L concentrations by adding the appropriate analytes to milk samples prior to processing. These concentrations cover the relevant concentration range with respect to the maximum residue limit (MRL) of the analytes. The spiked samples were allowed to rest for at least 30 minutes before extraction was started to allow adequate equilibration of analytes with the sample matrix.
LC ConditionsLC System Waters ACQUITY UPLCMobile Ph. A 0.1% formic acidMobile Ph. B AcetonitrileColumn Waters ACQUITY BEH C18
1.7 μm, 2.1 x 50 mmColumn Temp 40 °CFlow Rate 350 μL/minInjection Volume 16.6 μL (calibrated)Cycle Time 9 minutesGradient t = 0 min 0% B
t = 1 min 0% Bt = 6 min 40% Bt = 7.5 min 100% B
MS ConditionsInstrument Waters LCT PremierIon Mode Electrospray +Capillary V 3200 VAperture 1 V 8 V & 30 VSource T 120 °CDesolvation T 400 °CGas Flow 600 L/hrMass Range 100 – 1000 DaResolution 10000 FWHM (W-mode)Acq. Time 0.2 sCalibration NaCH2O2
LockSpray™ Leucine Enkephalinreference [M+H]+ = 556.2771Da
RESULTS & DISCUSSION
Prior to software-assisted processing, the data were interrogated manually to determine the sensitivity on spiked compounds in milk. Using this targeted approach for known analytes also enabled an investigation of the quantitative capability of the UPLC-ToF system. Figure 1 shows good linearity was observed and that the LoD/LoQ are much lower than the MRL concentration.
Figure 1. Quantitation of Flumequine. Chromatogram shown is 0.1 x MRL concentration.
Other parameters, as shown in Figure 3, allow a user to specify peak width and noise limits; rejection factors to avoid multiple occurrences of the same component and internal standard detection parameters if semi-quantitative work is required. A library search method is also created which specifies which libraries to use; how many ions to search against; maximum number of hits and any screening parameters. With these methods in place, a search or a screen can be performed using nominal masses, and is therefore not restrictive as an exactmass library would be. Instead, an extra suite of accurate mass parameters is included which allows the n most intense ions from a deconvoluted mass spectrum to be scored by proximity to the theoretical exact mass of the compound from its library formula. Using this method, not only can a library hit be confirmed at-a-glance, but any fragments formed by in-source CID also have an elemental composition based on that of the parent ion assigned to them, which makes structural elucidation much easier.
Figure 4 overleaf shows the ChromaLynx browser results for a milk sample spiked with several veterinary drugs at a concentration of 10 μg/L -equivalent to the lowest MRL of any of the 41 compounds. The two compounds required to be reported at this level are Flubendazole and Oxfendazole, both of which have been correctly assigned by reference to the library created from standards.
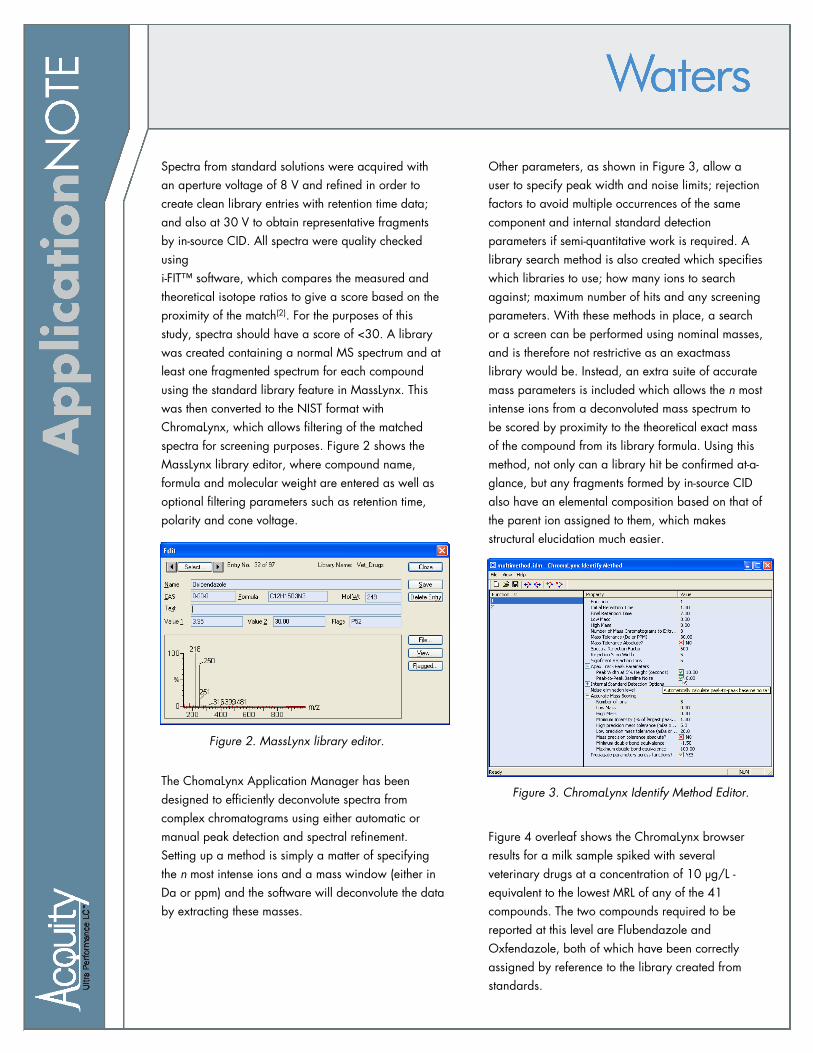
Spectra from standard solutions were acquired with an aperture voltage of 8 V and refined in order to create clean library entries with retention time data; and also at 30 V to obtain representative fragments by in-source CID. All spectra were quality checked using i-FIT™ software, which compares the measured and theoretical isotope ratios to give a score based on the proximity of the match(2). For the purposes of this study, spectra should have a score of <30. A library was created containing a normal MS spectrum and at least one fragmented spectrum for each compound using the standard library feature in MassLynx. This was then converted to the NIST format with ChromaLynx, which allows filtering of the matched spectra for screening purposes. Figure 2 shows the MassLynx library editor, where compound name, formula and molecular weight are entered as well as optional filtering parameters such as retention time, polarity and cone voltage.
The ChomaLynx Application Manager has been designed to efficiently deconvolute spectra from complex chromatograms using either automatic or manual peak detection and spectral refinement. Setting up a method is simply a matter of specifying the n most intense ions and a mass window (either in Da or ppm) and the software will deconvolute the data by extracting these masses.
Figure 3. ChromaLynx Identify Method Editor.
Figure 2. MassLynx library editor.

Figure 4. ChromaLynx Application Manager showing Fenbendazole successfully screened from a multi-analyte spiked milk sample at its MRL concentration (10ppb).
measured mass to <5 ppm (in this case [M+H]+ ΔM = 1.0ppm). A secondary confirmation level of 5 – 20 ppmis also applied, so matches can still be made if thedata is compromised. As an additional quality check, elemental compositions can also be displayed by i-FIT score.
The table in Figure 5 overleaf shows a summary of the MRLs (where applicable), the level at whichChromaLynx screening gives a positive (tentative in brackets) identification and the LoDs for each of the spiked compounds. All library entries are correctly identified at or below their MRL.
Electrospray, being a ‘soft’ ionization technique, does not produce spectra with the same degree of fragmentation as other techniques, and therefore there are fewer matches to be made than with, for example, GC-MS libraries. Hence, in this study, candidates with a match factor (averaged from the high and low energy functions) over 500 are considered positively identified, and between 250 – 500 are defined as tentative.
As is clearly displayed, both compounds are positively identified by the green check mark as having a good match to the library entry. However, equally important is the green shaded elemental composition in the match window, showing that the library formula matches the

It is important to note at this point that, while in this study a mass accuracy of <5 ppm has been considered confirmatory, there is currently no such consideration in EU legislation. A sample found to contain any of the analytes should therefore be subject to further analysis. This is typically performed on a tandem quadrupole type MS/MS instrument, where product ion ratios are used for confirmation. The use of accurate mass spectra for confirmatory purposes is currently under investigation by many groups, and will require validation.
Figure 6. A selection of analytes included in this study. The analytical challenge lies in the diversity of structures and chemistries exhibited.
MRL/ Screened LoD/µg/L Level µg/L
Albendazole 100 100 (25) 0.10Albendazole Sulfoxide 100 25 (10) 0.20Fenbendazole 10 10 0.20Oxfendazole 10 10 (5) 0.10Oxfendazole Sulfone 100 (25) 0.10Mebendazole 100 (25) 0.20Levamisole 10 (5) 0.25Thiabendazole 100 10 0.20Flubendazole 10 0.05Oxibendazole 25 (5) 0.05Spiramycin 200 25 0.30Tilmicosin 50 10 (5) 0.50Tylosin 50 25 1.00Josamycin 25 0.20Tiamulin 5 (1) 0.05Valnemulin 10 0.10Lincomycine 150 10 0.20Nalidixic Acid (25) 0.10Oxolinic Acid 50 (10) 0.10Flumequine 50 100 (10) 0.10Norfloxacin 100 (50) 1.00Ciprofloxacin * 1.00Lomefloxacin (IS) 50 0.50Enrofloxacin 100 10Marbofloxacin 75 10 0.20Difloxacin 25 (5) 0.20Danofloxacin 30 50 (25) 0.20Cinchophen 100 (10) 0.10Sarafloxacin 50 (25) 0.20Dapsone 100 (25) 0.10Sulfadiazine 100 (100) 0.25Sulfamethoxazole 100 * 0.15Sulfamethazine 100 * 0.20Sulfadimethoxine 100 100 (10) 0.15Sulfadimidine 100 25 (10) 0.25Sulfadoxine 100 25 (10) 0.05Sulfaquinoxaline 100 (25) 0.20Doxycycline (-H2O) 100 (25) 0.40Tetracycline 100 (100) 1.00Oxytetracycline 100 (50) 0.50Chlorotetracycline 100 (50) 4.00
* = not in library
Ben
zim
idaz
oles
Mac
rolid
esTe
tra-
cycl
ines
Qui
nolo
nes
Sul
fona
mid
es
Figure 5. Summary table showing analytes’ MRL, screened concentration and estimated LoD in milk.
O
O
O
CH3
CH3
OH
CH3
O
O
O
OCH3
O
CH3
O
N CH3
CH3
OH
OO
CH3
OHCH3
O
CH3
CH3
S
O
O
NH2 NH2
N
N
CH3
F
N
O
O
OH N
OOOH
OOH
OH
OH
NH2
OH
CH3CH3
HHOH CH3
N
NH
NH
O
O
O
CH3
Dapsone
Mebendazole
Josamycin
Oxytetracycline
Danofloxacin
However, at this early stage it is the authors’ recommendation that preferably two mass spectral peaks with <5 ppm accuracy, acquired with a mass resolution of at least 10,000 FWHM should be considered. Matching measured and theoretical isotope ratios has proven a reliable and conclusive method for the correct assignment of an analyte’sidentity and, hence, stringent criteria for this should be compulsory.

Waters, ACQUITY UPLC, UPLC, LCT Premier, ChromaLynx, MassLynx, and i-FIT are trademarks of Waters Corporation.All other trademarks are the property of their respective owners.
©2006 Waters Corporation Produced in the U.S.A. April 2006 720001675EN SE-PDF
SUMMARY
• The method presented is suitable for the screening of multiple veterinary drug residues in real matrix samples.• A generic, minimal sample preparation for veterinary drug residues in milk samples is sufficient when analysis is
carried out by UPLC-ToF MS.• ChromaLynx deconvolution software effectively detects chromatographic peaks, even in complex matrices and
when compounds co-elute.• The resulting refined spectra are suitable for library matching against user-compiled reference spectra.• Increased chromatographic resolution from UPLC separation helps to minimize matrix effects and obtain analyte
peaks suitable for quantitation in the ToF analyzer.• Spectra with high mass accuracy and correct isotope ratios are valuable aids to the identification of
contaminants, and may be appropriate for confirmatory analysis.
REFERENCES
1. Swartz M. E., UPLC™, An Introduction and Review, J. Liquid Chromatography and Related Technologies, 2005, 28(7-8), pp 1253-1263.
2. Hobby K., A Novel Method of Isotope Prediction Applied to Elemental Composition Analysis. Poster, presented at BMSS 2005. Waters literature code 720001345EN.