advanced natural gas fuel tank project · the advanced natural gas fuel tank project advanced...
TRANSCRIPT
E n e r g y R e s e a r c h a n d D e v e l o p m e n t D i v i s i o n I N T E R I M / F I N A L P R O J E C T R E P O R T
ADVANCED NATURAL GAS FUEL TANK PROJECT
JUNE 2016 CE C-500-2016-038
Prepared for: California Energy Commission Prepared by: Department of Physics and Astronomy, University of Missouri
PREPARED BY: Primary Author(s): Peter Pfeifer Robert Little Tyler Rash Jimmy Romanos Brett Maland University of Missouri Department of Physics and Astronomy Columbia, MO 65211 Phone: 573-882-2335 http://all-craft.missouri.edu Contract Number: 500-08-022 Prepared for: California Energy Commission Reynaldo Gonzalez Contract Manager Aleecia Gutierrez Office Manager Energy Generation Research Office Laurie ten Hope Deputy Director ENERGY RESEARCH AND DEVELOPMENT DIVISION Robert P. Oglesby Executive Director
DISCLAIMER This report was prepared as the result of work sponsored by the California Energy Commission. It does not necessarily represent the views of the Energy Commission, its employees or the State of California. The Energy Commission, the State of California, its employees, contractors and subcontractors make no warranty, express or implied, and assume no legal liability for the information in this report; nor does any party represent that the uses of this information will not infringe upon privately owned rights. This report has not been approved or disapproved by the California Energy Commission nor has the California Energy Commission passed upon the accuracy or adequacy of the information in this report.
i
ACKNOWLEDGEMENTS
The authors gratefully acknowledge the invaluable and essential contributions of the following persons, groups, and businesses to the successful completion of this project.
Rey Gonzalez and McKinley Addy, Contract and Project Managers, for their assistance and advice.
Henry Mak and Southern California Gas Company (SoCalGas) for their significant contribution of matching funds.
MeadWestvaco for their generous donation of 400 lbs. of high quality activated carbon.
Midwest Energy Solutions for loan of a Phill Fuelmaker home fueling compressor.
Robert Bonelli, ANGP Inc. for his commercialization efforts that connected many interested persons and businesses.
Phil Buckley, Buckley Engineering, LLC.
Christian Bach, Michael Eaves, Louis Herring, Doug Horne, Henry Mak, Diane Lewis, Steve Ragan, Tom Sewell, Dale Van Gundy, and Mike Veenstra, PAC members.
Lucyna Firlej, U. Montpellier II, France.
Bogdan Kuchta, U. Marseille, France.
Michael Roth, Northern Iowa University.
Pedro Santos and Jimmy Romanos, Oscomp Systems, Inc.
University of Missouri Contributors
Matt Beckner, Chris Blessing, Jacob Burress, Nag Chada, Carleton Clay, Elmar Dohnke, Tyler Klein, Lindsey Ortiz, Yuchoong Soo, David Stalla, Sean Sweany, Daniel Van Hoesen, Carlos Wexler, and Josh Willis, The ALL-CRAFT Team (Alliance for Collaborative Research on Alternative Fuel Technology).
Mark Lee, Chemistry Department.
Galen Suppes and Ali Tekeei, Chemical Engineering Department.
Yuyi Lin and Hao Xu, Department of Mechanical and Aerospace Engineering.
Rod Schlotzhauer, Ed Honse, Daniel Lynch, and Sam Potts, Physics Machine Shop.
Tyeece Little, Rachel Smith, and Marianne Friedman for managing contractual and fiscal matters.
ii
PREFACE
The California Energy Commission Public Interest Energy Research (PIER) Program supports public interest energy research and development that will help improve the quality of life in California by bringing environmentally safe, affordable, and reliable energy services and products to the marketplace.
The PIER Program conducts public interest research, development, and demonstration (RD&D) projects to benefit California.
The PIER Program strives to conduct the most promising public interest energy research by partnering with RD&D entities, including individuals, businesses, utilities, and public or private research institutions.
PIER funding efforts are focused on the following RD&D program areas:
• Buildings End-Use Energy Efficiency
• Energy Innovations Small Grants
• Energy-Related Environmental Research
• Energy Systems Integration
• Environmentally Preferred Advanced Generation
• Industrial/Agricultural/Water End-Use Energy Efficiency
• Renewable Energy Technologies
• Transportation
Advanced Natural Gas Fuel Tank Project is the final report for the Advanced Natural Gas Fuel and Tank project , contract number 500-08-022, conducted by the Deapartment of Physics and Astronomy at the University of Missouri, Columbia, MO. The information from this project contributes to PIER’s Transportation Program.
When the source of a table, figure, or photo is not otherwise credited, it is the work of the author of the report.
For more information about the PIER Program, please visit the Energy Commission’s website at www.energy.ca.gov/research/ or contact the Energy Commission at 916-327-1551.

iii
ABSTRACT
The Advanced Natural Gas Fuel Tank Project advanced adsorbed natural gas technology that uses low pressure, light-weight fuel tanks filled with high-capacity adsorbent materials. For light-duty vehicles, low-pressure conformable tanks can replace heavy, expensive compressed natural gas tanks and be located in a vehicle’s unused spaces. Compressed natural gas applications such as heavy-duty trucks and storage facilities also benefit from adsorbed natural gas because even at compressed natural gas pressures, storage is increased when adsorbent materials are added to the tanks. The research covers four primary areas: (1) development and improvement of natural gas adsorbents that produced activated carbons; (2) design and construction of a 40-liter light-weight, conformable natural gas fuel tank, (3) construction of an on-road absorbed natural gas system simulator; and (4) analysis of costs of adsorbed natural gas vehicles and fueling stations to show the cost advantages of absorbed natural gas over compressed natural gas.
Keywords: University of Missouri, adsorbed natural gas, natural gas, fuel tanks, adsorbents, nanoporous carbon, flat panel tank, CNG, on-road simulator, activated carbon, monoliths, cost analysis, light-duty vehicles, storage tanks, home fueling
Please use the following citation for this report:
Pfeifer, Peter, Robert Little, Tyler Rash, Jimmy Romanos, Brett Maland. (University of Missouri, Columbia, MO). 2014. Advanced Natural Gas Fuel Tank Project. California Energy Commission. Publication number: CEC-500-2016-038.
iv
TABLE OF CONTENTS
Acknowledgements ................................................................................................................................... i
PREFACE ................................................................................................................................................... ii
ABSTRACT .............................................................................................................................................. iii
TABLE OF CONTENTS ......................................................................................................................... iv
LIST OF FIGURES .................................................................................................................................. vi
LIST OF TABLES ...................................................................................................................................... x
EXECUTIVE SUMMARY ........................................................................................................................ 1
Introduction ........................................................................................................................................ 1
Project Purpose ................................................................................................................................... 1
Project Benefits ................................................................................................................................... 2
CHAPTER 1: Introduction ...................................................................................................................... 1
1.1 Background ................................................................................................................................. 1
1.2 Factors Impeding the Use of Natural Gas as a Vehicle Fuel ................................................ 1
1.3 NG Fueled Vehicles ................................................................................................................... 2
1.3.1 Vehicle Driving Range ....................................................................................................... 2
1.3.2 NG Fueling Stations ........................................................................................................... 2
1.4 Natural Gas Fuel Advantages .................................................................................................. 2
1.5 Alternative Technology – Adsorbed Natural Gas (ANG) .......................................................... 3
Chapter 2: Technical Background ......................................................................................................... 4
2.1 Adsorbed Natural Gas (ANG) vs. Compressed Natural Gas (CNG) ................................. 4
2.2 Storage Capacity — Why ANG Tanks Hold More Fuel than CNG Tanks ........................ 5
2.3 Instrumentation for Evaluating Nanoporous Carbon Performance ................................... 6
2.4 Adsorption Metrics .................................................................................................................... 7
2.5 Outgassing .................................................................................................................................. 8
Chapter 3: Adsorbent Engineering: Carbon Powders ..................................................................... 11
3.1 Precursor Materials .................................................................................................................. 12
3.2 Adsorption Studies I – Nanoporous Carbon Powders ....................................................... 12
v
3.2.1 KOH Activation ................................................................................................................ 13
3.2.2 Parametric Studies ........................................................................................................... 15
3.3 Adsorption Studies II: Top Performing Powders and Monoliths ..................................... 21
3.4 MU Monoliths and Powders Compared to Competing Adsorbents ................................ 24
Chapter 4: Monolith Engineering ....................................................................................................... 27
4.1 Best Performing Monoliths ..................................................................................................... 27
4.1.1 BR-0162 — Best Performing Monolith Made with MU Precursor Carbon .............. 27
4.1.2 BR-0311 — Best Performing Monolith Made with MeadWestvaco Carbon ............ 28
4.1.3 Homogeneity of Monolith BR-0311 ............................................................................... 29
4.1.4 Monolith Research — Details ......................................................................................... 31
4.1.5 0.5-Inch Monoliths (Pellets) ............................................................................................ 31
4.1.5 Binder Studies — Poly-vinylidene Chloride ................................................................ 31
4.1.6 Monolith Reproducibility ............................................................................................... 34
4.1.7 Binder Studies — Polyvinyl Alcohol ............................................................................. 35
4.1.8 PVA Monolith Pyrolysis Procedure .............................................................................. 36
Chapter 5: Monolith Production for the Advanced Flat Panel Tank Assembly ........................ 38
5.1 Design of Monolith Dies ......................................................................................................... 38
5.2 Monolith Production ............................................................................................................... 40
5.2.1 Binder and Carbon Mixing ............................................................................................. 40
5.2.2 Monolith Production ....................................................................................................... 41
5.2.3 Pyrolysis of green body monoliths ................................................................................ 43
5.2.4 Quality control measurements ....................................................................................... 44
5.2.5 Monolith Machining ........................................................................................................ 46
5.3 Populating the Flat Panel Tank with Machined Monoliths ............................................... 47
Chapter 6: Advanced Flat Panel Tank Assembly — Construction, Operation and Performance ............................................................................................................................................. 49
6.1 Analysis of the 2007 University of Missouri Prototype ANG Tank ................................. 49
6.2 Highlights of “Evaluation of the 2007 University of Missouri Adsorbed Natural Gas Tank – Performance Report and Recommendations Report” ....................................................... 49
vi
6.2.1 Methane Adsorption of Truck Tank Monoliths. .......................................................... 50
6.2.2 Thermogravimetry/Mass Spectrometry (TGA/MS) Analysis of Guard Bed Carbon and Tank Monoliths ......................................................................................................................... 51
6.2.3 ANG Tank Storage ........................................................................................................... 52
6.2.4 Recommendations ............................................................................................................ 53
6.3 Theoretical Model of New Tank Design ............................................................................... 53
6.4 Flat Panel Tank Design ............................................................................................................ 53
6.5 Advanced Flat Panel Tank Assembly ................................................................................... 57
6.5.1 Operational Procedures ................................................................................................... 59
6.6 Simulated Road Tests .............................................................................................................. 60
6.7 Marketability of the University of Missouri ANG tank ..................................................... 64
Chapter7: Cost Analysis ........................................................................................................................ 65
7.1 Carbon Cost .............................................................................................................................. 65
7.2 Tank Cost................................................................................................................................... 66
7.3 Ancillary Components ............................................................................................................ 68
7.4 Fuel Cost Savings Realized by ANG Owners ...................................................................... 70
7.4.1 At-Home Fueling ............................................................................................................. 70
7.4.2 Large Scale Fueling Stations ........................................................................................... 71
7.4.3 Conclusion......................................................................................................................... 72
Chapter 8: Delivered Action Items ..................................................................................................... 74
Glossary .................................................................................................................................................... 78
References................................................................................................................................................. 80
Appendix A: Instrumentation for Evaluating Nanoporous Carbon Performance .................. A-1
Appendix B: Table of Best Performing 3.5-Inch Monoliths ........................................................ B-1
Appendix C: 40-Liter Thin-Wall Aluminum Tank Schematics ................................................... C-1
Appendix D: Advanced Flat Panel Tank Assembly Schematic ................................................. D-1
LIST OF FIGURES
Figure 1: Illustration of Problems Associated with Petroleum-Based Fuels, Potential Alternatives and Advantage of Natural Gas Coupled with Adsorbent Technology ............................................. 1
vii
Figure 2: Volumetric Storage Capacity of an ANG Tank and a CNG Tank ...................................... 4
Figure 3: Comparison of ANG and CNG Tank Storage Capacity and Weight ................................. 5
Figure 4: 0.5 Liter Test Fixture .................................................................................................................. 6
Figure 5: Representative Gravimetric Excess Adsorption Isotherm for Methane and Activated Carbon Monoliths ...................................................................................................................................... 7
Figure 6: Comparison of the Effect of Time and Temperature on Outgassing of an Empty Sample Cell, Cell Filled with Powder Carbon, and Cell Filled with a Carbon Monolith ................ 9
Figure 7: Effect of Outgassing of Briquette 3K-110916 at 400°C and 600°C on Methane Adsorption Up to 35 Bar ......................................................................................................................... 10
Figure 8: Effect of Pore Width on Van der Waals Potential and Intrapore Gas Density ............... 11
Figure 9: Illustration of Excess Adsorption .......................................................................................... 11
Figure 10: Parts of the Corncob that Make Up the Commercial Product Used as the Precursor for Producing University of Missouri’s High-Performance Nanoporous Carbons .............................. 12
Figure 11: Patented Multi-Step Process for Producing Adsorbents and Monoliths ....................... 13
Figure 12: Activation Mechanism Above 700°C by the Penetration of Metallic Potassium into Three Carbon Monoliths Types ............................................................................................................. 14
Figure 13: Porosity Dependence on the KOH:C Weight Ratio and the Activation Temperature 15
Figure 14: BET Surface Area Dependence on the KOH:C Weight Ratio and the Activation Temperature.............................................................................................................................................. 16
Figure 15: Effect of KOH:C Weight Ratio and Activation Temperature on Pore Size Distribution .................................................................................................................................................................... 17
Figure 16: Volumetric Storage Capacity as a Function of KOH:C Weight Ratio and the Temperature.............................................................................................................................................. 18
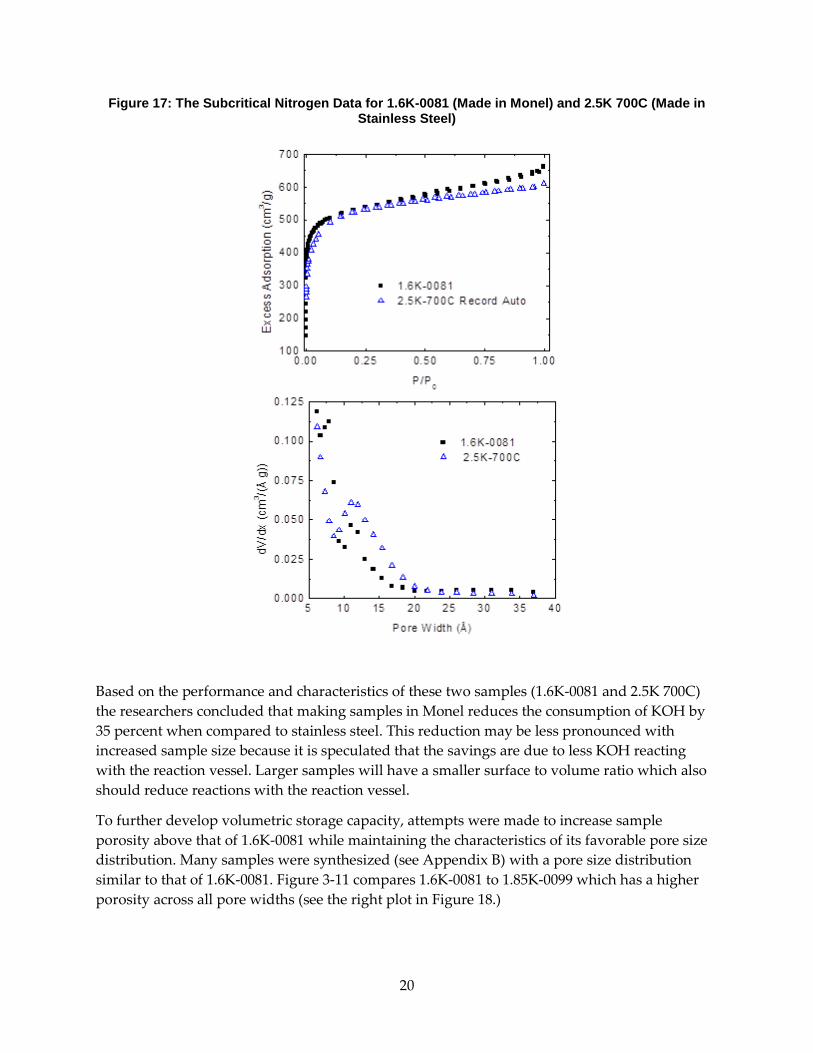
Figure 17: The Subcritical Nitrogen Data for 1.6K-0081 (Made in Monel) and 2.5K 700C (Made in Stainless Steel) .......................................................................................................................................... 20
Figure 18: Comparison of Excess Adsorption and Pore Size Distribution from the Subcritical Nitrogen Data for 1.85K-0099 and 1.6K-0081 ....................................................................................... 21
Figure 19: Comparison of the Volumetric Storage of 2.5K-0064 and Compressed Methane at Pressures Up to 140 Bar. .......................................................................................................................... 22
Figure 20: Comparison of the Volumetric Storage Capacity of Two University of Missouri Nanoporous Carbon Powders over a Wide Range of Pressures ....................................................... 23
Figure 21: At 35 Bar and 22°C, ANG Volumetric Storage Capacity is 5 Times Higher Than Compressed Methane .............................................................................................................................. 23

viii
Figure 22: Isothermal Delivery of Methane as a Function of Rail Pressure ..................................... 26
Figure 23: Typical 3.5-Inch Diameter by 0.75-Inch Height "Missouri Hockey Puck" Monolith ... 28
Figure 24: Best Performing Monolith, BR-0311, 3.5-Inch Diameter by 3.5-Inch Height................. 28
Figure 25: Illustration and Photos of Slices Cut from the BR-0311 Monolith and Their Density and Volumetric Storage Values .............................................................................................................. 30
Figure 26: Volumetric Storage Capacity Isotherms for the Four Slices Cut from Monolith BR-0311 ............................................................................................................................................................ 30
Figure 27: Die and Piston Used for Compacting 0.5-Inch Pellets (left), Die and Heater Assembly (center), and Manual Hydraulic Press (right) ...................................................................................... 31
Figure 28: Effect of Compaction Temperature and Pyrolysis Temperature on Volumetric Storage Capacity ..................................................................................................................................................... 33
Figure 29: Differential Pore Size Distribution and Cumulative Pore Volume of BR-0132 and BR-0311 ............................................................................................................................................................ 34
Figure 30: Comparison of Volumetric Storage Capacity of Re-Measured BR-0162 and the Reproduced Monoliths BR-0134 and BR-0163 ..................................................................................... 35
Figure 31: Prototype Extrusion-Compaction Machine ....................................................................... 37
Figure 32: Completed Die Components Showing the Die, Piston, Base, and Top ......................... 39
Figure 33: Die Base Detail ....................................................................................................................... 39
Figure 34: Assembled Die ....................................................................................................................... 40
Figure 35: Heating Jacket and Controller ............................................................................................. 40
Figure 36: Four Rock Tumblers Holding Activated Carbon, Binder, and Ball Bearings for Blending Binder and Carbon .................................................................................................................. 41
Figure 37: Die Assembly in the Hydraulic Press with Extruded Monolith ..................................... 42
Figure 38: Five Pressed Die Assemblies Being Heated ....................................................................... 43
Figure 39: Typical Green Body Monolith, 3.5-Inch Diameter by 3.5-Inch Height .......................... 43
Figure 40: Tube Furnace Containing a Green Body Monolith for Pyrolysis ................................... 44
Figure 41: Volumetric Storage Capacity Isotherms for 10 Quality Control Monoliths Produced for the Flat Panel Tank Assembly .......................................................................................................... 46
Figure 42: Monoliths Manufactured for the Flat Panel Tank Assembly .......................................... 46
Figure 43: Chamber Configurations of the Flat Panel Tank ............................................................... 47
Figure 44: Monolith Machined to Fit an Interior Chamber of the Flat Panel Tank ........................ 47
ix
Figure 45: Machined Monoliths Assembled for Loading into the Flat Panel Tank ........................ 48
Figure 46: Flat Panel Tank Populated with Monoliths ....................................................................... 48
Figure 47: NG Vehicle with Prototype Tank and Fuel Delivery System .......................................... 49
Figure 48: Portion of the Tank Section and Monoliths from the 2007 Prototype Tank .................. 50
Figure 49: Volumetric Storage Capacity of Four Monoliths Removed from the NG Truck Tank 50
Figure 50: Average Gravimetric Excess Adsorption of Four Monoliths Removed from the Truck Tank Compared to Br 46 Isotherms ....................................................................................................... 51
Figure 51: TGA/MS of Guard Bed Carbon Taken from the Top (left) and Bottom (right) of the ANG Tank ................................................................................................................................................. 51
Figure 52: TGA/MS Results for Two Monoliths from the Tank ........................................................ 52
Figure 53: Early Flat Panel Tank Designs ............................................................................................. 54
Figure 54: Performance Specifications for a Steel Prototype 1 and Aluminum Prototype 2 Tank .................................................................................................................................................................... 54
Figure 55: First 40-Liter Flat Panel Tank Made of Steel ...................................................................... 55
Figure 56: 9-Liter and 6-Liter Prototype Aluminum Tanks ............................................................... 55
Figure 57: Main Schematic for the 40-Liter Thin-Wall Aluminum Tank. ........................................ 56
Figure 58: Unwelded 40-Liter Thin-Wall, Conformable Aluminum Tank, Assembled ................ 56
Figure 60: Early Design Schematic of the Advanced Flat Panel Tank Assembly ........................... 57
Figure 61: Wall Mounted Advanced Flat Panel Tank Assembly ...................................................... 58
Figure 62: Schematic Representation of the Advanced Flat Panel Tank Assembly ....................... 59
Figure 63: Volumetric Storage During Slow Fill (left axis) and Delivery (right axis) .................... 60
Figure 64: Tank Pressure and Temperature During an 8 Minute Fast Fill and Delivery .............. 60
Figure 65: Amount of Fuel Delivered .................................................................................................... 61
Figure 66: Pressure and Temperature at the Tank Inlet as a Function of Time During the Fast Fill .................................................................................................................................................................... 61
Figure 67: Zoomed in Pressure and Temperature at the Tank Inlet as a Function of Time During the Fast Fill ................................................................................................................................................ 62
Figure 68: FPTA’s Flow Rate as Function of Pressure ........................................................................ 62
Figure 69: Predicted Flow Rate Capability as a Function of Tank Capacity and Pressure to 30 bar. .............................................................................................................................................................. 63
x
Figure 70: Predicted Flow Rate Capability as a Function of Tank Capacity and Pressure to 5 Bar .................................................................................................................................................................... 63
Figure 71: Graphic of an Aluminum CNG Tank ................................................................................. 67
Figure 72: Graphic of an Aluminum ANG Tank ................................................................................. 67
Figure 73: Components of a CNG Conversion Kit .............................................................................. 68
Figure 74: Components of an ANG Conversion Kit ........................................................................... 69
Figure 75: Wilco Machine and Fab Stacked Horizontal Storage Vessels ......................................... 72
Figure A1: Quantachrome Autosorb-1 Instrument ........................................................................... A-1
Figure A2: Quantachrome Quadrasorb .............................................................................................. A-1
Figure A3: Hiden HTP-1 Instrument ................................................................................................... A-2
Figure A4: 0.5 Liter Test Fixture ........................................................................................................... A-2
Figure A5: Rapid Methane Screening Instrument (RMS) ................................................................. A-3
Figure C1: Schematics for 40-liter Thin-Wall Flat Panel Tank ......................................................... C-1
Figure D1: Functional Schematic of the Advanced Flat Panel Tank Assembly ............................ D-1
LIST OF TABLES
Table 1: Effect of Outgassing with and without Heat on Gravimetric Excess Adsorption of Powder Carbon and Monolith ................................................................................................................. 9
Table 2: Summary and Comparison of the Volumetric Storage of University of Missouri Nanoporous Carbon Powders and MSC-30 and Storage Targets ..................................................... 21
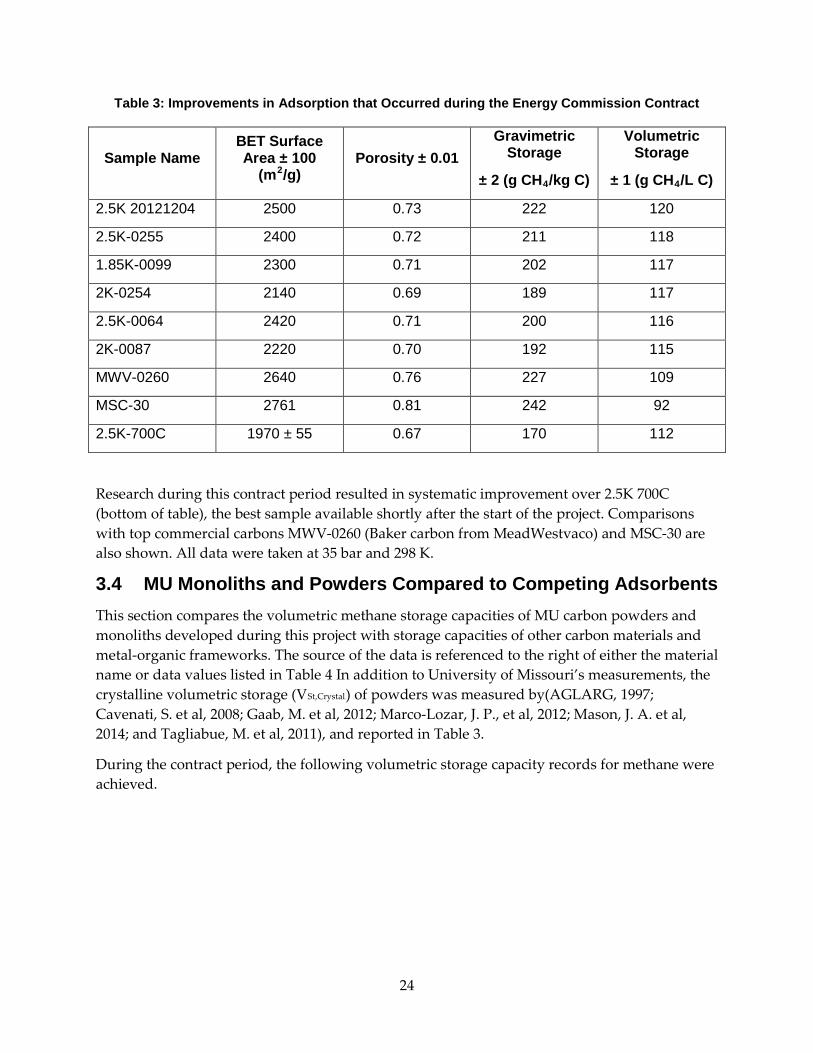
Table 3: Improvements in Adsorption that Occurred during the Energy Commission Contract 24
Table 4: Volumetric Storage Capacities of University of Missouri Carbons, Select MOFs, and AGLARG Monoliths ................................................................................................................................ 25
Table 5: Sample Characterization and Methane Uptake of Monoliths BR-0162 and BR-0311 ...... 29
Table 6: Data Taken at 35 Bar and 25 C° ............................................................................................... 29
Table 7: Examples of Volumetric Storage Capacities Resulting from Variation of Fabrication Parameters ................................................................................................................................................. 32
Table 8: Volumetric Storage Capacity of Pellets Made with PVA Compared to Pellets Made with PVDC ......................................................................................................................................................... 36
Table 9: Quality Control of MWV Carbon Powder ............................................................................. 45
xi
Table 10: Quality Control of 118 University of Missouri Monoliths ................................................ 45
Table 11: ANG Tank Storage Methods ................................................................................................. 52
Table 12: Description of Cylindrical Tank Types ................................................................................ 66
Table 13: Comparison of the Cost of Production Volumes of ANG and CNG Tanks ................... 68
Table 14: Summary of Cost of Ancillary Components for ANG and CNG Systems ...................... 70
Table 15: Cost Per GGE of ANG and CNG Systems ........................................................................... 70
Table 16: Comparative Cost of 0Compressing ANG and CNG Tanks ............................................. 71
Table 17: Comparison of the Total (Operating and Fueling) Cost Per GGE of Converting a Vehicle to ANG and CNG ...................................................................................................................... 73
1
EXECUTIVE SUMMARY
Introduction Continued rising prices and crude oil supply uncertainties are pushing petroleum-based fuel consumers to look for viable alternatives. A leading candidate is natural gas, now widely available and abundant due to improved extraction technology. Currently, compressed natural gas (CNG) is used however CNG tanks are bulky, cylindrical, and heavy-walled, wasting material and valuable space. As an alternative, adsorbed natural gas (ANG) tanks can be used because they are flat, solid-state, and light-weight. For this project, the researchers developed and demonstrated adsorbed natural gas (ANG) storage technology to help increase California's use of natural gas as motor fuel for the state’s on-road transportation fuel from the less than 1 percent to 19 percent by 2050. The unique tanks are filled with highly adsorbent material (a substance that attracts particles to its surface in this case micro-porous activated carbon) to increase gas storage capacity and are conformable to fit in a vehicle’s unused spaces. This development will lay the foundation to commercialize low pressure, low-cost, and flat panel natural gas fuel tanks for vehicles and fueling stations.
Project Purpose The research team explored materials to replace bulky, cylindrical, heavy-walled CNG tanks with flat, solid-state, light-weight tanks that store ANG in next-generation clean vehicles. The flat or conformable tank, made possible by the low pressure in the ANG tank, can integrate into the chassis or other unused space of a car, options that are not possible with heavy-walled high-pressure CNG tanks. The tank will make natural gas vehicles a more attractive alternative to gasoline and diesel vehicles.
Two major tasks of the research were to design and build an advanced integrated, light-weight advanced flat panel tank assembly to simulate ANG tank operation based on supporting research and estimate and compare the cost of ANG technology and compressed natural gas (CNG). Supporting research included improving the adsorption capacity of the activated carbon, developing a process for compacting carbon into monoliths (briquettes), and designing and building prototype conformable tanks.
The team expects this project to help promote natural gas use as a vehicle fuel by demonstrating that ANG technology offers significant advantages over CNG. These advantages include costs for vehicle conversion, fuel tanks, gas compression, compressors, home fueling and fueling stations. ANG technology will also replace expensive cylindrical tanks that occupy passenger, luggage, or payload space with low-cost flat tanks that fit in available vehicle spaces. Future objectives include working with industry to make NGV products achieve a sustainable market through commercial pilot projects such as large-scale ANG tanks for fueling stations, NG delivery to locations that are not served by NG pipelines, and storage of biomethane on, and bulk transportation from, farms and other production locations with uneconomical pipeline options.
The research team developed nanoporous carbon, manufactured from corncob in a multistep process (patents awarded), with a storage capacity 180 times its own volume. It also holds five
2
times what a tank without carbon would hold at 35 bar. Corncob is a low-cost raw material, ensuring low tank costs and production from domestic sources.
Marketing of the University of Missouri ANG tank involved numerous presentations to interested investors. Commercialization licenses have been signed with Adsorbed Natural Gas Products, Inc. and partners for light-duty vehicle application and another licensee for NG transportation and stationary storage, and University of Missouri is collaborating with General Electric for a home-fueling station.
Project Benefits The cost of ANG is estimated by comparing the costs of materials and components required for ANG technology versus CNG based on a typical 4-cylinder sedan with a 7.8 GGE (gasoline gallon equivalent) tank. The cost elements for ANG were broken down into four categories: carbon adsorbent, fuel tank, ancillary components and fuel cost savings.
• Using efficiencies and cost structure of companies operating in carbon and chemical markets, chemical and materials costs, the cost of producing carbon monoliths is estimated at $6.95 to $8.13 per pound depending on binder content. These estimates will differ if chemical recycling is employed, process methods are modified, and materials costs change.
• Light-weight, conformable tanks for ANG application (500 psi) can be extruded of aluminum at an estimated cost less than $300 compared to $2,500—$3,000 for a steel Type III CNG tank. Aluminum as a CNG tank material is shown to be impractical.
• Even though ANG requires additional components for natural gas conversion, the total cost is estimated to be less than cost of CNG conversion.
• Assuming a natural gas cost of $1.02 per GGE, and adding compressor and energy costs, home fueling an ANG tank costs $1.59 per GGE versus $2.94 per GGE for CNG.
Fueling station costs for ANG storage tanks and compressors are estimated to be 75 percent of the cost of CNG tanks and compressors.
The overall analysis supports that ANG likely has cost advantages compared to CNG, making ANG an attractive technology for fueling vehicles with natural gas.
1
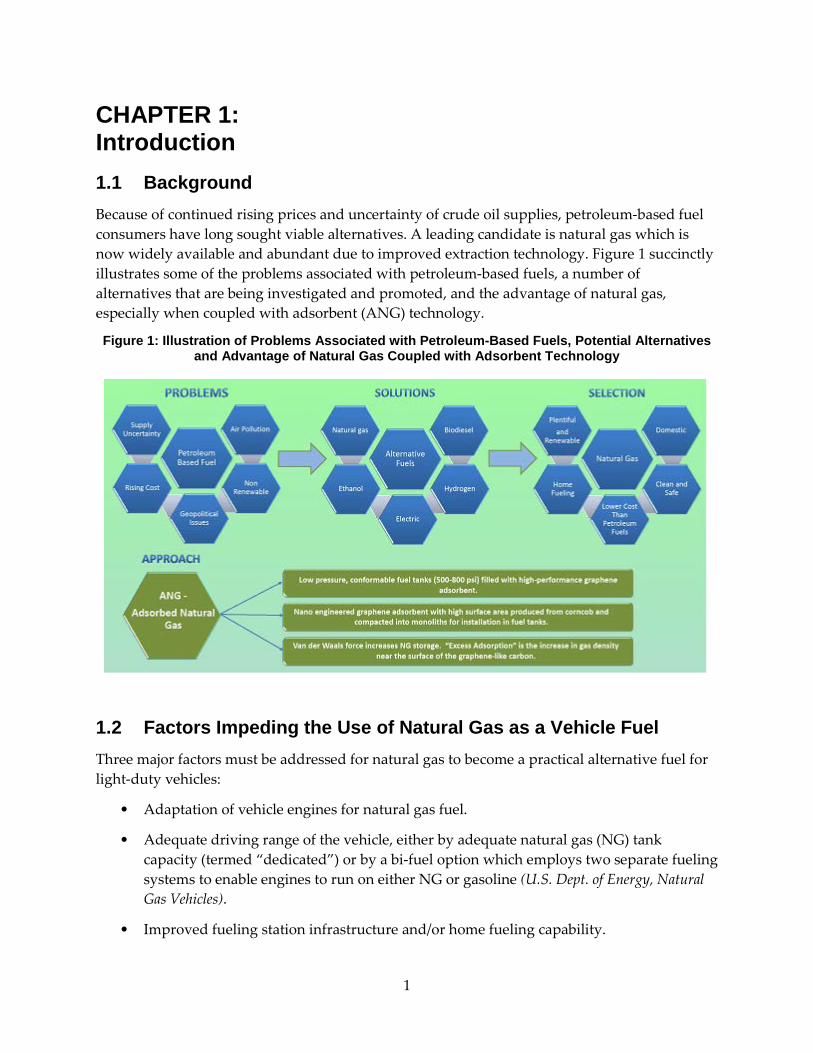
CHAPTER 1: Introduction 1.1 Background Because of continued rising prices and uncertainty of crude oil supplies, petroleum-based fuel consumers have long sought viable alternatives. A leading candidate is natural gas which is now widely available and abundant due to improved extraction technology. Figure 1 succinctly illustrates some of the problems associated with petroleum-based fuels, a number of alternatives that are being investigated and promoted, and the advantage of natural gas, especially when coupled with adsorbent (ANG) technology.
Figure 1: Illustration of Problems Associated with Petroleum-Based Fuels, Potential Alternatives and Advantage of Natural Gas Coupled with Adsorbent Technology
1.2 Factors Impeding the Use of Natural Gas as a Vehicle Fuel Three major factors must be addressed for natural gas to become a practical alternative fuel for light-duty vehicles:
• Adaptation of vehicle engines for natural gas fuel.
• Adequate driving range of the vehicle, either by adequate natural gas (NG) tank capacity (termed “dedicated”) or by a bi-fuel option which employs two separate fueling systems to enable engines to run on either NG or gasoline (U.S. Dept. of Energy, Natural Gas Vehicles).
• Improved fueling station infrastructure and/or home fueling capability.
2
1.3 NG Fueled Vehicles Although there are numerous foreign manufacturers that produce NG-ready vehicles, there is only one NG passenger vehicle available in the United States, the Honda Civic GX (now called the Civic Natural Gas), which utilizes compressed natural gas (CNG). Nevertheless, manufacturers are becoming more interested as consumers become more aware of the benefits of natural gas. Vehicle conversion companies have sprung up and some vehicle manufacturers are producing NG fueled light- and medium-duty pickup trucks. Most recently (2013), General Motors announced production in the fall of 2014 of a Chevrolet Impala designed to operate on gasoline and compressed natural gas.
1.3.1 Vehicle Driving Range Liquid fuels such as gasoline and diesel fuel have high energy densities per unit volume whereas gases have much lower density. Therefore, to improve the energy density of a gas it is either compressed or liquefied. The majority of current natural gas fueled vehicles, light- and heavy-duty, use CNG tanks, which compress the gas to fuel vehicle tanks up to 3600 psi. Achieving these high pressures is costly in terms of energy requirements, fueling station equipment, primarily compressors, and equipment maintenance. CNG technology also requires spherical or cylindrical tank geometry that is heavy and expensive. While this tank configuration may suffice for medium- and heavy-duty vehicles where space and weight are not a major concern, it is unsatisfactory for most light-duty vehicles except in a bi-fuel configuration. Light-duty vehicles using only natural gas will suffer significant loss of passenger and/or payload space or will have limited driving range that may be unacceptable to most drivers. An alternative to CNG, as shown in Figure 1, is to use conformable tanks filled with a highly adsorbent material to increase storage capacity at lower tank pressure. The benefit is lighter weight, lower cost tanks, preservation of passenger and payload space, reduced gas compression cost, feasible home fueling, and reduced vehicle cost compared to CNG configurations.
1.3.2 NG Fueling Stations The United States Department of Energy Alternative Fuels Data Center web page shows that as of March 2014, there were 677 public CNG stations in the United States. In addition, numerous local communities are investing in dedicated natural gas service vehicles and installing fueling stations as well. As demand for natural gas for fueling vehicles grows, there will be more fueling stations built and existing gasoline stations modified to provide natural gas. Although these stations operate at CNG pressures, they still can provide fueling for ANG vehicles and can serve as interim facilities until ANG technology develops to the point where lower pressure fueling stations become economically feasible.
1.4 Natural Gas Fuel Advantages In spite of the aforementioned drawbacks, there are strong incentives for using NG as a vehicle fuel, a prime reason being cost and availability. Estimates are that a gasoline gallon equivalent (GGE) cost of CNG is approximately $2.14. The reason for this low price relative to gasoline is
3
that hydraulic fracturing (fracking) to release natural gas has decoupled its price from the price of oil and opened many more sources of supply.
Since many homes have access to natural gas lines, home fueling of vehicles is attractive because of convenience and potentially even lower fuel cost. A few attempts have been made to manufacture and sell compressors for home fueling tanks to CNG pressures, but these home-fueling devices are expensive, on the order of $4,000 plus installation. Assuming gasoline priced at $3.65 a gallon and natural gas at $2.14 per GGE, a vehicle driven 15,000 miles a year with average fuel mileage of 25 mpg would save $906 a year. Thus, the compressor cost would be recovered in 4.4 years.
As Figure 1 shows, there are additional benefits to using natural gas as a vehicle fuel:
• Clean, emitting 6 percent to 11 percent lower levels of greenhouse gases than gasoline throughout the life cycle.
• Safe and available, having been safely used in many households for many years.
• Produced domestically and plentiful thereby reducing reliance on foreign fuel suppliers.
• Renewable – natural gas (RNG or biogas) can be produced at landfills and sewage treatment plants and from animal waste on farms for the highest greenhouse gas reduction.
• Does not require complicated and expensive chemical treatment such as is needed for gasoline, diesel, and ethanol production.
• Does not utilize food resources in the production process.
1.5 Alternative Technology – Adsorbed Natural Gas (ANG) The research reported herein describes the application of adsorbed natural gas technology to light-duty vehicles to show that NG can be used without sacrificing passenger and payload space and providing acceptable driving range. This technology replaces heavy, expensive CNG tanks with low pressure (500—800 psi) conformable tanks filled with adsorbent material, nanoporous graphene-like carbon, to increase tank storage capacity that can be located in various void spaces of the vehicle.
The report describes the design, construction, and operation of an on-road simulator, the Advanced Flat Panel Tank Assembly (FPTA), and the technology employed to design and fabricate a light-weight conformable tank and to produce high quality adsorbent that populates the tank.
Estimates of the cost of materials and components needed for an ANG system and the feasibility of applying the technology to large NG storage tanks is discussed in Section 7, “Cost Analysis” and reported in detail in a separate report titled, “Cost Analysis Of Adsorbed Natural Gas Vehicles And Fueling Stations” dated December 2013, that was submitted to the Energy Commission.
4
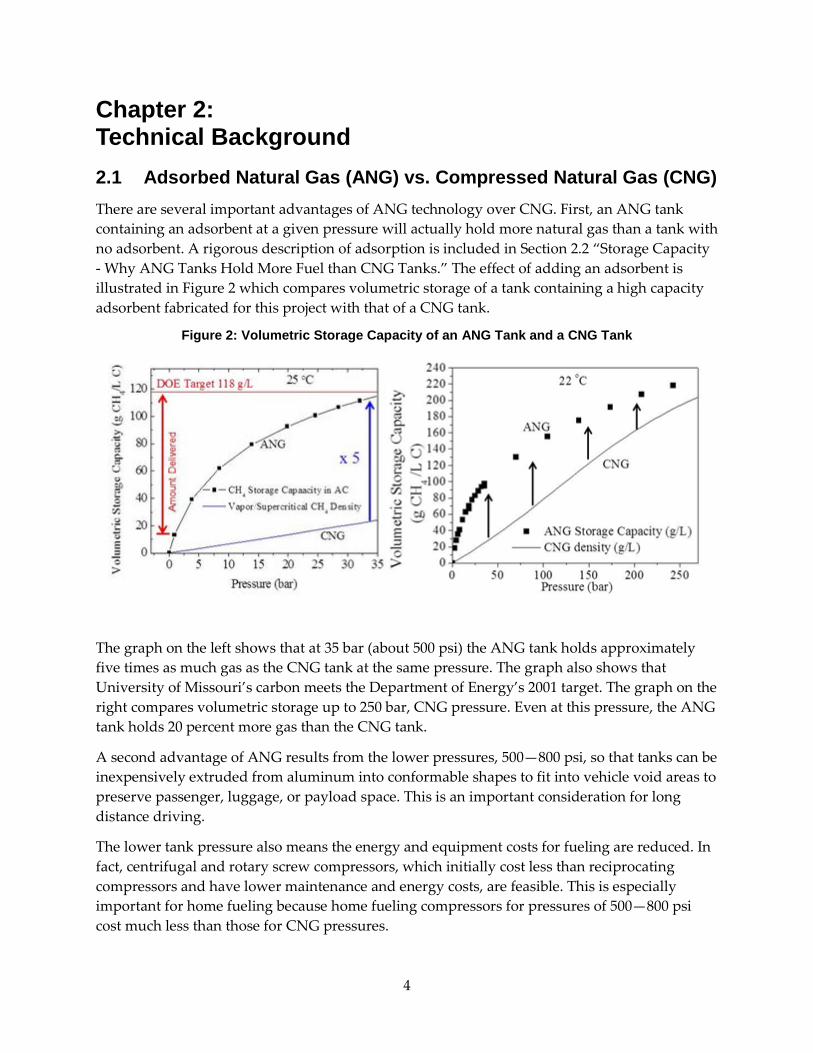
Chapter 2: Technical Background 2.1 Adsorbed Natural Gas (ANG) vs. Compressed Natural Gas (CNG) There are several important advantages of ANG technology over CNG. First, an ANG tank containing an adsorbent at a given pressure will actually hold more natural gas than a tank with no adsorbent. A rigorous description of adsorption is included in Section 2.2 “Storage Capacity - Why ANG Tanks Hold More Fuel than CNG Tanks.” The effect of adding an adsorbent is illustrated in Figure 2 which compares volumetric storage of a tank containing a high capacity adsorbent fabricated for this project with that of a CNG tank.
Figure 2: Volumetric Storage Capacity of an ANG Tank and a CNG Tank
The graph on the left shows that at 35 bar (about 500 psi) the ANG tank holds approximately five times as much gas as the CNG tank at the same pressure. The graph also shows that University of Missouri’s carbon meets the Department of Energy’s 2001 target. The graph on the right compares volumetric storage up to 250 bar, CNG pressure. Even at this pressure, the ANG tank holds 20 percent more gas than the CNG tank.
A second advantage of ANG results from the lower pressures, 500—800 psi, so that tanks can be inexpensively extruded from aluminum into conformable shapes to fit into vehicle void areas to preserve passenger, luggage, or payload space. This is an important consideration for long distance driving.
The lower tank pressure also means the energy and equipment costs for fueling are reduced. In fact, centrifugal and rotary screw compressors, which initially cost less than reciprocating compressors and have lower maintenance and energy costs, are feasible. This is especially important for home fueling because home fueling compressors for pressures of 500—800 psi cost much less than those for CNG pressures.
5
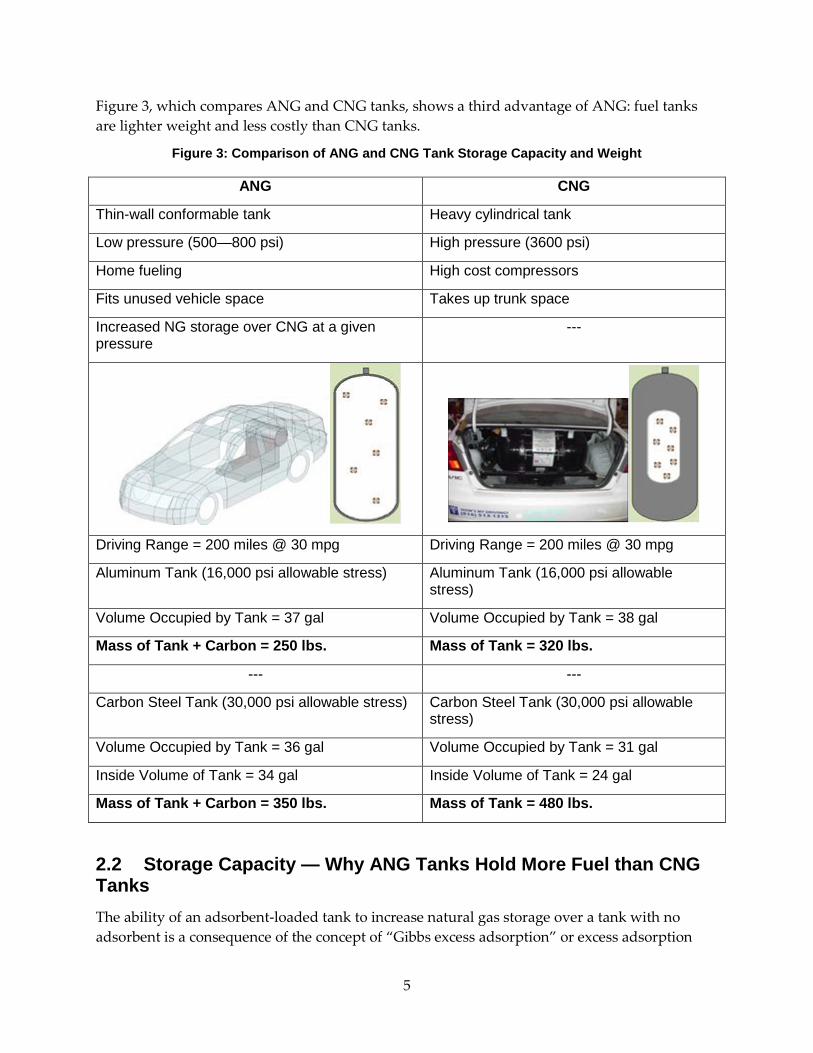
Figure 3, which compares ANG and CNG tanks, shows a third advantage of ANG: fuel tanks are lighter weight and less costly than CNG tanks.
Figure 3: Comparison of ANG and CNG Tank Storage Capacity and Weight
ANG CNG
Thin-wall conformable tank Heavy cylindrical tank
Low pressure (500—800 psi) High pressure (3600 psi)
Home fueling High cost compressors
Fits unused vehicle space Takes up trunk space
Increased NG storage over CNG at a given pressure
---
Driving Range = 200 miles @ 30 mpg Driving Range = 200 miles @ 30 mpg
Aluminum Tank (16,000 psi allowable stress) Aluminum Tank (16,000 psi allowable stress)
Volume Occupied by Tank = 37 gal Volume Occupied by Tank = 38 gal
Mass of Tank + Carbon = 250 lbs. Mass of Tank = 320 lbs.
--- ---
Carbon Steel Tank (30,000 psi allowable stress) Carbon Steel Tank (30,000 psi allowable stress)
Volume Occupied by Tank = 36 gal Volume Occupied by Tank = 31 gal
Inside Volume of Tank = 34 gal Inside Volume of Tank = 24 gal
Mass of Tank + Carbon = 350 lbs. Mass of Tank = 480 lbs.
2.2 Storage Capacity — Why ANG Tanks Hold More Fuel than CNG Tanks The ability of an adsorbent-loaded tank to increase natural gas storage over a tank with no adsorbent is a consequence of the concept of “Gibbs excess adsorption” or excess adsorption
6
that results from van der Waals forces, attractive forces that are able to condense gases into high density film layers. Excess adsorption is defined as the amount of gas in a sample cell containing adsorbent minus the amount of gas in absence of adsorption. The characteristic strength of the gas-surface interaction is called the binding energy which is dependent on the molecular species involved as well as geometry of the surface (Rouquerol, et al, 1999).
2.3 Instrumentation for Evaluating Nanoporous Carbon Performance Nanoporous carbons are evaluated by physical characteristics such as surface area, pore size distribution, and cumulative pore volume; and by gas adsorption measurements represented by adsorption isotherms, film thickness, and film density. University of Missouri researchers use numerous analytical instruments, commercial and custom-built, to evaluate adsorbents including a Quantachrome Autosorb-1, a Quantachrome Quadrasorb, a HidenIsochema Hiden HTP-1 ,a 0.5 Liter Test Fixture, a Rapid Screening Instrument, and a Gravimetric Adsorption System. Descriptions of the equipment capabilities are included in Appendix A.
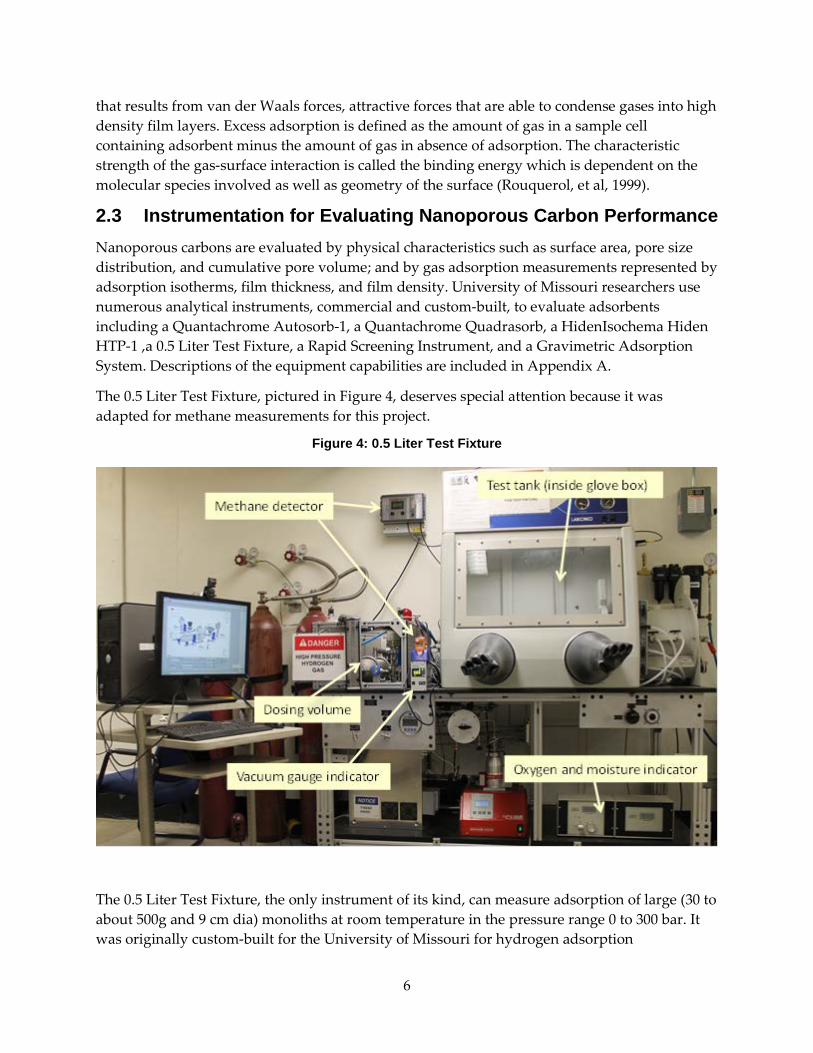
The 0.5 Liter Test Fixture, pictured in Figure 4, deserves special attention because it was adapted for methane measurements for this project.
Figure 4: 0.5 Liter Test Fixture
The 0.5 Liter Test Fixture, the only instrument of its kind, can measure adsorption of large (30 to about 500g and 9 cm dia) monoliths at room temperature in the pressure range 0 to 300 bar. It was originally custom-built for the University of Missouri for hydrogen adsorption
7
measurements and modified under the current research project for measuring methane adsorption. The instrument is invaluable for conducting quality control measurements of 3. 5-inch diameter by 3.5-inch height monoliths produced for the Flat Panel Tank Assembly (FPTA). The modification of the instrument for methane measurements is detailed in Data and Analysis Report of an Instrument for Rapid Measurement of Methane Storage Capacities of Briquettes from April 2012.
In combination, the instruments available to University of Missouri researchers provide the capability to characterize and measure adsorption of samples ranging in size from milligram quantities of powder carbon to large monoliths at pressures up to 300 bar and temperatures from 77K to 303 K. Redundant instrumentation validates results.
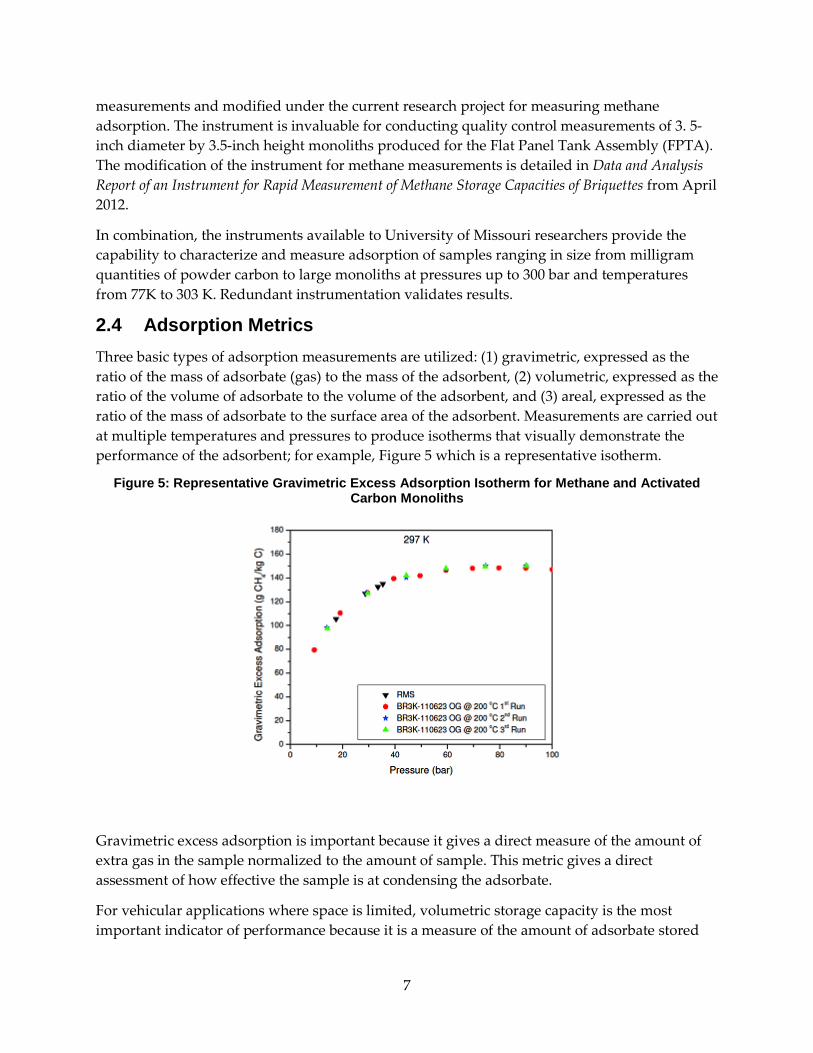
2.4 Adsorption Metrics Three basic types of adsorption measurements are utilized: (1) gravimetric, expressed as the ratio of the mass of adsorbate (gas) to the mass of the adsorbent, (2) volumetric, expressed as the ratio of the volume of adsorbate to the volume of the adsorbent, and (3) areal, expressed as the ratio of the mass of adsorbate to the surface area of the adsorbent. Measurements are carried out at multiple temperatures and pressures to produce isotherms that visually demonstrate the performance of the adsorbent; for example, Figure 5 which is a representative isotherm.
Figure 5: Representative Gravimetric Excess Adsorption Isotherm for Methane and Activated Carbon Monoliths
Gravimetric excess adsorption is important because it gives a direct measure of the amount of extra gas in the sample normalized to the amount of sample. This metric gives a direct assessment of how effective the sample is at condensing the adsorbate.
For vehicular applications where space is limited, volumetric storage capacity is the most important indicator of performance because it is a measure of the amount of adsorbate stored
8
inside the adsorbent normalized with respect to the sample volume. The volumetric storage capacity will determine the vehicle’s driving range for a fixed tank size. The volumetric storage capacity does not take into account the external volume of the vessel used to hold the adsorbent or any other auxiliary equipment.
For applications where mass is more important than volume, such as heavy trucks, the gravimetric storage capacity of an adsorbent is the measure of the amount of adsorbate stored inside the adsorbent normalized with respect to the sample mass. High gravimetric storage capacity is important because the 80,000 lb. highway weight limit for typical Class 8 trucks means that every pound of extra fuel storage system weight reduces allowable cargo weight. The gravimetric storage capacity (as was the case with the volumetric storage capacity) does not include the weight of the tank or auxiliary equipment. When the tank and auxiliary equipment weight (volume) is included, it is referred to as the system gravimetric (volumetric) storage capacity.
In summary, adsorbents that perform well gravimetrically will not be best performers volumetrically; conversely, adsorbents that are the best volumetric performers will not provide the best gravimetric performance. Consequently, the type of adsorbent chosen depends on the potential application. Where weight is a major consideration, gravimetric performance is the desired metric. Where available space is a major consideration, volumetric performance is the desired metric.
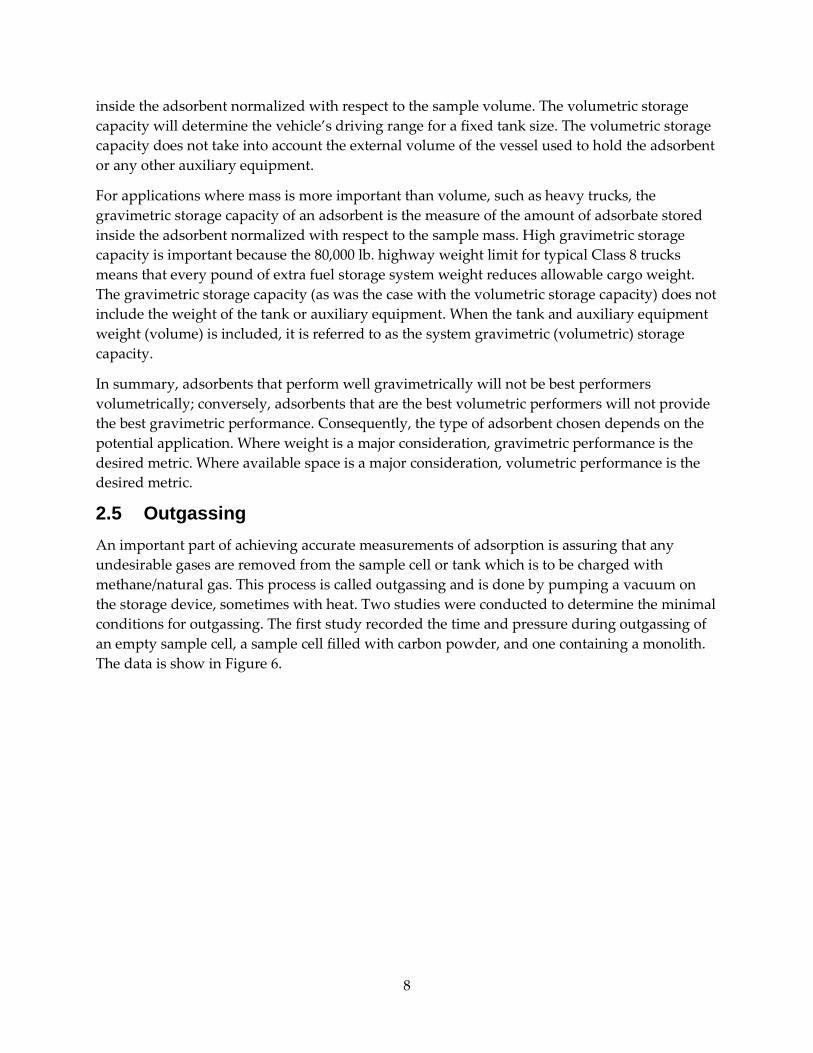
2.5 Outgassing An important part of achieving accurate measurements of adsorption is assuring that any undesirable gases are removed from the sample cell or tank which is to be charged with methane/natural gas. This process is called outgassing and is done by pumping a vacuum on the storage device, sometimes with heat. Two studies were conducted to determine the minimal conditions for outgassing. The first study recorded the time and pressure during outgassing of an empty sample cell, a sample cell filled with carbon powder, and one containing a monolith. The data is show in Figure 6.
9
Figure 6: Comparison of the Effect of Time and Temperature on Outgassing of an Empty Sample Cell, Cell Filled with Powder Carbon, and Cell Filled with a Carbon Monolith
As the graph shows, all results are equivalent at 20 minutes. The results were further verified by measuring the gravimetric adsorption of the powder carbon and monolith, which shows that adsorption of the heated and unheated adsorbents was essentially the same. The comparison is shown in Table 1.
Table 1: Effect of Outgassing with and without Heat on Gravimetric Excess Adsorption of Powder Carbon and Monolith
Outgassing
Condition
Gravimetric Excess Adsorption (g/kg)
Powder Carbon Monolith
Unheated 166 163
With heat 167 167
Three conclusions can be drawn from this study: (1) outgassing occurred within 20 minutes whether the sample cell was empty or filled with adsorbent; (2) heating during outgassing was of no benefit; and (3) the sample cell filled with powder carbon or monolith outgassed nearly as quickly as the empty cell indicating that desorption occurs rapidly.
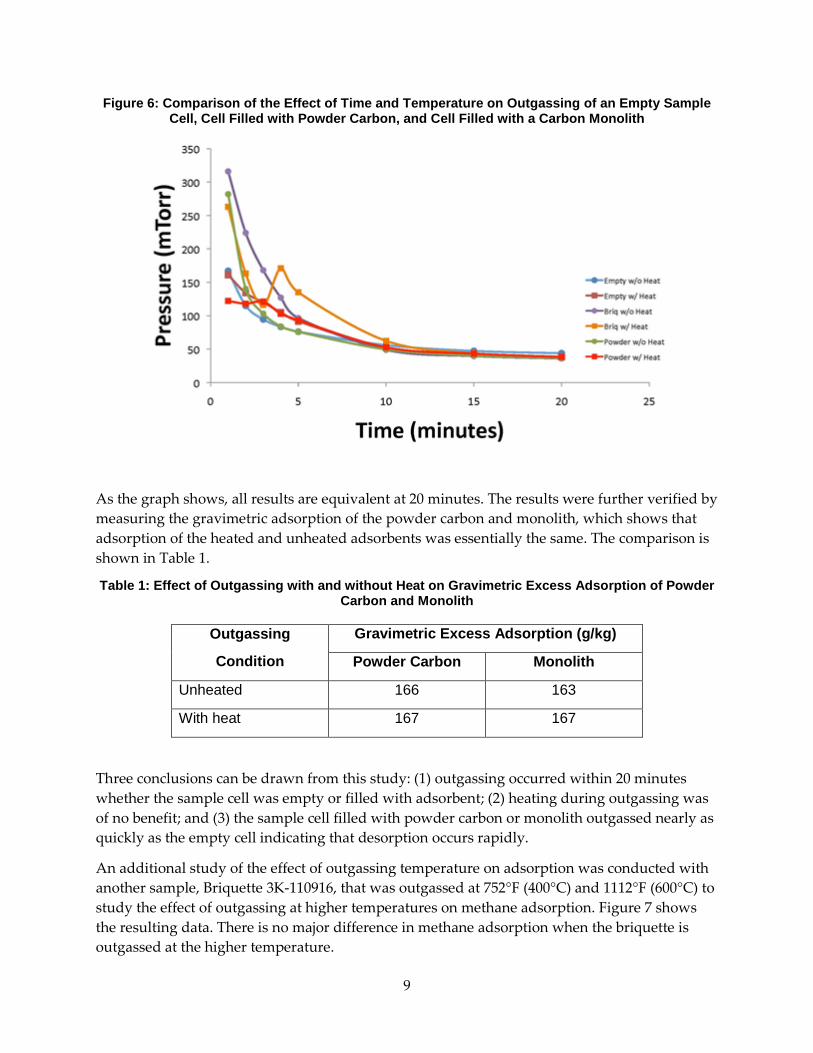
An additional study of the effect of outgassing temperature on adsorption was conducted with another sample, Briquette 3K-110916, that was outgassed at 752°F (400°C) and 1112°F (600°C) to study the effect of outgassing at higher temperatures on methane adsorption. Figure 7 shows the resulting data. There is no major difference in methane adsorption when the briquette is outgassed at the higher temperature.
10
Figure 7: Effect of Outgassing of Briquette 3K-110916 at 400°C and 600°C on Methane Adsorption Up to 35 Bar
No significant difference is observed between the two outgassing temperatures. Therefore monoliths can be satisfactorily outgassed at the lower temperature to reduce outgassing time and energy cost.
11
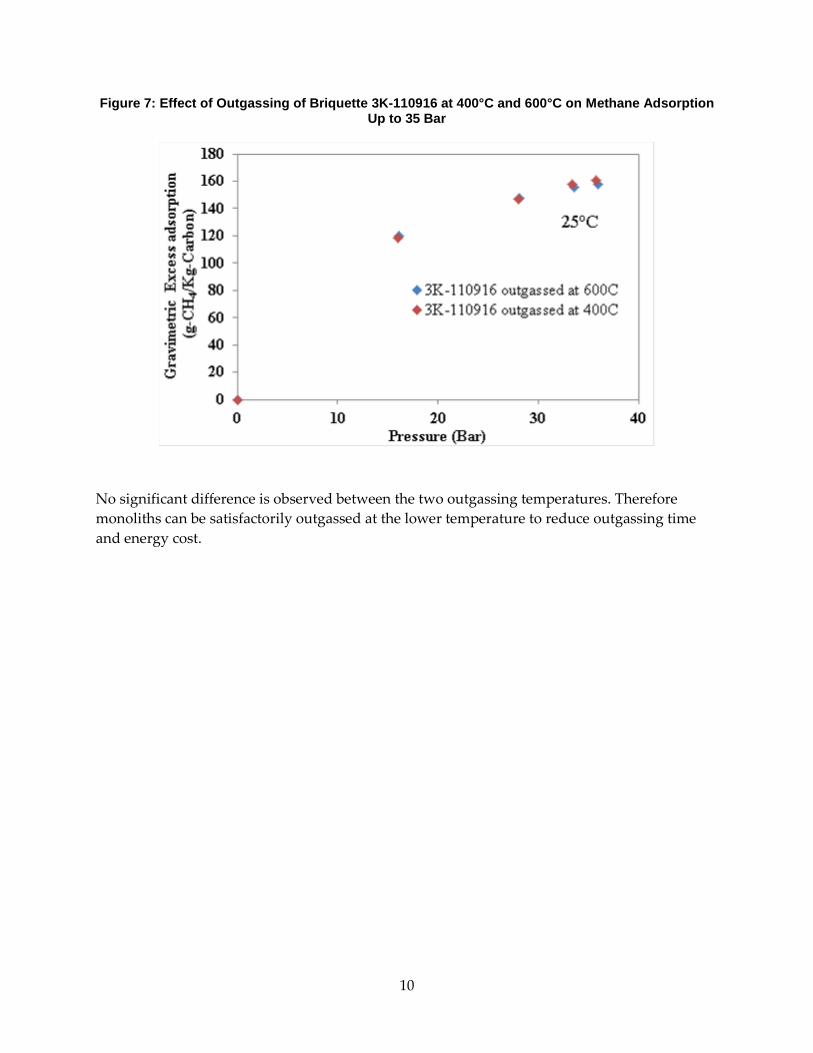
Chapter 3: Adsorbent Engineering: Carbon Powders Adsorption is the result of van der Waals forces between an adsorbate and an adsorbent. In this case, the adsorbate is natural gas and the adsorbent is nanoporous carbon. The strength of the van der Waals forces is determined by pore size. Figure 8 illustrates that narrow, sub-nm pores cause van der Waals potentials to overlap to form deep potential wells which yield high intrapore gas densities.
Figure 8: Effect of Pore Width on Van der Waals Potential and Intrapore Gas Density
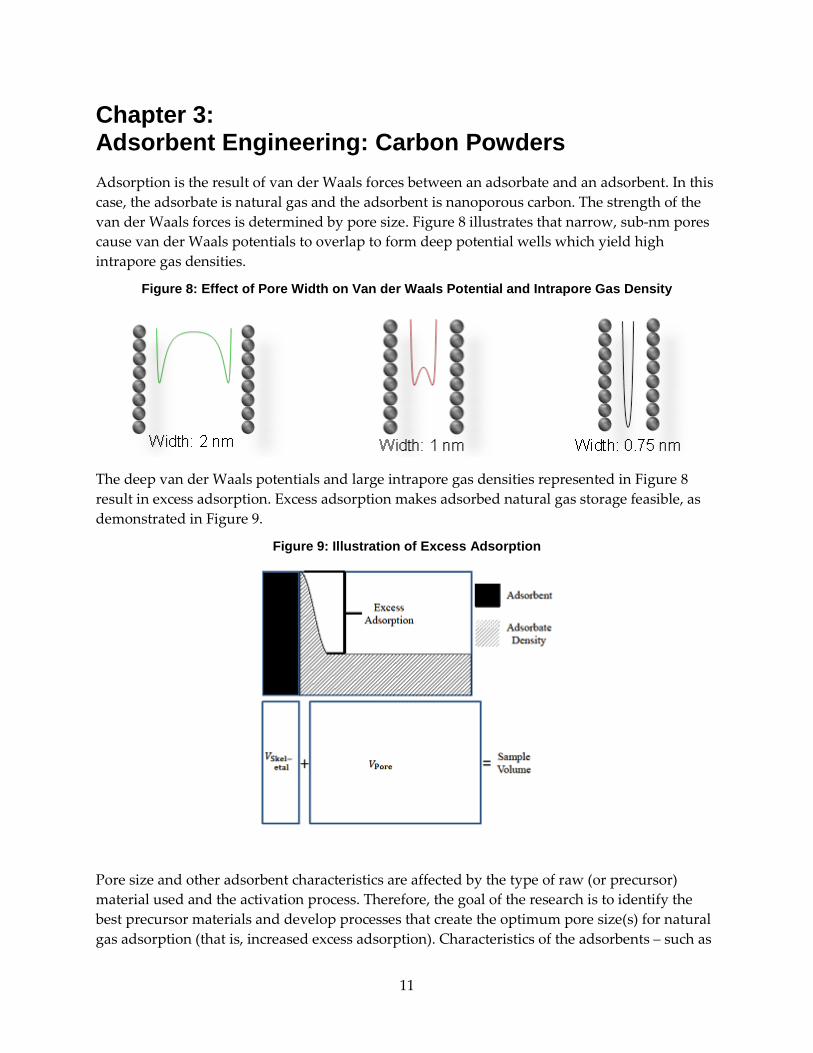
The deep van der Waals potentials and large intrapore gas densities represented in Figure 8 result in excess adsorption. Excess adsorption makes adsorbed natural gas storage feasible, as demonstrated in Figure 9.
Figure 9: Illustration of Excess Adsorption
Pore size and other adsorbent characteristics are affected by the type of raw (or precursor) material used and the activation process. Therefore, the goal of the research is to identify the best precursor materials and develop processes that create the optimum pore size(s) for natural gas adsorption (that is, increased excess adsorption). Characteristics of the adsorbents – such as
12
pore size distribution, total pore volume, specific surface area, porosity, and density – are general indicators of the adsorbent quality that is verified by adsorption measurements. Systematic studies were conducted in which precursor materials, charring parameters, potassium hydroxide (KOH) to carbon ratios, pyrolysis time and temperature, and process vessel materials were varied in attempting to produce adsorbents optimized to store natural gas.
3.1 Precursor Materials Before implementation of the current contract, the University of Missouri conducted extensive reviews of existing research and evaluated materials as potential high quality adsorbents for storing alternative fuels such as natural gas and hydrogen. That early research sought to identify precursor materials that are plentiful, readily available, and inexpensive for producing nanoporous, graphene-like materials (activated carbon) with high adsorption capacity. Among the materials evaluated are coconut shells, peach pits, olive pits, petroleum coke, sawdust, poly-vinylidene chloride (PVDC), corncob, and the following woods: red oak and walnut. Evaluation of these raw materials showed that cellulosic materials were most readily available and inexpensive and provided the best results as natural gas adsorbents. Corncob satisfied the required criteria and was selected as the raw material of choice for this study. Corncob is an excellent precursor material because it is abundant, relatively inexpensive, supplies marginal nutritional value to soil, and has limited commercial value. In addition, corncob contains few minerals that can cause preferential gasification during activation leading to meso- and macropore channeling and pitting, and not the preferred microporosity and repeatability (Shaw, 2007).
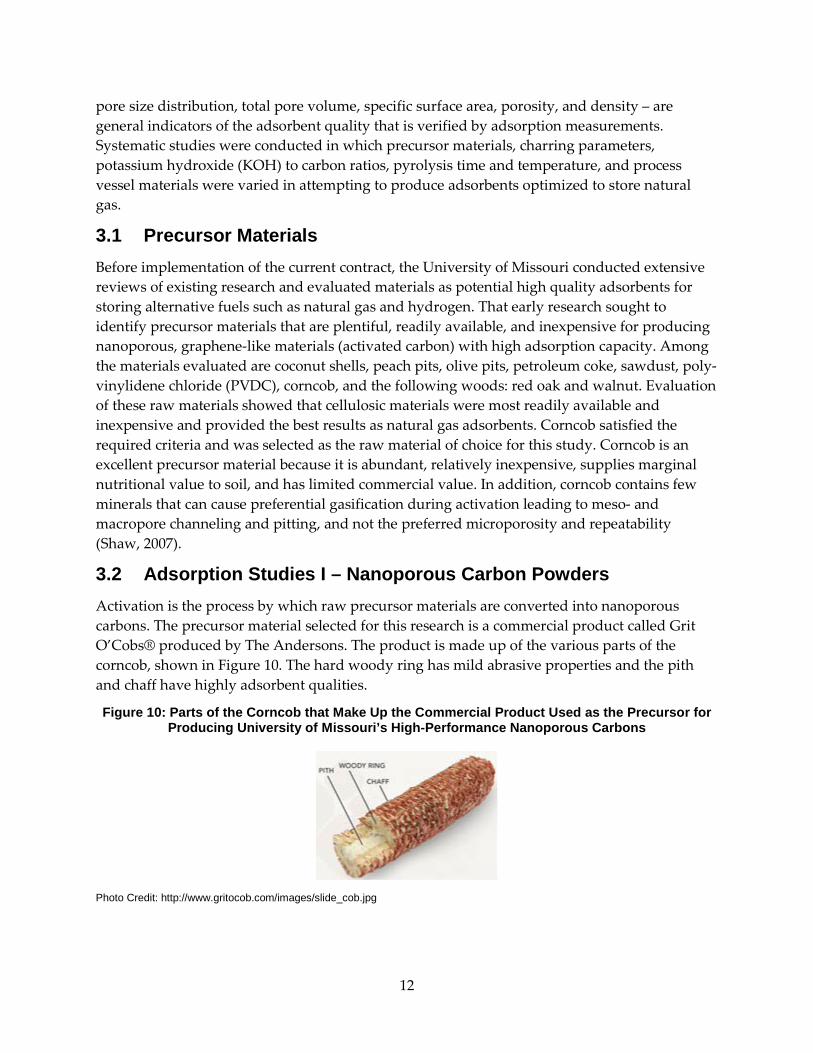
3.2 Adsorption Studies I – Nanoporous Carbon Powders Activation is the process by which raw precursor materials are converted into nanoporous carbons. The precursor material selected for this research is a commercial product called Grit O’Cobs® produced by The Andersons. The product is made up of the various parts of the corncob, shown in Figure 10. The hard woody ring has mild abrasive properties and the pith and chaff have highly adsorbent qualities.
Figure 10: Parts of the Corncob that Make Up the Commercial Product Used as the Precursor for Producing University of Missouri’s High-Performance Nanoporous Carbons
Photo Credit: http://www.gritocob.com/images/slide_cob.jpg
13
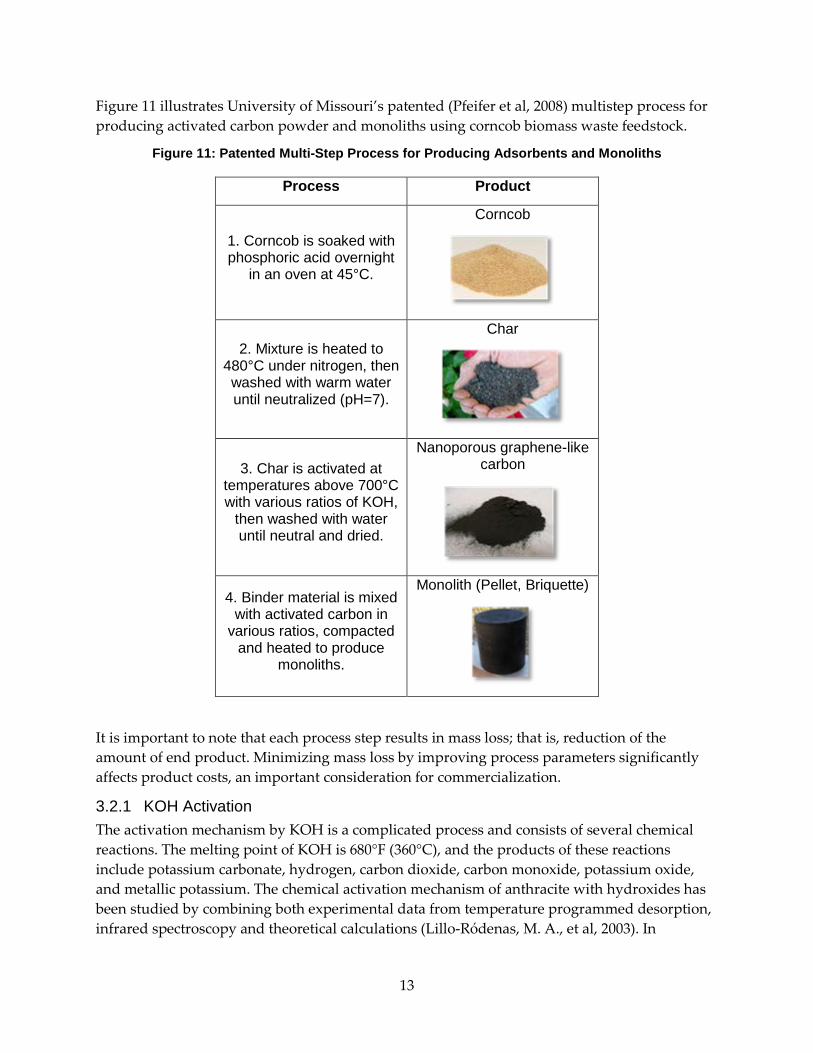
Figure 11 illustrates University of Missouri’s patented (Pfeifer et al, 2008) multistep process for producing activated carbon powder and monoliths using corncob biomass waste feedstock.
Figure 11: Patented Multi-Step Process for Producing Adsorbents and Monoliths
Process Product
1. Corncob is soaked with phosphoric acid overnight
in an oven at 45°C.
Corncob
2. Mixture is heated to 480°C under nitrogen, then washed with warm water until neutralized (pH=7).
Char
3. Char is activated at temperatures above 700°C with various ratios of KOH,
then washed with water until neutral and dried.
Nanoporous graphene-like carbon
4. Binder material is mixed with activated carbon in
various ratios, compacted and heated to produce
monoliths.
Monolith (Pellet, Briquette)
It is important to note that each process step results in mass loss; that is, reduction of the amount of end product. Minimizing mass loss by improving process parameters significantly affects product costs, an important consideration for commercialization.
3.2.1 KOH Activation The activation mechanism by KOH is a complicated process and consists of several chemical reactions. The melting point of KOH is 680°F (360°C), and the products of these reactions include potassium carbonate, hydrogen, carbon dioxide, carbon monoxide, potassium oxide, and metallic potassium. The chemical activation mechanism of anthracite with hydroxides has been studied by combining both experimental data from temperature programmed desorption, infrared spectroscopy and theoretical calculations (Lillo-Ródenas, M. A., et al, 2003). In
14
addition, KOH and sodium hydroxide (NaOH) activation mechanisms of multi-walled carbon nanotubes have been investigated (Raymundo-Piñero E., et al, 2005). The process of activation by KOH was described by Marsh, who proposed that two main mechanisms contribute to chemical activation. The first consists of the consumption of carbon by oxygen producing carbon monoxide and carbon dioxide; this process is catalyzed by alkali metals. The second consists of the reduction of the hydroxide to free potassium metal, the penetration of free metal into the lattice of the carbon, the expansion of the lattice by the intercalated potassium, and the rapid removal of the intercalate from the carbon matrix. Otowa et al, 1993, described the activation process by the following reactions. Below 1292°F (700°C), the main products are hydrogen, water, carbon monoxide, carbon dioxide, potassium oxide, and carbonate. The dehydration of KOH to potassium oxide (KR2RO) (reaction a) results in carbon consumption through the reaction of CO2, produced in reactions (reaction b) and (reaction c), with K2O to form potassium carbonate (KR2RCO)R3R:
2KOH → K2O + H2O (a) C + H2O → CO + H2 (b)
CO + H2O → CO2 + H2 (c) CO2 + K2O → K2CO3 (d)
Above 1292°F (700°C), however, an important activation mechanism occurs alongside the formation of metallic potassium. This mechanism, described in (reaction e) and (reaction f), is directly related to the formation of sub-nm pores:
K2O + H2 → 2K + H2O (e) K2O + C → 2K + CO (f)
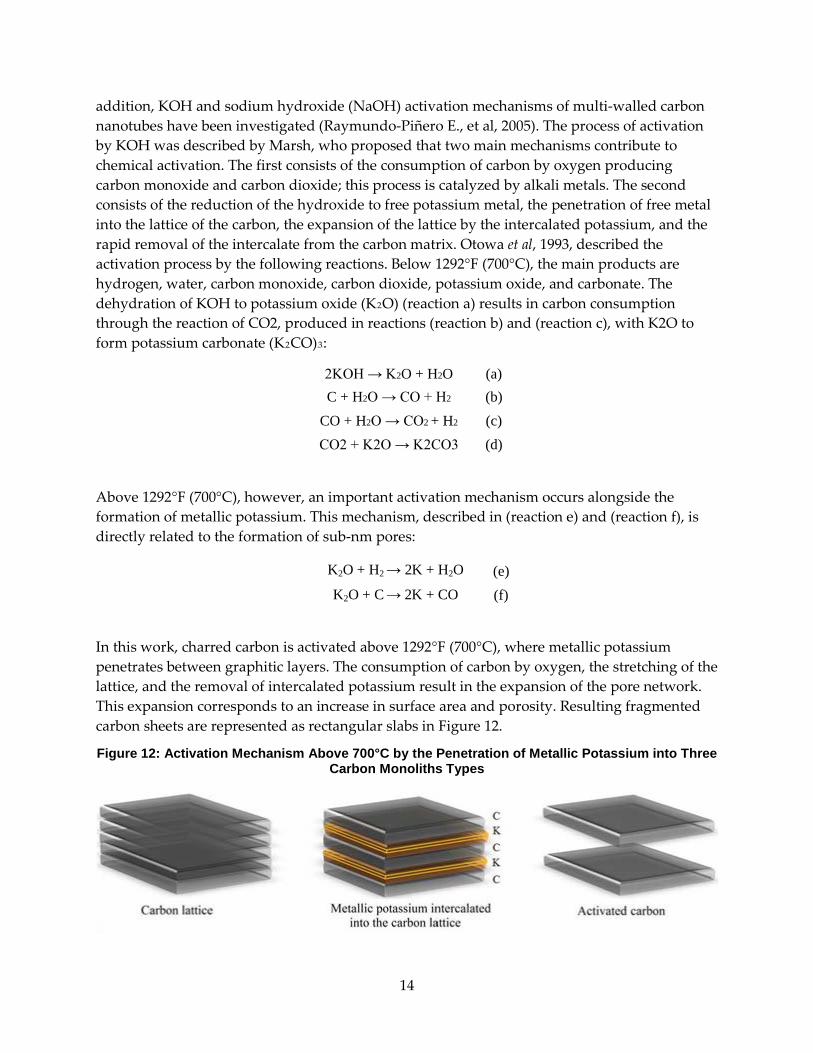
In this work, charred carbon is activated above 1292°F (700°C), where metallic potassium penetrates between graphitic layers. The consumption of carbon by oxygen, the stretching of the lattice, and the removal of intercalated potassium result in the expansion of the pore network. This expansion corresponds to an increase in surface area and porosity. Resulting fragmented carbon sheets are represented as rectangular slabs in Figure 12.
Figure 12: Activation Mechanism Above 700°C by the Penetration of Metallic Potassium into Three Carbon Monoliths Types
15
Surface area, pore size distribution, and pore volume (all of which affect adsorption capacity) can be somewhat controlled by varying treatment parameters such as chemical concentrations, process temperatures, and exposure times. For the current research, the adsorbent is optimized for natural gas storage in vehicle tanks.
3.2.2 Parametric Studies 3.2.2.1 Effect Of KOH:Carbon Ratios and Activation Temperature With the realization that adsorbent characteristics could be affected by varying process variables, systematic research was conducted to determine the effects of varying KOH:C (potassium hydroxide and carbon) ratios and activation temperature, separately and in combination.
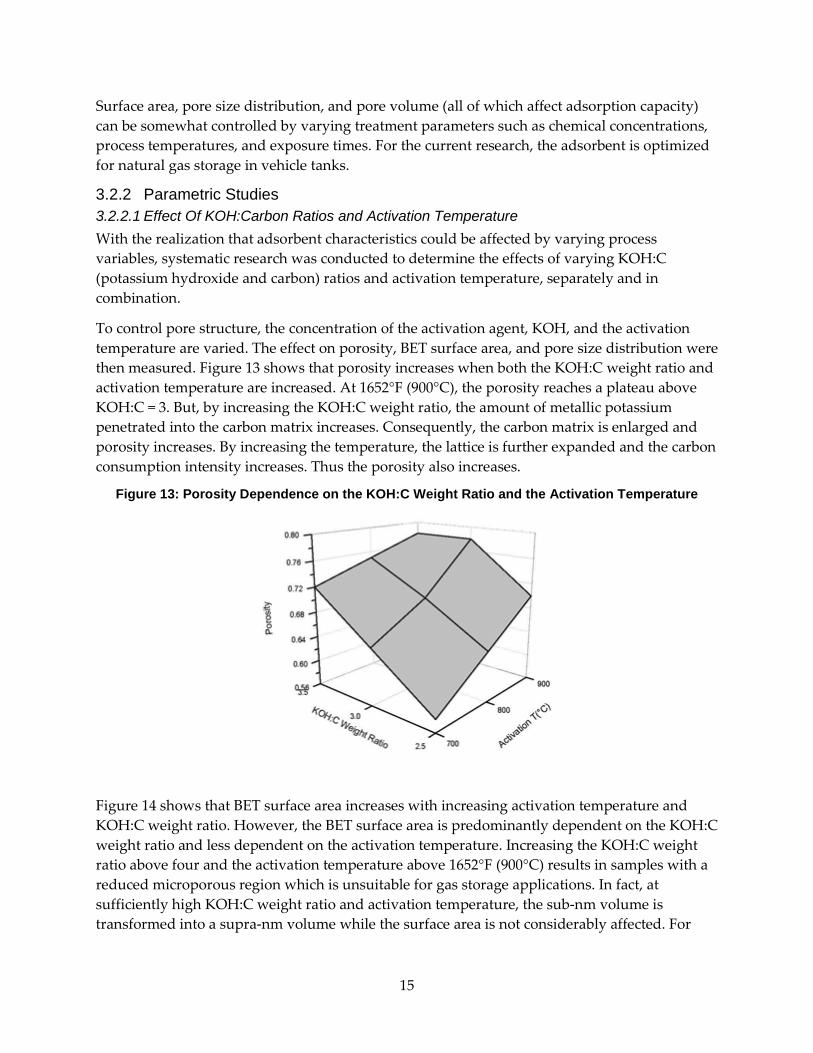
To control pore structure, the concentration of the activation agent, KOH, and the activation temperature are varied. The effect on porosity, BET surface area, and pore size distribution were then measured. Figure 13 shows that porosity increases when both the KOH:C weight ratio and activation temperature are increased. At 1652°F (900°C), the porosity reaches a plateau above KOH:C = 3. But, by increasing the KOH:C weight ratio, the amount of metallic potassium penetrated into the carbon matrix increases. Consequently, the carbon matrix is enlarged and porosity increases. By increasing the temperature, the lattice is further expanded and the carbon consumption intensity increases. Thus the porosity also increases.
Figure 13: Porosity Dependence on the KOH:C Weight Ratio and the Activation Temperature
Figure 14 shows that BET surface area increases with increasing activation temperature and KOH:C weight ratio. However, the BET surface area is predominantly dependent on the KOH:C weight ratio and less dependent on the activation temperature. Increasing the KOH:C weight ratio above four and the activation temperature above 1652°F (900°C) results in samples with a reduced microporous region which is unsuitable for gas storage applications. In fact, at sufficiently high KOH:C weight ratio and activation temperature, the sub-nm volume is transformed into a supra-nm volume while the surface area is not considerably affected. For
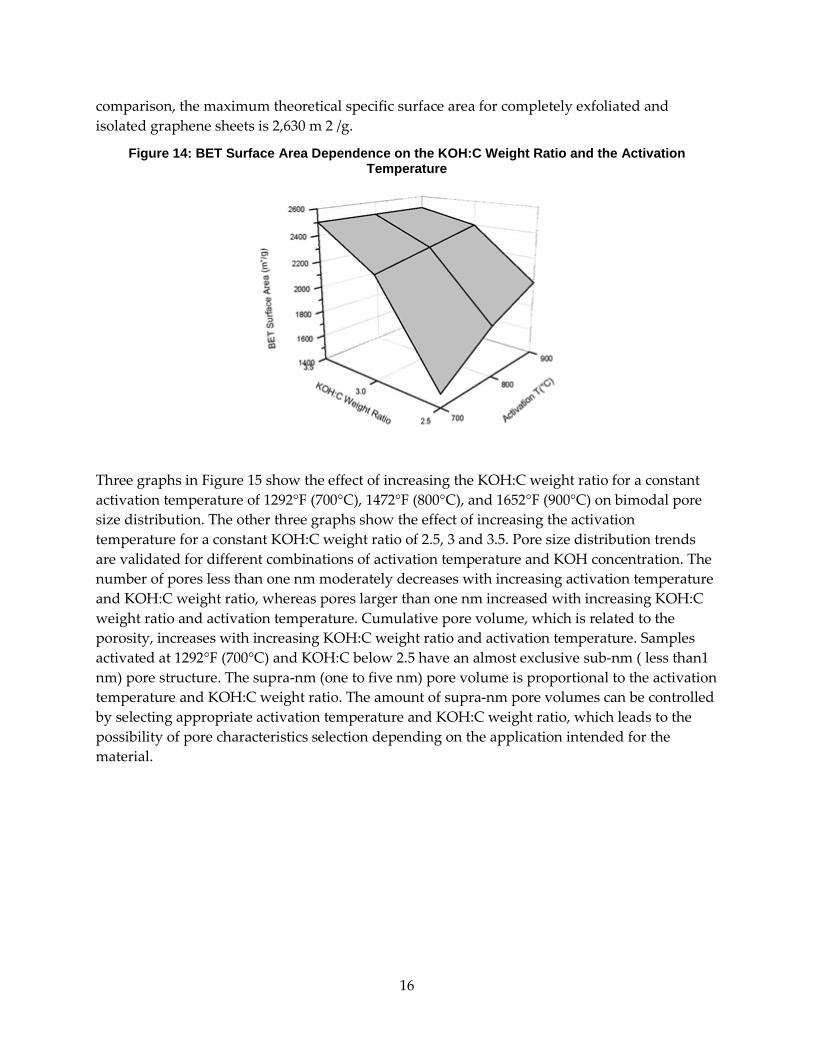
16
comparison, the maximum theoretical specific surface area for completely exfoliated and isolated graphene sheets is 2,630 m 2 /g.
Figure 14: BET Surface Area Dependence on the KOH:C Weight Ratio and the Activation Temperature
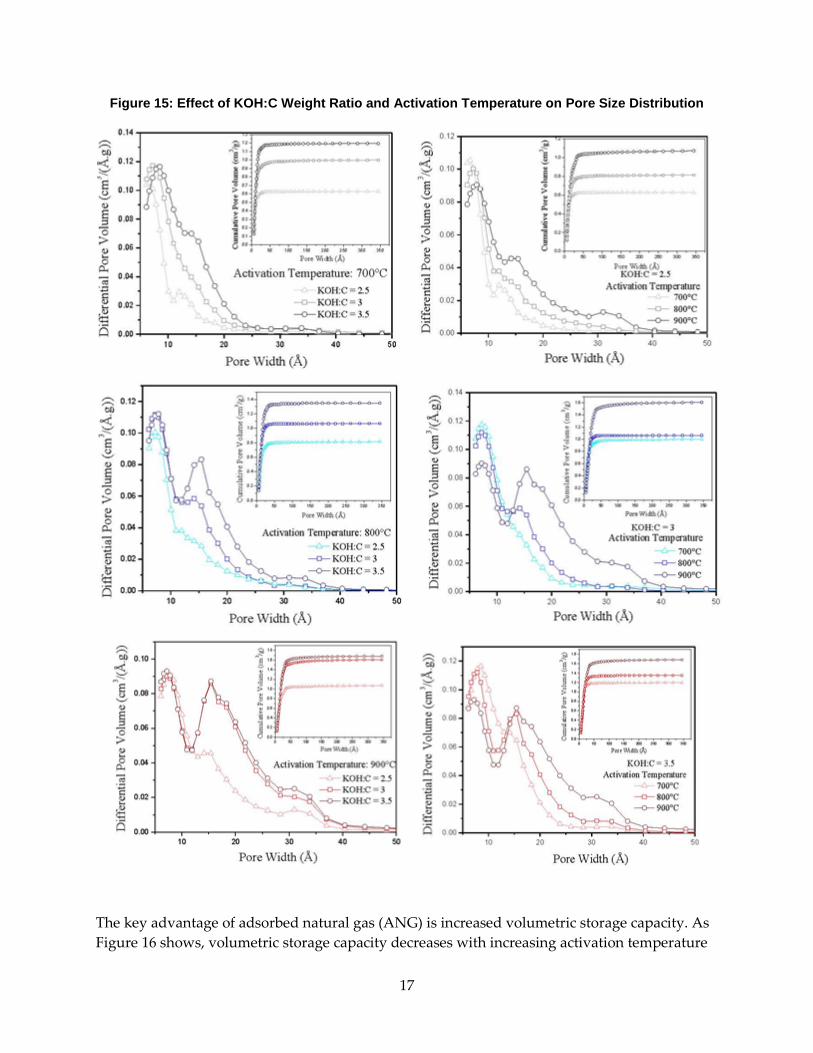
Three graphs in Figure 15 show the effect of increasing the KOH:C weight ratio for a constant activation temperature of 1292°F (700°C), 1472°F (800°C), and 1652°F (900°C) on bimodal pore size distribution. The other three graphs show the effect of increasing the activation temperature for a constant KOH:C weight ratio of 2.5, 3 and 3.5. Pore size distribution trends are validated for different combinations of activation temperature and KOH concentration. The number of pores less than one nm moderately decreases with increasing activation temperature and KOH:C weight ratio, whereas pores larger than one nm increased with increasing KOH:C weight ratio and activation temperature. Cumulative pore volume, which is related to the porosity, increases with increasing KOH:C weight ratio and activation temperature. Samples activated at 1292°F (700°C) and KOH:C below 2.5 have an almost exclusive sub-nm ( less than1 nm) pore structure. The supra-nm (one to five nm) pore volume is proportional to the activation temperature and KOH:C weight ratio. The amount of supra-nm pore volumes can be controlled by selecting appropriate activation temperature and KOH:C weight ratio, which leads to the possibility of pore characteristics selection depending on the application intended for the material.
17
Figure 15: Effect of KOH:C Weight Ratio and Activation Temperature on Pore Size Distribution
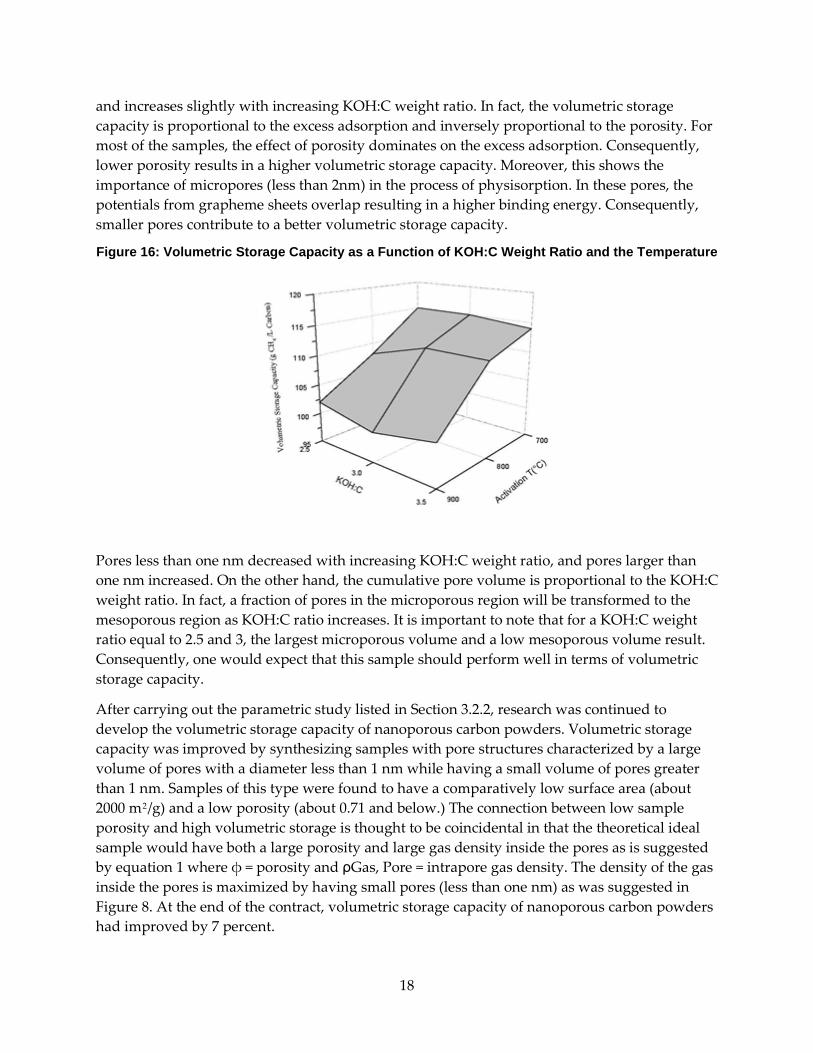
The key advantage of adsorbed natural gas (ANG) is increased volumetric storage capacity. As Figure 16 shows, volumetric storage capacity decreases with increasing activation temperature
18
and increases slightly with increasing KOH:C weight ratio. In fact, the volumetric storage capacity is proportional to the excess adsorption and inversely proportional to the porosity. For most of the samples, the effect of porosity dominates on the excess adsorption. Consequently, lower porosity results in a higher volumetric storage capacity. Moreover, this shows the importance of micropores (less than 2nm) in the process of physisorption. In these pores, the potentials from grapheme sheets overlap resulting in a higher binding energy. Consequently, smaller pores contribute to a better volumetric storage capacity.
Figure 16: Volumetric Storage Capacity as a Function of KOH:C Weight Ratio and the Temperature
Pores less than one nm decreased with increasing KOH:C weight ratio, and pores larger than one nm increased. On the other hand, the cumulative pore volume is proportional to the KOH:C weight ratio. In fact, a fraction of pores in the microporous region will be transformed to the mesoporous region as KOH:C ratio increases. It is important to note that for a KOH:C weight ratio equal to 2.5 and 3, the largest microporous volume and a low mesoporous volume result. Consequently, one would expect that this sample should perform well in terms of volumetric storage capacity.
After carrying out the parametric study listed in Section 3.2.2, research was continued to develop the volumetric storage capacity of nanoporous carbon powders. Volumetric storage capacity was improved by synthesizing samples with pore structures characterized by a large volume of pores with a diameter less than 1 nm while having a small volume of pores greater than 1 nm. Samples of this type were found to have a comparatively low surface area (about 2000 mP
2P/g) and a low porosity (about 0.71 and below.) The connection between low sample
porosity and high volumetric storage is thought to be coincidental in that the theoretical ideal sample would have both a large porosity and large gas density inside the pores as is suggested by equation 1 where φ = porosity and ρGas, Pore = intrapore gas density. The density of the gas inside the pores is maximized by having small pores (less than one nm) as was suggested in Figure 8. At the end of the contract, volumetric storage capacity of nanoporous carbon powders had improved by 7 percent.
19
VRStR = φ · ρGas,Pore
To develop samples with a large volume of pores less than one nm in diameter and a high volumetric storage sample, synthesizing was carried out in a more chemically inert reaction vessel made of Monel rather than stainless steel. This decision made it possible to remove many of the undesirable impurities that come from stainless steel (iron (Fe), nickel (Ni), chromium (Cr), and so forth) from samples, and reduced the amount of KOH used during the activation process by around 35 percent.
After switching to the Monel reaction vessel, improving volumetric storage was begun by attempting to make a sample with the same pore structure as that of the best stainless steel based volumetric storage sample, 2.5K 700C. The analogous sample made in Monel was 1.6K-0081 which was also activated at 1292°F (700°C) but with a lower KOH:C ratio. This sample is similar to 2.5K 700C in terms of surface area (2030 ± 100 vs. 1970 ± 55 mP
2P/g), porosity (0.67 ± 0.01
vs. 0.67 ± 0.01), and volumetric storage capacity (118 vs. 112 ± 1 g/L), respectively. The subcritical nitrogen isotherm and pore size distribution (see Figure 17, left and right) for the two samples are also very similar.
20
Figure 17: The Subcritical Nitrogen Data for 1.6K-0081 (Made in Monel) and 2.5K 700C (Made in Stainless Steel)
Based on the performance and characteristics of these two samples (1.6K-0081 and 2.5K 700C) the researchers concluded that making samples in Monel reduces the consumption of KOH by 35 percent when compared to stainless steel. This reduction may be less pronounced with increased sample size because it is speculated that the savings are due to less KOH reacting with the reaction vessel. Larger samples will have a smaller surface to volume ratio which also should reduce reactions with the reaction vessel.
To further develop volumetric storage capacity, attempts were made to increase sample porosity above that of 1.6K-0081 while maintaining the characteristics of its favorable pore size distribution. Many samples were synthesized (see Appendix B) with a pore size distribution similar to that of 1.6K-0081. Figure 3-11 compares 1.6K-0081 to 1.85K-0099 which has a higher porosity across all pore widths (see the right plot in Figure 18.)

21
Figure 18: Comparison of Excess Adsorption and Pore Size Distribution from the Subcritical Nitrogen Data for 1.85K-0099 and 1.6K-0081
The large amount of pores less than 10 Å in 1.85K-0099 and 1.6K-0081 make these samples excellent volumetric adsorbents. Volumetric storage of 2.5K-0064 is five times better than compressed methane at 35 bar and 77°F (25°C).
By focusing on producing samples with pore structures similar to 1.85K-0099 and 1.6K-0081, a total of five nanoporous carbon samples were produced with an average volumetric storage capacity equal to the 2011 Department of Energy storage target of 118 g/L. These samples have a volumetric storage capacity that is 4.9 times better than that of compressed methane at the same temperature and pressure. The gas in the pores of these samples is seven times denser than that of compressed methane at the same pressure and temperature (see Table 2).
3.3 Adsorption Studies II: Top Performing Powders and Monoliths Table 2: Summary and Comparison of the Volumetric Storage of University of Missouri
Nanoporous Carbon Powders and MSC-30 and Storage Targets
Data Taken at 35 bar and 25°C
Sample VSt,Crystal
(g/L)
VSt,Crystal
ρFree gas
ρGas,Pore
(g/L)
ρGas,Pore
ρFree gas
MU Samples (5) 118 ± 1.3 4.9 168 7
MSC-30 92 ± 1 3.9 114 4.8
DOE Target (2011) 118 N/A N/A N/A
22
All data in Table 2 were taken at 35 bar and 77°F (25°C). The column labeled “VRSt,CrystalR” shows the intragranular volumetric storage capacity of the samples. The “± 1.3” in the intragranular volumetric storage capacity of the University of Missouri samples is the standard deviation of the values of the top five volumetric University of Missouri samples. The column labeled “VRSt,CrystalR / ρFree gas” gives the improvement in volumetric storage of the given sample over compressed methane at the same pressure and temperature. The column labeled “ρGas,Pore ” is the density of gas inside the pores. The far right column compares the density of the gas in the pores to that of compressed methane at 35 bar and 77°F (25°C).
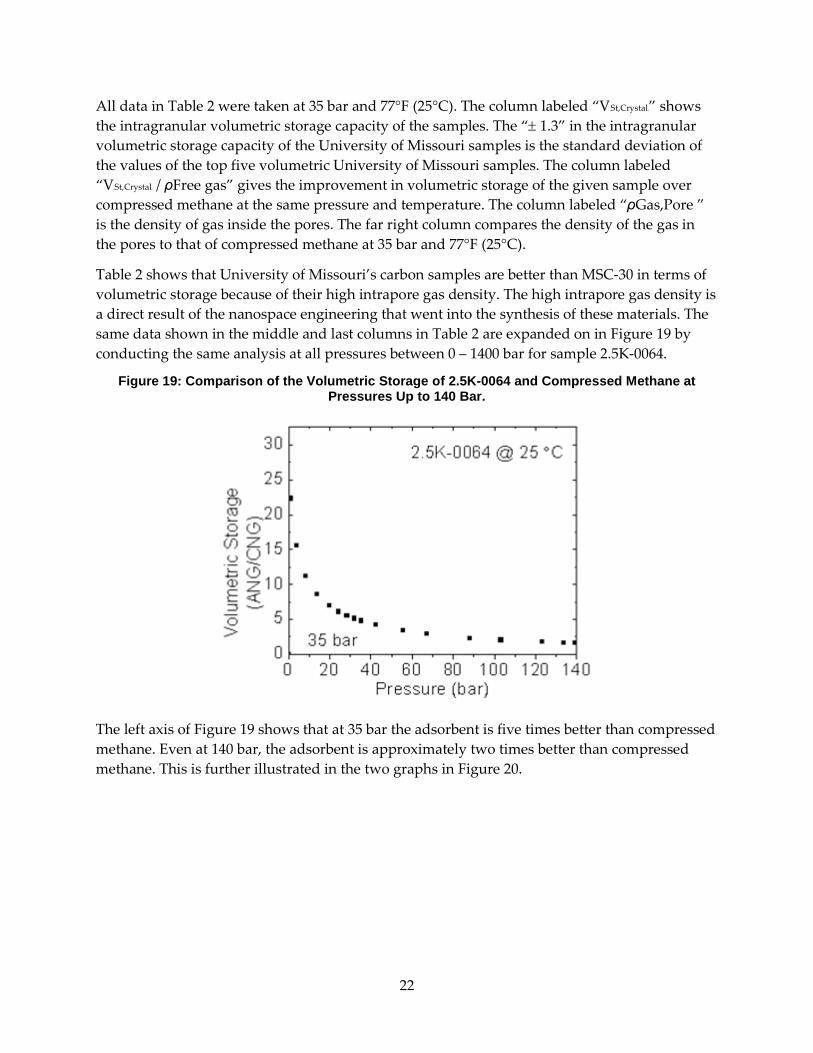
Table 2 shows that University of Missouri’s carbon samples are better than MSC-30 in terms of volumetric storage because of their high intrapore gas density. The high intrapore gas density is a direct result of the nanospace engineering that went into the synthesis of these materials. The same data shown in the middle and last columns in Table 2 are expanded on in Figure 19 by conducting the same analysis at all pressures between 0 – 1400 bar for sample 2.5K-0064.
Figure 19: Comparison of the Volumetric Storage of 2.5K-0064 and Compressed Methane at Pressures Up to 140 Bar.
The left axis of Figure 19 shows that at 35 bar the adsorbent is five times better than compressed methane. Even at 140 bar, the adsorbent is approximately two times better than compressed methane. This is further illustrated in the two graphs in Figure 20.
23
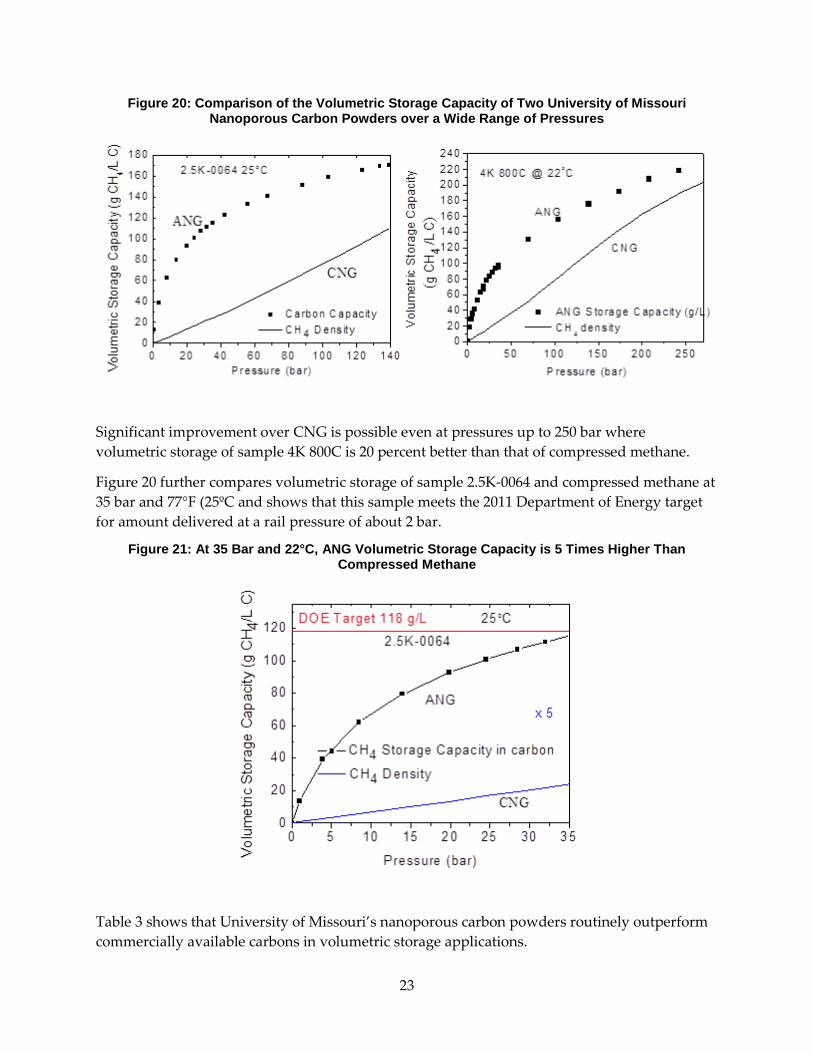
Figure 20: Comparison of the Volumetric Storage Capacity of Two University of Missouri Nanoporous Carbon Powders over a Wide Range of Pressures
Significant improvement over CNG is possible even at pressures up to 250 bar where volumetric storage of sample 4K 800C is 20 percent better than that of compressed methane.
Figure 20 further compares volumetric storage of sample 2.5K-0064 and compressed methane at 35 bar and 77°F (25ºC and shows that this sample meets the 2011 Department of Energy target for amount delivered at a rail pressure of about 2 bar.
Figure 21: At 35 Bar and 22°C, ANG Volumetric Storage Capacity is 5 Times Higher Than Compressed Methane
Table 3 shows that University of Missouri’s nanoporous carbon powders routinely outperform commercially available carbons in volumetric storage applications.
24
Table 3: Improvements in Adsorption that Occurred during the Energy Commission Contract
Sample Name BET Surface Area ± 100
(mP
2P/g)
Porosity ± 0.01 Gravimetric
Storage
± 2 (g CHR4R/kg C)
Volumetric Storage
± 1 (g CHR4R/L C)
2.5K 20121204 2500 0.73 222 120
2.5K-0255 2400 0.72 211 118
1.85K-0099 2300 0.71 202 117
2K-0254 2140 0.69 189 117
2.5K-0064 2420 0.71 200 116
2K-0087 2220 0.70 192 115
MWV-0260 2640 0.76 227 109
MSC-30 2761 0.81 242 92
2.5K-700C 1970 ± 55 0.67 170 112
Research during this contract period resulted in systematic improvement over 2.5K 700C (bottom of table), the best sample available shortly after the start of the project. Comparisons with top commercial carbons MWV-0260 (Baker carbon from MeadWestvaco) and MSC-30 are also shown. All data were taken at 35 bar and 298 K.
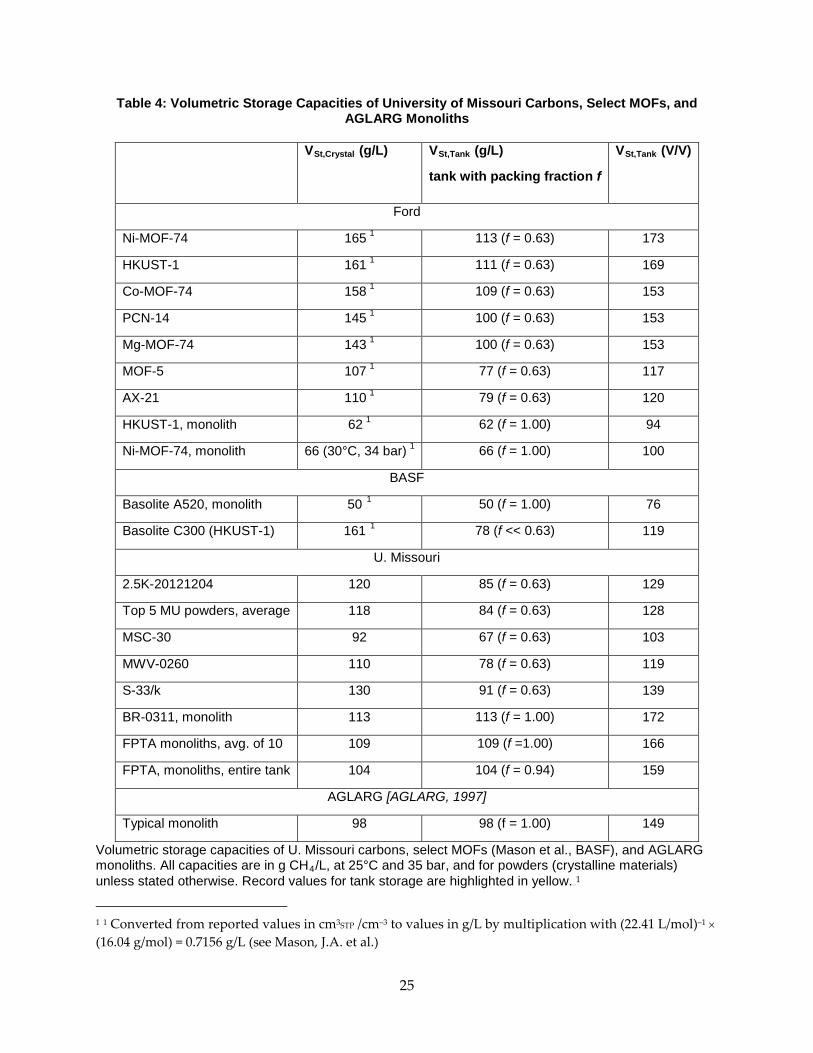
3.4 MU Monoliths and Powders Compared to Competing Adsorbents This section compares the volumetric methane storage capacities of MU carbon powders and monoliths developed during this project with storage capacities of other carbon materials and metal-organic frameworks. The source of the data is referenced to the right of either the material name or data values listed in Table 4 In addition to University of Missouri’s measurements, the crystalline volumetric storage (VRSt,CrystalR) of powders was measured by(AGLARG, 1997; Cavenati, S. et al, 2008; Gaab, M. et al, 2012; Marco-Lozar, J. P., et al, 2012; Mason, J. A. et al, 2014; and Tagliabue, M. et al, 2011), and reported in Table 3.
During the contract period, the following volumetric storage capacity records for methane were achieved.
25
Table 4: Volumetric Storage Capacities of University of Missouri Carbons, Select MOFs, and AGLARG Monoliths
VRSt,CrystalR (g/L) VRSt,TankR (g/L)
tank with packing fraction f
VRSt,TankR (V/V)
Ford
Ni-MOF-74 165P
1 113 (f = 0.63) 173
HKUST-1 161P
1 111 (f = 0.63) 169
Co-MOF-74 158P
1 109 (f = 0.63) 153
PCN-14 145P
1 100 (f = 0.63) 153
Mg-MOF-74 143P
1 100 (f = 0.63) 153
MOF-5 107P
1 77 (f = 0.63) 117
AX-21 110P
1 79 (f = 0.63) 120
HKUST-1, monolith 62P
1 62 (f = 1.00) 94
Ni-MOF-74, monolith 66 (30°C, 34 bar)P
1 66 (f = 1.00) 100
BASF
Basolite A520, monolith 50 P
1 50 (f = 1.00) 76
Basolite C300 (HKUST-1) 161 P
1 78 (f << 0.63) 119
U. Missouri
2.5K-20121204 120 85 (f = 0.63) 129
Top 5 MU powders, average 118 84 (f = 0.63) 128
MSC-30 92 67 (f = 0.63) 103
MWV-0260 110 78 (f = 0.63) 119
S-33/k 130 91 (f = 0.63) 139
BR-0311, monolith 113 113 (f = 1.00) 172
FPTA monoliths, avg. of 10 109 109 (f =1.00) 166
FPTA, monoliths, entire tank 104 104 (f = 0.94) 159
AGLARG [AGLARG, 1997]
Typical monolith 98 98 (f = 1.00) 149
Volumetric storage capacities of U. Missouri carbons, select MOFs (Mason et al., BASF), and AGLARG monoliths. All capacities are in g CHR4R/L, at 25°C and 35 bar, and for powders (crystalline materials) unless stated otherwise. Record values for tank storage are highlighted in yellow.0FP0F
1
1 1 Converted from reported values in cm3STP /cm–3 to values in g/L by multiplication with (22.41 L/mol)–1 × (16.04 g/mol) = 0.7156 g/L (see Mason, J.A. et al.)
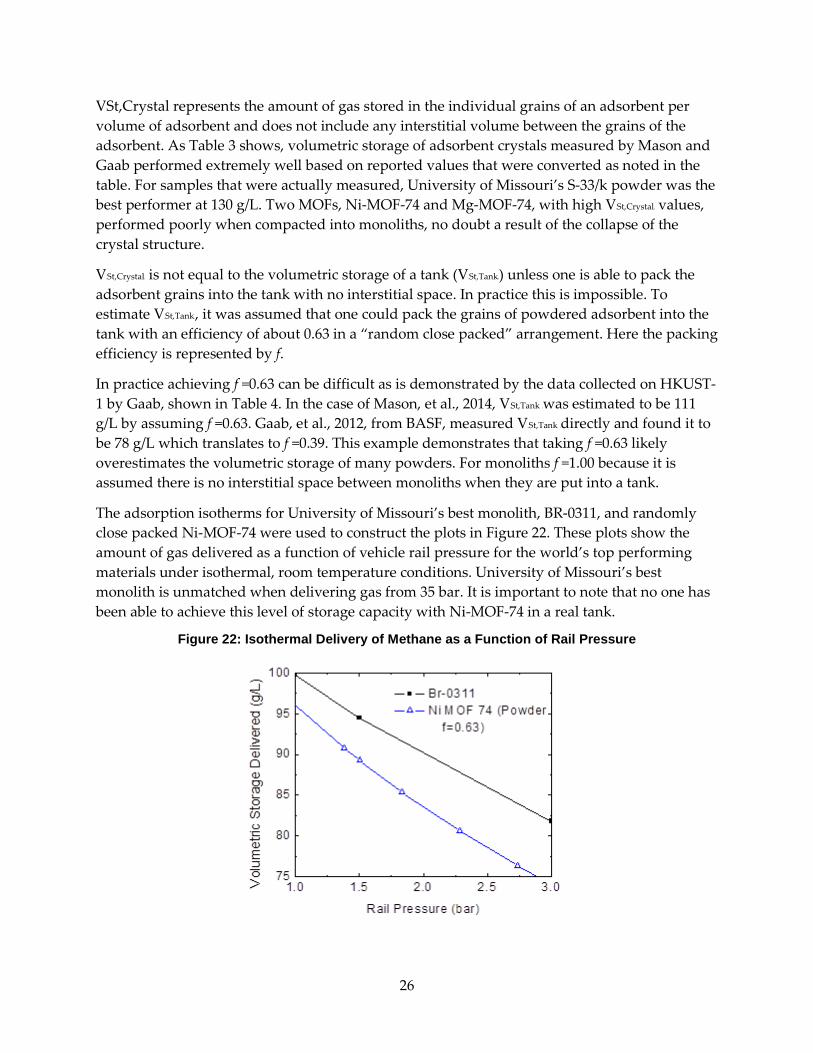
26
VSt,Crystal represents the amount of gas stored in the individual grains of an adsorbent per volume of adsorbent and does not include any interstitial volume between the grains of the adsorbent. As Table 3 shows, volumetric storage of adsorbent crystals measured by Mason and Gaab performed extremely well based on reported values that were converted as noted in the table. For samples that were actually measured, University of Missouri’s S-33/k powder was the best performer at 130 g/L. Two MOFs, Ni-MOF-74 and Mg-MOF-74, with high VRSt,CrystalR values, performed poorly when compacted into monoliths, no doubt a result of the collapse of the crystal structure.
VRSt,CrystalR is not equal to the volumetric storage of a tank (VRSt,TankR) unless one is able to pack the adsorbent grains into the tank with no interstitial space. In practice this is impossible. To estimate VRSt,TankR, it was assumed that one could pack the grains of powdered adsorbent into the tank with an efficiency of about 0.63 in a “random close packed” arrangement. Here the packing efficiency is represented by f.
In practice achieving f =0.63 can be difficult as is demonstrated by the data collected on HKUST-1 by Gaab, shown in Table 4. In the case of Mason, et al., 2014, VRSt,Tank Rwas estimated to be 111 g/L by assuming f =0.63. Gaab, et al., 2012, from BASF, measured VRSt,Tank Rdirectly and found it to be 78 g/L which translates to f =0.39. This example demonstrates that taking f =0.63 likely overestimates the volumetric storage of many powders. For monoliths f =1.00 because it is assumed there is no interstitial space between monoliths when they are put into a tank.
The adsorption isotherms for University of Missouri’s best monolith, BR-0311, and randomly close packed Ni-MOF-74 were used to construct the plots in Figure 22. These plots show the amount of gas delivered as a function of vehicle rail pressure for the world’s top performing materials under isothermal, room temperature conditions. University of Missouri’s best monolith is unmatched when delivering gas from 35 bar. It is important to note that no one has been able to achieve this level of storage capacity with Ni-MOF-74 in a real tank.
Figure 22: Isothermal Delivery of Methane as a Function of Rail Pressure
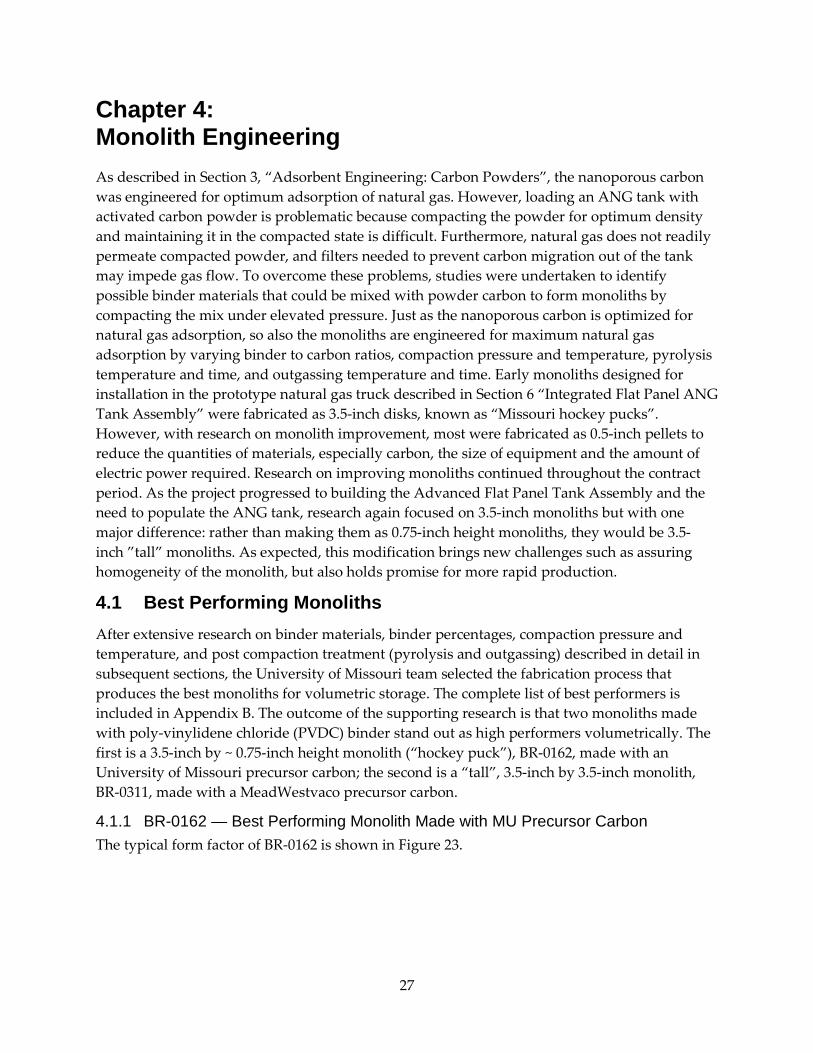
27
Chapter 4: Monolith Engineering As described in Section 3, “Adsorbent Engineering: Carbon Powders”, the nanoporous carbon was engineered for optimum adsorption of natural gas. However, loading an ANG tank with activated carbon powder is problematic because compacting the powder for optimum density and maintaining it in the compacted state is difficult. Furthermore, natural gas does not readily permeate compacted powder, and filters needed to prevent carbon migration out of the tank may impede gas flow. To overcome these problems, studies were undertaken to identify possible binder materials that could be mixed with powder carbon to form monoliths by compacting the mix under elevated pressure. Just as the nanoporous carbon is optimized for natural gas adsorption, so also the monoliths are engineered for maximum natural gas adsorption by varying binder to carbon ratios, compaction pressure and temperature, pyrolysis temperature and time, and outgassing temperature and time. Early monoliths designed for installation in the prototype natural gas truck described in Section 6 “Integrated Flat Panel ANG Tank Assembly” were fabricated as 3.5-inch disks, known as “Missouri hockey pucks”. However, with research on monolith improvement, most were fabricated as 0.5-inch pellets to reduce the quantities of materials, especially carbon, the size of equipment and the amount of electric power required. Research on improving monoliths continued throughout the contract period. As the project progressed to building the Advanced Flat Panel Tank Assembly and the need to populate the ANG tank, research again focused on 3.5-inch monoliths but with one major difference: rather than making them as 0.75-inch height monoliths, they would be 3.5-inch ”tall” monoliths. As expected, this modification brings new challenges such as assuring homogeneity of the monolith, but also holds promise for more rapid production.
4.1 Best Performing Monoliths After extensive research on binder materials, binder percentages, compaction pressure and temperature, and post compaction treatment (pyrolysis and outgassing) described in detail in subsequent sections, the University of Missouri team selected the fabrication process that produces the best monoliths for volumetric storage. The complete list of best performers is included in Appendix B. The outcome of the supporting research is that two monoliths made with poly-vinylidene chloride (PVDC) binder stand out as high performers volumetrically. The first is a 3.5-inch by ~ 0.75-inch height monolith (“hockey puck”), BR-0162, made with an University of Missouri precursor carbon; the second is a “tall”, 3.5-inch by 3.5-inch monolith, BR-0311, made with a MeadWestvaco precursor carbon.
4.1.1 BR-0162 — Best Performing Monolith Made with MU Precursor Carbon The typical form factor of BR-0162 is shown in Figure 23.
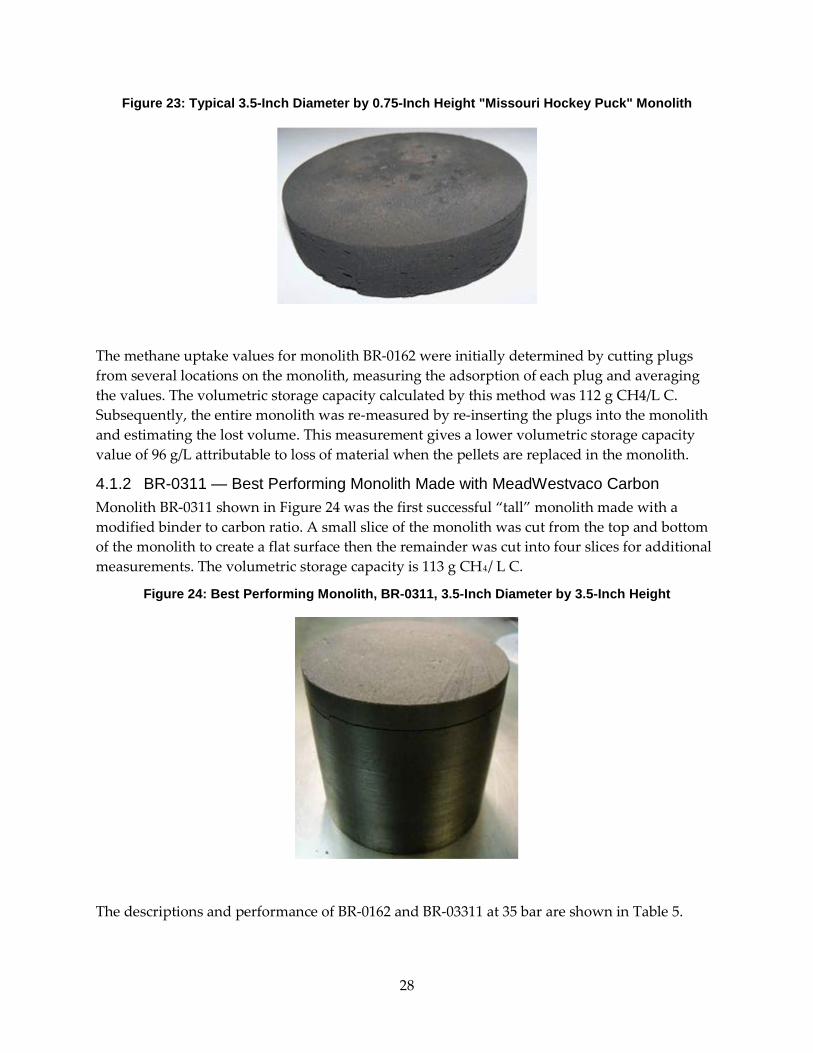
28
Figure 23: Typical 3.5-Inch Diameter by 0.75-Inch Height "Missouri Hockey Puck" Monolith
The methane uptake values for monolith BR-0162 were initially determined by cutting plugs from several locations on the monolith, measuring the adsorption of each plug and averaging the values. The volumetric storage capacity calculated by this method was 112 g CH4/L C. Subsequently, the entire monolith was re-measured by re-inserting the plugs into the monolith and estimating the lost volume. This measurement gives a lower volumetric storage capacity value of 96 g/L attributable to loss of material when the pellets are replaced in the monolith.
4.1.2 BR-0311 — Best Performing Monolith Made with MeadWestvaco Carbon Monolith BR-0311 shown in Figure 24 was the first successful “tall” monolith made with a modified binder to carbon ratio. A small slice of the monolith was cut from the top and bottom of the monolith to create a flat surface then the remainder was cut into four slices for additional measurements. The volumetric storage capacity is 113 g CHR4R/ L C.
Figure 24: Best Performing Monolith, BR-0311, 3.5-Inch Diameter by 3.5-Inch Height
The descriptions and performance of BR-0162 and BR-03311 at 35 bar are shown in Table 5.
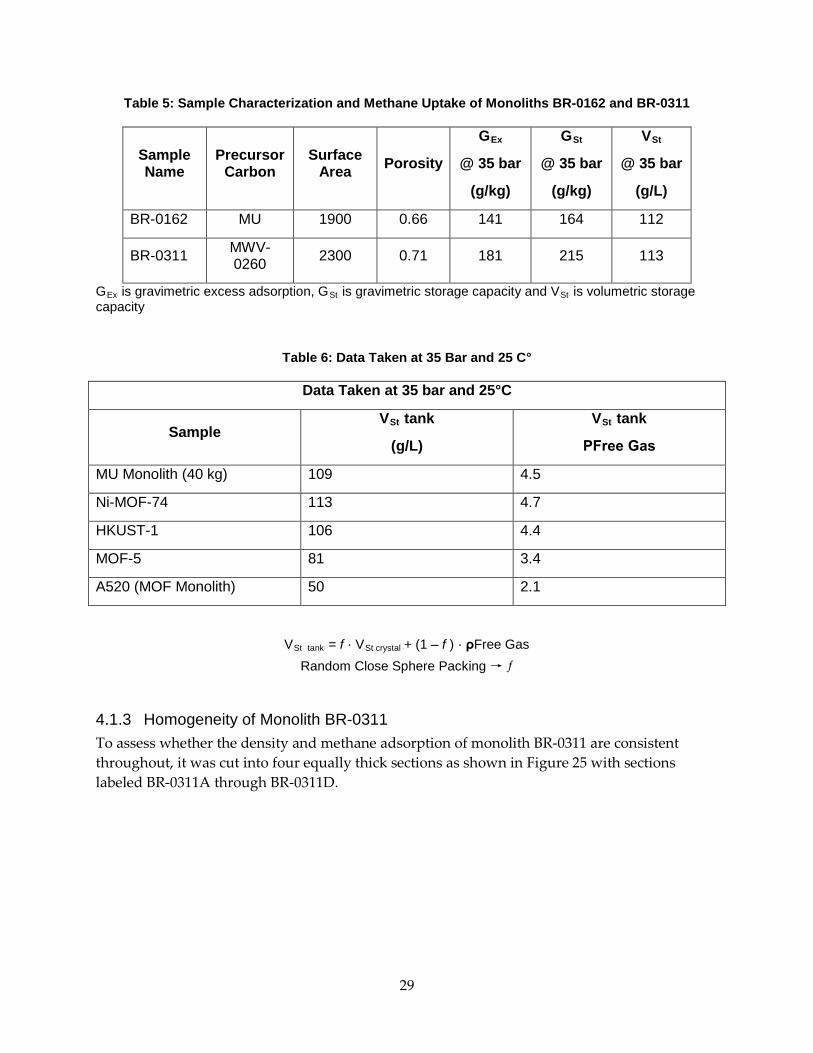
29
Table 5: Sample Characterization and Methane Uptake of Monoliths BR-0162 and BR-0311
Sample Name
Precursor Carbon
Surface Area Porosity
GREx
@ 35 bar
(g/kg)
GRSt
@ 35 bar
(g/kg)
VRSt
@ 35 bar
(g/L)
BR-0162 MU 1900 0.66 141 164 112
BR-0311 MWV-0260 2300 0.71 181 215 113
GRExR is gravimetric excess adsorption, G RStR is gravimetric storage capacity and VRStR is volumetric storage capacity
Table 6: Data Taken at 35 Bar and 25 C°
Data Taken at 35 bar and 25°C
Sample VRStR tank
(g/L)
VRStR tank
ΡFree Gas
MU Monolith (40 kg) 109 4.5
Ni-MOF-74 113 4.7
HKUST-1 106 4.4
MOF-5 81 3.4
A520 (MOF Monolith) 50 2.1
VRStR RtankR = f · VRSt crystal R+ (1 – f ) · ρFree Gas Random Close Sphere Packing → ƒ
4.1.3 Homogeneity of Monolith BR-0311 To assess whether the density and methane adsorption of monolith BR-0311 are consistent throughout, it was cut into four equally thick sections as shown in Figure 25 with sections labeled BR-0311A through BR-0311D.
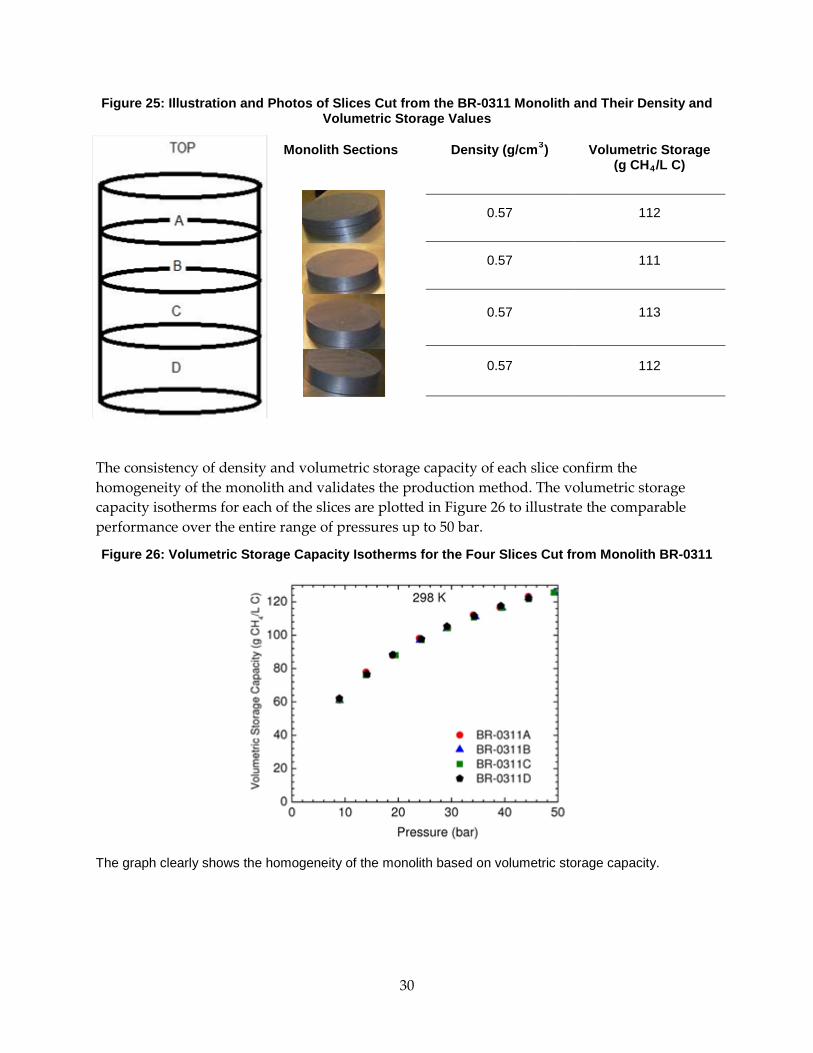
30
Figure 25: Illustration and Photos of Slices Cut from the BR-0311 Monolith and Their Density and Volumetric Storage Values
Monolith Sections Density (g/cmP
3P)
Volumetric Storage (g CHR4R/L C)
0.57 112
0.57 111
0.57 113
0.57 112
The consistency of density and volumetric storage capacity of each slice confirm the homogeneity of the monolith and validates the production method. The volumetric storage capacity isotherms for each of the slices are plotted in Figure 26 to illustrate the comparable performance over the entire range of pressures up to 50 bar.
Figure 26: Volumetric Storage Capacity Isotherms for the Four Slices Cut from Monolith BR-0311
The graph clearly shows the homogeneity of the monolith based on volumetric storage capacity.
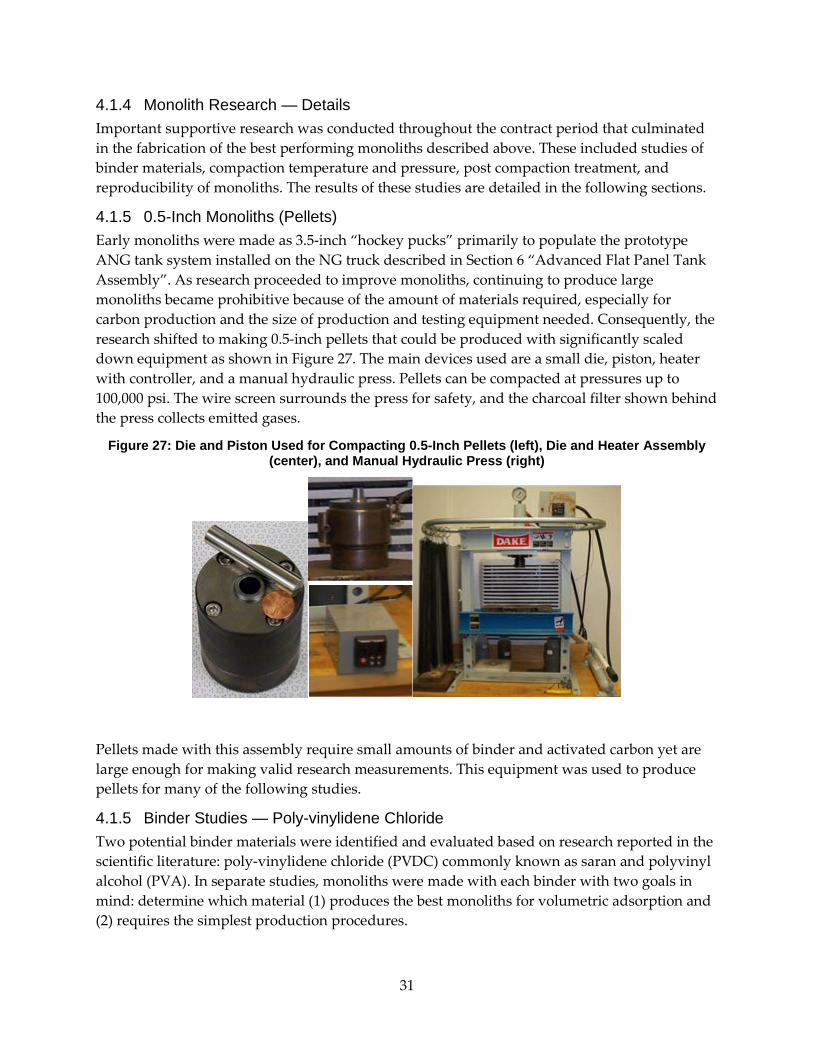
31
4.1.4 Monolith Research — Details Important supportive research was conducted throughout the contract period that culminated in the fabrication of the best performing monoliths described above. These included studies of binder materials, compaction temperature and pressure, post compaction treatment, and reproducibility of monoliths. The results of these studies are detailed in the following sections.
4.1.5 0.5-Inch Monoliths (Pellets) Early monoliths were made as 3.5-inch “hockey pucks” primarily to populate the prototype ANG tank system installed on the NG truck described in Section 6 “Advanced Flat Panel Tank Assembly”. As research proceeded to improve monoliths, continuing to produce large monoliths became prohibitive because of the amount of materials required, especially for carbon production and the size of production and testing equipment needed. Consequently, the research shifted to making 0.5-inch pellets that could be produced with significantly scaled down equipment as shown in Figure 27. The main devices used are a small die, piston, heater with controller, and a manual hydraulic press. Pellets can be compacted at pressures up to 100,000 psi. The wire screen surrounds the press for safety, and the charcoal filter shown behind the press collects emitted gases.
Figure 27: Die and Piston Used for Compacting 0.5-Inch Pellets (left), Die and Heater Assembly (center), and Manual Hydraulic Press (right)
Pellets made with this assembly require small amounts of binder and activated carbon yet are large enough for making valid research measurements. This equipment was used to produce pellets for many of the following studies.
4.1.5 Binder Studies — Poly-vinylidene Chloride Two potential binder materials were identified and evaluated based on research reported in the scientific literature: poly-vinylidene chloride (PVDC) commonly known as saran and polyvinyl alcohol (PVA). In separate studies, monoliths were made with each binder with two goals in mind: determine which material (1) produces the best monoliths for volumetric adsorption and (2) requires the simplest production procedures.
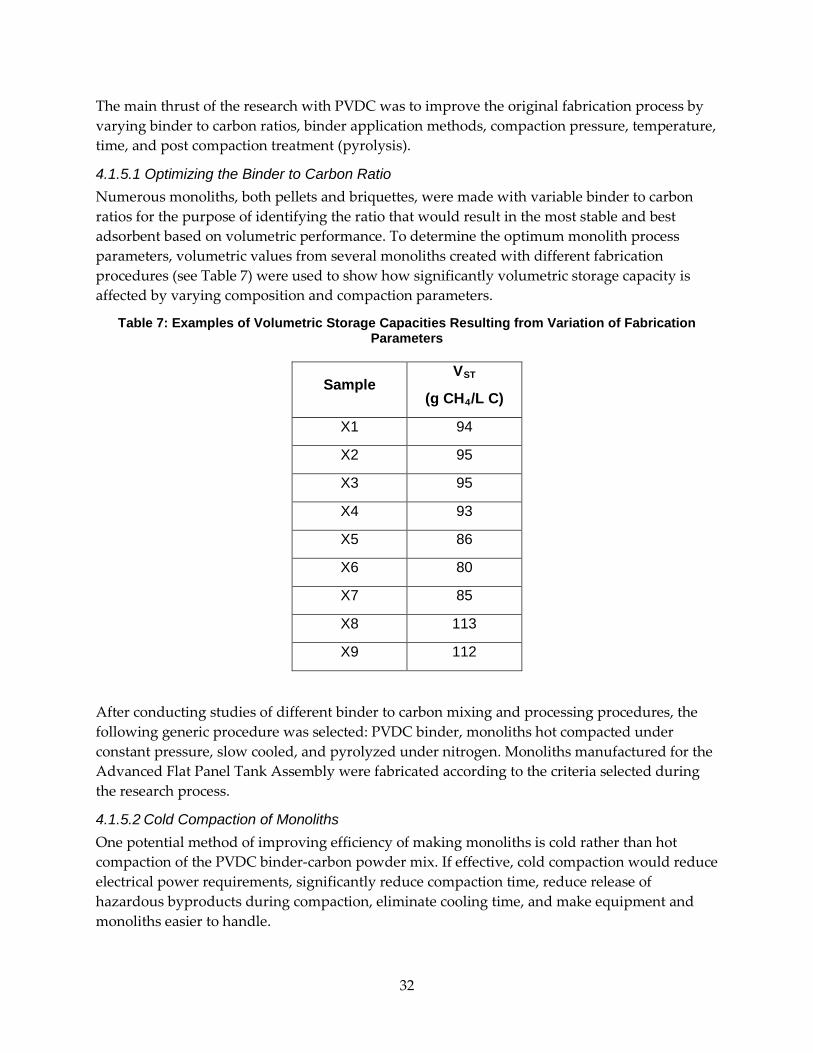
32
The main thrust of the research with PVDC was to improve the original fabrication process by varying binder to carbon ratios, binder application methods, compaction pressure, temperature, time, and post compaction treatment (pyrolysis).
4.1.5.1 Optimizing the Binder to Carbon Ratio Numerous monoliths, both pellets and briquettes, were made with variable binder to carbon ratios for the purpose of identifying the ratio that would result in the most stable and best adsorbent based on volumetric performance. To determine the optimum monolith process parameters, volumetric values from several monoliths created with different fabrication procedures (see Table 7) were used to show how significantly volumetric storage capacity is affected by varying composition and compaction parameters.
Table 7: Examples of Volumetric Storage Capacities Resulting from Variation of Fabrication Parameters
Sample VRST
(g CHR4R/L C)
X1 94
X2 95
X3 95
X4 93
X5 86
X6 80
X7 85
X8 113
X9 112
After conducting studies of different binder to carbon mixing and processing procedures, the following generic procedure was selected: PVDC binder, monoliths hot compacted under constant pressure, slow cooled, and pyrolyzed under nitrogen. Monoliths manufactured for the Advanced Flat Panel Tank Assembly were fabricated according to the criteria selected during the research process.
4.1.5.2 Cold Compaction of Monoliths One potential method of improving efficiency of making monoliths is cold rather than hot compaction of the PVDC binder-carbon powder mix. If effective, cold compaction would reduce electrical power requirements, significantly reduce compaction time, reduce release of hazardous byproducts during compaction, eliminate cooling time, and make equipment and monoliths easier to handle.
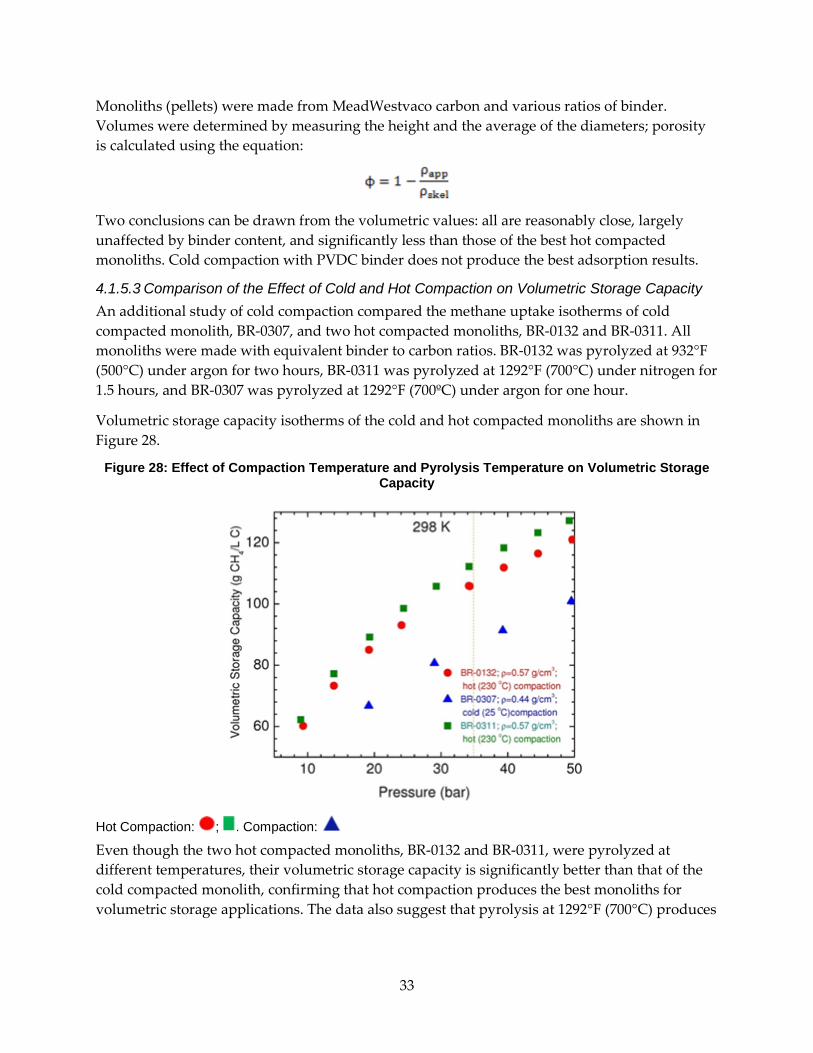
33
Monoliths (pellets) were made from MeadWestvaco carbon and various ratios of binder. Volumes were determined by measuring the height and the average of the diameters; porosity is calculated using the equation:
Two conclusions can be drawn from the volumetric values: all are reasonably close, largely unaffected by binder content, and significantly less than those of the best hot compacted monoliths. Cold compaction with PVDC binder does not produce the best adsorption results.
4.1.5.3 Comparison of the Effect of Cold and Hot Compaction on Volumetric Storage Capacity An additional study of cold compaction compared the methane uptake isotherms of cold compacted monolith, BR-0307, and two hot compacted monoliths, BR-0132 and BR-0311. All monoliths were made with equivalent binder to carbon ratios. BR-0132 was pyrolyzed at 932°F (500°C) under argon for two hours, BR-0311 was pyrolyzed at 1292°F (700°C) under nitrogen for 1.5 hours, and BR-0307 was pyrolyzed at 1292°F (700ºC) under argon for one hour.
Volumetric storage capacity isotherms of the cold and hot compacted monoliths are shown in Figure 28.
Figure 28: Effect of Compaction Temperature and Pyrolysis Temperature on Volumetric Storage Capacity
Hot Compaction: ; . Compaction:
Even though the two hot compacted monoliths, BR-0132 and BR-0311, were pyrolyzed at different temperatures, their volumetric storage capacity is significantly better than that of the cold compacted monolith, confirming that hot compaction produces the best monoliths for volumetric storage applications. The data also suggest that pyrolysis at 1292°F (700°C) produces
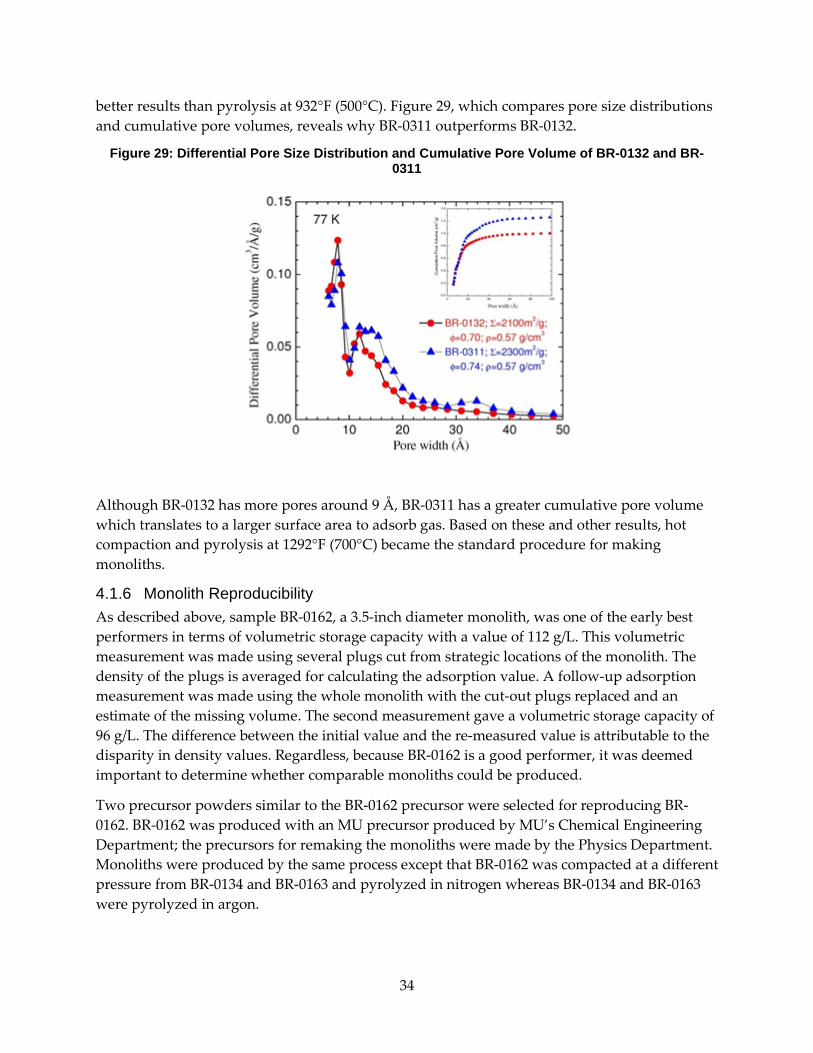
34
better results than pyrolysis at 932°F (500°C). Figure 29, which compares pore size distributions and cumulative pore volumes, reveals why BR-0311 outperforms BR-0132.
Figure 29: Differential Pore Size Distribution and Cumulative Pore Volume of BR-0132 and BR-0311
Although BR-0132 has more pores around 9 Å, BR-0311 has a greater cumulative pore volume which translates to a larger surface area to adsorb gas. Based on these and other results, hot compaction and pyrolysis at 1292°F (700°C) became the standard procedure for making monoliths.
4.1.6 Monolith Reproducibility As described above, sample BR-0162, a 3.5-inch diameter monolith, was one of the early best performers in terms of volumetric storage capacity with a value of 112 g/L. This volumetric measurement was made using several plugs cut from strategic locations of the monolith. The density of the plugs is averaged for calculating the adsorption value. A follow-up adsorption measurement was made using the whole monolith with the cut-out plugs replaced and an estimate of the missing volume. The second measurement gave a volumetric storage capacity of 96 g/L. The difference between the initial value and the re-measured value is attributable to the disparity in density values. Regardless, because BR-0162 is a good performer, it was deemed important to determine whether comparable monoliths could be produced.
Two precursor powders similar to the BR-0162 precursor were selected for reproducing BR-0162. BR-0162 was produced with an MU precursor produced by MU’s Chemical Engineering Department; the precursors for remaking the monoliths were made by the Physics Department. Monoliths were produced by the same process except that BR-0162 was compacted at a different pressure from BR-0134 and BR-0163 and pyrolyzed in nitrogen whereas BR-0134 and BR-0163 were pyrolyzed in argon.
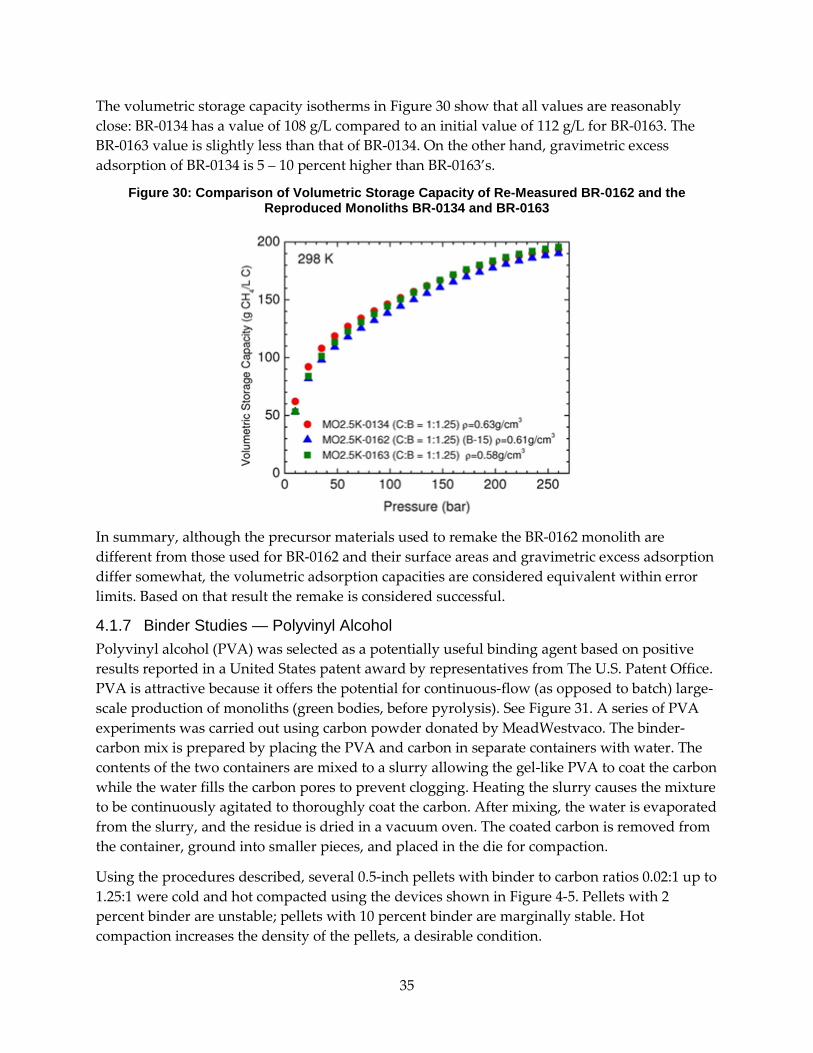
35
The volumetric storage capacity isotherms in Figure 30 show that all values are reasonably close: BR-0134 has a value of 108 g/L compared to an initial value of 112 g/L for BR-0163. The BR-0163 value is slightly less than that of BR-0134. On the other hand, gravimetric excess adsorption of BR-0134 is 5 – 10 percent higher than BR-0163’s.
Figure 30: Comparison of Volumetric Storage Capacity of Re-Measured BR-0162 and the Reproduced Monoliths BR-0134 and BR-0163
In summary, although the precursor materials used to remake the BR-0162 monolith are different from those used for BR-0162 and their surface areas and gravimetric excess adsorption differ somewhat, the volumetric adsorption capacities are considered equivalent within error limits. Based on that result the remake is considered successful.
4.1.7 Binder Studies — Polyvinyl Alcohol Polyvinyl alcohol (PVA) was selected as a potentially useful binding agent based on positive results reported in a United States patent award by representatives from The U.S. Patent Office. PVA is attractive because it offers the potential for continuous-flow (as opposed to batch) large-scale production of monoliths (green bodies, before pyrolysis). See Figure 31. A series of PVA experiments was carried out using carbon powder donated by MeadWestvaco. The binder-carbon mix is prepared by placing the PVA and carbon in separate containers with water. The contents of the two containers are mixed to a slurry allowing the gel-like PVA to coat the carbon while the water fills the carbon pores to prevent clogging. Heating the slurry causes the mixture to be continuously agitated to thoroughly coat the carbon. After mixing, the water is evaporated from the slurry, and the residue is dried in a vacuum oven. The coated carbon is removed from the container, ground into smaller pieces, and placed in the die for compaction.
Using the procedures described, several 0.5-inch pellets with binder to carbon ratios 0.02:1 up to 1.25:1 were cold and hot compacted using the devices shown in Figure 4-5. Pellets with 2 percent binder are unstable; pellets with 10 percent binder are marginally stable. Hot compaction increases the density of the pellets, a desirable condition.
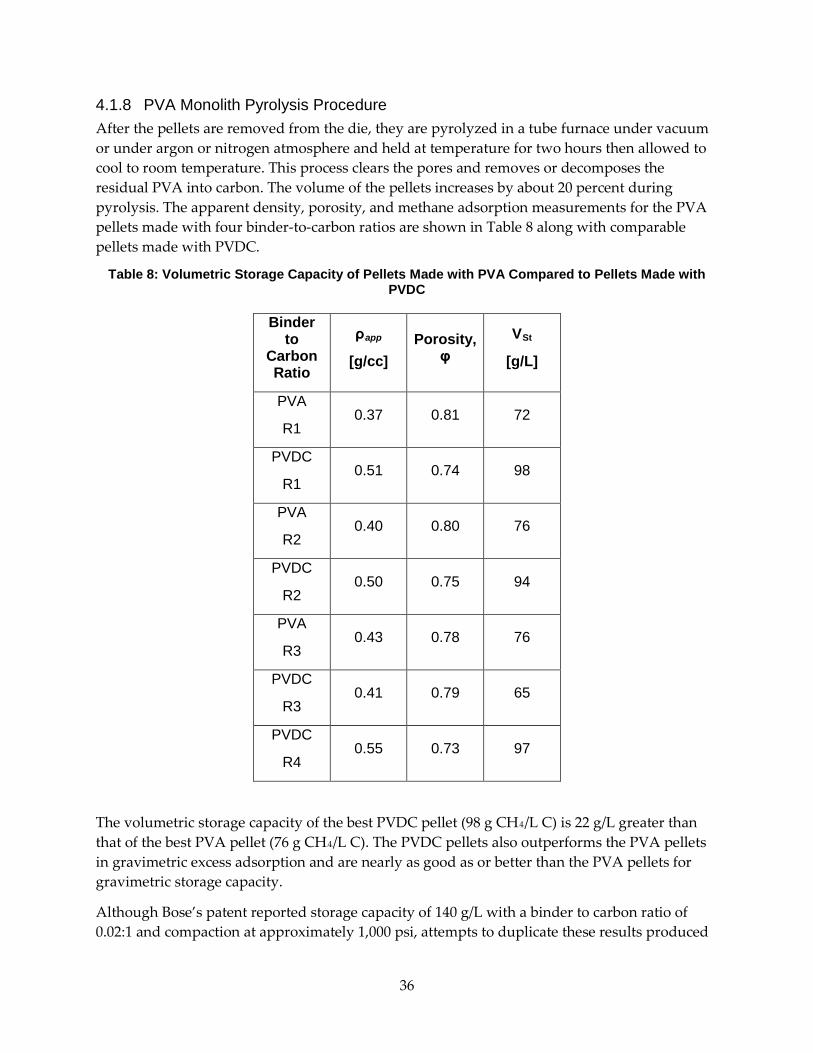
36
4.1.8 PVA Monolith Pyrolysis Procedure After the pellets are removed from the die, they are pyrolyzed in a tube furnace under vacuum or under argon or nitrogen atmosphere and held at temperature for two hours then allowed to cool to room temperature. This process clears the pores and removes or decomposes the residual PVA into carbon. The volume of the pellets increases by about 20 percent during pyrolysis. The apparent density, porosity, and methane adsorption measurements for the PVA pellets made with four binder-to-carbon ratios are shown in Table 8 along with comparable pellets made with PVDC.
Table 8: Volumetric Storage Capacity of Pellets Made with PVA Compared to Pellets Made with PVDC
Binder to
Carbon Ratio
ρRapp
[g/cc] Porosity,
φ VRSt
[g/L]
PVA
R1 0.37 0.81 72
PVDC
R1 0.51 0.74 98
PVA
R2 0.40 0.80 76
PVDC
R2 0.50 0.75 94
PVA
R3 0.43 0.78 76
PVDC
R3 0.41 0.79 65
PVDC
R4 0.55 0.73 97
The volumetric storage capacity of the best PVDC pellet (98 g CHR4R/L C) is 22 g/L greater than that of the best PVA pellet (76 g CHR4R/L C). The PVDC pellets also outperforms the PVA pellets in gravimetric excess adsorption and are nearly as good as or better than the PVA pellets for gravimetric storage capacity.
Although Bose’s patent reported storage capacity of 140 g/L with a binder to carbon ratio of 0.02:1 and compaction at approximately 1,000 psi, attempts to duplicate these results produced

37
only unstable pellets. Based on these results and the values reported in Table 8, the decision was made to abandon PVA as the binder for this project.
A prototype extrusion-compaction machine, Figure 31, for extrusion of PVA-based cold-compressed carbon monoliths (green bodies) was designed, constructed, and tested/deployed. The machine was tested but not used for production after PVDC was selected as the preferred binder.
Figure 31: Prototype Extrusion-Compaction Machine
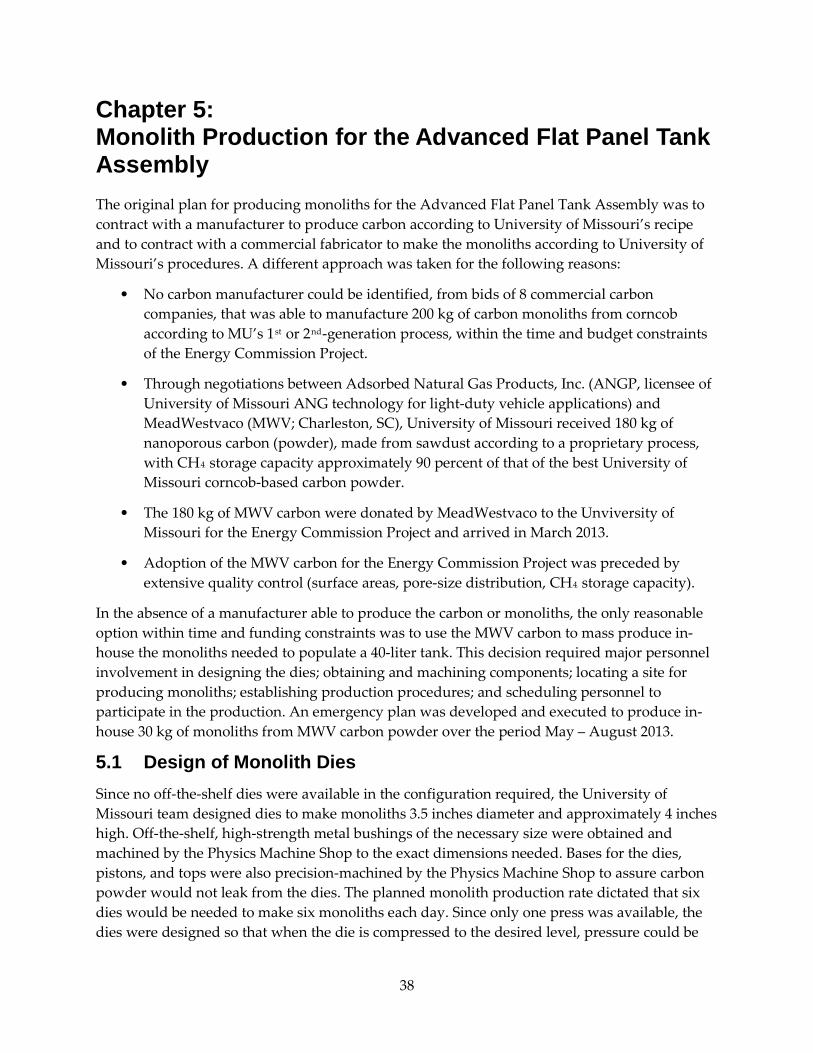
38
Chapter 5: Monolith Production for the Advanced Flat Panel Tank Assembly The original plan for producing monoliths for the Advanced Flat Panel Tank Assembly was to contract with a manufacturer to produce carbon according to University of Missouri’s recipe and to contract with a commercial fabricator to make the monoliths according to University of Missouri’s procedures. A different approach was taken for the following reasons:
• No carbon manufacturer could be identified, from bids of 8 commercial carbon companies, that was able to manufacture 200 kg of carbon monoliths from corncob according to MU’s 1P
stP or 2P
ndP-generation process, within the time and budget constraints
of the Energy Commission Project.
• Through negotiations between Adsorbed Natural Gas Products, Inc. (ANGP, licensee of University of Missouri ANG technology for light-duty vehicle applications) and MeadWestvaco (MWV; Charleston, SC), University of Missouri received 180 kg of nanoporous carbon (powder), made from sawdust according to a proprietary process, with CHR4R storage capacity approximately 90 percent of that of the best University of Missouri corncob-based carbon powder.
• The 180 kg of MWV carbon were donated by MeadWestvaco to the Unviversity of Missouri for the Energy Commission Project and arrived in March 2013.
• Adoption of the MWV carbon for the Energy Commission Project was preceded by extensive quality control (surface areas, pore-size distribution, CHR4R storage capacity).
In the absence of a manufacturer able to produce the carbon or monoliths, the only reasonable option within time and funding constraints was to use the MWV carbon to mass produce in-house the monoliths needed to populate a 40-liter tank. This decision required major personnel involvement in designing the dies; obtaining and machining components; locating a site for producing monoliths; establishing production procedures; and scheduling personnel to participate in the production. An emergency plan was developed and executed to produce in-house 30 kg of monoliths from MWV carbon powder over the period May – August 2013.
5.1 Design of Monolith Dies Since no off-the-shelf dies were available in the configuration required, the University of Missouri team designed dies to make monoliths 3.5 inches diameter and approximately 4 inches high. Off-the-shelf, high-strength metal bushings of the necessary size were obtained and machined by the Physics Machine Shop to the exact dimensions needed. Bases for the dies, pistons, and tops were also precision-machined by the Physics Machine Shop to assure carbon powder would not leak from the dies. The planned monolith production rate dictated that six dies would be needed to make six monoliths each day. Since only one press was available, the dies were designed so that when the die is compressed to the desired level, pressure could be

39
maintained to allow the die assembly to be removed from the press, thereby freeing the press for compressing the next die assembly.
The die components and an assembled die are shown in Figures 32 through 35.
Figure 32: Completed Die Components Showing the Die, Piston, Base, and Top
Figure 33: Die Base Detail
The threaded rods in conjunction with the top plate and nuts (Figure 32) are used to maintain pressure on the monolith when the assembly is removed from the press. The small hole in the center of the base (Figure 33) allows gas to escape during compaction and heating. The larger section of the hole accommodates a filter to prevent carbon from escaping. The set screws adjacent to the raised area are used to remove the die from the base.
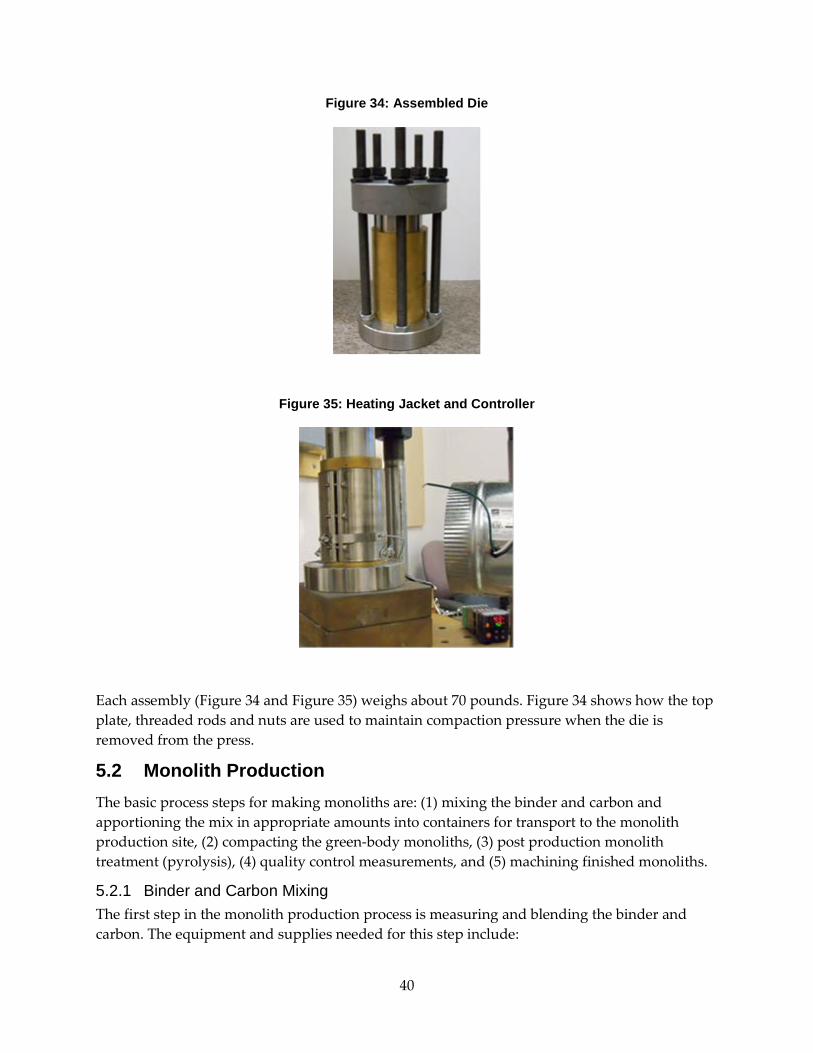
40
Figure 34: Assembled Die
Figure 35: Heating Jacket and Controller
Each assembly (Figure 34 and Figure 35) weighs about 70 pounds. Figure 34 shows how the top plate, threaded rods and nuts are used to maintain compaction pressure when the die is removed from the press.
5.2 Monolith Production The basic process steps for making monoliths are: (1) mixing the binder and carbon and apportioning the mix in appropriate amounts into containers for transport to the monolith production site, (2) compacting the green-body monoliths, (3) post production monolith treatment (pyrolysis), (4) quality control measurements, and (5) machining finished monoliths.
5.2.1 Binder and Carbon Mixing The first step in the monolith production process is measuring and blending the binder and carbon. The equipment and supplies needed for this step include:
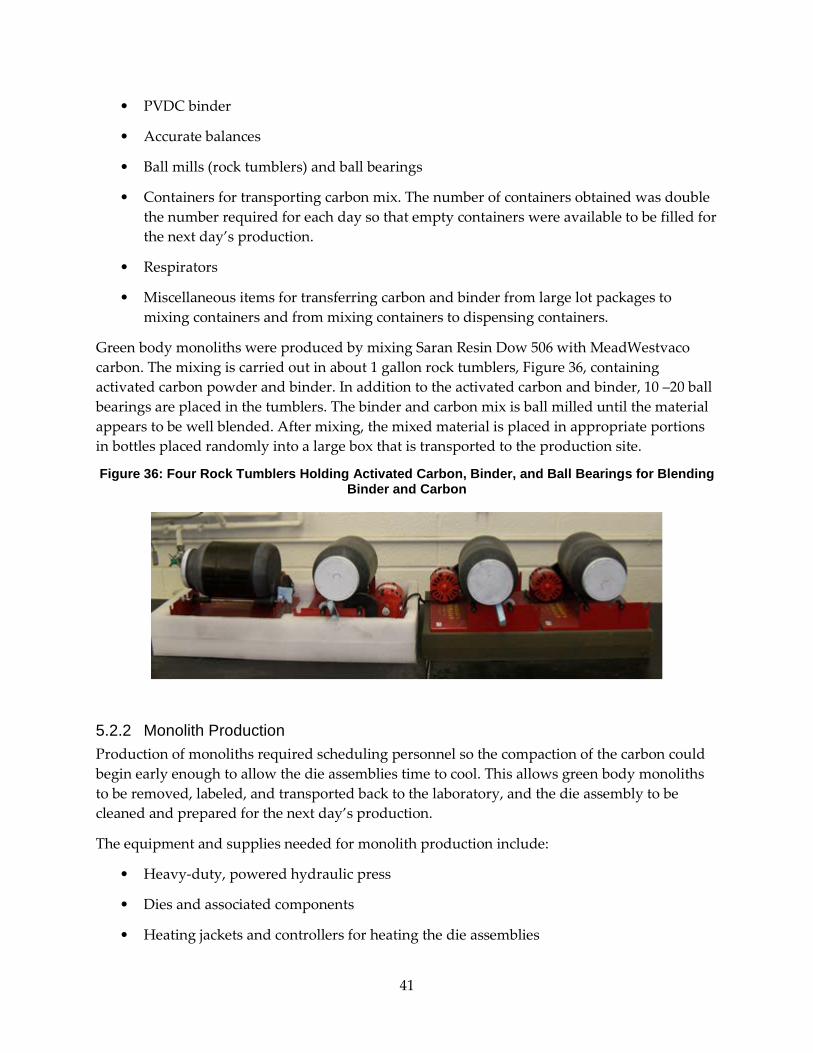
41
• PVDC binder
• Accurate balances
• Ball mills (rock tumblers) and ball bearings
• Containers for transporting carbon mix. The number of containers obtained was double the number required for each day so that empty containers were available to be filled for the next day’s production.
• Respirators
• Miscellaneous items for transferring carbon and binder from large lot packages to mixing containers and from mixing containers to dispensing containers.
Green body monoliths were produced by mixing Saran Resin Dow 506 with MeadWestvaco carbon. The mixing is carried out in about 1 gallon rock tumblers, Figure 36, containing activated carbon powder and binder. In addition to the activated carbon and binder, 10 –20 ball bearings are placed in the tumblers. The binder and carbon mix is ball milled until the material appears to be well blended. After mixing, the mixed material is placed in appropriate portions in bottles placed randomly into a large box that is transported to the production site.
Figure 36: Four Rock Tumblers Holding Activated Carbon, Binder, and Ball Bearings for Blending Binder and Carbon
5.2.2 Monolith Production Production of monoliths required scheduling personnel so the compaction of the carbon could begin early enough to allow the die assemblies time to cool. This allows green body monoliths to be removed, labeled, and transported back to the laboratory, and the die assembly to be cleaned and prepared for the next day’s production.
The equipment and supplies needed for monolith production include:
• Heavy-duty, powered hydraulic press
• Dies and associated components
• Heating jackets and controllers for heating the die assemblies
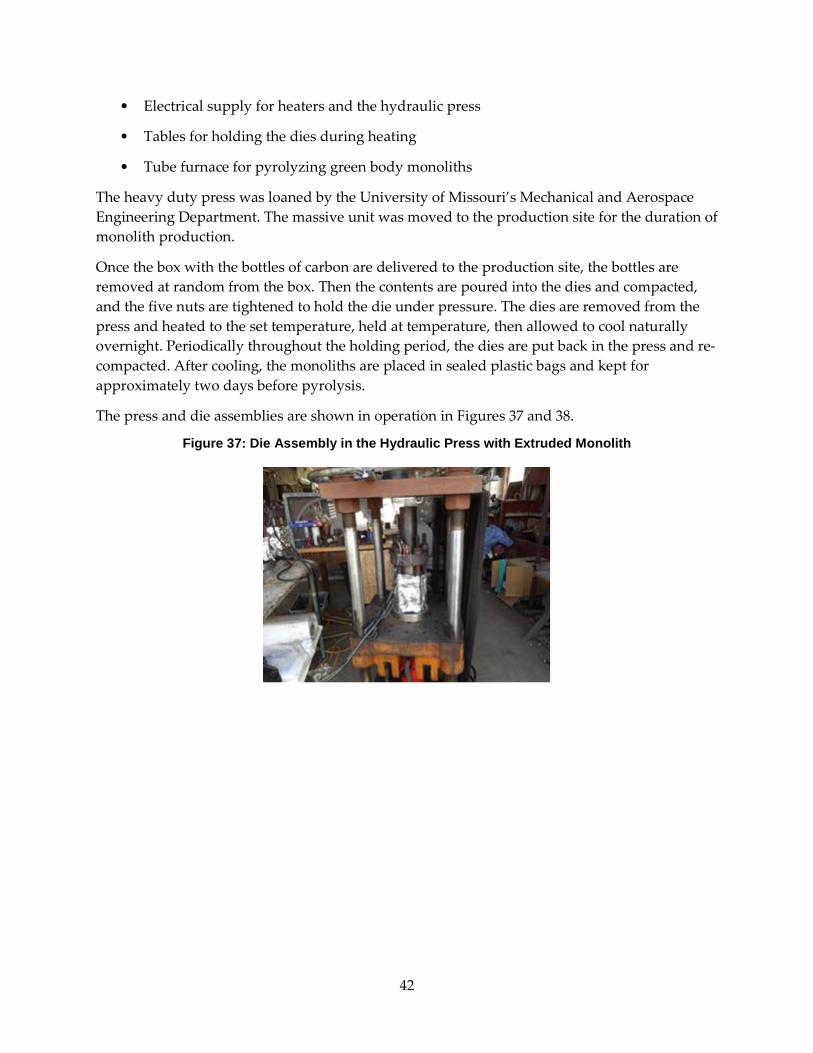
42
• Electrical supply for heaters and the hydraulic press
• Tables for holding the dies during heating
• Tube furnace for pyrolyzing green body monoliths
The heavy duty press was loaned by the University of Missouri’s Mechanical and Aerospace Engineering Department. The massive unit was moved to the production site for the duration of monolith production.
Once the box with the bottles of carbon are delivered to the production site, the bottles are removed at random from the box. Then the contents are poured into the dies and compacted, and the five nuts are tightened to hold the die under pressure. The dies are removed from the press and heated to the set temperature, held at temperature, then allowed to cool naturally overnight. Periodically throughout the holding period, the dies are put back in the press and re-compacted. After cooling, the monoliths are placed in sealed plastic bags and kept for approximately two days before pyrolysis.
The press and die assemblies are shown in operation in Figures 37 and 38.
Figure 37: Die Assembly in the Hydraulic Press with Extruded Monolith
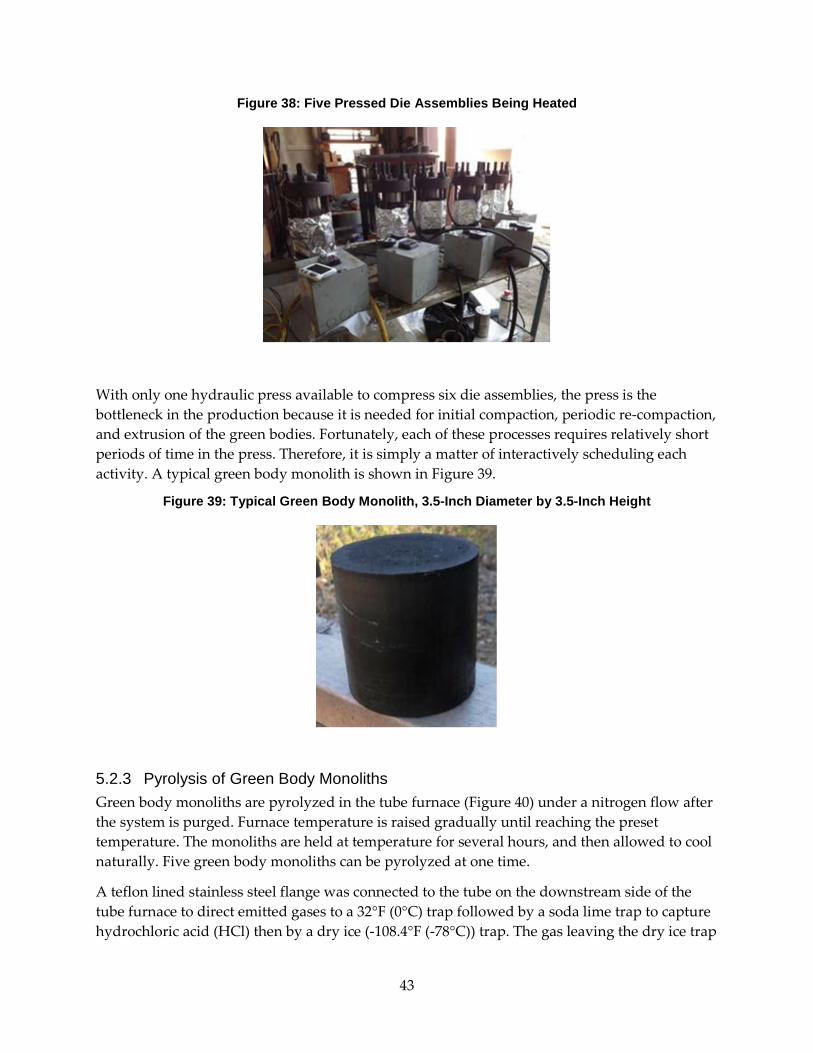
43
Figure 38: Five Pressed Die Assemblies Being Heated
With only one hydraulic press available to compress six die assemblies, the press is the bottleneck in the production because it is needed for initial compaction, periodic re-compaction, and extrusion of the green bodies. Fortunately, each of these processes requires relatively short periods of time in the press. Therefore, it is simply a matter of interactively scheduling each activity. A typical green body monolith is shown in Figure 39.
Figure 39: Typical Green Body Monolith, 3.5-Inch Diameter by 3.5-Inch Height
5.2.3 Pyrolysis of Green Body Monoliths Green body monoliths are pyrolyzed in the tube furnace (Figure 40) under a nitrogen flow after the system is purged. Furnace temperature is raised gradually until reaching the preset temperature. The monoliths are held at temperature for several hours, and then allowed to cool naturally. Five green body monoliths can be pyrolyzed at one time.
A teflon lined stainless steel flange was connected to the tube on the downstream side of the tube furnace to direct emitted gases to a 32°F (0°C) trap followed by a soda lime trap to capture hydrochloric acid (HCl) then by a dry ice (-108.4°F (-78°C)) trap. The gas leaving the dry ice trap
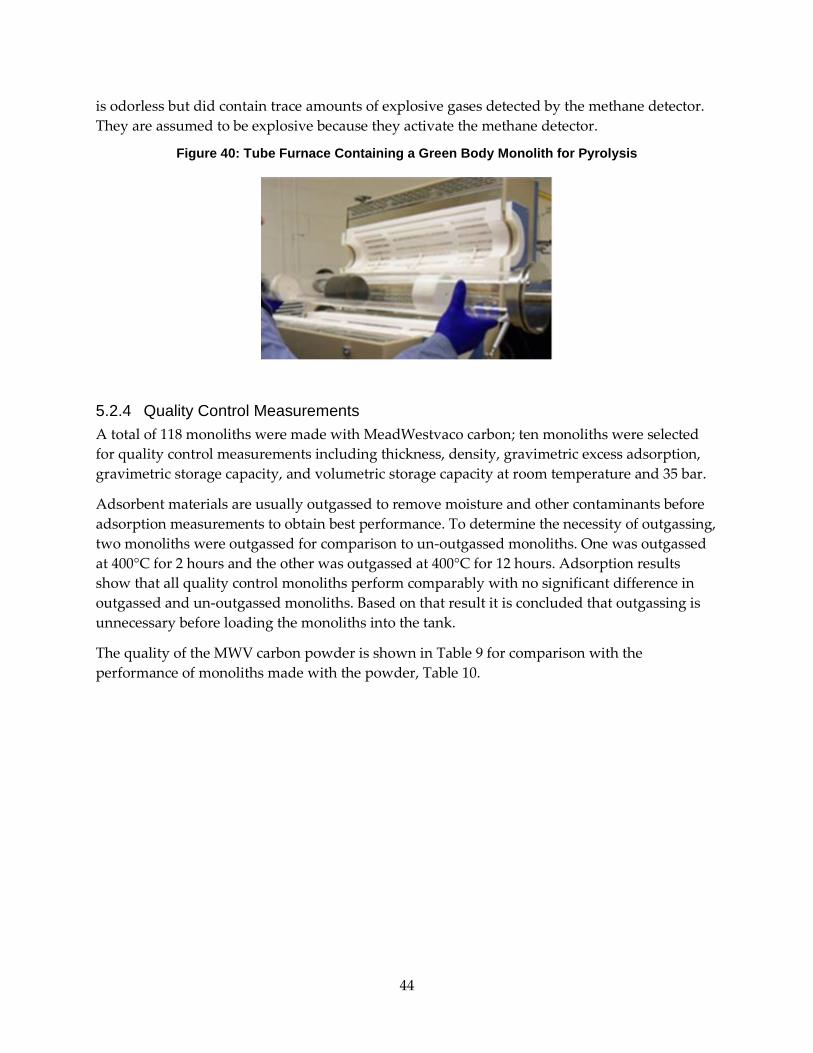
44
is odorless but did contain trace amounts of explosive gases detected by the methane detector. They are assumed to be explosive because they activate the methane detector.
Figure 40: Tube Furnace Containing a Green Body Monolith for Pyrolysis
5.2.4 Quality Control Measurements A total of 118 monoliths were made with MeadWestvaco carbon; ten monoliths were selected for quality control measurements including thickness, density, gravimetric excess adsorption, gravimetric storage capacity, and volumetric storage capacity at room temperature and 35 bar.
Adsorbent materials are usually outgassed to remove moisture and other contaminants before adsorption measurements to obtain best performance. To determine the necessity of outgassing, two monoliths were outgassed for comparison to un-outgassed monoliths. One was outgassed at 400°C for 2 hours and the other was outgassed at 400°C for 12 hours. Adsorption results show that all quality control monoliths perform comparably with no significant difference in outgassed and un-outgassed monoliths. Based on that result it is concluded that outgassing is unnecessary before loading the monoliths into the tank.
The quality of the MWV carbon powder is shown in Table 9 for comparison with the performance of monoliths made with the powder, Table 10.
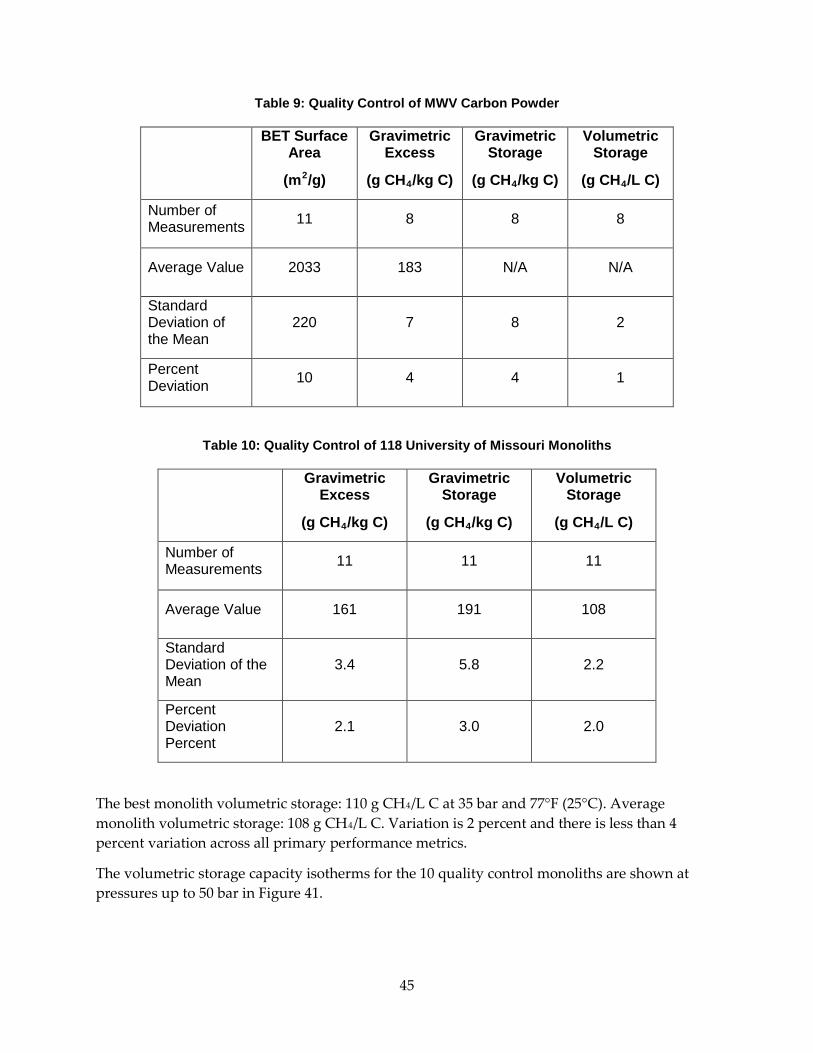
45
Table 9: Quality Control of MWV Carbon Powder
BET Surface Area
(mP
2P/g)
Gravimetric Excess
(g CHR4R/kg C)
Gravimetric Storage
(g CHR4R/kg C)
Volumetric Storage
(g CHR4R/L C)
Number of Measurements 11 8 8 8
Average Value 2033 183 N/A N/A
Standard Deviation of the Mean
220 7 8 2
Percent Deviation 10 4 4 1
Table 10: Quality Control of 118 University of Missouri Monoliths
Gravimetric
Excess
(g CHR4R/kg C)
Gravimetric Storage
(g CHR4R/kg C)
Volumetric Storage
(g CHR4R/L C)
Number of Measurements 11 11 11
Average Value 161 191 108
Standard Deviation of the Mean
3.4 5.8 2.2
Percent Deviation Percent
2.1 3.0 2.0
The best monolith volumetric storage: 110 g CHR4R/L C at 35 bar and 77°F (25°C). Average monolith volumetric storage: 108 g CHR4R/L C. Variation is 2 percent and there is less than 4 percent variation across all primary performance metrics.
The volumetric storage capacity isotherms for the 10 quality control monoliths are shown at pressures up to 50 bar in Figure 41.

46
Figure 41: Volumetric Storage Capacity Isotherms for 10 Quality Control Monoliths Produced for the Flat Panel Tank Assembly
The results shown in Table 10 and Figure 41 confirm the consistency of the production process and homogeneity of the resulting monoliths. The average volumetric adsorption capacity, 108 g/L, compares very favorably with the record performance of 113 g/L.
Several of the 118 monoliths produced for the flat panel tank are shown in Figure 42.
Figure 42: Monoliths Manufactured for the Flat Panel Tank Assembly
5.2.5 Monolith Machining The cylindrical monoliths required machining to fit into the flat panel fuel tank with chamber designs shown in Figure 43.
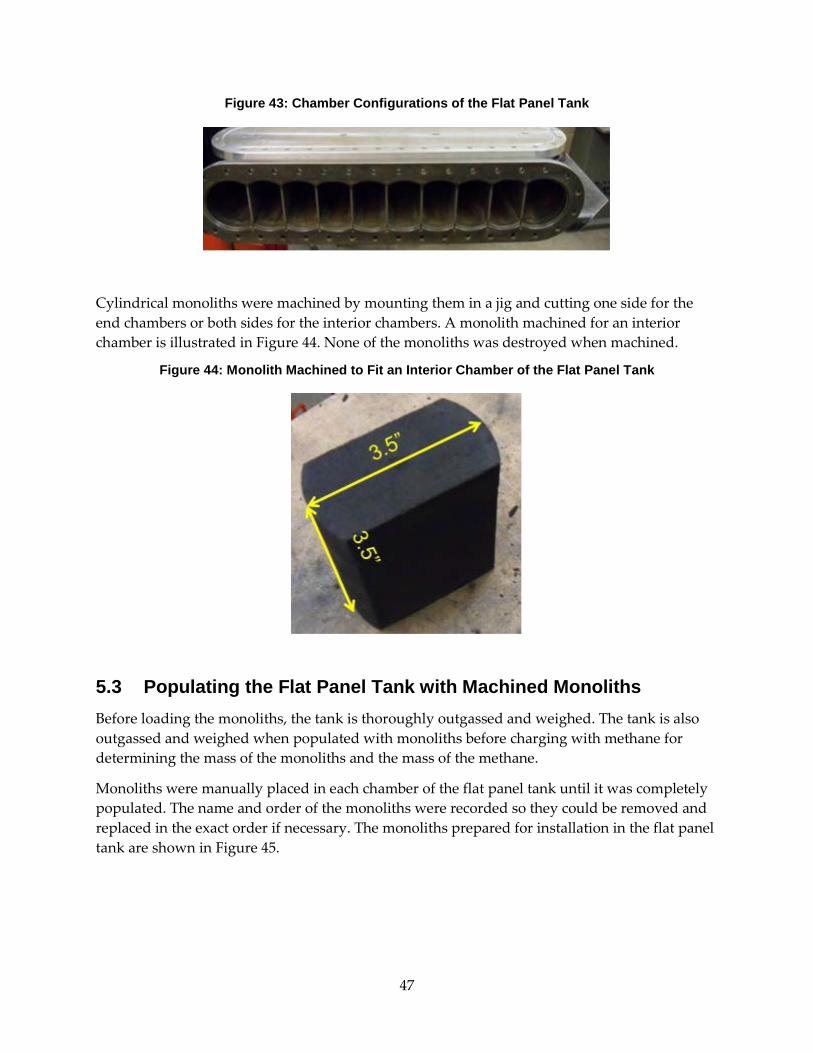
47
Figure 43: Chamber Configurations of the Flat Panel Tank
Cylindrical monoliths were machined by mounting them in a jig and cutting one side for the end chambers or both sides for the interior chambers. A monolith machined for an interior chamber is illustrated in Figure 44. None of the monoliths was destroyed when machined.
Figure 44: Monolith Machined to Fit an Interior Chamber of the Flat Panel Tank
5.3 Populating the Flat Panel Tank with Machined Monoliths Before loading the monoliths, the tank is thoroughly outgassed and weighed. The tank is also outgassed and weighed when populated with monoliths before charging with methane for determining the mass of the monoliths and the mass of the methane.
Monoliths were manually placed in each chamber of the flat panel tank until it was completely populated. The name and order of the monoliths were recorded so they could be removed and replaced in the exact order if necessary. The monoliths prepared for installation in the flat panel tank are shown in Figure 45.
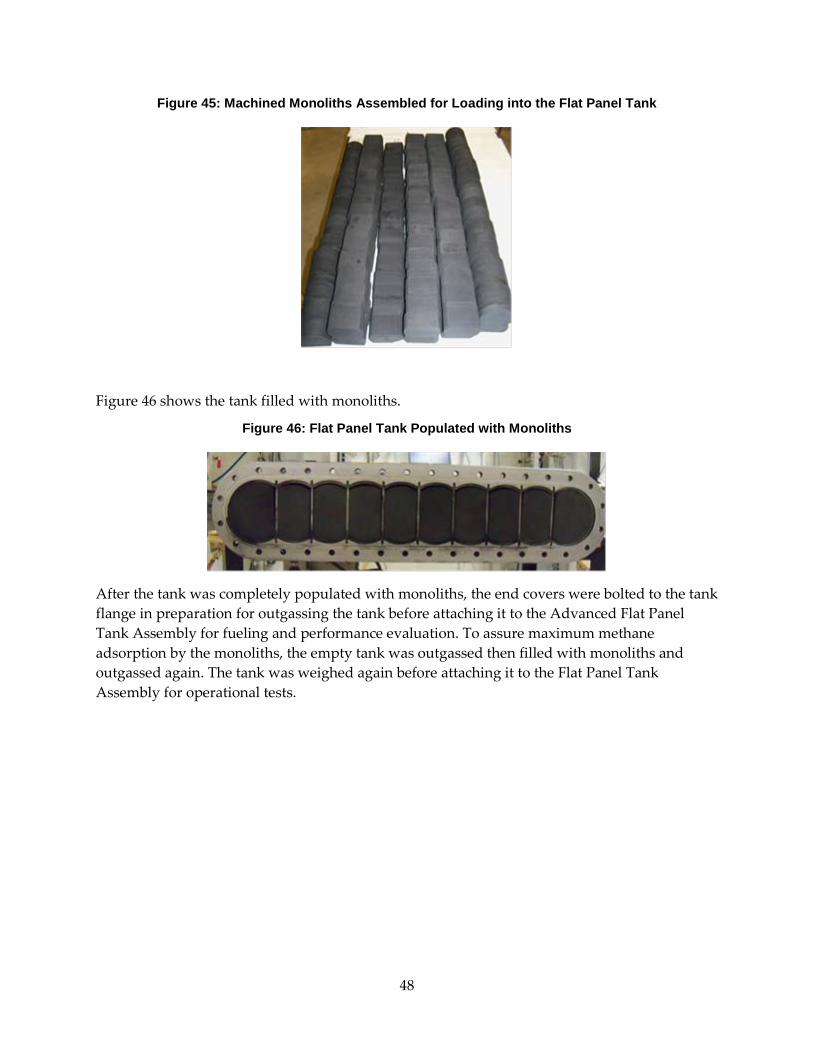
48
Figure 45: Machined Monoliths Assembled for Loading into the Flat Panel Tank
Figure 46 shows the tank filled with monoliths.
Figure 46: Flat Panel Tank Populated with Monoliths
After the tank was completely populated with monoliths, the end covers were bolted to the tank flange in preparation for outgassing the tank before attaching it to the Advanced Flat Panel Tank Assembly for fueling and performance evaluation. To assure maximum methane adsorption by the monoliths, the empty tank was outgassed then filled with monoliths and outgassed again. The tank was weighed again before attaching it to the Flat Panel Tank Assembly for operational tests.
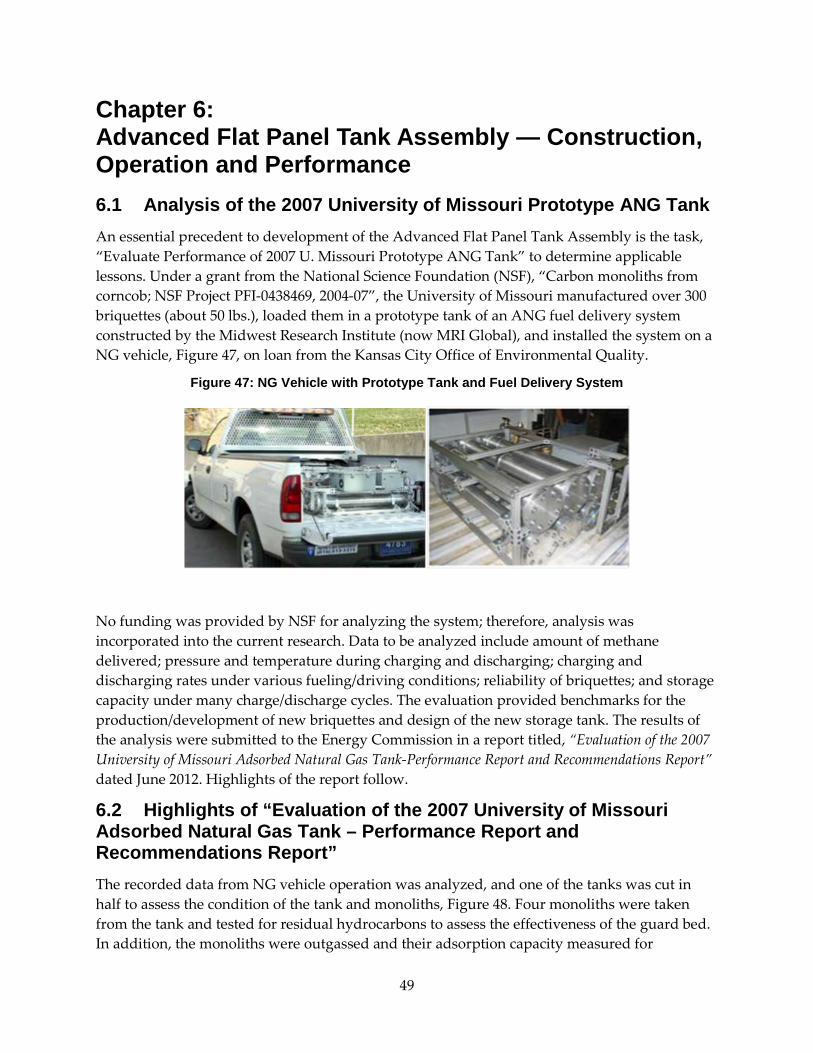
49
Chapter 6: Advanced Flat Panel Tank Assembly — Construction, Operation and Performance 6.1 Analysis of the 2007 University of Missouri Prototype ANG Tank An essential precedent to development of the Advanced Flat Panel Tank Assembly is the task, “Evaluate Performance of 2007 U. Missouri Prototype ANG Tank” to determine applicable lessons. Under a grant from the National Science Foundation (NSF), “Carbon monoliths from corncob; NSF Project PFI-0438469, 2004-07”, the University of Missouri manufactured over 300 briquettes (about 50 lbs.), loaded them in a prototype tank of an ANG fuel delivery system constructed by the Midwest Research Institute (now MRI Global), and installed the system on a NG vehicle, Figure 47, on loan from the Kansas City Office of Environmental Quality.
Figure 47: NG Vehicle with Prototype Tank and Fuel Delivery System
No funding was provided by NSF for analyzing the system; therefore, analysis was incorporated into the current research. Data to be analyzed include amount of methane delivered; pressure and temperature during charging and discharging; charging and discharging rates under various fueling/driving conditions; reliability of briquettes; and storage capacity under many charge/discharge cycles. The evaluation provided benchmarks for the production/development of new briquettes and design of the new storage tank. The results of the analysis were submitted to the Energy Commission in a report titled, “Evaluation of the 2007 University of Missouri Adsorbed Natural Gas Tank-Performance Report and Recommendations Report” dated June 2012. Highlights of the report follow.
6.2 Highlights of “Evaluation of the 2007 University of Missouri Adsorbed Natural Gas Tank – Performance Report and Recommendations Report” The recorded data from NG vehicle operation was analyzed, and one of the tanks was cut in half to assess the condition of the tank and monoliths, Figure 48. Four monoliths were taken from the tank and tested for residual hydrocarbons to assess the effectiveness of the guard bed. In addition, the monoliths were outgassed and their adsorption capacity measured for
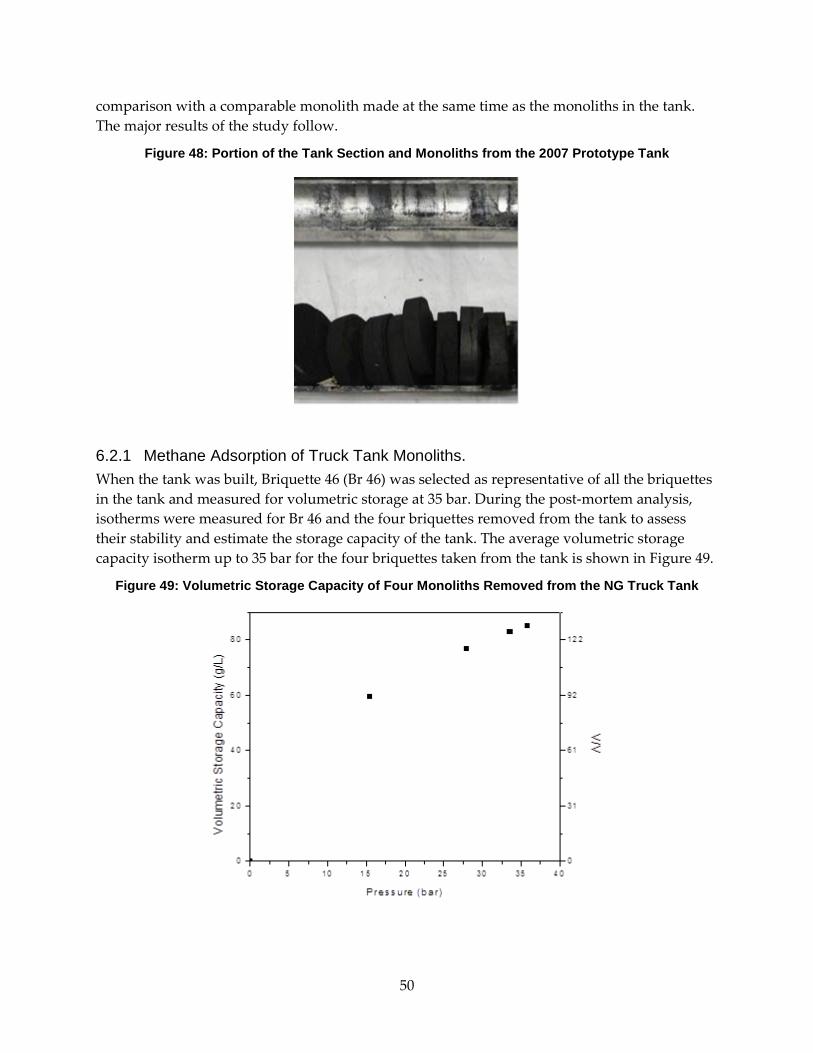
50
comparison with a comparable monolith made at the same time as the monoliths in the tank. The major results of the study follow.
Figure 48: Portion of the Tank Section and Monoliths from the 2007 Prototype Tank
6.2.1 Methane Adsorption of Truck Tank Monoliths. When the tank was built, Briquette 46 (Br 46) was selected as representative of all the briquettes in the tank and measured for volumetric storage at 35 bar. During the post-mortem analysis, isotherms were measured for Br 46 and the four briquettes removed from the tank to assess their stability and estimate the storage capacity of the tank. The average volumetric storage capacity isotherm up to 35 bar for the four briquettes taken from the tank is shown in Figure 49.
Figure 49: Volumetric Storage Capacity of Four Monoliths Removed from the NG Truck Tank
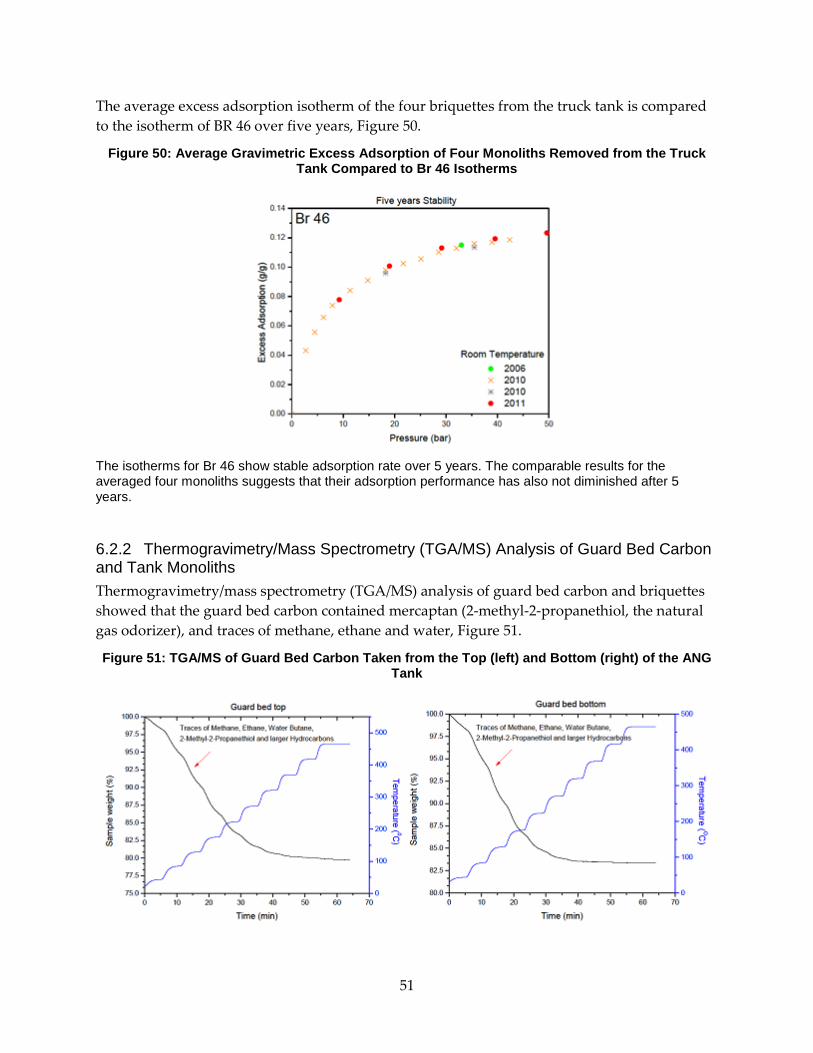
51
The average excess adsorption isotherm of the four briquettes from the truck tank is compared to the isotherm of BR 46 over five years, Figure 50.
Figure 50: Average Gravimetric Excess Adsorption of Four Monoliths Removed from the Truck Tank Compared to Br 46 Isotherms
The isotherms for Br 46 show stable adsorption rate over 5 years. The comparable results for the averaged four monoliths suggests that their adsorption performance has also not diminished after 5 years.
6.2.2 Thermogravimetry/Mass Spectrometry (TGA/MS) Analysis of Guard Bed Carbon and Tank Monoliths Thermogravimetry/mass spectrometry (TGA/MS) analysis of guard bed carbon and briquettes showed that the guard bed carbon contained mercaptan (2-methyl-2-propanethiol, the natural gas odorizer), and traces of methane, ethane and water, Figure 51.
Figure 51: TGA/MS of Guard Bed Carbon Taken from the Top (left) and Bottom (right) of the ANG Tank
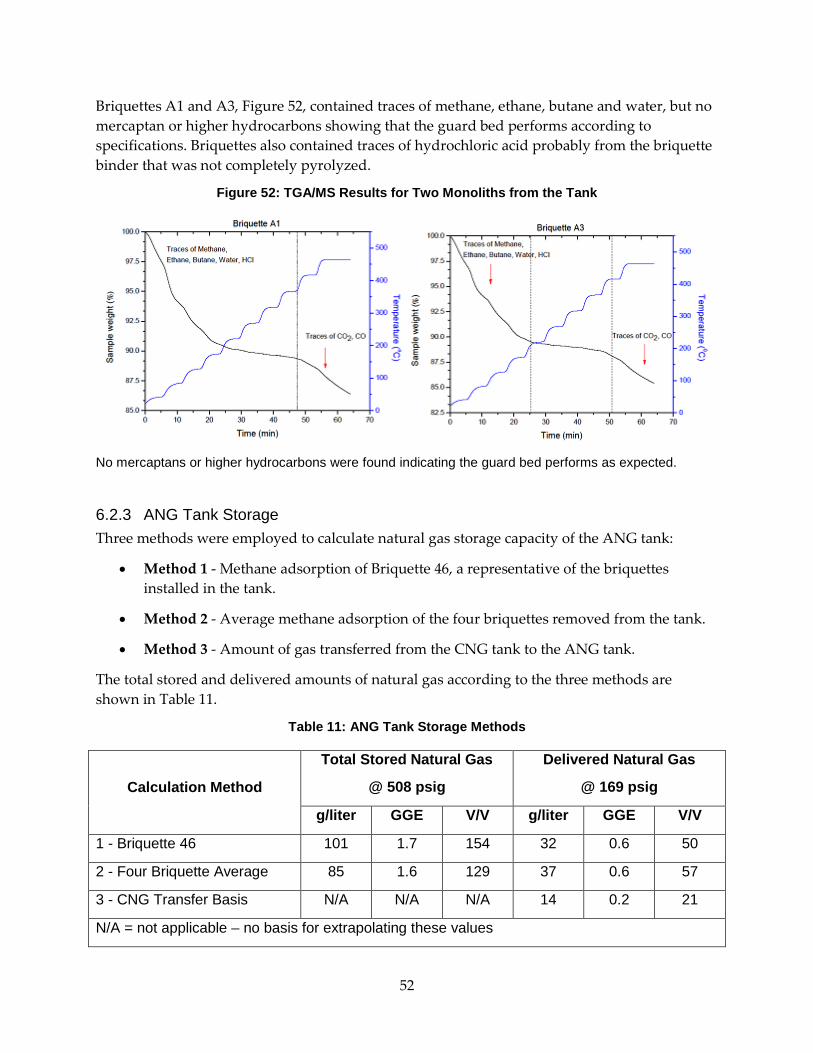
52
Briquettes A1 and A3, Figure 52, contained traces of methane, ethane, butane and water, but no mercaptan or higher hydrocarbons showing that the guard bed performs according to specifications. Briquettes also contained traces of hydrochloric acid probably from the briquette binder that was not completely pyrolyzed.
Figure 52: TGA/MS Results for Two Monoliths from the Tank
No mercaptans or higher hydrocarbons were found indicating the guard bed performs as expected.
6.2.3 ANG Tank Storage Three methods were employed to calculate natural gas storage capacity of the ANG tank:
• Method 1 - Methane adsorption of Briquette 46, a representative of the briquettes installed in the tank.
• Method 2 - Average methane adsorption of the four briquettes removed from the tank.
• Method 3 - Amount of gas transferred from the CNG tank to the ANG tank.
The total stored and delivered amounts of natural gas according to the three methods are shown in Table 11.
Table 11: ANG Tank Storage Methods
Calculation Method
Total Stored Natural Gas
@ 508 psig
Delivered Natural Gas
@ 169 psig
g/liter GGE V/V g/liter GGE V/V
1 - Briquette 46 101 1.7 154 32 0.6 50
2 - Four Briquette Average 85 1.6 129 37 0.6 57
3 - CNG Transfer Basis N/A N/A N/A 14 0.2 21
N/A = not applicable – no basis for extrapolating these values
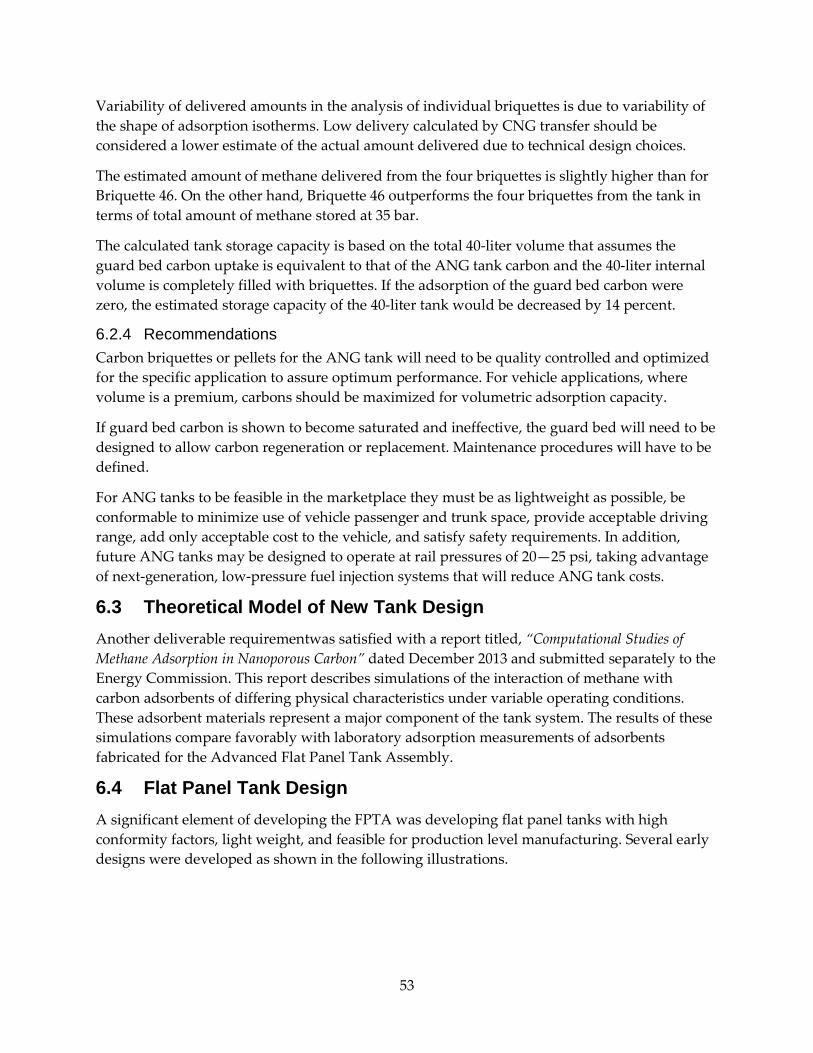
53
Variability of delivered amounts in the analysis of individual briquettes is due to variability of the shape of adsorption isotherms. Low delivery calculated by CNG transfer should be considered a lower estimate of the actual amount delivered due to technical design choices.
The estimated amount of methane delivered from the four briquettes is slightly higher than for Briquette 46. On the other hand, Briquette 46 outperforms the four briquettes from the tank in terms of total amount of methane stored at 35 bar.
The calculated tank storage capacity is based on the total 40-liter volume that assumes the guard bed carbon uptake is equivalent to that of the ANG tank carbon and the 40-liter internal volume is completely filled with briquettes. If the adsorption of the guard bed carbon were zero, the estimated storage capacity of the 40-liter tank would be decreased by 14 percent.
6.2.4 Recommendations Carbon briquettes or pellets for the ANG tank will need to be quality controlled and optimized for the specific application to assure optimum performance. For vehicle applications, where volume is a premium, carbons should be maximized for volumetric adsorption capacity.
If guard bed carbon is shown to become saturated and ineffective, the guard bed will need to be designed to allow carbon regeneration or replacement. Maintenance procedures will have to be defined.
For ANG tanks to be feasible in the marketplace they must be as lightweight as possible, be conformable to minimize use of vehicle passenger and trunk space, provide acceptable driving range, add only acceptable cost to the vehicle, and satisfy safety requirements. In addition, future ANG tanks may be designed to operate at rail pressures of 20—25 psi, taking advantage of next-generation, low-pressure fuel injection systems that will reduce ANG tank costs.
6.3 Theoretical Model of New Tank Design Another deliverable requirementwas satisfied with a report titled, “Computational Studies of Methane Adsorption in Nanoporous Carbon” dated December 2013 and submitted separately to the Energy Commission. This report describes simulations of the interaction of methane with carbon adsorbents of differing physical characteristics under variable operating conditions. These adsorbent materials represent a major component of the tank system. The results of these simulations compare favorably with laboratory adsorption measurements of adsorbents fabricated for the Advanced Flat Panel Tank Assembly.
6.4 Flat Panel Tank Design A significant element of developing the FPTA was developing flat panel tanks with high conformity factors, light weight, and feasible for production level manufacturing. Several early designs were developed as shown in the following illustrations.
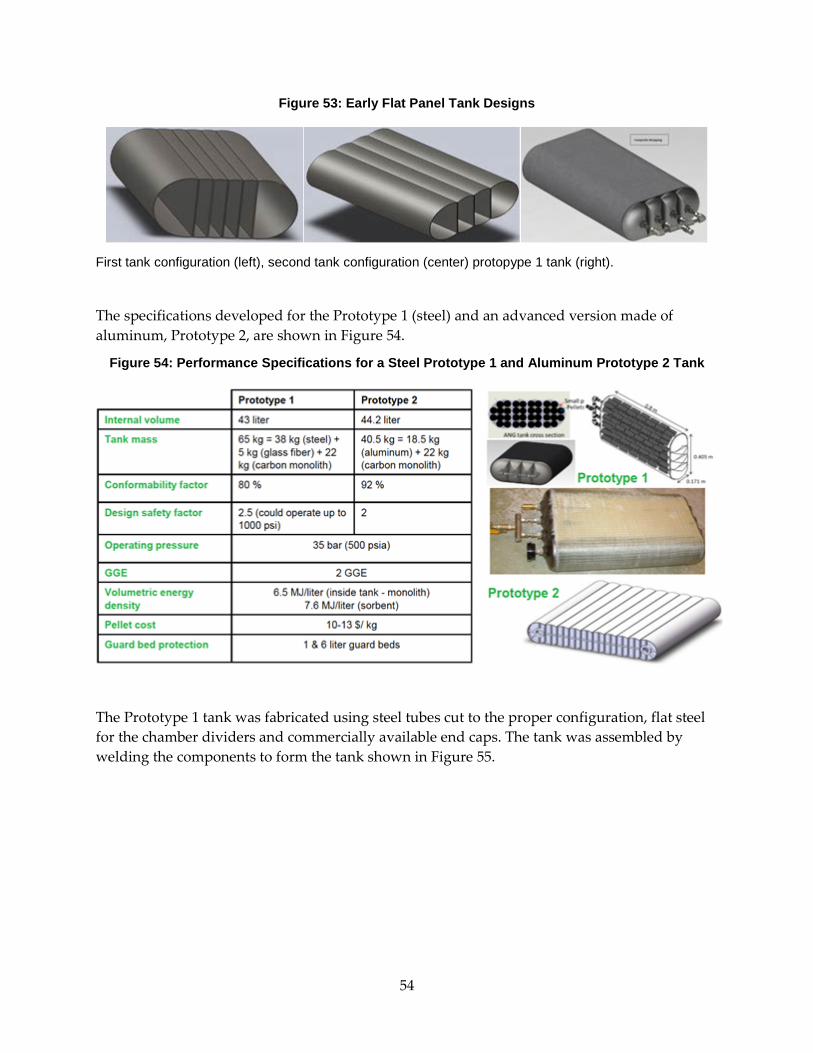
54
Figure 53: Early Flat Panel Tank Designs
First tank configuration (left), second tank configuration (center) protopype 1 tank (right).
The specifications developed for the Prototype 1 (steel) and an advanced version made of aluminum, Prototype 2, are shown in Figure 54.
Figure 54: Performance Specifications for a Steel Prototype 1 and Aluminum Prototype 2 Tank
The Prototype 1 tank was fabricated using steel tubes cut to the proper configuration, flat steel for the chamber dividers and commercially available end caps. The tank was assembled by welding the components to form the tank shown in Figure 55.
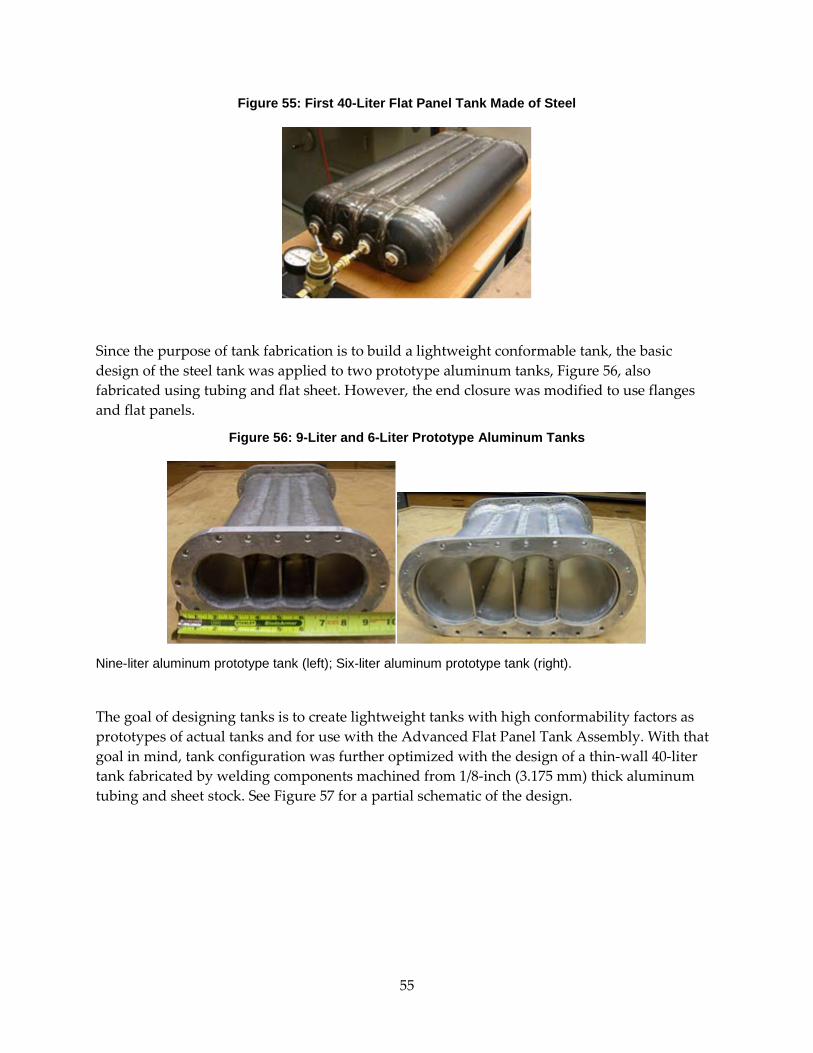
55
Figure 55: First 40-Liter Flat Panel Tank Made of Steel
Since the purpose of tank fabrication is to build a lightweight conformable tank, the basic design of the steel tank was applied to two prototype aluminum tanks, Figure 56, also fabricated using tubing and flat sheet. However, the end closure was modified to use flanges and flat panels.
Figure 56: 9-Liter and 6-Liter Prototype Aluminum Tanks
Nine-liter aluminum prototype tank (left); Six-liter aluminum prototype tank (right).
The goal of designing tanks is to create lightweight tanks with high conformability factors as prototypes of actual tanks and for use with the Advanced Flat Panel Tank Assembly. With that goal in mind, tank configuration was further optimized with the design of a thin-wall 40-liter tank fabricated by welding components machined from 1/8-inch (3.175 mm) thick aluminum tubing and sheet stock. See Figure 57 for a partial schematic of the design.
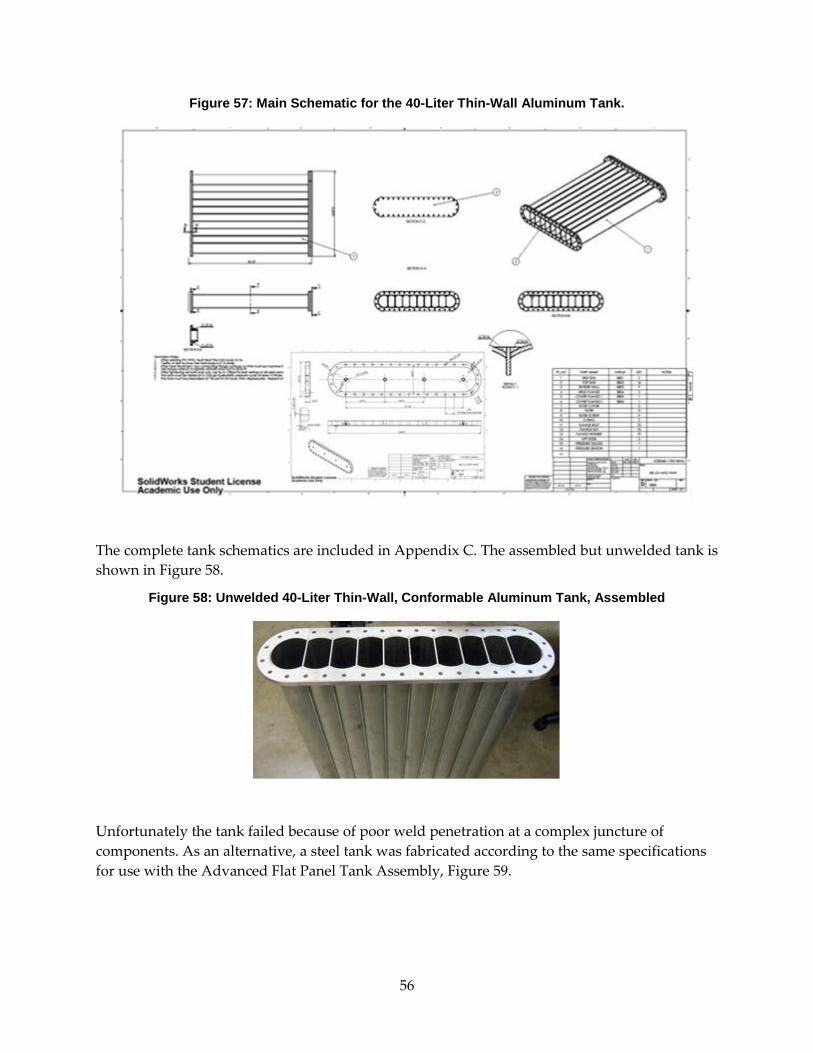
56
Figure 57: Main Schematic for the 40-Liter Thin-Wall Aluminum Tank.
The complete tank schematics are included in Appendix C. The assembled but unwelded tank is shown in Figure 58.
Figure 58: Unwelded 40-Liter Thin-Wall, Conformable Aluminum Tank, Assembled
Unfortunately the tank failed because of poor weld penetration at a complex juncture of components. As an alternative, a steel tank was fabricated according to the same specifications for use with the Advanced Flat Panel Tank Assembly, Figure 59.
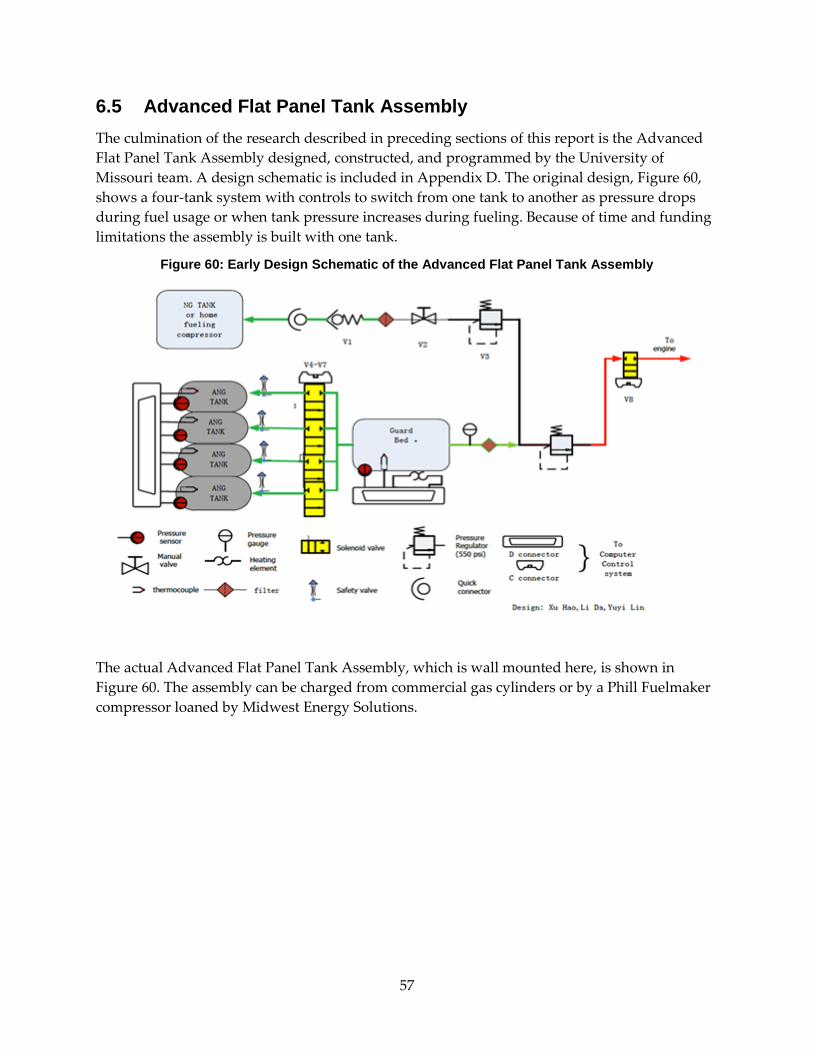
57
6.5 Advanced Flat Panel Tank Assembly The culmination of the research described in preceding sections of this report is the Advanced Flat Panel Tank Assembly designed, constructed, and programmed by the University of Missouri team. A design schematic is included in Appendix D. The original design, Figure 60, shows a four-tank system with controls to switch from one tank to another as pressure drops during fuel usage or when tank pressure increases during fueling. Because of time and funding limitations the assembly is built with one tank.
Figure 60: Early Design Schematic of the Advanced Flat Panel Tank Assembly
The actual Advanced Flat Panel Tank Assembly, which is wall mounted here, is shown in Figure 60. The assembly can be charged from commercial gas cylinders or by a Phill Fuelmaker compressor loaned by Midwest Energy Solutions.
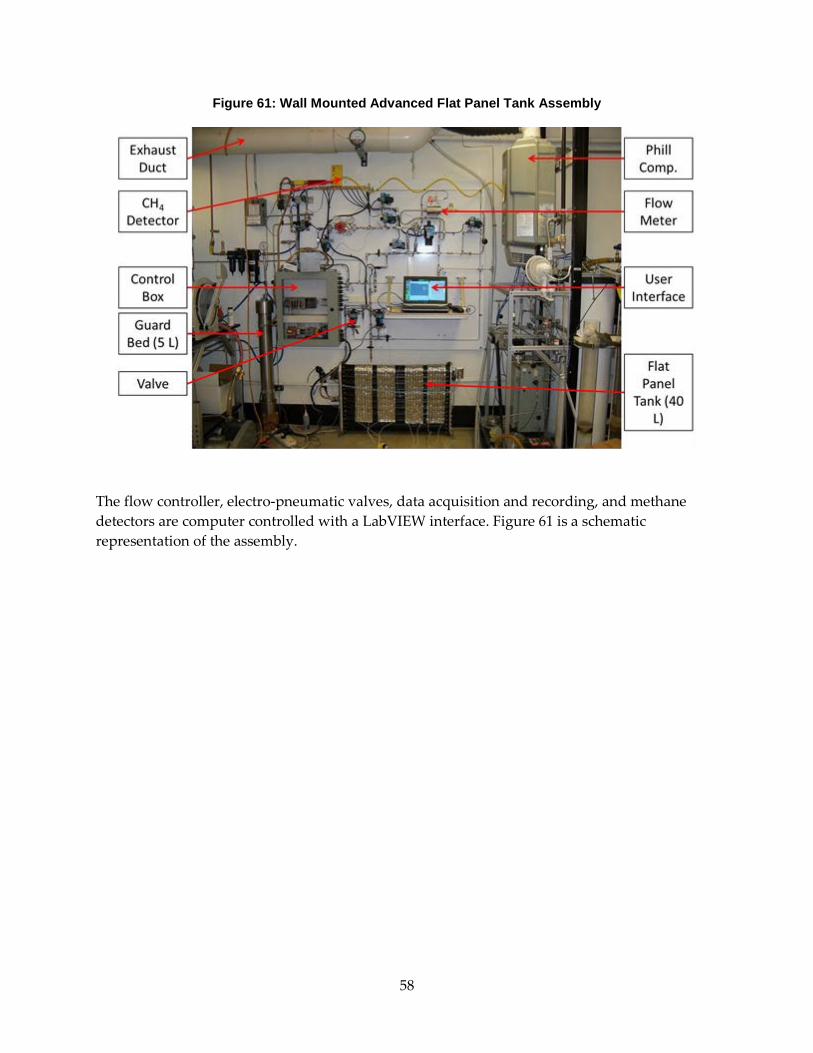
58
Figure 61: Wall Mounted Advanced Flat Panel Tank Assembly
The flow controller, electro-pneumatic valves, data acquisition and recording, and methane detectors are computer controlled with a LabVIEW interface. Figure 61 is a schematic representation of the assembly.

59
Figure 62: Schematic Representation of the Advanced Flat Panel Tank Assembly
6.5.1 Operational Procedures Initial procedures for operating the Advanced Flat Panel Tank Assembly involve three procedures:
• Preparation of the flat panel ANG tank. The empty tank first must be completely evacuated and weighed. The monoliths are then loaded into the tank which is sealed, evacuated again and weighed. These two measurements give an accurate mass value for the monoliths.
• Charging of the buffer storage tanks if tests are to be run with natural gas.
• Purging the assembly fuel lines before the tank is attached.
The gas supplied to the FPTA comes from either the house natural gas line via the Phill natural gas compressor or industrial grade methane bottles (99 percent CHR4R) The configuration of the system allows the tank to be fast or slow filled while flow rates and volumes and tank temperature and pressure are recorded. Using these values, the volumetric capacity of the monoliths and the tank can be calculated. Gas can also be “used” at variable rates to show how tank temperature and pressure are affected, and how much gas can be delivered at different tank temperatures. Since the tank is initially weighed with no monoliths and when filled with monoliths without natural gas, the tank can be fueled and weighed to determine an accurate mass of natural gas in the tank to validate the calculations made by the data analysis system.
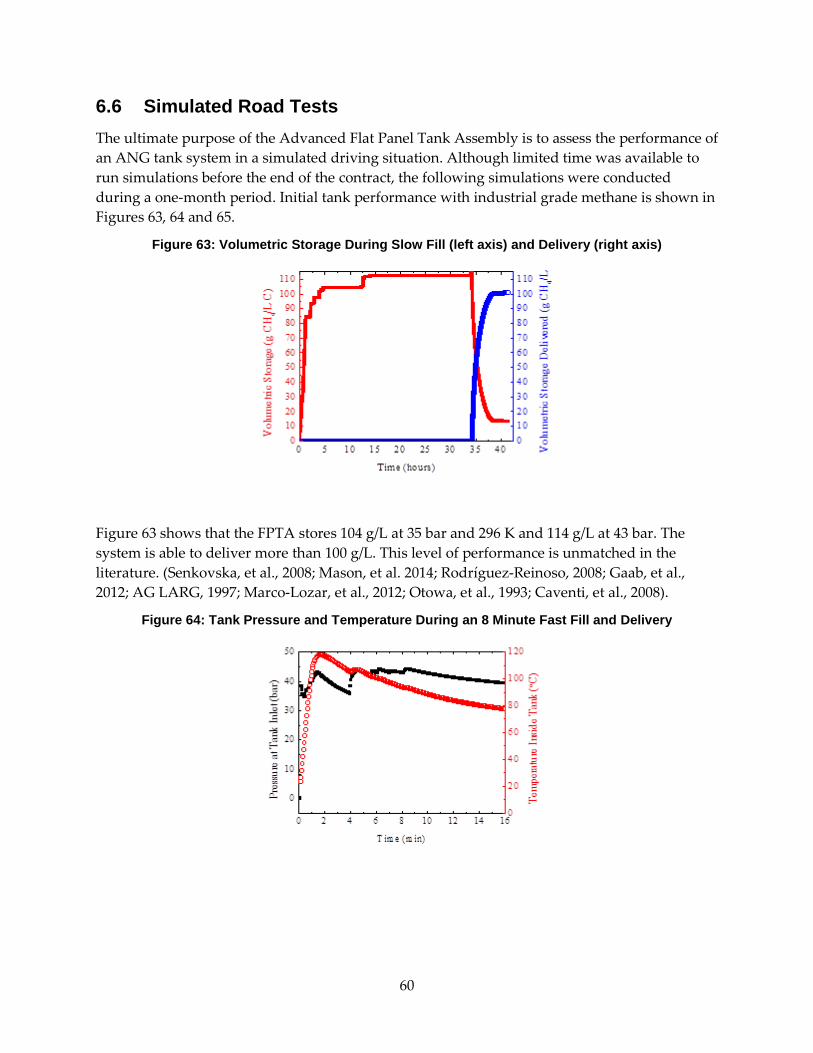
60
6.6 Simulated Road Tests The ultimate purpose of the Advanced Flat Panel Tank Assembly is to assess the performance of an ANG tank system in a simulated driving situation. Although limited time was available to run simulations before the end of the contract, the following simulations were conducted during a one-month period. Initial tank performance with industrial grade methane is shown in Figures 63, 64 and 65.
Figure 63: Volumetric Storage During Slow Fill (left axis) and Delivery (right axis)
Figure 63 shows that the FPTA stores 104 g/L at 35 bar and 296 K and 114 g/L at 43 bar. The system is able to deliver more than 100 g/L. This level of performance is unmatched in the literature. (Senkovska, et al., 2008; Mason, et al. 2014; Rodríguez-Reinoso, 2008; Gaab, et al., 2012; AG LARG, 1997; Marco-Lozar, et al., 2012; Otowa, et al., 1993; Caventi, et al., 2008).
Figure 64: Tank Pressure and Temperature During an 8 Minute Fast Fill and Delivery
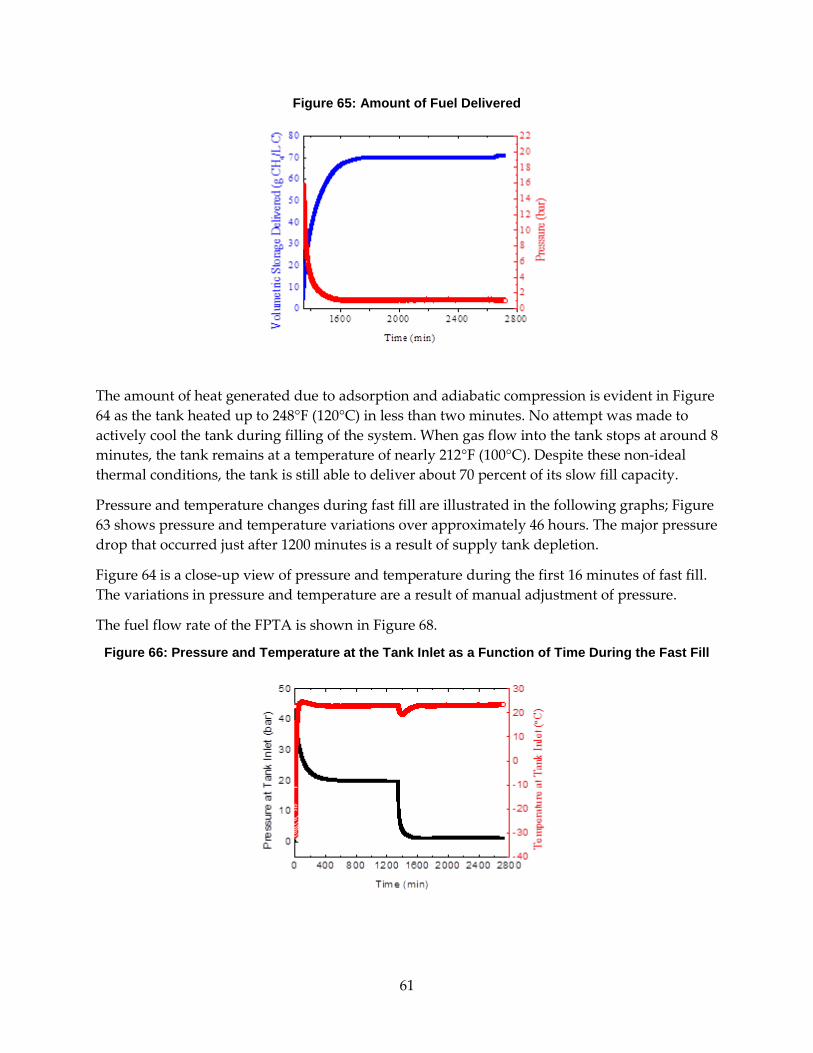
61
Figure 65: Amount of Fuel Delivered
The amount of heat generated due to adsorption and adiabatic compression is evident in Figure 64 as the tank heated up to 248°F (120°C) in less than two minutes. No attempt was made to actively cool the tank during filling of the system. When gas flow into the tank stops at around 8 minutes, the tank remains at a temperature of nearly 212°F (100°C). Despite these non-ideal thermal conditions, the tank is still able to deliver about 70 percent of its slow fill capacity.
Pressure and temperature changes during fast fill are illustrated in the following graphs; Figure 63 shows pressure and temperature variations over approximately 46 hours. The major pressure drop that occurred just after 1200 minutes is a result of supply tank depletion.
Figure 64 is a close-up view of pressure and temperature during the first 16 minutes of fast fill. The variations in pressure and temperature are a result of manual adjustment of pressure.
The fuel flow rate of the FPTA is shown in Figure 68.
Figure 66: Pressure and Temperature at the Tank Inlet as a Function of Time During the Fast Fill
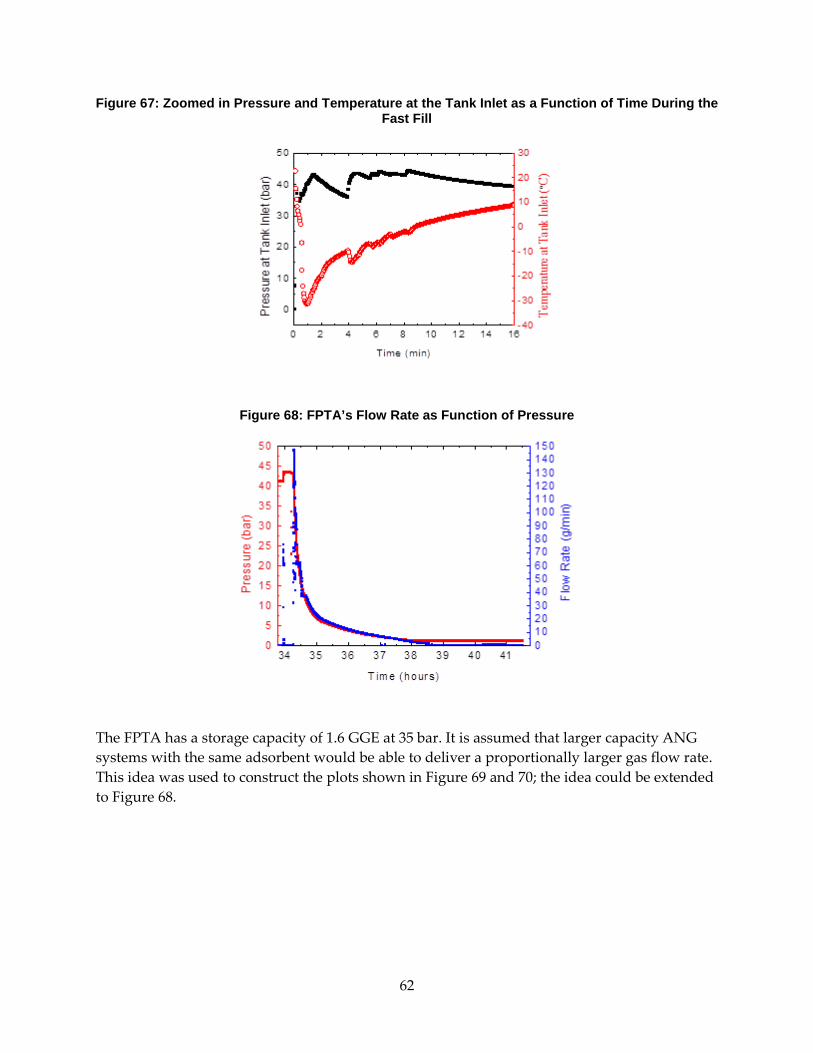
62
Figure 67: Zoomed in Pressure and Temperature at the Tank Inlet as a Function of Time During the Fast Fill
Figure 68: FPTA’s Flow Rate as Function of Pressure
The FPTA has a storage capacity of 1.6 GGE at 35 bar. It is assumed that larger capacity ANG systems with the same adsorbent would be able to deliver a proportionally larger gas flow rate. This idea was used to construct the plots shown in Figure 69 and 70; the idea could be extended to Figure 68.
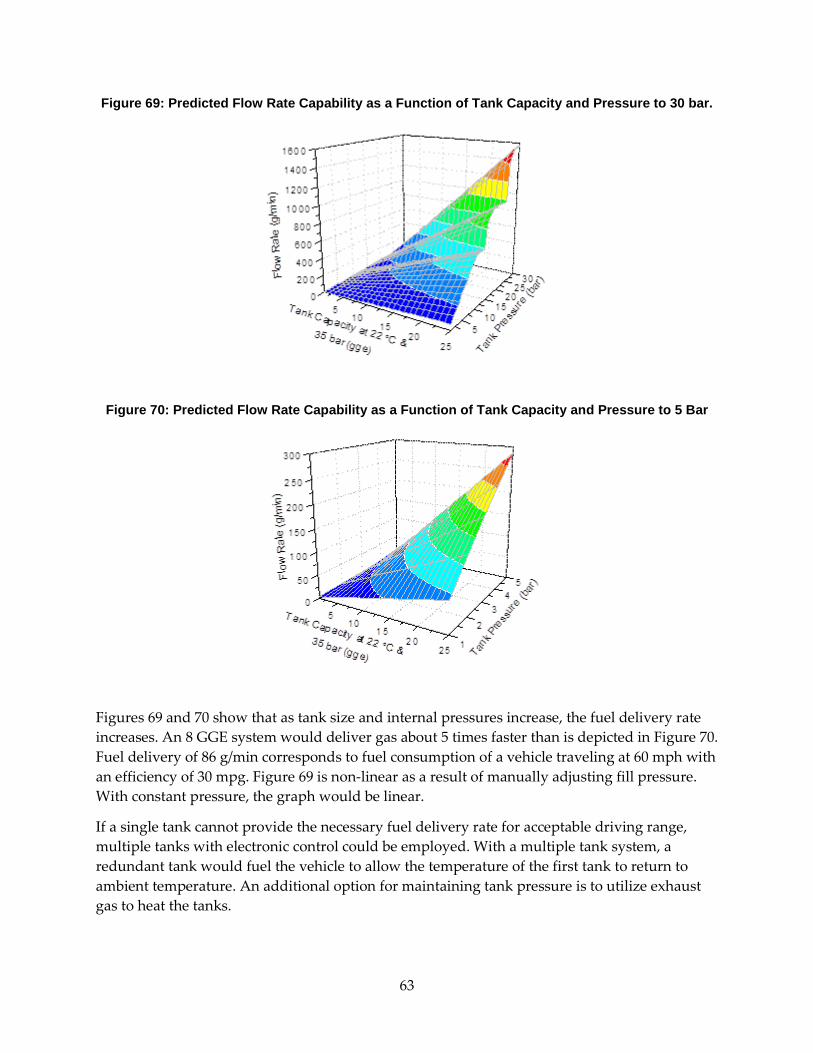
63
Figure 69: Predicted Flow Rate Capability as a Function of Tank Capacity and Pressure to 30 bar.
Figure 70: Predicted Flow Rate Capability as a Function of Tank Capacity and Pressure to 5 Bar
Figures 69 and 70 show that as tank size and internal pressures increase, the fuel delivery rate increases. An 8 GGE system would deliver gas about 5 times faster than is depicted in Figure 70. Fuel delivery of 86 g/min corresponds to fuel consumption of a vehicle traveling at 60 mph with an efficiency of 30 mpg. Figure 69 is non-linear as a result of manually adjusting fill pressure. With constant pressure, the graph would be linear.
If a single tank cannot provide the necessary fuel delivery rate for acceptable driving range, multiple tanks with electronic control could be employed. With a multiple tank system, a redundant tank would fuel the vehicle to allow the temperature of the first tank to return to ambient temperature. An additional option for maintaining tank pressure is to utilize exhaust gas to heat the tanks.
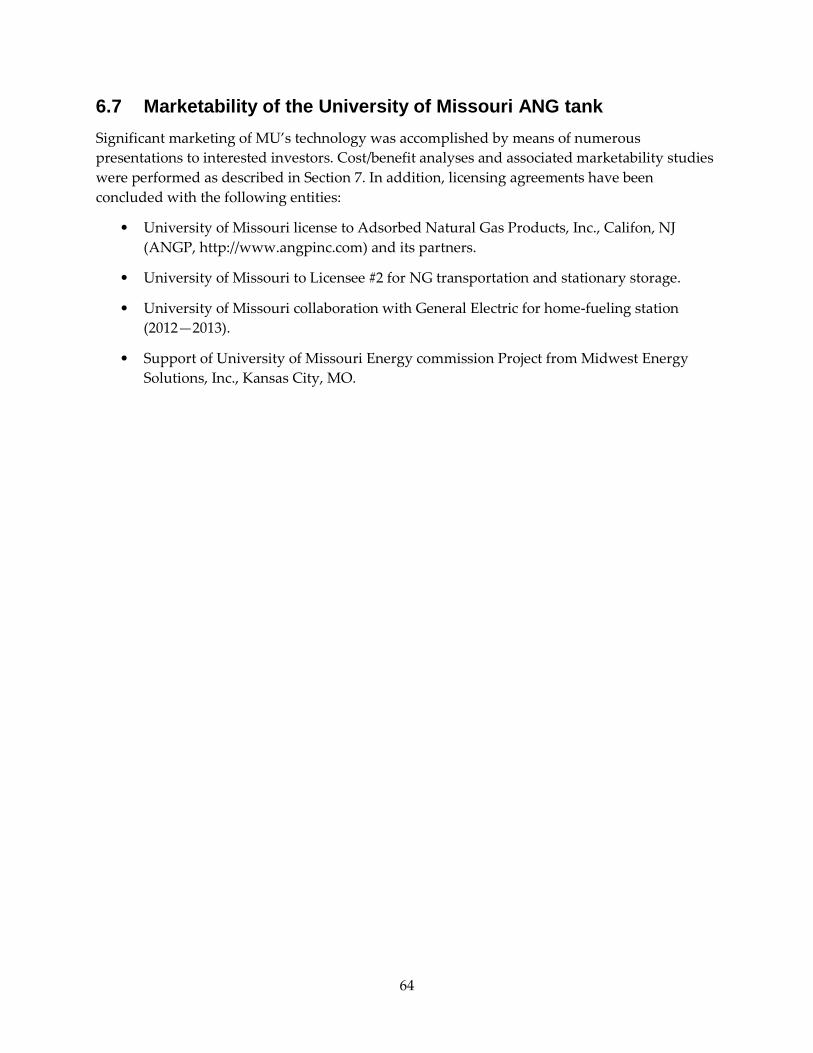
64
6.7 Marketability of the University of Missouri ANG tank Significant marketing of MU’s technology was accomplished by means of numerous presentations to interested investors. Cost/benefit analyses and associated marketability studies were performed as described in Section 7. In addition, licensing agreements have been concluded with the following entities:
• University of Missouri license to Adsorbed Natural Gas Products, Inc., Califon, NJ (ANGP, http://www.angpinc.com) and its partners.
• University of Missouri to Licensee #2 for NG transportation and stationary storage.
• University of Missouri collaboration with General Electric for home-fueling station (2012—2013).
• Support of University of Missouri Energy commission Project from Midwest Energy Solutions, Inc., Kansas City, MO.
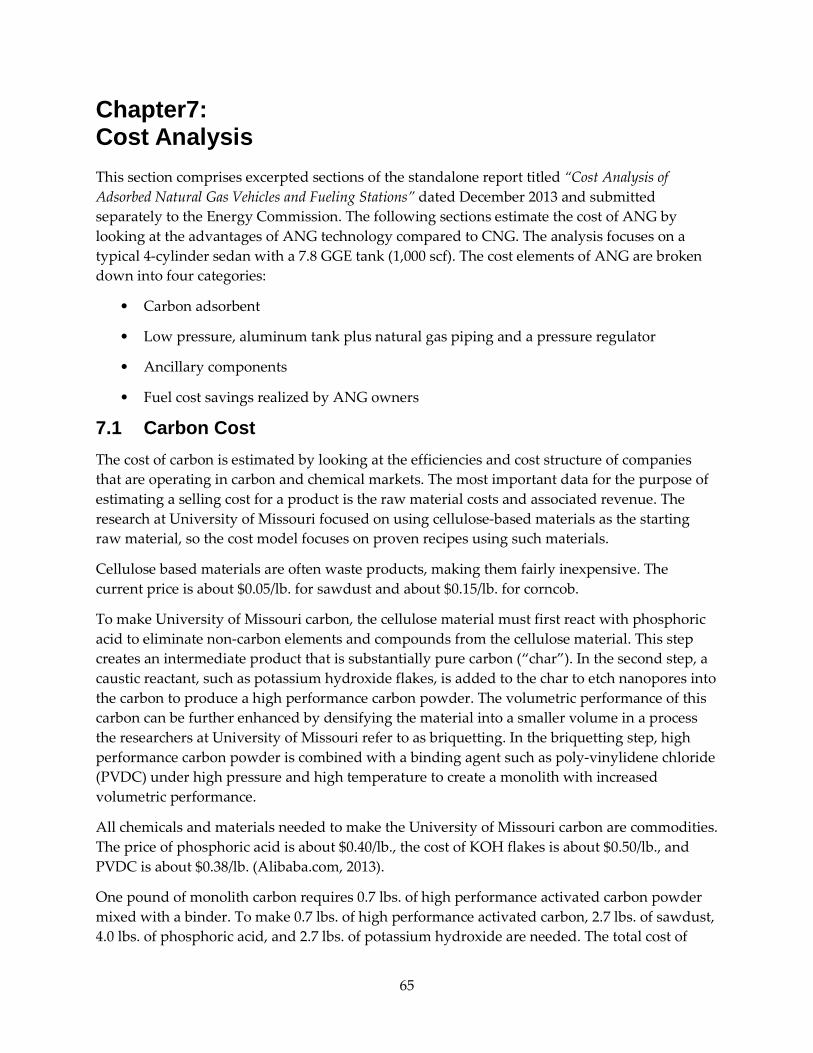
65
Chapter7: Cost Analysis This section comprises excerpted sections of the standalone report titled “Cost Analysis of Adsorbed Natural Gas Vehicles and Fueling Stations” dated December 2013 and submitted separately to the Energy Commission. The following sections estimate the cost of ANG by looking at the advantages of ANG technology compared to CNG. The analysis focuses on a typical 4-cylinder sedan with a 7.8 GGE tank (1,000 scf). The cost elements of ANG are broken down into four categories:
• Carbon adsorbent
• Low pressure, aluminum tank plus natural gas piping and a pressure regulator
• Ancillary components
• Fuel cost savings realized by ANG owners
7.1 Carbon Cost The cost of carbon is estimated by looking at the efficiencies and cost structure of companies that are operating in carbon and chemical markets. The most important data for the purpose of estimating a selling cost for a product is the raw material costs and associated revenue. The research at University of Missouri focused on using cellulose-based materials as the starting raw material, so the cost model focuses on proven recipes using such materials.
Cellulose based materials are often waste products, making them fairly inexpensive. The current price is about $0.05/lb. for sawdust and about $0.15/lb. for corncob.
To make University of Missouri carbon, the cellulose material must first react with phosphoric acid to eliminate non-carbon elements and compounds from the cellulose material. This step creates an intermediate product that is substantially pure carbon (“char”). In the second step, a caustic reactant, such as potassium hydroxide flakes, is added to the char to etch nanopores into the carbon to produce a high performance carbon powder. The volumetric performance of this carbon can be further enhanced by densifying the material into a smaller volume in a process the researchers at University of Missouri refer to as briquetting. In the briquetting step, high performance carbon powder is combined with a binding agent such as poly-vinylidene chloride (PVDC) under high pressure and high temperature to create a monolith with increased volumetric performance.
All chemicals and materials needed to make the University of Missouri carbon are commodities. The price of phosphoric acid is about $0.40/lb., the cost of KOH flakes is about $0.50/lb., and PVDC is about $0.38/lb. (Alibaba.com, 2013).
One pound of monolith carbon requires 0.7 lbs. of high performance activated carbon powder mixed with a binder. To make 0.7 lbs. of high performance activated carbon, 2.7 lbs. of sawdust, 4.0 lbs. of phosphoric acid, and 2.7 lbs. of potassium hydroxide are needed. The total cost of
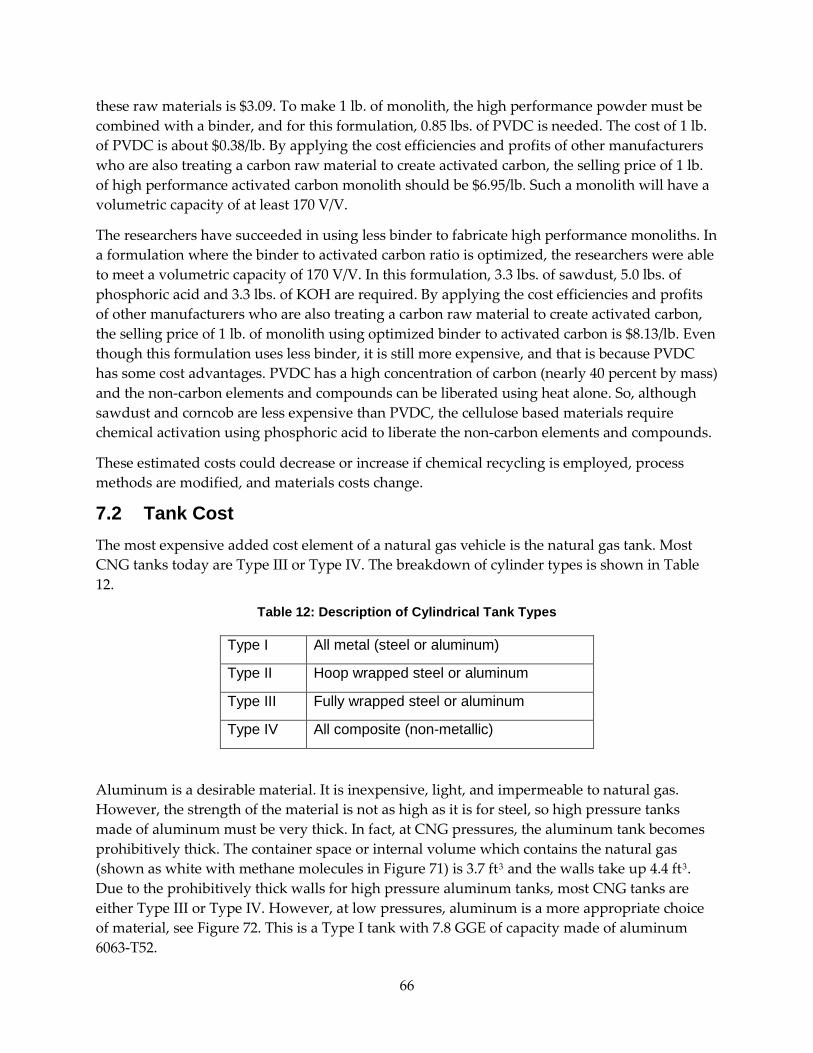
66
these raw materials is $3.09. To make 1 lb. of monolith, the high performance powder must be combined with a binder, and for this formulation, 0.85 lbs. of PVDC is needed. The cost of 1 lb. of PVDC is about $0.38/lb. By applying the cost efficiencies and profits of other manufacturers who are also treating a carbon raw material to create activated carbon, the selling price of 1 lb. of high performance activated carbon monolith should be $6.95/lb. Such a monolith will have a volumetric capacity of at least 170 V/V.
The researchers have succeeded in using less binder to fabricate high performance monoliths. In a formulation where the binder to activated carbon ratio is optimized, the researchers were able to meet a volumetric capacity of 170 V/V. In this formulation, 3.3 lbs. of sawdust, 5.0 lbs. of phosphoric acid and 3.3 lbs. of KOH are required. By applying the cost efficiencies and profits of other manufacturers who are also treating a carbon raw material to create activated carbon, the selling price of 1 lb. of monolith using optimized binder to activated carbon is $8.13/lb. Even though this formulation uses less binder, it is still more expensive, and that is because PVDC has some cost advantages. PVDC has a high concentration of carbon (nearly 40 percent by mass) and the non-carbon elements and compounds can be liberated using heat alone. So, although sawdust and corncob are less expensive than PVDC, the cellulose based materials require chemical activation using phosphoric acid to liberate the non-carbon elements and compounds.
These estimated costs could decrease or increase if chemical recycling is employed, process methods are modified, and materials costs change.
7.2 Tank Cost The most expensive added cost element of a natural gas vehicle is the natural gas tank. Most CNG tanks today are Type III or Type IV. The breakdown of cylinder types is shown in Table 12.
Table 12: Description of Cylindrical Tank Types
Type I All metal (steel or aluminum)
Type II Hoop wrapped steel or aluminum
Type III Fully wrapped steel or aluminum
Type IV All composite (non-metallic)
Aluminum is a desirable material. It is inexpensive, light, and impermeable to natural gas. However, the strength of the material is not as high as it is for steel, so high pressure tanks made of aluminum must be very thick. In fact, at CNG pressures, the aluminum tank becomes prohibitively thick. The container space or internal volume which contains the natural gas (shown as white with methane molecules in Figure 71) is 3.7 ftP
3P and the walls take up 4.4 ftP
3P.
Due to the prohibitively thick walls for high pressure aluminum tanks, most CNG tanks are either Type III or Type IV. However, at low pressures, aluminum is a more appropriate choice of material, see Figure 72. This is a Type I tank with 7.8 GGE of capacity made of aluminum 6063-T52.
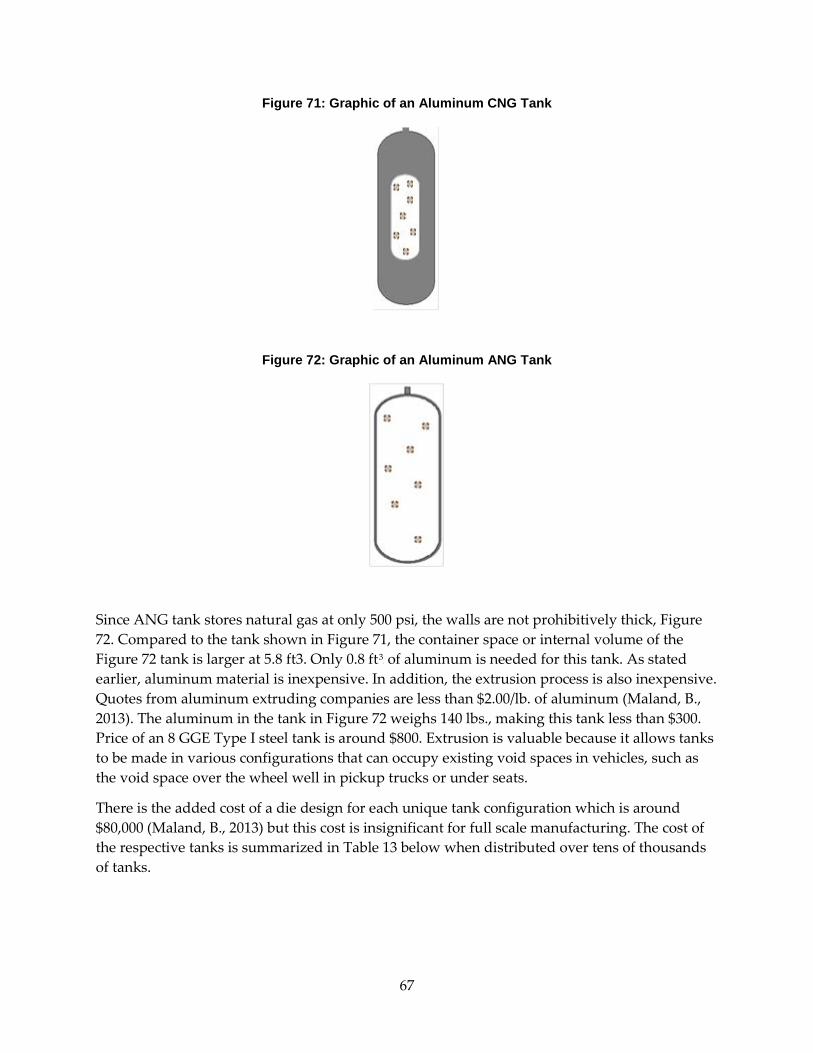
67
Figure 71: Graphic of an Aluminum CNG Tank
Figure 72: Graphic of an Aluminum ANG Tank
Since ANG tank stores natural gas at only 500 psi, the walls are not prohibitively thick, Figure 72. Compared to the tank shown in Figure 71, the container space or internal volume of the Figure 72 tank is larger at 5.8 ft3. Only 0.8 ftP
3P of aluminum is needed for this tank. As stated
earlier, aluminum material is inexpensive. In addition, the extrusion process is also inexpensive. Quotes from aluminum extruding companies are less than $2.00/lb. of aluminum (Maland, B., 2013). The aluminum in the tank in Figure 72 weighs 140 lbs., making this tank less than $300. Price of an 8 GGE Type I steel tank is around $800. Extrusion is valuable because it allows tanks to be made in various configurations that can occupy existing void spaces in vehicles, such as the void space over the wheel well in pickup trucks or under seats.
There is the added cost of a die design for each unique tank configuration which is around $80,000 (Maland, B., 2013) but this cost is insignificant for full scale manufacturing. The cost of the respective tanks is summarized in Table 13 below when distributed over tens of thousands of tanks.
68
Table 13: Comparison of the Cost of Production Volumes of ANG and CNG Tanks
Tank Description Tank Cost
New 8 GGE aluminum extruded ANG tank at 500 psi <$300
8 GGE Type I steel CNG tank at 3,600 psi $800—$1,000
8 GGE Type II aluminum lined, composite wrapped CNG tank at 3,600 psi $1,300—$1,500
8 GGE Type III aluminum lined, composite wrapped CNG tank at 3,600 psi $2,500—$3,000
8 GGE Type IV plastic lined, composite wrapped CNG tank at 3,600 psi >$3,000
7.3 Ancillary Components In addition to the tank, CNG vehicles require piping and other features to deliver natural gas to the engine. Although there are many variations, natural gas vehicles are typically outfitted with a pressure regulator, a mixer or sequential injectors, natural gas tubing, water heater tubing, a filling nozzle, a pressure sensor, a pressure gauge, and electronic controls and software to manage natural gas delivery. Figure 73 shows these components in a typical configuration.
Figure 73: Components of a CNG Conversion Kit

69
Except for the software and CPU, all of these components are typically sold in conversion kits. Depending on how the fuel is delivered to the cylinders, the price for these kits for a 4 cylinder engine can range from $500 — $1850. Additional required components may add more than $1,000. These cost estimates are based on 2013 market analyses and are expected to decrease in the future as the market for natural gas vehicles grows, from both gasoline engine conversion and OEM manufactured vehicles.
ANG conversion kits would share many components with CNG kits. Components shared by both ANG vehicles and CNG vehicles will be less expensive when applied to an ANG vehicle because the pressure rating does not need to be as high. Figure 74 shows the components of an ANG vehicle, which highlights the additional components: a carbon filter, a guard bed, and a compressor. So, although the cost of the ANG tank is significantly less and the cost of the ANG kit will also be less due to the lower pressure rating of the components, there are added components. The onboard compressor may be an expensive addition, but it is not absolutely necessary. Advocates of an on-board compressor point out that a significant amount of natural gas remains in the storage tank at the rail pressure of the vehicle.
Figure 74: Components of an ANG Conversion Kit
The compilation of all of the cost elements is summarized in Table 14 below.
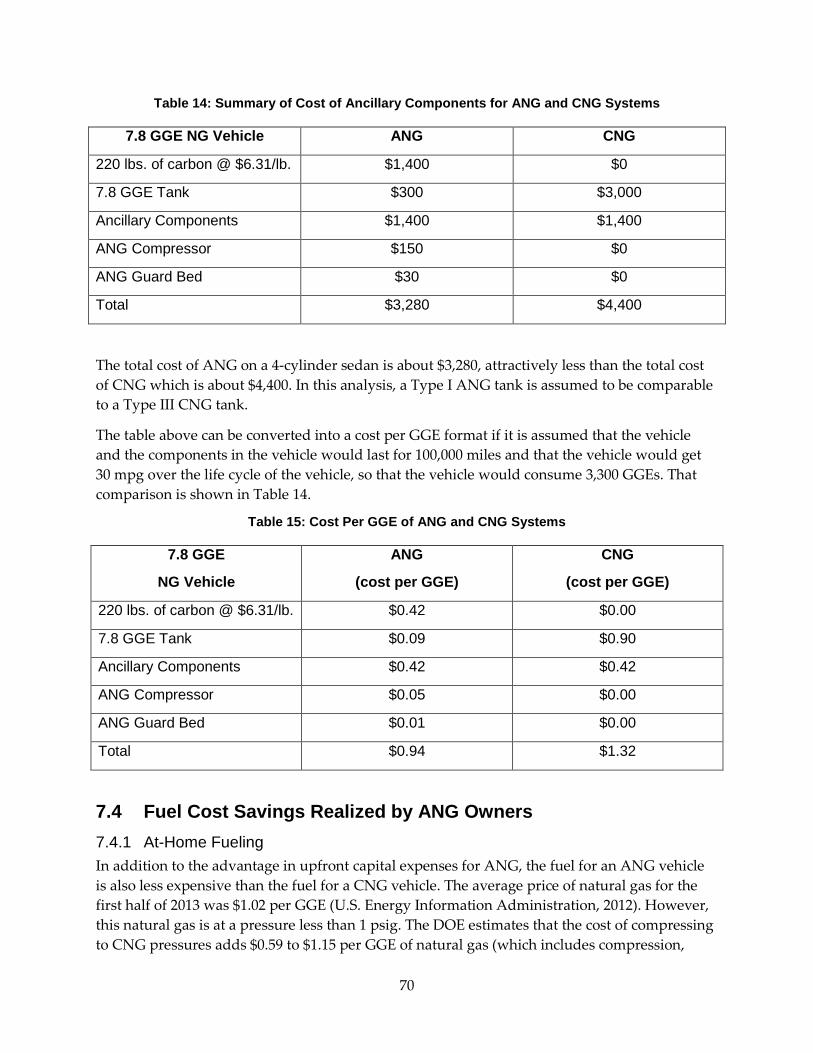
70
Table 14: Summary of Cost of Ancillary Components for ANG and CNG Systems
7.8 GGE NG Vehicle ANG CNG
220 lbs. of carbon @ $6.31/lb. $1,400 $0
7.8 GGE Tank $300 $3,000
Ancillary Components $1,400 $1,400
ANG Compressor $150 $0
ANG Guard Bed $30 $0
Total $3,280 $4,400
The total cost of ANG on a 4-cylinder sedan is about $3,280, attractively less than the total cost of CNG which is about $4,400. In this analysis, a Type I ANG tank is assumed to be comparable to a Type III CNG tank.
The table above can be converted into a cost per GGE format if it is assumed that the vehicle and the components in the vehicle would last for 100,000 miles and that the vehicle would get 30 mpg over the life cycle of the vehicle, so that the vehicle would consume 3,300 GGEs. That comparison is shown in Table 14.
Table 15: Cost Per GGE of ANG and CNG Systems
7.8 GGE
NG Vehicle
ANG
(cost per GGE)
CNG
(cost per GGE)
220 lbs. of carbon @ $6.31/lb. $0.42 $0.00
7.8 GGE Tank $0.09 $0.90
Ancillary Components $0.42 $0.42
ANG Compressor $0.05 $0.00
ANG Guard Bed $0.01 $0.00
Total $0.94 $1.32
7.4 Fuel Cost Savings Realized by ANG Owners 7.4.1 At-Home Fueling In addition to the advantage in upfront capital expenses for ANG, the fuel for an ANG vehicle is also less expensive than the fuel for a CNG vehicle. The average price of natural gas for the first half of 2013 was $1.02 per GGE (U.S. Energy Information Administration, 2012). However, this natural gas is at a pressure less than 1 psig. The DOE estimates that the cost of compressing to CNG pressures adds $0.59 to $1.15 per GGE of natural gas (which includes compression,
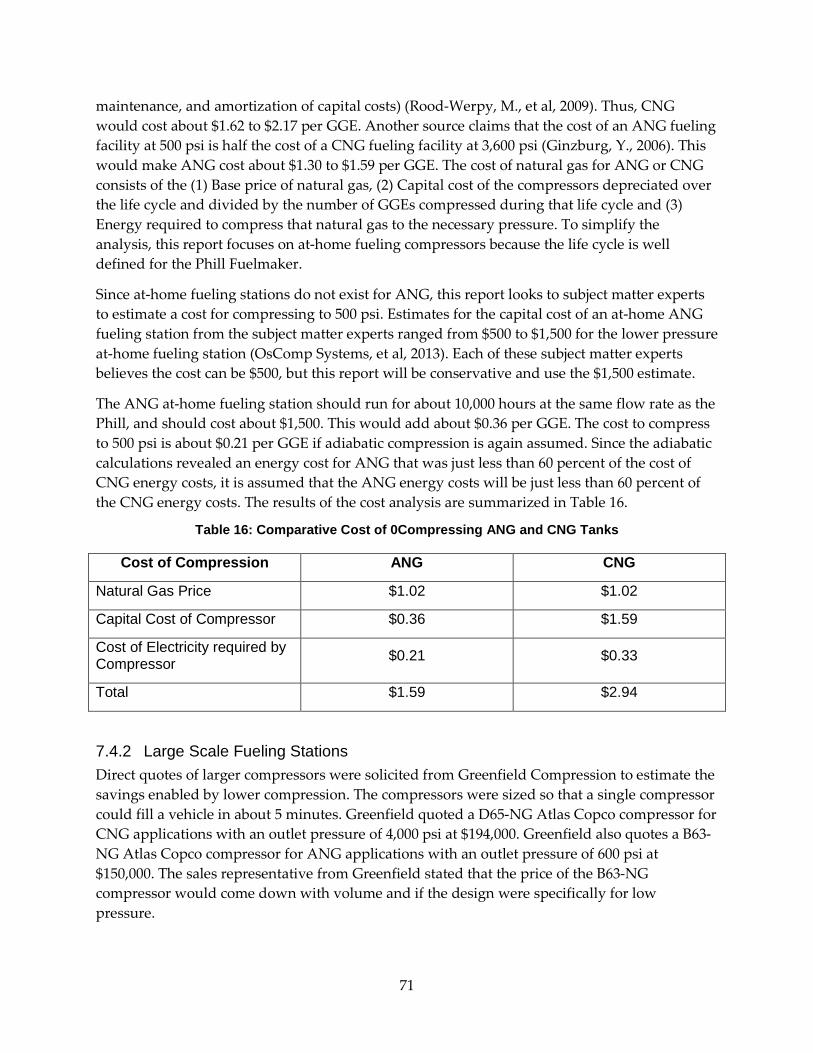
71
maintenance, and amortization of capital costs) (Rood-Werpy, M., et al, 2009). Thus, CNG would cost about $1.62 to $2.17 per GGE. Another source claims that the cost of an ANG fueling facility at 500 psi is half the cost of a CNG fueling facility at 3,600 psi (Ginzburg, Y., 2006). This would make ANG cost about $1.30 to $1.59 per GGE. The cost of natural gas for ANG or CNG consists of the (1) Base price of natural gas, (2) Capital cost of the compressors depreciated over the life cycle and divided by the number of GGEs compressed during that life cycle and (3) Energy required to compress that natural gas to the necessary pressure. To simplify the analysis, this report focuses on at-home fueling compressors because the life cycle is well defined for the Phill Fuelmaker.
Since at-home fueling stations do not exist for ANG, this report looks to subject matter experts to estimate a cost for compressing to 500 psi. Estimates for the capital cost of an at-home ANG fueling station from the subject matter experts ranged from $500 to $1,500 for the lower pressure at-home fueling station (OsComp Systems, et al, 2013). Each of these subject matter experts believes the cost can be $500, but this report will be conservative and use the $1,500 estimate.
The ANG at-home fueling station should run for about 10,000 hours at the same flow rate as the Phill, and should cost about $1,500. This would add about $0.36 per GGE. The cost to compress to 500 psi is about $0.21 per GGE if adiabatic compression is again assumed. Since the adiabatic calculations revealed an energy cost for ANG that was just less than 60 percent of the cost of CNG energy costs, it is assumed that the ANG energy costs will be just less than 60 percent of the CNG energy costs. The results of the cost analysis are summarized in Table 16.
Table 16: Comparative Cost of 0Compressing ANG and CNG Tanks
Cost of Compression ANG CNG
Natural Gas Price $1.02 $1.02
Capital Cost of Compressor $0.36 $1.59
Cost of Electricity required by Compressor $0.21 $0.33
Total $1.59 $2.94
7.4.2 Large Scale Fueling Stations Direct quotes of larger compressors were solicited from Greenfield Compression to estimate the savings enabled by lower compression. The compressors were sized so that a single compressor could fill a vehicle in about 5 minutes. Greenfield quoted a D65-NG Atlas Copco compressor for CNG applications with an outlet pressure of 4,000 psi at $194,000. Greenfield also quotes a B63-NG Atlas Copco compressor for ANG applications with an outlet pressure of 600 psi at $150,000. The sales representative from Greenfield stated that the price of the B63-NG compressor would come down with volume and if the design were specifically for low pressure.
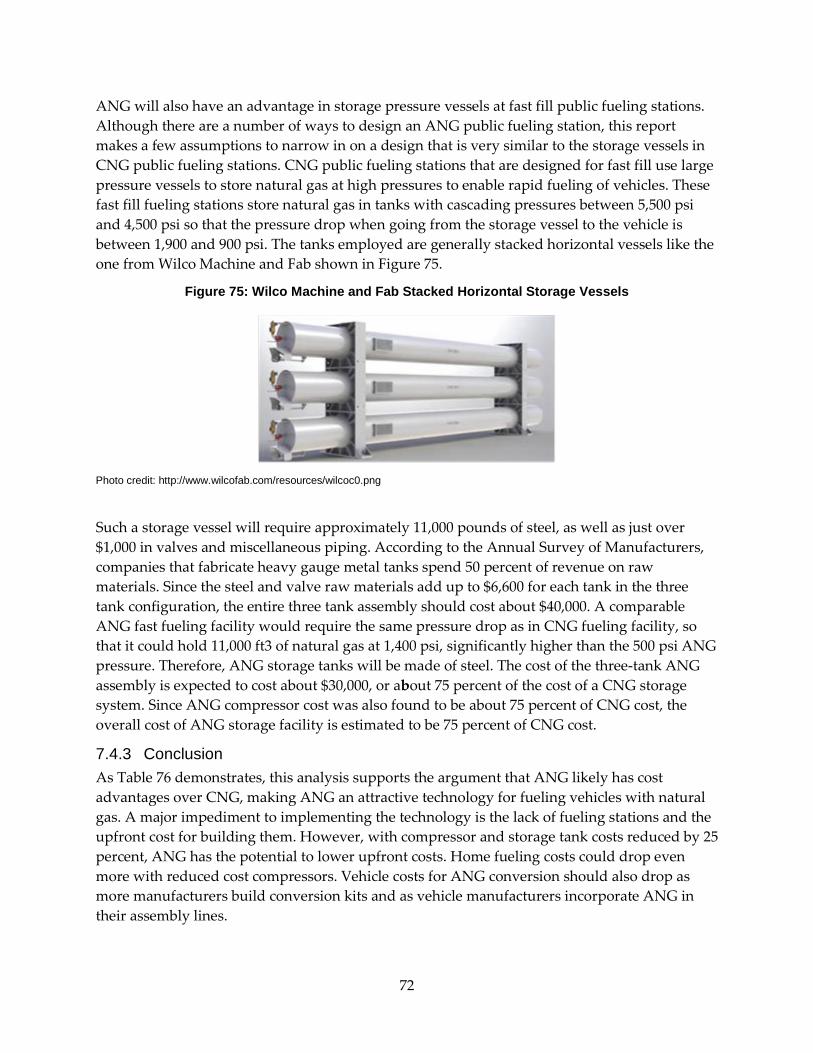
72
ANG will also have an advantage in storage pressure vessels at fast fill public fueling stations. Although there are a number of ways to design an ANG public fueling station, this report makes a few assumptions to narrow in on a design that is very similar to the storage vessels in CNG public fueling stations. CNG public fueling stations that are designed for fast fill use large pressure vessels to store natural gas at high pressures to enable rapid fueling of vehicles. These fast fill fueling stations store natural gas in tanks with cascading pressures between 5,500 psi and 4,500 psi so that the pressure drop when going from the storage vessel to the vehicle is between 1,900 and 900 psi. The tanks employed are generally stacked horizontal vessels like the one from Wilco Machine and Fab shown in Figure 75.
Figure 75: Wilco Machine and Fab Stacked Horizontal Storage Vessels
Photo credit: http://www.wilcofab.com/resources/wilcoc0.png
Such a storage vessel will require approximately 11,000 pounds of steel, as well as just over $1,000 in valves and miscellaneous piping. According to the Annual Survey of Manufacturers, companies that fabricate heavy gauge metal tanks spend 50 percent of revenue on raw materials. Since the steel and valve raw materials add up to $6,600 for each tank in the three tank configuration, the entire three tank assembly should cost about $40,000. A comparable ANG fast fueling facility would require the same pressure drop as in CNG fueling facility, so that it could hold 11,000 ft3 of natural gas at 1,400 psi, significantly higher than the 500 psi ANG pressure. Therefore, ANG storage tanks will be made of steel. The cost of the three-tank ANG assembly is expected to cost about $30,000, or about 75 percent of the cost of a CNG storage system. Since ANG compressor cost was also found to be about 75 percent of CNG cost, the overall cost of ANG storage facility is estimated to be 75 percent of CNG cost.
7.4.3 Conclusion As Table 76 demonstrates, this analysis supports the argument that ANG likely has cost advantages over CNG, making ANG an attractive technology for fueling vehicles with natural gas. A major impediment to implementing the technology is the lack of fueling stations and the upfront cost for building them. However, with compressor and storage tank costs reduced by 25 percent, ANG has the potential to lower upfront costs. Home fueling costs could drop even more with reduced cost compressors. Vehicle costs for ANG conversion should also drop as more manufacturers build conversion kits and as vehicle manufacturers incorporate ANG in their assembly lines.

73
Table 17: Comparison of the Total (Operating and Fueling) Cost Per GGE of Converting a Vehicle to ANG and CNG
7.8 GGE NG Vehicle ANG (cost per GGE) CNG (cost per GGE)
220 lbs. of carbon @ $6.95/lb. $0.46 $0.00
7.8 GGE Tank $0.09 $0.90
Ancillary Components $0.42 $0.42
ANG Compressor $0.05 $0.00
ANG Guard Bed $0.01 $0.00
Total Vehicle Cost $1.03 $1.32
Cost of Compression ANG CNG
Natural Gas Price $1.02 $1.32
Capital Cost of Compressor $0.36 $1.59
Cost of Electricity Required by Compressor $0.21 $0.33
Total Compression Cost $1.59 $2.94
Total Cost $2.62 $4.26
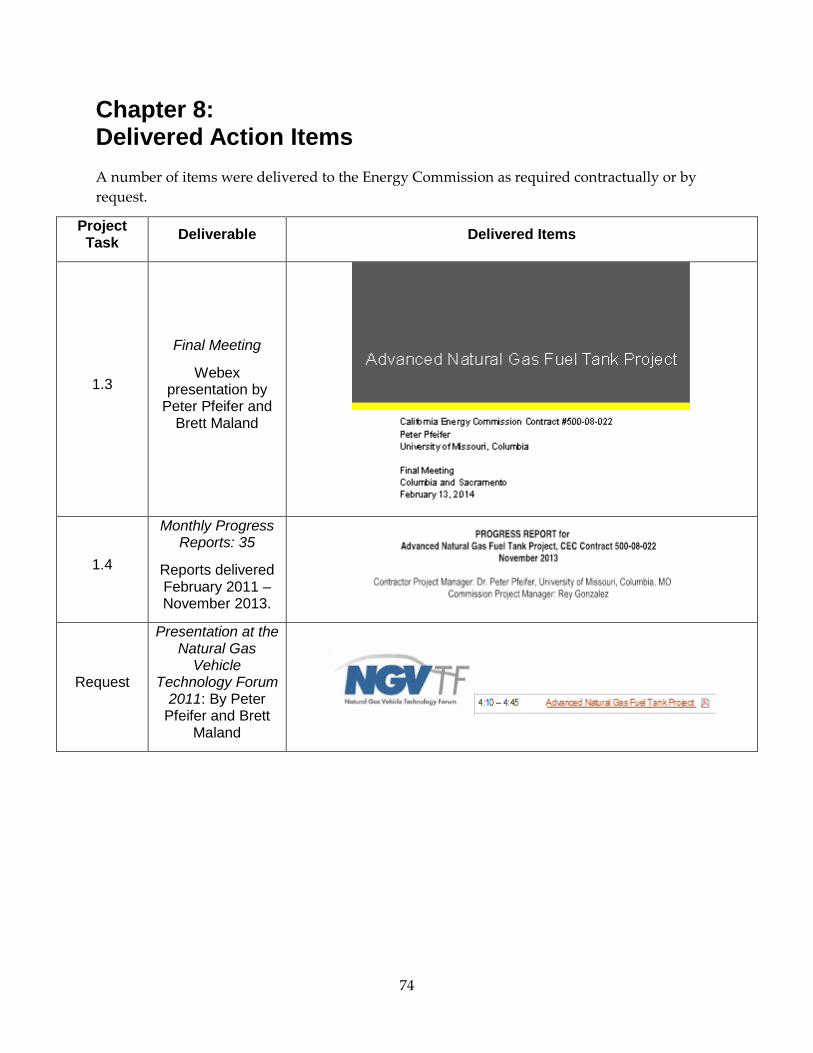
74
Chapter 8: Delivered Action Items A number of items were delivered to the Energy Commission as required contractually or by request.
Project Task Deliverable Delivered Items
1.3
Final Meeting
Webex presentation by
Peter Pfeifer and Brett Maland
1.4
Monthly Progress Reports: 35
Reports delivered February 2011 – November 2013.
Request
Presentation at the Natural Gas
Vehicle Technology Forum
2011: By Peter Pfeifer and Brett
Maland
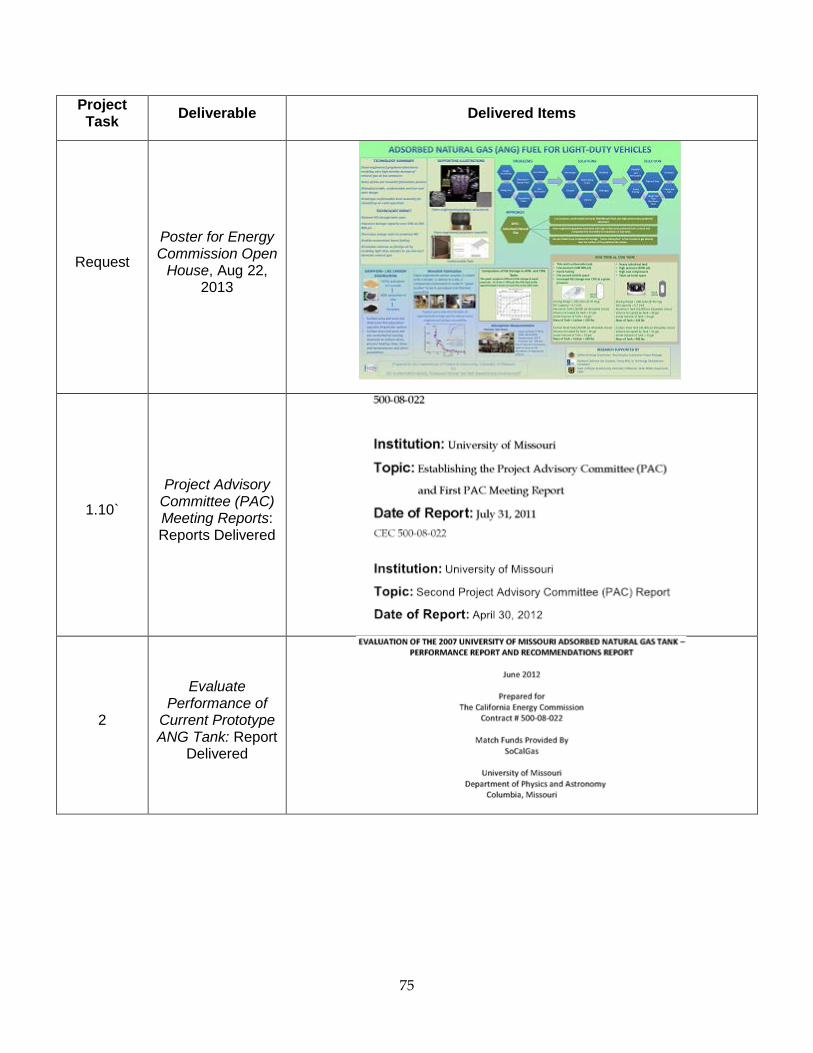
75
Project Task Deliverable Delivered Items
Request
Poster for Energy Commission Open
House, Aug 22, 2013
1.10`
Project Advisory Committee (PAC) Meeting Reports: Reports Delivered
2
Evaluate Performance of
Current Prototype ANG Tank: Report
Delivered

76
Project Task Deliverable Delivered Items
3.3
Design and Build Instrument for
Rapid Measurement of Methane Storage
Capacities of Briquettes: Report
Delivered
4
Design and Build Integrated, Light-
Weight, Advanced, Flat Panel ANG Tank Assembly
4.1 Theoretical Model
of New Tank Design
77
Project Task Deliverable Delivered Items
6
Develop Cost Estimates for the Light-Weight Flat-Panel ANG Tank
for Passenger Cars and Develop Design Principles
and cost Estimates for Large-Scale ANG Tanks for Fueling Station Applications:
Report Delivered
78
GLOSSARY
Term Definition
Å Angstrom
ANG Adsorbed Natural Gas
Bar One atmosphere of pressure
BET Brunauer, Emmett, Teller Theory
CNG Compressed Natural Gas
f Packing fraction
FPTA Flat Panel Tank Assembly
GREx Gravimetric Excess Adsorption
GGE Gallon of gas equivalent (2.576 kg of CH4)
GRSt Gravimetric Storage Capacity
KOH Potassium hydroxide
MOF Metal Organic Framework
MRI Midwest Research Institute now MRIGlobal
MS Mass spectrometry
mSample Mass of Sample
MWV MeadWestvaco
NG Natural gas
NGV Natural gas vehicle
P Pressure
PSD Pore size distribution
psi Pounds per square inch
PVA Poly vinyl alcohol
PVDC Poly-vinylidene chloride
TGA Thermogravimetric analysis
V/V Volume per volume

79
VRSkeletal Adsorbent Skeletal Volume
VRSt Volumetric Storage Capacity
ρFree Gas Unadsorbed Gas Density
ρGas, Pore Average Gas Density in Pore Volume
ρRSkeletal Adsorbent Skeletal Density
σ Specific Surface Area
φ Porosity
80
REFERENCES
AGLARG (Atlanta Gas Light Adsorbent Research Group), Low Pressure Adsorbent Natural Gas Vehicle Demonstration, Atlanta Gas Light Company, Final Report,1997, Contract 466590, Submitted to U.S. Department of Energy, Brookhaven National Laboratory, Upton, New York.
Alibaba.com, Brett Maland - Quotes obtained from Alibaba.com, 2013.
Andersons (The), Grit O’Cobs®, http://www.gritocob.com/
Anonymous, April 2012, Data and Analysis Report of an Instrument for Rapid Measurement of Methane Storage Capacities of Briquettes, Final Report, University of Missouri, Columbia, MO, Final Report to California Energy Commission, Contract #500-08-022
Autoweek, GM says natural-gas Chevrolet Impala on the way, http://www.autoweek.com/article/20131016/carnews/131019833, Autoweek, 10/16/2013
Bose, T.K., R. Chahine, and J.-M. St-Arnaud, High-density adsorbent and method of producing same. U.S. Patent 4 999 330, March 12, 1991
Cavenati, S., Grande, C. A., Rodrigues, A. E., Kiener, C., & Müller, U., 2008, Metal Organic Framework Adsorbent for Biogas Upgrading. Industrial & Engineering Chemistry Research, 47(16), 6333-6335. doi: 10.1021/ie8005269
CNG Now, Consumer Vehicles, http://www.cngnow.com/vehicles/consumer-vehicles/Pages/information.aspx
Elliott, J. A., Kelly, A., & Windle, A. H., 2002, Recursive packing of dense particle mixtures. Journal of Materials Science Letters, 21(16), 1249-1251. doi: 10.1023/a:1016503002392
Fiske, T. J., Railkar, S. B., & Kalyon, D. M., 1994, Effects of segregation on the packing of spherical and nonspherical particles. Powder Technology, 81(1), 57-64. doi: http://dx.doi.org/10.1016/0032-5910(94)02862-1
Gaab, M., Trukhan, N., Maurer, S., Gummaraju, R., & Müller, U., 2012, The progression of Al-based metal-organic frameworks – From academic research to industrial production and applications. Microporous and Mesoporous Materials, 157(0), 131-136. doi: http://dx.doi.org/10.1016/j.micromeso.2011.08.016
Ginzburg, Y., 2006, ANG Storage as a Technological Solution for the “Chicken-and-Egg” Problem of NGV Refueling Infrastructure Development, 23rd World Gas Conference, Amsterdam 2006.
Greenfield Compression, Inc., 909 N Bowser Road, Richardson, TX 75081 Phone: (972) 889-2400, Brett Maland personal communication, 2013. www.atlascopco.com

81
Lillo-Ródenas, M. A., D. Cazorla-Amorós, and A. Linares-Solano, 2003, Understanding chemical reactions between carbons and NaOH and KOH: an insight into the chemical activation mechanism, Carbon 41 267–75
Maland, Brett, Personal quote from Tri-State Aluminum, New Jersey, December 2013.
Marco-Lozar, J. P., M. Kunowsky, F. Suarez-Garcia, J. D. Carruthers and A. Linares-Solano, Energy & Environmental Science 5 (12), 9833-9842 (2012).
Marsh, H. and F. Rodríguez-Reinoso, 2006, Activated Carbon (Amsterdam, London: Elsevier)
Mason, J. A., Veenstra, M., & Long, J. R., 2014, Evaluating metal-organic frameworks for natural gas storage. [10.1039/C3SC52633J]. Chemical Science, 5(1), 32-51. doi: 10.1039/c3sc52633j
OsComp Systems, et al. Estimates provided by: OsComp Systems, a compressor technology company; Professor Yuyi Lin, P.E., Associate Professor of Mechanical Engineering at the University of Missouri; and General Electric estimating $500, see
http://www.genewscenter.com/Press-Releases/GE-Researchers-Developing-At-Home-Refueling-Station-for-NG-Vehicles-39c7.aspx
Otowa, T., R.Tanibata, and M.Itoh, 1993, Production and adsorption characteristics of MAXSORB: high-surface-area active carbon, Gas Sep. Purif. 7 241-5
Pfeifer, P., et al, 2008, High Surface Area Carbon and Process for its Production, US patent 20080207442
Raymundo-Piñero E., P. Azaïs, T. Cacciaguerra, D. Cazorla-Amorós, A. Linares-Solano, and F. Béguin , 2005, KOH and NaOH activation mechanisms of multiwalled carbon nanotubes with different structural organisation Carbon 43 786–95
Rodríguez-Reinoso, F., Y. Nakagawa, J. Silvestre-Albero, J. M. Juárez-Galán and M. Molina-Sabio, 2008, Correlation of methane uptake with microporosity and surface area of chemically activated carbons, Microporous Mesoporous Mater. 115 (3), 603-608 (2008).
Romanos, J., M. Beckner, T.Rash, L. Firlej, B. Kuchta, P. Yu, G. Suppes, C. Wexler , and P. Pfeifer, 2012, Nanospace engineering of KOH activated carbon, Nanotechnology 23 015401
Rood-Werpy, M., et al, 2009, Natural Gas Vehicles: Status, Barriers, Opportunities; Clean Cities DOE, September 23, 2009.
Rouquerol, F., J. Rouquerol, and K. Sing, Adsorption by Powders and Porous Solids; Principles, Methodology and Applications. 1999: Academic Press. New York, US.
Senkovska, Irena; Kaskel, Stefan, 2008, High pressure methane adsorption in the metal- organic frameworks Cu3(btc)2, Zn2(bdc)2dabco, and Cr3F(H2O)2O(bdc)3, Microporous and Mesoporous Materials, 112(1-3), 108-115.
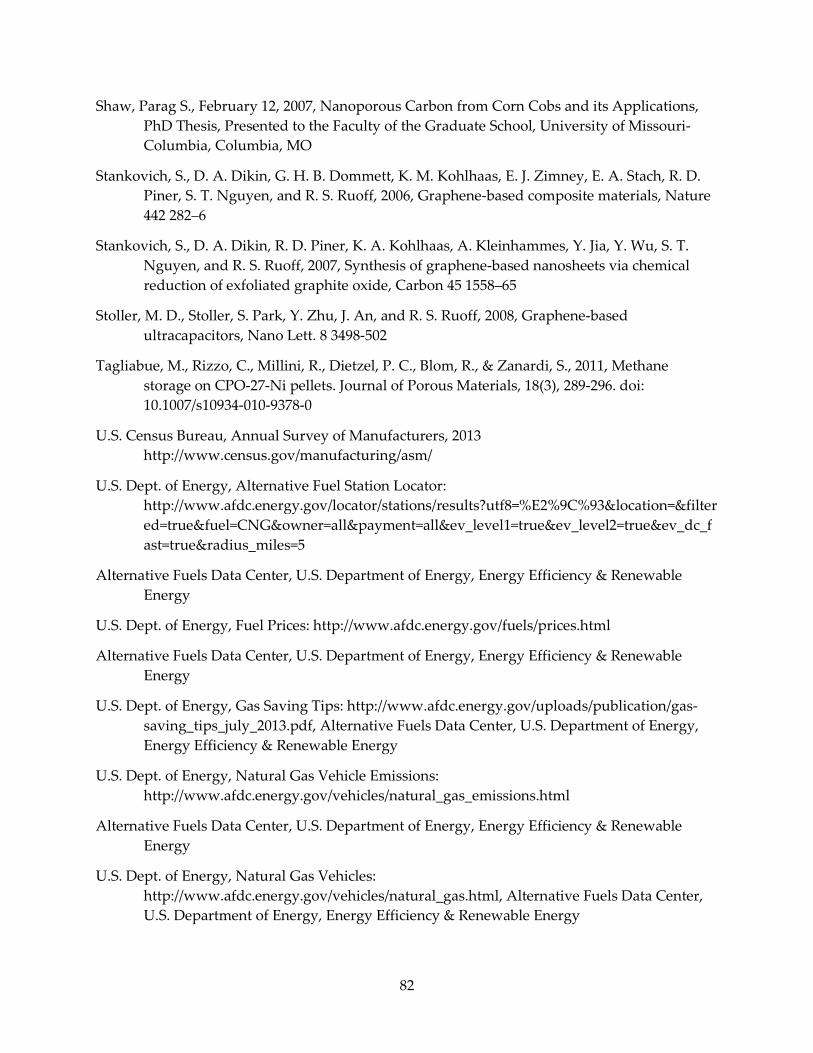
82
Shaw, Parag S., February 12, 2007, Nanoporous Carbon from Corn Cobs and its Applications, PhD Thesis, Presented to the Faculty of the Graduate School, University of Missouri- Columbia, Columbia, MO
Stankovich, S., D. A. Dikin, G. H. B. Dommett, K. M. Kohlhaas, E. J. Zimney, E. A. Stach, R. D. Piner, S. T. Nguyen, and R. S. Ruoff, 2006, Graphene-based composite materials, Nature 442 282–6
Stankovich, S., D. A. Dikin, R. D. Piner, K. A. Kohlhaas, A. Kleinhammes, Y. Jia, Y. Wu, S. T. Nguyen, and R. S. Ruoff, 2007, Synthesis of graphene-based nanosheets via chemical reduction of exfoliated graphite oxide, Carbon 45 1558–65
Stoller, M. D., Stoller, S. Park, Y. Zhu, J. An, and R. S. Ruoff, 2008, Graphene-based ultracapacitors, Nano Lett. 8 3498-502
Tagliabue, M., Rizzo, C., Millini, R., Dietzel, P. C., Blom, R., & Zanardi, S., 2011, Methane storage on CPO-27-Ni pellets. Journal of Porous Materials, 18(3), 289-296. doi: 10.1007/s10934-010-9378-0
U.S. Census Bureau, Annual Survey of Manufacturers, 2013 http://www.census.gov/manufacturing/asm/
U.S. Dept. of Energy, Alternative Fuel Station Locator: http://www.afdc.energy.gov/locator/stations/results?utf8=%E2%9C%93&location=&filtered=true&fuel=CNG&owner=all&payment=all&ev_level1=true&ev_level2=true&ev_dc_fast=true&radius_miles=5
Alternative Fuels Data Center, U.S. Department of Energy, Energy Efficiency & Renewable Energy
U.S. Dept. of Energy, Fuel Prices: http://www.afdc.energy.gov/fuels/prices.html
Alternative Fuels Data Center, U.S. Department of Energy, Energy Efficiency & Renewable Energy
U.S. Dept. of Energy, Gas Saving Tips: http://www.afdc.energy.gov/uploads/publication/gas-saving_tips_july_2013.pdf, Alternative Fuels Data Center, U.S. Department of Energy, Energy Efficiency & Renewable Energy
U.S. Dept. of Energy, Natural Gas Vehicle Emissions: http://www.afdc.energy.gov/vehicles/natural_gas_emissions.html
Alternative Fuels Data Center, U.S. Department of Energy, Energy Efficiency & Renewable Energy
U.S. Dept. of Energy, Natural Gas Vehicles: http://www.afdc.energy.gov/vehicles/natural_gas.html, Alternative Fuels Data Center, U.S. Department of Energy, Energy Efficiency & Renewable Energy
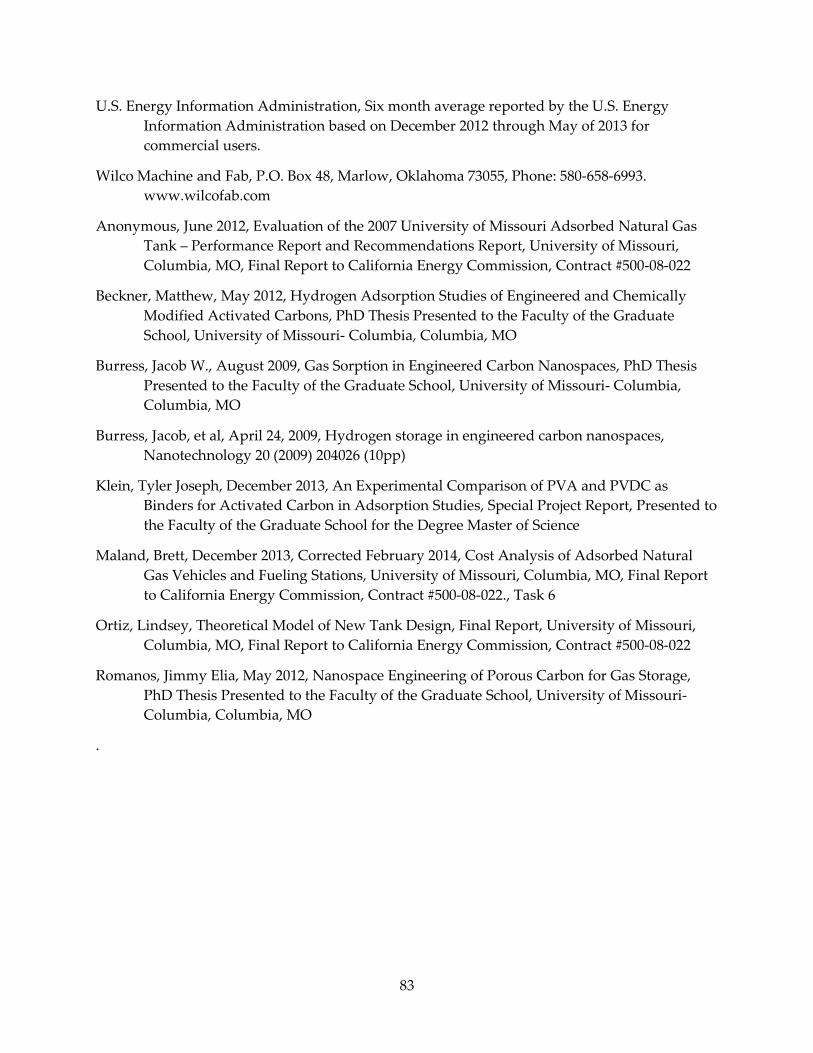
83
U.S. Energy Information Administration, Six month average reported by the U.S. Energy Information Administration based on December 2012 through May of 2013 for commercial users.
Wilco Machine and Fab, P.O. Box 48, Marlow, Oklahoma 73055, Phone: 580-658-6993. www.wilcofab.com
Anonymous, June 2012, Evaluation of the 2007 University of Missouri Adsorbed Natural Gas Tank – Performance Report and Recommendations Report, University of Missouri, Columbia, MO, Final Report to California Energy Commission, Contract #500-08-022
Beckner, Matthew, May 2012, Hydrogen Adsorption Studies of Engineered and Chemically Modified Activated Carbons, PhD Thesis Presented to the Faculty of the Graduate School, University of Missouri- Columbia, Columbia, MO
Burress, Jacob W., August 2009, Gas Sorption in Engineered Carbon Nanospaces, PhD Thesis Presented to the Faculty of the Graduate School, University of Missouri- Columbia, Columbia, MO
Burress, Jacob, et al, April 24, 2009, Hydrogen storage in engineered carbon nanospaces, Nanotechnology 20 (2009) 204026 (10pp)
Klein, Tyler Joseph, December 2013, An Experimental Comparison of PVA and PVDC as Binders for Activated Carbon in Adsorption Studies, Special Project Report, Presented to the Faculty of the Graduate School for the Degree Master of Science
Maland, Brett, December 2013, Corrected February 2014, Cost Analysis of Adsorbed Natural Gas Vehicles and Fueling Stations, University of Missouri, Columbia, MO, Final Report to California Energy Commission, Contract #500-08-022., Task 6
Ortiz, Lindsey, Theoretical Model of New Tank Design, Final Report, University of Missouri, Columbia, MO, Final Report to California Energy Commission, Contract #500-08-022
Romanos, Jimmy Elia, May 2012, Nanospace Engineering of Porous Carbon for Gas Storage, PhD Thesis Presented to the Faculty of the Graduate School, University of Missouri- Columbia, Columbia, MO
.
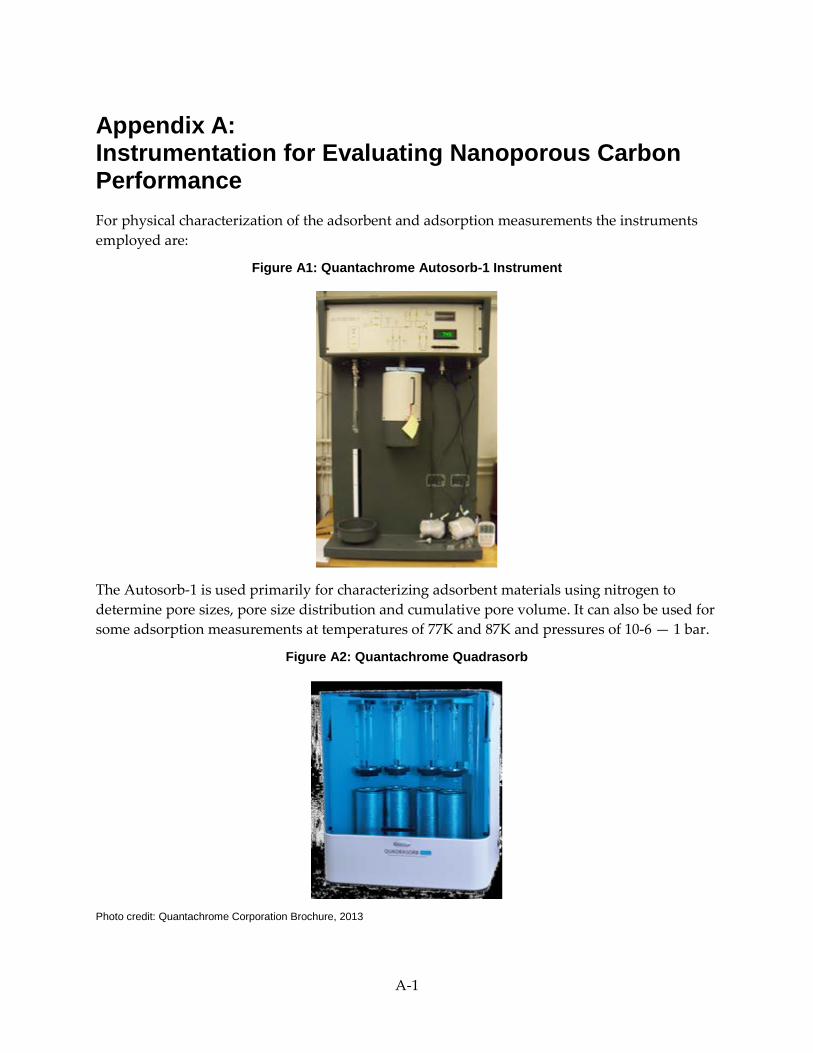
A-1
Appendix A: Instrumentation for Evaluating Nanoporous Carbon Performance For physical characterization of the adsorbent and adsorption measurements the instruments employed are:
Figure A1: Quantachrome Autosorb-1 Instrument
The Autosorb-1 is used primarily for characterizing adsorbent materials using nitrogen to determine pore sizes, pore size distribution and cumulative pore volume. It can also be used for some adsorption measurements at temperatures of 77K and 87K and pressures of 10-6 — 1 bar.
Figure A2: Quantachrome Quadrasorb
Photo credit: Quantachrome Corporation Brochure, 2013
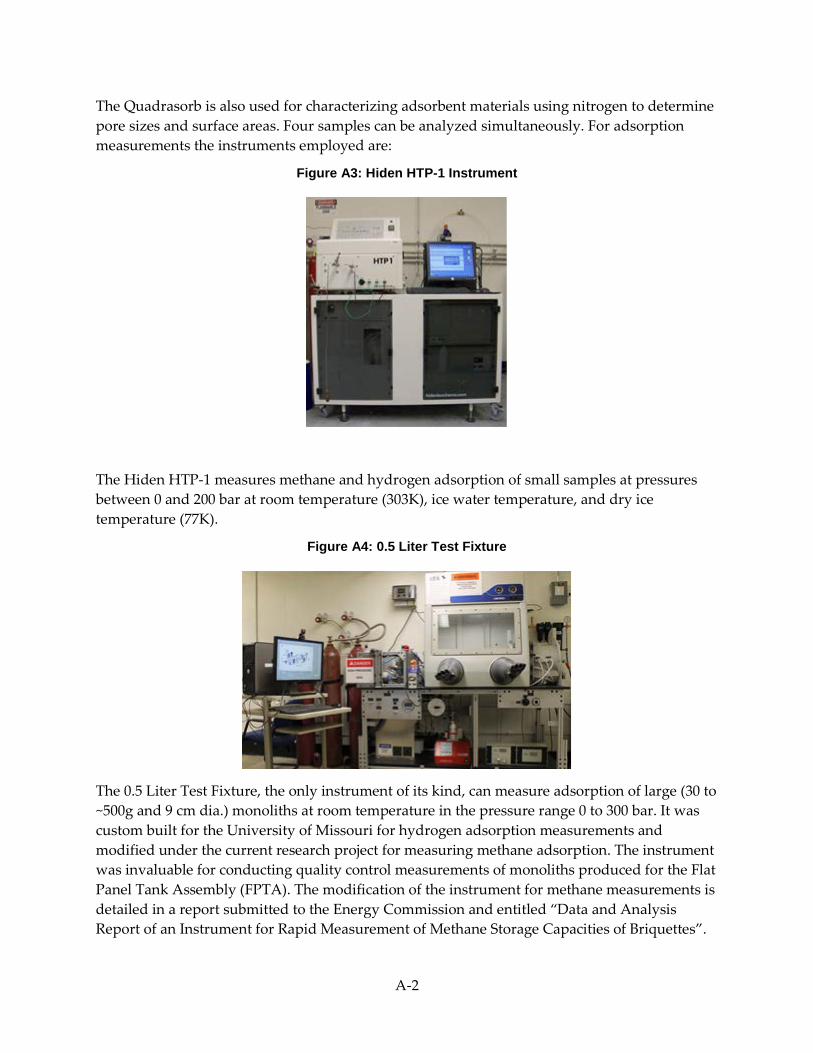
A-2
The Quadrasorb is also used for characterizing adsorbent materials using nitrogen to determine pore sizes and surface areas. Four samples can be analyzed simultaneously. For adsorption measurements the instruments employed are:
Figure A3: Hiden HTP-1 Instrument
The Hiden HTP-1 measures methane and hydrogen adsorption of small samples at pressures between 0 and 200 bar at room temperature (303K), ice water temperature, and dry ice temperature (77K).
Figure A4: 0.5 Liter Test Fixture
The 0.5 Liter Test Fixture, the only instrument of its kind, can measure adsorption of large (30 to ~500g and 9 cm dia.) monoliths at room temperature in the pressure range 0 to 300 bar. It was custom built for the University of Missouri for hydrogen adsorption measurements and modified under the current research project for measuring methane adsorption. The instrument was invaluable for conducting quality control measurements of monoliths produced for the Flat Panel Tank Assembly (FPTA). The modification of the instrument for methane measurements is detailed in a report submitted to the Energy Commission and entitled “Data and Analysis Report of an Instrument for Rapid Measurement of Methane Storage Capacities of Briquettes”.

A-3
Figure A5: Rapid Methane Screening Instrument (RMS)
The rapid screening instrument can measure between 1—5 grams of carbon, in the pressure range 0—50 bar at room temperature. As its name implies it is used for rapid, initial evaluation of adsorbent quality.
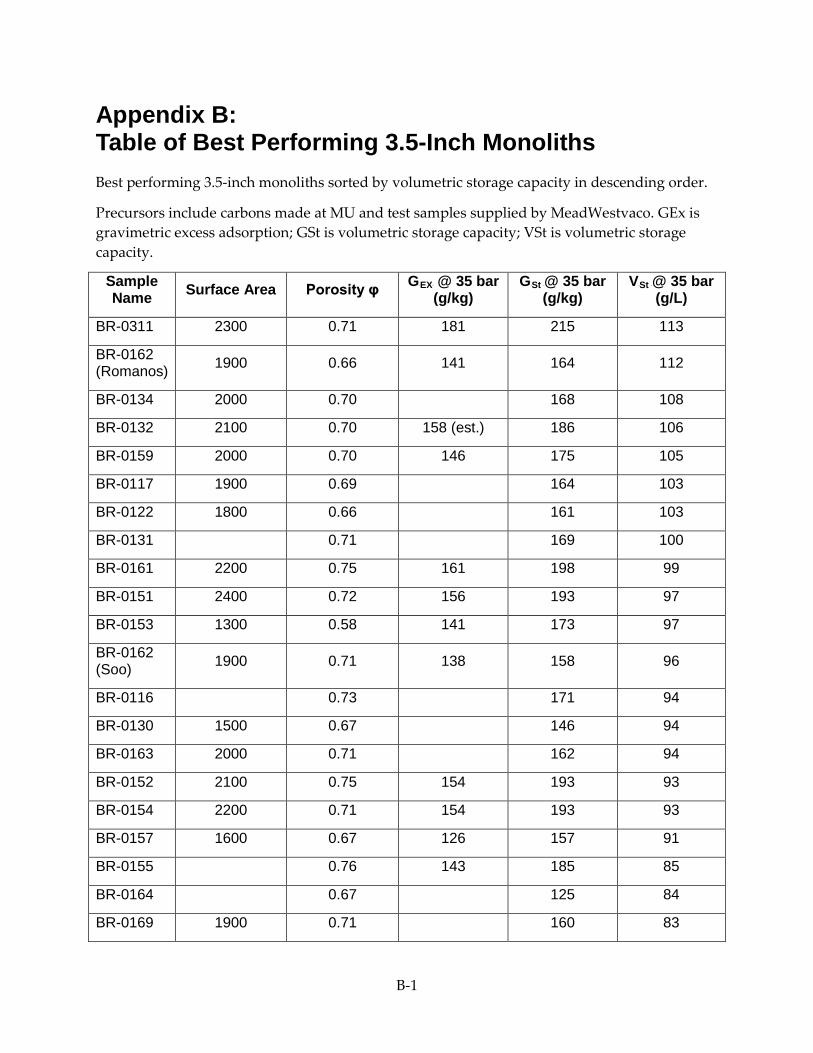
B-1
Appendix B: Table of Best Performing 3.5-Inch Monoliths Best performing 3.5-inch monoliths sorted by volumetric storage capacity in descending order.
Precursors include carbons made at MU and test samples supplied by MeadWestvaco. GEx is gravimetric excess adsorption; GSt is volumetric storage capacity; VSt is volumetric storage capacity.
Sample Name Surface Area Porosity φ GREXR @ 35 bar
(g/kg) GRSt R@ 35 bar
(g/kg) VRSt R@ 35 bar
(g/L)
BR-0311 2300 0.71 181 215 113
BR-0162 (Romanos) 1900 0.66 141 164 112
BR-0134 2000 0.70 168 108
BR-0132 2100 0.70 158 (est.) 186 106
BR-0159 2000 0.70 146 175 105
BR-0117 1900 0.69 164 103
BR-0122 1800 0.66 161 103
BR-0131 0.71 169 100
BR-0161 2200 0.75 161 198 99
BR-0151 2400 0.72 156 193 97
BR-0153 1300 0.58 141 173 97
BR-0162 (Soo) 1900 0.71 138 158 96
BR-0116 0.73 171 94
BR-0130 1500 0.67 146 94
BR-0163 2000 0.71 162 94
BR-0152 2100 0.75 154 193 93
BR-0154 2200 0.71 154 193 93
BR-0157 1600 0.67 126 157 91
BR-0155 0.76 143 185 85
BR-0164 0.67 125 84
BR-0169 1900 0.71 160 83
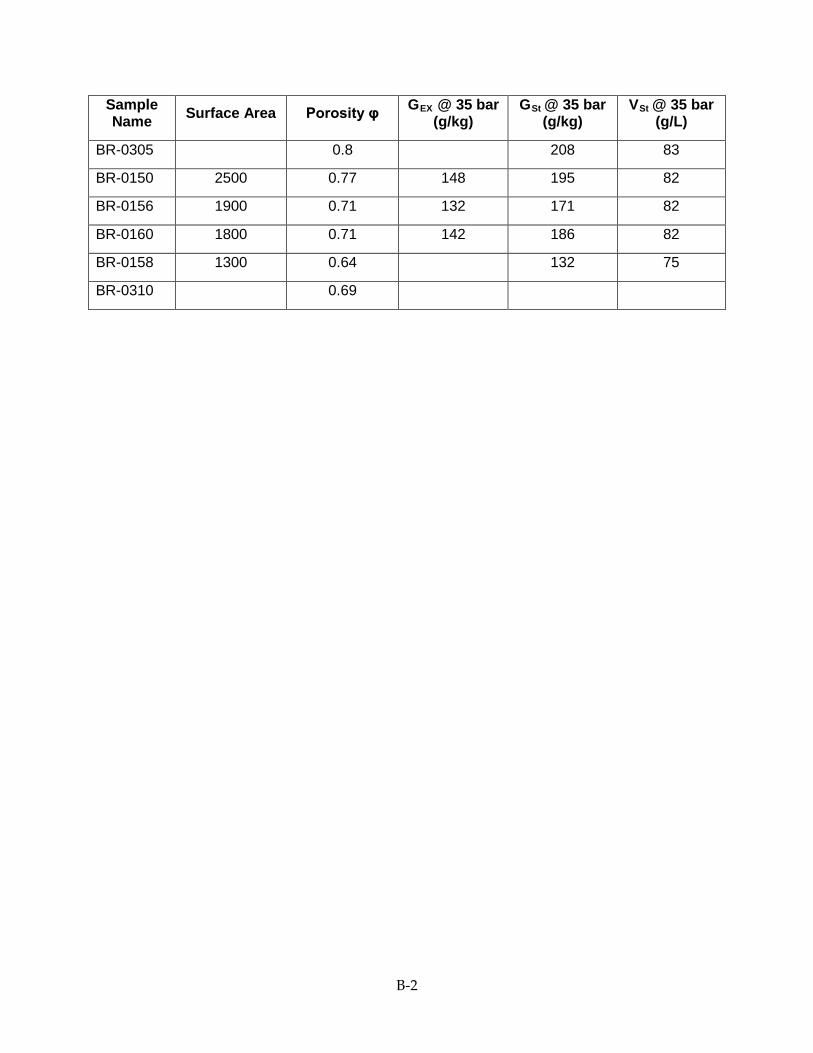
B-2
Sample Name Surface Area Porosity φ GREXR @ 35 bar
(g/kg) GRSt R@ 35 bar
(g/kg) VRSt R@ 35 bar
(g/L)
BR-0305 0.8 208 83
BR-0150 2500 0.77 148 195 82
BR-0156 1900 0.71 132 171 82
BR-0160 1800 0.71 142 186 82
BR-0158 1300 0.64 132 75
BR-0310 0.69
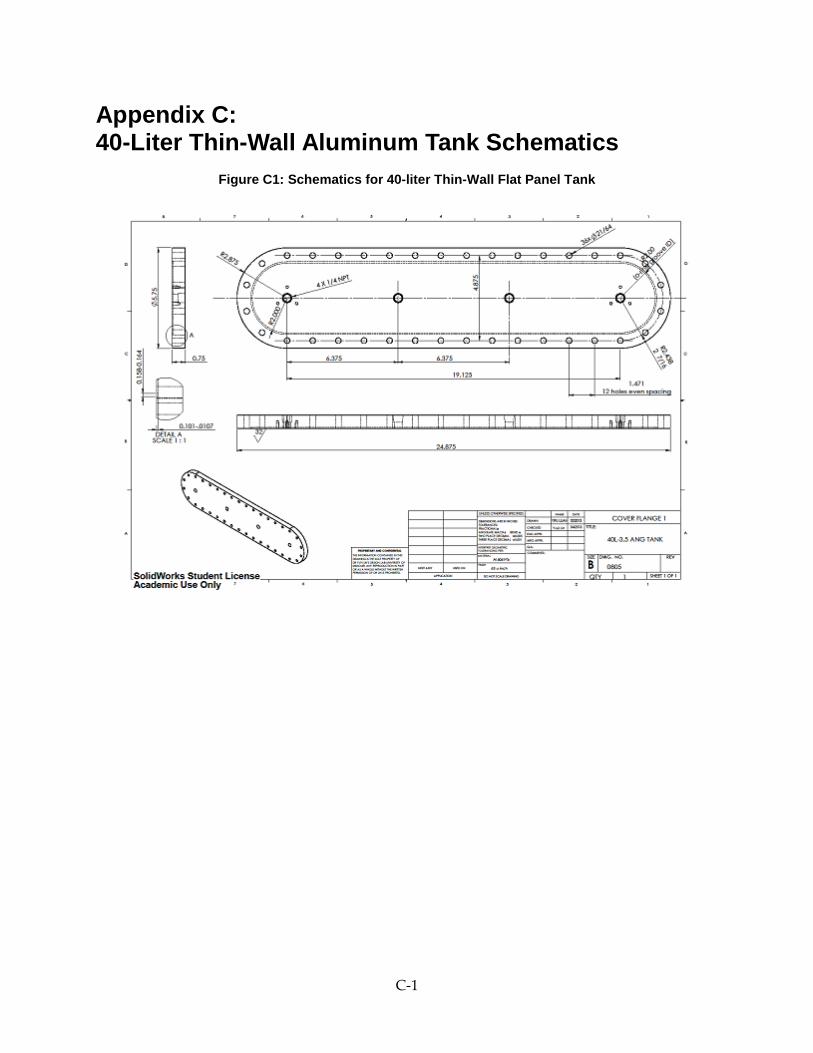
C-1
Appendix C: 40-Liter Thin-Wall Aluminum Tank Schematics
Figure C1: Schematics for 40-liter Thin-Wall Flat Panel Tank

C-2
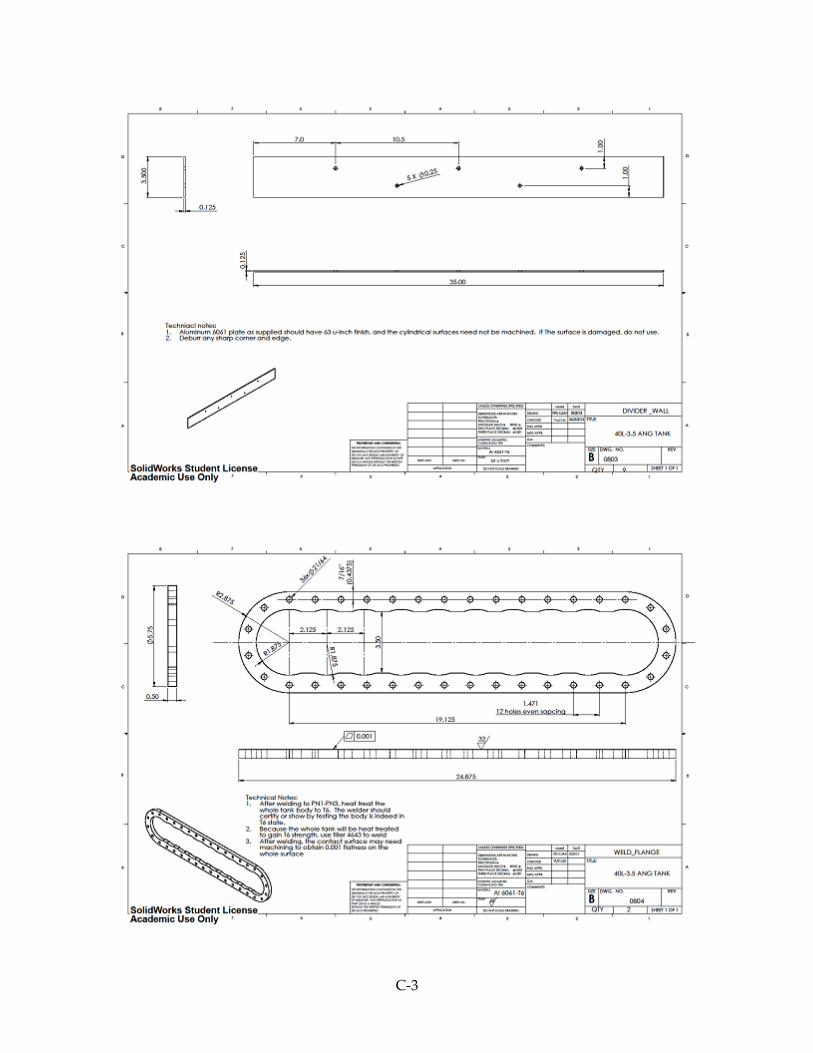
C-3
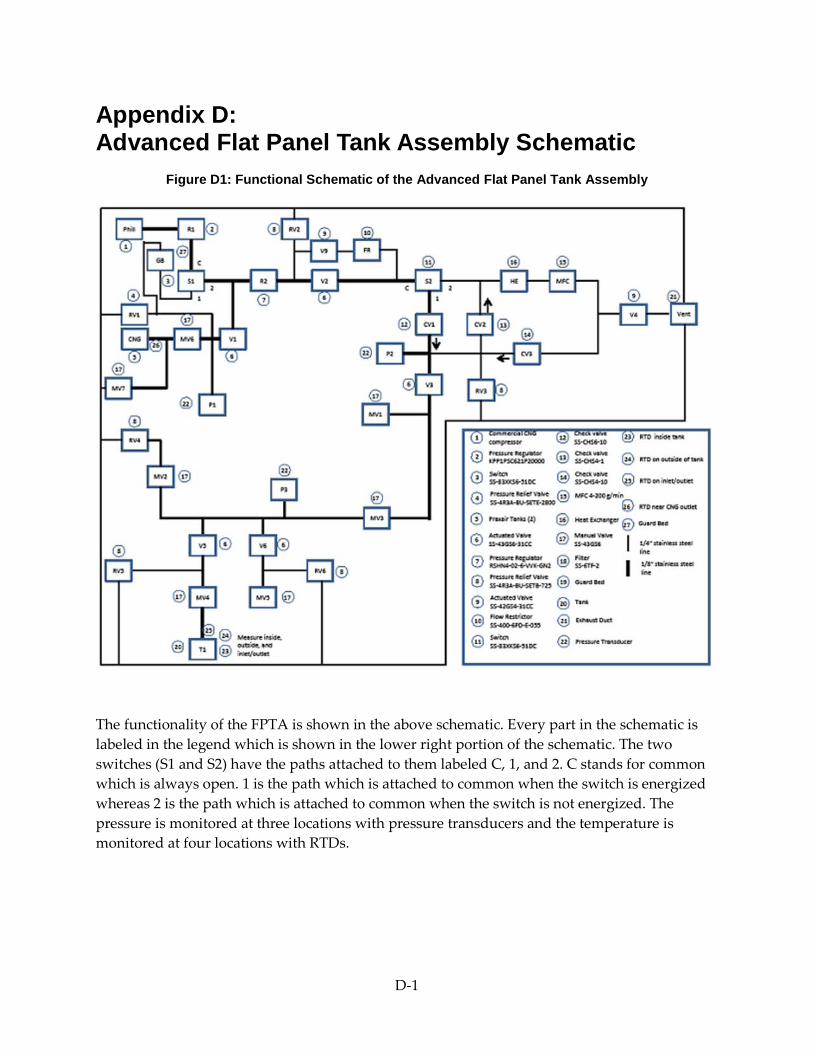
D-1
Appendix D: Advanced Flat Panel Tank Assembly Schematic
Figure D1: Functional Schematic of the Advanced Flat Panel Tank Assembly
The functionality of the FPTA is shown in the above schematic. Every part in the schematic is labeled in the legend which is shown in the lower right portion of the schematic. The two switches (S1 and S2) have the paths attached to them labeled C, 1, and 2. C stands for common which is always open. 1 is the path which is attached to common when the switch is energized whereas 2 is the path which is attached to common when the switch is not energized. The pressure is monitored at three locations with pressure transducers and the temperature is monitored at four locations with RTDs.