advanced performance management...
TRANSCRIPT

ACCAP5 Study TextAdvanced PerformanceManagement
PublishingPublishing


AC
CA
Paper
P5
Advanced performance management
PublishingPublishing
Welcome to Emile Woolf‘s study text for Paper P5 Advanced Performance Management which is:
Written by tutors
Comprehensive but concise
In simple English
Used around the world by Emile Woolf Colleges
ii © Emile Woolf Publishing Limited
Third edition published by Emile Woolf Publishing Limited Crowthorne Enterprise Centre, Crowthorne Business Estate, Old Wokingham Road, Crowthorne, Berkshire RG45 6AW Email: [email protected] www.emilewoolfpublishing.com
© Emile Woolf Publishing Limited, April 2011
All rights reserved. No part of this publication may be reproduced, stored in a retrieval system, or transmitted, in any form or by any means, electronic, mechanical, photocopying, recording, scanning or otherwise, without the prior permission in writing of Emile Woolf Publishing Limited, or as expressly permitted by law, or under the terms agreed with the appropriate reprographics rights organisation.
You must not circulate this book in any other binding or cover and you must impose the same condition on any acquirer. Notice Emile Woolf Publishing Limited has made every effort to ensure that at the time of writing the contents of this study text are accurate, but neither Emile Woolf Publishing Limited nor its directors or employees shall be under any liability whatsoever for any inaccurate or misleading information this work could contain. British Library Cataloguing in Publications Data A catalogue record for this book is available from the British Library. ISBN: 978‐1‐84843‐156‐0 Printed and bound in Great Britain Acknowledgements The syllabus and study guide are reproduced by kind permission of the Association of Chartered Certified Accountants.
© Emile Woolf Publishing Limited iii
Paper P5 Advanced performance management
c
Contents
Page
Syllabus and study guide v
DCF tables xvii
Chapter 1: Strategic management accounting 1
Chapter 2: Strategic planning techniques 31
Chapter 3: Budgets and beyond 45
Chapter 4: Changes in business structure and management accounting 77
Chapter 5: External factors on organisational performance 95
Chapter 6: Performance measurement systems and design 119
Chapter 7: Strategic performance measurement 227
Chapter 8: Decentralisation and divisional performance 247
Chapter 9: Transfer pricing 267
Chapter 10: Japanese business practices and management accounting techniques 295
Chapter 11: Role of quality 311
Chapter 12: Performance measurement and strategic HRM issues 331
Chapter 13: Strategic models and performance measurement 375
Chapter 14: Alternative views of performance measurement 387
Chapter 15: Current developments and emerging issues in performance management 375
Appendix 1: Revision: ABC and other accounting methods 387
Appendix 2: Accounting for decision-making 411
Appendix 3: Decision-making with risk and uncertainty 431
Appendix 4: Budgeting and quantitative techniques in budgeting 447

iv © Emile Woolf Publishing Limited
Appendix 5: Discounted Cash Flow (DCF) and long-term decisions 473
Appendix 6: Pricing and life cycle issues 495
Practice questions 517
Answers to practice questions 557
Index 619

© Emile Woolf Publishing Limited v
Paper P5 Advanced performance management
S
Syllabus and study guide
AIM
To apply relevant knowledge, skills and exercise professional judgement in selecting and applying strategic management accounting techniques in different business contexts and to contribute to the evaluation of the performance of an organization and its strategic development.
MAIN CAPABILITIES
On successful completion of this paper, candidates should be able to:
A Use strategic planning and control models to plan and monitor organisational performance
B Assess and identify relevant macroeconomic, fiscal and market factors and key external influences on organisational performance
C Identify and evaluate the design features of effective performance management information and monitoring systems
D Apply appropriate strategic performance measurement techniques in evaluating and improving organisational performance
E Advise clients and senior management on strategic business performance evaluation and on recognising vulnerability to corporate failure
F Identify and assess the impact of current developments in management accounting and performance management on measuring, evaluating and improving organisational performance.
Rationale
The Advanced Performance Management syllabus further develops key aspects introduced in Paper F5, Performance Management, at the skills level and draws on aspects of the material covered from a more strategic and operational planning perspective in Paper P3, Business Analysis. The syllabus introduces candidates to the strategic role of management accounting as a discipline for planning and controlling performance so that strategic objectives
Paper P5: Advanced performance management
vi © Emile Woolf Publishing Limited
can be set, monitored and controlled. It also covers the impact of external factors on strategic management issues, such as macroeconomic, fiscal, market and environmental impacts on performance. From appreciating the strategic context of performance management and the impact of wider factors, the syllabus examines, at an operational level, the issues relating to performance measurement systems and their design. The syllabus then moves from performance management systems and their design to the scope and application of high-level performance measurement techniques in a variety of contexts, including not-for-profit organisations and multinational businesses. Having covered the strategic aspects of performance management and operational systems for the measurement and control of performance in a variety of contexts, candidates are then expected to synthesise this knowledge in the role of an advisor to senior management or independent clients on how to assess and control the performance of an entity, including the recognition of whether a business is facing difficulties or possibly failure. Finally, the syllabus deals with current developments in performance management and with emerging issues as they might affect or influence the management of performance within organisations.
Detailed syllabus
A Strategic planning and control
1. Introduction to strategic management accounting
2. Performance management and control of the organisation
3. Changes in business structure and management accounting
4. Effect of Information Technology (IT) on strategic management accounting
5. Other environmental and ethical issues
B External influences on organisational Performance
1. Changing business environment
2. Impact of external factors on strategy and performance
C Performance measurement systems and design
1. Performance management information systems
2. Sources of management information
3. Recording and processing methods
4. Management reports
D Strategic performance measurement
1. Performance hierarchy
2. Strategic performance measures in private sector

Syllabus and study guide
© Emile Woolf Publishing Limited vii
3. Divisional performance and transfer pricing issues
4. Strategic performance measures in not-for-profit organisations
5. Non- financial performance indictors
6. The role of quality in management information and performance measurement systems
7. Performance measurement and strategic human resource management issues
8. Performance measurement and the reward systems
9. Other behavioural aspects of performance measurement
E Performance evaluation and corporate failure
1. Alternative views of performance measurement and management
2. Strategic performance issues in complex business structures
3. Predicting and preventing corporate failure
F Current developments and emerging issues performance management
1. Current developments in management accounting techniques
2. Current issues and trends in performance management
Approach to examining the syllabus
Paper P5 builds on paper F5, Performance Management, and candidates are expected to have a thorough understanding of the paper F5 syllabus. In addition, candidates will also be required to apply the principles and techniques covered in paper F2, Management Accounting.
Paper P5 has a link with Paper P3, Business Analysis, in the areas of strategic planning and control and performance measurement
Examination structure
The examination will be a three hour paper in two sections:
Section A
Section A will comprise two compulsory questions comprising between 50 and 70 marks in total. Each question will comprise of between 25 and 40 marks
Section B
In section B candidates will be asked to answer two from three questions comprising of between 15 and 25 marks each
Total 100 marks
7

Paper P5: Advanced performance management
viii © Emile Woolf Publishing Limited
Study Guide
This study guide provides more detailed guidance on the syllabus. You should use this as the basis of your studies.
A STRATEGIC PLANNING AND CONTROL
1. Introduction to strategic management accounting
a) Explain the role of strategic performance management in strategic planning and control.
b) Discuss the role of corporate planning in clarifying corporate objectives, making strategic decisions and checking progress towards the objectives.
c) Compare planning and control between the strategic and operational levels within a business entity.
d) Assess the use of strategic management accounting in the context of multinational companies.
e) Discuss the scope for potential conflict between strategic business plans and short-term localised decisions.
f) Evaluate how SWOT analysis may assist in the performance management process.
g) Evaluate the methods of benchmarking performance.
2. Performance management and control of the organisation
a) Evaluate the strengths and weaknesses of alternative budgeting models and compare such techniques as fixed and flexible, rolling, activity based, zero based and incremental.
b) Assess how budgeting may differ in not-for-profit organisations from profit-seeking organisations.
c) Evaluate the impact to an organisation of a move beyond budgeting
3. Changes in business structure and management accounting
a) Identify and discuss the particular information needs of organisations adopting a functional, divisional or network form and the implications for performance management.
b) Assess the influence of Business Process Re-engineering on systems development and improvements in organisational performance.
c) Discuss the concept of business integration and the linkage between people, operations, strategy and technology.
d) Identify and discuss the required changes in management accounting systems as a consequence of empowering staff to manage sectors of a business.

Syllabus and study guide
© Emile Woolf Publishing Limited ix
4. Effect of Information Technology (IT) on strategic management accounting
a) Assess the changing accounting needs of modern service orientated businesses compared with the needs of traditional manufacturing industry.
b) Discuss how IT systems provide the opportunity for instant access to management accounting data throughout the organisation and their potential impact on business performance.
c) Discuss how IT systems facilitate the remote input of management accounting data in an acceptable format by non-finance specialists.
d) Explain how information systems provide instant access to previously unavailable data that can be used for benchmarking and control purposes and help improve business performance.
e) Assess the need for businesses to continually refine and develop their management accounting and information systems if they are to maintain or improve their performance in an increasingly competitive and global market.
5. Other environmental and ethical issues
a) Discuss the ways in which stakeholder groups operate and how they effect an organisation and its strategy formulation and implementation.
b) Discuss the ethical issues that may impact on strategy formulation and business performance.
c) Discuss the ways in which stakeholder groups may influence business performance.
B EXTERNAL INFLUENCES ON ORGANISATIONAL PERFORMANCE
1. Changing business environment
a) Assess the continuing effectiveness of traditional management accounting techniques within a rapidly changing business environment.
b) Evaluate how risk and uncertainty play an important role in long term strategic planning and decision-making that relies upon forecasts of exogenous variables.
2. Impact of external factors on strategy and performance
a) Discuss the need to consider the environment in which an organisation is operating when assessing its performance, including:
i) Political climate
ii) Market conditions
iii) Funding
b) Assess the impact of governmental regulations and policies on performance measurement techniques used and the performance levels

Paper P5: Advanced performance management
x © Emile Woolf Publishing Limited
achieved (for example, in the case of utility services and former state monopolies).
C PERFORMANCE MEASUREMENT SYSTEMS AND DESIGN
1. Performance management information systems
a) Identify the accounting information requirements and describe the different types of information systems used for strategic planning, management control and operational control and decision-making.
b) Discuss, with reference to performance management, ways in which the information requirements of a management structure are affected by the features of the structure.
c) Evaluate the compatibility of the objectives of management accounting and management accounting information.
d) Discuss the integration of management accounting information within an overall information system, for example the use of enterprise resource planning systems.
e) Evaluate whether the management information systems are lean and value of the information that they provide.
f) Define and discuss the merits of, and potential problems with, open and closed systems with regard to the needs of performance management.
g) Highlight the ways in which contingent (internal and external) factors influence management accounting and its design and use.
h) Advise how anticipated human behaviour will influence the design of a management accounting system.
i) Discuss the impact of responsibility accounting on information requirements.
2. Sources of management information
a) Identify and discuss the principal internal and external sources of management accounting information.
b) Demonstrate how these principal sources of management information might be used for control purposes.
c) Identify and discuss the direct data capture and process costs of management accounting information.
d) Identify and discuss the indirect costs of producing information.
e) Discuss the limitations of using externally generated information.
f) Demonstrate how the information might be used in planning and controlling activities e.g. benchmarking against similar activities.
g) Discuss those factors that need to be considered when determining the capacity and development potential of a system.

Syllabus and study guide
© Emile Woolf Publishing Limited xi
3. Recording and processing methods
a) Demonstrate how the type of business entity will influence the recording and processing methods.
b) Discuss how IT developments e.g. unified corporate databases and network technology may influence management accounting systems.
c) Discuss the difficulties associated with recording and processing data of a qualitative nature.
4. Management reports
a) Discuss the principal controls required in generating and distributing internal information.
b) Discuss the procedures that may be necessary to ensure security of highly confidential information that is not for external consumption.
c) Evaluate the output reports of an information system in the light of best practice and avoiding the problem of information overload.
D STRATEGIC PERFORMANCE MEASUREMENT
1. Performance hierarchy
a) Discuss how the purpose, structure and content of a mission statement impacts on business performance.
b) Discuss the ways in which high-level corporate performance objectives are developed.
c) Identify strategic objectives and discuss how they may be incorporated into the business plan.
d) Discuss how strategic objectives are cascaded down the organisation via the formulation of subsidiary performance objectives.
e) Discuss social and ethical obligations that should be considered in the pursuit of corporate performance objectives.
f) Explain the performance ‘planning gap’ and evaluate alternative strategies to fill that gap.
g) Apply critical success factor analysis in developing performance metrics from business objectives.
h) Identify and discuss the characteristics of operational performance.
i) Discuss the relative significance of planning as against controlling activities at different levels in the performance hierarchy.
2. Strategic performance measures in private sector
a) Demonstrate why the primary objective of financial performance should be primarily concerned with the benefits to shareholders.
b) Justify the crucial objectives of survival and business growth.
c) Discuss the appropriateness of, and apply different measures of performance, including:

Paper P5: Advanced performance management
xii © Emile Woolf Publishing Limited
i) Return on Capital Employed (ROCE)
ii) Return on Investment (ROI)
iii) Earnings Per Share (EPS)
iv) Earnings Before Interest, Tax, Depreciation and Amortisation (EBITDA)
v) Residual Income (RI)
vi) Net Present value (NPV)
vii) Internal rate of return and modified internal Rate of Return (IRR, MIRR)
d) Discuss why indicators of liquidity and gearing need to considered in conjunction with profitability.
e) Compare and contrast short and long run financial performance and the resulting management issues.
f) Explore the traditional relationship between profits and share value with the long-term profit expectations of the stock market and recent financial performance of new technology companies.
g) Assess the relative financial performance of the organisation compared to appropriate benchmarks.
h) Discuss and apply Six Sigma measures of performance.
3. Divisional performance and transfer pricing issues
a) Describe, compute and evaluate performance measures relevant in a divisionalised organisation structure including ROI, RI and Economic value added (EVA).
b) Discuss the need for separate measures in respect of managerial and divisional performance.
c) Discuss the circumstances in which a transfer pricing policy may be needed and discuss the necessary criteria for its design.
d) Demonstrate and evaluate the use of alternative bases for transfer pricing.
e) Explain and demonstrate issues that require consideration when setting transfer prices in multinational companies.
4. Strategic performance measures in not-for-profit organisations
a) Highlight and discuss the potential for diversity in objectives depending on organisation type.
b) Discuss the need to achieve objectives with limited funds that may not be controllable.
c) Identify and discuss ways in which performance may be judged in not-for profit organisations.
d) Discuss the difficulties in measuring outputs when performance is not judged in terms of money or an easily quantifiable objective.
e) Discuss how the combination of politics and the desire to measure public sector performance may result in undesirable service outcomes.

Syllabus and study guide
© Emile Woolf Publishing Limited xiii
f) Assess ‘value for money’ service provision as a measure of performance in not-for-profit organisations and the public sector.
5. Non-financial performance indicators
a) Discuss the interaction of non-financial performance indicators with financial performance indicators.
b) Discuss the implications of the growing emphasis on non-financial performance indicators.
c) Discuss the significance of non-financial performance indicators in relation to employees.
d) Identify and discuss the significance of non-financial performance indicators in relation to product/service quality e.g. customer satisfaction reports, repeat business ratings, customer loyalty, access and availability.
e) Discuss the difficulties in interpreting data on qualitative issues.
f) Discuss the significance of brand awareness and company profile and their potential impact on business performance.
6. The role of quality in management information and performance measurement systems
a) Discuss and evaluate the application of Japanese business practices and management accounting techniques, including:
i) Kaizen costing,
ii) Target costing,
iii) Just-in-time, and
iv) Total Quality Management.
b) Discriminate between quality, quality assurance, quality control and quality management.
c) Assess the relationship of quality management to the performance management strategy of an organisation.
d) Advise on the structure and benefits of quality management systems and quality certification.
e) Justify the need and assess the characteristics of quality in management information systems
7. Performance measurement and strategic Human Resource Management issues
a) Explain how the effective recruitment, management and motivation of people is necessary for enabling strategic and operational success.
b) Discuss the judgemental and developmental roles of assessment and appraisal and their role in improving business performance.
c) Advise on the relationship of performance management to performance measurement (performance rating) and determine the implications of performance measurement to quality initiatives and process redesign.

Paper P5: Advanced performance management
xiv © Emile Woolf Publishing Limited
8. Performance measurement and the reward systems
a) Explore the meaning and scope of reward systems.
b) Discuss and evaluate different methods of reward practices.
c) Explore the principles and difficulty of aligning reward practices with strategy.
d) Advise on the relationship of reward management to quality initiatives, process re-design and harnessing of e-business opportunities.
e) Assess the potential beneficial and adverse consequences of linking reward schemes to performance measurement, for example, how it can affect the risk appetite of employees.
9 Other behaviour aspects of performance measurement
a) Discuss the accountability issues that might arise from performance measurement systems.
b) Evaluate the ways in which performance measurements systems may send the wrong signals and result in undesirable business consequences.
c) Demonstrate how management style needs to be considered when designing an effective performance measurement system.
E PERFORMANCE EVALUATION AND CORPORATE FAILURE
1. Alternative views of performance measurement and management
a) Evaluate the ‘balanced scorecard’ approach as a way in which to improve the range and linkage between performance measures.
b) Evaluate the ‘performance pyramid’ as a way in which to link strategy, operations and performance.
c) Evaluate the work of Fitzgerald and Moon that considers performance measurement in business services using building blocks for dimensions, standards and rewards.
d) Discuss and apply the Performance Prism.
e) Discuss and evaluate the application of activity-based management.
f) Evaluate and apply the value-based management approaches to performance management.
2. Strategic performance issues in complex business structures
a) Evaluate the use and the application of strategic models in assessing the business performance of an entity, such as Ansoff, Boston Consulting Group and Porter.
b) Discuss the problems encountered in planning, controlling and measuring performance levels, e.g. productivity, profitability, quality and service levels, in complex business structures.

Syllabus and study guide
© Emile Woolf Publishing Limited xv
c) Discuss the impact on performance management of the use of business models involving strategic alliances, joint ventures and complex supply chain structures.
3. Predicting and preventing corporate failure
a) Assess the potential likelihood of corporate failure, utilising quantitative and qualitative performance measures.
b) Assess and critique quantitative and qualitative corporate failure prediction models.
c) Identify and discuss performance improvement strategies that may be adopted in order to prevent corporate failure.
d) Discuss how long-term survival necessitates consideration of life-cycle issues.
e) dentify and discuss operational changes to performance management systems required to implement the performance improvement strategies.
F. CURRENT DEVELOPMENTS AND EMERGING ISSUES IN PERFORMANCE MANAGEMENT
1. Current developments in management accounting techniques
a) Discuss the ways through which management accounting practitioners are made aware of new techniques and how they evaluate them.
b) Discuss, evaluate and apply environmental management accounting.
c) Discuss the use of benchmarking in public sector performance (league tables) and its effects on operational and strategic management and client behaviour.
d) Discuss the issues surrounding the use of targets in public sector organisations.
2. Current issues and trends in performance management
a) Assess the changing role of the management accountant in today’s business environment as outlined by Burns and Scapens.
b) Discuss contemporary issues in performance management.
c) Discuss how changing organisation’s structure, culture and strategy will influence the adoption of new performance measurement methods and techniques.

Paper P5: Advanced performance management
xvi © Emile Woolf Publishing Limited

© Emile Woolf Publishing Limited xvii
Paper P5 Advanced performance management
t
DCF tablesPresent value table
Present value of 1 i.e. n)r1( −+ where r = discount rate, n = number of periods until payment
Periods Discount rate (r)
(n) 1% 2% 3% 4% 5% 6% 7% 8% 9% 10% 1 2 3 4 5
0.990 0.980 0.971 0.961 0.951
0.980 0.961 0.942 0.924 0.906
0.971 0.943 0.915 0.888 0.863
0.962 0.925 0.889 0.855 0.822
0.952 0.907 0.864 0.823 0.784
0.943 0.890 0.840 0.792 0.747
0.935 0.873 0.816 0.763 0.713
0.926 0.857 0.794 0.735 0.681
0.917 0.842 0.772 0.708 0.650
0.909 0.826 0.751 0.683 0.621
1 2 3 4 5
6 7 8 9
10
0.942 0.933 0.923 0.914 0.905
0.888 0.871 0.853 0.837 0.820
0.837 0.813 0.789 0.766 0.744
0.790 0.760 0.731 0.703 0.676
0.746 0.711 0.677 0.645 0.614
0.705 0.665 0.627 0.592 0.558
0.666 0.623 0.582 0.544 0.508
0.630 0.583 0.540 0.500 0.463
0.596 0.547 0.502 0.460 0.422
0.564 0.513 0.467 0.424 0.386
6 7 8 9
10 11 12 13 14 15
0.896 0.887 0.879 0.870 0.861
0.804 0.788 0.773 0.758 0.743
0.722 0.701 0.681 0.661 0.642
0.650 0.625 0.601 0.577 0.555
0.585 0.557 0.530 0.505 0.481
0.527 0.497 0.469 0.442 0.417
0.475 0.444 0.415 0.388 0.362
0.429 0.397 0.368 0.340 0.315
0.388 0.356 0.326 0.299 0.275
0.350 0.319 0.290 0.263 0.239
11 12 13 14 15
(n) 11% 12% 13% 14% 15% 16% 17% 18% 19% 20% 1 2 3 4 5
0.901 0.812 0.731 0.659 0.593
0.893 0.797 0.712 0.636 0.567
0.885 0.783 0.693 0.613 0.543
0.877 0.769 0.675 0.592 0.519
0.870 0.756 0.658 0.572 0.497
0.862 0.743 0.641 0.552 0.476
0.855 0.731 0.624 0.534 0.456
0.847 0.718 0.609 0.516 0.437
0.840 0.706 0.593 0.499 0.419
0.833 0.694 0.579 0.482 0.402
1 2 3 4 5
6 7 8 9
10
0.535 0.482 0.434 0.391 0.352
0.507 0.452 0.404 0.361 0.322
0.480 0.425 0.376 0.333 0.295
0.456 0.400 0.351 0.308 0.270
0.432 0.376 0.327 0.284 0.247
0.410 0.354 0.305 0.263 0.227
0.390 0.333 0.285 0.243 0.208
0.370 0.314 0.266 0.225 0.191
0.352 0.296 0.249 0.209 0.176
0.335 0.279 0.233 0.194 0.162
6 7 8 9
10 11 12 13 14 15
0.317 0.286 0.258 0.232 0.209
0.287 0.257 0.229 0.205 0.183
0.261 0.231 0.204 0.181 0.160
0.237 0.208 0.182 0.160 0.140
0.215 0.187 0.163 0.141 0.123
0.195 0.168 0.145 0.125 0.108
0.178 0.152 0.130 0.111 0.095
0.162 0.137 0.116 0.099 0.084
0.148 0.124 0.104 0.088 0.074
0.135 0.112 0.093 0.078 0.065
11 12 13 14 15

Paper P5: Advanced performance management
xviii © Emile Woolf Publishing Limited
Annuity table
Present value of an annuity of 1 i.e. ( )
rr11 n−+−
where r = discount rate, n = number of periods
Periods Discount rate (r)
(n) 1% 2% 3% 4% 5% 6% 7% 8% 9% 10% 1 2 3 4 5
0.990 1.970 2.941 3.902 4.853
0.980 1.942 2.884 3.808 4.713
0.971 1.913 20829 3.717 4.580
0.962 1.886 2.775 3.630 4.452
0.952 1.859 2.723 3.546 4.329
0.943 1.833 2.673 3.465 4.212
0.935 1.808 2.624 3.387 4.100
0.926 1.783 2.577 3.312 3.993
0.917 1.759 2.531 3.240 3.890
0.909 1.736 2.487 3.170 3.791
1 2 3 4 5
6 7 8 9
10
5.795 6.728 7.652 8.566 9.471
5.601 6.472 7.325 8.162 8.983
5.417 6.230 7.020 7.786 8.530
5.242 6.002 6.733 7.435 8.111
5.076 5.786 6.463 7.108 7.722
4.917 5.582 6.210 6.802 7.360
4.767 5.389 5.971 6.515 7.024
4.623 5.206 5.747 6.247 6.710
4.486 5.033 5.535 5.995 6.418
4.355 4.868 5.335 5.759 6.145
6 7 8 9
10 11 12 13 14 15
10.37 11.26 12.13 13.00 13.87
9.787 10.58 11.35 12.11 12.85
9.253 9.954 10.63 11.30 11.94
8.760 9.385 9.986 10.56 11.12
8.306 8.863 9.394 9.899 10.38
7.887 8.384 8.853 9.295 9.712
7.499 7.943 8.358 8.745 9.108
7.139 7.536 7.904 8.244 8.559
6.805 7.161 7.487 7.786 8.061
6.495 6.814 7.103 7.367 7.606
11 12 13 14 15
(n) 11% 12% 13% 14% 15% 16% 17% 18% 19% 20% 1 2 3 4 5
0.901 1.713 2.444 3.102 3.696
0.893 1.690 2.402 3.037 3.605
0.885 1.668 2.361 2.974 3.517
0.877 1.647 2.322 2.914 3.433
0.870 1.626 2.283 2.855 3.352
0.862 1.605 2.246 2.798 3.274
0.855 1.585 2.210 2.743 3.199
0.847 1.566 2.174 2.690 3.127
0.840 1.547 2.140 2.639 3.058
0.833 1.528 2.106 2.589 2.991
1 2 3 4 5
6 7 8 9
10
4.231 4.712 5.146 5.537 5.889
4.111 4.564 4.968 5.328 5.650
3.998 4.423 4.799 5.132 5.426
3.889 4.288 4.639 4.946 5.216
3.784 4.160 4.487 4.772 5.019
3.685 4.039 4.344 4.607 4.833
3.589 3.922 4.207 4.451 4.659
3.498 3.812 4.078 4.303 4.494
3.410 3.706 3.954 4.163 4.339
3.326 3.605 3.837 4.031 4.192
6 7 8 9
10 11 12 13 14 15
6.207 6.492 6.750 6.982 7.191
5.938 6.194 6.424 6.628 6.811
5.687 5.918 6.122 6.302 6.462
5.453 5.660 5.842 6.002 6.142
5.234 5.421 5.583 5.724 5.847
5.029 5.197 5.342 5.468 5.575
4.836 4.988 5.118 5.229 5.324
4.656 4.793 4.910 5.008 5.092
4.486 4.611 4.715 4.802 4.876
4.327 4.439 4.533 4.611 4.675
11 12 13 14 15

© Emile Woolf Publishing Limited 1
Paper P5 Advanced performance management
CH
AP
TER
1
Strategic management accounting
Contents
1 Strategic management accounting
2 Introduction to strategic planning and control
3 Strategic objectives
4 Levels of management and management information
5 Strategic management accounting and multi-nationals
6 The effect of IT on management accounting
7 Stakeholders and ethical considerations

Paper P5: Advanced performance measurement
2 © Emile Woolf Publishing Limited
Strategic management accounting
Introduction
The nature of strategic management accounting
1 Strategic management accounting
1.1 Introduction
The purpose of management accounting is to provide relevant and reliable information so that managers can make well-informed decisions. The value of management accounting depends on the quality of the information provided, and whether it helps managers to make better decisions.
Management accounting is often associated with long-established methods of costing and financial reporting, such as absorption costing, standard costing, variance analysis and budgetary control reports.
These traditional methods might be adequate for operational decisions but do not provide useful information for the formulation of strategy particularly if the business environment that is continually changing.
The differences between planning at strategic and operational levels is summarised in the following table:
Strategic management Operational management
Mainly a longer-term focus Short-term focus: day-to-day operational issues.
Feedback may be occasional Regular feedback about performance
Broad ‘higher level’ issues, such as acquisitions and disposals, as well as the development of internal resources. Approach to measuring performance:
Where are we? Where do we want to be? How do we get there? What are the risks?
Control actions based on routine information and concerned with the current use of resources and improving the efficiency and effectiveness of resources, and with cost control.
Largely external in focus Mainly internal focus
Forward looking Backward looking Non-routine issues Concerned with detailed plans and
controls
The criticisms of traditional management accounting methods will be considered in more detail in a later chapter.

Chapter 1: Strategic management accounting
© Emile Woolf Publishing Limited 3
4.2 The nature of strategic management accounting
Strategic management accounting provides managers with information that is relevant to making and monitoring strategic decisions. It provides information:
about longer-term strategic issues, as well as the shorter term
of a non-financial nature as well as financial information
obtained from external as well as internal sources
about the business environment as well as internal operations
that recognises the significance of change and the need to anticipate major changes in the business environment
where the focus is on being competitive and succeeding in a competitive market environment.
about strategic objectives
customer satisfaction and adding value
product life cycle
internal and external analysis: SWOT analysis
benchmarking.
risk and uncertainty
Strategic management accounting techniques
Advanced cost accounting:
JIT based systems
activity based management and activity based costing;
backflush accounting;
throughput accounting;
Strategic management accounting:
life cycle costing;
target costing;
environmental management accounting; and
balanced scorecard
quality costing
environmental costing

Paper P5: Advanced performance measurement
4 © Emile Woolf Publishing Limited
Introduction to strategic planning and control
Levels of strategic planning
Definition of strategic planning and control
Advantages of formal strategic planning
Strategic planning process
Performance management systems
Linking performance measurement to strategy
2 Introduction to strategic planning and control This paper is about performance management and not just about performance measurement. Measurement is a component of management. In this paper you are required to do more than simply apply measures. In addition you might be required to review measures in place and suggest alternatives when weaknesses are identified. This review would be in the context of the strategy of the organisation and how the performance management system was working to help achieve the corporate objectives.
2.1 Levels of strategic planning
Planning is a hierarchical activity, linking strategic planning at the top with detailed operational planning at the bottom. Strategic plans set a framework and guidelines within which more detailed plans, and shorter-term planning decisions, can be made. R N Anthony identified three levels of planning: within an organisation:
Strategic planning. This involves identifying the objectives of the entity, and plans for achieving those objectives, mostly over the longer term. Strategic plans include corporate strategy plans, business strategy plans and functional strategy plans.
Tactical planning. These are shorter-term plans for achieving medium-term objectives. An example of tactical planning is the annual budget. Budgets and other tactical plans can be seen as steps towards the achievement of longer-term strategic objectives.
Operational planning. This is detailed planning of activities, often at a supervisor level or junior management level, for the achievement of short-term goals and targets. For example, a supervisor might divide the workload between several employees in order to complete all the work before the end of the day.
2.2 Definition of strategic planning and control
‘Strategic planning and control’ within an entity is the continuous process of:
identifying the goals and objectives of the entity
planning strategies that will enable these goals and objectives to be achieved
setting targets for each strategic objective (performance targets)

Chapter 1: Strategic management accounting
© Emile Woolf Publishing Limited 5
converting strategies into shorter-term operational plans
implementing the strategy
monitoring actual performance (performance measurement and review)
taking control measures where appropriate when actual performance is below the target.
Other aspects of strategic planning and control are:
re-assessing plans and strategies when circumstances in the business environment change
where necessary, changing strategies and plans.
2.3 Advantages of formal strategic planning
Companies often have a formal strategic planning process, because a formal system of planning:
clarifies objectives
helps management to make strategic decisions. Strategic planning forces managers to think about the future: companies are unlikely to survive unless they plan ahead
establishes targets for achievement
co-ordinates objectives and targets throughout the organisation, from the mission statement and strategic objectives at the top of a hierarchy of objectives, down to operational targets
provides a system for checking progress towards the objectives.
However, planning must also be flexible. Plans and targets might need to change in response to changes in the business environment, for example, a new initiative by a rival company.
Changes in strategic plans
Strategic plans often cover a period of several years, typically five years or longer. They are prepared on the basis of the best information available at the time, using assumptions about the nature of the business environment – competitive conditions, market conditions, available technology, the economic, social and political climate, and so on.
However, the business environment can change very quickly, in unexpected ways. Changes can create new threats to a company, or they can create new business opportunities. Whenever changes occur, a company should be able to respond – taking measures to deal with new threats, or to exploit new opportunities.
The response of a company to changes in its environment could mean having to develop new strategies and abandon old ones. When changes are made, the original strategic plan will no longer be entirely valid, although large parts of it might be unaffected.
Strategic planning in practice is therefore often a mixture of:
formal planning, and
developing new strategies and making new plans whenever significant changes occur in its business environment.

Paper P5: Advanced performance measurement
6 © Emile Woolf Publishing Limited
Responding to unexpected changes by doing something that is not in the formal plan is sometimes called ‘freewheeling opportunism’. It means making unplanned decisions, to take advantages of opportunities as they arise, or to deal with unexpected threats.
2.4 Strategic planning process
Different methods and approaches may be used to develop strategic plans.
A basic approach to strategic planning is shown in the following diagram.
Mission and objectives
STRATEGIC ANALYSIS
Position audit
Corporate appraisal
Environmental analysis
Basis of strategy
Strategic direction STRATEGIC CHOICE
Strategic method
Evaluation of strategic
options
Review and control Strategic
implementation
Mission and objectives
The entity exists for a purpose, which may be expressed formally in a mission statement.
The entity must develop clear objectives, such as the maximisation of shareholder wealth. These objectives should be consistent with the mission statement. Targets can be established for the achievement of objectives within the planning period.
Objectives should take into account the interest and power of stakeholders. Stakeholder mapping is a useful tool in this regard.

Chapter 1: Strategic management accounting
© Emile Woolf Publishing Limited 7
Strategic analysis
Environmental analysis
Environmental analysis involves an analysis of developments outside the organisation that are already affecting the organisation or could affect the organisation in the future. These are external factors that might affect the achievement of objectives and strategy selection. An external analysis might consider:
the political situation in each country where it has operating subsidiaries
changes in the law, and how these affect the organisation
changes in economic conditions
social factors and cultural factors, such as an increasing average age in the population
technology changes: the development of the internet and e-commerce, for example, have had enormous consequences for business within the past few years
the competitive environment, such as the entry of a new competitor into the market, or the ‘globalisation’ of the market.
An external analysis should identify opportunities and threats that face the organisation. Strategies might be developed to exploit opportunities or take counter-measures to deal with threats.
Models that might be used include:
PESTEL analysis
Porter’s 5 forces
Risk analysis
These are covered in more detail later.
Position audit
Internal analysis looks at the strengths and weaknesses within the organisation – its products, existing customers, management, employees, technical skills and ‘know-how’, its operational systems and procedures, its reputation for quality, the quality of its suppliers, its liquidity and cash flows, and so on.
Strategies should seek to make full use of any strengths within the entity and to reduce or remove significant weaknesses.
Models that might be used include:
Ms (Men, Management, Money, Make-up, Machinery, Methods, Markets, Materials, Management information)
Financial analysis
Benchmarking
Product life cycle
Boston consulting grid

Paper P5: Advanced performance measurement
8 © Emile Woolf Publishing Limited
Value chain analysis
Stakeholder mapping
Some of these are covered in more detail later.
Corporate appraisal
SWOT analysis
The mission statement and objectives of the entity, together with the results from the environmental analysis and position audit, should lead on to a formal appraisal of strategy and what the entity might be capable of achieving.
SWOT analysis is the analysis of the strengths and weaknesses of an organisation, and the opportunities and threats in its environment. This method of strategic analysis is often used by organisations as a starting point for strategic planning.
Strategic management accounting can assist with SWOT analysis by trying to put costs or benefits to particular strengths, weaknesses, opportunities and threats, so that strategic managers are able to assess their importance.
SWOT analysis is explained in more detail later.
Gap analysis
A strategic plan should set out the ways in which an organisation intends to achieve its objectives. One way of doing this is to prepare a forecast of what is likely to happen if the company carries on with its current plans and policies, and does not take any new strategic initiatives.
Gap analysis involves:
identifying the corporate objectives for the organisation, and what strategic management wants the organisation to achieve each year over the planning period
comparing these strategic targets with the expected actual results, if there are no changes in strategy and no new planning initiatives.
The gap is the difference between these two and is known as is a planning gap. (Gap analysis is sometimes described as an analysis of the difference between ‘Where we are’ and ‘Where we want to be’.)
Company objectives
(e.g. annual profits)
Time
Desired position
Planning horizon
Position if no action is taken

Chapter 1: Strategic management accounting
© Emile Woolf Publishing Limited 9
Strategies should be developed to close the gap, so that expected performance is in line with the strategic aims and objectives.
Strategic choice
There are choices to made in three areas
Basis of strategy
This is about how to compete. The work of Michael Porter is influential in this area.
According to Porter, a successful competitive strategy must be based on either:
cost leadership, or
differentiation.
Cost leadership means becoming the lowest-cost producer in the market. A company that can make products or provide services at a lower cost than competitors will succeed, by selling at lower prices and winning the biggest share of the market.
Differentiation means making products or services that are considered by customers to be different from those of competitors, and because they are different they are better. A company that is not the least-cost producer can therefore succeed by offering product or service that customers will pay a higher price (than the least-cost producer’s price) to obtain.
Either of these strategies might be pursued with a broad focus or in a niche market.
Strategic direction
This concerns which products should be sold to which markets. A useful model here is Ansoff’s Grid which is covered in more detail later. It identifies four possible alternatives:
Sell existing products in existing markets – Market penetration strategy.
Sell existing products in new markets – Market development strategy
Sell new products in existing markets – Product development strategy.
Sell new products in new markets – Diversification strategy.
Strategic method
This concerns the question of how to grow? Growth can be achieved through:
Internal growth (also called organic growth)
Acquisitions and mergers
Joint ventures or strategic alliances
Evaluation of strategic options
Strategies should be evaluated to decide whether they might be appropriate. Johnson and Scholes have suggested that strategies should be assessed for:
suitability;

Paper P5: Advanced performance measurement
10 © Emile Woolf Publishing Limited
feasibility;
acceptability
Suitability
A strategy must be suitable for achieving the strategic aims and requirements of the company. This must be must be assessed in terms of resources and competences.
A strategy must enable the company to take advantage of its core competences and unique resources, in order to gain competitive advantage
Suitability relates to the strategic logic and strategic fit of the strategy
The strategy must fit the company's operational circumstances and strategic position.
Key questions include does the strategy:
Exploit company strengths and distinctive competences?
Rectify company weaknesses?
Neutralise or deflect environmental threats?
Help the firm to seize opportunities?
Satisfy the goals of the organisation?
Fill the gap identified by gap analysis?
Generate/maintain competitive advantage?
Feasibility
Questions that might be asked to assess feasibility are:
Can we afford it?
Will we have the labour skills needed?
Can we achieve the necessary product quality?
Can we produce at the cost that will be necessary?
Do we have the marketing skills needed?
Can we obtain the raw materials needed?
Acceptability
A strategy must be acceptable to the key stakeholders affected by it. A strategy is inappropriate if it is unacceptable to any key stakeholders
Strategic implementation
The selected strategies should then be implemented.
The implementation of strategies should be monitored. Changes and adjustments should be made where these become necessary.
Areas of importance here are change management and project management. These are covered in more detail later

Chapter 1: Strategic management accounting
© Emile Woolf Publishing Limited 11
Review and control
This is a key area. An entity will have management information systems in place to monitor the progress of the business. These are particularly important to the introduction of a new strategy where timing and achievement of progress points might be vital to its success. This covered in more detail later.
2.5 Performance management systems
Performance management systems have a key role to play in many aspects pf strategic planning and are concerned with:
A system of performance management is concerned with the following:
setting targets for the achievement of the entity’s main strategic objective
setting targets for each strategy that is implemented for achieving the main strategic objective
setting targets at all levels of management within the entity: all planning targets (at all levels within the entity) should be consistent with the strategic targets and objectives
measuring actual performance
comparing actual performance with the targets
where appropriate, taking control measures
where appropriate, changing the targets.
In many organisations, performance measurement systems are also used in a system of incentives and rewards, and managers are given a reward (often a cash bonus) for achieving or exceeding one or more agreed performance targets.
Performance management is therefore concerned with planning and controlling, at all levels within an organisation.
2.6 Linking performance measurement to strategy
The measures of performance used throughout an organisation should be linked to the corporate strategy of the organisation, and should be consistent with corporate strategy. This means that there has to be consistency between performance measures at all levels in the organisation, from operating levels up. The performance measures that are used should focus on targets where success is a critical factor. The performance measures that are chosen should do the following:
Measure effectiveness – the effectiveness of processes, and the effectiveness of products and services in meeting customer needs
Measure efficiency – the use of resources within the organisation
Include ‘external’ measures from outside the organisation as well as internal measures
Be a mixture of financial and non-financial measurement, and qualitative and quantitative measurements

Paper P5: Advanced performance measurement
12 © Emile Woolf Publishing Limited
Focus on the long-term as well as the short-term
Be flexible so that the measures used are continually changed in response to a changing business environment
Recognise the trade-off between different measures of performance: for example, it is often necessary to make compromises to reach a suitable balance between short-term and long-term targets
Recognise the motivational effect that performance measurements can have on employee and management behaviour.

Chapter 1: Strategic management accounting
© Emile Woolf Publishing Limited 13
Strategic objectives
Performance measurement system?
Planning and corporate objectives
Management accounting and performance measurement
3 Strategic objectives The purpose of strategic planning and control is to help an entity to achieve its strategic objectives. It is normally assumed that the objective of a company is to provide a high return to its owners, the shareholders, consistent with the level of risk in the business. Not-for-profit entities also have strategic objectives, which relate to the purpose for which they exist. These objectives are non-financial in nature.
3.1 Planning and corporate objectives
Performance measurement is an integral part of a system of planning and control.
Planning targets clarify the objectives of the organisation. Corporate objectives are converted into planning targets. Similarly, the objectives of strategic plans are converted into planning targets. A target should be a clear statement of what an entity wants to achieve within a specified period of time. Planning targets are usually quantified, but may be expressed in qualitative terms.
Measurements of performance (target and actual) help to improve management’s understanding of processes and systems.
Planning targets are set at strategic, tactical and operational management levels. Using quantitative measures of performance makes it easier to set targets for managers and the organisation as a whole.
In a well-designed performance management system, all planning targets are consistent with each other, at the strategic, tactical and operational levels.
When the business environment is changing, a performance measurement system should provide for the continual re-assessment of planning targets, so that targets can be altered as necessary to meet the changing circumstances.
Actual performance, at the strategic, tactical and operational levels should be measured and monitored. Comparing actual performance with targets provides useful control information. Differences between actual performance and targets can be analysed, to establish the causes. Where appropriate, action can be taken to improve performance by dealing with the causes of the poor performance.
Performance measures also make it possible to compare the performance of different organisations or different divisions within the same organisation.
Performance measurement systems promote accountability of the organisation to its stakeholders.
A performance management system may be linked to a system of rewarding individuals for the successful achievement of planning targets.

Paper P5: Advanced performance measurement
14 © Emile Woolf Publishing Limited
3.2 The need for performance measurement
Every managed organisation needs a system of performance measurement.
Managers need to understand what they should be trying to achieve. A sense of purpose and direction is provided by plans (strategies, budgets, operational plans and so on), and for each plan there should be objectives and targets. Setting targets for achievement (performance targets) is an essential part of planning.
Managers also need to know whether they are successful. The information they need is provided by comparing:
- their actual results or performance with the performance target, and
- the performance target with the current forecast of what performance will be.
Targets, forecasts and actual performance should be measured, in order to compare them. Ideally measures of performance should be quantified values (financial or non-financial measures), because numerical measures of performance are easier to compare than non-quantified (‘qualitative’) measures.
The benefits of performance measurement systems
The advantages of having a formal system of performance measurement can be summarised as follows:
A well-structured system of performance measurement clarifies the objectives of the organisation, and shows how departments, work groups and individuals within the organisation contribute to the achievement of those objectives.
It establishes agreed measures of activity, based on key success factors.
It helps to provide a better understanding of the processes within the organisation, and what each should be trying to achieve.
It provides a system for comparing the performance of different organisations or departments.
The system establishes performance targets for the organisation’s managers, over a suitable time period for achievement.
3.3 Management accounting and performance measurement
Management accounting is an important element in performance measurement systems. Many performance targets are financial in nature, such as achieving targets for return on capital, profits and sales revenue and targets for keeping expenditure under control. However, a performance measurement system uses a wide range of targets at the strategic, tactical and operational level. Many of these are non-financial targets, and not all targets are quantifiable. Clearly, a comprehensive management accounting system should therefore provide information for setting targets and measuring actual performance at all levels. It should also provide non-financial information as well as financial information. If a management accounting system cannot provide all this information to management, managers will have to rely on other information systems in addition

Chapter 1: Strategic management accounting
© Emile Woolf Publishing Limited 15
to the management accounting system. An entity might then have several different information systems, which is probably inefficient and less effective than a fully co-ordinated management information system.

Paper P5: Advanced performance measurement
16 © Emile Woolf Publishing Limited
Levels of management and management information
Levels of management
Potential conflict between strategic plans and short-term decisions
4 Levels of management and management information In ‘traditionally-structured’ large organisations, there is a hierarchy of managers, from senior management down to junior managers and supervisors. The responsibilities of managers vary according to their position in the management hierarchy. Even in small organisations, the nature of management activities can be analysed into different levels.
4.1 Levels of management
A common approach to analysing levels of management and management decision-making is to identify three levels:
strategic management
tactical management
operational management.
Strategic management
Strategic management is concerned with:
deciding on the objectives and strategies for the organisation
making or approving long-term plans for the achievement of strategic targets
monitoring actual results, to check whether these are in line with strategic targets
where appropriate, taking control action to bring actual performance back into line with strategic targets
reviewing and amending strategies.
A strategy is a plan for the achievement of a long-term objective. The main objective of a profit-making entity may be to maximise the wealth of its owners. Several strategies are selected for the achievement of this main objective, and each individual strategy might have its own specific objective. Strategic planning is often concerned with developing products and markets and for long-term investment. For example, a company seeking to increase its profits by 10% a year for the next five years might select the following strategies:
Marketing strategy: to expand into markets in other countries (with specific countries selected as planning targets for each year of the plan)
Innovation strategy: to invest in research and development (with a target to launch, say, two new products on the market each year for the next five years)

Chapter 1: Strategic management accounting
© Emile Woolf Publishing Limited 17
Investment strategy: to invest in new technology (with a target, say, of replacing all existing equipment with new technology within the next five years).
Tactical management
Tactical management is associated with the efficient and effective use of an organisation’s resources, and the control over expenditure. In a large organisation, tactical managers are the ‘middle managers’. Tactical management is concerned with implementation and control of medium-term plans, within the guidelines of the organisation’s strategic plans. For example, budgeting and budgetary control are largely tactical management responsibilities.
Operational management
Operational management is the management of day-to-day operating activities. It is usually associated with operational managers and supervisors. At an operational level, managers need to make sure on a day-to-day basis that they have the resources they need and that those resources are being used efficiently. It includes scheduling of operations and monitoring output, such as daily efficiency levels. There isn’t a clear dividing line between tactical management and operational management, but essentially the differences are a matter of detail. Tactical management may be concerned with the performance of an entire department during a one-week period, whereas operational management may be concerned with the activities of individuals or small work groups on a daily basis.

Paper P5: Advanced performance measurement
18 © Emile Woolf Publishing Limited
4.3 Potential conflict between strategic plans and short-term decisions
Problems may occur in any organisation, but especially large organisations with a large number of managers, when ‘local’ operational managers take decisions that are inconsistent with long-term strategic objectives.
There a several reasons why this might happen.
‘Local’ managers might be rewarded for achieving short-term planning targets, such as keeping actual expenditure within the budget limit. However, although there is a short-term benefit, there might be longer-term damage. For example, a local manager might decide to cut the training budget for his staff in order to reduce costs, but in the long-term the future success of the company might depend on having well-trained and skilled employees.
‘Local’ managers might fail to buy into the plan because they believe it to be unfair.
‘Local’ managers might be unaware of the strategic plans and objectives, due to poor communication within the entity.
In any system of performance management, especially in systems where managers are rewarded for achieving planning targets, it is important to make sure that the short-term planning targets are consistent with longer-term strategic objectives.

Chapter 1: Strategic management accounting
© Emile Woolf Publishing Limited 19
Strategic management accounting and multi-nationals
Global competition
Multinational organisations and global organisations
Strategic management accounting issues
5 Strategic management accounting and multi-nationals
5.1 Global competition
Many business entities have expanded beyond their national markets and operate in foreign markets. The reasons for this are many and varied but include:
Cost reduction opportunities due to economies of scale.
Few growth opportunities in domestic markets
Extension of product life by selling into new markets
Convergence of markets so that a standard product can be sold in many countries.
Emergence of new markets
Avoidance of currency risk by setting up operations in other countries to supply those countries.
5.2 Corporate strategies for international business
Large companies have developed strategies for growing their business operations internationally. When an entity starts to sell its products in foreign markets for the first time, it will probably think of the foreign market as an extension of its domestic market. It will not change its product design for the foreign markets, and will sell an identical product in all the countries where it operates. The product will be manufactured in the entity’s domestic country, and exported to the foreign markets. However, as an entity becomes more committed to its foreign markets, and as foreign sales increase, the situation changes. The entity will start to recognise differences between the different foreign markets. Customers in each different market will have slightly different needs and preferences. The entity might therefore alter its products to suit the needs of each local market. As a result, total sales will increase. However, profits will fall. This is because the cost of adapting products to local market needs is high.

Paper P5: Advanced performance measurement
20 © Emile Woolf Publishing Limited
5.3 Multinational organisations and global organisations
Companies that operate in different countries and many different national markets are called either multinational companies (MNCs) or global companies. Often, the two terms are used with the same meaning. However, a difference can be identified between MNCs and global companies according to their differences in corporate strategy.
An international company is a company with all or most of its production operations in a single country. Most of its senior managers are nationals of the country. The company sells its products in different companies, through local sales agents or local sales offices in each country, or using international sales representatives.
A global company is a company with operations in a large number of different countries, making a similar range of products or providing a similar range of services. Its senior managers are nationals of a variety of different countries.
When companies expand their business outside their ‘home country’, they will usually begin as an international company, but may eventually develop into a global company.
Multinational company Global company
Management make strategic decisions for each foreign market individually.
Management develop worldwide strategies for all their markets.
Products are adapted and designed to the requirements of the local market.
The company produces core products. These are standardised for all markets, with only minimal design changes for individual national markets.
Marketing (for example, advertising) is adapted in each country to suit the local culture.
There is a uniform approach to marketing in all countries, with only small variations.
Countries are selected as a target for production and sales entirely on the basis of their potential for profitability.
Countries are selected for their ability to contribute to the integrated global strategy.
The aim is to optimise the value chain in each country of operation.
The value chain is broken up, and different parts of the value chain are in different countries. The aim is to optimise the value chain globally.
A multinational company often has the culture of the country where its head office is based (for example, the US).
A global company develops a global culture. Its senior managers are likely to come from different countries.
As international competition becomes more intense, and as IT systems and communication systems develop, companies are continually looking for new strategies and new forms of organisation structure to support those strategies.
Production systems, marketing systems and other operations have been made more flexible.
Lean manufacturing systems have been developed with the aim of improving quality and reducing costs. Lean manufacturing systems, and the search for economies of scale, are benefits that can be obtained from a global organisation of business operations.
However to deal with uncertainty and volatility in local markets, corporations need to change their organisation structures from vertical bureaucracies to decentralised organisations with team-based management, and greater

Chapter 1: Strategic management accounting
© Emile Woolf Publishing Limited 21
management responsibility at the local market level. These local operating units become the focus of strategy development for the entity as a whole.
Bartlett and Ghosal suggested that the way in which an international company is organised and structured depends on two factors:
the benefits obtainable from global organisation, and
the need for local (national) operations to respond to the demands of the local market, and so the need for ‘local independence’.
Benefits from global co-ordination
Low High
Need for local independence and responsiveness
Low International divisions
Global product companies
High
International subsidiaries
Transnational corporations
1. International divisions. International divisions are headed by senior
management (mainly from the home country) located in head office in the home country.
2 International subsidiaries. These are locally-established subsidiaries that
respond more to the needs of the local market. Each subsidiary develops its product variations and local strategies. This type of organisation is vulnerable to competition as global competition intensifies.
3 Global product companies. The company sells a standard product globally,
with benefits from economies of scale. Differences in customer needs between local markets are ignored. This type of company might become vulnerable to competition from companies that respond more successfully to the needs of local markets.
4 Transnational corporations. Companies that are organised as an integrated
network of interdependent resources, on a global scale. As international business develops, more companies are becoming transnational.
5.4 Strategic management accounting issues
Senior managers need information for planning, control and decision making. Overseas expansion adds other dimensions to the strategic management process and this must be supported with information.
The decision to invest overseas must be consistent with the strategic objectives of the organisation.
Strategic analysis is more complex. There are further environmental issues and new risks to consider:
Political risk

Paper P5: Advanced performance measurement
22 © Emile Woolf Publishing Limited
Cultural risk
Currency risk
Funding risk
The strategic evaluation will need to take into account the views and power of more stakeholders. The company may not have any experience with these groups.
Any new project will need to be managed carefully in an environment with which the company may have little experience.
Once overseas operations are established they will need to be controlled. The company will need to establish performance targets and measures which might differ from the domestic country. The establishment of transfer prices between countries will have an impact on these performance measures.

Chapter 1: Strategic management accounting
© Emile Woolf Publishing Limited 23
The effect of IT on management accounting
IT systems and management accounting
IT systems for providers of services
IT systems and competitive advantage
6 The effect of IT on management accounting
6.1 IT systems and management accounting
Management accounting systems are information systems, and the development of information technology (IT) continues to have a significant impact on management accounting and on:
collecting data
storing data and information: (Note: data is unprocessed, whereas information is data that has been processed into something that has meaning or purpose)
the ability to process data into valuable information
access to information
communication of information.
In many traditional management accounting systems, data was input to the computer system by specialist staff. There was often a high rate of input errors, and data validation checks were included in the software to reduce the error rate. In many systems, the process of collecting data and input to a computer system was fairly slow. Many modern IT systems provide for automatic input of data by non-finance operating staff, often with minimal risk of errors. One example is the automatic input of sales data and inventory data at check-out points in stores and supermarkets, using bar codes and automatic bar code readers. Information is available about sales and reductions in inventory at the exact moment that the items are being sold. IT systems also provide for access to external sources of data and information. External data can be obtained from the Internet, either:
free of charge, for example, from the web sites of government departments and public news agencies, or
through subscription (payments to an external information provider).
Another significant feature of many IT systems is instant access to information. Information might be held on a central database, and accessible to all authorised personnel through a network connection. Instant access means that managers do not have to wait for information to come to them, for example in routine reports. They can search for and obtain the information they want at any time.

Paper P5: Advanced performance measurement
24 © Emile Woolf Publishing Limited
A wide range of complex data analysis can be performed with computer software. Many managers can use models for planning and forecasting, including the application of sensitivity analysis to plans and forecasts.
6.2 IT systems for providers of services
For companies that provide services (rather than manufacturing goods), IT systems can make substantial improvements in the quality of service provision. A key feature of many services is the contact between a representative of the company (the service provider) and the customer. This may be face-to-face contact, or contact by telephone or even e-mail or text message.
IT systems can improve the quality of service in a number of different ways.
The service provider has instant access to the customer’s files or to other key information. Instant access means that a customer’s requests can be dealt with immediately. This makes it possible, for example, to sell and renew insurance policies by telephone.
In some cases, the customer is given the opportunity to take control over his own service provision. For example, customers can book seats on air flights and at theatres using the Internet and the service provider’s web site.
Some services can be provided through IT systems. For example, customers can download media items (music and film) through the Internet.
Immediate service provision, made possible by IT systems, is likely to increase customer satisfaction with the service. The Internet often makes it possible for customers to compare the products or services of different suppliers, and to make an informed choice about which supplier to buy from. It may therefore be important for companies to provide extensive information to customers on their web site, to help them make their purchase decisions.
6.3 IT systems and competitive advantage
IT systems may be able to give one business a strategic advantage (competitive advantage) over its rivals. The efficiency of IT systems can improve the quality of administration, production and service to customers – and so provide better value for customers, for example by reducing costs or providing a faster service.
‘Bespoke’ IT systems, written for the specific requirements of a particular entity, may provide competitive advantage because of their uniqueness.
Purchased software (‘off the shelf’) is unlikely to provide competitive advantage because it is available to anyone.
Even if an IT system does not provide a competitive advantage, however, a business may need to have efficient systems to avoid being at a competitive disadvantage. A business needs to invest in IT to keep up with what rivals are doing.
Significantly, IT systems can create a competitive advantage by providing management with better information. In this respect, a well-designed management accounting system will provide a competitive advantage.

Chapter 1: Strategic management accounting
© Emile Woolf Publishing Limited 25
Management should keep their IT systems under continual review, and:
be aware of new developments in IT systems and new opportunities for exploiting IT
review existing systems to ensure that they are of a high quality and are operating effectively and efficiently
monitor the use of IT systems by competitors, and be prepared to respond to any initiatives in IT that competitors introduce.
Quality in software
An entity should seek to have good quality in its IT systems and system software. The following factors may be used by management to assess the ‘quality’ of new ‘bespoke’ software systems.
Ideally, new software systems that have been written and developed for an entity should be error-free. It is difficult to avoid all errors in new systems, in spite of testing, but errors can be major or minor. Quality software should be free from major errors and the number of minor errors should be very low.
The software itself and also the procedures and processes used for its development and testing (and documentation) should meet the international quality standards (ISO Standards) for IT.
The software must meet the specifications agreed with the ‘customer’.
The software should be delivered on time.
The software should be capable of being updated, and not necessarily by the original developers of the software. This is one of the reasons why using ISO Standards is so important.

Paper P5: Advanced performance measurement
26 © Emile Woolf Publishing Limited
Stakeholders and ethical considerations
Stakeholder groups
Ethics and ethical codes
The problems with ethical codes
Ethical issues
Corporate social responsibility (CSR)
7 Stakeholders and ethical considerations
7.1 Stakeholder groups
A stakeholder in an entity is a person who has an interest in what the entity does and how it performs. In a company, the main stakeholders are the equity shareholders, who have a direct interest in the profitability of the company, the dividends that it pays and the share price. There are other stakeholders. The influence of these stakeholders on strategic planning and performance will vary between different entities. Some stakeholder groups are more influential than others. Stakeholder groups include:
Employees, whose interests are jobs, job security, pay, working conditions, and so on.
Suppliers, whose interests are maintaining a continuing profitable business relationship.
Customers, whose interest arises because they buy goods or services from the company.
The government, whose interests include revenues from taxation and the effect of company actions on employment (or unemployment), consumer interests and economic growth.
Pressure groups. Some companies are strongly influenced by consumer groups and other pressure groups. In the UK for example, there are pressure groups for the protection of the environment, animal rights activists, groups opposed to genetically-modified foods, and so on.
Although the main objective of a company might be to increase the wealth of shareholders, strategy might also be influenced by the demands and expectations of other stakeholders.
Senior management might agree to improve pay and working conditions for employees, even though this will affect profitability.
A company might choose to develop long-term strategic relationships with key suppliers, even though this might result in higher material costs in the short term.
Companies might sometimes be forced to agree to the demands of pressure groups, in order to avoid damage to their reputation and a loss of customer loyalty.

Chapter 1: Strategic management accounting
© Emile Woolf Publishing Limited 27
7.2 Ethics and ethical codes
Companies should comply with the law. Many companies go further and state that they will act in an ethical way. In practice, there are limits to ethical behaviour by companies.
Companies exist to create wealth for the shareholders. Their main purpose – in spite of the corporate mission – is not a social or moral purpose.
The ethics of doing business are different from the ethics of normal social behaviour. Businesses compete with each other, and many decisions are taken for commercial reasons, regardless of their effect. For example, companies will close down loss-making operations, regardless of the impact on the employees who are made redundant.
Acting ethically, for a business entity, probably means:
acting fairly towards employees
dealing honestly with suppliers and customers
avoiding lies in communications with employees, customers, suppliers and government
acting within the law.
Ethical behaviour might also cover issues such as:
sexual harassment
bribery.
However, acceptable standards of behaviour appear to vary between countries and industries. In some industries, such as the sale of weapons, bribery appears to be common practice as a method of winning major orders. For the same reason that companies might try to act on a socially responsible way, many companies will try to act ethically.
Codes of ethics
Many public companies have a published code of ethics.
The New York Stock Exchange rules require companies whose shares it trades to have a publicly-displayed code of business conduct and ethics.
In the UK, 90% of the top UK companies have a code of ethics.
7.3 The problems with ethical codes
The main problem with ethical codes is that they are often not observed.
Enron, the collapsed US corporation, had an ethical code but the board of directors chose to over-rule it.
Many companies do not give their employees training in the code of ethics, so that employees are not even aware that it exists.

Paper P5: Advanced performance measurement
28 © Emile Woolf Publishing Limited
The difficulty for a board of directors is that if there is a ‘scandal’ involving unethical behaviour, there will be damage to its reputation. A ‘knee jerk ‘response after a scandal has happened is unlikely to be an effective way of dealing with the problem. To have an effective ethical code:
senior management must believe in it
senior management must give the lead in acting ethically, and
employees must be made aware of the code and its provisions.
7.4 Ethical issues
Ethical issues can affect the choice of strategy and business performance in two basic ways.
Senior management might promote a culture of ethical behaviour, and expect all its employees to act in an ethical manner. An entity will never behave in an ethical way unless senior management give the lead. This is often referred to as the ‘tone at the top’.
Unethical behaviour might damage a company’s reputation, with the result that the company suffers a loss of customers and falling sales demand. Employees might also prefer to work for an ethical organisation than for an organisation with a reputation for unethical behaviour.
There are several aspects to ethical behaviour.
For individuals, ethical business behaviour means dealing honestly and in an open manner with other people.
For companies and other organisations, ethical behaviour can mean:
- acting fairly as an employer and showing concern for the welfare of employees
- contributing to the well-being of society, for example, providing financial support to local communities
- refusing to deal with suppliers who use slave labour or child labour
- showing concern for the environment and ‘sustainable business’.
It might be argued that ethical behaviour can have an effect on business performance. There are two sides to this argument:
Ethical behaviour might improve the reputation of a company and make customers more willing to buy goods from it (and make employees more willing to work for it).
On the other hand, ethical behaviour might have a cost, in terms of higher employee costs, higher purchase costs from suppliers, higher expenditures on measures to protect the environment from pollution, and so on.

Chapter 1: Strategic management accounting
© Emile Woolf Publishing Limited 29
7.5 Corporate social responsibility (CSR)
Corporate social responsibility (CSR) is concerned with companies acting in a socially responsible way. ‘While there is no single commonly-accepted definition of corporate social responsibility or CSR, it generally refers to business decision-making linked to ethical values, compliance with legal requirements, and respect for people, communities and the environment’ (Business for Social Responsibility).
The CSR issues that affect companies vary according to the nature of the company and the circumstances in which it operates. However, there are five broad areas where CSR might be relevant. Business in the Community, a voluntary group of UK companies, has set out five principles of socially responsible corporate behaviour, relating to each if these five areas:
to treat employees fairly and with respect
to operate in an ethical way and with integrity
to respect human rights
to sustain the environment for future generations
to be a responsible neighbour in the community.
There are several reasons why companies might choose to act – or at least claim to act – in a socially-responsible way.
They might want to act voluntarily in order to avoid legislation. For example, companies in many countries face the possibility of further laws against deforestation, excessive fishing and excessive pollution of the environment.
They might want to act in an ethical and socially-responsible way because the company has an ethical culture.
They might want to respond to pressure from shareholders. Some institutional shareholders have a policy of investing only in socially-responsible and ethical companies.
To protect their reputation.
Reputation risk
The risk to a company’s reputation from adverse publicity about social and environmental factors is always difficult to assess. However, many companies are aware that adverse publicity can have a damaging effect on customer goodwill - and sales and profits. Companies that have been at risk include:
companies accused of buying from suppliers in developing countries that use child labour or slave labour
companies accused of polluting the environment
companies in the food and drugs industries accused of selling dangerous food products or dangerous drugs.
Some major companies have given the responsibility for reputation risk to a member of the board of directors, recognising that adverse publicity could be damaging for the company.
Many companies, particularly those whose customers are the general public (consumers) or governments, might need to consider CSR as a strategic issue when evaluating their strategic options.

Paper P5: Advanced performance measurement
30 © Emile Woolf Publishing Limited

© Emile Woolf Publishing Limited 31
Paper P5 Advanced performance management
CH
AP
TER
2
Strategic planning techniques
Contents
1 SWOT analysis
2 Benchmarking

Paper P5: Advanced performance management
32 © Emile Woolf Publishing Limited
SWOT analysis
The nature of SWOT analysis
Strengths and weaknesses
Threats and opportunities
Preparing a SWOT analysis
Strategic management accounting and SWOT analysis
1 SWOT analysis
1.1 The nature of SWOT analysis
SWOT analysis is a technique used in strategic planning for identifying key factors that might affect business strategy. These factors are both internal to the company and external, in its environment. SWOT analysis can be used in the strategic planning process to analyse the company’s capabilities and core competencies (or lack of them) and also to carry out an environmental analysis.
SWOT analysis is an analysis of strengths, weaknesses, opportunities and threats.
S – Strengths. Strengths are internal strengths that come from the resources of the entity.
W – Weaknesses. Weaknesses are internal weaknesses in the resources of the entity.
O – Opportunities. Opportunities are factors in the external environment that might be exploited, to the entity’s strategic advantage.
T – Threats. Threats are factors in the external environment that create an adverse risk for the entity’s future prospects.
Strengths and weaknesses are concerned with the internal capabilities and core competencies of an entity. Threats and opportunities are concerned with factors and developments in the environment.
In order to prepare a SWOT analysis, it is necessary to:
analyse the internal resources of the entity, and try to identify strong points and weak points
analyse the external environment, and try to identify opportunities and threats.
1.2 Strengths and weaknesses
Strengths and weaknesses relate to factors within the entity, such as the strength and weaknesses of its processes and systems, its resources, its management and its track record of success or failure in the past.
Senior management in a company might have their own opinion of the strengths and weaknesses of the company, but a management information system should be able to provide measured and reliable information about strengths or weaknesses.

Chapter 2: Strategic planning techniques
© Emile Woolf Publishing Limited 33
The table below contains examples of activities, processes and resources where there might be strengths or weaknesses that could have strategic significance.
Products and brands Strength of the brand name Quality of products (or services) The portfolio of products, assessed in terms of (1) stages in their life cycle, or (2) a Boston Consulting Group portfolio analysis Profitability and return on capital Contribution to cash flow
Research and development Number of innovations Success rate for new innovations Speed of innovation: speed in responding to new products of competitors Costs
Marketing Abilities of the sales force Success in the past in selling products Efficiency of ‘channels of distribution’ – making the product available to customers Network of intermediaries – retail stores, agents or distributors Market size Market share Numbers of regular customers Customer service operations
Distribution/delivery Location of distribution centres Cost of distribution Fleet of delivery vehicles
Finance Availability of long-term capital Availability of short-term funding (cash) Profitability Operational cash flows Return on investment Credit control, collection of receivables, bad debts
Assets (buildings, equipment) Type and value of assets Quality of assets Production capacity Location of assets
Employees and managers Skills and experience Training Loyalty Motivation Industrial relations
Organisation and management Centralised/decentralised management Management style Information systems
Suppliers and inventory Relationship with key suppliers Storage capacity for inventory Speed of inventory turnover

Paper P5: Advanced performance management
34 © Emile Woolf Publishing Limited
1.3 Threats and opportunities
An information system should provide information to management about threats and opportunities in the environment. The sources of this information are outside the entity itself. There might be a wide range of information sources, such as official publications, newspaper reports, government statistics, physical observation of competitors and customers, and discussions with suppliers.
The nature of threat and opportunities in the environment can be classified into several broad groups. One method of classification is known as PESTEL:
Political threats and opportunities Government regulations, for example, towards giving permission for new business developments and construction projects. Government policy, for example towards government spending programmes. Consequences of a change of government.
Economic threats and opportunities
Economic change: rate of economic growth or recession Exchange rates Interest rates Anti-monopoly regulations Rate of inflation Taxation
Social threats and opportunities Social change: for example changes in the age distribution of the population Cultural change: for example, changes in leisure activities Movements in the population
Technological threats and opportunities
Any technological or scientific development
Environmental threats and opportunities
Cost and availability of forms of energy Pollution Preservation of the environment: sustainable business
Legal threats and opportunities New laws Decisions by a court of law
1.4 Preparing a SWOT analysis
A SWOT analysis might be presented as four lists, in a cruciform chart, as follows: (Illustrative items have been inserted, for a small company producing pharmaceuticals).
Strengths
Extensive research knowledge
Highly-skilled scientists in the work force
High investment in advanced equipment
Patents on six products
High profit margins
Weaknesses
Slow progress with research projects
Poor record of converting research projects into new product development
Recent increase in labour turnover

Chapter 2: Strategic planning techniques
© Emile Woolf Publishing Limited 35
Opportunities
Strong growth in total market demand
New scientific discoveries have not yet been fully exploited
Threats
Recent merger of two major competitors
Risk of stricter regulation of new products
In order to prepare a SWOT analysis, it is necessary to:
analyse the internal resources of the entity, and try to identify strong points and weak points
analyse the external environment, and try to identify opportunities and threats.
1.5 Strategic management accounting and SWOT analysis
Management accounting systems should be able to support SWOT analysis by management, by providing relevant information. Much of this information can be quantified.
In the example above of the pharmaceuticals company, it should be possible to provide quantified data about items such as:
time to complete research projects
percentage of research projects that move on to a development phase
amount invested in capital equipment
labour turnover rates (compared to average labour turnover in the industry)
profit margins
growth in total market demand and annual sales.

Paper P5: Advanced performance management
36 © Emile Woolf Publishing Limited
Benchmarking
The purpose of benchmarking
The potential benefits of benchmarking
Methods of benchmarking
Internal benchmarking: league tables
Competitive benchmarking
Process benchmarking
Customer benchmarking
Strategic benchmarking
Functional benchmarking
Product benchmarking (reverse engineering)
Requirements for successful benchmarking
Problems with benchmarking
2 Benchmarking
2.1 The purpose of benchmarking
Benchmarking is a process of setting standards or targets for products, services or work processes with reference to organisations that are recognised as models of ‘best practice’. A benchmark is an organisation that provides the ‘best practice’ for comparison. An entity uses benchmarking to evaluate its own products, services or work processes by comparing them with the ‘best practice’ of the benchmark organisation. The purpose of benchmarking is to identify measures that need to be taken to improve or change, so that the organisation becomes as good as, or better than, the benchmark.
Definition of benchmarking
‘Benchmarking is the continuous process of measuring products, services and practices against the toughest competitors or the companies recognised as industry leaders (“best in class”)’ (The Xerox Company).
The benchmarking process
Benchmarking should be a continuous process, and it usually consists of the following stages:
Identify aspects of performance that should be compared with a ‘benchmark partner’.
Select a suitable benchmark (a ‘benchmark partner’).
Compare the product, service or process with the benchmark.

Chapter 2: Strategic planning techniques
© Emile Woolf Publishing Limited 37
Identify gaps in performance between the benchmark and the entity’s own product, service or process.
Identify changes that can be made to improve performance.
Implement the improvements.
Monitor the success of the changes in improving performance, and measure the benefits.
2.2 The potential benefits of benchmarking
Benchmarking can offer several benefits.
It can be used to identify aspects of performance that are weak, where improvements are necessary.
It can be used to set targets for improvement that are realistic and practicable.
It can be used to look at practices in companies in different industries, and to learn from them.
It encourages continuous improvement: benchmarking encourages managers and employees to make improvements, and to believe that changes are necessary.
2.3 Methods of benchmarking
There are several methods of benchmarking:
internal benchmarking
competitive benchmarking
process benchmarking
customer benchmarking.
Benchmarking can also be grouped into the following categories:
strategic benchmarking
functional benchmarking
‘best practices’ benchmarking (process benchmarking)
product benchmarking.
2.4 Internal benchmarking: league tables
Internal benchmarking uses a benchmark inside the organisation itself. Other parts of the same organisation are compared with the benchmark. For example, a company might have several regional or area offices. The best-performing regional office might be taken as a benchmark, and the other regional offices are compared with it. The benchmarking exercise should identify the reasons why each region has not performed as well as the benchmark. When the reasons for the worse performance are recognised, plans can be made to deal with the problems and achieve improvements.

Paper P5: Advanced performance management
38 © Emile Woolf Publishing Limited
League tables
One method of making internal benchmarking comparisons is to establish a league table. Points may be awarded for various aspects of performance, and for each profit centre or division a total points score is calculated, depending on how well or badly it has performed for each of the aspects.
A league table may then be published, with the ‘winners’ scoring the most points and the ‘losers’ at the bottom of the league table.
League tables may also be used within the not-for-profit sector. In the UK for example, state-owned schools are ranked within league tables, according to their relative success or failure in major national examinations.
The use of league tables is intended to encourage improvements in performance through competition – no division wants to be bottom of the table and many will want to be at the top.
In principle, each division is measured according to the same key or critical measures of performance, and the system should therefore be ‘fair’. However, many local’ factors will affect the performance of a particular division. In comparing the performance of schools, for example, much depends on the quality of the students, and it is unfair to compare the performance of a state school in a prosperous neighbourhood with the performance of a school in a ‘ghetto’ community.
A further problem is that divisional managers may be made responsible for aspects of performance that are outside their control, especially where the level of performance involves the co-operation between two or more divisions. It is unfair to assess the performance of a division on factors that ar outside the control of its management.
Finally, league tables (like other measures of performance) encourage ‘cheating’, such as trying to hide unfavourable data. Divisional managers may also take action to improve short-term performance even if this has adverse implications for longer-term results. The league tables may therefore become the main focus for management, instead of the actual performance levels that the league tables are trying to encourage.
2.5 Competitive benchmarking
Competitive benchmarking uses a successful competitor as the benchmark. A company compares its own products and systems with those of the competitor, and the purpose is to discover the reasons why the competitor is more successful. When the reasons are identified, plans can be made to improve competitiveness, either by copying what the competitor does, or devising new products or systems that are even better then those of the competitor. Comparing yourself with the main competitors makes good sense in a competitive business environment. A practical difficulty with competitive benchmarking, however, may be a lack of detailed information about the competitor.
It should be possible to fully analyse a competitor’s products – by buying them and looking at them in close detail.

Chapter 2: Strategic planning techniques
© Emile Woolf Publishing Limited 39
However, it may be more difficult to study a competitor’s systems and methods of operation in detail. For example, a competitor may have a superior system for handling customers’ calls, or a more efficient warehousing system, or a better order processing and despatch system. A rival company will not be allowed to examine these systems in detail.
Example In 1991, the Massachussetts Institute of Technology and J D Power and Associates published a survey of car manufacturing plants in Japan, the USA and Europe. Japanese car production was used as a benchmark, and the survey found that productivity was much higher in Japan (where the average time to produce a car was 16.2 man hours) than in Europe (where the average time to produce one car was 36.2 man hours). The survey analysed possible reasons for the superior performance of Japanese producers, and made comparisons of performance in the areas of training time for new employees, absenteeism and the number of defects per vehicle produced. The survey provided useful information for US and European car producers, but they had a huge gap to close before they could begin to compete effectively with their Japanese competitors.
Example Benchmarking began with the Xerox Corporation in the US in 1982. Xerox, a manufacturer of photocopier machines, was in financial difficulties and losing market share to Japanese competitors, who were selling high-quality photocopiers at a much lower price. Xerox set up a management team that:
identified key performance indicators for operations such as order fulfilment, distribution, production costs, retail selling prices and product features, and
compared the performance of Xerox in each of these areas against those of its most successful competitors.
Xerox used the findings of its benchmarking exercise to identify areas for improvement. Improvements were made, and as a result customer satisfaction improved, costs were cut and Xerox improved its competitive position in the market. Other companies followed the example of Xerox, and benchmarking became an established practice for performance measurement.
Problems with competitive benchmarking
There are several problems with benchmarking the performance of a business against its competitors. To benchmark effectively it is necessary to obtain meaningful and reliable comparative information about the performance of the competitor. Much of this information, particularly non-financial information, will be unavailable unless the

Paper P5: Advanced performance management
40 © Emile Woolf Publishing Limited
competitor is willing to provide it. If the competitor is a private company and is not required to publish detailed financial statements, comparative financial information may also be difficult to obtain. There is no reason why a competitor should agree to provide information, unless they too are interested in benchmarking and so would be willing to consider information sharing. The risk of handing over confidential information to a competitor company, or providing information that could give a competitor some marketing advantage, is likely to make any company unwilling to agree to such a scheme. There are some organisations that specialise in taking financial information from firms in the same industry, and providing ‘inter-firm comparisons’ for the participants, without giving away sensitive information about any individual company. However in practice most inter-firm comparison is carried out between quoted companies by stock market analysts. The cost of benchmarking might be quite high, and too large to justify the benefits to be obtained from a benchmarking system. To deal with this problem, it would be necessary to ensure that the system is kept fairly simple, and as much of the preparation of benchmarking comparisons as possible should be computerised. There may be problems with getting managers tp understand the purpose and benefits of inter-firm comparisons. When benchmarking comparisons are available, managers and other employees need to be told what they should do with it. The purpose and use of benchmarking information would therefore have to be explained clearly to staff, and systems put in place for the monitoring and use of the information obtained. There may be a risk that a benchmarking exercise with competitors, if practicable, will be used to criticise staff for performing ‘worse’ than competitors. Management must ensure that the system, if put in place, does not create a ‘culture of blame’ that is likely to make employees defensive and resentful.
Competitive benchmarking and competitor analysis
Competitive benchmarking is not the same as competitor analysis. Competitor analysis involves a comparison by a company of its own performance with the performance of its main rivals. A company might draw up a ‘league table’ consisting of itself and its competitors, with the best performer at the top of the table and the worst performer at the bottom. For example, in the UK, some of the major supermarket chains draw up a league table of prices, with the chain offering the cheapest prices at the top of the table and the chain with the highest-price food stores at the bottom.
However, this is not benchmarking. Benchmarking is used to identify differences, and then to develop new ways of doing things, in order to make improvements in performance. The aim should be to make improvements that make the company better than its competitors, rather than improvements than help the company to close the gap with its competitors.

Chapter 2: Strategic planning techniques
© Emile Woolf Publishing Limited 41
2.6 Process benchmarking
Process benchmarking is the most common method of benchmarking. It involves a comparison of the performance of the entity in one particular activity or process with the performance of another entity in a different industry. This type of benchmarking seeks to identify best practice anywhere, by looking at organisations with a reputation for excellence.
The purpose of process benchmarking is to use a benchmarking approach to analyse operational systems, such as purchasing, call handling (by call centres), order processing, delivery systems, information systems, and so on.
An organisation compares its own practices in an aspect of its operations with those of a benchmark organisation that is in an unrelated industry (and so is not a competitor). For example, a company may compare its warehousing and distribution systems with a benchmark organisation, its customer call centre operations or its IT system maintenance arrangements.
A process benchmarking programme is agreed between two organisations, which then share information about their systems and compare their performance. Each organisation is able to use the benchmarking process to review its system and procedures, and look for ways of improving their performance. Benchmarking can be used as an approach to improving quality – in products, services and systems. Comparisons with the ‘best’ can provide ideas:
for copying the benchmark organisation, or
for doing something in a different way, not necessarily in exactly the same way as the benchmark organisation
Example The Xerox Company wanted to improve its performance in dealing with customer orders. It identified Bean, a catalogue retailer specialising in outdoor clothing, as a benchmark for excellence in this area. The two organisations, Xerox and Bean, collaborated with each other in comparing their systems, exchanging information. Xerox management studied the order fulfilment process at Bean and used its findings to improve its own systems. Process benchmarking can be very effective in helping a company to gain a competitive advantage over its rivals. ‘Benchmarking … is not a method for copying the best practices of competitors, but a way of seeking superior process performance outside the industry. Benchmarking makes it possible to gain competitive superiority rather than competitive parity.’
2.7 Customer benchmarking
Customer benchmarking is a completely different approach. This uses the customer as a benchmark, by trying to establish what the customer wants and expects. A company can compare what a customer wants with what the company actually provides. Gaps can be identified between customer expectations and ‘reality’, and the company can then look for ways to close the gap.

Paper P5: Advanced performance management
42 © Emile Woolf Publishing Limited
2.8 Strategic benchmarking
Strategic benchmarking involves a comparison of the strategies of different companies. A company can compare its own strategies with those of its most successful competitor, or with the strategies of successful companies in other industries. Strategic benchmarking usually involves a comparison with the most successful competitor. A company will use benchmarking to find out why the competitor is more successful. A starting point for the comparison is usually a survey of customers and shared suppliers, to find out what the competitor does better. Aspects of strategy that might be considered include:
strategic objectives
core competencies
process capability
products
strategic alliances
the use of technology.
2.9 Functional benchmarking
Functional benchmarking is a form of competitor benchmarking. It involves a comparison of performance of a core business function in the company with the performance of the same function in a successful competitor. For example, functional benchmarking might involve a comparison of:
the sales and marketing function
the research and development function.
The aim should be to find out why the competitor appears to perform this function more successfully, in order to identify changes and improvements that should be made. Process benchmarking compares processes in more detail.
2.10 Product benchmarking (reverse engineering)
Product benchmarking, also called reverse engineering, is a form of competitor benchmarking. It involves a comparison of an entity’s products with the products manufactured by its main competitors. The comparison will usually look at:
the competitor’s costs
product concepts
strengths and weaknesses in product design and quality.

Chapter 2: Strategic planning techniques
© Emile Woolf Publishing Limited 43
This product analysis will usually involve obtaining some products of the competitor and analysing them in the workshop or laboratory.
2.11 Requirements for successful benchmarking
There are several requirements for benchmarking to be effective as a way of improving competitiveness.
It is important to select key aspects of performance for benchmarking. These are the aspects of performance that have to be successful (and improved) in order to gain a competitive advantage over rivals.
It must be a continuous process, not a ‘once only’ exercise. Competitors do not ‘stand still’, and successful competitors will continually innovate and improve. It is essential to keep repeating benchmarking exercises in order to avoid falling behind again as the business environment changes.
Benchmarking should be a method for becoming better than competitors, not just for closing the gap on competitors and ‘catching up’. The aim should be to achieve superior performance.
When benchmark partners are used for process benchmarking, the collaboration should be open and honest. A company should be prepared to give more information to its benchmark partner than it is hoping to obtain from the benchmark partner.
2.12 Problems with benchmarking
There are several problems that can make it difficult to use benchmarking successfully.
It might be difficult to identify a critical process where benchmarking could provide valuable information to help an entity improve its performance. Benchmarking might select processes that are not critical to performance. The value of any benefits achieved will therefore be small and insignificant.
It might be difficult to obtain reliable information for comparison with a benchmark. Even when a ‘benchmark partner’ is identified for process benchmarking, it could be difficult to get the ‘partner’ to agree to a benchmarking exercise and then to obtain the required information.

Paper P5: Advanced performance management
44 © Emile Woolf Publishing Limited

© Emile Woolf Publishing Limited 45
Paper P5 Advanced performance management
CH
AP
TER
3
Budgets and alternative budgeting models
Contents
1 Preparing budgets
2 Flexible budgets and rolling budgets
3 Zero based budgeting (ZBB) and activity based budgeting (ABB)
4 The behavioural aspects of budgeting
5 Beyond budgeting

Paper P5: Advanced performance management
46 © Emile Woolf Publishing Limited
Preparing budgets
The purpose of budgeting
Budgeting: planning and co-ordination
Budgetary control
1 Preparing budgets
1.1 The purpose of budgeting
A budget is a plan covering an entire organisation, and stated mainly in money values. Typically, a budget is prepared annually for the next financial year. However, capital expenditure budgets will cover a longer planning period, but may be reviewed and updated every year. There are several reasons for preparing budgets.
A budget is an (annual) plan for the entire organisation. Like other types of plan, it is used to set targets for achievement.
Since it is a plan for the entire organisation, a budget should co-ordinate the activities of everyone within the organisation, so that everyone works towards consistent goals.
It is used for control purposes. Actual results can be compared with the budget, and differences reported as variances.
It can be used to communicate information about plans and actual results, so that managers and other employees are aware of their expected and actual performance.
Budgets might be used to motivate individuals, particularly managers, by setting them targets for performance for the year and rewarding them if they achieve their targets. Rewards may take the form of a cash bonus at the end of the year. Alternatively, rewards may be given in the form of eventual promotion, or (for senior managers) the award of shares or share options in the company.
1.2 Budgeting: planning and co-ordination
Budgeting can be described as planning at the ‘tactical’ management level. As annual plans, they must be consistent with the longer-term strategic plans of the organisation. They can also provide a useful benchmark for setting shorter-term operational targets, such as monthly sales volumes and output volumes, efficiency targets, capacity utilisation targets, and so on. Budgets can also be an effective method of co-ordinating activities throughout an organisation, because:
targets for all activities are set within the budget, and the targets for all managers should therefore be consistent with each other

Chapter 3: Budgets and alternative budgeting models
© Emile Woolf Publishing Limited 47
as indicated above, budgets provide a co-ordinating link between longer-term strategic plans and shorter-term operational targets and plans.
These are the recognised strengths of ‘traditional’ budgeting systems.
1.3 Budgetary control
Budgets are used for control.
The budget may be divided into control periods, typically periods of one month. Actual results for a control period are then compared with the budget, and differences reported as variances. You should already be familiar with variance reporting from your earlier studies. Budgeting and variance reporting (and standard costing and variance reporting) are examples of a feedback control system.
- When actual results are worse than budget, there is an adverse variance. If the variance is significant, and the cause of the variance is controllable, the manager responsible may be expected to take control action to bring actual results back towards the budgeted performance level. Adverse variances are an example of negative feedback, where control action is needed to correct weaknesses or inefficiencies.
- When actual results are better than budget, there is a favourable variance. If the variance is significant, and the cause of the variance is controllable, the manager responsible may be expected to take control action to continue the favourable results in the future. Favourable variances are an example of positive feedback, where control action is expected to take actual results even further away from the budget or target.
Another method of control reporting is to prepare an up-to-date forecast of the results for the budget period. An up-to-date forecast is compared with the budget. The comparison may show that actual results for the year may be better or worse than originally budgeted. The control information provided by comparisons of current forecasts with the budget is an example of feedforward control.
A combination of feedback and feedforward control information can be used to keep management informed about performance.
An advantage of feedforward control is that it is forward-looking. Managers can act to alter future results, but cannot change what has already happened. Looking forward is therefore practical. However, up-to-date forecasts might not be entirely reliable, and when forecasts are uncertain or unreliable, the value of feedforward control information is limited.
An advantage of feedback information is that it uses historical information for comparison with the budget or standard costs. The differences between actual results and budget should therefore be a useful measurement of actual performance.
Variance analysis is not described in this chapter. It is assumed that you are sufficiently familiar with variances. It is most unlikely that you will be required to calculate any variances in your examination.
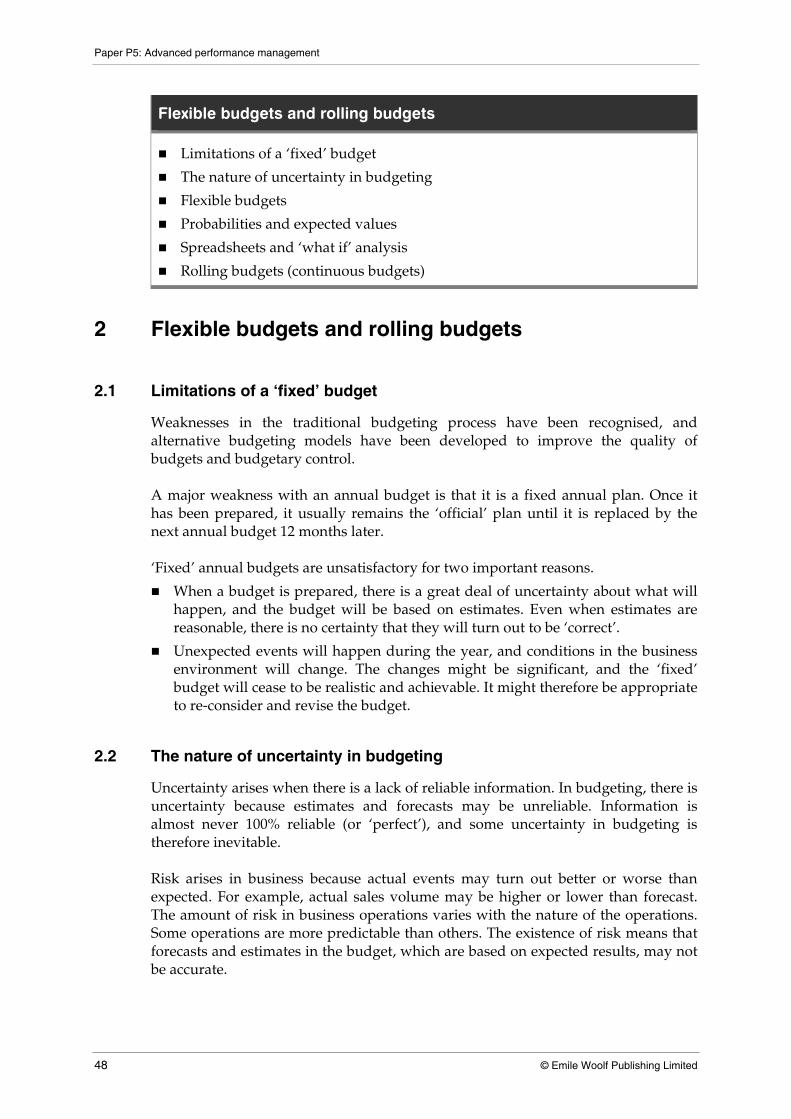
Paper P5: Advanced performance management
48 © Emile Woolf Publishing Limited
Flexible budgets and rolling budgets
Limitations of a ‘fixed’ budget
The nature of uncertainty in budgeting
Flexible budgets
Probabilities and expected values
Spreadsheets and ‘what if’ analysis
Rolling budgets (continuous budgets)
2 Flexible budgets and rolling budgets
2.1 Limitations of a ‘fixed’ budget
Weaknesses in the traditional budgeting process have been recognised, and alternative budgeting models have been developed to improve the quality of budgets and budgetary control. A major weakness with an annual budget is that it is a fixed annual plan. Once it has been prepared, it usually remains the ‘official’ plan until it is replaced by the next annual budget 12 months later. ‘Fixed’ annual budgets are unsatisfactory for two important reasons.
When a budget is prepared, there is a great deal of uncertainty about what will happen, and the budget will be based on estimates. Even when estimates are reasonable, there is no certainty that they will turn out to be ‘correct’.
Unexpected events will happen during the year, and conditions in the business environment will change. The changes might be significant, and the ‘fixed’ budget will cease to be realistic and achievable. It might therefore be appropriate to re-consider and revise the budget.
2.2 The nature of uncertainty in budgeting
Uncertainty arises when there is a lack of reliable information. In budgeting, there is uncertainty because estimates and forecasts may be unreliable. Information is almost never 100% reliable (or ‘perfect’), and some uncertainty in budgeting is therefore inevitable. Risk arises in business because actual events may turn out better or worse than expected. For example, actual sales volume may be higher or lower than forecast. The amount of risk in business operations varies with the nature of the operations. Some operations are more predictable than others. The existence of risk means that forecasts and estimates in the budget, which are based on expected results, may not be accurate.
Chapter 3: Budgets and alternative budgeting models
© Emile Woolf Publishing Limited 49
Both risk and uncertainty mean that estimates and forecasts in a budget are likely to be wrong. Management should be aware of risk and uncertainty when preparing budgets and when monitoring performance.
When preparing budgets, it may be appropriate to look at several different forecasts and estimates, to assess the possible variations that might occur. In other words, managers should think about how much better or how much worse actual results may be, compared with the budget.
When monitoring actual performance, managers should recognise that adverse or favourable variances might be caused by weaknesses in the original forecasts, rather than by good or bad performance.
Several approaches may be used for analysing risk and uncertainty in budgets. These include:
flexible budgets
using probabilities and expected values
using spreadsheet models and ‘what if’ analysis (sensitivity analysis)
stress testing.
2.3 Flexible budgets
Flexible budgets may be prepared during the budget-setting process. A flexible budget is a budget based on an assumption of a different volume of output and sales than the volume in the master budget or ‘fixed budget’. An organisation might prepare several flexible budgets in addition to the main budget (the master budget or fixed budget). If the actual level of activity differs significantly from the expected level, the fixed budget can be substituted by a suitable flexible budget. For example, a company might prepare its master budget on the basis of estimated sales of $100 million. Flexible budgets might be prepared on the basis that sales will be higher or lower – say $80 million, $90 million, $110 million and $120 million. Each flexible budget will be prepared on the basis of assumptions about fixed and variable costs, such as increases or decreases in fixed costs if sales rise above or fall below a certain amount, or changes in variable unit costs above a certain volume of sales. During the financial year covered by the budget, it may become apparent that actual sales and production volume will be higher or lower than the fixed budget forecast. In such an event, actual performance can be compared with a suitable flexible budget. Flexible budgets can be useful, because they allow for the possibility that actual activity levels may be higher or lower than forecast in the master budget. The main disadvantage of flexible budgets could be the time and effort needed to prepare

Paper P5: Advanced performance management
50 © Emile Woolf Publishing Limited
them. The cost of preparing them could exceed the benefits of having the information that they provide.
2.4 Probabilities and expected values
Estimates and forecasts in budgeting may be prepared using probabilities and expected values. An expected value is a weighted average value calculated with probabilities.
Example A company is preparing a sales budget. The budget planners believe that the volume of sales next year will depend on the state of the economy.
State of the economy Sales for the year
$ million No growth 40 Low growth 50 Higher growth 70
It has been estimated that there is a 60% probability of no growth, a 30% probability of low growth and a 10% probability of higher growth. The expected value (EV) of sales next year could be calculated as follows:
State of the economy Sales for the year Probability EV of sales
$ million $ million No growth 40 0.6 24 Low growth 50 0.3 15 Higher growth 70 0.1 7 EV of sales 46
The company might decide to prepare a sales budget on the assumption that annual sales will be $46 million.
The problems with using probabilities and expected values
There are two problems that might exist with the use of probabilities and expected values.
The estimates of probability might be subjective, and based on the judgement or opinion of a forecaster. Subjective probabilities might be no better than educated guesses. Probabilities should have a rational basis.
An expected value is most useful when it is a weighted average value for an outcome that will happen many times in the planning period. If the forecast event happens many times in the planning period, weighted average values are suitable for forecasting. However, if an outcome will only happen once, it is doubtful whether an expected value has much practical value for planning purposes.

Chapter 3: Budgets and alternative budgeting models
© Emile Woolf Publishing Limited 51
This point can be illustrated with the previous example of the EV of annual sales. The forecast is that sales will be $40 million (0.60 probability), $50 million (0.30 probability) or $70 million (0.10 probability). The EV of sales is $46 million.
The total annual sales for the year is an outcome that occurs only once. It is doubtful whether it would be appropriate to use $46 million as the budgeted sales for the year. A sales total of $46 million is not expected to happen.
It might be more appropriate to prepare a fixed budget on the basis that sales will be $40 million (the most likely outcome) and prepare flexible budgets for sales of $50 million and $70 million.
When the forecast outcome happens many times in the planning period, an EV might be appropriate. For example, suppose that the forecast of weekly sales of a product is as follows:
Weekly sales Probability EV of weekly sales
$ $ 7,000 0.5 3,500 9,000 0.3 2,700
12,000 0.2 2,400 8,600
Since there are 52 weeks in a year, it would be appropriate to assume that weekly sales will be a weighted average amount, or EV. The budget for annual sales would be (52 × $8,600) = $447,200. If the probability estimates are fairly reliable, this estimate of annual sales should be acceptable as the annual sales budget.
2.5 Spreadsheets and ‘what if’ analysis
Preparing budgets is largely a ‘number crunching’ exercise, involving large amounts of calculations. This aspect of budgeting was made much easier, simpler and quicker with IT and the development of computer-based models for budgeting. Spreadsheet models, or similar planning models, are now widely used to prepare budgets. A feature of computer-based budget models is that once the model has been constructed, it becomes a relatively simple process to prepare a budget. Values are input for the key variables, and the model produces a complete budget. Amendments to a budget can be made quickly. A new budget can be produced simply by changing the value of one or more input variables in the budget model. This ability to prepare new budgets quickly by changing a small number of values in the model also creates opportunities for sensitivity analysis and stress testing. The budget planner can test how the budget will be affected if forecasts and estimates are changed, by asking ‘what if’ questions. For example:
What if sales volume is 5% below the budget forecast?
What if the sales mix of products is different?
What if the introduction of the new production system or the new IT system is delayed by six months?

Paper P5: Advanced performance management
52 © Emile Woolf Publishing Limited
What if interest rates go up by 2% more than expected?
What if the fixed costs are 5% higher and variable costs per unit are 3% higher?
Sensitivity analysis and stress testing are similar.
Sensitivity analysis considers variations to estimates and input values in the budget model that have a reasonable likelihood of happening. For example, variable unit costs might be increased by 5% or sales forecasts reduced by 5%.
Stress testing considers the effect of much greater changes to the forecasts and estimates. For example, what might happen if sales are 20% less than expected? Or what might happen if the price of a key raw material increases by 50%?
The answers to ‘what if’ questions can help budget planners to understand more about the risk and uncertainty in the budget, and the extent to which actual results might differ from the expected outcome in the master budget. This can provide valuable information for risk management, and management can assess the ‘sensitivity’ of their budget to particular estimates and assumptions.
2.6 Rolling budgets (continuous budgets)
Some entities operate in a rapidly-changing environment. After preparing an annual budget, there may be changes in the business environment that soon make the budget irrelevant and out-of-date. For example, the rate of inflation may be much higher than expected, or a competitor might take action that changes conditions in the market. Social tastes and attitudes may change suddenly, affecting the sales demand for a company’s products. Unexpected and sudden changes affect budgets by making them irrelevant. Rolling budgets are a way of dealing with the problem. Rolling budgets, also called continuous budgets, are budgets covering a set period of time, such as one year, but prepared more frequently.
Example A company might prepare rolling annual budgets every three months. It will prepare four annual budgets each year. If its year-end is 31st December, its preparation of rolling budgets would be as follows:
Date of budget preparation Period covered by the budget
December Year 1 1st January – 31st December Year 2 March Year 2 1st April Year 2 – 31st March Year 3 June Year 2 1st July Year 2 – 30th June Year 3 September Year 2 1st October Year 2 – 30th September Year 3 December Year 2 1st January – 31st December Year 3 and so on

Chapter 3: Budgets and alternative budgeting models
© Emile Woolf Publishing Limited 53
The main advantages of rolling budgets are as follows:
Budgets are continually reviewed and revised in response to changes in business conditions. The entity is not committed to a fixed annual budget that is no longer relevant.
Control can be exercised through comparisons between current forecasts and strategic targets. This is a form of feedforward control. When the business environment is continually changing, this may be a more effective method of budgetary control than comparing actual results with the fixed budget or standard costs.
The main disadvantages of rolling budgets are as follows:
They can be time-consuming, and divert management attention from the task of managing actual operations.
Whenever a new rolling budget is prepared, the new plans must be communicated to all managers affected by the changes. There is a risk that some managers will not be informed about changes to plans and targets.

Paper P5: Advanced performance management
54 © Emile Woolf Publishing Limited
Zero based budgeting (ZBB) and activity based budgeting (ABB)
Incremental budgeting and zero based budgeting: a comparison
The framework for a ZBB system
Advantages of ZBB
Disadvantages of ZBB
ZBB and performance monitoring
Activity based budgeting (ABB)
3 Zero based budgeting and activity based budgeting (ABB)
3.1 Incremental budgeting and zero based budgeting: a comparison
Zero based budgeting (ZBB) is a method of preparing expenditure budgets that is an alternative to incremental budgeting.
Incremental budgeting
With incremental budgeting, the starting point for preparing the budget for next year’s expenditure is actual expenditure in the current year. Adjustments are then made to the current year’s expenditure, to allow for estimated inflation next year and also for known changes in expenditure (such as an increase or reduction in employee numbers next year, or higher or lower depreciation charges). Essentially, however, incremental budgeting means budgeting by adding extra amounts of expenditure onto the costs actually incurred in the financial year just ended. In many cases, there is inefficiency and excessive spending in the budget for the previous year. There is no incentive to identify inefficiency and reduce costs.
Zero based budgeting (ZBB)
Zero based budgeting was developed as a method of eliminating inefficiency and wasteful spending from the budget.
The zero based budgeting approach requires an expenditure budget to be built up from zero, so that all expenditure within the budget is properly considered and estimated.
Its aim is to eliminate wasteful allowances for spending from expenditure budgets. Spending is not provided for in the budget unless it has been justified.
ZBB is particularly appropriate for preparing overhead expenditure budgets. A problem arises with budgeting for overhead costs, whenever overhead spending levels cannot be related to particular activities (as in activity based costing) or to

Chapter 3: Budgets and alternative budgeting models
© Emile Woolf Publishing Limited 55
volumes of production output. The temptation is to budget for next year’s spending by assuming that spending next year will be much the same as in the current year, with perhaps an increase for inflation or a reduction for ‘cost control measures’. This is incremental budgeting.
3.2 The framework for a ZBB system
If an entity wishes to introduce ZBB, it must divide its operations into ‘decision units’. These may also be called budget cost centres. Each decision unit should have a manager who is responsible for the budget for the unit. A decision unit, for the purpose of ZBB, is an operating division for which ‘decision packages’ can be associated. Each decision unit starts with a budget allowance of zero. The manager of the decision unit must then justify every programme and every item of spending for inclusion in the budget for next year. Each of these programmes or items of spending is called a ‘decision package’.
A decision package is a program of activity that will achieve a specific purpose.
Each decision package must have a clearly-stated purpose that contributes to the goals and objectives of the entity.
An expenditure estimate must be prepared for each decision package.
For each decision package, the decision unit manager should:
identify the goal or objective of the programme
identify the activities that must be carried out to perform the programme
identify the resources required for the programme and their cost
explain how the programme will contribute to the goals of the entity as a whole.
For each decision package, the decision unit manager must:
justify the need for the decision package
consider what would be the consequences of eliminating the decision package
consider whether the decision package can be performed in a different way, more effectively or more efficiently.
Decision unit managers must therefore justify all their spending. As a result, the budget should eliminate wasteful spending (‘budget slack’) and spending that is no longer required due to changes in business conditions.
In preparing a zero based budget, each decision package is costed, and the budget planners must decide whether to accept the decision package for the budget, or whether to reject it. If a decision package is accepted, the cost estimate for the package goes into the budget.

Paper P5: Advanced performance management
56 © Emile Woolf Publishing Limited
Two types of decision package: ranking packages in order of priority
There are two types of decision package.
Decision packages for a minimum level of operation. For example, there may be a minimum acceptable level of training for a group of employees. There may be several alternative decision packages for providing the training – internal courses, external courses, or computer-based training programmes. An expenditure estimate should be prepared for each alternative basic decision package.
Incremental decision packages. These are programmes for conducting a more extensive operation than the minimum acceptable level. For example, there may be incremental decision packages for providing some employees with more training, or for having more extensive supervision, or more extensive quality control checks. For incremental decision packages, an estimate should be made of the cost of the incremental operation, and the expected benefits.
A zero based budget is then prepared as follows:
A decision must be taken to provide for a minimum level of operation. This means deciding for each basic operation:
- whether or not to perform the operation at all – do the benefits justify the costs?
- If the operation is performed at a basic level, which of the alternative basic decision packages should be selected?
Having decided on a basic level of operations, a basic expenditure budget can be prepared.
The next step is to consider each incremental decision package, and decide whether this additional operation, or additional level of operations, is justified. An incremental decision package is justified if the expected benefits exceed the estimated costs.
A budget can then be prepared consisting of all the selected basic decision packages and incremental decision packages.
If the total expenditure budget is too high when all these decision packages are included, some incremental decision packages should be eliminated from the budget. One method of doing this is to rank the incremental decision packages in an order of priority (typically in order of net expected benefits, which are the expected benefits minus the estimated incremental costs). The decision packages at the bottom of the priority list can then be eliminated from the budget, until total budgeted expenditure comes within the maximum permitted spending limit.
Extensive use of value judgements by managers will be needed to rank decision packages in a priority order. This is because the expected benefits from incremental activities or incremental programmes are often based on guesswork and opinion, or on forecasts that might be difficult to justify.

Chapter 3: Budgets and alternative budgeting models
© Emile Woolf Publishing Limited 57
3.3 Advantages of ZBB
The potential advantages of zero based budgeting, particularly when budgeting for overhead costs, are that:
all spending levels in the budget must be justified: wasteful spending (‘budget slack’) should be eliminated
all activities are reviewed and their value is assessed.
ZBB can be particularly useful in budgeting for ‘discretionary costs’. These are costs that an entity does not have to incur, but chooses to incur because the expected benefits exceed the expected costs. Managers of decision units are required to answer several key questions about their operational activities:
Does each decision package support the goals and objectives of the entity?
What would be the consequences for the entity if a decision package were to be eliminated?
Can the same operation be performed in a different way, and at less cost?
At what level of activity should each operation be conducted? Would it be appropriate to put in fewer resources, and conduct the operation at a lower level?
3.4 Disadvantages of ZBB
There are many difficulties and disadvantages with zero based budgeting.
A large effort is required to establish a framework for zero based budgeting. Decision units must be identified, and for each decision unit, there must be a system for identifying decision packages. This takes time and effort. Once established, the framework must be kept up to date.
Managers of decision units must spend much more time preparing budgets than they would with a traditional system of incremental budgeting.
An effective system of ZBB requires an excellent management accounting system that can help managers to identify the incremental costs and benefits of different decision packages.
Estimates, particularly estimates of the benefits of decision packages, are often based on the value judgements of managers.
ZBB might be seen as a threat, to cut back expenditure allowances in the next budget year.
When incremental decision packages are ranked in priority order, there may be disputes between managers of different decision units (budget cost centres), as each tries to protect his own spending levels and argue that budget cuts should fall on other cost centres.
ZBB can therefore be a very effective budgeting process for an occasional review of costs, as a cost-cutting exercise. However, it is not suitable as a regular budgeting system, because it would be too expensive and time-consuming.

Paper P5: Advanced performance management
58 © Emile Woolf Publishing Limited
In view of the large amount of management time that is required to prepare a zero based budget, an entity may decide to produce a zero based budget periodically, say every three years, and to prepare incremental budgets in the intervening years. In order to maintain the support of budget cost centre managers for a system of ZBB, it is also necessary to make sure that any system of performance-based rewards (such as annual bonuses for keeping spending within budget limits) is not affected by the use of ZBB. If managers feel that their rewards will be threatened – for example because it will be difficult to keep spending within the ZBB limits – they are unlikely to give their support to the ZBB system. Zero based budgeting techniques can be difficult to apply in practice. Decision unit managers will be expected to identify and evaluate each decision package, and then rank decision packages in order of priority. This calls for some skill and knowledge. When a company is introducing ZBB for the first time, or when a new manager is appointed, it is therefore advisable to provide suitable training in ZBB methods.
3.5 ZBB and performance monitoring
Within a system of zero based budgeting, actual performance should be monitored.
For each decision package, there should be a measurable performance target.
Actual results should be compared with this target.
Each decision package must therefore have one or more measurable performance objective. The package must specify the objective or objectives, and the activities or operations that will be required to achieve those objectives. Actual performance should be measured and compared with the objectives. Management must be informed whether or not the performance objectives are achieved.
3.6 Activity based budgeting (ABB)
Activity based budgeting (ABB) is similar in concept to activity based costing (ABC). When an entity uses activity based costing, it should be able to prepare activity based budgets. These are budgets prepared using activity based costing methods, and budgets for overheads are therefore prepared as activity costs. Total budgeted overhead costs for the budget period are the sum of:
overhead costs associated with specific activities, and
general overhead costs that are not associated with any specific activities.
Failure to analyse overhead costs accurately: activity-based budgeting
Another criticism of traditional budgeting is that overhead costs are not estimated with enough accuracy. It has often been assumed that overhead costs are mainly fixed costs. In reality, this might not be true.

Chapter 3: Budgets and alternative budgeting models
© Emile Woolf Publishing Limited 59
Overhead costs now make up a large proportion of total costs of many organisations. Since overhead costs are a substantial part of total costs, it would be inappropriate to assume that these costs are largely fixed from one year to the next, if the assumption is incorrect. Activity based costing is based on the view that many overhead costs arise from certain key activities that make use of resources. For each activity, there is one (or more) ‘cost drivers’. A cost driver is something that results in the use of resources. Cost drivers may therefore be seen as something that causes overhead costs to happen. Many overhead costs may vary according to the activity level associated with a cost driver. Organisations that use activity based costing are able to budget for overhead costs using activity based budgeting. This analyses overhead costs into fixed costs and ‘variable’ costs that vary with a particular activity. Overhead cost budgets can be prepared, for each key activity, by:
estimating the volume of activity in the budget period (this is the number of units of the cost driver)
from this, estimating the amount of resources required to carry out the activities, and
preparing a cost budget for these resources.
In principle, a system of ABB might help to remove ‘slack; and wasteful overhead spending from the budget, because budgets are based on expected activity levels.

Paper P5: Advanced performance management
60 © Emile Woolf Publishing Limited
The behavioural aspects of budgeting
The relevance of attitudes and behaviour to effective budgeting
Misunderstanding and worries about cost-cutting
Opposition to unfair targets set by senior management
Sub-optimisation
Budget slack (budget bias)
Corporate and individual aspirations
Argyris: four behavioural issues in budgeting
Budgeting as a bargaining process
Budgets as a method of motivating individuals
Expectancy theory of motivation
Behavioural aspects of budgetary control: budgetrt control as a system of performance measurement
Management styles and budgetary control
4 The behavioural aspects of budgeting
4.1 The relevance of attitudes and behaviour to effective budgeting
The effectiveness of budgeting and budgetary control depends largely on the behaviour and attitudes of managers and (possibly) other employees.
Budgets provide performance targets for individual managers. If managers are rewarded for achieving or exceeding their target, budgets could provide them with an incentive and a motivation to perform well.
It has also been suggested that budgets can motivate individuals if they are able to participate in the planning process. Individuals who feel a part of the planning and decision-making process are more likely to identify with the plans that are eventually decided. By identifying with the targets, they might have a powerful motivation to succeed in achieving them.
When budgeting helps to create motivation in individuals, the human aspect of budgeting is positive and good for the organisation. Unfortunately, in practice, human behaviour in the budgeting process has a negative effect. There are several possible reasons why behavioural factors can be harmful:
Misunderstanding and worries about cost-cutting.
Opposition to unfair targets set by senior management
Sub-optimisation
Budget slack or budget bias

Chapter 3: Budgets and alternative budgeting models
© Emile Woolf Publishing Limited 61
4.2 Misunderstanding and worries about cost-cutting
Budgeting is often considered by the managers affected to be an excuse for cutting back on expenditure and finding ways to reduce costs. Individuals often resent having to reduce their spending, and so have a hostile attitude to the entire budgeting process. This fear and hostility can exist even when senior management do not have a cost-cutting strategy.
4.3 Opposition to unfair targets set by senior management.
When senior managers use the budgeting process to set unrealistic and unfair targets for the year, their subordinates may unite in opposition to what the senior managers are trying to achieve. Senior managers should communicate and consult with the individuals affected by target-setting, and try to win their agreement to the targets they are trying to set. Targets need to be reasonable.
A distinction can be made between:
aspirational budgets, which are budgets based on performance levels and targets that senior managers would like to achieve, and
expectational budgets, which are budgets based on performance levels and targets that senior managers would realistically expect to achieve.
Aspirational budgets might be considered unfair, especially if the individuals affected have not been consulted. Expectational budgets, based on current performance levels, do not provide for any improvements in performance. Ideally perhaps, budgets might be set with realistic targets that provide for some improvements in performance. In addition to opposing budgets that are unfair, operational managers may resent budgets because:
they have been imposed by senior managers, without consulting the managers who will be responsible for achieving the budget targets
they are unachievable
they are irrelevant.
4.4 Sub-optimisation
There may be a risk that the planning targets for individual managers are not in the best interests of the organisation as a whole. For example, a production manager might try to budget for production targets that fully utilise production capacity. However, working at full capacity is not in the best interests of the company as a whole if sales demand is lower. It would result in a build-up of unwanted finished goods inventories. The planning process must be co-ordinated in order to avoid sub-optimal planning. In practice, however, effective co-ordination is not always achieved.

Paper P5: Advanced performance management
62 © Emile Woolf Publishing Limited
4.5 Budget slack (budget bias)
Budget slack has been defined as ‘the intentional overestimation of expenses and/or underestimation of revenue during budget setting’ (CIMA Official Terminology, 2005 ed.). Managers who prepare budgets may try to overestimate costs so that it will be much easier to keep actual spending within the budget limit. Similarly, managers may try to underestimate revenue in their budget so that it will be easier for them to achieve their budget revenue targets. As a result of slack, budget targets are lower than they should be. When managers are rewarded for achieving their budget targets, the motivation to include some slack in the budget is even stronger. An additional problem with budget slack is that when a manager has slack in his spending budget, he may try to make sure that actual spending is up to the budget limit. There are two reasons for this:
If there is significant under-spending, the manager responsible might be required to explain why.
Actual spending needs to be close to the budget limit in order to keep the budget slack in the budget for the next year.
The problem of budget slack is particularly associated with spending on ‘overhead’ activities and incremental budgeting. One of the advantages of zero based budgeting is that it should eliminate a large amount of slack from budgets. In some cases, budget bias operates the other way. Some managers might prepare budgets that are too optimistic. For example, a sales manager might budget for sales in the next financial year that are unrealistic and unachievable, simply to win the approval of senior management.
4.6 Corporate and individual aspirations
The behavioural problems with budgeting arise because the corporate aims of an organisation are usually not the same as the aspirations of the individuals who work for it. For example, the aim of a company might be to maximise shareholder wealth, but there is no reason at all why this should be the aim of the company’s employees and managers. Individuals have their own aims and ambitions, that working might (or might not) satisfy. The potential conflict between corporate objectives and the aspirations of the company’s employees can become apparent in the budgeting process, when an organisation sets its targets for the next year. The accepted wisdom is that there is a potential conflict between corporate and individual aspirations. Individuals will be inclined to do what they want for themselves, regardless of whether this is good for the organisation. The solution to the problem should be to bring the aspirations of individual managers and other employees as closely as possible into line with the objectives of

Chapter 3: Budgets and alternative budgeting models
© Emile Woolf Publishing Limited 63
the organisation. This is the rationale for measures to motivate individuals, such as reward schemes and motivation through participation.
4.7 Argyris: four behavioural issues in budgeting
Chris Argyris (1953) was one of the early writers on the behavioural aspects of budgeting. He suggested that four behavioural issues were involved in the budgeting process. Behavioural issue Comment Budgets are a ‘pressure device’
Many employees regarded the budgeting process as a way in which managers put pressure on ‘lazy’ workers and try to get them to work harder. Managers try to budget for improvements in performance, but employees resist the pressure and do not co-operate. Argyris commented that employee resistance against management pressure ‘seems to be at the core of the budget problem’.
‘Budget men’ want to see operational managers fail
The accounting department is usually responsible for preparing the master budget and preparing budgetary control reports. Management accountants regard themselves as ‘successful’ in their work if they can identify significant adverse variances and poor operational performance. Their ‘success’ therefore arises out of the failures and poor performance of operational managers. The budgeting and budgetary control process is therefore damaged by hostility and poor communication between the management accounts (the ‘budget men’) and operational managers.
Departmental targets and goal congruence
A budget usually sets targets for each department, and departmental managers are considered successful if they achieve their budget target. However, one department might achieve its target in a way that is damaging to other departments and to the entity as a whole. There is often a lack of ‘goal congruence’ in departmental targets, which prevents co-operation between different departments.
Management style Managers use budgets to impose their character and management style on their subordinates. Subordinates do not like the way that their manager behaves, but they blame the budget and not the manager for the problem.
4.8 Budgeting as a bargaining process
Budgeting should be a process where an organisation prepares short-term plans that are consistent with its objectives and strategies. In practice, however, planning often involves compromises, and balancing the requirements of different long-term and short-term objectives.

Paper P5: Advanced performance management
64 © Emile Woolf Publishing Limited
As a result, budgeting can become a bargaining process between managers. The managers with the greatest power and influence are the most likely to get what they want. In many cases, managers will make ‘deals’ and reach compromises on what should be included in the budget. The bargaining process is evident perhaps in the annual round of budgeting in central government, when spending departments (health, education, social services, defence and so on) argue and negotiate with each other and with the treasury department. They try to reach agreement through bargaining on spending allowances for the next financial year. In companies, managers might also use the budgeting process to bargain, giving way on some demands in order to get what they want in other matters. Anthony Hopwood has commented on the bargaining process as follows: ‘Behind the essential technical façade of the budgetary procedures lies a prior and less formal bargaining process in which the managers compete for … resources. In practice, budget requests can vary from being a statement of a manager’s anticipations to being one of his most optimistic aspirations. Since the amounts requested often have an important effect on the amounts received and hence on … control over … resources, the requests are themselves strategies in a bargaining process in which the issues ... include personal motives for status, recognition and advancement.’
4.9 Budgets as a method of motivating individuals
Instead of creating resistance and opposition, the budgeting process might possibly be used to motivate individual managers and employees, so that they have a personal interest in wanting to set a challenging budget and to achieve the budget targets that are set. One approach to motivating individuals is to reward them for achieving their budget targets. Systems of rewards, such as annual cash bonuses, are widely used. Rewards systems are considered in more detail in a later chapter, in the context of performance targets.
It has also been suggested that individuals will be more committed to achieving budget targets if they are able to participate in the budgeting process, and contribute to the decision about what the budget targets should be.
Participation in budgets is achieved by inviting subordinates to discuss budget targets and suggest what these might be. However, the final decision about budget targets is the responsibility of senior managers.
The value of participation could therefore depend on the attitude of senior managers to the participation process. Is the participation by subordinates ‘genuine’? Is the manager really listening to what the subordinates have to say?
The effect of participation on the motivation of subordinates will also depend on circumstances. Hopwood suggested that the effectiveness of participation on employee motivation depends on three key factors.

Chapter 3: Budgets and alternative budgeting models
© Emile Woolf Publishing Limited 65
Factor Comment
The nature of the task The effectiveness of participation will depend on the nature of the work, and the extent to which employees have control over the way in which the work is done. ‘In highly-programmed … and technically constrained areas, where speed and detailed control are essential for efficiency, participative approaches have less to offer…. In contrast, in areas where flexibility, innovation and the capacity to deal with un-anticipated problems are important, participation in decision-making may offer a more immediate … payoff….’ (Hopwood).
Organisation structure Participation is likely to be more effective in an organisation where management responsibilities are decentralised, and local managers have more influence over their own budgets.
Personality of the employees Some types of individual are more likely than others to be motivated by participation in the budgeting process. This is a matter of different personalities.
1.10 Expectancy theory of motivation
A simple view of motivation may be that an individual can be motivated to work harder in order to achieve a budgeted target or planning target if he is given a reward for its successful achievement such as more pay or a promotion. Reality is more complex, but some writers on management have tried to explain the nature of motivation, and how an individual may be motivated to perform better. Expectancy theory is one such theory. (You may have learned about this theory in your previous accountancy studies.) This theory states that the motivation of an individual to do ‘X’ depends partly on:
what he expects to get as a reward or return from doing ‘X’ and
the strength of his wish or desire for that reward ‘Y’.
Motivation also depends on the extent to which the individual expects that by doing X he will actually get Y. Expectancy theory is therefore that the strength of an individual’s motivation to do X depends partly on the strength of his desire for an outcome Y and the strength of his expectancy that by doing X he will get Y. For example, suppose that a company introduces a remuneration scheme in which profit centre managers will receive a bonus of 25% of their basic salary if their division achieves an actual profit in excess of the budgeted profit. According to expectancy theory, the ability of the reward scheme to motivation a profit centre manager will depend on:

Paper P5: Advanced performance management
66 © Emile Woolf Publishing Limited
his wish or desire to earn the 25% bonus, and also
his expectancy that by putting in more work and more effort, he will succeed in achieving the budgeted profit. (The strength of this expectancy will depend on how ‘tough’ the profit target is.)
Similarly, suppose that a school measures the performance of its teachers by the ass rates of their students in end-of-year examinations. If there is no financial reward system for the payment of teachers with good exam results, and if it is not possible to offer other rewards such as promotion to a higher position in the school, the motivation of a teacher to achieve good pass rates will depend on:
the ‘personal reward’ he may get from achieving good pass rates (such as personal or professional satisfaction) and the strength of his interest in those rewards, and
the strength of his expectation that good teaching will have a noticeable impact on the pass rates of his students.
Expectancy theory may provide a useful framework for discussing the motivaton provided by any performance measurement system, not just a budgetary planning and control system.
4.11 Behavioural aspects of budgetary control: budgetary control as a system of performance measurement
The performance of operational managers may be measured by comparing actual performance with the budget. The manager might be rewarded for achieving budget targets but criticised for failing to meet the budget. This tendency to ‘blame’ managers for failing to meet the budget targets will have an adverse effect on the motivation and attitude of the operational managers in the following circumstances:
The budget might not make any distinction between costs that are controllable and costs outside the manager’s control. The manager might therefore be criticised for excess spending on items over which he has no control.
Circumstances might change and events might occur that make the original budget unrealistic. Even so, the manager might be criticised for failing to meet the budget targets, even when changed circumstances have made the budget targets unrealistic.
If budgeting is used as a ‘performance contract’ between the company and its managers, and provides a basis on which the actions by management are assessed, this could lead to a number of problems. Managers will want to avoid criticism, and so meet targets, but they have no obvious incentive to do better than the targets in the budget plan.
Meeting only the lowest targets. Once a manager has agreed his budget targets for the year, his only incentive is to achieve the budget target, and not to exceed it.

Chapter 3: Budgets and alternative budgeting models
© Emile Woolf Publishing Limited 67
Using more resources than necessary. Once the budgeted utilisation of resources has been agreed (materials, labour time, machine time and so on) a manager will be satisfied with using the full budgeted quantity of resources permitted. There is no incentive to improve on performance and use fewer resources.
Earning the bonus – whatever it takes to do this. Managers and employees who are incentivised by a bonus to achieve a budget target will do whatever they can to make the target – even if this means ignoring other aspects of performance for which there is no bonus and even if it means ‘bending the rules’ to make the target.
Competing with other divisions and departments in the same organisation. There will be a tendency for cost centres and profit centres to act competitively towards each other, in order to achieve their own budget target. This may be evident in attitudes to transfer pricing, which are described in another chapter.
Making sure that all the expenditure allocation in the budget is actually spent. Managers often see budgeting as a competition for resources and spending allocations. If a cost centre or profit centre does not spend up to its permitted limit in one year, it is at risk of having some of the spending allowance removed the next year. Managers will try to avoid this by making sure that their full budgeted spending allocation is actually spent.
Providing forecasts that are inaccurate. Managers may try to provide forecasts that are (deliberately) not accurate in order to gain an advantage and misrepresent future expectations. There are various reasons why this may be done – for example to persuade senior management to make a decision that is favourable to the forecast provider in order to win a bigger allocation of resources in the budget.
Meeting the budget target, but not beating it. If there is no incentive t beat a budget target, managers will be satisfied with simply achieving the target. They may then prefer not to exceed the target so that their target for the following year may not be as challenging as it otherwise might be.
Avoiding risks. Managers will be tempted to stick to the agreed plans in the budget and will be reluctant to take unplanned initiatives that could result in a failure to meet budget targets. Managers may prefer to do nothing wrong than to take risks in order to improve performance.
Overcoming the problems
There is no obvious solution to these behavioural problems with budgeting, but some measures should be taken to try to prevent them from occurring, or at least from becoming significant.
Problem (1) Meeting only the lowest targets. It may be appropriate to introduce an incentive scheme, in which higher bonuses are paid according to the amount by which the budget target is exceeded. Higher bonuses can be paid for better (budget-beating) performance.
Problem (2) Using more resources than necessary. One possibility is to train management and staff in the application of Total Quality Management techniques, so that managers and employees are actively looking for improvements. Another possibility is to provide rewards for achieving variable costs per unit that are less than standard/budgeted.

Paper P5: Advanced performance management
68 © Emile Woolf Publishing Limited
Problem (3) Earning the bonus – whatever it takes to do this. It is very difficult problem to overcome the problem that managers will do whatever nis necessary and ‘cheat’ to achieve their targets and bonuses. The most effective solution may be to amend the rewards system so that there are a number of bonus incentives for achieving a number of different targets. However, this will be difficult to design and implement.
Problem (4) Competing with other divisions and departments in the same organisation. If there are disputes between different cost centres, or between cost centres and profit centres, it may be necessary to refer the matter for resolution to the senior management at head office.
Problem (5) Making sure that all the expenditure allocation in the budget is actually spent. Rewarding employees and managers for achieving lower fixed costs than budgeted may be a solution to this problem.
Problem (6) Providing forecasts that are inaccurate. A change in management culture may be necessary to overcome this problem. It is an almost unavoidable feature of management behaviour that forecasts will be presented in the most favourable light possible. It is the task of top management to establish a culture of ‘no blame’ within the organisation, so that managers may be willing to provide information that is more ‘honest’.
Problem (7) Meeting the budget target, but not beating it. As suggested above, it may be appropriate to have an incentive scheme in which higher bonuses are available according to the amount by which the budget target is exceeded.
Problem (8) Avoiding risks. A bonus system that rewards managers and employees for beating a range of budget targets may be effective, so that managers are prepared to take risks to improve performance. However, as the crisis in the banking system (2007 – 2009) showed, managers shouldnever be encouraged to take on excessive risks.
4.12 Management styles and budgetary control
In the 1970s, research was carried out by Anthony Hopwood into performance evaluation by managers, and how the performance of managers with cost centre responsibility is judged. He identified three types of management style:
A budget-constrained style. With this style of management, the performance of managers is based on their ability to meet budget targets in the short term. With this style of performance evaluation, the focus is mainly on budgeted costs actual costs and variances. Managers are under considerable pressure to meet their short-term budget targets. Stress in the job is high. Managers might be tempted to manipulate accounting data to make actual performance seem better in comparison with the budget.
A profit-conscious style. The performance of managers is evaluated on the basis of their ability to increase the general effectiveness of the operations under their management. Increasing general effectiveness means being more successful in achieving the longer-term aims of the organisation. For example, success in reducing costs in the long term would be considered an increase in general effectiveness.

Chapter 3: Budgets and alternative budgeting models
© Emile Woolf Publishing Limited 69
With a profit-conscious style, budgets and variances are not ignored, but they are budgetary control information which is treated with caution, and variances are not given the same importance as with a budget-constrained style.
Hopwood found that with this style of management evaluation, costs remain important, but there is much less pressure and stress in the job. As a consequence, there was a good working relationship between managers and their subordinates. In addition, there was less manipulation of accounting data than with a budget-constrained style.
A non-accounting style. With this style, budgetary control information plays a much less important part in the evaluation of managers’ performance. Other (non-accounting) measures of performance were given greater prominence.
Hopwood appeared to suggest that a profit-conscious style of evaluation was the most effective of the three.
This conclusion has been challenged by David Otley. His research into profit centre managers in the UK coal mining industry (1978) found that there was a fairly close link between good performance and a budget-constrained style of management evaluation. Managers whose performance was judged on success in meeting budget targets were generally more successful in actually meeting their targets. The differing conclusions between the research of Hopwood and Otley suggest that the most appropriate approach to the evaluation of performance depends on the circumstances and conditions in which the organisations and their managers operate. This conclusion is consistent with the contingency theory of management accounting (described in an earlier chapter).

Paper P5: Advanced performance management
70 © Emile Woolf Publishing Limited
Beyond budgeting
Origins of ‘beyond budgeting’
Weaknesses in traditonal budgeting
The ‘beyond budgeting model’
Performance management in the ‘beyond budgeting’ model
Beyond budgeting: concluding comments
5 Beyond budgeting
5.1 Origins of ‘beyond budgeting’
The Beyond Budgeting Round Table (BBRT) was set up in 1998. It is a European-wide research project investigating whether entities would benefit from the abolition of budgets and budgeting. The BBRT claims that several successful European companies have stopped preparing budgets. Instead, they use a ‘responsibility model’ for decision-making and performance measurement. As a result, their performance has improved.
In the UK, the ideas of ‘beyond budgeting’ are associated with the writing of Jeremy Hope and Robin Fraser.
5.2 Weaknesses in traditional budgeting
Hope and Fraser have argued that the traditional budgeting system is inefficient and inadequate for the needs of modern businesses. In a continually-changing business world, traditional budgeting systems can have the effect of making business organisations fixed and rigid in their thinking, and unable to adapt. As a result, business organisations may be much too slow and inflexible in reacting to business developments. The budgeting system establishes ‘last year’s reality’ as the framework for the current year’s activities. When the business environment is changing rapidly, this approach is inadequate. Managers should respond quickly to changes in the environment, but traditional budgeting and budgetary control systems act as a restraint on innovation and initiative. Consequences of the inadequacy of the traditional budgeting system are that:
operational managers regard the budgeting process as a waste of their time and resent having to prepare and then continually revise budget plans
management accountants are involved in the budgetary planning and control system, but their work adds little or no value to the business. As a result, it may be difficult to justify the existence of the management accounting function.

Chapter 3: Budgets and alternative budgeting models
© Emile Woolf Publishing Limited 71
According to the Beyond Budgeting Round Table, there are ten major problems with the traditional budgeting and budgetary control system.
(1) Budgets are time-consuming and expensive. In spite of computer technology and the use of budget models, it can take four to five months in a large company to prepare the annual budget for next year. The work on budget preparation has been found to use over 20% of the time of senior managers and financial controllers.
(2) Traditional budgeting adds little value and uses up valuable management time that could be used better in other ways. Preparing a budget does nothing, or very little, to add value to the entity. Budgets ‘are bureaucratic, time-consuming exercises, and the time taken would be better deployed in more value-creating activities’ (Hope and Fraser).
(3) Fails to consider shareholder value. The traditional budgeting process focuses too much on internal matters and not enough on external factors and the business environment, and it fails to focus on shareholder value.
(4) Rigid and inflexible: budgeting systems prevent fast response. Managers concentrate on achieving ‘agreed’ budget targets, which may not be in the best interests of the organisation as a whole, particularly when circumstances change after the budget has been agreed. Budgets are therefore ‘rigid’ and prevent fast and flexible responses to changing circumstances and unexpected events.
(5) Budgets ‘protect’ spending and fail to reduce costs. In many entities, managers are expected to spend their entire budget allowance. If they don’t, money will be taken away from their budget allowance next year. This is certainly no incentive to cut costs.
(6) Traditional budgeting and budgetary control discourages innovation. Managers are required to achieve fixed budget targets, and the fixed budget does not encourage continuous improvement. Managers will be reluctant to exceed their budgeted spending limits, even though extra spending would be necessary to react to events, possibly because spending above budget will put their bonus at risk. In a dynamic business environment, business organisations should be seeking continuous improvement and innovation.
(7) Budgets focus on sales targets, not customer satisfaction. This will possibly increase sales in the short-term, even if the products are not as good as they should be, but long-term success depends on satisfying customers.
(8) In practice, it has been found that although most companies have a budgeting system, they are poor at executing strategy. This suggests that budgeting systems are not effective systems for implementing strategy.
(9) Budgeting systems encourage a culture of ‘dependency’, in which junior managers do what they are told by their boss, and do not argue. ‘They reinforce the “command and control” management model and … undermine attempts at organisational change, such as team working, delegation and empowerment’ (Hope and Fraser).
(10) Budgets can lead to ‘unethical’ behaviour, such as including ‘slack’ within the budgeted spending allowance.

Paper P5: Advanced performance management
72 © Emile Woolf Publishing Limited
There are other major criticisms of budgeting systems.
Traditional budgeting is seen as a method of imposing financial control, by comparing actual results with budget. Budgeting should be a system for communicating corporate goals – setting objectives and improving performance.
Budgets are also plans that focus on financial numbers. ‘They fail to deal with the most important drivers of shareholder value … - knowledge or intellectual capital. Strong brands, skilled people, excellent management processes, strong leadership and loyal customers are assets that are outside the … accounting system’ (Hope and Fraser).
In many cases, budget plans are not the result of a rational decision-making process. Often, budgets are a political compromise between different departments and managers, and budgeted spending limits for each manager are the outcome of a bargaining process.
Traditional budgetary control encourages managers to achieve fixed budget targets, but does not encourage continuous improvement. Managers will be reluctant to exceed their budgeted spending limits, even though extra spending would be necessary to react to events, possibly because spending above budget will put their bonus at risk. In a dynamic business environment, business organisations should be seeking continuous improvement and innovation.
Traditional budgeting shows the costs of departments and functions, but not the costs of activities that are performed by employees. The traditional budget figures do not give managers information about the cost drivers in their business. In addition, traditional budgets do not help managers to identify costs that do not add value.
5.3 The ‘beyond budgeting model’
The Beyond Budgeting view is that budgeting, as practised by most companies, should be abolished. The traditional hierarchical form of management structure should also be abolished. In its place, there should be a system in which authority and responsibility is given to operational managers, who should work together to achieve the strategic objectives of the entity. Traditional budgeting is based on a ‘dependency model’ of management and organisation culture. It is a system for centralised control by senior management. Control is exercised by requiring operational managers to meet (or exceed) budget targets. The ‘Beyond Budgeting’ alternative is a ‘responsibility model’ in which decision-making and performance management are delegated to ‘line managers’ (operating managers). Instead of having fixed annual plans, these managers agree performance targets: these targets are reviewed regularly and amended as necessary in response to changing circumstances and unexpected events. A solution to the lack of flexibility in traditional budgeting may be continuous rolling forecasting (or even continuous budgets), so that the business organisation can adapt much more quickly to changes in its environment and to new events.

Chapter 3: Budgets and alternative budgeting models
© Emile Woolf Publishing Limited 73
Responsibility should be delegated to operational managers, who should be empowered to take decisions in response to changing circumstances, that the managers believe would be in the best interests of the organisation.
Goals should be agreed by reference to external benchmarks (such as increasing market share, or beating the competition in other ways) and targets should not be fixed and internally-negotiated.
Operational managers should be motivated by the challenges they are given and by the delegation of responsibility.
Operational managers can use their direct knowledge of operations to adapt much more quickly to changing circumstances and new events.
Operational managers may be expected to work within agreed parameters, but they are not restricted in their spending by detailed line-by-line budgets.
Delegated decision-making should encourage more transparent and open communication systems within the organisation. Managers need continuous rolling forecasts to make decisions and apply control. Efficient IT systems are therefore an important element in the ‘beyond budgeting’ model.
5.4 Performance management in the ‘beyond budgeting’ model
In the Beyond Budgeting model of performance management, there are 12 basic principles.
(1) Governance. The basis for taking action should be a set of clear values. Mission statements and plans should not be used to guide action.
(2) Responsibility for performance. Managers should be responsible for achieving competitive results, not for meeting the budget target.
(3) Delegation. People should be given the ability and the freedom to act. They should not be controlled and constrained by senior managers.
(4) Structure. Operations should be organised around processes and networks, and should not be organised on the basis of departments and functions.
(5) Co-ordination. There should be effective co-ordination between people within the company, and this should be achieved by process design and fast information systems.
(6) Leadership. Senior managers should challenge and ‘coach’. They should not command and control.
(7) Setting goals. The goal should be to beat competitors, not meet budget.
(8) Formulating strategy. Formulating and implementing strategy should be a continuous process, not an annual event imposed by senior management.
(9) Anticipatory management. Management should use anticipatory systems for managing strategy. (Anticipatory systems are systems that provide information about events that are anticipated in the future.)
(10) Resource management. Resources should be made available to operational managers at a fair cost, when they are required. Resources should not be allocated to departments in a fixed budget.

Paper P5: Advanced performance management
74 © Emile Woolf Publishing Limited
(11) Measurement and control. Performance measurement and control should be based on a small number of key performance indicators, not a large number of detailed reports.
(12) Motivation and rewards. Rewards, at a company level and a business unit level, should be based on competitive performance, not meeting predetermined budget targets.
Principles (1) to (6) are concerned with establishing an effective organisation and culture of behaviour. Principles (7) to (12) are concerned with establishing an effective system of performance measurement.
‘Beyond Budgeting entails a shift from a performance emphasis based on numbers to one based on people. It assumes that performance improvement is more likely to come from giving capable people control over decisions (and making them accountable for results), than simply from adopting different measures and incentives’ (Hope and Fraser).
Hope and Fraser set out the 12 principles, and their effect, as follows:
Effective organisation and behaviour
Effective performance
Management of competitive success
Clear values Relative targets Fast response
Responsibility for results
Adaptive strategies
Best people
Freedom and capability to act
×
Anticipatory management
=
Innovative strategies
Fast networks and processes
Internal market for resources
Low costs
Co-ordination Fast, distributed controls
Loyal customers
Challenge and stretch
Relative team rewards
Satisfied customers
To compete successfully, management have to be very good at the six issues in the box on the right-hand side of this diagram.
They must create a climate and culture for fast response. An ability to respond quickly to unexpected changes and events will mean that the company can deal with uncertainty successfully. Change should be seen as an opportunity, not a threat.
- Managers must be given responsibility for strategy, and they should monitor strategy continuously, not just once a year (as in the traditional budget model).
- If new initiatives are needed, managers should be able to obtain the resources they need quickly. ‘They need, for example, the authority to acquire key people when they are available (not when there is room in the budget); to react to competitive threats and opportunities as they arise (not as predicted in an outdated plan); and to acquire and deploy resources when necessary (not as allocated by head office)’ (Hope and Fraser).

Chapter 3: Budgets and alternative budgeting models
© Emile Woolf Publishing Limited 75
They must employ the best people. A challenging environment to work in is likely to attract and retain top-quality employees.
They must innovate and generate new business ideas. Bureaucracy does not encourage innovation and creativity. The ‘Beyond Budgeting’ model does.
They must operate with low costs. Competitive pressures in markets are forcing down prices. In the ‘Beyond Budgeting’ model managers will adapt strategies to the requirements of the competitive environment, and will find ways to reduce costs if this is appropriate. The traditional budgeting model does not encourage effective cost reduction.
They must create and retain loyal customers. The ‘Beyond Budgeting’ model encourages managers to focus on satisfying customer needs. Satisfied customers are likely to be loyal customers.
They must create value for shareholders. The ‘Beyond Budgeting’ model should help a company to improve its profitability and create additional value for its shareholders.
5.5 Beyond budgeting: concluding comments
Hope and Fraser have argued that traditional budgeting systems are weak and should not be used. However, in practice most companies and other organisations continue to use them.
It has been argued that the ‘beyond budgeting’ model is much more easily applied in the private sector than in the public sector. Government activity is managed through expenditure budgets and spending controls, and there is accountability for spending to politicians (government ministers and elected representatives) and to the general public. There may also be uncertainty about the objectives of particular government activities or departments. In such circumstances, it is difficult to apply a flexible system of decision-making or to devolve decision-making to lower levels of management. There have been attempts to improve traditional budgeting systems: for example, zero based budgeting, continuous budgets and activity based budgeting are all attempts to improve the budgeting system. Hope and Fraser argue, however, that these are ‘valiant efforts to update the process, but they only deal with part of the [problem] and are both time-consuming and complicated to manage.’

Paper P5: Advanced performance management
76 © Emile Woolf Publishing Limited

© Emile Woolf Publishing Limited 77
Paper P5 Advanced performance management
CH
AP
TER
4
Changes in business structure and
management accounting
Contents
1 Information needs of organisations
2 Business Process Re-engineering (BPR)
3 Business integration – Value chain analysis
4 Impact of staff empowerment

Paper P5: Advanced performance management
78 © Emile Woolf Publishing Limited
Information needs of organisations
Introduction
Functional organisations
Divisional organisations
Project-based and team-based structures
Network organisations
1 Information needs of organisations
1.1 Introduction
Organisation structure is an aspect of strategy implementation. Strategy is implemented through actions, and actions are planned and controlled through the management and decision-making structure within the entity. Organisation structures differ between entities. The organisation structure for an entity should be appropriate for the size of the entity, the nature of its operations, and what it is trying to achieve. Most important, the organisation must enable the entity to develop plans and implement them effectively. There are several different types of organisation structure. Within a single entity, particularly a large entity, there might be a mixture of different organisation structures, with different structures in different parts of the entity. From a strategic perspective, however, the key question is: ‘What is the most appropriate structure for a particular entity that will help it to achieve its strategic objectives in the most efficient way?’
a functional structure
a divisional structure
a matrix organisation.
1.2 Functional organisations
In a functional organisation structure, decision-making authority is delegated in a formal arrangement, and responsibilities are divided between the managers of different activities or functions. Typically, functions in a manufacturing entity include production (or operations), marketing and sales, and finance and accounting. There might also be a human relations function, an IT function, a research and development function, and so on. Each function has its own management structure and its own staff. An organisation chart showing a simple functional structure is shown below.

Chapter 4: Changes in business structure and management accounting
© Emile Woolf Publishing Limited 79
Information needs
Each functional manager needs information about the performance of their department and senior management need to know how the business is performing overall.
Budgets are set for each individual function and amalgamated into an overall budget for the business. Actual results for each function are collected and compared to budget on a periodic basis. The comparison of actual to budget is made available to functional managers so that they can take corrective action. Again the results are amalgamated for senior management.
Potential issues include: Functional managers making dysfunctional decisions as they do not get to see
the big picture
Performance of managers must be judged based only on controllable costs.
Performance of departments must be judged on costs and revenues traceable to the department.

Paper P5: Advanced performance management
80 © Emile Woolf Publishing Limited
1.3 Divisional organisations
As entities grow still further, and develop their business operations into different product-markets, a divisional structure might become appropriate. A division is an area of operations, defined by:
markets in different geographical areas (for example, the European and the North American divisions).
different products (for example the bus division and the rail division of a transport company).
different customers (for example, industrial products and consumer products).
A division might be a strategic business unit of the entity (group). Each division has its own functional departments, such as marketing and sales, operations (production), accounting and finance, and so on. Authority is delegated from head office to the divisional management (led perhaps by a divisional managing director), and responsibility for the implementation of product-market strategy is mainly at divisional level. Head office retains overall control, and there may be some head office functions providing support services to all the divisions, such as corporate strategy, IT and research and development. The simple organisation chart below shows the organisation structure for a divisionalised organisation with two divisions, where IT and research and development are head office support functions.
Information needs
Each division will be run by a manger who will report back to head office.

Chapter 4: Changes in business structure and management accounting
© Emile Woolf Publishing Limited 81
At the divisional level there may be a series of departments. The informational needs of the managers of the departments and of the divisional manager in understanding their overall performance has been covered above.
The results of the division will be reported back to central management on a periodic basis.
Potential issues include: Divisional managers making dysfunctional decisions as they do not get to see
the big picture
Performance of managers must be judged based only on controllable costs.
Performance of divisions must be judged on costs and revenues traceable to the department and investment within the authority of the manager.
1.4 Project-based and team-based structures
In addition to having a formal management structure, entities might also used project teams and other management teams to implement some activities. Project teams are usually assembled to accomplish a specific task, such as introducing a new system or a new process. The project team should consist of members from different disciplines or functions, so that a wide range of skills is assembled to implement the project. Project teams might be used for implementing planned strategic changes.
1.5 Network organisations
To work effectively in the project-based environment, organisations need to take on new forms. The traditional steady-state company with a fixed number of employees and a traditional hierarchical structure is not suited to this new environment. Instead, new models are emerging. An alternative structure more appropriate to this type of operation is a network organisation.
Network organisations have the following characteristics:
Independent teams
Extensive use of outsourcing
Departments which share common values
Projects which support each other
Multiple links between projects
A key co-ordinating role for the Chief Executive to construct the teams and manage the interrelationship of projects
In most cases there is a core organisation which continues between projects, and holds the projects together. These projects are linked in terms of a central business strategy. The core organisation selects projects strategically to fit its mission and core skills.

Paper P5: Advanced performance management
82 © Emile Woolf Publishing Limited
Information needs
The senior coordinator needs information about outsourcing costs to allow for pricing of bids for work and the construction of budgets once the work is won.
Workers in full time employment are a valuable resource and information is required to track their allocation to projects and availability for potential new work.
Budgets need to be constructed for each project. The accounting system must be able to allocate costs and revenues to each project to allow the project leader to control its progress. Information should be available to the project manager on a very timely basis (perhaps real time).

Chapter 4: Changes in business structure and management accounting
© Emile Woolf Publishing Limited 83
Business Process Re-engineering (BPR)
BPR and changing processes
Principles of BPR
BPR and empowerment of employees
Conducting a BPR exercise
BPR projects: radical solutions
2 Business Process Re-engineering (BPR)
2.1 BPR and changing processes
To achieve a big competitive advantage, it is often necessary to take risks and to re-engineer processes in a radical way. Business process re-engineering (BPR) is an approach to improving business operations and processes by re-designing them extensively. Changes introduced by BPR are major changes, completely altering the way that the process was carried out before. Business Process Re-engineering (BPR) is defined by Hammer and Champy (Re-engineering the Corporation: a Manifesto for Business Revolution, 1993) as ‘the fundamental re-thinking and rational re-design of the business processes to achieve dramatic improvements in critical contemporary measures of performance such as cost, quality, speed and service.’ (Note: Philosophically, BPR is the complete opposite of Total Quality Management (TQM), which believes in continuous but small improvements as the best way of achieving better performance. TQM is described in a later chapter.)
The aim of BPR is to take an operation or ‘process’ and radically re-design the way that it is carried out. Examples of processes may be:
handling customer orders, from taking an order to delivery to the customer
requisitioning of materials and purchasing system
the quality control process
in a hospital, the process for dealing with a particular type of patient, such as accident and emergency patients
BPR is a radical approach to the improvement of processes, and a BPR programme results in extensive and fundamental changes. It is therefore different from activity-based management, because the solutions provided by a BPR approach are often more radical and extreme. BPR is sometimes associated with radical shake-up, extensive job losses and heavy cost-cutting.

Paper P5: Advanced performance management
84 © Emile Woolf Publishing Limited
Like ABM, a BPR approach requires an analysis of costs that traditional management accounting systems do not provide.
2.2 Principles of BPR
Key principles of BPR are as follows:
There must be a total re-think of business processes. Work must not be looked at from a departmental or functional perspective. It must be looked at in a cross-functional manner.
Work should be organised around the natural flow of information, or materials or customers.
Work should be organised around what the process produces, not around the tasks that go into it.
The objective of a BPR programme is to achieve substantial improvements in performance by re-designing the process.
Hammer (1990) described the main principles of BPR as follows:
There must be a completely different way of thinking about a process. A process should be seen as something that is done to achieve a desired objective. The focus should be on the end result, not the functions and activities involved in the existing process. The work should therefore be organised around the outcome from the process, not the tasks that go into performing it.
For example, at one time the process of producing a daily newspaper was seen as a series of tasks, each carried out by different functions – reporting, writing copy, editing copy, producing the ‘artwork’ for print, producing printing plates and printing. These tasks were carried out by news reporters, editors, typesetters and printing staff.
However, the purpose of this process is to produce daily newspapers for sale. This process has now been completely re-engineered. Reporting, writing and editing copy and producing artwork for print are now carried out by the same journalist, with minimal external interference, using IT technology.
The aim is to achieve dramatic improvements in the process through major re-design.
Whenever possible, the ‘customer’ for an operation or process should be required to carry out the process himself. A ‘customer’ should therefore be his own supplier.
For example, suppose that when an individual re-orders supplies for a task, he sends a purchase order requisition to the buying department, and the buying department places the order. In this situation, the individual is an ‘internal customer’ of the buying department. A BPR consultant would possibly recommend that the individual should re-order supplies direct from the external supplier, and the intermediary function of the buying department should be scrapped. In this way, the individual would become his own supplier. In theory, this should simplify and speed up the buying process.
Similarly, if the users of a computer system currently use the services of a help desk to sort out problems with using the system, a BPR recommendation might be that the team should take on the responsibility itself for system maintenance.

Chapter 4: Changes in business structure and management accounting
© Emile Woolf Publishing Limited 85
The decision points for controlling the process should be located where the work is done. The people who do the work should also be the people who manage it. The distinction between managers and other employees, for the purposes of operating a process, should not exist.
2.3 BPR and empowerment of employees
Changes introduced by BPR will often involve the ‘empowerment’ of individual employees. This means giving an employee the ‘power’ to make decisions, without having to ask a supervisor or manager first. Similarly, junior operational managers may be empowered to take decisions without having to ask for the approval of a senior manager.
Empowerment of employees and junior managers has implications for management accounting systems and IT systems. If employees and junior operational managers are given authority to make certain operational decisions themselves, they need immediate access to relevant information in order to make a sensible decision.
This will probably require a management accounting system that provides:
immediate access to information and
information that is easy to find and easy to understand, for individuals with a non-financial background.
2.4 Conducting a BPR exercise
A BPR exercise seeks to transform the way in which a process is performed, with the aim of performing it better – more effectively, efficiently or economically. In a BPR exercise, investigators (usually management consultants) will look at all the activities that are involved in performing the process under review. They might consider why each activity is performed, and what value it provides. Having investigated the existing process, the investigators will consider:
whether it can be radically re-designed, so as to achieve the same results but more cheaply and efficiently, or – more usually –
whether it can be radically re-designed to achieve even better results, perhaps more cheaply and efficiently.
The focus should be on the outcome from the process, and how this affects customer satisfaction and how it adds value.
A process is a series of activities. A BPR exercise into a food catering service would be looking for ways in which the customer can be provided with the product or service they expect, but in a cheaper and more effective way.
Can the service or product provided in a way that increases customer satisfaction? Can the quality of the service or product be improved by changing the process?

Paper P5: Advanced performance management
86 © Emile Woolf Publishing Limited
Can the product or service be provided in a way that is more convenient to the customer, or quicker?
Can the process be carried out at a lower cost, without reducing customer satisfaction?
Activities that do not add value should be eliminated.
Some of the features of changes that might be introduced by a BPR project include the following:
The new process will often involve delegating more responsibility to employees who deal directly with suppliers and customers. In some cases, it might involve outsourcing – paying an external supplier to carry out some activities instead of performing the activities with the entity’s own staff.
Information should be captured once, at source, and made available to everyone who needs it through an efficient IT system.
The need for checks and controls is often reduced by improving the quality of the process. Checking and controlling are activities that add no value.
Employees might be required to perform several different tasks, not just one specialised task.
Example A food catering company provides meals at lunchtime to a large number of schools and workplaces. Before a BPR exercise, meals were provided as follows: Each school or workplace had a kitchen, where the food was prepared and cooked. Staff included a trained chef at each location. Meals were served to individuals at their table by waitresses, who cleared up the used plates and cutlery for cleaning. The BPR exercise discovered that what mattered most to ‘customers’ was getting a meal that they could enjoy but eat quickly. Speed was a key requirement of the meals service. As a result of the BPR exercise, the following changes were introduced. All food for schools and workplaces in a local area were prepared and cooked centrally by a highly-qualified chef. This improved the quality of the meals. The meals were then delivered to each school or workplace ready-cooked, and the food was then heated up on site at the appropriate time. ‘Customers’ were asked to queue for their meals rather than have waitress service. This made the process of providing the meals much quicker. Finally, disposable plates and cutlery were introduced, removing the need for cleaning the dishes at the end of the mealtime. As a result of the changes, ‘customers’ received better-quality meals that they were able to obtain and eat more quickly. Non-value adding activities – a waitress service and cleaning the dishes – were removed from the process.

Chapter 4: Changes in business structure and management accounting
© Emile Woolf Publishing Limited 87
2.5 BPR projects: radical solutions
BPR projects are often led by external business consultants. They look at a particular process, and consider ways in which its purpose or objective could be achieved better in a completely different way. The aim of a BPR project is to design a completely new system of operating that will provide very large benefits to the organisation. For example, BPR consultants may look at the processes that a company uses for inventory control. Its solution may be to get rid of inventory entirely, and switch to a just-in-time purchasing and production system. Similarly, BPR consultants investigating the branch network of a commercial bank may recommend that the bank should close its branch network entirely, and switch all its customers to on-line banking services. Some BPR projects recommend solutions that are not quite as radical, but even so, the recommended changes are always substantial. Because the recommended changes are radical, the risks are often high.
Paper P5: Advanced performance management
88 © Emile Woolf Publishing Limited
Business integration – Value chain analysis
Creating value and competitive advantage
The value chain
A value chain for a company handling physical resources
A value chain for service operations
The value system
3 Business integration – Value chain analysis
A business is often organised into a series of departments or divisions each of which might undertake a different function. In practice value is added by a series of activities and processes which occur in a coordinated way. These activities and processes must be linked effectively to add value.
Value chain analysis is a model that gives insight into such business integration.
3.1 Creating value and competitive advantage
Value relates to the benefit that a customer obtains from a product or service. Value is provided by the attributes of the product or service. Customers are willing to pay money to obtain goods or services because of the benefits they receive. The price they are willing to pay puts a value on those benefits.
A customer will often be willing to pay more for something that provides more value.
Given a choice between two competing products or services, a customer will select the one that provides more value (in terms of value for money, quality, reliability, functions, convenience, and so on).
Business entities create added value when they make goods and provide services. For example, if a business entity buys a quantity of components for $100 and converts them into a wrist watch that it sells for $1,000, it has created value of $900. In a competitive market, the most successful companies are those that are best at creating value. Michael Porter has argued that companies in a competitive market must seek competitive advantage over their rivals. They do this by creating more value and by creating value more effectively, more efficiently or at less cost.
Porter suggested that an entity can adopt either of two competitive strategies:
a cost leadership strategy, where its aim is to create the same value as its competitors in the products it makes or the services it provides, but at a lower cost
a differentiation strategy, where its aim is to create more value than its competitors, for a competing product or service, so that customers are willing to pay more to buy it.
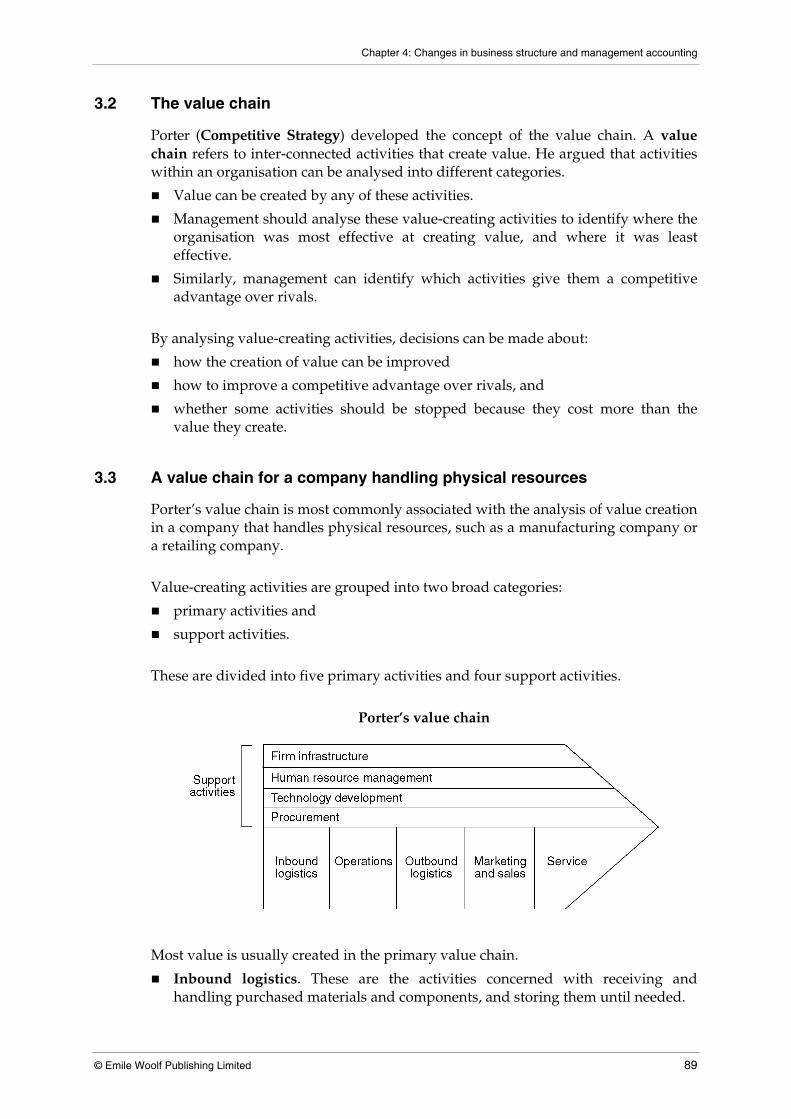
Chapter 4: Changes in business structure and management accounting
© Emile Woolf Publishing Limited 89
3.2 The value chain
Porter (Competitive Strategy) developed the concept of the value chain. A value chain refers to inter-connected activities that create value. He argued that activities within an organisation can be analysed into different categories.
Value can be created by any of these activities.
Management should analyse these value-creating activities to identify where the organisation was most effective at creating value, and where it was least effective.
Similarly, management can identify which activities give them a competitive advantage over rivals.
By analysing value-creating activities, decisions can be made about:
how the creation of value can be improved
how to improve a competitive advantage over rivals, and
whether some activities should be stopped because they cost more than the value they create.
3.3 A value chain for a company handling physical resources
Porter’s value chain is most commonly associated with the analysis of value creation in a company that handles physical resources, such as a manufacturing company or a retailing company.
Value-creating activities are grouped into two broad categories:
primary activities and
support activities.
These are divided into five primary activities and four support activities.
Porter’s value chain
Most value is usually created in the primary value chain.
Inbound logistics. These are the activities concerned with receiving and handling purchased materials and components, and storing them until needed.

Paper P5: Advanced performance management
90 © Emile Woolf Publishing Limited
Operations. These are the activities concerned with converting the purchased materials into an item that customers will buy. In a manufacturing company, operations might include machining, assembly, packing, testing and equipment maintenance.
Outbound logistics. These are activities concerned with the storage of finished goods before sale, and the distribution and delivery of goods (or services) to the customers.
Marketing and sales.
Service. These are all the activities that occur after the point of sale, such as installation, repairs and maintenance, and after-sales service.
The nature of the activities in the value chain varies from one industry to another, and there are also differences between the value chain of manufacturers, retailers and other service industries. However, the concept of the primary value chain is valid for all types of business entity. It is important to recognise that value is added by all the activities on the primary value chain, including logistics. Customers might be willing to pay more for a product or a service if it is delivered to them in a more convenient way. For example, customers might be willing to pay more for household shopping items if the items are delivered to their home, so that they do not have to go out to a supermarket or a store to get them.
Secondary value chain activities: support activities
In addition to the primary value chain activities, there are also secondary activities or support activities. Porter identified these as:
Procurement. These are activities concerned with buying the resources for the entity – materials, plant, equipment and other assets.
Technology development. These are activities related to any development in the technological systems of the entity, such as product design (research and development) and IT systems.
Human resources management. These are the activities concerned with recruiting, training, developing and rewarding people in the organisation.
Corporate infrastructure. This relates to the organisation structure and its management systems, including planning and finance management.
Support activities are often seen as necessary ‘overheads’ to support the primary value chain, but value can also be created by support activities. For example:
- procurement can add value by identifying a cheaper source of materials or equipment
- technology development can add value to operations with the introduction of a new IT system
- human resources management can add value by improving the skills of employees through training.

Chapter 4: Changes in business structure and management accounting
© Emile Woolf Publishing Limited 91
Primary activities Examples
Inbound logistics Delivery systems for materials and components, warehouses for accepting deliveries
Operations For a manufacturing company, manufacturing operations and methods: total quality management methods, just-in-time production methods and so on.
Outbound logistics Warehousing for finished goods, methods of delivering goods to customers
Marketing and sales Advertising and sales promotion methods, taking and processing sales orders, pricing
Service After-sales service, handling customer queries and complaints
Support activities Examples
Firm infrastructure Centralised/decentralised management structure, size of head office, head office services, size of management hierarchy, decision-making processes
Human relations management
Recruitment policies, training policies, incentive (bonus) pay arrangements, employee skill levels
Technology development Use of IT and IT systems, age of IT systems, use of e-commerce
Procurement Choice of suppliers, arrangements with suppliers, just-in-time purchasing, negotiation of prices, credit terms and discounts with suppliers.
For each individual activity listed within each of these categories of activity, it should be possible to analyse what the company does well (creating value) and what it does less effectively. It is also possible to use value chain analysis to identify the information requirements for each activity, to ensure that it can create value.
3.4 A value chain for service operations
Although Porter’s value chain is normally associated with companies that handle physical goods, the same approach to analysis can be applied to companies in service industries. An article by Malcolm Eva in Student Accountant (‘The adaptability of strategic models’, June 2005) suggested how value chain analysis could be applied to a service organisation. The article gave as an example an organisation providing distance learning courses. This example was based on a study by Woudstra and Powell (1989) in the American Journal of Distance Education.

Paper P5: Advanced performance management
92 © Emile Woolf Publishing Limited
The article suggests that the only difference between value chain analysis for organisations handling physical materials and for service organisations is the approach to analysing the primary activities. For a service organisation, it might be helpful to think of the five primary activities in terms of a process model, as follows:
Process model
Using a distance learning organisation as an example, the article went on to suggest that the primary activities in the value chain could be identified. A simplified analysis is given below. Review curriculum
Obtain funding
Obtain accreditation
Establish hardware and software for learning
Register students
Develop course content
Prepare multimedia
Mark assignments
Give feedback to students
Distribute materials
Place courses on-line
Notify students of results
Publish results
Promote the scheme
Receive enquiries
Receive student feedback
Provide telephone tuition support
Provide tutorials
Inbound logistics
Operations (Process)
Outbound logistics
Marketing and sales
Service
The value chain can be analysed, to identify those activities that add value most effectively, and give the organisation a competitive advantage. Activities that do not add value can be analysed to see whether they should be done differently, or scrapped.

Chapter 4: Changes in business structure and management accounting
© Emile Woolf Publishing Limited 93
3.5 The value system
There is a value chain within every business entity. There is also a supply chain from the producers of raw materials and equipment through to the entities that sell the end consumer product to customers. For example, food products might go from the original food producer to a food processor (who makes the processed food item) to a retailer. Here, there are three firms in the supply chain from the original food source to the end consumer. Each firm in the supply chain has its own value chain. The value system is the sum of the value chains in all the firms in a supply chain. The value that customers pay for when they buy goods or services comes from the value created by the entire value system. This has an important implication for each firm in the supply chain. The firm should try to improve the efficiency and effectiveness of its own activities in creating value. However, it should also consider the entire value system, and think about how value might be added across the system, not just within its own internal value chain. Collaboration between business entities and their key suppliers, for example in developing new materials or improving delivery systems, can help to add value across the supply chain, to the benefit of both entities. Management accounting systems should be able to provide information to managers to help them identify ways of adding value across the entire length of the value chain, in its relationships with suppliers as well as in its own internal systems.

Paper P5: Advanced performance management
94 © Emile Woolf Publishing Limited
Impact of staff empowerment
Delayering and employee empowerment
Management accounting impact x
4 Impact of staff empowerment
4.1 Delayering and employee empowerment
Delayering is a planned reduction in the number of layers of a management hierarchy. It is often accompanied by employee empowerment.
Employee empowerment is a strategy whereby powers previously held by managers are delegated to those that they used to manage. Employee empowerment helps employees own their work and take responsibility for their results. In recent years many large organisations have removed layers of management and empowered lower level employees.
The following are necessary in order for empowerment to be effective:
Employees must buy into it. For this to happen they must have real authority to make decisions and be able to control their area of responsibility.
Employees must share in corporate ethos and be committed to the strategic objectives of the company
Employee must be provided with information for decision making
Employee performance must be appraised fairly
4.2 Management accounting impact
There is a need to provide information at a different level than previously provided.
Information reports may need to be restructured to provide the employee with appropriate decision making and control information.
New performance measures and management processes will be required in order to appraise the employee. Information collection and processing might need to be refocused to allow this.

© Emile Woolf Publishing Limited 95
Paper P5 Advanced performance management
CH
AP
TER
5
External influences on organisational performance
Contents
1 The relevance of traditional management accounting systems: ‘relevance lost’
2 Risk and uncertainty
3 PESTEL analysis
4 Government regulation

Paper P5: Advanced performance management
96 © Emile Woolf Publishing Limited
The relevance of traditional management accounting systems: ‘relevance lost’
The purpose of management accounting systems
Are traditional management accounting methods still relevant?
Kaplan: ‘relevance lost’
Problems with standard costing and variances
The continuing relevance of standard costing systems
Making management accounting relevant
Trends in management accounting
1 The relevance of traditional management accounting systems: ‘relevance lost’
1.1 The purpose of management accounting systems
A management accounting system is a part of the management information system within an organisation. The purpose of management accounting is to provide information to managers that can be used to help them with making decisions. Traditionally, management accounting systems have provided financial or accounting information, obtained from accounting records and other data within the organisation. Commonly-used management accounting techniques have included absorption costing, marginal costing and cost-volume-profit analysis, budgeting, standard costing and budgetary control and variance analysis.
For various reasons, questions have been raised about the relevance of traditional management accounting to the needs of management in the modern business environment.
Traditional management accounting techniques such as standard costing and variance analysis do not provide all the information that managers need in manufacturing companies where Total Quality Management or Just in Time management approaches are used.
Traditional absorption costing is probably of limited value in a manufacturing environment where production processes are highly automated, and production overhead costs is a much more significant element of cost than direct labour.
Traditional management accounting focuses on manufacturing costs, whereas many companies (and other organisations) operate in service industries and provide services rather than manufactured products.
The traditional focus of management accounting has been on cost control or cost reduction. Lower costs mean that lower prices can be charged to customers, or higher profits can be made. However, many companies now seek to increase customer satisfaction and meet customer needs. To meet customer needs, other factors in addition to cost can be important – particularly product (or service)

Chapter 5: External influences on organisational performance
© Emile Woolf Publishing Limited 97
quality. Traditional management accounting ignores factors such as quality, reliability or speed of service.
Many traditional management accounting techniques have a short-term focus. There are exceptions. Discounted cash flow, for example, is used to evaluate long-term capital projects. However, traditional management accounting systems do not provide senior managers with the information they need for making strategy decisions. Strategic decision-making needs information about competitors, customers, developments in technology and other environmental (external) factors.
Management information systems should be capable of providing the information that managers need. For the management accounting system to be the main management information system within an organisation, it must be able to provide the necessary variety of information – financial and non-financial, long-term as well as short-term – using suitable techniques of analysis.
1.2 Are traditional management accounting methods still relevant?
Many businesses compete with each other on the basis of:
product or service quality and price
delivery
reliability
after-sales service
customer satisfaction – meeting customer needs.
These are critical variables in competitive markets and industries. Business organisations, faced with an increasingly competitive global market environment, must be able to deliver what the customer wants more successfully than their rivals. This means making sure that they provide quality for the price, and customer satisfaction, including the delivery, reliability and after-sales service that customers want or expect.
1.3 Kaplan: ‘relevance lost’
Some years ago, Robert Kaplan put forward an argument that management accounting systems had lost their relevance and did not provide the information that managers need to make their decisions. He suggested that the information needs of management had changed, but the information provided by management accountants had not. There was a danger that management accounting would lose its relevance – and value – entirely. Kaplan made the following criticisms of traditional management accounting systems:
Traditional overhead costing systems, where overheads were absorbed into costs at a rate per direct labour hour, were irrelevant. (Activity based costing has been developed as just one alternative for overhead cost analysis.)

Paper P5: Advanced performance management
98 © Emile Woolf Publishing Limited
Standard costing systems are largely irrelevant, because in many markets customers do not want to buy standard products. They want product differentiation.
Traditional management accounting systems fail to provide information about aspects of performance that matter – product and service quality (and price), delivery, reliability, after-sales service and customer satisfaction.
He argued that in today’s competitive market environment ‘traditional cost accounting systems based on an assumption of long production runs of a standard product, with unchanging characteristics and specifications, [are not] relevant in this new environment.’
The need for a change of focus in providing information to management
Traditional management accounting systems focus on reducing costs and budgetary control of costs. Kaplan argued that the focus was wrong:
In modern production systems, products are often designed and manufactured to specific customer demands and often have a short life cycle. Their design is often sophisticated, and they are overhead-intensive. Traditional management accounting systems, in contrast, assume standard products whose manufacture is directly labour-intensive.
Machinery used in production is often flexible, and can be switched between different uses and purposes. Traditional manufacturing systems assume that standard tasks require particular types of machine. Although they may focus on minimising the machine time per product manufactured, these systems do not provide information to help with optimising the use of available multi-purpose machinery.
1.4 Problems with standard costing and variances
Kaplan and Johnson have argued that standard costing and standard cost variances should not be used in a modern manufacturing environment for either:
cost control, or
performance measurement.
They argue that standard costs are no longer relevant in a modern manufacturing environment. Standard costing is used for standard products and the focus is on keeping production costs under control.
Kaplan and Johnson argued that using variance analysis to control costs and measure performance is inconsistent with a focus on the objectives of quality, time and innovation, which are now key factors in successful manufacturing operations.
Standard cost variances ignore quality issues and ignore quality costs. However, in a competitive market quality is a key success factor.
Manufacturing companies might have a system of Total Quality Management (TQM) in place, or something similar. An aim of TQM is to continue to find ways of achieving quality improvements, including cost reductions. With
Chapter 5: External influences on organisational performance
© Emile Woolf Publishing Limited 99
continuous improvement, there should be continual (small) reductions in costs. Standard costs – which are a fixed cost per unit – are inconsistent with the TQM objective of continuous improvement and cost reductions.
Another aim of the TQM approach is to eliminate waste from operations. Kaplan and Johnson argued that achieving standard costs is inconsistent with this TQM objective of eliminating waste. If waste is gradually eliminated, there should be continual reductions in costs.
When a company relies for success on innovation and new product design, many of its resources are committed to product design and development, and so many of its costs are incurred at this early stage of the product’s life. Cost control should therefore focus on design and development costs, whereas standard costing provides information about production costs for products that have already been developed and are now in production.
When product design and innovation are important, product life cycles will be short. It may therefore be appropriate to look at all the costs of a product over its full life cycle (including its design and development stages, and including marketing costs as well as production costs).
Standard costing variance analysis is restricted to monitoring the manufacturing costs of products during just a part of their life cycle.
Standard costs are only likely to apply in a stable and non-changing business environment. In many industries, the environment is continually changing, and products are adapted to meet the changing circumstances and conditions.
1.5 The continuing relevance of standard costing systems
However, there are still some advantages to be obtained from using a standard costing system.
Standard costs can be a useful aid for budgeting even in a Total Quality Management environment. Standard costs can be established for making products within the budget period to a target level of quality. If the TQM goals of continuous improvement and elimination of waste are achieved, the standard costs can be adjusted down for the next budget period.
Managers need short-term (‘real time’) feedback on costs. They need to know whether costs are under control, and they also need to understand the financial consequences of their decisions and actions. Variance analysis is a useful method of providing ‘real time’ feedback on costs.
Cost control is still an important aspect of management control. Quality, time and innovation may be critical factors, but so too is cost control. Standard costing and variance analysis provides a system for controlling costs in the short term.
Standard costs for existing products can provide a useful starting point for planning the cost for new products.
Standard costs can also be useful for target costing. The difference between the target cost for a product and its current standard cost is a ‘cost gap’. Standard costs can be used to measure the size of the cost gap. In order to achieve the target cost, managers can focus on this cost gap and consider ways in which it can be closed.

Paper P5: Advanced performance management
100 © Emile Woolf Publishing Limited
Overhead variances can provide useful information for cost control when many overhead costs are volume-driven.
1.6 Making management accounting relevant
If it is accepted that traditional management accounting systems are no longer relevant to the information needs of managers in a competitive business world, the obvious next question is what has to be done to make them relevant? The suggested answer is that management accounting systems need to recognise the factors that are critical for business success, and that management need to know about. These factors may be:
non-financial, as well as financial
longer-term (strategic) in nature, as well as short-term
strategic (concerned with objectives and strategies), as well as tactical (concerned with day-to-day management control)
related to factors in the business environment as well as to factors within the business entity itself (in other words, making use of external as well as internal information).
1.7 Trends in management accounting
New techniques have been developed in management accounting, in response to changes in the business environment. Examples of techniques that have been developed include activity based costing and activity based management, backflush accounting, throughput accounting, target costing, life cycle costing, environmental management accounting and the balanced scorecard approach to performance measurement. Some of these techniques have been developed in response to changes in manufacturing methods and systems.
Evaluating a management accounting technique
If the contingency theory of management accounting is valid, it should be expected that the management accounting techniques used in practice will vary with the particular information needs of the organisation. For your examination, you may be required to give your views about whether a particular management accounting technique is appropriate for the specific requirements of a particular organisation. The management accounting techniques used within an organisation must provide information that management need and will use. The key questions to ask, when assessing the usefulness of a management accounting system, are as follows: The information needs of management
What decisions do managers need to make?
What are they key factors that will affect their decisions?
Chapter 5: External influences on organisational performance
© Emile Woolf Publishing Limited 101
What are the critical items of information they need for their decisions?
The information provided by the management accounting system
Is the information provided:
- relevant to the decision-making needs of the managers?
- sufficiently comprehensive for these needs?
- reliable?
- available when needed?
Is the information provided in a clear and understandable form?
Are key items of information drawn to the attention of the manager, such as issues relating to controllability, trend or materiality?
Does the benefit of having the information justify the cost of providing it?

Paper P5: Advanced performance management
102 © Emile Woolf Publishing Limited
Risk and uncertainty
Decision-making and risk and uncertainty
Risk preference
Worst, most likely and best possible outcomes
Maximax, maximin and minimax regret decision rules
Expected values
3 Risk and uncertainty
3.1 Decision-making and risk and uncertainty
Decision-making, particularly long-term decision-making, has to be taken under conditions of risk and uncertainty.
Uncertainty occurs when there is insufficient information about what will happen, or what will probably happen, in the future. It is therefore likely that estimates of future values (future sales, future costs, and so on) will be inaccurate.
Risk occurs when future events of the future outcome could be any of several different possibilities. However, the probabilities of each possible outcome can be assessed with reasonable accuracy.
Uncertainty in decision-making can be reduced by obtaining more reliable information. Risk cannot be removed from a decision, because risk exists in the situation itself. A decision-maker can try to analyse the risk, and must make a decision on the basis of whether the risk is justified or acceptable.
3.2 Risk preference
Risk preference describes the attitude of a decision-maker towards risk. Decision-makers might be described as risk averse, risk-seeking or possibly risk neutral.
A risk averse decision maker considers risk in making a decision, and will not select a course of action that is more risky unless the expected return is higher and so justifies the extra risk. It is not correct to state that a risk-averse decision maker seeks to avoid risk as much as possible. However, a risk-averse decision maker might expect a substantially higher return to make the extra risk worth taking.
A risk neutral decision maker ignores risk in making a decision. The decision of a risk neutral decision maker is to select the course of action with the highest expected return, regardless of risk. The highest expected return could mean the highest EV of NPV or the highest EV of profit.
A risk-seeking decision maker also considers risk in making a decision. A risk seeker, unlike a risk-averse decision-maker, will take extra risks in the hope of earning a higher return. Given two options with the same EV of NPV, a risk seeker will prefer the option with the higher risk.

Chapter 5: External influences on organisational performance
© Emile Woolf Publishing Limited 103
Example A company must make a choice between three different projects A, B and C. These three projects are mutually exclusive. The net present values of each project have been estimated as follows.
Project A Project B Project C
NPV NPV NPV Probability 0.5 + 800,000 + 2,000,000 + 100,000 Probability 0.5 - 500,000 - 1,700,000 + 50,000 Expected value of NPV + 150,000 + 150,000 + 75,000
Projects A and B have a higher expected NPV than project C, but are more risky. Project C would have a positive NPV, whereas projects A and B have a 50% chance of a negative NPV. Project B is more risky than project A, although it has the same expected return (NPV) of + 150,000. With project B, the NPV could be as high as + 2,000,000, but could also be as low as – 1,700,000. So which project should be undertaken?
A risk-averse decision-maker would choose either project A or project C. Project C offers a lower return but lower risk, and project A has a higher expected return but higher risk. A risk-averse decision maker would not choose project B, because project A offers the same expected return for less risk.
A risk-seeking decision-maker would choose project B rather than project A, in the hope of making a return of + 2,000,000.
A risk-neutral decision-maker might choose either project A or project B because they both offer the same expected return, which is higher than the expected return from project C.
3.3 Worst, most likely and best possible outcomes
The choice between two or more alternative courses of action might be based on the worst, most likely or best expected outcomes from each course of action. A simple example will be used to explain this point.
Example A company must make a decision between three possible courses of action, 1, 2 and 3. The expected profit or loss from each course of action has been estimated as follows.
Course of action Worst possible outcome
Most likely outcome
Best possible outcome
Course 1 - 1,000 + 4,000 + 5,000 Course 2 - 500 + 2,500 + 7,000 Course 3 - 3,000 + 1,000 + 9,000
The course of action chosen by the company will depend on the attitude to risk of its decision-maker.

Paper P5: Advanced performance management
104 © Emile Woolf Publishing Limited
A decision might be taken to select the project where the possible loss is the lowest. This would be course of action 2, where the worst outcome is – 500. This is not as bad as the worst outcome for courses of action 1 and 3. A risk-averse decision-maker might choose this course of action.
A decision might be taken on the basis of the most likely outcome. The preferred course of action would then be the one where the expected return is highest. In this example, the preferred course of action would be course 1, where the most likely return is + 4,000. This is better than course 2 (+ 2,500) or course 3 (+ 1,000).
A decision might be taken on the basis of the best possible return. The preferred course of action would then be the one that offers the highest return. Here, the preferred course of action would be course 3 (+ 9,000). This course of action would be the choice of a risk-seeking decision-maker.
The main disadvantage of choosing between mutually-exclusive courses of action on the basis of the worst, most likely or best possible outcome is that the choice ignores the likelihood or probability of the worst, most likely or best outcomes actually happening.
3.4 Maximax, maximin and minimax regret decision rules
Choosing between mutually-exclusive courses of action on the basis of worst, most likely or best possible outcome can be stated as ‘decision rules’. The choice may be based on a maximax, maximin or a minimax regret decision rule.
Maximax decision rule. The decision maker will select the course of action with the highest possible pay-off. The decision maker seeks the highest return, assuming that events turn out in the best way possible. The maximax decision rule is a decision rule for the risk seeker.
Maximin decision rule. The decision maker will select the course of action with the highest expected return under the worst possible conditions. This decision rule might be associated with a risk averse decision maker.
Minimax regret decision rule. The decision maker selects the course of action with the lowest possible ‘regret’. ‘Regret’ is the opportunity cost of having made the wrong decision, given the actual conditions that apply in the future.
Example
A business entity has to decide which of three projects to select for investment. The three projects are mutually exclusive, and only one of them can be selected.
The expected profits from investing in each of the projects will depend on the state of the market. The following estimates of net present value have been prepared:
State of market Diminishing Static Expanding
Probability 0.4 0.3 0.3 $000 $000 $000 Project 1 100 200 950 Project 2 0 500 600 Project 3 180 190 200

Chapter 5: External influences on organisational performance
© Emile Woolf Publishing Limited 105
Which options would be selected:
(a) under the maximax decision rule
(b) under the maximin decision rule
(c) under the minimax regret decision rule?
Answer (a) Maximax decision rule. The most favourable outcome is an expanding
market. Project 1 offers the highest return in an expanding market; therefore project 1 will be selected.
(b) Maximin decision rule. The least favourable outcome is a diminishing market. The most favourable outcome in a diminishing market is project 3; therefore project 3 will be selected.
(c) Minimax regret decision rule. To establish the decision under the minimax regret decision rule, we must first prepare a pay-off table showing the regret the decision-maker would have choosing option 1, option 2 or option 3, and the actual market conditions turn out diminishing, static or expanding.
The regret with each course of action is shown in the pay-off table below. The right-hand column of the table shows the maximum regret.
State of market Diminishing Static Expanding Maximum regret
$000 $000 $000 Project 1 80 300 0 300 Project 2 180 0 350 350 Project 3 0 310 750 750
If you are not sure how regret is calculated, the following notes might be helpful.
If project 1 is selected and the market condition turns out to be diminishing, the regret will be not having chosen option 3, because the NPV with option 1 would be 100 and with option 3 it would be 180. The regret is therefore 180 – 100 = 80.
If project 1 is selected and the market condition turns out to be static, the regret will be not having chosen option 2, because the NPV with option 1 would be 200 and with option 2 it would be 500. The regret is therefore 500 – 200 = 300.
If project 1 is selected and the market condition turns out to be expanding, there is no regret because the best possible option has been chosen.
The maximum regret with option 1 is the highest of 180, 300 and 0. This is 300.
The minimum ‘maximum regret’ is 300 with option 1. Option 1 would therefore be selected if the minimax regret rule is applied.
3.5 Expected values
Expected values can be used to analyse information where risk can be assessed. Where probabilities are assigned to different outcomes, we can evaluate the worth of a decision as the expected value or weighted average of these outcomes. Expected value (EV) = weighted average of possible outcomes.

Paper P5: Advanced performance management
106 © Emile Woolf Publishing Limited
The weighted average value is calculated by applying the probability of each possible outcome to the value of the outcome.
EV = ∑px
Where p = the probability of each outcome and x = the value of each outcome
An EV is a measurement of weighted average value.
A decision might be based on selecting the course of action that offers the highest EV of profit, or the lowest EV of cost. In other words, the ‘decision rule’ is to select the course of action with the highest EV of profit or the lowest EV of cost.
The main advantage of using EVs to make a decision, compared to the decision rules explained earlier, is that it takes into consideration the probability or likelihood of each different possible outcome.
Example A business entity has to decide which of three projects to select for investment. The three projects are mutually exclusive, and only one of them can be selected. The expected profits from investing in each of the projects will depend on the state of the market. The following estimates of net present value have been prepared:
State of market Diminishing Static Expanding
Probability 0.4 0.3 0.3 $000 $000 $000 Project 1 100 200 900 Project 2 0 500 600 Project 3 180 190 200
(Note: This type of table is called a ‘pay-off table’ or a ‘pay-off matrix’. It shows all the possible ‘pay-offs’ or results – NPV, profit and so on – from different possible decisions or strategies).
Required Identify which project would be selected if the decision is to choose the project with the highest expected value of NPV.
Answer
State of market Probability Project 1 Project 2 Project 3
NPV EV of NPV
NPV EV of NPV
NPV EV of NPV
$000 $000 $000 $000 $000 $000 Diminishing 0.4 100 40 0 0 180 72 Static 0.3 200 60 500 150 190 57 Expanding 0.3 900 270 600 180 200 60 370 330 189

Chapter 5: External influences on organisational performance
© Emile Woolf Publishing Limited 107
Based on expected values, project 1 should be selected.
Advantages of using expected values
Using EVs to make a decision has some advantages.
An EV is a weighted average value, that is based on all the different possible outcomes and the probability that each will occur.
It recognises the risk in decisions, based on the probabilities of different possible results or outcomes.
It expresses risk in a single figure.
Disadvantages of using expected values
Using EVs to make a decision also has some disadvantages.
The probabilities of the different possible outcomes may be difficult to estimate.
The EV is unlikely to be an actual outcome that could occur. In the example above, the EVs for projects 1, 2 and 3 (370, 330 and 189) are not expected to occur. They are simply weighted average values.
Unless the same decision has to be made many times, the average will not be achieved. It is therefore not a valid way of making a decision about the future when the outcome will happen only once.
An EV is an average value. It gives no indication of the range or spread of possible outcomes. It is therefore an inadequate measurement of risk.

Paper P5: Advanced performance management
108 © Emile Woolf Publishing Limited
PESTEL analysis
The nature of environmental analysis
The elements of PEST analysis
PEST analysis at the ‘macro’ level
PEST analysis at the departmental or divisional level
Economic and market trends
The influence of fiscal policy and monetary policy
Environmental and ethical issues
4 PESTEL analysis
4.1 The nature of environmental analysis
A business entity cannot exist in isolation from its environment. It inter-relates with its environment, and its survival and strategic success depend on how well it responds to the threats and opportunities that the environment provides. An entity’s environment is anything that is not a part of the entity itself. For a business organisation, the environment includes customers, potential customers, markets, competitors, suppliers, governments and potential sources of new employees. It also includes the social, political and economic environment in which the entity exists and operates. The term ‘macro-environment’ is used to mean general factors in the business environment of an entity, rather than specific customers, suppliers and competitors. Environmental influences on an organisation vary with the size of the organisation, and the industry and the countries in which it operates. The importance of environmental factors for strategic management arises because:
organisations operate within their environment and interact with it
changes in the environment can be large and significant – and continually happening
future changes can be very difficult to predict.
4.2 The purpose of environmental analysis
Environmental analysis is a part of the process of assessing strategic position. In order to make strategic choices about the future, the management of an entity need to understand:
the factors in the environment that have a significant effect on the entity and what it does

Chapter 5: External influences on organisational performance
© Emile Woolf Publishing Limited 109
the key drivers of change: these are the factors in the environment that will have the greatest effect on the entity, and force the entity to change its strategies in order to survive and succeed
the difference in impact that key drivers of change in the environment will have on different industries or different markets, or how changes in the environment might affect one particular entity more or less than other entities.
It is also important to consider the future impact of factors in the environment. The future impact might be different from the impact that they have had in the past. Some factors might grow in significance; others might become less significant.
Environmental analysis is the process of:
studying the environment in which an entity operates
identifying significant factors in the environment, particularly those that will be significant in the future.
The purpose of the analysis is to assess the environment, to analyse the position of an entity in relation to its environment and to judge how the entity’s strategies should be developed to take advantage of opportunities and the deal with any potential threats. It is a first step towards formulating a business strategy.
4.3 The elements of PESTEL analysis
PESTEL analysis is a structured approach to analysing the external environment of an entity. The influences (current influences and possible future influences) of the environment on the entity are grouped into categories. For each category of environmental influence, the main influences are identified. There are six categories of environmental influence:
P – Political environment
E – Economic environment
S – Social and cultural environment
T – Technological environment
E – Ecological influences
L – Legal environment
The purpose of dividing environmental influences into categories is simply to make it easier to organise the environmental analysis and ensure that some key influences are not over-looked. It provides a useful framework for analysis.
This approach to analysis is also called:
SLEPT analysis, when ‘legal influences’ are added as a separate category of influences, or
PESTLE analysis when ‘legal influences’ and ‘environmental/ecological influences’ are added as separate categories of influence.

Paper P5: Advanced performance management
110 © Emile Woolf Publishing Limited
4.4 PEST analysis at the ‘macro’ level
PEST analysis is normally used at the ‘macro’ level. This means that it is used to analyse environmental influences on the company or organisation as a whole.
Political environment
The political environment consists of political factors that can have a strong influence on business entities and other organisations. Investment decisions by companies will be influenced by factors such as:
the stability of the political system in particular countries
the threat of government action to nationalise the industry and seize ownership from private business
wars and civil unrest
the threat of terrorist activity.
Political considerations are particularly important for business entities operating in countries with an unstable political regime, or a dictatorship.
Economic environment
The economic environment consists of the economic influences on an entity and the effect of possible changes in economic factors on future business prospects. Factors in the economic environment include:
the rate of growth in the economy
the rate of inflation
the level of interest rates, and whether interest rates may go up or fall
foreign exchange rates, and whether particular currencies are likely to get weaker or stronger
unemployment levels and the availability of skilled or unskilled workers
government tax rates and government subsidies to industry
the existence or non-existence of free trade between countries, and whether trade barriers may be removed
the existence of trading blocs of countries, such as the European Community.
Economic factors could affect a decision by a company about where to invest. Tax incentives, the availability of skilled labour, a good transport infrastructure, a stable currency and other factors can all influence strategic choices.
Social and cultural environment
An entity is affected by social and cultural influences in the countries or regions in which it operates, and by social customs and attitudes. Some influences are more significant than others. Factors in the social and cultural environment include the following:
The values, attitudes and beliefs of customers, employees and the general public.

Chapter 5: External influences on organisational performance
© Emile Woolf Publishing Limited 111
Patterns of work and leisure, such as the length of the working week and popular views about what to do during leisure time
The ethnic structure of society
The influence of religion and religious attitudes in society
The relative proportions of different age groups in society.
Technological environment
The technological environment consists of the science and technology available to an organisation (and its competitors), and changes and developments in science and technology. Some aspects of technology and technological change affect virtually all organisations. Developments in IT and computer technology, including the Internet, are the most obvious example. Business entities that do not respond to changes in IT and computerisation risk losing their share of the market to competitors. However, technological change might also affect particular industries. Scientific developments in food and drugs, for example, are having a continual impact on companies in these industries. For strategic planning, companies need to be aware of current technological changes and the possible nature of changes in the future. Technology could have an important influence, for example, on investment decisions in research and development, and investment in new technology.
Ecological influences
For business entities in some industries, environmental factors have an important influence on strategic planning and decision-making. They are particularly important for industries that are:
subject to strict environmental legislation, or the risk of stricter legislation in the future (for example, legislation to cut levels of atmospheric pollution)
faced with the risk that their sources of raw materials will be used up (for example, parts of the fishing industry and timber production industry)
at the leading edge of technological research, such as producers of genetically modified foods.
In some countries, companies have seen a commercial advantage in presenting themselves as ‘environment-friendly’, by improving their reputation with the general public. Several companies have adopted a policy of becoming ‘carbon neutral’ so that they remove as much carbon dioxide from the atmosphere as they add to carbon dioxide with emissions from their operating activities. (It was reported in the UK in 2007 that the demand from UK companies to acquire energy from renewable energy sources was far in excess of the capacity of the energy companies to supply energy from those sources.) Major oil companies are investing in the development of energy from renewable energy sources, such as the sea and wind.

Paper P5: Advanced performance management
112 © Emile Woolf Publishing Limited
Legal environment
The legal environment consists of the laws and regulations affecting an entity, and the possibility of major new laws or regulations in the future. Laws and regulations vary between different countries, although international regulation is accepted in certain areas of commercial activity, such as banking. Strategic decisions by an entity might be affected by legal considerations. For example:
an international company might locate some operations, for tax reasons, in a country with a favourable tax system
decisions to relocate operations from one country to another could be affected by the differences in employment law in the two countries, or by new employment legislation
in many industries, companies are faced with environmental legislation or health and safety legislation, affecting the ways in which they operate, as well as the design of the products they make and sell.
PEST analysis at the ‘macro’ level should be carried out whenever an entity is considering a strategic move into an unfamiliar region or industry. For example, if a company is considering whether or not to invest in a new operation in a different country, the decision should not be taken without giving very careful consideration to PEST factors – political conditions in that country (and the ‘sovereign risk’ associated with that country), cultural attitudes in the country, and how they differ from cultures in the countries where the company already operates.
4.5 PEST analysis at the departmental or divisional level
PEST analysis can also be used to analyse the influences within an organisation on a department or division within an organisation. The ‘environmental’ influences in this case are factors outside the department, but relating to the organisation as a whole. This use of PEST analysis can be helpful for considering the effect of a planned ‘business solution’ in a department. The method of analysis is the same as for PEST analysis at the macro level. The tables below give examples of what organisational influences on a department might be.
Political influences Company policies Organisational strategy The attitude of the board of directors A change in the CEO or any other member of the board of directors The management structure in the organisation, and lines of reporting and control Management style

Chapter 5: External influences on organisational performance
© Emile Woolf Publishing Limited 113
Economic influences Budget spending allocations Cross-charging policies (transfer pricing) Accounting models and methods used
Sociological influences Work practices in the organisation Expected working hours Flexibility allowed in working time Autonomy given to individual members of staff The likelihood of organisational change and employee attitudes The likelihood of redundancies and employee attitudes
Technological influences The capabilities of existing IT systems
4.6 Economic and market trends
Companies need to be aware of trends in the economy generally and in the markets for their products and services. Many companies operate in a global market place, and they need to monitor global economic developments and market trends. In other words:
Some economic and market factors should influence strategic planning.
Unexpected changes in the economy and in particular markets will affect performance, so that performance exceeds expectation or is worse than expected, for reasons outside management’s control.
Here are just a few examples.
There appears to be a major shift in worldwide production from countries in North America and Europe towards countries such as China and India, where production costs are lower. A multinational company planning its future manufacturing or outsourcing strategy should consider this trend. Decisions about where to produce goods, or whether to purchase (outsource) rather than manufacture internally, will affect the competitive position of the company in the future.
There might be a forecast of an economic downturn in the USA. North America is an important market for companies in many other countries of the world. A fall in demand in US markets could have significant consequences for these companies.
There is a growing recognition that energy might become more restricted in supply and more expensive in future years. Supply shortages might occur with other natural resources, such as hard wood and fish stocks. Companies might decide to develop strategies to deal with expected shortages in order to remain competitive, such as becoming more energy-efficient and trying to secure future supplies of key materials.
Unexpected changes in economic and market conditions will also affect the performance of companies. For example:

Paper P5: Advanced performance management
114 © Emile Woolf Publishing Limited
If total demand for a product falls unexpectedly, all companies operating in the market should expect profits to be lower than expected. Provided that the market is still profitable, companies should expect to maintain their percentage share of total market sales (in other words, maintain their competitive strength).
A company might have a growth strategy, expecting to achieve large increases in sales and profitability. The success of this strategy might depend on having access to new capital funding, in order to finance the growth in business. The success of this strategy might be affected by an unexpected shortage of capital in the markets of equities and debt capital, or by an unexpected increase in the cost of new finance.
The profitability of a multinational company might be affected by changes in an important foreign exchange rate. For example, if a UK company sells its products in the US markets, and prices its goods in dollars, its profitability (measured in pounds sterling) would be affected by a fall in the value of the dollar against the pound.
4.7 The influence of fiscal policy and monetary policy
Fiscal policy refers to government policy on taxation, government spending and government borrowing. Monetary policy refers to government efforts to control the national economy by controlling interest rates or the exchange rate. The strategic decisions of companies, and their performance, can be significantly affected by fiscal and monetary policy. For example:
The profitability of companies is affected by taxation. Changes in tax rules and rates of taxation will have an impact on company profits.
Increases in government spending will benefit companies that supply goods or services to the government.
A government decision to increase interest rates will raise the cost of new borrowing and existing variable rate borrowing. It will also (possibly) reduce the willingness of customers to borrow and spend, which means that the total market demand for products might fall.
Chapter 5: External influences on organisational performance
© Emile Woolf Publishing Limited 115
Government regualtion
Introduction
Government as a regulator
Impact on performance measurement
5 Government regualtion Although the main objective of a company might be to maximise returns to its shareholders (for a given level of risk), strategy formulation and implementation is often strongly influenced by government policy. The influence of government policy on strategy varies from one company to another.
5.1 Introduction
Organisations must assess their performance within the environment within which they operate.
Governments have huge impact on businesses. Government policy impact many areas of the environment within which companies operate.
Some areas are directly under their control:
Taxation policies of national governments could affect the decisions of multinational companies about where to locate their operations. A government might try to attract inward investment by offering subsidies to companies that invest in the country. High taxation could persuade companies to re-locate in another country.
Government policy on competition in markets affects some industries. Mergers or takeovers that would create a monopoly in a market could be prevented, because they are against the ‘public interest’.
Employee legislation (minimum wage; health and safety; retirement age)
Competition regulation
Consumer protection legislation
Other areas are not controlled but are influenced by macroeconomic policies:
Inflation
Exchange rates
Interest rates
In many countries, the government is a major customer of commercial companies. Government economic policy might therefore affect strategy formulation. For example, if a government announces a large and sustained increase in spending on hospitals and the health service, this could affect the investment plans of companies that supply the health service.
A national government might have a policy of protecting important domestic industries against takeovers by foreign companies. This could affect strategic planning by companies that could become a takeover target, and also planning by multinational companies wishing to expand through foreign acquisitions.

Paper P5: Advanced performance management
116 © Emile Woolf Publishing Limited
5.2 Government as a regulator
In addition to the above, some entities are regulated by the government either directly or through agencies set up for the purpose. These entities may be subject to regulation which impacts:
Price of output
Quality of output
Quantity of output
Such entities include public sector organisations (health service; schools; armed forces), businesses under direct ownership (e.g. the Royal Mail in the UK) and privatised companies.
Privatised companies are those that were once owned by the state but have been sold into private ownership. In the UK this includes utility companies and British Telecom.
The government is responsible for ensuring that these entities function in the public interest. Government requirements on these entities will impact aspects of how they measure performance.
5.3 Impact on performance measurement
Public sector organisations
These are funded by the government in order to provide a service to the citizens of the state.
The main objective of a public sector organisation is non-financial. In a health service, the main objective is to provide health care. In an education system, schools and universities exist to provide education.
However, not-for-profit organisations have important financial objectives, even if these objectives are not their main objective, and they need financial management.
In particular, these organisations must operate within the limitation of the amount of resources and finance they have at their disposal.
Financial managers in not-for-profit organisations try to ensure the careful use of resources and finance. Government will require that the organisation provides value for money (VFM). Value for money has three elements:
Economy. Economy means operating in a way that does not waste money. Expenditure should be controlled and unnecessary spending should be avoided.
Efficiency. Efficiency means using resources in the most efficient way possible, and getting the most out of them. For example, employees should work efficiently and the aim should be to achieve high productivity levels.
Effectiveness. Effectiveness means using resources and spending money so as to achieve targets and objectives.
Government will set benchmarks against which each of these might be measured and this will drive the organisation to meet these benchmarks.

Chapter 5: External influences on organisational performance
© Emile Woolf Publishing Limited 117
Privatised companies
When a state owned entity is privatised the government are often concerned that the company continues to provide service at an acceptable level and price to the public at large. The privatised companies are allowed to operate as normal commercial companies, except that they are also required to meet minimum specified levels of performance. For example:
water supply companies are required to ensure supplies of water and also to maintain and replace water pipes and systems.
Companies operating train services are expected to maintain minimum standards of service, or risk the loss of their operating franchise.
The companies involved must meet service levels set by the government or face financial sanctions. This means that its performance measurement system must include targets aimed at meeting these levels.

Paper P5: Advanced performance management
118 © Emile Woolf Publishing Limited

© Emile Woolf Publishing Limited 119
Paper P5 Advanced performance management
CH
AP
TER
6
Performance measurement systems
Contents
1 Accounting information requirements
2 Impact of structure
3 Integration of management accounting in an information system
4 Lean systems
5 Influence of contingent factors
6 Responsibility accounting
7 Sources of information
8 Recording and processing methods
9 Management reports

Paper P5: Advanced performance management
120 © Emile Woolf Publishing Limited
Accounting information requirements
Qualities of information
Information for different management levels
1 Accounting information requirements
1.1 Qualities of information
Information is only useful to managers if it possesses certain qualities.
Purpose and relevance. Information should have a purpose and should be needed by management for a particular reason. The information provided should be relevant to this purpose.
Timeliness. Information must be timely. This means that it must be made available to managers in time to use it for making a decision. If information is provided too late for its purpose, it has no value.
Reliable. Management information must be reliable. It does not have to be 100% accurate, but it should be as accurate as it needs to be for its purpose.
Understandable. Information should be understandable to the individuals who use it. For accountants, this often means having to make sure that the figures provided to managers are set out clearly and are properly explained.
Sufficiently complete. Information should be as complete as it needs to be. There should be no important omissions. However, information in management reports should not be excessive, because important information may be hidden in the unimportant information, and it will take managers too long to read and understand.
Communicated to the right person. Management information should be communicated to the proper person. This is the person with the authority to make a decision on the basis of the information received and who needs the information to make the decision.
Its value must exceed its cost. Management information has a value. The value of information comes from improving the quality of management decisions. More information is worth having if it helps to improve management decisions, and the benefits from those decisions exceed the cost of providing the information.
1.2 Information for different management levels
Information should be provided to managers to help them to make decisions. The nature of the information required varies according to the level of management and the type of decision. Within organisations, there are management information systems that provide this information. A major element of the overall management information system should be the management accounting system.

Chapter 6: Performance measurement systems
© Emile Woolf Publishing Limited 121
A management accounting system should provide information for strategic management, tactical management and operational management. The requirements of management for information vary with the level of management. This concept is set out simply in the diagram below.
Levels of management and information requirements
Strategic management information
Strategic management information is information that helps strategic managers to:
make long-term plans
assess whether long-term planning targets will be met, and
review existing strategies and make changes or improvements.
Strategic management needs strategic information. The characteristics of strategic information may be summarised as follows:
It is often information about the organisation as a whole, or a large part of it.
It is often in summary form, without too much detail.
It is generally relevant to the longer-term.
It is often forward-looking.
The data that is analysed to provide the information comes from both internal and external sources (from sources inside and outside the organisation).
It is often prepared on an ‘ad hoc’ basis, rather than in the form of regular and routine reports.
It may contain information of a qualitative nature as well as quantified information.
There is often a high degree of uncertainty in the information. This is particularly true when the information is forward-looking (for example, a forecast) over a number of years in the future.

Paper P5: Advanced performance management
122 © Emile Woolf Publishing Limited
Tactical information
Tactical information is information reported to middle managers in a large organisation, or for the purpose of annual planning and budgetary control. Tactical information is used to decide how the resources of the organisation should be used, and to monitor how well they are being used. It is useful to relate tactical information to the sort of information that is contained in an annual budget. A budget is planning at a tactical management level, where the plan is expressed in financial terms. The general features of tactical information are as follows:
It is often information about individual departments and operations.
It is often in summary form, but at a greater level of detail than strategic information.
It is generally relevant to the short-term and medium-term.
It may be forward-looking (for example, medium-term plans) but it is often concerned with performance measurement. Control information at a tactical level is often based on historical performance.
The data that is analysed to provide the information comes from both internal and external sources (from sources inside and outside the organisation), but most of the information comes from internal sources.
It is often prepared on a routine and regular basis (for example, monthly or weekly performance reports).
It consists mainly of quantified information.
There may be some degree of uncertainty in the information. However, as tactical plans are short-term or medium-term, the level of uncertainty is much less than for strategic information.
Control reports might typically be prepared every month, comparing actual results with the budget or target, and much of the information comes from internal sources. Examples of tactical information might be:
variance reports in a budgetary control system
reports on resource efficiency, such as the productivity of employees
sales reports: reports on sales by product or by customer
reports on capacity usage.
Operational information
Operational information is needed to enable supervisors and front line (operational) managers to organise and monitor operations, and to make on-the-spot decisions whenever operational problems arise. Operational information may also be needed by employees, to process transactions in the course of their regular work. The general features of operational information are as follows:
It is normally information about specific transactions, or specific jobs, tasks, daily work loads, individuals or work groups. (It is ‘task-specific’.)

Chapter 6: Performance measurement systems
© Emile Woolf Publishing Limited 123
It may be summarised at a work group or section level, but is in a more detailed form than tactical information.
It is generally relevant to the very short-term.
It may be forward-looking (for example, daily plans) but it is often concerned with transactions, procedures and performance measurement at a daily level.
The data that is analysed to provide the information comes almost exclusively from both internal sources (from sources inside the organisation).
It consists mainly of quantified information. Most of this information is ‘factual’ and is not concerned with uncertainty.
Operational information is provided regularly, or is available online when required. It is concerned with operational details, such as:
the number of employees in the department absent from work
wastage rates in production
whether the scheduled work load for the day has been completed
delays and hold-ups in work flow, and the reasons for the delay
whether a customer’s order will be completed on time.
In many respects, strategic information, tactical information and operational information are all concerned with the same things – business plans and actual performance. They are provided in different amounts of detail and with differing frequency. However, with the development of IT systems and internal and external databases, it is possible for all levels of information to be available to managers online and on demand.
Example An accountancy tuition company has a strategic target of increasing its annual sales. What strategic, tactical and operational decisions might be taken towards achieving this target?
Answer Here is a suggested answer.
(a) At a strategic level management may decide it is necessary to increase sales by 20%. It will then need to study the company and its business environment and decide how this might be done – for example by developing the existing business, buying a competitor company, or diversifying into other forms of training, such as training lawyers or bankers.
(b) At a tactical level, a budget should be prepared for the next year, based on strategic decisions already taken. Middle management should consider a variety of plans for achieving targets, such as spending more money on advertising, recruiting more trainers and running more training programmes. Targets might be set for each type of course or each geographical training centre location.

Paper P5: Advanced performance management
124 © Emile Woolf Publishing Limited
(c) Operational management will make decisions about the courses and their administration, such as making special offers (free study materials) to attract more students, running additional courses when demand is strong, and making sure that all student fees are collected.
Example What do you think might be the information requirements of the manager in each of the following scenarios? Scenario 1 Wang Chung is the production director of a large Chinese factory producing music compact discs (CDs). He is considering a joint venture with a TBC Limited, a small CD producer in the UK, with the aim of supplying lower-cost CDs to the UK and European markets and thereby increasing profitability. Scenario 2 James Pearce is a supervisor of a department responsible for making alterations to motor vans so that people can sleep in them and use them for overnight accommodation. He is in charge of the six people in his department and receives daily performance data on times taken by staff to complete their work compared to predetermined standard times. The department operates two eight-hour shifts each day. Two members of staff have requested time off on the same shift. This would disrupt the work production schedule. James can only permit one member of staff to take the time off, and so he has decided to accept one request and turn down the other.
Answer
Here is a suggested answer. Scenario 1 Wang Chung needs strategic information to help him with the strategic planning for the joint venture. The information he is likely to need includes:
How the joint venture will operate. What will be the responsibilities of the joint venture partners?
Information about the business history and financial status of the joint venture partner.
The target markets for the CDs.
Conditions within these target markets.
The products that the joint venture will plan to sell.
The target selling price
Details of how the lower-cost production and selling will be achieved.
The nature (and prices) of competitors in these markets
The term of the joint venture agreement.
Financial data: the size of investment required, including working capital. Estimated sales and costs over the planning period.

Chapter 6: Performance measurement systems
© Emile Woolf Publishing Limited 125
The risk in the project.
Scenario 2 James Pearce has to make an operational decision, and decide which of the two employees should be given the time off. The information he needs might be:
The reasons why each employee wants the particular day off work, and whether either is willing to change to another day
How much holiday each employee has taken so far during the year, and the total number of days to which each is entitled
Whether there are policy guidelines or rules within the company about how this type of decision should be made
Whether there might be an available substitute worker who could be used for a day, so that both employees can take the same day off work.
1.3 Compatibility of management accounting and management accounting information
The Chartered Institute of Management Accountants (CIMA) define management Accounting as:
The process of identification, measurement, accumulation, analysis, preparation, interpretation and communication of information used by management to plan, evaluate and control within an entity and to assure appropriate use of and accountability for its resources. Management accounting also comprises the preparation of financial reports for non-management groups such as shareholders, creditors, regulatory agencies and tax authorities
One of the main aims of management accounting is to provide decision useful information. In a perfect world there would be complete compatibility between the management accounting system and management accounting information required by users. In reality this may not always be the case. The reasons for this might include:
System inertia where the same information is produced year after year even though the information requirements of users have changed.
Requirement for information on areas not addressed by the system.
Lack of communication of user needs to the management accounting function.

Paper P5: Advanced performance management
126 © Emile Woolf Publishing Limited
Impact of structure
The nature of new institutional theory
New institutional theory and changes in management accounting practice
2 Impact of structure The impact of structure on information needs has been covered earlier. Institutional theory might help to explain why some organisations use management accounting techniques and reporting systems that are not actually the most appropriate for the information requirements of the organisation’s managers.
2.1 The nature of new institutional theory
An institution is something that gives stability and meaning to social behaviour. It is an established way of behaving and thinking. ‘Institution’ therefore has a meaning that relates to ‘something becoming an established institution’ or ‘something becoming institutionalised’
New institutional theory is an approach to the study of behaviour in organisations. The theory is based on the view that the attitudes, habits and established views within an organisation are influenced by its ‘institutional environment’.
Established rules, beliefs and practices within an organisation are formulated by adopting the rules, beliefs and practices within other organisations. The way that an organisation operates is therefore decided not so much by what is best for the organisation, but by how things are done generally in all other similar organisations.
DiMaggio and Powell suggested that organisations operating in similar environments are subject to the influence of established views about what is generally regarded as ‘acceptable’ behaviour’. As a result, all these organisations tend to have similar structures and processes. Quite simply, the theory is that all organisations become institutionalised. They adopt the common practices of other organisations in the industry, and the same attitudes.
Powell and diMaggio identified three factors that make organisations copy the practices and processes of other organisations:
pressures imposed on organisations to behave in a particular way by government, regulations and possibly by supplier relationships
attitudes that are adopted when an organisation faces uncertainty and, in response to this uncertainty, it copies the practices of another organisation that it considers to be more successful or ‘legitimate’
attitudes of professionalism and the view that it is necessary to conform to a set of norms or rules developed by a professional body or group. Management accountants, for example, tend to conform to practices established by their professional bodies.
Chapter 6: Performance measurement systems
© Emile Woolf Publishing Limited 127
2.3 New institutional theory and changes in management accounting practice
This institutionalisation extends to management accounting systems. This is why it is usual to find that certain management accounting methods are used in particular industries and not in others. There is a tendency for all organisations to use the same management accounting techniques because they are generally established and widely accepted, not because they are techniques that are necessarily useful and relevant to the organisation itself.
Accounting is a social and institutional practice that inter-reacts with social relations within an organisation. When social relations within an organisation change, accounting systems will also change. For example, consider a situation in which a large company acquires control over a new subsidiary.
The board of directors of the company will require information about the new subsidiary in order to monitor its performance.
To meet the requirements of the new owner, practices and procedures in the subsidiary will change. The management accounting reporting system will also have to change, in response to the changes in practices and procedures.
New accounting practices will be introduced.
The new accounting procedures and practices will then be reproduced by other individuals who are responsible for introducing the new reporting system.
The new accounting practices might gain widespread acceptance, so that they come to be regarded as essential. In other words, they become institutionalised within the organisation.
This view perceives organisations needing legitimacy to survive. The organisation then adopts structures, job roles and policies e.g. Health and Safety, Equal Opportunities to appease outsiders. Unfortunately for the firm these do not increase efficiency or profitability.

Paper P5: Advanced performance management
128 © Emile Woolf Publishing Limited
Integration of management accounting systems in management information system
Control system theory
Feedback control system
Feed-forward and double loop feedback
Using control system theory
Enterprise resource planning systems
3 Integration of management accounting systems in management information system
3.1 Control system theory
Control system theory can be used to analyse information systems for planning, measuring performance and control. It is sometimes used to analyse a budgetary control system, but its general principles are relevant to any systems of planning and control, or systems of performance measurement. An information system is a form of control system. It is used to establish planning targets, and to compare actual performance against targets. When actual performance is below target, control measures can be taken to improve performance and bring it up to the target level.
Open systems and closed systems
In control system theory, systems are either open or closed.
An open system is one that interacts with its environment. It is affected by its environment, and accepts input from its environment. The system also produces output that goes into its environment.
A closed system is one that does not interact with its environment. It is ‘shut off’ from its environment, and does not accept any input from the environment.
A business entity, for example is an open system. It interacts with its environment and is influenced by conditions in the environment. It accepts inputs from the environment (materials from suppliers, capital from investors, labour) and it produces output that affects its environment. The distinction between open and closed systems might seem odd. However, there is some relevance in the context of management information systems and management accounting.
A management information system that does not take in data from its environment can be described as a closed system.
In contrast, a management information system that obtains data from external as well as internal sources can be described as an open system.

Chapter 6: Performance measurement systems
© Emile Woolf Publishing Limited 129
Ideally, management accounting systems should obtain data from external as well as internal sources. In practice, they might rely on data from internal sources, and exclude external sources of data.
3.2 Feedback control system
Using control system terminology, a control system might be described as a feedback control system. For a control system based on feedback, the basic concept of control system theory is as follows:
1 A plan or target is established. 2 A manager responsible for the plan or target puts the plan into action, and
commits resources to operations 3 There is output from the process. Things happen as a result of the operations
that take place. For example, output might be produced and sold. 4 The output (performance) should be measured. 5 These measures of actual performance are fed back to the manager concerned,
as control information. (This information is called ‘feedback’.) 6 The manager compares actual performance with the target. Where
appropriate, control action is taken to improve performance in the future. A feedback control system consists of several inter-related elements. These are shown in the diagram below.
System
A system can be any operation or activity. It can be an entire business entity. A system can be anything that is subject to planning and control. In this diagram, the control information is measure output from the system itself. In this sense it is a closed system
Inputs
Every system has inputs. In a business operation, inputs include resources – materials, equipment, labour and cash. Inputs are used within a system to produce outputs. Some inputs are controllable by management. Other inputs are not controllable, and may be subject to influence from environmental factors.

Paper P5: Advanced performance management
130 © Emile Woolf Publishing Limited
For example, raw material prices are inputs to a production system. Materials prices might be controllable to some extent, by efficient purchasing. However, materials prices are often outside the control of management, and are affected by environmental factors such as inflation rates and materials supply shortages.
Outputs
Every system produces outputs. Some outputs are planned. For example, outputs from a business operation include the volume of production and sales. Some outputs can be quantified; others are more difficult to quantify. For example, the outputs from a business operation include the morale and satisfaction of the workforce, and customer satisfaction.
Sensor
Outputs from a system are measured. However, not all outputs are measured. Outputs are measured only if:
they are measurable and
if the control system has a procedure for measuring them.
For example, in the case of a business operation, measured outputs will include sales, costs and profit. Other measured outputs might include the efficiency of resource utilisation and capacity utilisation. Outputs that might or might not be measured include customer satisfaction, the quality of output and employee satisfaction. Management can decide what measurable outputs should be measured and fed back as information for the purpose of performance assessment.
Feedback
Feedback is measured information that is reported back to management for control purposes.
Comparator
A comparator compares measured outputs (feedback) with a target, plan or standard. Performance has to be measured against expected performance or target performance, to assess whether it is satisfactory. Where actual performance differs from the plan, it may be necessary to amend the plan or change the target. However, the comparison of actual performance with plan might suggest that action can be taken to improve future performance.
Effector
Control action is taken through an effector mechanism. An effector makes adjustments to the inputs to the system, so that future outputs will be changed. An effector might take the form of management instructions to employees. For example, the quality of output is low and the rate of rejected units in a production process might be too high. On receiving feedback about the low quality of work, management might try to take measures to improve the situation – by employing more people in the work and instructing them to take more time and more care over their work.

Chapter 6: Performance measurement systems
© Emile Woolf Publishing Limited 131
It is important to recognise, however, that the effectors in a control system can only apply to controllable inputs to the system. Uncontrollable inputs, and inputs that are subject to environmental influence, cannot be controlled.
3.3 Feed-forward and double loop feedback
Strategic planning and control information is often:
feed-forward control information, or
double-loop feedback information.
Feed-forward
Feed-forward control information is forward-looking control information. It compares:
the target performance and
the latest forecast of what actual performance will be.
For example, the directors of a retail store company might obtain control information in September comparing the targeted sales for the company for the year to 31st December, and the latest forecast of what sales for the year will be. If the forecast is below the target, the directors will study the difference (the ‘gap’) between target and current forecast, and consider measures to close the gap. A feed-forward system of control information is an alternative to a feedback system. In management accounting, feedback systems are often associated with budgetary control. Feed-forward systems are associated with decentralised decision-making, and techniques such as continuous budgeting.
Double-loop feedback
Feedback is control information reported to the manager responsible, comparing actual performance in a period with the target or budget for that period. In other words, feedback compares actual results with a plan for the benefit of the manager directly responsible for control. Double-loop feedback is control information comparing actual results with the plan that is reported to a higher level of management. Senior managers can use double-loop feedback to:
assess the performance of the managers responsible and
where appropriate, consider making changes to the budget or plan.
3.4 Using control system theory
Control system theory can be useful in providing a framework for the analysis of control systems and performance measurement systems. Each aspect of a control system can be reviewed, to decide whether it is appropriate or sufficient. For example, it provides a framework for asking questions such as:
Are the targets or plans for the system suitable? Should there be different targets or more targets for achievement?
Does the information system currently measure enough, or should it be measuring other outputs from the system. Are the sensors used to measure the outputs adequate? Is the feedback provided in an appropriate form?
Is the feedback being sent to the most appropriate individuals?

Paper P5: Advanced performance management
132 © Emile Woolf Publishing Limited
Are the effectors appropriate? Is enough control action being taken? To what extent is management able to control the inputs to the system?
3.5 Enterprise resource planning systems
An enterprise resource planning (ERP) system is a company-wide computer software system, used by many medium-sized and large businesses. It is an IT system for automating a range of different processes within the business, using shared data files. The processes that may be supported by an ERP system include:
the supply chain activities: purchasing, manufacturing, and distribution operations
warehouse management systems
customer relationship management (CRM) systems
human resources management systems
project management systems
financial and management accounting systems, including book-keeping, costing and credit management.
It runs on an internal network, and is accessible by users throughout the organisation. ERP systems have a strong accounting focus, and are used to plan the resources required throughout the business for processing, delivering and accounting for customer orders. Typically an ERM system is a modular system, so that the user can select which aspects of the system to buy and implement. Additional modules can be added (or modules can be removed) as required. ERP systems evolved initially from manufacturing resource planning systems (called MRP II systems), which were specific to manufacturing businesses. They are now available for all types of entity, including non-manufacturing businesses, not-for-profit entities and government departments. A key feature of ERP systems is that they integrate the IT requirements of different users throughout the organisation. Different users share their input and their data. So when an ERP system is introduced for the first time, it can have important practical implications. IT system users, who have previously been used to working with their own dedicated IT system, are now required to work with shared systems.
Introducing an ERP system for the first time
ERP systems are generally large and complex, and they usually involve major changes on staff working practices. Implementing ERP systems is often far too complex for a company’s in-house staff to achieve on their own and it is usual to hire external IT consultancy firms to assist with consultation, customisation of the system to the user’s requirement and support services. The length of time required to implement a new ERP system depends on the size of the business, the number of

Chapter 6: Performance measurement systems
© Emile Woolf Publishing Limited 133
modules, the extent to which the system has been customised (re-written), the scope of the changes in processes and procedures required and the willingness of the ‘customer’ (and its management) to take ownership for the project. For management accountants, the implications of introducing ERP systems are that:
they share accounting information with management in other departments: ‘management accounting’ is no longer a separate IT system over which the management accountants have a monopoly
management accountants now have access to non-financial data produced by other departments.
ERP systems and the work of the management accountant
The introduction of an ERP system is likely to remove the need for much of the ‘traditional’ work of the management accountant. Instead of asking for reports from the management accountant, operational managers will be able to obtain the information themselves from the IT system. If managers need help in obtaining information, they will go to ERP system specialists (either within or external to the company) who are able to assist with the maintenance as well as the implementation of the new system. Although the traditional role of the management accountant will be reduced, there should be some scope for the management accountant to become involved in the operation of an ERP system:
through control and/or audit of data input to the system
with analysis of information provided as output from the system
by becoming ‘information specialists’, providing information about a range of non-financial as well as financial performance. ERP systems can make it easier to develop performance reporting systems that provide non-financial operating data as well as financial performance reports.
In other words, the role of the management accountant will change, but by adapting to the new IT environment, it is probably that management accountants will remain as information ‘experts’ for their organisation.

Paper P5: Advanced performance management
134 © Emile Woolf Publishing Limited
Lean systems
Lean manufacturing
Applications of lean to management information systems
4 Lean systems
4.1 Lean manufacturing
Manufacturing companies are often in competition with competitors on price, and controlling the efficiency and costs of the production process can be strategically important. Lean manufacturing is an approach to minimising production costs and maximising production efficiency. It originated with Toyota in Japan in the 1950s. The underlying philosophy of lean manufacturing is to get rid of waste from the production system. The Toyota Production System identified seven types of waste:
Over-production. Making too many units of production, so that some items are unsold, is wasteful.
Inventory is wasteful. It costs money to create inventory, but inventory does not create any value. Materials should not be purchased until they are needed (to avoid raw materials inventory) and items of production should not be manufactured until they are needed for a sale to a customer (to avoid finished goods inventory).
Transportation. Transporting materials, part-finished items and finished goods is wasteful, because moving items from one place to another is costly but adds no value.
Waste in processing. Waste of materials in production adds to cost but adds no value.
Motion. Waste is also created when people move around. Physical movement is a waste, because in most jobs, physical movement is a waste of time that does not add value. Production systems should seek to reduce unnecessary motion.
Waiting. Waiting for work – idle time – is wasteful.
Making defective units. Waste is also created by manufacturing defective products. Defective products must be scrapped, or must be re-worked before they are in a condition for sale.
Lean manufacturing systems seek to eliminate waste. Aims and features of lean manufacturing include:
zero defects
zero inventory
just-in-time purchasing
just-in-time production
making products to order
highly flexible production systems
Chapter 6: Performance measurement systems
© Emile Woolf Publishing Limited 135
small work cells, within small areas of the factory floor (to reduce motion and transportation)
multi-skilled employees
low rates for wastage and defective units.
4.2 Applications of lean to management information systems
Lean techniques are also applicable in service environments or indeed in any system that contains waste.
Waste in the context of an information system arises from:
The need to correct input
Difficulty in retrieving information in the required form
The need to further process the information after retrival
The “lean” approach can be applied to information management in order to add value to the information produced by the system. It does this by making the information in the system easier to retrieve and more dedicated to the needs of all users.

Paper P5: Advanced performance management
136 © Emile Woolf Publishing Limited
Contingency theory of management accounting
Theories of management accounting
The nature of contingency theory in management accounting
Contingent variables
Contingency theory and the changing requirements for management accounting information
5 Contingency theory of management accounting
5.1 Theories of management accounting
Several theories have been developed to suggest:
whether management accounting techniques are relevant to the modern business environment
what factors affect the choice of which management accounting techniques to use
reasons why the use of management accounting techniques might change over time, particularly with technological changes and other changes in the business environment.
You might be expected to show an awareness of these theories in your examination.
5.2 The nature of contingency theory in management accounting
Contingency theory is a theory that the most appropriate solution or system in a particular situation is dependent upon (‘contingent’ upon) the circumstances of the case. A contingency theory has been developed for management accounting, by writers such as Otley, to suggest what management accounting methods are most appropriate in any particular set of circumstances. Otley has described the contingency theory of management accounting as follows: ‘The contingency theory of management accounting is based on the premise that there is no universally appropriate accounting system applicable to all organisations in all circumstances. Rather a contingency theory attempts to identify specific aspects of an accounting system that are associated with certain defined circumstances and to demonstrate an appropriate matching.’ Contingency theory may therefore be summarised as follows:
There is no unique management accounting system that is best for all organisations.
So the important question is: ‘What is the most effective management accounting system for my organisation’?
The most effective management accounting system for an organisation depends on the circumstances of the organisation.

Chapter 6: Performance measurement systems
© Emile Woolf Publishing Limited 137
It is therefore necessary to study the circumstances of the organisation, and identify the key features affecting the type of management accounting system that it needs.
Otley called these key features ‘contingent variables’.
5.3 Contingent variables
The contingent variables that influence the type of management accounting system that should be applied include:
the environment
technology
size and complexity of the organisation
strategy
culture
other information systems within the organisation.
The environment
The type of management information system, for example whether it should be centralised or decentralised, depends largely on:
whether the environment of the organisation is predictable or unpredictable
the amount of competition in the market
the number of product-markets in which the organisation competes.
Example When there is intense competition in a particular market, a key factor for business success might be to develop innovative products at a competitive price. When product innovation and pricing are significant factors, a company may use target costing and target pricing. Target pricing means deciding in advance a price at which a new product should be offered to the market. Target costing is an accounting technique concerned with developing a new product at a cost that will allow the company to sell it at the target price, and make a profit at that price.
Technology
In product costing, the nature of the manufacturing process determines how costs can be traced to products – for example, process costing and job costing are designed for different types of manufacturing system. Similarly, with the development of new manufacturing methods, new management accounting techniques might be appropriate. For example, backflush accounting might be appropriate in a Just in Time manufacturing environment.

Paper P5: Advanced performance management
138 © Emile Woolf Publishing Limited
Size and complexity
Management accounting systems should be designed differently for organisations of differing sizes and complexity. As an organisation grows, its organisation structure is likely to change and become more complex. From consisting of simple functional departments, it might grow into a large organisation with several investment centres. The management accounting requirements of the organisation will change as it grows and becomes more complex. In large organisations, where authority is delegated to divisional managers, new systems might be needed by head office to monitor the performance of the divisions and to make the divisional managers accountable for the division’s performance. Responsibility accounting might be applied to investment centres, with performance of each centre measured by Return on Investment (ROI) or Residual Income (RI).
Strategy
It has been argued that the cost appropriate management accounting system for an organisation will also depend on its choice of competitive strategy, and in particular whether it adopts:
a ‘cost leadership’ strategy based on cost minimisation, or
a ‘product differentiation’ strategy of offering customers an appropriate quality of product for a given price.
When a company has a ‘cost leadership’ strategy, it tries to be the lowest-cost producer in the market, and competes on the basis of sales price. Management accounting systems should focus on costs and cost control or cost reduction. Many companies pursue a ‘product differentiation’ strategy, in which they do not try to be the least cost producer. Instead, they seek to offer products or services that create more ‘value’ for the customer, by satisfying their needs better. In these circumstances, a focus on cost control alone is inappropriate: management information systems need to provide managers with information about other factors that create value, such as product or service quality. Techniques such as quality costing might be appropriate.
Culture
The management accounting system should be consistent with the culture and value systems of the managers who will use it; otherwise, managers will resist the system and find fault with it. Corporate culture describes the ethics and attitudes of management and employees within an organisation. A management accounting system is more effective if senior management can maintain a corporate culture that supports the aims of the organisation and objectives and its methods of working.
Other information systems within the organisation
Otley also argued that the requirements for an effective management accounting system also depend on the other information systems and control systems within the organisation.

Chapter 6: Performance measurement systems
© Emile Woolf Publishing Limited 139
A contingency approach to selecting a management accounting systems might be considered within the context of the factors set out in the following diagram:
5.4 Contingency theory and the changing requirements for management accounting information
A ‘traditional’ management accounting system may have provided management information for a manufacturing company where:
The management structure is highly centralised, and information about costs and profits was provided for the company as a single ‘profit centre’.
All the support services and activities were performed by the company’s own employees.
The company used only full-time employees.
Customers were willing to hold large inventories of goods purchased from the company, and would allow long supply lead times for the delivery of new supplies.
The manufacturing operations involved long production runs of standardised products.
In this type of environment, a traditional management accounting system – with budgeting, standard costing and budgetary control systems – was probably adequate for many of management’s information requirements. In modern-day manufacturing organisations:
Management authority may be much more decentralised, and a company may be organised on the basis of several profit centres or investment centres. If these profit centres provide goods or services to each other, a system is needed for deciding and recording transfer prices for work done by each profit centre for the others. In addition, there must be systems for reporting the performance of each separate centre – perhaps using return on investment or residual income as key measures of performance for investment centres.

Paper P5: Advanced performance management
140 © Emile Woolf Publishing Limited
Many activities are outsourced to external organisations. For example, manufacturing companies might outsource some parts of manufacturing operations, IT support services, some accounting services, security, cleaning services, management of the company’s fleet of motor vehicles, and so on. When operations are outsourced, management need information to help them to:
- decide whether it is better to outsource work or do the work ‘in-house’
- monitor the quality as well as the cost of the outsourced work.
Many part-time and temporary employees are used. Managers need information to help them plan the work and then monitor the performance of these employees.
Some customers have adopted a just-in-time (JIT) approach to purchasing, and do not hold large inventories. These customers need reliable suppliers who can deliver fresh supplies immediately. When customers expect to use JIT methods for purchasing, this has implications for the inventories of suppliers. Managers in supplier companies need information about optimum inventory levels, or about JIT production, so that they can meet the expectations of their customers.
In many industries, customers expect products to be adapted to their specific requirements. Product design is more significant, and many companies now commit significant resources to design work. Standard products, long production runs and standard costing systems are not appropriate.
A management information system must be capable of providing information that managers need. This can be information from external sources as well as from sources within the organisation itself. Managers may also need information for strategic decision-making as well as information for day-to-day operational control or shorter-term planning. In many cases, managers need non-financial information as well as financial information. The challenge for management accounting systems is to satisfy all these information needs. In addition, as the needs of management change, accounting systems should change too. Contingency theory can therefore be used to explain why traditional management accounting systems can become irrelevant, and why new techniques should be used.
5.5 Institutional theory and contingency theory
Contingency theory, as applied to management accounting, is based on the view that the most effective or appropriate management accounting system depends on the circumstances of the organisation. Institutional theory takes a different view. It starts by asking why so many organisations are similar in the way that they structure their accounting systems, and the methods that they use. Institutional theory also considers how systems might change as well as new ways of doing things might become institutionalised. This might be relevant to changes in management accounting systems.

Chapter 6: Performance measurement systems
© Emile Woolf Publishing Limited 141
Responsibility accounting
Classification of costs by cost behaviour
Classification of costs: controllability
Responsibility accounting
Performance reporting and responsibility accounting: problems with the principle of ‘controllability’
Practical difficulties with responsibility accounting
Non-financial information performance measurement
6 Responsibility accounting
6.1 The analysis of costs
The analysis of costs is a core feature of management accounting. A management accounting system must be capable of providing reliable and relevant information about costs for purposes of planning, setting targets, performance measurement and control.
A management accounting system must be able to analyse how costs should vary with changes in activity. Understanding cost behaviour is important for planning decisions as well as for analysing actual performance.
A management accounting system must also be able to report actual performance in a way that identifies the managers who are responsible for the costs or revenues. The controllability of costs and performance is also a key issue. Controllability is considered in more detail in the next section.
A management accounting system should also provide information that enables managers to assess performance. Performance can be assessed by:
- comparing actual performance with the targets
- comparing current forecasts with the original targets
- looking at trends and changes in performance over time
- comparing performance with other entities (benchmarking).
Information about performance should also make a distinction between what is significant (material) and what is unimportant (immaterial).
Assessing trends
Performance reports may show the changes in performance over a period of time, such as annual growth in sales and profits. The value of measuring changes in a measure of performance over time is that it helps managers to identify trends. When there is an upward or downward trend over time, it might be appropriate to assume that the trend is likely to continue unless action is taken to try changing it.

Paper P5: Advanced performance management
142 © Emile Woolf Publishing Limited
Materiality
Performance reports should help managers to identify the aspects of performance that appear significant or material. Reports may therefore highlight exceptional or material results. For example:
Long reports usually begin with an executive summary, where the key aspects of performance are summarised.
‘Reporting by exception’ might be used to report results to management. This is a form of reporting in which only exceptional results are brought to management’s attention.
6.2 Classification of costs: controllability
Revenues and costs might be classified as controllable or uncontrollable. A cost is controllable if a manager is able to take action that will alter its amount. Typically, a cost is controllable if action by a manager may result in a reduction in the cost. However, a cost might be controllable by one manager in an organisation, but not by another. Management information should attribute costs to the managers who can control them A performance management system should try to identify costs, revenues and investments that are:
directly attributable to a division or performance centre within the organisation, and
controllable by the manager responsible for the division or performance centre.
However, there are some problems with identifying and measuring controllable costs.
Costs that are directly attributable to a department or cost centre might not be controllable by the manager of the department or cost centre. For example, the rental costs of a building used by a department are a directly-attributable fixed cost of the department, but the manager of the department might have no control over the decision about whether the department remains in the building or not. The rental cost is therefore directly attributable, but non-controllable by the manager.
Some costs are partly-controllable, not fully controllable. For example, the quantity of materials used by a department might be controllable by its manager, but their purchase price is not controllable if the materials are purchased by a separate buying department. Total material costs depend on both the quantities used and their price. In this situation, quantities would be controllable by one manager and priced by another.
Example A business unit employs ten staff who are paid a fixed annual salary. The salary costs are directly attributable to the business unit, and salaries are decided centrally by head office. The manager of the unit has no control over salary levels. However,

Chapter 6: Performance measurement systems
© Emile Woolf Publishing Limited 143
he should be able to influence the efficiency and effectiveness of the employees who work for him. It is therefore appropriate that the manager should be held accountable for the salary costs of the business unit, and the results achieved by incurring those costs, even though he does not have full control.
Terminology: endogenous variables and exogenous variables
You should note the following terms, which might be unfamiliar to you but might be used in an examination question.
Endogenous variables: these are factors under the control or influence of management
Exogenous variables: these are factors that are outside the control or influence of management.
6.3 Responsibility accounting
Responsibility accounting is a method of reporting based on measuring the performance of responsibility centres within an organisation. The manager of a responsibility centre is responsible and accountable for the performance of the centre.
Responsibility accounting is based on the principle that managers should be responsible – and so held accountable – for costs and other aspects of performance over which they have control. Managers should not be held accountable for costs and other matters over which they have no control. The principle of ‘controllability’ is therefore a key issue in any system of responsibility accounting.
Cost centres, profit centres and investment centres
This is why, for example, reporting units within an organisation may be:
cost centres, where the manager is in a position to control costs, but not sales revenue
profit centres, where the manager is in a position to control costs and sales revenue, but is not in a position to control the amount of investment and other investment decisions
investment centres, where the manager is in a position to control costs and sales revenue, and also has control over investment decisions affecting the centre.
Within a system for reporting the costs of a centre, a system of responsibility accounting should also try to make a distinction between:
costs over which the manager should have short-term control: these are often reported as variable costs and directly-controllable fixed costs (or directly attributable fixed costs)
costs over which the manager has some control, but over the longer term rather than the short term
costs over which the manager has no control: in some systems of responsibility accounting, centres are not charged at all with any share of general overhead costs that the centre manager cannot control.

Paper P5: Advanced performance management
144 © Emile Woolf Publishing Limited
There might be a hierarchy of responsibility centres.
A business entity might be divided into several investment centres (strategic business units or operating subsidiaries).
Within each investment centre there might be several profit centres.
Within each profit centre there might be several cost centres and revenue centres.
Although the details of a responsibility accounting system may vary between different entities, the basic principle is consistent: the accounting system should identify performance that a manager should be able to control, and for which he or she should therefore be made responsible and held to account.
6.4 Performance reporting and responsibility accounting: problems with the principle of ‘controllability’
Management information is provided to each responsibility centre manager, usually in the form of regular performance reports that the manager uses to:
assess performance
investigate any aspects of performance that seem poor (or very good), and
take any appropriate control measures, depending on what the investigation reveals.
There are two ways in which the principle of ‘controllability’ may be applied in management performance reports.
One approach is to include in a performance report only those matters over which the manager has control.
- This means that many operational performance reports will include non-financial information, because the operational manager responsible does not have control over materials prices, or wage rates or salaries for employees.
- Alternatively, performance reports might report variances by converting physical variance (materials usage variances in quantities and labour variances in hours) into a money value, using standard prices for materials and standard rates per hour for labour.
Another approach is to include controllable costs and non-controllable costs in a performance report, but to distinguish clearly between these two types of cost. A profit centre report might therefore be presented as follows:
$000
Profit centre sales revenue 2,000
Cost of sales 600
Gross profit/contribution 1,400
Other controllable costs 500
Controllable profit 900
Non-controllable costs 300
Net profit 600

Chapter 6: Performance measurement systems
© Emile Woolf Publishing Limited 145
Problems with the controllability principle
A problem with applying the principle of controllability is that it might be difficult to decide which costs are controllable and which are uncontrollable.
In practice, many items of cost are partly controllable.
Some costs that are uncontrollable in the short term (fixed costs) are controllable in the longer term.
A management information system for responsibility centres should identify revenues, costs and investment that are directly attributable to each centre, for which the centre manager is responsible and that the centre manager is in a position to control.
Type of responsibility centre Performance information required
Cost centre Controllable costs
Revenue centre (for example, a sales team)
Sales revenue
Profit centre Controllable costs Revenues Profits
Investment centre Controllable costs Revenues Profit Controllable investment Return on investment
An effective management accounting system must be able to supply the managers of responsibility centres with the information that they need, in a suitable form and with sufficient regularity. Managers must be able to use the information to help them with managing their centre, and taking appropriate control decisions so that actual performance meets (or exceeds) expectations or target.
Example The manager of an operating division has received the following report about the performance of the division for the financial year that has just ended.
Current year Previous year
$ $ Sales 800,000 500,000 Operating costs excluding depreciation 600,000 390,000 Depreciation 200,000 80,000 Interest charges 40,000 20,000 Profit/(loss) (40,000) 10,000
The manager is responsible for operations within the division, but has no control over decisions relating to capital expenditure or borrowing to finance expenditure. These decisions are taken by senior executives within the company.

Paper P5: Advanced performance management
146 © Emile Woolf Publishing Limited
The manager has been asked to explain the deterioration in the performance of the division in the current year. The manager has replied that as far as he is concerned, there has been a significant improvement in performance. What is the most appropriate method of assessing performance?
Answer This performance report shows that although sales revenue has increased from $500,000 to $800,000 compared with the previous year, a $10,000 profit has turned into a $40,000 loss. However, the division manager has no control over capital expenditure or borrowing. The decline in performance may be due to the increase in depreciation costs and interest charges since the previous year. If so, the decline in performance might be attributable wholly or partly to the buying and borrowing decisions of senior management. A suitable measure of performance for the manager of the operating division might be operating profit, which is sales revenue minus operating costs. Operating profit may be referred to as:
profit before interest and tax (PBIT), or possibly
earnings before interest, tax, depreciation and amortisation (EBITDA).
Using this measure of performance, a performance report might be presented as follows:
Current year Previous year
$ $ Sales 800,000 500,000 Operating costs excluding depreciation 600,000 390,000 Operating profit – manager’s responsibility 200,000 110,000 Depreciation 200,000 80,000 Interest charges 40,000 20,000 Profit/(loss) for the division (40,000) 10,000 Operating profit/sales ratio 25% 22% Growth in annual sales revenue 60%
This shows that sales revenue grew by 60% in the current year (presumably helped by new investment in non-current assets for the division) and the ratio of operating profit/sales went up from 22% to 25%. This lends support to the division manager’s claim that performance has improved.
6.5 Practical difficulties with responsibility accounting
The principle of responsibility accounting is valid. In practice, however, it is often difficult to apply successfully. The main reason for this is that many costs are only partially controllable.
A cost centre manager may be in a position to control the efficiency of resource utilisation (for example, materials usage, wastage rates, machine utilisation and labour efficiency).

Chapter 6: Performance measurement systems
© Emile Woolf Publishing Limited 147
However, the centre manager may not be able to control purchase prices for materials, the effectiveness of machine repairs by maintenance staff or wage rates to employees under his or her management.
There is a risk that managers will be held responsible for costs or other aspects of poor performance over which they did not have effective control, and so were not in a position to deal with. For example, a production centre manager may be held responsible for a fall in production output during a month, when the reason for the fall was a mistake in the purchasing department which ordered the wrong materials and so caused a hold-up in production. If managers are held responsible, within a system of responsibility accounting, for performance that they were unable to control, the reporting system will create problems of motivation. If so, the system may well have the opposite effect of what it was designed to achieve – better performance measurement as a means of giving managers an incentive to improve performance.
Controllability: long-term and short-term
Another serious limitation of responsibility accounting systems is the short-term nature of the performance that they measure. Managers are usually held accountable on a monthly, quarterly or annual basis for costs, revenues or return on investment. By concentrating on specific aspects of short-term performance, the reporting system encourages managers to ignore other aspects of performance – including long-term performance. When a new manager is appointed to manage a responsibility centre, he will inherit the ‘legacy’ left by his predecessor. For a considerable time, the short-term performance of the centre will be affected by decisions made by the previous manager at some time in the past. As a result, the new manager’s performance will be judged – praised or criticised – partly on the basis of another manager’s decisions and efforts.
6.6 Non-financial information performance measurement
A performance management system should measure all critical aspects of performance. For a number of reasons, an exclusive focus on the financial aspects of performance is normally insufficient.
Many critical success factors for the longer-term are non-financial in nature, and may relate to issues such as meeting customer needs and innovation.
Intangible assets such as customer goodwill, know-how and intellectual capital are often essential elements of long-term business success, and financial measurement systems do not record data about these aspects of performance.
Financial measurements are usually measurements of historical performance. However, expectations of future financial performance are probably more important, and performance measurement systems ought to include an element of future projections.
An exclusive focus on financial performance will often lead to a focus on short-term performance, to the exclusion of longer-term considerations. Long-term profit may be sacrificed in order to achieve short-term targets, especially if the achievement of annual financial targets is used as a basis for the payment of

Paper P5: Advanced performance management
148 © Emile Woolf Publishing Limited
bonuses. Management may be encouraged to adopt a narrow focus, instead of considering a wider range of factors that are essential to success.
Performance should be assessed within the context of the business environment and competitive environment in which an entity operates. An exclusive focus on financial aspects of performance is insufficient. Information for the assessment of performance should come from sources outside the entity as well as from internal sources (so that comparisons can be made), whereas a financial focus concentrates on sources of information from within the entity.
Business scorecard approach: focussing on more than one critical aspect of performance
Some business organisations use a ‘balanced scorecard’ approach to setting planning targets and measuring performance. The main target is a financial performance target, but it is also recognised that non-financial performance is also vitally important for long-term financial success. In a balanced scorecard approach, targets and performance measurements are therefore established for:
a financial perspective
an internal business perspective
a customer perspective, and
an innovation and learning perspective.
The balanced scorecard approach is described in more detail in a later chapter. Non-financial performance measurements might also focus on customer satisfaction, and whether the products or services sold by the organisation meet customer needs in terms of:
product quality
reliability of service
speed of service or delivery
selling price.
It is also possible to measure performance in terms of ‘value added’, which is the value of the additional benefits achieved, less the cost of creating these extra benefits. Non-financial performance measurements will also be considered in more detail later.

Chapter 6: Performance measurement systems
© Emile Woolf Publishing Limited 149
Sources of information
Control system theory
Feedback control system
Feed-forward and double loop feedback
Using control system theory
Information from internal sources
Information from external sources
Organising a system for providing external information
Limitations of external information
7 Sources of information Performance measurement systems, both for planning and for monitoring actual performance, rely on the provision of relevant, reliable and timely information. Information comes from both inside and outside the organisation. Traditionally, management accounting systems have been an information system providing financial information to managers from sources within the organisation. In large organisations, management accounting information might be extracted from a cost accounting system, which records and analyses costs. With the development of IT systems, management information systems have become more sophisticated, using large databases to hold data, from external sources as well as internal sources. Both financial and non-financial data are held and analysed. The analysis of data has also become more sophisticated, particularly through the use of spreadsheets and other models for planning and cost analysis (for example, activity based costing).
7.1 Information from internal sources
A control system such as a management accounting system must obtain data from within the organisation (from internal sources) for the purposes of planning and control. The system should be designed so that it captures and measures all the data required for providing management with the information they need. It is useful to remember the essential qualities of good information.
It should be relevant to the needs of management. Information must help management to make decisions. Information that is not relevant to any decision-making (such as planning and control decisions) is of no value. An important factor in the design of information systems should be the purpose of the information. What decisions should be made, and what information will be needed to make those decisions.
It should be reliable. This means that the data should be sufficiently accurate for its purpose. It should also be complete.
It should be available in a timely manner. In other words, it should be available for when it is needed by management.

Paper P5: Advanced performance management
150 © Emile Woolf Publishing Limited
The cost of providing the information should not exceed the benefits that it provides. The key factor that limits the potential size of many information systems is that the cost of obtaining additional information is not justified by the additional benefits that the information will provide.
In designing a performance measurement system, and deciding what information is required from internal sources, these desirable qualities of good information should influence the design of the system. Traditionally, management accounting systems have obtained internal data from the cost accounting system and costing records. In many organisations, IT systems now integrate costing data with other operational data. This means that data is available to the management accounting system from non-accounting sources.
Example An information system might be required to provide information about the profitability of different types of customer. The starting point for the design of this information system is the purpose of the information. Why is information about customer profitability needed? The answer might be that the company wants to know which of its customers contribute the most profits, and whether some customers are unprofitable. If some customers are unprofitable, the company will presumably consider ways of improving profitability (for example, by increasing prices charged to those customers) or will decide to stop selling to those customers. The next consideration is: What data is needed to measure customer profitability? The answer might be that customers should first be divided into different categories, and each category of customer should have certain unique characteristics. Having established categories of customer, information is needed about costs that are directly attributable to each category of customers. This might be information relating to gross profits from sales, minus the directly attributable selling and distribution costs (and any directly attributable administration costs and financing costs). Having established what information is required, the next step is to decide how the information should be ‘captured’ and measured. In this example, a system is needed for measuring each category of customer, sales revenues, costs of sales and other directly attributable costs. The information should be available for when management intend to review customer profitability. This might be every three months, six months or even annually.
7.2 Information from external sources
Managers need information about customers, competitors and other elements in their business environment. The management information system must be able to provide this in the form that managers need, and at the time that they need it.

Chapter 6: Performance measurement systems
© Emile Woolf Publishing Limited 151
External information is needed for strategic planning and control. However, it is also often needed for tactical and operational management decisions. Examples of the external information needed by companies are set out in the table below. Information area Examples of information needed
Customers What are the needs and expectations of customers in the market? Are these needs and expectations changing? What is the potential for our products or services to meet these needs, or to meet them better?
Competitors Who are they? What are they doing? Can we copy some of their ideas? How large are they, and what is their market share? How profitable are they? What is their pricing policy?
Legal environment What are the regulations and laws that must be complied with?
Suppliers What suppliers are there for key products or services? What is the quality of their products or services? What is the potential of new suppliers? What is the financial viability of each supplier?
Political/ environmental issues
Are there any relevant political developments or developments relating to environmental regulation or environmental conditions?
Economic/ financial environment
What is happening to interest rates? What is happening to exchange rates? What is happening in other financial markets? What is the predicted state of the economy
Sources of external information
Sources of external information, some accessible through the Internet, include:
market research
supplier price lists and brochures
trade journals
newspapers and other media
government reports and statistics
reports published by other organisations, such as trade bodies.

Paper P5: Advanced performance management
152 © Emile Woolf Publishing Limited
7.3 Organising a system for providing external information
If managers are to be provided with external information by a management information system (MIS), the system must be designed so that it is capable of providing it:
There has to be a system of data capture. How should information be obtained from the environment and filed within the MIS? How should the data be held within the MIS?
How should the information be provided to managers? Should it be e-mailed to them? Or should managers be expected to search for the information in the MIS when they need it?
Should the external information be processed into a usable form for managers when it is captured, or should it be supplied to managers as ‘raw unprocessed data’?
The external information should be divided into strategic information and operational information. Which managers should be provided with the strategic information, and which ones need the operational information?
7.4 Limitations of external information
It is important to recognise the limitations of external information.
It might not be accurate, and it might be difficult to assess how accurate it is.
It might be incomplete.
It might provide either too much or not enough detail.
It might be difficult to obtain information in the form that is ideally required.
It might not always be available when required.
It might be difficult to find.

Chapter 6: Performance measurement systems
© Emile Woolf Publishing Limited 153
Recording and processing methods
Recording data
Processing methods
8 Recording and processing methods. Management reports
8.1 Recording data
There are many different ways of ‘capturing’ data, and recording it in an information system. Methods of recording data will depend on circumstances, and also on the nature of the data required. For example:
Records of labour time spent on particular tasks or jobs might be recorded on time sheets or job sheets.
Records of materials used might be recorded in materials requisition notes.
Data about customer satisfaction might be captured as records of customer complaints. Alternatively, data might be obtained from market research surveys.
The system of recording data should be made as convenient as possible for the individuals responsible for input of the data to the information system. Where possible, the information system should be designed to minimise the risk of errors.
Data should also be recorded in a form that will allow it to be processed. As a simple example, suppose that records of labour costs should provide for an analysis of these costs into production costs, administration costs and sales and distribution costs. The data about labour costs will have to be recorded in a way that will enable the costs to be divided into their different categories.
8.2 Processing methods
Performance measurement systems should be designed so that data can be processed in a way that meets the requirements of management. There are various ways of processing data, and IT systems enable managers to obtain large amounts of information for different purposes.
Data might be needed for planning or forecasting. Spreadsheet models and other forecasting models are now commonplace.
Accountancy software packages, including management accounting packages or modules, can be used to process accounting data.
E-mail allows managers to communicate information quickly between each other.
Widespread availability of Wifi connection enables easy connection to the internet when travelling.
Network technology now allows workers in any location to connect to a firm’s system via the internet using virtual private network (VPN) links.

Paper P5: Advanced performance management
154 © Emile Woolf Publishing Limited
Unified corporate databases combine data from different systems (e.g. purchasing and inventory issues). This can improve control over budgeting, forecasting and planning; reporting etc.

Chapter 6: Performance measurement systems
© Emile Woolf Publishing Limited 155
Management reports
Data tables
Controllability, trend and materiality
Security
Information overload
9 Management reports
9.1 Data tables
Data is often provided to managers in data tables, possibly using a spreadsheet model. Performance data in particular is often put into tables, as well as reported in the form of charts and graphs.
One-way data table
A one-way data table shows the change in an output variable for given changes in one input variable.
Example The one-way data table below shows:
the variations in an output variable, gross profit,
for given changes in one input variable, annual inflation in the price of raw materials.
Price inflation in raw materials Gross profit
% $ 3 197,000 4 195,500 5 194,000 6 192,500 7 191,000
Two-way data table
A two-way data table shows the change in an output variable for given changes in two input variables.
Example The example below shows the changes in contribution for given variations in both (1) the percentage of input rejected as scrap or waste and (2) the volume of production.

Paper P5: Advanced performance management
156 © Emile Woolf Publishing Limited
Figures show annual contribution:
Production (units)
% scrapped 5 million 6 million 7 million 8 million 9 million 3 9.40 11.28 13.16 15.04 16.92 4 9.20 11.04 12.88 14.72 16.56 5 9.00 10.80 12.60 14.40 16.20
9.2 Controllability, trend and materiality
Performance reports may present information relating to controllability, trend and materiality.
Controllability was considered earlier, in the context of responsibility accounting.
Trend. Performance reports may show the changes in performance over a period of time, such as annual growth in sales and profits. The value of measuring changes in a measure of performance over time is that it helps managers to identify trends. When there is an upward or downward trend over time, it might be appropriate to assume that the trend is likely to continue unless action is taken to try changing it.
Materiality. Performance reports should help managers to identify the aspects of performance that appear significant or material. Reports may therefore highlight exceptional or material results. For example:
- Long reports usually begin with an executive summary, where the key aspects of performance are summarised.
- ‘Reporting by exception’ might be used to report results to management. This is a form of reporting in which only exceptional results are brought to management’s attention.
9.3 Security
Entities are able to produce large amounts of information, in formal reports or on demand. This raises problems of control and security.
There should be controls to ensure that reports are distributed only to individuals who are authorised to receive it. Much information is confidential, and access to it should be restricted.
There should be distribution lists for routine reports, and a copy of the report should be available only to the individuals in the list.
Access to online data files can be restricted by a system of identity codes and passwords.
IT systems should have safeguards against unauthorised access by external users. For example, intranet systems should include firewalls (hardware and software). There should be physical controls over unauthorised access to computers and computer terminals (such as making sure that office doors are locked when the manager is away from his desk).
There should be established procedures for preventing unauthorised access to confidential data. Managers should be required to keep all confidential
Chapter 6: Performance measurement systems
© Emile Woolf Publishing Limited 157
information in a secure place. There should be restrictions over the type of information that can be sent by e-mail.
9.4 Information overload
Reports should serve the needs of the user. It is now very easy to produce large volumes of information. Too much information could confuse the user or obscure key facts and trends. One of the key skills of a modern accountant is to know what not to produce.

Paper P5: Advanced performance management
158 © Emile Woolf Publishing Limited

© Emile Woolf Publishing Limited 159
Paper P5 Advanced performance management
CH
AP
TER
7
Strategic performancemeasurement
Contents
1 Performance hierarchy
2 Financial performance in the private sector
3 Six Sigma
4 Non-financial performance indicators (NFPIs)
5 Performance measurement in not-for-profit organisations
6 Behavioural aspects of performance reporting: reward systems
7 Value management

Paper P5: Advanced performance management
160 © Emile Woolf Publishing Limited
Performance hierarchy
Agency theory
The nature of the performance hierarchy
Mission statement
Corporate vision
High-level corporate objectives and strategic objectives
Critical success factors (CSFs) and key performance indicators (KPIs)
The planning gap
The characteristics of operational performance
Accountability
Hard accountability and soft accountability
1 Performance hierarchy
1.1 Agency theory
Agency theory is associated with the work of Jensen and Meckling in the 1970s. The theory considers the separation of ownership in business from its management. The shareholders are the owners of a company and in a large company the shareholders are not executive managers. Management is performed by professionals, who are supposed to act as representatives of the shareholders. It is therefore possible to describe the shareholders of a company as principals, who use agents (management) to act on their behalf and in their interests. A similar situation applies to not for-profit entities. For example, the management of a government-owned hospital can be described as agents who work on behalf of the hospital’s owners (the government or the general public) or the representatives of the owners (say, the hospital’s board of governors). For the purpose of the P5 examination, agency theory may be summarised briefly as follows.
There is a conflict of interests between the principals of an entity and their agents. The principals have their own objectives which they want the entity to achieve. In a company, the shareholders may want to maximise their return on investment, and invest in a company whose ‘mission’ they support. Management on the other hand have personal interests to which they give priority, such as remuneration and other rewards. The conflict of interests is always at the heart of the principal-agent relationship.
Conflicts of interest are evident in a number of different ways.
- As a general rule, professional managers work less hard than they would do if they were owners of the company. The result could be lower sales growth and lower profits.

Chapter 7: Strategic performance measurement
© Emile Woolf Publishing Limited 161
- Where remuneration is linked to the size of the company rather than its profits, managers have an incentive to grow the business even if this means lower profitability. Managers are more likely to want to reinvest profits in growth rather than to see profits paid out to shareholders as dividends.
- Time horizon. Managers may be more concerned about short-term performance rather than the longer term, because their future (pay and promotion) is often linked to short-term performance. Long-term shareholders are more interested in the longer term.
- Moral hazard. Senior managers are often interested in ‘perks’ that go with the job, such as a company car or company plane, a company flat, status and so on. Their interest in these aspects of their job is greater when they do not have a substantial shareholding in the company.
When there is a principal-agency relationship, the problem is how to minimise the agency problem for the minimum cost. ‘Agency costs’ consist of three elements:
Monitoring costs. Principals need to establish systems for monitoring the performance of their agents. For example, shareholders require the directors of a company to prepare an annual report and accounts, so that the directors can be held to account for their stewardship of the company. To improve the reliability of financial statements, external auditors are appointed report to the shareholders about whether the financial statements give a true and fair view. Monitoring costs can be substantial, because performance reporting systems need to apply throughout the management hierarchy.
Bonding costs. The principals may try to bring the interests of their agents more into line with their own interests, by offering incentives based on performance and achievements. Remuneration schemes offering incentives to senior management are examples of bonding costs.
Residual loss. Monitoring systems and bonding schemes will not avoid some agency costs. For example, management may decide to pursue an expensive acquisition in order to grow the company and achieve a ‘strategic objective’. However the acquisition may be over-priced and may lose value for the company’s owners.
Performance measurement systems and reward systems are therefore linked to agency theory. For the purpose of the exam, agency theory may be summarised as follows:
In large companies there is a separation of ownership from control, and this creates an agency-principal relationship between the professional managers and the shareholders. A similar separation of ownership from control occurs in large not-for-profit entities.
Individuals are driven by self-interest and this leads to conflicts of interest between owners and managers. Managers of a company cannot be relied on to act in the best interests of the shareholders.
This problem creates costs for the owners, and these costs should be minimised if possible.
The potential costs (from ‘residual loss’) can be minimised partly through monitoring systems (performance measurement systems and accountability) and

Paper P5: Advanced performance management
162 © Emile Woolf Publishing Limited
reward/incentive schemes, but monitoring systems and reward systems create additional costs.
1.2 The nature of the performance hierarchy
The targets for managers throughout an organisation should be consistent with each other. All managers and employees should be working towards the same goals. Consistency in setting performance targets can be achieved through a performance hierarchy, linking the goals of the most senior management with the targets for operational managers.
At the top of the hierarchy, an organisation might have a mission statement.
The mission statement provides a framework for setting strategic objectives, and for strategic planning.
Within the framework of a strategic plan, management at the ‘tactical’ level can prepare plans, such as annual budgets, capital expenditure budgets and marketing plans.
Within the framework of tactical plans, operational managers can prepare operating plans and set operating targets.
Agency theory and the performance hierarchy
This chapter is concerned with the measurement of performance, and accountability for performance, throughout a business entity or a not-for-profit entity. It may be useful to consider performance monitoring systems in the context of agency theory. One way in which the principals try to ensure that the agents are working in their interests is to make the agents accountable. The agent must be required to give an account of performance to the principal, and the principal must be able to hold the agent to account. To make the agents accountable, there should be a reporting system in which the agents report on those aspects of operations for which they are responsible and in a position to control. Reporting systems should apply throughout the management hierarchy and the ‘agents’ at each level in the hierarchy should be held accountable for their performance. Within a company, there is a hierarchy of performance evaluation and accountability.
Junior managers are accountable to senior managers, and their performance is measured and evaluated.
Performance is also measured and evaluated in relation to time: short-term and long-term performance should be measured.
Performance should be measured and evaluated at strategic, tactical and operational levels.
A question in a past P5 examination, for example, asked about the application of agency theory to lecturers in a university. The theme of the question was that lecturers can be seen as agents of the university’s principals who should be held accountable for their performance. A problem with the application of agency theory

Chapter 7: Strategic performance measurement
© Emile Woolf Publishing Limited 163
to not-for-profit entities, however, is that there may be several different groups of ‘principals’. In the example of a university, the principals may be the government that owns it. Alternatively, the principals may be seen as either the general public (as the taxpayer and voters) or the students who receive their education at the university.
1.3 Mission statement
Some organisations have a formal mission statement. The purpose of a mission statement is to provide a clear expression of the reason why the organisation is in existence and what it is seeking to achieve.
The content of mission statements varies between different organisations, but common elements are:
a statement of the purpose of the organisation
a statement of its broad strategy for achieving its purpose
a statement of the values and culture of the organisation.
The purpose of the organisation is usually expressed in terms of its business purpose, rather than its financial objectives (such as maximising the wealth of its shareholders). For example, the purpose of a company in the entertainment industry might be to provide audio-visual entertainment products to customers throughout the world. The mission statement might also include a statement of the strategy for achieving the purpose. For example, the mission statement of company in the entertainment industry might include a strategy of providing audio-visual entertainment in all forms and through all media channels. In contrast, the mission statement of another company in the entertainment industry might be to produce films for purposes of public entertainment and also education and training.
The usefulness of a mission statement
A mission statement can have several useful purposes.
It provides a guide to employees (and other stakeholders such as customers and suppliers) about what the organisation is in existence to achieve. It may help employees to identify more readily with their employer.
More significantly, it can help managers to formulate their business strategy. Business strategies should be consistent with the mission of the organisation. Managers should consider new strategies in the context of whether it is consistent with the organisation’s purpose.
The mission statement can therefore be used as a screening device, for rejecting strategies that are inconsistent with the mission of the organisation. For example, suppose that the mission statement of a company in the entertainment industry is to produce films for purposes of public entertainment and also education and training. A proposed strategy to develop a chain of cinemas would be

Paper P5: Advanced performance management
164 © Emile Woolf Publishing Limited
inconsistent with this mission, and either the strategy should be rejected or the mission statement should be amended.
The mission statement can also be used to establish a corporate culture, such as a culture of encouraging all employees to develop to their full potential, or a culture of acting ethically in all dealings with customers and suppliers.
Limitations of mission statements
Mission statements can be of limited practical value, however, especially when they are worded in vague language that lacks real substance. When the actual behaviour of an organisation contradicts what is said in its mission statement, the mission statement may be regarded as cynical and insincere. For example, a pharmaceuticals company might include in its mission statement the objective of promoting the improvement in the health of all people throughout the world. Its management might decide not to allow one of its drugs to be used to combat a serious epidemic in a developing country, because the country is unable to afford to pay for the drug. The actual decision of the company would be inconsistent with its mission statement, making a mockery of the mission statement. Mission statements do not have a time scale for achievement. Strategies are needed to establish specific targets and time scales for achievement. Mission statements may therefore be useful for formulating strategies, but they are of limited value for monitoring actual performance.
1.4 Corporate vision
Corporate vision is how a company sees itself, and how it wants to be seen by others, such as its customers, its employees and its shareholders. A corporate vision statement may set out the future direction that the company will take, and what it expects to achieve within the next few years. ‘The vision process translates core values into actions and enables companies to design a desired future rather than simply letting fate happen’ (PricewaterhouseCoopers).
Ideally a corporate vision:
should be realistic, and not ‘wishful thinking’.
should be ‘emotional’, so that it can attract employees, customers and investors to the company
should indicate a sense of direction, and what the company wants to achieve.
A corporate vision statement can be used instead of, or in addition to, a mission statement. Examples It might be useful to look at a few corporate vision statements, selected at random from the internet.

Chapter 7: Strategic performance measurement
© Emile Woolf Publishing Limited 165
Translink, a transport company: ‘To provide a transformed network of co-ordinated bus and rail services which attracts a growing number of passengers, enjoys public confidence and is recognised for its quality and innovation.’ Hitachi Chemical Company. ‘Our vision is to contribute to society through the development of superior technologies and products. By combining and adapting our wide ranging advanced material and processing technologies, Hitachi Chemical aims to provide superior technologies, products and services that contribute to the betterment of human life and society.’ Colt Engineering. ‘The corporate vision of the Colt companies is our primary objective and the overriding focus of Colt’s activities: Being North America’s contractor of choice for clients and staff.’ Tylö AB, manufacturer of bathroom equipment. ‘To be perceived as the global market leader with the most inspiring, innovative bath, shower and sauna environments.’
1.5 High-level corporate objectives and strategic objectives
An organisation should have high level ‘corporate’ objectives that are consistent with its mission. For companies, the highest corporate objective is likely to be the aim of providing benefits to their shareholders. This objective may be expressed in general terms as ‘maximising the wealth of shareholders over the long term’. There may be social or ethical constraints or obligations that will be taken into consideration in the pursuit of the corporate objective. For example, companies may recognise the need to act in an ethical manner and in accordance with an ethical code of conduct. Some companies may recognise obligations for the protection of the environment. Others may recognise an obligation towards employees as well as shareholders.
High-level corporate objectives must be converted into more specific plans or strategies, each with its own strategic goal. Strategic objectives are high-level goals, usually with a long-term time horizon. Achieving the strategic goals should mean that the corporate objective will also be achieved. There may be a hierarchy of strategies and strategic objectives. For example:
There may be a financial objective to achieve targets for growth in profitability, return on capital and shareholder wealth over a strategic planning period.
A company should develop strategies for achieving financial success in a competitive market. This calls for competitive strategies on how to position the business in its markets. There may be a strategy for growth in the business, through internal development or through mergers and acquisitions.
Strategies may be developed for marketing (meeting customer needs), product innovation and funding/capital expenditure and investment to enable the company to achieve the financial objective and objectives for competitive strategy.

Paper P5: Advanced performance management
166 © Emile Woolf Publishing Limited
Strategies may be developed for other aspects of the business, such as IT systems, human resource planning and the use of new technology. These would be designed to support the marketing, innovation and finance strategies.
As indicated earlier, strategic objectives should create a framework for subsidiary objectives, and for tactical and operational planning.
1.6 Critical success factors (CSFs) and key performance indicators (KPIs)
Critical success factors are factors that are critical to the success of an organisation and the achievement of its overall objectives. They are the key areas where targeted performance must be achieved. Failure to meet targets for any CSF will mean failure to achieve long-term targets and objectives. CSFs are therefore vitally important and an organisation cannot afford to fail in any of these areas.
At a strategic level, there are usually just a small number of CSFs. They might be expressed in terms of:
profitability
market share
product leadership
development of human resources
achieving a balance between long-term and short-term goals.
There may be other CSFs, depending on the nature of the company and its business. For example, other CSFs may be quality standards, capacity utilisation, the rate of innovation, and so on. For each critical success factor, there should be a measure of performance. These performance measures might be called key performance indicators or KPIs. A target should be set for each KPI and actual performance can be measured against the target. For your examination, you may be asked to suggest what the CSFs or KPIs for a particular entity may be, given information provided in the question. It is worth spending time thinking about what you would consider to be the essential ingredients of success for particular types of business – for example an oil company, a bank, a television company, a commercial property company, a car manufacturer and so on.
1.7 The planning gap
The concept of the planning gap can be useful for formulating strategies and other plans. The planning gap and gap analysis was described in the earlier chapter introducing strategic management accounting.
A planning gap is the difference between:
the target or objective that an organisation would like to achieve and

Chapter 7: Strategic performance measurement
© Emile Woolf Publishing Limited 167
the forecast or expectation of what the actual achievement will be (on the assumption that there are no new initiatives to improve performance).
Normally, and particularly when objectives are challenging and ambitious, there will be a large gap between what an organisation wants to achieve and what it currently expects to achieve.
Having identified the planning gap over the planning period, management should then consider strategies, and then more detailed tactical and operational plans, for closing the gap. The planning gap may be closed either by:
developing strategies for improving performance, or
if new strategies will not be sufficient to close the gap, lowering the target.
1.8 The characteristics of operational performance
Although the main corporate objective may be expressed in financial terms, operational performance should be measured by a combination of financial and non-financial measures. Performance measurement at an operational level also normally focuses more on providing information about actual performance for control purposes. Compared with strategic performance information, there is less emphasis on planning information at the operational level. Performance targets should also be set for both the long-term and the short-term. The strategic aim should be directed towards long-term goals, but the long-term goals will not be achieved unless intermediate shorter-term goals are also achieved. Each organisation should therefore develop its own hierarchy of financial and non-financial objectives, linked through the performance hierarchy and between the short-term and long-term.
1.9 Accountability
Accountability involves:
a manager or other individual having to give an account of performance to his or her boss (or ‘principal’), and
the boss (or ‘principal’) holding that individual to account.
Accountancy has an important role in systems of accountability, but not an exclusive role. Control systems and performance reporting systems use a range of both financial and non-financial quantitative methods and also qualitative methods for making individuals accountable for their performance. New systems of accountability have been developed over recent years, such as activity based costing systems and total Quality Management (TQM) systems.

Paper P5: Advanced performance management
168 © Emile Woolf Publishing Limited
1.10 Hard accountability and soft accountability
Systems of accountability based on accounting may require a combination of both hard accountability and soft accountability.
Hard accountability means accountability to another person for performance, in the form of financial reports and other quantitative performance measurements.
Soft accountability is self-accountability. An individual might be personally motivated to achieve performance targets, and will judge his or her own personal performance in relation to those targets. With soft accountability, control from above by senior management is not required.
Hard accountability requires methods for measuring and reporting actual performance, using quantitative measures, and comparing actual performance against the target. A system of hard accountability needs three elements.
Counting. This means that there must be quantitative aspects of performance that are capable of being counted and measured. There are different costing systems for recording and measuring performance, such as standard costing and variance reporting systems, profit centre reporting systems, activity-based costing systems, quality cost systems and so on. Quantitative measures may be non-financial as well as (or instead of) financial measures.
Accounting for the numbers. This means finding the reasons for the numbers that were achieved. If performance is accounted for, it is then possible to ask questions about why or how those figures occurred. For example, why were actual product costs higher than budgeted or higher than standard cost? Why did the profit centre report a fall in profit compare dwith the previous year?
Accountability for the events and circumstances that led to the numbers. The third aspect of hard accountability is to make individuals accountable for their contribution to the events or circumstances that have led to the performance level that has been achieved. For example if there has been a very high adverse material price variance, the purchasing manager may be asked to explain the poor performance. If capacity utilisation of machinery is below budget, the production manager may be asked to explain reasons for poor production scheduling, or the sales manager may be asked to explain a failure to achieve the budgeted level of sales demand for production output.

Chapter 7: Strategic performance measurement
© Emile Woolf Publishing Limited 169
Financial performance in the private sector
The primary performance objective
Differing primary measures of financial performance
Other financial measures of performance
Short-run and long-run financial performance
Setting financial targets: methods
Making comparisons of financial performance
2 Financial performance in the private sector
2.1 The primary performance objective
For companies, the primary performance objective should be concerned with the benefits of their owners, the shareholders. The aim should be to provide benefits to shareholders over the long term, in the form of dividends from profits and share price growth. Share price growth comes mainly from growth in the business and earnings per share. However, growth should not be achieved if it exposes the company to excessive risks. The primary objective of financial performance targets should therefore be consistent with the long-term objectives of both:
business growth and
survival
2.2 Differing primary measures of financial performance
There are several measures of financial performance that could be used to assess success in achieving corporate objectives.
It is inappropriate to use targets for share price growth and dividend growth as formal planning targets and measures of actual performance. Share prices can be volatile, and affected by stock market conditions outside the control of a company’s management. Dividend policy, on the other hand, is under the control of the board of directors, but can be manipulated. Dividend payments do not have to move in line with changes in profitability or longer-term financial expectations of profit.
It is therefore more appropriate to measure financial performance in terms of conditions that should lead to share price growth and dividend growth in the future.
Discounted cash flow measures of performance
Discounted cash flow is used to assess the value of proposed capital expenditure projects. (It can also be used to assess the value of companies and their shares.) In

Paper P5: Advanced performance management
170 © Emile Woolf Publishing Limited
theory, if a company uses an appropriate cost of capital as the discount rate, projects that are expected to have a positive net present value (NPV) should add to the value of the company and its shares. Similarly, projects will add to the company’s value if they are expected to have an internal rate of return (IRR) or modified internal return (MIRR) in excess of the company’s cost of capital. NPV, IRR and MIRR are therefore used to assess the value of capital expenditure proposals. However, although discounted cash flow techniques can be applied to evaluate forecasts of future cash flows from capital projects, they are not practical methods for analysing historical performance. This is because management accounting systems are not designed to identify specific cash flows arising from capital projects, and some relevant cash flows in DCF analysis, such as opportunity costs, would also be difficult to measure.
Financial measures of historical performance
Financial measures used to measure historical performance, and assess whether a company appears to be achieving its corporate objectives, may be:
return on capital employed (ROCE)
earnings per share and growth in earnings per share
earnings before interest, tax, depreciation and amortisation (EBITDA)
for investment centres, return on investment or residual income
None of these performance measures is ideal for assessing performance and progress towards achieving the corporate objective.
Return on capital employed (ROCE) is a useful measure of performance, because it relates the amount of profit earned to the amount of capital employed in the business. However, the measurement of ROCE depends on accounting conventions for the measurement of profit and capital employed.
Earnings per share growth is also commonly used to assess performance. On the assumption that in the long term, the ratio of the share price to EPS (the price/earnings ratio or P/E ratio) remains fairly constant, growth in EPS should result in a higher share price. However, the P/E ratio does not necessarily remain constant over the long term, and could change if the perception of investment risk in the company changed.
EBITDA (= Earnings before interest tax depreciation and amortisation). EBITDA is a useful measure of performance only if it is assumed that management have no control over interest costs or depreciation and amortisation charges. This may be true for profit centre management, but is unlikely to be the case when managers have control over investment and financing decisions. EBITDA is a useful approximation of cash flow from operations before interest and tax, and can be a useful measurement of financial performance for this reason. (Note: If you are not sure about this, think about the calculation of operational cash flows in a statement of cash flows, using the indirect method.)
The benefits and limitations of ROI and residual income are considered in the next chapter.

Chapter 7: Strategic performance measurement
© Emile Woolf Publishing Limited 171
Measuring financial security: liquidity and gearing
A long-term objective of a company should be survival, as well as growth. It is therefore appropriate to measure financial risk. Measures of financial risk include:
liquidity risk, measured by ratios such as the current ratio or quick ratio, or by cash flow analysis
gearing or debt/equity ratios, which measure the potential risk to a company from its funding structure.
Liquidity can be important. Liquidity means having cash or access to cash to make payments when these are due. For example, a company must have cash to pay salaries and wages of its employees, and to pay suppliers and other creditors. In some cases, profitable companies might become insolvent because they cannot pay their debts. A lack of liquidity also restricts flexibility of action. A company that is short of cash is often unable to take advantage of new opportunities that might arise, because they do not have the money to spend. Gearing and debt levels can also be important. Highly-geared companies are exposed to the risk of a big fall in earnings per share whenever there is a fall in their operating profits. When they borrow at variable rates of interest, an increase in interest rates will also reduce profitability.
Historical profits and expected future profits
The main objective of a commercial company might be to maximise the wealth of shareholders. Wealth is increased by paying dividends and through increases in the share price. A common assumption in financial management is that the share price of a company depends on expectations of future profits and dividends. During the late 1990s and early 2000s, the share prices of newly-formed ‘new technology’ companies reached very high levels, even though these companies were making heavy losses. The view of investors at the time was that high values for new technology companies were justified by the expectation of enormous future profits. The high share prices reached by these companies are now known as the ‘dot.com bubble’, which collapsed in 2001. In 2000 and 2001 the share prices of these companies collapsed, and many went out of business. It was eventually recognised that most of the new technology companies would never compete successfully against larger ‘traditional’ companies. Most never became profitable before they went out of business or were taken over at low prices. A lesson from the ‘dot.com bubble’ is that future share prices (and shareholder wealth) will depend on future profits and dividends. However, it is important to convince investors that the company will be profitable in the future. Historical returns and profits, and trends in profitability, might provide some guide to what profits might be in the future.

Paper P5: Advanced performance management
172 © Emile Woolf Publishing Limited
2.3 Other financial measures of performance
Financial measures are used to set targets for performance and monitor actual performance throughout the management hierarchy. You should be familiar with many of these financial measures, such as:
gross profit margin
net profit margin
cost/sales ratios
growth in sales
cost variances.
Another way of measuring the management of costs is to measure costs as a percentage of total sales revenue, and monitoring changes in this percentage figure over time. Cost ratios might include:
production costs as a percentage of sales distribution and marketing costs as a percentage of sales
administrative costs as a percentage of sales
material costs as a percentage of total cost
labour costs as a percentage of total costs.
Costs can also be monitored in terms of:
cost per unit
cost per machine hour
cost per activity – for example the cost to process and despatch a customer’s order, or the cost to rectify a defective unit
comparison with a target cost.
2.4 Short-run and long-run financial performance
DCF methods of measuring financial performance are forward-looking and long-term in perspective. As stated already, DCF is not suitable for measuring historical performance. A problem with other financial measures of performance is that they are mainly short-term in perspective, and focus in the current financial year. Trends can also be monitored (growth in EPS, sales, profits and so on), but it can be difficult to project historical trends into the future. Rewards to individuals for performance are also often based on the achievement of targets for the current financial year, adding to the short-term focus. The need to find a balance between short-term and long-term financial success has led to the development of differing views of performance measurement, such as the balanced scorecard and performance pyramid. These are described in a later chapter.

Chapter 7: Strategic performance measurement
© Emile Woolf Publishing Limited 173
2.5 Setting financial targets: methods
There are several different ways of setting targets, such as financial targets, or making financial forecasts:
engineering-based targets
historical-based targets
negotiated targets
Engineering-based targets
Engineering targets may be used when there is a stable and predictable relationship between inputs to the forecasting model and outputs. An example of this type of forecasting or targeting is standard costing. Standard costs assume a fixed relationship between the resources that go into making an item of product and the production of one finished unit. By setting a standard cost, it is possible to set a target total cost for the production of any given quantity of the items.
Historical-based targets
When it is not possible to identify stable and predictable relationships between inputs and outputs, it may be appropriate to establish targets on the basis of either:
historical performance, and what has been accomplished in the past, or
historical targets that have been used in the past, on the assumption that they are still based on valid assumptions
For example, a financial target may be set to achieve a gross profit to sales ratio of 40%, because this target has been used consistently for the past few years. However, the past is not always a suitable basis for setting targets for the future:
the circumstances that applied in the past may no longer apply for the future, and different assumptions might be appropriate for setting targets for the future
the historical targets used in the past may allow for inefficiencies that ought to be eliminated for the future.
Negotiated targets
Financial targets may also be agreed as the outcome of negotiations between superiors and subordinates. Senior managers may try to impose financial targets on their subordinates, and the subordinates may argue that the targets are unrealistic and unfair. As a result of the discussions and negotiations that follow, ‘compromise’ targets may be agreed that are acceptable to both sides. Advocates of negotiated financial targets argue that the negotiation process between superiors and subordinates helps to bridge the information gap between:
senior managers, who can see the ‘big picture’ and what the entity should be trying to achieve (which subordinate managers may not be aware of)

Paper P5: Advanced performance management
174 © Emile Woolf Publishing Limited
subordinate managers, who understand operational matters at a level of detail that their seniors do not.
Negotiating financial targets enables senior and subordinate managers to exchange information and views, each from their own perspective. As a result of the negotiations, the financial targets that are agreed should be achievable, striking a realistic balance between higher-level objectives and lower-level practical realities.
2.6 Making comparisons of financial performance
The performance of departments or divisions may be assessed through comparison. In other words, has one division performed better than the other? However, when making comparisons of performance between two divisions of the business, it is important to be aware of the reasons why their performance might be different. There could be very good reasons why one division has performed better than the other in the short-term. When there are good reasons for differences in performance, the comparison should take these reasons into consideration. A simple example may help to illustrate this point.
Example An international company has two operating divisions, one in Country X and the other in Country Y. The operating division in Country X has been in existence for many years. The operating division in country Y was established two years ago, when the company invested in country Y for the first time. The financial results for the two divisions for the year just ended are as follows:
Year 1 Year 2 Country X Country Y Total Country X Country Y Total
$ million
$ million
$ million
$ million
$ million
$ million
Sales 800 80 880 860 120 980 Direct costs Labour 280 15 295 302 22 324 Materials 160 20 180 182 28 210 440 35 475 484 50 534 Other costs Marketing 70 40 110 80 80 160 Depreciation 100 8 108 100 16 116 170 48 218 180 96 276 Total costs 610 83 693 664 146 810 Profit before interest
190 (3) 187 196 (26) 170
Interest 20 40 165 130 Non-current assets (net book value)
90 25 115 100 55 155
Debt 300 650
Chapter 7: Strategic performance measurement
© Emile Woolf Publishing Limited 175
These figures might suggest that operating performance was much better in Country X than in Country Y. Country Y made a loss in Year 1 and an even bigger loss in Year 2. However, the operations in Country Y are fairly new, and the difference in the results between the two countries is probably due to the costs of starting up in Country Y. In particular, the marketing costs in Country Y are very high relative to sales. High marketing spending may be necessary to establish a foothold in the market and a suitable market share. The ratio of total costs to sales can be compared. The ratio of material costs to sales is slightly higher in Country Y than in Country X, possibly due to difficulty in obtaining material supplies locally. However, the ratio of labour costs to sales is much lower in Country Y, suggesting that at some time in the future, it may be beneficial to switch production from country X to Country Y. Sales are growing in Country X, but the profit/sales ratio has fallen slightly. Sales grew by 50% in Country Y in Year 2, suggesting that the greatest potential for growth in sales and profits might be in Country Y rather than Country X. The data is by no means conclusive. The key point, however, is that comparisons should be made with care.

Paper P5: Advanced performance management
176 © Emile Woolf Publishing Limited
Six Sigma
Seeking ‘near perfection’
The basic approach in Six Sigma
Process improvement and process design
Process improvement: DMAIC
New process design or radical improvement: DMADV
3 Six Sigma
3.1 Seeking ‘near perfection’
Six Sigma is an approach to eliminating defects from products and operations, and achieving near perfection. Although it was originally applied to manufacturing operations and defects in products, it can also be applied to any product, process or transaction. The term ‘Six Sigma’ comes from statistical analysis, but it is now generally accepted as meaning that there should be no more than 3.4 defects in every 1 million items, for any product or process to which the Six Sigma methodology is applied. The limit of 3.4 defects per 1 million items can be seen as a target, and improvements in existing products and processes and designs of new products and processes should aim towards this target. Six Sigma was originated in the US in the 1980s, by Motorola. (Although the term ‘Six Sigma’ is widely used, it is a registered trademark of Motorola.) Modern technology was becoming more complex, and it was becoming apparent in some manufacturing industries that old ideas about quality standards and quality control no longer applied. Unless quality standards could be improved in component production, for example, the quality of complex end-products would be much lower than customers had a right to expect. In 1989, having experimented for several years with its approach to quality by improvements, Motorola announced that within five years it intended to achieve a defect rate of no more than 3.4 parts per million in its products.
Examples A company might establish target specifications for the manufacture of a product, and products should be manufactured to this exact specification, or within acceptable tolerance limits. A Six Sigma approach should be to ensure that no more than 3.4 items per 1 million produced will fail to meet the specification, or will be manufactured outside the acceptable tolerance limits. The IT department of a company that writes software for other departments might set a target for the programs that it writes of no more than 3.4 coding errors per 1 million lines of software code.

Chapter 7: Strategic performance measurement
© Emile Woolf Publishing Limited 177
3.2 The basic approach in Six Sigma
A definition of Six Sigma will help to explain its key features. Six Sigma has been defined as ‘a data-driven method for achieving near-perfect quality. Six Sigma analysis can focus on any element of production or service, and has a strong emphasis on statistical analysis in design, manufacturing and customer-oriented activities’ (UK Department of Trade and Industry). The basic objective with Six Sigma is to focus on improvements in processes and a reduction in variations. Perfection is achieved by reducing the amount of variations in processes. For example, if a product is designed with a length of exactly one metre, Six Sigma improvements might be aimed at reducing the variation in the length of products actually manufactured to acceptable tolerance limits of, say, plus or minus one millimetre. The aim of Six Sigma is to improve customer satisfaction. Its approach is to apply a standard approach (a structured methodology) to reduce and control the causes of variation in a process, and to focus on reducing the standard deviation of actual performance from the target specification.
The Six Sigma approach relies heavily on statistical measurements. Actual performance is measured and compared with the target, and the number of ‘defects’ – products or processes that fail to meet acceptable standards – can be established, to see whether the required quality standards have been achieved. Another feature of Six Sigma is that project teams are established to achieve the required improvements in processes or products. These project teams should consist of representatives from every department or aspect of operations that might contribute towards making the required improvements. The projects teams should be led by individuals who are specially trained in Six Sigma methods, who are commonly called Master Black Belts, Black Belts and Green Belts, according to their level of skill and knowledge of Six Sigma. General Electric Company, another US company that adopted Six Sigma methods, has stated that Six Sigma is based on the following key concepts:
‘Critical to quality’. These are attributes or characteristics of a product or service that are the most important to customers.
Defect. This is failing to deliver what the customer wants.
Process capability. This is the level of quality or performance that a process is capable of achieving.
Variation. This refers to variations in quality that the customer can see or feel in a product or service.
Stable operations. This means consistent and predictable processes and operations that improve what customers see and feel.
Design for Six Sigma. This refers to designing a product or process that meets customer needs and achieves the level of process capability for doing this.

Paper P5: Advanced performance management
178 © Emile Woolf Publishing Limited
3.3 Process improvement and process design
The Six Sigma approach differs slightly between:
making improvements in existing processes, where the required changes in the process are fairly small (‘incremental improvements’), and
the design of a new process, or major re-design of an existing process.
Process improvements
The Six Sigma approach to making incremental improvements in existing processes is in five steps, known as DMAIC.
Define an opportunity
Measure performance
Analyse the opportunity
Improve performance
Control performance.
New process design/process re-design
The Six Sigma approach to designing a new process or the major re-design of an existing process is also in five steps, known as DMADV.
Define the goals for the new process
Match performance requirements with these goals
Analyse these performance requirements and produce an outline design (a design, but not in detail) of a new process that will meet these requirements
Design and implement the process
Verify performance.
3.4 Process improvement: DMAIC
The five steps in process improvement using the Six Sigma method are explained in more detail below. You should try to learn the DMAIC approach: it has been examined in P5 in the past, and may well be examined again.
D = Define
A serious problem with the quality of an existing process is identified.
A problem statement is then prepared. This describes the nature of the problem, which must be defined in specific, measurable terms. What is the visible evidence of the problem? What are the symptoms of the problem? (A ‘symptom’ is something that is going wrong in the process, expressed as a quantified measurement of output from the process).
Having defined the problem, a ‘mission statement’ is drawn up, which states what will be done to deal with the problem. Like the problem statement, the mission statement should be expressed in specific and quantified terms, using the same units of measurement that have been used in the problem statement.

Chapter 7: Strategic performance measurement
© Emile Woolf Publishing Limited 179
For example, the problem statement may be that the number of defects in a particular process is 1 in 1,000. The mission statement may then be that the aim should be to reduce the number of defects to no more than 1 in 100,000
A project team is set up. This team is given the responsibility and the resources to solve the problem and make an improvement. It should be a ‘cross-functional’ team consisting of members from all the departments or functions that will be affected by the project.
M = Measure
The project team should begin with preliminary analysis of the process and the quality problem. The aim is to obtain a measure of how the process is working and to gather data that can be studied in order to arrive at a conclusion about what the problem seems to be. If there appears to be more than one cause to the problem, the team should concentrate on the factor that appears to be the biggest contributor.
Data is obtained about the current process, and the ‘symptoms’ of the problem are measured in detail. At this stage in the project, the project team should measure how the process is working, and obtain data that can be analysed in order to identify what seems to be causing the problem. Where there are several causes of a ‘symptom’, the project team should concentrate on those problems that are the main causes.
This is a preliminary analysis. The project team will not make a final decision about the main causes of the problem until it has carried out a more extensive analysis.
The mission statement should be verified, and if necessary amended.
A = Analyse
The project team should then investigate in greater detail the matter than, on preliminary analysis, appears to be the cause of the quality problem. The aim is now to identify what the actual cause of the problem is. Different theories will be formulated and tested, with a view to confirming or discovering what the main cause (or causes) of the problem seems to be. Theories that cannot be correct are rejected. Through this process of testing different theories, the main cause of the problem is identified.
Different theories are tested, until the project team believes that it has discovered the main cause (or causes) of the problem.
The project team formulate different theories about the main causes of the problem, and documents these theories.
Each theory is then tested, to establish whether it might be correct. Theories are rejected when it is decided that they cannot be correct.
The ‘root’ cause (or causes) of the problem is identified when the testing of the theories has been completed.
I = Improve
The cause (or causes) of the problem are removed by means of re-designing and improving the process that is causing the problem.
Paper P5: Advanced performance management
180 © Emile Woolf Publishing Limited
Several different alternative methods of improving the process should be evaluated, to decide which will be the most effective in achieving the ‘mission statement’ for the project.
The chosen improvement is then designed in detail.
If the improvements are likely to meet resistance to change from some employees, plans should be developed for overcoming the expected resistance.
Before the improvement is implemented, it should be tested to prove that it will be effective.
The improvement is then implemented.
C = Control
New controls are designed and implemented to prevent the problem from returning and to make sure that the improvements are sustained. Controls will include regular measurements of output from the process, and a comparison of actual performance with the target. The controls should be audited from time to time, to make sure that they are effective.
3.5 New process design or radical improvement: DMADV
Sometimes, making improvements in existing processes is not sufficient to achieve the required quality standard, and a completely different process must be designed. The five steps in new process design using the Six Sigma method are explained in more detail below.
Define. The goals and target quality standards of the new process must be defined. Customer requirements and expectations should be taken into consideration when defining these goals.
Match. The next step is to develop a set of performance measurements (quantified performance targets) that will enable the goals for the process to be achieved.
Analyse. These performance standards for the new process must be analysed. Based on this analysis, a preliminary design for a new process is developed.
Design. The preliminary design for the new process is developed into a more detailed design, and the new process is then implemented.
Verify. After the new process has been implemented, controls and checks should be introduced to confirm that the required performance targets are met, and that the goals of the process are successfully achieved.
3.6 Six Sigma roles
Because a Six Sigma programme means seeking excellence, implementation requires more than simply explaining to employees what Six Sigma means, and expecting everyone to know what to do to achieve it. It is essential for entities to invest in training selected staff in the appropriate methods, tools and techniques, and then to

Chapter 7: Strategic performance measurement
© Emile Woolf Publishing Limited 181
enable them to manage the Six Sigma programme and guide improvement projects. These selected and trained individuals, particularly those commonly referred to as ‘master black belts’, ‘black belts’ and ‘green belts’, are the core of the Six Sigma programme. Six Sigma identifies five key roles for its successful implementation.
Executive leadership. This includes the chief executive (CEO) and other key top management team members. They are responsible for setting up a vision for Six Sigma implementation and for allocating resources to the programme.
Champions are responsible for the Six Sigma implementation across the entity in an integrated manner. They are senior managers in the organisation. Champions also act as mentor to Black Belts.
Master Black Belts are identified act as the entity’s in-house expert coaches for Six Sigma. They devote 100% of their time to Six Sigma. They assist champions and guide Black Belts and Green Belts.
Black Belts operate under Master Black Belts to apply Six Sigma methodology to specific projects. They devote 100% of their time to Six Sigma. They primarily focus on Six Sigma project execution, whereas Champions and Master Black Belts focus on identifying projects/functions for Six Sigma.
Green Belts are the employees who take up Six Sigma implementation along with their other job responsibilities. They operate under the guidance of Black Belts and support them in achieving the overall results.
3.7 The significance of Six Sigma for process redesign
A key feature of Six Sigma is the search for excellence and near-perfection. In practice many processes fail to provide perfect quality and the scope for improvements is enormous. However, to achieve near-perfection, it might be necessary to introduce radical changes to systems and business methods. Six Sigma improvements might be targeted for example at:
the replacement of traditional business methods with e-business methods
the replacement of traditional organisation structures with virtual organisations
introducing changes throughout the value chain
radical process re-design.
Paper P5: Advanced performance management
182 © Emile Woolf Publishing Limited
Non-financial performance indicators (NFPIs)
The nature of non-financial measures of performance
Strategic NFPIs
Operational NFPIs
Capacity utilisation and resource utilisation
Multiple measures of performance
Measurements of quality
Performance through quality
Qualitative performance
4 Non-financial performance indicators (NFPIs)
4.1 The nature of non-financial measures of performance
Performance measures might be non-financial. Non-financial performance indicators (NFPIs) can be both quantitative and qualitative.
Non-financial measures of performance should focus on critical success factors of a non-financial nature. These will vary from one type of business entity to another, and they will also vary according to the ‘level’ of performance reporting – strategic or operational. Typically, non-performance measures of performance will relate to a critical success factor in one of the following areas:
quality
speed (for example, speed of service or speed of delivery)
reliability
efficiency
achieving a specific non-financial target
meeting customer needs/customer satisfaction.
4.2 Strategic NFPIs
Non-financial performance measures are needed because success in achieving some strategic objectives cannot be measured in money terms alone, and in terms of financial performance measurements. Some strategic objectives are therefore set in terms of a non-financial performance target, and actual results are compared with this non-financial target. Non-financial targets should be compatible with financial targets.

Chapter 7: Strategic performance measurement
© Emile Woolf Publishing Limited 183
Examples of quantitative strategic non-financial performance measurements include:
market share (as a target for competitive strategy and sales strategy)
number of new products developed (as a target for innovation strategy)
quality measures (where quality is a key strategic objective for meeting customer needs and expectations).
4.3 Operational NFPIs
Many operational targets are set and operational performance measured by NFPIs. For example, measures of success in meeting customer needs include:
customer service measures, such as average time to respond to customer calls, and average time to meet customer orders
customer satisfaction reports
measures of repeat business obtained or customer loyalty.
Measures of performance in relation to the management of employees would include:
staff turnover rates
absenteeism and sickness rates
productivity ratios or similar productivity measurements.
4.4 Capacity utilisation and resource utilisation
Measures of performance in relation to the utilisation of resources include capacity utilisation ratios, such as:
hotel room occupancy rates (hotels)
machine utilisation rates
proportion of seats filled (airlines, cinemas).
Capacity utilisation is an important aspect of performance, because successful performance often depends on the extent to which available key resources are used. In a manufacturing business, a company may have invested heavily in special production equipment. If the machines are used to 98% of their capacity, this would indicate that operations are performing well. On the other hand, if the machines are operating at only 40% capacity, this would indicate scope for improvement. In your exam, you may be required to calculate capacity utilisation ratios as measures of performance, and comment on them (change from the previous year, or comparison with the budget or with another entity’s capacity utilisation). Other examples of capacity utilisation measures are:
The capacity utilisation of classrooms in a school (actual number of students as a percentage of capacity)

Paper P5: Advanced performance management
184 © Emile Woolf Publishing Limited
The utilisation of bed space in a hospital (actual patient days compared with maximum capacity)
The utilisation of seats in a bus service or train service, compared with capacity
The utilisation of space in transport vehicles, compared with capacity.
Actual capacity utilisation is usually reported as a percentage of total capacity.
Example Cloudy Airlines has a fleet of three passenger planes that fly between Bendia Airport and Dandia Airport. Each plane does two return journeys each day. They operate for 360 days each year. The seating capacity on each plane is 150 seats, all the same class. During the year just ended, Cloudy Airlines sold 180,000 return flight tickets on the route and 97,200 one-way tickets. Capacity utilisation on the route was 75% last year. What was capacity utilisation in the current year (just ended) and what does this suggest about performance?
Answer We need to calculate the capacity on the route.
100% capacity = 3 planes × 4 trips per day (two return trips) × 150 seats per plane × 360 days per year = 648,000 passengers. Actual capacity = (180,000 × 2) + 97,200 = 457,200. Capacity utilisation = 457,200/648,000 = 0.7056 = 70.56%. If capacity utilisation was 75% last year, capacity utilisation has fallen in the current year, which should be a matter of concern to management.
4.5 Multiple measures of performance
Performance can be assessed using several different measures or indicators. For example, performance can be measured by:
A combination of financial measures, quantified non-financial measures and (possibly) non-quantified (qualitative) non-financial measures
A balanced scorecard approach, with four different perspectives on performance targets
Measures related to short-term financial and operating targets and measures related to longer-term strategic objectives.

Chapter 7: Strategic performance measurement
© Emile Woolf Publishing Limited 185
4.6 Measurements of quality
Quality targets may be a major element in strategic planning. Quality is associated with meeting customer needs and expectations. Quality performance can be measured and evaluated in relation to the key performance objectives of quality, speed, dependability (reliability), flexibility and cost. For example:
Performance objective
Performance measure
Quality Percentage of items rejected or scrapped Average number of defects per unit produced Average time between machine breakdowns Number of customer complaints Number or cost of warranty claims
Speed Average time between receiving an order and completing the work
Throughput cycle time Transport times
Dependability Percentage of customer orders met from inventory Percentage of orders or items delivered late Average delays
Flexibility Average set-up time New product development time Range of products
Cost Variances Cost per operating hour/per machine hour Labour productivity Throughput, contribution
Another approach to quality performance measurement is to use a combination of operational measures, financial measures and customer measures. For example:
Operational measures
- percentage of items rejected
- time lost in production
Financial measures
- the cost per unit produced
- quality costs
Customer measures, such as:
- number of customer complaints
- number of claims under warranty
- change in total market share.

Paper P5: Advanced performance management
186 © Emile Woolf Publishing Limited
4.7 Performance through quality
Cost and quality are inter-connected issues. Business entities provide goods or services to customers that combine a particular cost per unit (and sales price per unit) with a perceived level of quality. In a competitive business environment, companies should be trying either:
to provide customers with more quality for a given cost per unit or
to provide products of a given quality for a lower cost.
In the following diagram, the current position for a company in a competitive market is shown as point A. The company has six strategic options, A to F.
Strategy A. This is a do-nothing strategy. In a competitive business environment, it is the strategy most likely to result in eventual business failure. Companies cannot ‘do nothing’. Like their competitors, they need to seek ways of providing more value to customers, by reducing costs or improving quality.
Strategy B. This strategy is to improve the quality of the product or service, and increasing the cost per unit to achieve the quality improvement.
Strategy C. This is a strategy of more quality for the same cost – improving the quality of the product or service without any change in the cost per unit.
Strategy D. This is a strategy of improving quality and at the same time reducing the cost per unit. This is the strategy most likely to succeed over the long term, but improving quality and reducing costs may be difficult to achieve.
Strategy E. This is a strategy of maintaining the same quality, but at a lower cost per unit.
Strategy F. This is a strategy of ‘going down-market’, and providing a cheaper product or service, but at a lower standard of quality.
Strategy A is the least likely to succeed and Strategy D the most likely to succeed. The likely success of the other strategies will depend on competitive conditions in the market (what competitors are doing) and on customer preferences.

Chapter 7: Strategic performance measurement
© Emile Woolf Publishing Limited 187
4.8 Qualitative performance
Qualitative performance is performance that is not measured and expressed in quantitative terms. Qualitative performance targets may be expressed in general terms, such as:
being the ‘best’ or ‘better than competitors’
‘meeting customer needs’
‘high quality’.
Where possible, performance targets should be quantified. A quantified target provides a specific objective for achievement, and actual performance can be measured against it. With qualitative targets, assessing performance may be a matter of judgement and subjective opinion. In many cases, it is possible to convert qualitative targets into quantitative targets. For example, an objective of achieving high quality can be expressed in quantitative quality targets. Similarly, ‘being better than the competition’ can be converted into quantitative targets, by identifying the ways in which the company wants to ‘beat’ the opposition. Even ‘meeting customer needs’ can be quantified, by identifying what customer needs are, or by measuring customer views in an attitude survey. In some cases, however, it may be difficult to quantify critical performance targets. In particular, it may be difficult to set quantitative targets for:
brand recognition, or
reputation.
These can, however, be critical success factors.
The commercial success of many companies is reinforced by a strong brand that the company reinforces through advertising and maintains through quality.
The commercial success of a company may be put at risk by a ‘bad’ reputation. For example, a well-known footwear company suffered a decline in sales some years ago following media reports that its suppliers used child labour. Some oil companies promote an image of being environmentally-conscious, perhaps in the expectation that it will obtain longer-term benefits from a socially and environmentally-friendly image.

Paper P5: Advanced performance management
188 © Emile Woolf Publishing Limited
Performance measurement in not-for-profit organisations
The special characteristics of not-for-profit organisations
Identifying performance targets for not-for-profit organisations
Value for money (VFM)
Problems with performance measurement in not-for-profit entities
5 Performance measurement in not-for-profit organisations
5.1 The special characteristics of not-for-profit organisations
Not-for-profit organisations, such as government departments and charitable organisations, differ from commercial businesses because their main objective is not financial. The main objective of any such organisation depends on the purpose for which it exists: to administer the country (government departments), to provide education (schools and universities), provide medical care (hospitals), do charitable work, and so on.
A not-for-profit organisation will nevertheless have some financial objectives:
State-owned organisations must operate within their spending budget.
Charitable organisations may have an objective of keeping running costs within a certain limit, and of raising as much funding as possible for their charity work.
Because of this difference, a different approach is needed to setting performance targets and measuring performance in a not-for-profit organisation.
5.2 Identifying performance targets for not-for-profit organisations
You may be required in your examination to suggest quantitative targets for a not-for-profit organisation. The selection of appropriate targets will vary according to the nature and purpose of the organisation. The broad principle, however, is that any not-for-profit organisation should have:
strategic targets, mainly non-financial in nature
operational targets, which may be either financial (often related to costs and keeping costs under control) or non-financial (related to the nature of operations)
A useful approach to setting performance targets and performance measures in a not-for-profit entity is to group performance indicators into three groups:
financial measurements, which indicate the efficiency in using available financial resources and economy in spending
non-financial measurements, which indicate whether the entity has achieved its strategic objectives (measurements of effectiveness)

Chapter 7: Strategic performance measurement
© Emile Woolf Publishing Limited 189
qualitative indicators, which also indicate effectiveness in achieving objectives, but which cannot be measured in quantifiable terms.
Example The performance targets and performance measurements for a hospital might include the following items:
Financial measures
Budgeted annual expenditure. Comparison of actual spending with the budget.
(efficiency, economy)
Costs per selected units of activity, such as average costs per treatment, average costs per operation, average annual cost per hospital bed.
Benchmarking costs against costs in other hospitals. Major items of cost as a percentage of total costs: for example,
administration and management costs as a percentage of total running costs.
Non-financial measures
Units of service delivered, such as the number of patients treated each year, and the number of operations performed.
(effectiveness) The speed of delivery of services, such as the speed of an ambulance service, average waiting time for treatment, average time between start and completion of treatment.
Quality of service, measured in terms of successful treatments, number of serious errors in treatment.
Utilisation of resources, such as ‘bed occupancy rates’ (percentage of beds occupied on average by patients each day).
Qualitative Public confidence and satisfaction with the services provided. Morale of the work force. Standards of cleanliness in the hospital.
Example Similarly, the performance measurements for a school might be as follows:
Financial measures
Budgeted annual expenditure. Comparison of actual spending with the budget.
(efficiency, economy)
Costs per selected units of activity, such as average costs per student per year.
Benchmarking costs against costs in other schools. Major items of cost as a percentage of total costs: for example,
cost of spending on books or IT systems as a percentage of total running costs.

Paper P5: Advanced performance management
190 © Emile Woolf Publishing Limited
Non-financial measures
Examination results (compared with a government target or benchmarked against other schools).
(effectiveness) Number of students going on to university. Annual intake of new students. Utilisation of resources, such as the ratio of teachers to students.
Qualitative Reputation of the school. Behaviour of students.
5.3 Value for money (VFM)
The performance of not-for-profit organisations may be assessed on the basis of value for money or VFM. Value for money is often referred to as the ‘3Es’:
economy
efficiency
effectiveness.
Economy
Economy means keeping spending within limits, and avoiding wasteful spending. It also means achieving the same purpose at a lower expense. A simple example of economy is found in the purchase of supplies. Suppose that an administrative department buys items of stationery from a supplier, and pays $2 each for pens. It might be possible to buy pens of the same quality to fulfil exactly the same purpose for $1.50 each. Economy would be achieved by switching to buying the $1.50 pens, saving $0.50 per pen with no loss of operating efficiency or effectiveness.
Efficiency
Efficiency means getting more output from available resources. Applied to employees, efficiency is often called ‘productivity’. Suppose that a sales order clerk processes 50 customer orders each day. Efficiency would be improved if a sales order clerk increases the rate of output, and processes 60 orders each day, without any loss of effectiveness.
Effectiveness
Effectiveness refers to success in achieving end results or success in achieving objectives. Whereas efficiency is concerned with getting more outputs from available resources, effectiveness is concerned with achieving outputs that meet the required aims and objectives. For example, the efficiency of sales representatives will be improved if they increase their calls to customers from eight to ten each day, but their effectiveness will not be increased if they do not achieve any more sales from the extra calls. Management accounting systems and reporting systems may provide information to management about value for money. Has VFM been achieved, and if so, how much and in what ways?

Chapter 7: Strategic performance measurement
© Emile Woolf Publishing Limited 191
Value for money audits may be carried out to establish how much value is being achieved within a particular department and whether there have been improvements to value for money. Internal audit departments may carry out occasional VFM audits, and report to senior management and the manager of the department they have audited. VFM budgeting can be particularly useful in not-for-profit organisations, whose purpose is to achieve a stated objective as closely as possible, with the resources available.
Example State-owned schools may be given a target that their pupils (of a specified age) must achieve a certain level of examination grades or ‘passes’ in a particular examination. A VFM audit could be used to establish spending efficiency within a school.
Economy. Was there any unnecessary spending? Could the same value have been obtained for lower spending?
Efficiency. Have the school’s resources been used efficiently? Could more output have been obtained from the available resources? Could the same results have been achieved with fewer resources? A study of efficiency might focus on matters such as teaching time per teacher per week, and the utilisation of resources such as science equipment and computer-based training materials.
Effectiveness. The most obvious measurements of effectiveness are the number or percentage of pupils achieving the required examination ‘passes’, or the grades of pass mark that they have achieved. Effectiveness is improved by increasing the pass rate.
5.4 Problems with performance measurement in not-for profit entities
There are several problems commonly found with performance measurement in not-for-profit entities, particularly in entities that are controlled by the government. The entity might have several different strategic targets, which may sometimes conflict with each other. For example, the strategic targets for a state-owned school might be to:
raise the general standard of education, as measured by pass rates in examinations
provide a broad education
raise the standards of the most able students.
These targets conflict because it may be impossible to focus on examination results and also provide a broad education. Similarly, it might not be possible to raise education standards for all students but at the same time try to develop the most gifted students.

Paper P5: Advanced performance management
192 © Emile Woolf Publishing Limited
Multiple strategic targets might not be achievable within the limits of the available resources and expenditure budgets. For example, the strategic targets of a police force might be to:
prevent crime and
increase the detection rate for crimes that have been committed.
Given the limited resources available, a police force might be unable to prevent crime and also increase detection rates. There are other problems with assessing performance of not-for-profit entities.
There might be political interference that prevents strategic targets from being achieved. For example, the government might decide to change the strategic targets for the hospitals service, or introduce additional targets.
It might be difficult to measure the output of a not-for-profit entity. For example, how might the output of a fire service be measured?
The service may be organised on a regional basis. For example, there may be a regional fire service, a regional police force or a regional schools network. It is usual in these circumstances to compare the performance of each region or area. This is often unfair, since conditions and circumstances very widely between different areas of the country. (An extreme example in the UK in 2006 was the criticism by a government audit agency of the police force on Lundy Island: the agency criticised the police for failing to improve its road accident statistics, whereas many other police forces had succeeded in reducing road accidents in their area. There had not been any road accidents on Lundy Island since the car was invented, which made the criticism somewhat unfair!)
There may be a tendency to measure performance by the amount of resources and money put into the entity, rather than measuring performance on the basis of outputs achieved. For example, it might be tempting to judge the health service on the basis of extra staff employed or extra money spent on hospitals, equipment and medicines.
Chapter 7: Strategic performance measurement
© Emile Woolf Publishing Limited 193
Behavioural aspects of performance reporting: reward systems
Unintended consequences of performance measurement systems
Performance rewards
Designing reward schemes: factors to consider
Behavioural problems with reward systems
6 Behavioural aspects of performance reporting: reward systems
6.1 Unintended consequences of performance measurement systems
An aim of performance reporting systems should be to improve performance. In order to achieve this objective, it is often necessary to consider the behavioural implications of performance reports. Performance reports should be used in the way intended. In practice, however, there may be unintended consequences, particularly when managers receive rewards for good performance.
Performance measurement systems can suffer from several problems that reduce their effectiveness. Berry, Broadbent and Otley (1996) suggested that the use of performance measures may cause the following problems.
Tunnel vision. Tunnel vision means focusing on performance measurement to the exclusion of other aspects of management.
Sub-optimisation. Sub-optimisation occurs when managers focus on achieving good performance in one area, but in doing so overlook other aspects of performance. As a result, overall performance is not as good as it should be. For example, management may be given performance targets for the sales of new products: they may focus on sales growth for new products, and in doing so overlook the need to maintain sales of established products. As a result total sales and profits might fall.
Myopia. Myopia is short-sightedness. In the context of performance measurement, it means concentrating on short-term performance measures to the exclusion of longer-term considerations.
Measure fixation. Measure fixation means taking action to ensure that specific performance targets are reached without considering the possible consequences. For example, a department might have a target for labour costs as a maximum proportion of its total operating costs. In order to meet this target, management might recruit and employ inexperienced and untrained staff who are paid less money than experienced employees. The labour cost target might be met, but the quality of work might deteriorate.
Misrepresentation. Misrepresentation describes the tendency to give a false but flattering picture of performance, by disguising actual results. For example, a sales manager might represent the sales performance for a period in a flattering

Paper P5: Advanced performance management
194 © Emile Woolf Publishing Limited
light – with some growth in sales volume. However, this could be misleading: sales volume growth might have been achieved only as a result of heavy price discounting and a big reduction in gross profit margins.
Misinterpretation. Misinterpretation occurs when performance measures are interpreted in an incorrect or over-simplified way. Management might read something good or something bad in a set of performance figures, when the actual situation is more complex and the results are not so easy to interpret.
Gaming. Gaming occurs when there is a deliberate distortion of a performance measure or a performance target, in order to make actual results subsequently appear much better than they really are. For example, a departmental manager might argue that productivity in the department has been poor, so that a low performance target is set for productivity in the department. If the target is set at a low level, it is relatively easy to achieve, and the department’s performance will therefore appear better than it really is.
Ossification. Performance measurement systems should be flexible, and new performance measures should be introduced as appropriate to replace measures that are no longer appropriate. Ossification refers to an unwillingness that may exist to change any parts of the measurement system, after it has been introduced.
Lack of consistency. Within an organisation, the performance targets set for individuals or groups may be inconsistent with each other. For example, a production manager may be given performance targets relating to keeping costs under control, and a quality control manager may have performance targets for ensuring the quality of completed output. The targets of the production manager and the quality control manager may be inconsistent, if lower costs are achievable by reducing quality.
These problems need to be recognised and understood. It may be difficult to eliminate the problems entirely, but some measures may help to cure the worst of the difficulties.
Staff at all levels should be involved developing and implementing the performance measurement scheme. This may make them more willing to accept the performance measures and work towards the achievement of their targets. Involvement may reduce the problems of tunnel vision and myopia.
Performance measures should be used with flexibility, and should not be relied on exclusively for control. Management should accept that sometimes measured performance is not an accurate portrayal of the true position. For example, short-term profitability may be reduced in order to invest in the longer term. A fall in short term profits should not be regarded as ‘failure’ in these circumstances. Taking a flexible approach to performance measures may reduce the problems of fixation and misrepresentation.
Management should continually review the performance measurement system and the appropriateness of the performance targets and performance measurements that are used. This may help to reduce the problems of ossification and gaming.
Management should also regularly audit the reliability and accuracy of the data that is used to measure performance. Performance reporting is only as good as

Chapter 7: Strategic performance measurement
© Emile Woolf Publishing Limited 195
the data on which it is based. This should help to reduce the effects of measure fixation and misinterpretation.
6.2 Performance rewards
Many organisations have systems for linking the achievement of performance targets with rewards for the successful individual. Rewards may take the form of higher pay (for example, a cash bonus or a higher salary) or promotion. Individuals may also feel rewarded by a sense of personal achievement (and possibly also by a formal recognition of their achievement by senior management). In some cases, there may be systems of ‘punishment’ for poor performance, such as withholding a bonus or even dismissal.
Advantages of reward systems
There are several advantages in having a system of rewards linked to performance:
A well-designed reward scheme should link rewards to performance that supports strategic objectives. This should help the organisation to implement its strategies and achieve its strategic objectives.
Rewards can motivate individuals to achieve their performance targets. They can also help to attract and retain talented individuals.
The payment of rewards for achieving key targets helps to inform managers and employees about what the critical aspects of performance are.
An effective reward system will encourage employees to focus on continuous improvement.
Where rewards involve granting shares or share options in the company, employees who benefit from the rewards may be encouraged to think more about the long-term prospects of their company and its market value.
Reward schemes might help to attract talented employees, and make them want to work for the entity.
6.3 Designing reward schemes: factors to consider
There are several factors to consider and questions to answer when designing a reward scheme.
Should the rewards for performance be based on results (outputs) or on the effort that has been put in? A reward scheme for salesmen, for example, can be based fairly simply on results achieved (volume of sales). It is often much more difficult however to reward administrative staff for results achieved, because the results of their efforts might not be easily quantifiable, or measured against clear targets.
Should rewards be given in a money form (a bonus or higher salary) or in non-monetary form (such as share options)?
Should rewards be explicit or implicit? Explicit rewards are rewards that will definitely be given for meeting performance targets, such as a cash bonus. Implicit rewards are not specific promises, but there is a general understanding that the rewards will be available for good performance. For example, there is

Paper P5: Advanced performance management
196 © Emile Woolf Publishing Limited
often an expectation of promotion or a higher salary for good performance, but these are not explicit promises, only an implicit understanding.
How large should rewards be?
Over what time period should performance be measured before rewards are given?
Should rewards be given for individual performance, or should there be group rewards for team performance?
Should the rewards involve equity participation – giving shares or share options to individuals?
What are the tax implications of different reward schemes? Can a reward scheme be devised that limits the tax liabilities of the employees receiving the rewards, without breaching the tax laws?
6.4 Behavioural problems with reward systems
When individuals are rewarded for performance, some potential behavioural problems might occur.
It is often difficult to measure the performance of individuals, and the performance of groups or teams must be measured instead. When group performance is measured, there may be a problem in the following situations:
Some members of the group or team believe that they have been responsible for the successful performance of the group, whereas other team members have not contributed as much as they should have done. These individuals may be angered if rewards are paid to all members of the team, including the undeserving members.
The reward system provides rewards to some members of a group, but not to others: for example, a departmental manager may be rewarded, but none of the departmental staff.
When performance is rewarded, the individuals affected will be inclined to focus on the measures of performance that set the level of their reward – to the exclusion of all other aspects of performance. This can have unintended consequences.

Chapter 7: Strategic performance measurement
© Emile Woolf Publishing Limited 197
Value management
Value management
Value management tools
7 Value management
The Institute of Value Management website http://www.ivm.org is well worth a visit. It includes several overviews of approaches for individual value enhancement projects.
7.1 Value management
The concept of value is based on the relationship between satisfying needs and expectations and the resources required to achieve them.
Value = Outcome/Cost The aim of Value Management is to reconcile all stakeholders’ views and to achieve the best balance between satisfied needs and resources
Value Management is concerned with improving and sustaining a desirable balance between the wants and needs of stakeholders and the resources needed to satisfy them. Stakeholder value judgements vary, and VM reconciles differing priorities to deliver best value for all stakeholders.
7.2 Value management tools
Value Management uses a combination of concepts and methods to create sustainable value for both organisations and their stakeholders including:
Cost benefit analysis
Objectives hierarchy
Issues generation and analysis
Process Mapping
Risk Analysis
Stakeholder Analysis
SWOT Analysis
Value Analysis

Paper P5: Advanced performance management
198 © Emile Woolf Publishing Limited

© Emile Woolf Publishing Limited 199
Paper P5 Advanced performance management
CH
AP
TER
8
Decentralisation and divisional performance
Contents
1 Divisional performance evaluation
2 Return on Investment (ROI)
3 Residual income (RI)
4 Divisional performance and depreciation
5 Economic Value Added (EVA)

Paper P5: Advanced performance management
200 © Emile Woolf Publishing Limited
Divisional performance evaluation
Decentralisation of authority
Benefits of decentralisation
Disadvantages of decentralisation
Controllable profit and traceable profit
1 Divisional performance evaluation
1.1 Decentralisation of authority
Decentralisation involves the delegation of authority within an organisation. Within a large organisation, authority is delegated to the managers of cost centres, revenue centres, profit centres and investment centres. The term ‘decentralised divisionalised structure’ means an organisation structure in which authority has been delegated to the centre’s manager to decide selling prices, choose suppliers, make output decisions, and so on. A divisionalised structure therefore usually means a structure in which there are investment centres and profit centres.
1.2 Benefits of decentralisation
Decentralisation should provide several benefits for an organisation.
Decision-making should improve, because the divisional managers make the tactical and operational decisions, and top management is free to concentrate on strategy and strategic planning.
Decision-making at a tactical and operational level should improve, because the divisional managers have better ‘local’ knowledge.
Decision-making should improve because decisions will be made faster. Divisional managers can make decisions ‘on the spot’ without referring them to senior management.
Divisions provide useful experience for managers who will one day become top managers in the organisation.
Within a large multinational group, there can be tax advantages in creating a divisional structure, by locating some divisions in countries where tax advantages or subsidies can be obtained.
1.3 Disadvantages of decentralisation
The divisional managers might put the interests of their division before the interests of the organisation as a whole. Taking decisions that benefit a division might have adverse consequences for the organisation as a whole. When this happens, there is a lack of ‘goal congruence’.

Chapter 8: Decentralisation and divisional performance
© Emile Woolf Publishing Limited 201
Top management may lose control over the organisation if they allow decentralisation without accountability. It may be necessary to monitor divisional performance closely. The cost of such a monitoring system might be high. It is difficult to find a satisfactory measure of historical performance for an investment centre that will motivate divisional managers to take the best decisions. For example, measuring divisional performance by Return on Investment (ROI) might encourage managers to make inappropriate long-term investment decisions. Economies of scale might be lost. For example, a company might operate with one finance director. If it divides itself into three investment centres, there might be a need for four finance directors – one at head office and one in each of the investment centres. Similarly there might be a duplication of other systems, such as accounting system and other IT systems.
1.4 Controllable profit and traceable profit
Profit is a key measure of the financial performance of a division. However, in measuring performance, it is desirable to identify:
Costs that are controllable by the manager of the division
Costs that are traceable to the division. These are controllable costs plus other costs directly attributable to the division over which the manager does not have control.
There may also be an allocation of general overheads, such as a share of head office costs. In a divisionalised system, profit centres and investment centres often trade with each other, buying and selling goods and services. These are internal sales, priced at an internal selling price (a ‘transfer price’). Reporting systems should identify external sales of the division and internal sales as two elements of the total revenue of the division.
$
External sales 600,000 Internal sales 150,000 Total sales 750,000 Costs controllable by the divisional manager: Variable costs 230,000 Contribution 420,000 Controllable fixed costs 140,000 Profit attributable to the manager (controllable profit) 280,000 Costs traceable to the division but outside the manager’s control 160,000 Profit traceable to the division 120,000 Share of general overheads 30,000 Net profit 90,000
Notes
Controllable profit is used to assess the manager and is therefore sometimes called the managerial evaluation.
Traceable profit is used to assess the performance of the division and is sometimes called the economic evaluation.

Paper P5: Advanced performance management
202 © Emile Woolf Publishing Limited
The apportionment of general head office costs should be excluded from the analysis of the manager’s performance and the division’s performance.
These profit measures can be used with variance analysis, ratio analysis, return on investment, residual income and non-financial performance measurements to evaluate performance.

Chapter 8: Decentralisation and divisional performance
© Emile Woolf Publishing Limited 203
Return on Investment (ROI)
Measuring ROI
ROI and investment decisions
Advantages and disadvantages of ROI for measuring performance
ROI and incentive schemes
2 Return on Investment (ROI)
Return on investment (ROI) is a measure of the return on capital employed for an investment centre. It is also called the accounting rate of return (ARR).
It is often used as a measure of divisional performance for investment centres because:
the manager of an investment centre is responsible for the profits of the centre and also the assets invested in the centre, and
ROI is a performance measure that relates profit to the size of the investment.
Profit is not a suitable measure of performance for an investment centre. It does not make the manager accountable for his or her use of the net assets employed (the investment in the investment centre).
2.1 Measuring ROI
ROI is the profit of the division as a percentage of capital employed. However, performance measurement systems should use ROI to evaluate the performance of both the manager and the division. Although ROI can be measured in different ways, the recommended measures are as follows:
Managerial evaluation
100% employed capital sDivision'profit leControllab
ROI ×=
Divisional/economic evaluation
100% employed capital sDivision'
profit TraceableROI ×=
Where possible, the capital employed by the division should be analysed into:
capital (assets less liabilities) controllable by the manager, and
capital (assets and liabilities) traceable to the division.
Profit is usually measured as an accounting profit, after deduction of any depreciation charges on non-current assets.
Paper P5: Advanced performance management
204 © Emile Woolf Publishing Limited
2.2 ROI and investment decisions
When an investment centre manager’s performance is evaluated by ROI, the manager will probably be motivated to make investment decisions that increase the division’s ROI, and reject investments that would reduce ROI.
Example A divisional manager is considering an investment in a new item of equipment that would cost $80,000. The estimated life of the equipment is four years and the expected residual value is $0. The estimated profit before depreciation is as follows:
Year $
1 20,000
2 25,000
3 35,000
4 25,000
The asset will be depreciated on a straight-line basis. What would be the ROI on this investment? Would the investment centre manager decide to undertake this investment or not?
Answer
$
Total four-year profits before depreciation 105,000
Depreciation over four years 80,000
Total profit over four years 25,000
Average annual profit 6,250
Average asset carrying value over four years: 80,000+0
2= $40,000
( ) 15.63%100%40,0006,250
ARR investment or ROI =×=
The manager might decide to undertake this investment if the average ROI of the division in less than 15.63%. By undertaking the investment, the average ROI over the next four years should increase, and the measured performance of the division would improve.

Chapter 8: Decentralisation and divisional performance
© Emile Woolf Publishing Limited 205
However, the manager is unlikely to undertake the investment if the average ROI of the investment centre is already higher than 15.63%. This is because over the life of the investment, the average ROI of the investment centre would fall.
The disadvantage of ROI for investment decisions
In practice, ROI (ARR) is an inappropriate basis for making investment decisions. Investment decisions should be based on DCF analysis.
Example The managers of investment centres A and B are considering new investments for their division. The following estimates have been prepared;
Division A Division B
Average investment (controllable investment) $100,000 $100,000
Average annual profit after depreciation $16,000 $11,000
Current controllable ROI of the division 18% 9%
Cost of capital of the company 13% 13%
Division A decision
Using ROI as a basis for the investment decision, Division A would reject their project.
The project ROI is 16%
The current ROI of the division is 18%. Investing in the project would reduce the division’s ROI.
However, the ROI of the project is higher than the company’s cost of capital.
Division B decision
Using ROI as a basis for the investment decision, Division B would invest in their project.
The project ROI is 11%.
The current ROI of the division is 9%. Investing in the project would increase the division’s ROI.
However, the ROI of the project is lower than the company’s cost of capital, and investing would almost certainly be undesirable because it would have a negative NPV.
The decision by Division A whether or not to invest should be based on a DCF evaluation. There is insufficient information to calculate the project NPV. Decisions using ROI are inappropriate because they do not make reference to the company’s cost of capital.

Paper P5: Advanced performance management
206 © Emile Woolf Publishing Limited
2.3 Advantages and disadvantages of ROI for measuring performance
Advantages of using ROI
There are several advantages in using ROI as a measure of the performance of an investment centre.
It relates the profit of the division to the capital employed, and the division manager is responsible for both profit and capital employed.
ROI is a percentage measure and can be used to compare the performance of divisions of different sizes.
It is an easily understood measure of financial performance.
It focuses attention on capital as well as profit, and encourages managers to sell off unused assets and avoid excessive working capital (inventory and receivables).
Disadvantages of using ROI
There are also disadvantages in using ROI as a measure of the performance of an investment centre.
As explained above, investment decisions might be affected by the effect they would have on ROI, and this is inappropriate for making investment decisions.
There are different ways of measuring capital employed. ROI might be based on the net book value (carrying value) of the division at the beginning of the year, or at the end of the year, or the average for the year. Comparison of performance between different organisations is therefore difficult.
When assets are depreciated, ROI will increase each year provided that annual profits are constant. There is a risk from high accounting returns on assets that are fully depreciated or nearly fully depreciated. This is the risk that the division’s manager might not want to get rid of ageing assets, because ROI will fall if new (replacement) assets are purchased.
ROI is an accounting measure of performance. An alternative system of performance measurement, such as a balanced scorecard approach, might be more appropriate.
2.4 ROI and incentive schemes
Some companies reward managers by paying them an annual bonus if they achieve or exceed a specified target. For divisional managers, an annual bonus might be calculated on the basis of ROI, and whether they succeed in achieving a target ROI each year, or improving the ROI of their division each year. If divisional managers are rewarded on the basis of ROI performance, this could lead to ‘wrong’ investment decisions. The following example illustrates this point.
Example XYZ Company has a divisionalised structure. The manager of North Division has

Chapter 8: Decentralisation and divisional performance
© Emile Woolf Publishing Limited 207
the authority to invest in capital projects, but only if the board of directors have given their permission. When permission is given by the board, the divisional manager can then decide whether or not to undertake the investment project. There is an incentive scheme for divisional managers. This scheme provides for annual bonus payments to divisional managers. This cash bonus is paid by reference to the ROI that new investment projects achieve in the first two years. ROI is calculated on the basis of average investment in the project each year. The manager of North Division has been given permission to spend $30 million on an investment, but there are three mutually exclusive ways in which this investment can be made. These have been called Option 1, Option 2 and Option 3. XYZ Company has a cost of capital of 10% which it applies to all investment projects. The cash flows and NPV for each Option would be as follows: Option 1 Option 2 Option 3
Cash flow Present value at
10%
Cash flow Present value at 10%
Cash flow Present value at 10%
Year $000 $000 $000 $000 $000 $000
0 (30,000) (30,000) (30,000) (30,000.0) (30,000) (30,000)
1 8,000 7,272 12,500 11,362.5 15,000 13,635
2 10,000 8,260 12,500 10,325.0 12,000 9,912
3 15,000 11,265 12,500 9,387.5 8,000 6,008
4 12,000 12,000 2,000 1,366
NPV + 4,993 + 1,075.0 + 921
The assets purchased with the $30 million would be depreciated over the life of the project, using the straight-line method, and would have no residual value. Required (a) Calculate the ROI for each Option in each of the first two years of the project. (b) Comment on the effect that the incentive scheme might have on the choice of
Option by the manager of North Division.
Answer
Option 1 Option 2 Option 3
$000 $000 $000
Annual depreciation 7,500 10,000 7,500
Investment, beginning of Year 1 30,000 30,000 30,000
Investment, end of Year 1 22,500 20,000 22,500
Average investment, Year 1 26,250 25,000 26,250
Investment, beginning of Year 2 22,500 20,000 22,500
Investment, end of Year 2 15,000 10,000 15,000
Average investment, Year 2 18,750 15,000 18,750

Paper P5: Advanced performance management
208 © Emile Woolf Publishing Limited
Option 1 Option 2 Option 3
Year 1 $000 $000 $000
Cash profit 8,000 12,500 15,000
Annual depreciation 7,500 10,000 7,500
Net profit 500 2,500 7,500
ROI, Year 1 1.9% 10.0% 28.6%
Year 2
Cash profit 10,000 12,500 12,000
Annual depreciation 7,500 10,000 7,500
Net profit 2,500 2,500 4,500
ROI, Year 2 13.3% 16.7% 24.0%
If the manager wants to maximise his bonus, he will choose the Option that gives the highest ROI in Year 1 and Year 2. His decision will be based on the short-term (years 1 – 2) instead of the longer term (the full life of each project). He will therefore choose Option 3. However, Option 3 has the lowest NPV of the three options, and from the company’s point of view, the preferred option should be Option 1, because this has the highest NPV. This is therefore an example of how the payment of a bonus on the basis of ROI could result in ‘wrong’ investment decisions.

Chapter 8: Decentralisation and divisional performance
© Emile Woolf Publishing Limited 209
Residual income (RI)
Measuring residual income
Imputed interest (notional interest)
Residual income and investment decisions
Advantages and disadvantages of residual income
3 Residual income (RI)
Residual income (RI) is another way of measuring the performance of an investment centre. Residual income = Divisional profit minus Imputed interest charge. Notes
Divisional profit is an accounting measurement of profit, after depreciation charges are subtracted. The interest charge is calculated by applying a cost of capital to the division’s net investment (net assets). The appropriate measure of net investment is the average investment during the period.
3.1 Measuring residual income
Residual income is measured in either of the following ways:
Managerial evaluation
$
Controllable profit A Less notional interest on average controllable investment B Controllable residual income A – B
Divisional/economic evaluation
$
Traceable profit A Less notional interest on average traceable investment B Divisional residual income A – B
3.2 Imputed interest (notional interest)
Residual income is calculated by deducting an amount for imputed interest (also called notional interest) from the accounting profit for the division. Imputed interest (notional interest) is the division’s capital employed, multiplied by:

Paper P5: Advanced performance management
210 © Emile Woolf Publishing Limited
the organisation’s cost of borrowing, or
the weighted average cost of capital of the organisation, or
a special risk-weighted cost of capital to allow for the special business risk characteristics of the division. A higher interest rate would be applied to divisions with higher business risk.
3.3 Residual income and investment decisions
If investment centres are evaluated on the basis of residual income, their managers will be motivated to undertake new investments that increase residual income and to avoid new investments that would reduce residual income. However, the investment decisions will often be different to what the decision would be if ROI is used. Residual income increases if the annual profit exceeds the notional interest charge.
Investments with an average annual profit higher than the cost of capital are undertaken.
Investments with an average annual profit lower than the cost of capital are rejected.
Example The difference between the ROI and residual income can be illustrated by returning to the previous example.
Division A Division B
Average investment (controllable investment) $100,000 $100,000
Average annual profit after depreciation $16,000 $11,000
Current controllable ROI of the division 18% 9%
Cost of capital of the company 13% 13%
Division A decision
Using RI as a basis for the investment decision, Division A would invest in their project, because RI would increase.
Division A
$ Average annual profit after depreciation 16,000 Notional interest (13% × $100,000) 13,000 Increase in average annual RI 3,000
Average annual return on capital from the project (16%) is higher than the company’s cost of capital. This is why the average annual residual income increases. Division B decision
Using RI as a basis for the investment decision, Division B would not invest in their project, because RI would fall.

Chapter 8: Decentralisation and divisional performance
© Emile Woolf Publishing Limited 211
Division B
$
Average annual profit after depreciation 11,000
Notional interest (13% × $100,000) 13,000
Fall in average annual RI (2,000)
Average annual return on capital from the project (11%) is less than the company’s cost of capital. This is why the average annual residual income falls. The decisions by Division A and Division B whether or not to invest should be based on a DCF evaluation. There is insufficient information to calculate the project NPV. However, using residual income for investment decisions is more likely than using ROI to result in a decision that agrees with the decision based on DCF analysis. In the above example, it is almost certain that a DCF analysis would show that the Division B investment has a negative NPV. The decision using DCF would be to reject the investment, and the decision based on RI is consistent with this.
3.4 Advantages and disadvantages of residual income
Advantages of RI
There are several advantages in using RI as a measure of the performance of an investment centre.
It relates the profit of the division to the capital employed, by charging an amount of notional interest on capital employed, and the division manager is responsible for both profit and capital employed.
Divisional managers are made aware, through the charge for imputed interest, that investments have a financing cost.
RI is a flexible measure of performance, because a different cost of capital can be applied to investments with different risk characteristics.
As explained above, measuring performance with RI is more likely to encourage managers to make investment decisions that are consistent with DCF-based investment decisions.
Disadvantages of RI
There are also disadvantages in using RI as a measure of the performance of an investment centre.
RI is an accounting-based measure, and suffers from the same problem as ROI in defining capital employed.
Its main weakness is that it is difficult to compare the performance of different divisions using RI. Larger divisions should earn a bigger RI. A small division making RI of $50,000 might actually perform much better than a much larger division whose RI is $100,000.
RI is not easily understood by management, especially managers with little accounting knowledge.

Paper P5: Advanced performance management
212 © Emile Woolf Publishing Limited
There may be problems in deciding a suitable rate of interest for the imputed interest charge.
Example The performance of a divisional manager is evaluated by RI. The company’s cost of capital is 10%. The manager is considering whether to invest in a project to buy an asset costing $600,000. The asset would have a three-year life and no residual value. Cash flows from the investment would be $500,000 in each year. Required
(a) Calculate the RI for each of the three years of the project, using net book value (NBV) at the start of the year as capital employed.
(b) Calculate the NPV of the project. Assume that cash flows occur at the end of each year.
Answer (a) Residual income
Year 1 Year 2 Year 3
$ $ $
Opening net book value 600,000 400,000 200,000
Annual depreciation 200,000 200,000 200,000
$ $ $
Profit 300,000 300,000 300,000
Notional interest (10%) 60,000 40,000 20,000
Residual income 240,000 260,000 280,000
(b) NPV
Year Cash flow Discount factor at 10% Present value
$ $
0 (600,000) 1.000 (600,000)
1 – 3 500,000 2.487 1,243,500
+ 643,500

Chapter 8: Decentralisation and divisional performance
© Emile Woolf Publishing Limited 213
Divisional performance and depreciation
ROI or RI: the problem with depreciation
Annuity-based depreciation
4 Divisional performance and depreciation
4.1 ROI or RI: the problem with depreciation
If straight-line depreciation is used and capital employed is based on carrying values (net book values) ROI and RI will rise over time if:
annual profits are constant and
assets are not replaced, and existing assets remain in use as they get older.
In the early years of an investment project, the ROI or RI might be very low. If a divisional manager is concerned about the effect that this would have on the division’s ROI or RI for the next year or two, the manager might refuse to invest in the project. This is because performance in the next year or so might be much worse, even though the project might be expected to earn a high return over its full economic life.
Example
Palace Division is a part of the Crystal Group. Its manager has the authority to invest in new capital expenditure, within limits set by head office. The senior management team of the division is considering an investment of $4.2 million. This would have a residual value of zero after four years. Net cash inflows from the investment would be $1.4million for each of the next four years. The cost of capital for the Palace Division is 10%. It is the group’s policy to use straight-line depreciation when measuring divisional profit. For measurement purposes and reporting purposes, ‘capital’ is defined as the opening net book value at the start of each year. Required
For this particular investment:
(a) Calculate residual income each year
(b) Calculate the Return on Investment each year
(c) Calculate the NPV of the investment
(d) State whether the decision would be in the best interests of the company if the manager makes the decision on the basis of the effect of the investment on:
(i) RI or
(ii) ROI.
Ignore taxation.

Paper P5: Advanced performance management
214 © Emile Woolf Publishing Limited
Answer (a) Residual income
Year 1 Year 2 Year 3 Year 4
$000 $000 $000 $000 Opening net book value 4,200 3,150 2,100 1,050 Annual depreciation 1,050 1,050 1,050 1,050 $ $ $ $ Profit before depreciation 1,400 1,400 1,400 1,400 1,050 1,050 1,050 1,050 350 350 350 350 Notional interest (10%) 420 315 210 105 Residual income (70) 35 140 245
The total residual income over the four years is $350,000 (profit of $1,400,000 minus notional interest charges of $1,050,000).
(b) Return on Investment
Capital is defined here as the value of the net assets at the beginning of the year.
Year 1 Year 2 Year 3 Year 4
$000 $000 $000 $000 Opening net book value 4,200 3,150 2,100 1,050 Annual depreciation 1,050 1,050 1,050 1,050 $ $ $ Profit before depreciation 1,400 1,400 1,400 1,400 1,050 1,050 1,050 1,050 Profit 350 350 350 350 Return on investment (ROI) 8.3% 11.1% 16.7% 33.3%
The average return on investment = average annual profit/average investment = $350,000/$2,100,000 = 16.7%.
(c) NPV Year
Cash flow
Discount factor at
10%
Present
value
$ $ 0 Capital expenditure 4,200,000 1.000 4,200,000 1 - 4 Net cash flow 1,400,000 3.170 4,438,000 Net present value + 238,000
(d) Ignoring risk and uncertainty in the forecast cash flows, the decision should be
to undertake the capital investment, because the NPV is positive. In theory, undertaking the project will add to shareholders’ wealth by this amount.
If the management of Palace Division are concerned about the short-term performance of the division, they might decide not to undertake the

Chapter 8: Decentralisation and divisional performance
© Emile Woolf Publishing Limited 215
investment. This is because the ROI will be less than 10% in Year 1 and the residual income would be negative.
However, if the management team takes a longer-term view, and considers performance over the full four years, they would undertake the investment, because the average annual ROI on the new investment would be 16.7% and the average annual increase in residual income for the division would be $87,500.
Unfortunately, decision-making often focuses on the short term, and there is a possibility that the investment will not be undertaken in order to prevent a fall in ROI or residual income.
Conflicts with NPV
This previous example should demonstrate that on occasions there may be a conflict between NPV and ROI/RI. NPV gives the correct decision under the assumption that we want to maximise shareholder wealth. NPV cannot be used to assess historical performance, but ROI and residual income do not always indicate the most appropriate investment decision. This raises the question: Is there any way in which ROI or residual income could be made more consistent with NPV in the assessment of new capital investments?
4.2 Annuity-based depreciation
The problem might sometimes be overcome if annuity-based depreciation is used to measure ROI and RI, instead of straight-line depreciation. However, this approach is only valid if the annual cash flows from an investment project are expected to be a constant amount each year (and are not low in the early years of the investment project). An annual depreciation charge is calculated as follows:
Assume that the investment is purchased using a bank loan at the company’s cost of capital.
Convert this loan into an annuity (constant annual cash flow). To do this, divide the cost by the DCF annuity factor for the number of years of the project.
This annuity or equivalent annual cash flow consists of an interest charge and a loan repayment. The loan repayment element is assumed to be the depreciation charge for the year.
This depreciation charge, which increases each year over the life of the project, is used to calculate the division’s profit for the year.
Annual equivalent cash flow (annuity) = Depreciation + Interest Annuity depreciation = Annual equivalent cash flow – Notional interest on capital employed.

Paper P5: Advanced performance management
216 © Emile Woolf Publishing Limited
Example 1 An investment centre invests $3,170,000 in capital equipment that is expected to have a four-year life. The DCF cost of capital is 10%. The investment centre’s performance is measured by ROI, but annuity depreciation is used for the centre’s capital assets. For the new equipment annual depreciation will be calculated as follows:
The DCF annuity factor for four years at 10% is about 3.170 (from DCF tables).
The annuity cost of the new equipment is therefore $3,170,000/3.170 = $1,000,000.
This annuity cost consists of an interest charge and depreciation.
The depreciation charge is calculated as the difference between the total annuity cost ($1,000,000) and the annual interest, as follows.
Year Opening balance
Interest at 10% Annuity Balance at end of year
$ $ $ $ 1 (3,170,000) (317,000) 1,000,000 (2,487,000) 2 (2,487,000) (248,700) 1,000,000 (1,735,700) 3 (1,735,700) (173,570) 1,000,000 (909,270) 4 (909,270) (90,927) 1,000,000 (197)
The closing balance at the end of the four years should be $0. The $197 arises from rounding errors in the annuity discount factor. The annual depreciation charge is the difference between the annuity cost of $1,000,000 and the interest charge each year. So it is $683,000 in Year 1, rising to $751,300 in Year 2, $816,430 in Year 3 and $909,073 in Year 4.
Example 2 Palace Division is a part of the Crystal Group. Its manager has the authority to invest in new capital expenditure, within limits set by head office. The senior management team of the division is considering an investment of $4.2 million. This would have a residual value of zero after four years. Net cash inflows from the investment would be $1.4million for each of the next four years. The cost of capital for the Palace Division is 10%. It is the group’s policy to use annuity depreciation when measuring divisional profit. For measurement purposes and reporting purposes, ‘capital’ is defined as the opening net book value at the start of each year. The equivalent annual charge or annuity =
Cost of investmentDCF factor for years 1− 4 at 10%
= $4.2 million3.170
= $1, 324, 921 (say, $1,325,000).

Chapter 8: Decentralisation and divisional performance
© Emile Woolf Publishing Limited 217
Residual income
Year 1 Year 2 Year 3 Year 4
$000 $000 $000 $000 Cash flow 1,400 1,400 1,400 1,400 Depreciation + notional interest 1,325 1,325 1,325 1,325 Residual income 75 75 75 75
The residual income is now constant in every year, and a positive value. The investment adds to RI each year. The decision, based on residual income and using annuity depreciation, would be to undertake the investment project. This is consistent with the NPV assessment.
ROI
For an ROI calculation, we must separate the equivalent annual charge into the interest charge and the depreciation element (the balance).
Year
Investment at the start of the year
Interest at 10%
Equivalent annual charge
Depreciation charge (=total annual charge
minus interest)
$ $ $ $ 1 4,200,000 420,000 1,324,921 904,921 2 3,295,079 329,508 1,324,921 995,413 3 2,299,666 229,967 1,324,921 1,094,954 4 1,204,712 120,471 1,324,921 1,204,450 5 0**
** Allowing for rounding errors in the discount factor.
Year 1 Year 2 Year 3 Year 4
$ $ $ $ Cash flow 1,400,000 1,400,000 1,400,000 1,400,000 Depreciation 904,921 995,413 1,094,954 1,204,450 Profit 495,079 404,587 305,046 195,550 Investment 4,200,000 3,295,079 2,299,666 1,204,450 ROI 11.8% 12.3% 13.3% 16.2%
The ROI exceeds the cost of capital (10%) in each year. The decision by the divisional manager, based on ROI, would therefore be to undertake the investment. This decision would be consistent with the NPV assessment. The project, which has a positive NPV, will therefore be accepted under both ROI and RI when depreciation is charged by the annuity method. It is important to recognise, however, that this conclusion is valid only if:
the cash flows in each year of the project are constant (and are not fairly low in the first year or early years of the project), and
the investment does not have any residual value at the end of its life.

Paper P5: Advanced performance management
218 © Emile Woolf Publishing Limited
Economic Value Added (EVA)
Profits and adding value to a business
The potential benefits of EVA
Measuring economic value added (EVA)
Using EVA
Possible problems with EVA
5 Economic Value Added (EVA)
5.1 Profits and adding value to a business
In theory, if a company makes a profit, the value of its shares ought to increase by the amount of the profit (less any dividends paid to shareholders). In practice, this does not happen.
One reason for this is that in order to make a profit, capital is invested. Capital is a resource which has a cost. The actual creation of extra value should therefore be the profit less the cost of capital invested. Residual income is the accounting profit earned by a division less a notional charge for capital employed. In theory, there is a connection between residual income and the expected increase in the value of a business.
Suppose for example that a company has $10 million in cash and keeps it in a bank deposit account earning 2% per year interest. The cash will earn interest of $200,000 less tax in one year, and this will be reported as income. However although keeping money in a low-interest account adds to accounting profit, it does not ’add value’ to the company (or ‘create value’), because the cost of capital needed to finance the cash is probably higher than 2%. The management writer Peter Drucker once wrote that: ‘until a business returns a profit that is greater than its cost of capital, it operates at a loss.’
There is a second – and more important – reason why profits are not a good measure of the expected increase in the value of a business. This is that profit measured by accounting conventions is not a proper measure of ‘real’ economic profit.
It can be argued that if economic profit is measured, instead of accounting profit, we will arrive at a better measurement of the increase in the value of a business during a given period of time.
A management consultancy firm, Stern Stewart, devised a method of measuring economic profit, which they have called economic value added or EVA. The term ‘EVA’ is a trademark of the Stern Stewart organisation.
5.2 The potential benefits of EVA
EVA is a measure of performance that is a close approximation of ‘economic profit’. Economic profit is measured in terms of the addition of economic value. An entity

Chapter 8: Decentralisation and divisional performance
© Emile Woolf Publishing Limited 219
earns an economic profit only if it creates economic value through its activities. By creating economic value, a company should add to the wealth of its owners, the shareholders.
Using EVA to measure performance could therefore have the following benefits:
It measures the creation of value by a company, and is a more ‘accurate’ measurement of performance than accounting profit.
Economic value can be created when expectations of future profitability improve, because economic value can be measured as the net present value of future profits. EVA therefore recognises the benefit of activities, such as new investments, that add to longer-term profitability. Unlike accounting measures of profitability, EVA is not focused exclusively on the short term.
Management is encouraged to focus on the creation of value (EVA), which is in the long-term interest s of shareholders.
Management reward schemes based on EVA are likely to align the interests of management and shareholders more closely than a bonus system linked to annual accounting profits.
It is a simple measure, like profit, and so one that line managers (including those with limited financial understanding) can understand.
5.3 Measuring economic value added (EVA)
Economic value added (EVA) for a financial period is the economic profit after deducting a cost for the value of capital employed.
The formula for EVA is as follows:
EVA = Net operating profit after tax – (Capital employed × Cost of capital)
or
EVA = NOPAT – (Capital employed × WACC).
In practice the computation of EVA involves making adjustments to accounting profit and the accounting value (book value) of assets. These adjustments can be complex, and although you are not required to know them in detail, an examination question may as you to calculate EVA from a given set of simplified data.
NOPAT
The net operating profit after tax is calculated by making adjustments to the accounting profit in order to arrive at an estimate of economic profit. NOPAT is similar to ‘free cash flow’ and is an estimate of economic profit before deducting a cost for the capital employed. The calculation of NOPAT requires a number of different adjustments to the figure for accounting profit.
A few of the problems are as follows:
(1) Interest costs. In calculating NOPAT, interest costs of debt capital should not be deducted from profit. This is because debt capital is included in the capital employed. NOPAT should be the profit before deducting interest costs but after deducting tax. There is tax relief on interest, so to reach a figure for

Paper P5: Advanced performance management
220 © Emile Woolf Publishing Limited
NOPAT the amount of interest charges in the period less relief on the interest cost should be added back to the figure for profit after tax.
NOPAT = Profit after tax + [Interest costs less tax relief on the interest]
(2) Depreciation. Non-cash expenses should not be deducted from profit. The
main item of non-cash expense is usually depreciation of non-current assets. However, there should be a charge for non-current assets, to allow for the economic consumption of value that occurs when the assets are used.
NOPAT = Profit after tax + Post-tax interest cost + [Accounting depreciation – Economic depreciation] If it can be assumed that accounting depreciation charges are similar to the loss of economic value in non-current assets, the two items cancel out, and: NOPAT = Profit after tax + [Interest costs less tax relief on the interest]
(3) Other non-cash expenses. Other non-cash expenses should also be added
back in order to measure NOPAT. These include additional provisions for irrecoverable debts and other provisions.
(4) Investments in intangible items. Investments in intangible items include
spending on promotion activities, investing in a brand name, research and development spending and spending on employee training (to increase the economic value of the work force). In conventional accounting systems, these items of expense are usually written off as expenses in the year that they occur. However, they are items of discretionary spending by management that add to the value of the business.
To measure NOPAT, these items of expense that have been written off in the conventional accounts should be added back.
(They should also be added to the value of the company’s capital. Economic depreciation charges will be applied as appropriate to this economic capital, in subsequent years.)
Charge for capital
EVA is NOPAT minus a charge to represent the cost of capital employed. There are two elements to the capital charge:
the value of the company’s assets, and
the cost of capital.
Capital employed. The valuation of capital employed should be based on economic values of the capital employed. In most cases, this means that non-current assets should be valued close to their current value, rather than at a value based on historical cost.

Chapter 8: Decentralisation and divisional performance
© Emile Woolf Publishing Limited 221
In a simplified system for measuring the economic value of a company’s capital employed, the starting point is the book value of the company’s net assets. This is:
book value of non-current assets at the beginning of the year, plus
book value of net current assets at the beginning of the year.
Some adjustments should then be made for:
Investments in intangibles. Spending on intangible items should be added back in calculating NOPAT, as explained earlier. In addition, the net book value of intangible items should be included in capital employed, and so an estimate of the net book value of the intangibles should be added to the accounting value of the company’s net assets.
Provisions and allowances. Additions during the year to allowances for irrecoverable debts and additions to provisions should be added back to profit in calculating NOPAT. The total amount of allowances for irrecoverable debts, provisions for deferred tax and other provisions should also be added to capital employed.
Off-balance sheet financing and operational leases. Some companies keep items of capital off their balance sheet (statement of financial position). A notable example is assets held on operating leases. The acquisition of leased assets is a form of debt finance, because the lessor (provider of the leased asset) has provided the financing for the assets that the company is leasing. The estimated value of assets held under operating lease agreements (and the value of any other assets financed ‘off balance sheet’) should be added to capital employed.
Cost of capital. The capital charge is calculated by applying the weighted average cost of capital (WACC) to the value of capital employed. WACC is the weighted average of equity capital and debt capital in the company’s target debt structure.
If the current debt structure of the company is close to the long-term target debt structure of the company, the weighted average cost of capital can be calculated from the current value of equity and debt capital.
However if the target capital structure is different from the current capital structure, the weighted average cost of capital is calculated using the target proportions of equity and debt.
The cost of equity and the cost of debt can vary from one year to the next. A new WACC may therefore be calculated each year, with appropriate costs for equity and debt in each year.
Example A company currently has equity capital valued at $800 million and debt capital of $400 million. Its target is to achieve 50% equity and 50% debt in its capital structure. In the current year the cost of equity was 15% and the cost of debt was 10%. The rate of tax is 30%.
The WACC for the purpose of calculating EVA is therefore:
(15% × 50%) + [10% (1 – 0.30) × 50%] = 11%.

Paper P5: Advanced performance management
222 © Emile Woolf Publishing Limited
The following example shows the calculation of EVA, at a level of complexity that you may meet in the examination.
Example A company’s income statement and statement of financial position for the year just ended and the previous year are as follows.
Income statement Year just
ended
Previous year
Year 2 Year 1
$000 $000
Profit before interest and tax 80,000 62,000
Interest cost 8,000 6,000
Profit before tax 72,000 56,000
Tax at 25% 18,000 14,000
Profit after tax 54,000 42,000
Dividends paid 29,000 24,000
Retained profit 25,000 18,000
Notes
1 Capital employed at the beginning of Year 1 was $410 million.
2 The company had non-capitalised leased assets of $18 million in each of the past three years. These assets are not subject to depreciation.
3 The estimated cost of equity in Year 2 was 12% and the cost of debt was 8%. The estimated cost of equity in Year 1 was 10% and the cost of debt was 7%
4 The company’s target capital structure is 50% equity and 50% debt.
5 It should be assumed that accounting depreciation was equal to economic depreciation, in each of the two years, and that this was also the amount used for the calculation of the tax charge in each year. (The purpose of this assumption is to remove the need to make an adjustment to get from accounting depreciation and to economic depreciation, and to remove the need for adjustments to capital employed.)
6 Other non-cash expenses were $16 million in Year 2 and $14 million in Year 1.
Statement of financial position, end of year: Year just
ended
Previous year
Year 2 Year 1
$000 $000
Non-current assets 280,000 265,000
Net current assets 200,000 170,000
480,000 435,000
Shareholders’ funds 370,000 345,000
Long-term and medium-term debt 110,000 90,000
480,000 435,000

Chapter 8: Decentralisation and divisional performance
© Emile Woolf Publishing Limited 223
Required
Use the information provided to calculate a figure for EVA in each of the two years, Year 2 and Year 1.
Answer
Net operating profit after tax Year just
ended
Previous year
Year 2 Year 1
Profit after tax 54,000 42,000
Add: Interest cost less tax: (8,000 less 25%) 6,000 (6,000 less 25%) 4,500
Add: Non-cash expenses 16,000 14,000
NOPAT 76,000 60,500
WACC Year 2: (12% × 50%) + [8% (1 – 0.25) × 50%] = 9%.
Year 1: (10% × 50%) + [7% (1 – 0.25) × 50%] = 7.625%.
These figures suggest that in each year the company created value, because the EVA was positive.
Financial performance in Year 2 was better than in Year 1 because the EVA is higher.
Allowing for the payment of dividends ($29 million in Year 2 and $24 million in Year 1) some of this created value was retained within the company each year.
Capital employed Year just
ended
Previous year
Year 2 Year 1
$000 $000
Book value of total assets less current liabilities 435,000 410,000
Non-capitalised leased assets 18,000 18,000
453,000 428,000
EVA Year just
ended
Previous year
Year 2 Year 1
$000 $000
NOPAT 76,000 60,500
Capital charge: (453,000 × 9%), (428,000 × 7.625%) 40,770 32,635
Economic value added (estimate) 35,230 27,865

Paper P5: Advanced performance management
224 © Emile Woolf Publishing Limited
5.4 Using EVA
If it is measured with reasonable accuracy, EVA should be a measure, in economic terms, of how much extra value or wealth has been created by a business operation during a period. It can therefore be argued that EVA would be a much more useful measure of divisional performance – and company performance – than traditional accounting measures of ROCE and profit. The problem with EVA however is its complexity. To arrive at an estimate of EVA, it is necessary to make many adjustments to accounting values for profit and asset values, and there might be some uncertainty about the reliability of the figure that is calculated as EVA. It might also be questioned whether the extra cost of calculating EVA (compared with ROCE or ROI/residual income) is justified.
Example A company reported the following results in Year 8: $000
Profit before interest and tax 26,000
Interest 6,000
Profit before tax 20,000
Tax at 25% 5,000
Profit after tax 15,000
Dividends paid 7,000
Retained profit 8,000
The profit is after charging $3,000,000 for depreciation. However, it has been estimated that the economic cost of depreciation was $3,500,000. The value of capital employed has been estimated as $120 million and the weighted average cost of capital is 9%. Using this information, make the best estimate possible of economic value added in Year 8.
Answer
$000 $000
Profit after tax 15,000
Add back: Interest 6,000
Less tax relief (25%) (1,500)
4,500
Adjustment for higher cost of economic depreciation (500)
NOPAT 19,000
Capital cost (9% × $120 million) (10,800)
EVA 8,200

Chapter 8: Decentralisation and divisional performance
© Emile Woolf Publishing Limited 225
EVA and measuring the performance of divisions
EVA can be used as an alternative to ROI or residual income as a method of measuring the performance of operating divisions. However, using EVA for performance measurement of operating divisions might make little sense unless the company as a whole also measured its total performance in terms of EVA.
5.5 Possible problems with EVA
There are several potential problems with the use of EVA.
It is not easy to use EVA for inter-firm comparisons or inter-divisional performance comparisons, because it is an absolute measure (in $) rather than a comparative measure (such as a ratio).
The adjustments required to get from accounting profit to NOPAT and from accounting capital employed to economic capital employed can be complex. In particular, it may be very difficult to estimate economic depreciation.

Paper P5: Advanced performance management
226 © Emile Woolf Publishing Limited

© Emile Woolf Publishing Limited 227
Paper P5 Advanced performance management
CH
AP
TER
9
Transfer pricing
Contents
1 Transfer pricing: purpose and objectives
2 The ideal transfer price
3 Finding the ideal transfer price
4 Transfer pricing in practice

Paper P5: Advanced performance management
228 © Emile Woolf Publishing Limited
Transfer pricing: purpose and objectives
Purpose of transfer pricing
Definition of a transfer price
The objectives of transfer pricing
The motivation of divisional managers
Goal congruence
Divisional autonomy
1 Transfer pricing: purpose and objectives
1.1 Purpose of transfer pricing
When a company has a divisionalised structure, some of the divisions might supply goods or services to other divisions in the same company. Similarly, one subsidiary within a group may supply goods or services to another of the group’s subsidiaries.
One division sells the goods or services. This will be referred to as the ‘selling division’.
Another division buys the goods or services. This will be referred to as the ‘buying division’.
For accounting purposes, these internal transfers of goods or services are given a value. Transfers could be recorded at cost. However, when the selling division is a profit centre or investment centre, it will expect to make some profit on the sale.
1.2 Definition of a transfer price
A transfer price is the price at which goods or services are sold by one division within an entity to another division in the same entity. Internal sales are referred to as transfers, so the internal selling and buying price is the transfer price.
1.3 The objectives of transfer pricing
A decision has to be made about what the transfer price should be. For the purpose of performance measurement and performance evaluation in a divisionalised organisation, it is appropriate that:
the selling division should earn some profit or return on sales to other divisions and
the buying division should pay a fair price for the goods or services that it buys from other divisions.
Transfer prices are decided by management. The objectives of transfer pricing should be to:

Chapter 9: Transfer pricing
© Emile Woolf Publishing Limited 229
achieve goal congruence for the entity as a whole, and
give autonomy (freedom to make decisions) to the managers of the profit centres or investment centres.
These two objectives are often in conflict with each other, and unless the transfer prices are set at a suitable level, it might be impossible to achieve both objectives.
1.4 The motivation of divisional managers
An assumption is that the managers of every profit centre will take decisions that maximise the profits of the division. If every division maximises its profits, the profits of the entity as a whole will also be maximised. However, a division might take action that maximises its own profit, but reduces the profits of another division. As a result, the profits of the entity as a whole might also be reduced.
1.5 Goal congruence
Every divisional manager should work towards the maximisation of the profits and returns of the entity as a whole. When every divisional manager has the same aim or goal, there is goal congruence.
Transfer prices should therefore encourage divisional managers to take decisions that are in the best interests of the entity as a whole.
Transfer prices should not encourage a divisional manager to take decisions that are against the interests of the entity as a whole and would reduce the profits of the entity.
Example An entity has two divisions, Division K and Division L. Division K makes a product which it sells as a component to Division L. Division L uses this component to make an end product that it sells to external customers. Division K as estimated that the variable cost to make the component is $5 per unit and with fixed costs of $7 per unit, the total cost per unit is $12. If Division K stopped making the component there would be no savings in fixed costs.
The manager of the division would like to make a profit from making and selling the component to Division L, and thinks that a transfer price of $14 would be reasonable. Similar components are sold in the market for about $15 per unit.
However, the manager of Division L has received an offer from an external supplier who, for a period of six months, would be prepared to sell the same component that is made by Division K at a special price of 11 per unit.

Paper P5: Advanced performance management
230 © Emile Woolf Publishing Limited
In this situation:
The manager of Division L would be attracted by an offer of 11 per unit for buying the component, given a transfer price of $14 from Division K. Given free choice, Division L would accept the offer and buy the component externally.
However this decision would reduce the profits of the company as a whole, because it costs just $5 per unit (the variable cost in Division K) to make the component internally. For each unit bought externally at $11 per unit, profit would therefore be reduced by $6.
In this situation, a transfer price of $14 per unit would not be ‘ideal’ and would encourage sub-optimal decision-making.
1.6 Divisional autonomy
Autonomy is freedom of action and freedom to make decisions. Divisional managers should be free to make their own decisions. Autonomy should improve motivation of divisional managers. For example, when transfer prices have been decided, the managers of all divisions within the entity should be free to decide:
whether to sell their output to other divisions (internal transfers) or whether to sell them to external customers, if an external market exists for the output
whether to buy their goods from another division (internal transfers) or whether to buy them from external suppliers, if an external market exists.
Divisional managers should be allowed to make their own choices. They should not have to be told what to do by senior management at head office. If there is a conflict between the objectives of goal congruence and divisional autonomy, goal congruence should have priority. If divisional managers cannot agree to do what is best for the entity as a whole, they should be instructed about what to do by senior management. However, this situation would be undesirable. Ideally, transfer prices should be set so that divisional managers can agree on selling and buying between each other in a way that is in the best interests of all the divisions and the entity as a whole.

Chapter 9: Transfer pricing
© Emile Woolf Publishing Limited 231
The ideal transfer price
Assumptions
Market-based and cost-based transfer prices
The opportunity cost of transfers
Identifying the ideal transfer price
2 The ideal transfer price
The ideal transfer price is a price that will result in goal congruence and also allow the divisional managers autonomy to make their own decisions, without having to be told by head office what they must do. The main problems arise when there is an external market for the goods (or services) that one division transfers to another. When an external market exists for goods or services that are also transferred internally, the market might be called an external intermediate market.
The selling division can sell its goods into this market, instead of transferring them internally.
Similarly the buying division can buy its goods from other suppliers in this market, instead of buying them internally from another division.
2.1 Assumptions
The following assumptions will be made:
When there is an external intermediate market, divisional managers will decide between internal transfers and using the external market in a way that maximises the profits of their division.
When there is no difference in profitability between internal transfers and selling or buying externally, the divisional managers should agree to transfer the goods internally.
If the performance of the divisions and the divisional managers is based on divisional profitability, it is reasonable to expect that:
- the selling division will earn some profit on internal transfers, and
- the buying division will pay a fair price for internal transfers.
2.2 Market-based and cost-based transfer prices
As a general rule:
when an external intermediate market does not exist for transferred goods, the transfer price will be based on cost
when an external intermediate market does exist for transferred goods, the transfer price will be based on the external market price.

Paper P5: Advanced performance management
232 © Emile Woolf Publishing Limited
However, the situation is more complicated when:
there is a limit to production capacity in the selling division, or
there is a limit to sales demand in the external intermediate market.
In these circumstances, we need to consider the opportunity costs for the selling division of transferring goods internally instead of selling them externally.
2.3 The opportunity cost of transfers
The selling division and the buying division have opportunity costs of transferring goods internally.
For the selling division, the opportunity cost of transferring goods internally to another division might include a loss of contribution and profit from not being able to sell goods externally in the intermediate market.
For the buying division, the opportunity cost of buying internally from another division is the price that it would have to pay for purchasing the items from external suppliers in the intermediate market.
Goal congruence is achieved when the transfer price is at a level where both the selling division and the buying division will want to do what is in the best interests of the entity as a whole, because it is also in the best interests of their divisions. Ideal transfer prices must therefore take opportunity costs into consideration.
2.4 Identifying the ideal transfer price
The following rules should help you to identify the ideal transfer price in any situation:
Step 1. Begin by identifying the plan that maximises the profits of the entity as a whole. In other words, what is the goal congruence that we are trying to achieve?
Step 2. Having identified the plan that is in the best interests of the entity as a whole, identify the transfer price, or range of transfer prices, that will make the manager of the buying division want to work towards this plan. The transfer price must ensure that, given this transfer price, the profits of the division will be maximised by doing what is in the best interests of the entity as a whole.
Step 3. In the same way, having identified the plan that is in the best interests of the entity as a whole, identify the transfer price, or range of transfer prices, that will make the manager of the selling division want to work towards the same plan. Again, the transfer price must ensure that, given the transfer price, the profits of the division will be maximised by doing what is in the best interests of the entity as a whole.
These rules will be illustrated with a number of different examples and different situations.

Chapter 9: Transfer pricing
© Emile Woolf Publishing Limited 233
Finding the ideal transfer price
No external intermediate market
An external intermediate market and no production limitations
An external intermediate market and production limitations
Transfer pricing and more than one limiting factors
3 Finding the ideal transfer price
The ideal transfer price depends on circumstances.
3.1 No external intermediate market
When there is no external intermediate market, the ideal transfer price is at cost or cost plus a contribution margin or profit margin for the selling division.
Example An entity has two divisions, Division A and Division B. Division A makes a component X which is transferred to Division B. Division B uses component X to make end-product Y. Details of costs and selling price are as follows:
Division A $
Cost of component X
Variable cost 10
Fixed cost 8
Total cost 18
Division B
Further processing costs
Variable cost 4
Fixed cost 7
11
Selling price per unit of product Y 40
The further processing costs of Division B do not include the cost of buying component X from Division A. One unit of component X goes into the production of one unit of Product Y. Fixed costs in both divisions will be the same, regardless of the volume of production and sales.

Paper P5: Advanced performance management
234 © Emile Woolf Publishing Limited
Required
What is the ideal transfer price, or what is a range of prices that would be ideal for the transfer price?
Answer Step 1
What is in the best interests of the entity as a whole? The total variable cost of one unit of the end product, product Y, is $14 ($10 + $4). The sales price of product Y is $26. The entity therefore makes additional contribution of $26 for every unit of product Y that it sells. It is in the best interests of the entity to maximise production and sales of product Y. Step 2
What will motivate the buying division to buy as many units of component X as possible? Division B will want to buy more units of component X provided that the division earns additional contribution from every unit of the component that it buys.
Division B $
Selling price of Product Y 40
Variable further processing costs 4
36
The opportunity cost of not buying units of component X, ignoring the transfer price, is $36 per unit. Division B should therefore be willing to pay up to $36 per unit for component X. Step 3
What will motivate the selling division to make and transfer as many units of component X as possible? Division A will want to make and sell more units of component X provided that the division earns additional contribution from every unit of the component that it sells. The marginal cost of making and transferring a unit of component X is $10. Division A should therefore be willing to transfer as many units of component X as it can make (or Division B has the capacity to buy) if the transfer price is at least $10. Ideal transfer price
The ideal transfer price is anywhere in the range $10 to $36.

Chapter 9: Transfer pricing
© Emile Woolf Publishing Limited 235
3.2 An external intermediate market and no production limitations
When there is an external intermediate market for the transferred item, a different situation applies, and if there are no production limitations in the selling division, the ideal transfer price is usually the external market price.
Example An entity has two divisions P and Q. Division P makes a component X which it either transfers to division Q or sells in an external market. The costs of making one unit of component X are:
Component X $
Variable cost 60
Fixed cost 30
Total cost 90
Division Q uses one unit of component X to make one unit of product Y, which it sells for $200 after incurring variable further processing costs of $25 per unit. Required
What is the ideal transfer price or range of transfer prices, if the price of component X in the external intermediate market is:
(a) $140
(b) $58?
Answer Step 1
What is in the best interests of the entity as a whole? The entity will benefit by maximising the total contribution from external sales of component X and product Y. If component X is not transferred by division P to Division Q, Division Q will have to buy units of component X in the external market. Every unit of component X transferred therefore reduces the need to purchase a unit externally. Since the additional contribution from making and selling a unit of product Y is $175 ($200 – $25), a profit-maximising plan is to maximise the sales of division Q, and transfer component X from Division P to Division Q rather than sell component X externally. Step 2
What will motivate the buying division to buy as many units of component X as possible from Division P?
Paper P5: Advanced performance management
236 © Emile Woolf Publishing Limited
Division Q will be prepared to buy component X from Division P as long as it is not more expensive than buying in the external market from another supplier. Division Q will be willing to buy internally if the transfer price is:
(a) not more than $140 when the external market price is $140
(b) not more than $58 when the external market price is $58.
However, the external market price is less than the variable cost of internal manufacture. This suggests that component X should be brought from the external market and not manufactured internally. Step 3
What will motivate the selling division to make and transfer as many units of component X as possible? Division P should be prepared to transfer as many units of component X as possible to Division Q provided that its profit is no less than it would be if it sold component X externally. Units transferred to division Q are lost sales to the external market; therefore there is an opportunity cost of transfer that division P will wish to include in the transfer price.
Component X: market price $140 $
Variable cost 60
Opportunity cost of lost external sale (140 – 60) 80
Total cost = minimum transfer price 140
Component X: market price $58 $
Variable cost 60
Opportunity cost of lost external sale (58 – 60) (2)
Total cost = minimum transfer price 58
Ideal transfer price
The ideal transfer price is the maximum that the buying division is prepared to pay and the minimum that the selling division will want to receive. In both situations, the ideal transfer price is therefore the price in the external intermediate market. When the external market price is $58, Division P is losing contribution by selling component X externally. It would also be cheaper for the entity as a whole to buy the component externally for $58 rather than make internally for a marginal cost of $60. Division P should consider ending its operations to produce component X.

Chapter 9: Transfer pricing
© Emile Woolf Publishing Limited 237
3.3 An external intermediate market and production limitations
When there is an external intermediate market for the transferred item, and the selling division has a limitation on the number of units it can produce, the ideal transfer price should allow for the opportunity cost of the selling division. Every unit transferred means one less external sale.
Example An entity consists of two divisions, Division A and Division B. Division A is working at full capacity on its machines, and can make either Product Y or Product Z, up to its capacity limitation. Both of these products have an external market. The costs and selling prices of Product Y and Product Z are:
Product Y Product Z
$ $
Selling price 15 17
Variable cost of production 10 7
Variable cost of sale 1 2
Contribution per unit 4 8
The variable cost of sale is incurred on external sales of the division’s products. This cost is not incurred for internal sales/transfers from Division A to Division B. To make one unit of Product Y takes exactly the same machine time as one unit of Product Z. Division B buys Product Y, which it uses to make an end product. The profit of the entity will be maximised by making and selling as many units as possible of Division B’s end product. Required
What is the ideal transfer price or range of transfer prices?
Answer Step 1
What is in the best interests of the entity as a whole? This is stated in the example. The entity wants to make and sell as many units of the end product of Division B as follows. It is not clear, however, whether it is better for Division B to buy Product Y externally or to buy internally from Division A. If division A does not make Product Y, it can make and sell Product Z instead. Product Z earns a higher contribution per unit of machine time, the limiting factor in Division A.

Paper P5: Advanced performance management
238 © Emile Woolf Publishing Limited
Step 2
What would motivate the buying division to buy as many units of Product Y as possible from Division A? Division B will be prepared to buy Product Y from Division A as long as it is not more expensive than buying in the external market from another supplier. Division B will be willing to buy Product Y internally if the transfer price is $15 or less. Step 3
What would motivate the selling division to make and transfer as many units of Product Y as possible? The selling division will only be willing to make Product Y instead of Product Z if it earns at least as much contribution as it would from making Z and selling it externally. (In this situation, the division can make as many units of Z as it can make of Y, and Product Z earns a higher contribution).
Product Y $
Variable cost 10
Opportunity cost of lost external sale (17 – 7 – 2) 8
Total cost = minimum transfer price 18
Ideal transfer price/ideal production and selling plan
Division B will not want to pay more than $15 for transfers of Product Y; otherwise it will buy Product Y externally. Division A will want to receive at least $18 for transfers of Product Y; otherwise it will prefer to make and sell Product Z, not Product Y. The ideal solution is for Division B to buy Product Y externally at $15 and for Division A to make and sell Product Z.
Example An entity consists of two divisions, Division A and Division B. Division A is operating at full capacity making Product X, for which there is an external market. The variable cost of making one unit of Product X is $70, and the sale price of Product X in the external market is $100 per unit. Division B needs one unit of Product X to manufacture another product, Product Y. The variable conversion costs and further processing costs in Division B are $29 per unit of Product Y, and one unit of Product Y requires one unit of Product X as a component. The external selling price of Product Y is $140 per unit. An external supplier has offered to sell units of Product Y to Division B for $103 per unit.

Chapter 9: Transfer pricing
© Emile Woolf Publishing Limited 239
Required
(a) Identify the ideal transfer price.
(b) Calculate the contribution per unit for each Division and for the entity as a whole if this transfer price is used.
(c) Suggest with reasons whether this transfer price provides a fair measure of divisional performance.
Answer Step 1 What is in the best interests of the entity as a whole?
For each additional unit of Product Y that division B makes and sells, the additional contribution for the entity is $41 ($140 – $29 – 70). The entity makes more contribution from making and selling Product Y than it makes from selling Product X externally. The production plan that will optimise the profit for the entity as a whole is for Division A to make units of Product X and transfer them to Division B.
Step 2
What would motivate the buying division to buy as many units of Product X as possible from Division A? Division B will not want to pay more to Division A for Product X than the price it has been offered by an external supplier, $103. However, Division B can presumably find another supplier who is willing to offer the current market price of $100, and the maximum price that Division B should pay ought to be $100.
Step 3
What would motivate the selling division to make and transfer as many units of Product X as possible?
Product Y $
Variable cost 70
Opportunity cost of lost external sale (100 – 70) 30
Total cost = minimum transfer price 100
Ideal transfer price
The ideal transfer price is $100 per unit of Product X.
Contribution per unit
Division A
Division B
Entity as a whole
$/unit $/unit $/unit
External sale - 140 140
Internal sale 100 - -
Sales revenue 100 140 140

Paper P5: Advanced performance management
240 © Emile Woolf Publishing Limited
Division A
Division B
Entity as a whole
$/unit $/unit $/unit
Transfer: purchase cost - 100 -
Other variable costs 70 29 99
Total variable costs 70 129 99
Contribution per unit 30 11 41
Comment
The contribution per unit for each division is a fair representation of the economic contribution of each division to the profitability of the entity as a whole. The transfer price will achieve goal congruence and provides an appropriate measurement of divisional performance.
3.4 Transfer pricing and more than one limiting factors
The selling division might have more than one limiting factor that restricts its output capacity. When this happens, it might be necessary to use a linear programming model to identify the shadow price (also called the dual price) of each of the limiting factors. A shadow price is the amount of contribution that will be lost for each reduction of one unit in the available scarce resource. (It is also the extra contribution that could be earned for each extra unit of the scarce resource that is available). For example, suppose that direct labour is a scarce resource. There are only 2,000 hours available each week, and the shadow price of direct labour is $5 per hour. This means that the maximum possible contribution will be reduced by $5 if there are only 1,999 hours available, and will be reduced by $500 if there are only 1,900 hours available each week, and so on. The ideal transfer price should include the shadow prices of any scarce resources used in the transferred product.
Example An entity consists of two divisions, Division A and Division B. Division A can make three products, Product P, Product Q and Product R. Product P and Product Q are sold in an external market. Their variable cost and selling price are:
Product P Product Q
$/unit $/unit
Selling price 20 28
Variable cost 10 16
Contribution 10 12

Chapter 9: Transfer pricing
© Emile Woolf Publishing Limited 241
There is a limited supply of labour and machine time each week in Division A. Labour hours are restricted to 3,000 each week and machine hours are restricted to 1,000 hours each week. Product R does not have an external market. Units of Product R are needed by Division B to go into the manufacture of one of its products. One unit of Product R requires:
one labour hour
two machine hours.
The variable costs of one unit of Product R, including the direct labour cost, is $16 per unit. A linear programming model has been used to calculate that if Division A makes only Product P and Product Q, and does not make any units of Product R, it would make 500 units of P and 500 units of Q each week. Total contribution would be $13,000. The shadow price of labour would be $3 per hour and the shadow price of machine time would be $4 per hour. Required
What should be the transfer price for each unit of Product R?
Answer From the point of view of the entity as a whole, it is only worth making and transferring units of Product R if it is more profitable for Division B to use Product R than for Division A to make and sell Products P and Q. The ideal transfer price should therefore include the shadow price of the labour and machine hours that units of Product R would require.
Transfer price of Product R $/unit
Variable cost of making R in Division A 16
Shadow price of labour (1 hour x $3) 3
Shadow price of machine time (2 hours x $4) 8
Transfer price 27

Paper P5: Advanced performance management
242 © Emile Woolf Publishing Limited
Transfer pricing in practice
Transfer price at market price
Transfer price at full cost plus
Transfer price at variable cost plus or incremental cost plus
Two-part transfer prices
Negotiated transfer prices
Dual pricing
Transfer pricing in multinational groups
4 Transfer pricing in practice
Transfer prices might be decided by head office and imposed on each division. Alternatively, the managers of each division might have the autonomy to negotiate transfer prices with each other. Ideally, the transfer prices that are decided with meet the two objectives of goal congruence and divisional autonomy. In practice, transfer prices might be agreed and expressed in one of the following ways.
4.1 Transfer price at market price
A transfer price might be the external selling/buying price for the item in an external intermediate market. This price is only possible when an external market exists. If the selling division would incur some extra costs if it sold its output externally rather than transferred it internally to another division, the transfer price might be reduced below market price, to allow for the variable costs that would be saved by the selling division.
Advantages of market price as the transfer price
Market price is the ideal transfer price when there is an external market. A transfer price below this amount will make the manager of the selling division want to sell externally, and a price above this amount will make the manager of the buying division want to buy externally. Transferring at market price also encourages efficiency in the supplying division, which must compete with the external competition.
Disadvantages of market price as the transfer price
The current market price is not appropriate as a transfer price when:

Chapter 9: Transfer pricing
© Emile Woolf Publishing Limited 243
the current market price is only temporary, and caused by short-term conditions in the market, or
there is imperfect competition in the external market, and the selling division faces a downward-sloping demand curve when it sells its output into the market. The opportunity cost of transferring output internally is not the market price, because the selling price would have to be reduced in order to sell the extra units.
4.2 Transfer price at full cost plus
A transfer price might be expressed as the full cost of production plus a margin for profit for the selling division. Standard full costs should be used, not actual full costs. This will prevent the selling division from increasing its profit by incurring higher costs per unit. Full cost plus might be suitable when there is no external intermediate market. However, there are disadvantages in using full cost rather than variable cost to decide a transfer price.
The fixed costs of the selling division become variable costs in the transfer price of the buying division. This might lead to decisions by the buying division manager that are against the best interests of the entity as a whole.
The size of the profit margin or mark-up is likely to be arbitrary.
4.3 Transfer price at variable cost plus or incremental cost plus
A transfer price might be expressed as the variable cost of production plus a margin for profit for the selling division. Standard variable costs should be used, not actual variable costs. This will prevent the selling division from increasing its profit by incurring higher variable costs per unit. Variable cost plus might be suitable when there is no external intermediate market. It is probably more suitable in these circumstances than full cost plus, because variable cost is a better measure of opportunity cost. Another type of cost plus transfer price is incremental cost plus. This might be used when making and transferring units results in an increase in total fixed costs (the fixed costs are stepped costs). Incremental cost =
Variable cost + Share of incremental fixed costs + Profit margin

Paper P5: Advanced performance management
244 © Emile Woolf Publishing Limited
4.4 Two-part transfer prices
With two-part transfer prices, the selling division charges the buying division for units transferred in two ways:
a standard variable cost per unit transferred, plus
a fixed charge in each period.
The fixed charge is a lump sum charge at the end of each period. The fixed charge would represent a share of the contribution from selling the end product, which the supplying division has helped to earn. Alternatively, the charge could be seen as a charge to the buying division for a share of the fixed costs of the selling division in the period.
4.5 Negotiated transfer prices
A negotiated transfer price is a price that is negotiated between the managers of the profit centres. The divisional managers are given the autonomy to agree on transfer prices. Negotiation might be a method of identifying the ideal transfer price in situations where an external intermediate market does not exist. An advantage of negotiation is that if the negotiations are honest and fair, the divisions should be willing to trade with each other on the basis of the transfer price they have agreed. Disadvantages of negotiation are as follows:
The divisional managers might be unable to reach agreement. When this happens, management from head office will have to act as judge or arbitrator in the case.
The transfer prices that are negotiated might not be fair, but a reflection of the bargaining strength or bargaining skills of each divisional manager.
4.6 Dual pricing
In some situations, two divisions might be unable to agree a transfer price, because there is no transfer price at which the selling division will want to transfer internally or the buying division will want to buy internally. However, the profits of the entity as a whole would be increased if transfers did occur. These situations are rare. However, when they occur, head office might find a solution to the problem by agreeing to dual transfer prices.
the selling division sells at one transfer price, and
the buying division buys at a lower transfer price.
Chapter 9: Transfer pricing
© Emile Woolf Publishing Limited 245
There are two different transfer prices. The transfer price for the selling division should be high enough to motivate the divisional manager to transfer more units to the buying division. Similarly, the transfer price for the buying division should be low enough to motivate the divisional manager to buy more units from the selling division. In the accounts of the entity, the transferred goods are:
sold by the selling division to head office and
bought by the buying division from head office.
The loss from the dual pricing is a cost for head office, and treated as a head office overhead expense. However, dual pricing can be complicated and confusing.
4.7 Transfer pricing in multinational groups
Multinational companies have subsidiaries in different countries for many reasons. Each subsidiary will be treated as a profit centre or an investment centre within the group. These subsidiaries may trade with each other, exchanging goods and services. When they do, a transfer price must be agreed. The same broad principles already described in this chapter should apply to transfer pricing within multinationals. When deciding a transfer price for transfers between subsidiaries in different countries, the following additional factors may be relevant:
taxation
import duties
currency fluctuations
repatriation of funds
Taxation
The taxation rules in each country, and tax rules relating to the pricing of transfers between group companies, may affect the choice of transfer prices. There may be a transfer price that will minimise the tax cost for the group as a whole, when there are differing rates of tax in the different countries.
A multinational might choose to locate a selling division in a country with a low marginal rate of tax and a buying division in a country with a high marginal rate of tax.
If the transfer price is high, the selling division will make high profits and the buying division will make low profits.
The total tax charge for the group as a whole can be reduced, because the high profits are taxed at a low rate and the high tax rate is applied only to low profits.
However, anti-avoidance legislation exists to prevent companies from using transfer pricing to move profits from subsidiaries in high-tax countries to subsidiaries in low-tax countries.

Paper P5: Advanced performance management
246 © Emile Woolf Publishing Limited
Import duties
A transfer price may be kept low in order to minimise the import duty or tariff payable on transfers to another country. However, there may be anti-avoidance legislation to prevent international companies from using transfer prices to minimise their payments of import duties.
Currency fluctuations
Transfers will be priced in one currency, and this will expose the investment centres to the risk of losses from adverse currency movements. A group should give careful consideration to the currency or currencies for pricing transfers. The problem of currency exposures is particularly severe when the exchange rate between the domestic currencies of the two investment centres is volatile and subject to large movements. Adverse movements in an exchange rate could wipe out an investment centre’s trading profit on transfers.
Repatriation of funds
Decisions about transfer prices may also need to take account of foreign exchange restrictions in the country of one of its investment centres. The aim should be to avoid having surplus funds tied up in a country from which cannot be repatriated.
Example The marginal rate of tax in country A is 30% and the marginal rate of tax in country B is 50%. A multinational company locates a supplying division in country A and the buying division in country B. If the transfer price is made higher, the total tax charge for the group will be reduced by 20% for each $1 of goods transferred. However the taxation authorities in many countries are aware of the possibilities for tax avoidance. The Organisation for Economic and Social Development in 1995 produced guidelines stating that transfers should be at ‘arm’s length’ and the transfer prices used should be prices that would be negotiated between two unrelated parties.

© Emile Woolf Publishing Limited 247
Paper P5 Advanced performance management
CH
AP
TER
10
Japanese business practices and management accounting
techniques
Contents
1 Just-in-time (JIT)
2 Quality management and quality costs
3 Target costing and Kaizen costing

P5: Advanced performance management
248 © Emile Woolf Publishing Limited
Just-in-time (JIT)
JIT production and JIT purchasing
Practical implications of JIT
Eliminating waste
JIT techniques
JIT in service operations
Problems with JIT
Information requirements and JIT
1 Just-in-time (JIT)
JIT originated in Japan in the 1970s. It is based on concepts that have close similarities to continuous improvement (‘kaizen’), lean manufacturing and total quality management (TQM).
1.1 JIT production and JIT purchasing
Just-in-time is a concept that can be applied to both manufacturing and service operations, although it is usually associated with manufacturing. The principle of JIT is that producing items for inventory is wasteful, because inventory adds no value, and holding inventory is therefore an expense for which there is no benefit. If there is no immediate demand for output from any part of the system, the production system should not produce output for holding as inventory. There is no value in achieving higher volumes of output if the extra output goes into inventory that has no immediate use. It follows that in an ideal production system:
there should be no inventory of finished goods: items should be produced just in time to meet customer orders, and not before (just in time production)
there should be no inventories of purchased materials and components: purchases should be delivered by external suppliers just in time for when they are needed in production (just in time purchasing).
JIT has also been called ‘stockless production’ and ‘fast throughput manufacturing’.
‘Just-in-time production is a production system which is driven by demand for finished products, whereby each component on a production line is produced only when needed for the next stage.
Just-in-time purchasing is a purchasing system in which material purchases are contracted so that the receipt and usage of the material, to the maximum extent possible, coincide’ (CIMA Official Terminology, 2005 ed.).

Chapter 10: Japanese business practices
© Emile Woolf Publishing Limited 249
1.2 Practical implications of JIT
It is important that items should be available when required. Finished goods must be available when customers order them, and raw materials and components must be supplied when they are needed for production. In practice, this means that:
Production times must be very fast. If there is no inventory of finished goods, production has to be fast in order to meet new customer orders quickly.
Production must be reliable, and there must be no hold-ups, stoppages or bottlenecks. Poor quality production, leading to rejected items and scrap, is unacceptable.
Deliveries from suppliers must be reliable: suppliers must deliver quickly and purchased materials and components must be of a high quality (so that there will be no scrapped items or rejected items in production).
JIT therefore depends for its success on highly efficient and high-quality production, and efficient and reliable supply arrangements with key suppliers. For successful JIT purchasing, there must be an excellent relationship with key suppliers. Collaborative long-term relationships should be established with major suppliers, and purchasing should not be based on selecting the lowest price offered by competing suppliers. Flexibility in production. The production system must be flexible, so that it can be switched immediately to making products that are ordered by customers, as soon as the order is received. Batch sizes should be small (to avoid inventory), and the ideal batch size is 1. A flexible production system requires a skilled and flexible work force. Lower costs. Another aim of JIT is to reduce costs. Costs can be reduced by:
eliminating waste in production
speeding up production times and
reducing inventory levels to zero.
1.3 Eliminating waste
Waste is any activity that does not add value. In the Toyota car manufacturing system in Japan, where JIT originated, seven causes of waste were identified.
Over-production. Producing items is wasteful if the items go into inventory or are held in production as part-finished work in progress.
Waiting time. Time spent waiting for work is wasteful, and creates inefficiency in both labour and machine usage.
Transport (movement of materials). It costs money and uses up time to move items from one place to another, but moving items adds no value. The layout of the factory floor should therefore be designed in a way that minimises movement of materials from one stage in production to the next.
Waste in the process. Waste in the process results in lost materials.

P5: Advanced performance management
250 © Emile Woolf Publishing Limited
Inventory. As explained already, holding inventory is wasteful. It does not add value but it creates a cost and ties up cash. The aim is to reduce inventory to zero.
Motion. When individuals move from one place to another in their work, they might not be adding value. The aim should be to simplify work procedures by eliminating unnecessary movements by people.
Defective goods are ‘quality waste’.
1.4 JIT techniques
Various techniques and methods are associated with JIT:
Work flow and the layout of the factory floor. The layout of the factory floor should be designed in a way that minimises waste of transportation and waste of motion. One way of doing this is to organise the work around ‘dedicated work cells’. A work cell is a small group of employees with all the equipment and skills necessary to produce a finished item.
Reducing setup time. ‘Setup’ activities are the activities that have to be carried out to get ready for the next job, for example tidying up the work place and cleaning machinery, and getting the materials for the next job. Setup activities do not add value. The aim should therefore be to reduce setup times.
Total productive maintenance. (TPM). The aim of Total Productive Maintenance is to prevent breakdowns in equipment that cause an unscheduled hold-up in production, by improving maintenance systems.
‘Kanban’ systems and visibility in the work place. To improve production flow, and avoid production of items that are not yet wanted, there should be clear signs in the workplace that indicate when more production is required. In a JIT system, ‘kanban’ cards might be used as a signalling system. These are signals – similar to flags – that send messages to other parts of the production system.
For example, a card can be used by one stage in the production process to signal to the previous stage in production that more output is now required. Details of the output required can be written on the card. Kanban cards can therefore be used to authorise a movement of materials within the production system. Without the authorisation, there should be no movement.
1.5 JIT in service operations
JIT can be applied to service operations. In particular, JIT regards queuing as wasteful, because it wastes the time of the individuals waiting in the queue. It might also be expensive to provide a system for holding customers in a queue (such as a system for making people wait in a telephone answering system).
1.6 Problems with JIT
There might be several problems with using JIT in practice.
Zero inventories cannot be achieved in some industries, where customer demand cannot be predicted with certainty and the production cycle is quite

Chapter 10: Japanese business practices
© Emile Woolf Publishing Limited 251
long. In these situations, it is necessary to hold some inventories of finished goods.
It might be difficult to arrange a reliable supply system with key suppliers.
1.7 Information requirements and JIT
In a JIT production and purchasing system, managers have information requirements that are different from those of managers in traditional manufacturing systems. In particular:
When inventory levels are small and insignificant, inventory costs are immaterial. Costing systems such as absorption costing, whose main purpose is to value inventory, are too complex for management information needs.
If inventories are always kept close to zero, they will always have a relatively small value. If inventories are small and of no material value, there is no value in trying to keep continuous accounting records for inventory. The cost of production and sales in any period should be very close to the material purchases, labour costs and other expenses of the organisation. JIT systems may therefore encourage the use of either throughput accounting or backflush accounting.
Managers need information about bottlenecks in production that create delays for just-in-time production.
If employees are ‘empowered’ to take more decisions themselves, the information system must be capable of providing these employees – probably through an online and on-demand information system – with the information they need to take decisions about their work.

P5: Advanced performance management
252 © Emile Woolf Publishing Limited
Quality management and quality costs
The importance of quality
Quality-related costs
Managing quality-related costs
Total Quality Management (TQM)
Continuous improvement (Kaizen)
Quality circles
Potential benefits from TQM
Performance measurement for TQM
TQM and JIT compared
2 Quality management and quality costs
2.1 The importance of quality
Success in business depends on satisfying the needs of customers and meeting the requirements of customers. An essential part of meeting customer needs is to provide the quality that customers require. Quality is therefore an important aspect of product design and marketing. Quality is also important in the control of production processes. Poor quality in production will result in losses due to rejected items and wastage rates, sales returns by customers, repairing products sold to customers (under warranty agreements) and the damaging effect on sales of a loss of reputation. A company or a not-for-profit entity may have a strategic target for quality:
It may adopt a Total Quality Management (TQM) approach and look for continuous improvements in quality. Improvements in quality do not mean higher costs. Improvements can be found that will lower costs by improving efficiency and eliminating waste.
It may have a strategic target for quality. For example, a company might set a target of a maximum of 1% of goods sold to customers being returned as unsatisfactory.
If there is a strategic target for quality, the aim should be to achieve the target for a minimum total of quality-related costs. Even if an entity does not have a specific quality target, it should seek to minimise quality-related costs. In order to do this, quality-related costs should be measured, analysed and controlled.

Chapter 10: Japanese business practices
© Emile Woolf Publishing Limited 253
2.2 Quality-related costs
Quality-related costs can be defined as: ‘the expenditure incurred in defect prevention and appraisal activities and the losses due to internal and external failure of a product or service, through failure to meet agreed specification’. An organisation must incur costs to deal with quality.
It might incur costs to prevent poor quality, or detect poor quality items when they occur.
It might incur costs in correcting the problem when poor quality does occur.
Quality costs can be classified into four categories:
prevention costs
appraisal costs
internal failure costs
external failure costs.
These categories of cost will be explained here in the context of a manufacturing company. However, a similar analysis could be made for service companies and not-for-profit entities.
Prevention costs
Prevention costs are the costs of action to prevent defects (or reduce the number of defects). They are costs incurred to prevent a quality problem from arising.
Quality problems can arise for a variety of reasons:
The initial design of the product and the method of making it may be poor, so that there will be a large number of sub-standard items produced.
The raw materials used to make the product may be poor in quality, and better-quality raw materials may reduce the wastage rate in production.
The work force may be badly trained, and so may make a large number of errors in production.
Faulty output may occur when the production machinery is not in good working order, which may be caused by insufficient maintenance and repair work on the machines.
Prevention costs are the costs incurred in preventing these problems from happening. For example:
designing products and services with in-built quality
designing production processes of a high quality
training employees to do their jobs to a high standard.
carrying out regular maintenance check-ups on production machinery.

P5: Advanced performance management
254 © Emile Woolf Publishing Limited
Appraisal costs
In a production system, the purpose of appraisal is to prevent poor-quality work from leaving the factory. Poor quality output should be identified in the factory, by testing or inspection either during the production process or at the end of the production process. Appraisal costs are the costs of checking the quality of work that has been done. They include inspection and testing costs.
Internal failure costs
Items that are inspected and found to be faulty will be either:
rejected and thrown out, or
re-worked so that it meets the required quality standard.
Internal failure costs are costs incurred when defective production occurs. They include:
the variable cost of items that are scrapped when found to be sub-standard in quality
the incremental cost of re-working items to bring them to the required quality standard
the cost of production time lost due to failures and defects. If a factory is working at full capacity and is unable to keep up with sales demand, this cost would include the contribution lost as a consequence of producing less finished output and so selling less.
External failure costs
External failure costs are costs incurred when the quality problem arises after the goods have been delivered to the customer. They include the costs of:
dealing with customers’ complaints
the costs of carrying out repair work under a guarantee or warranty
transport costs incurred when recovering faulty items from the customer
transport costs incurred in delivering repaired items or replacement items to the customer
the costs of recalling all items from customers in order to correct a design fault
legal costs, when a customer takes the organisation to court
the cost of lost reputation: when an organisation gets a reputation for poor quality, customers will stop buying from it.
It is commonly argued that the biggest quality costs that an entity incurs are its ‘external failure costs’: these are the quality costs incurred after goods have been delivered to the customer. It is impossible, however, to estimate the costs of the sales that are lost because potential new customers choose to use a different

Chapter 10: Japanese business practices
© Emile Woolf Publishing Limited 255
supplier, having learned about the company’s reputation for poor quality or bad service. The aim should be to reduce quality costs. Ideally this can be done by improving product design and production systems. If necessary, more should be invested in identifying quality problems before they leave the factory, for example through improved inspection and testing systems.
2.3 Managing quality-related costs
The traditional view of managing quality costs is that the total of all quality costs should be minimised. An organisation should spend more money on prevention and detection costs, if this reduces internal and external failure costs by a larger amount. On the other hand, there is no reason to spend more on preventing poor quality if the benefits do not justify the extra cost. This traditional view is rejected by supporters of the Total Quality Management (TQM) principle. The TQM view is that it is impossible to identify and measure all quality costs. In particular, it is impossible to measure the costs of lost reputation, which will lead to a decline in sales over time. The aim should therefore always be to work towards zero defects. To achieve zero defects, it will be necessary to spend more money on prevention costs. The TQM approach to quality costs is to ‘get things right the first time’.
Example You are presented with the following list of performance measurements before the implementation of a Total Quality Management Programme (Pre-TQM) and after its implementation (Post-TQM).
Pre-TQM performance Post-TQM performance
% %
Returns by customers due to packaging defects
5 2
Rejections on final inspection 6 4
Losses in production 3 1
Required Calculate how many units must be input to the process to achieve final sales of 1,000 units:
(a) before the TQM programme
(b) after the TQM programme.

P5: Advanced performance management
256 © Emile Woolf Publishing Limited
Answer
Performance
Pre-TQM Post-TQM
units units
Sales 1,000 1,000
Packaging failures 50 20
1,050 1,020
Rejected units 67 43
1,117 1,063
Process losses 35 11
Units to be input 1,152 1,074
The TQM improvements have led to a reduction of about 7% (78/1,152) in the quantity of units that need to be input to produce 1,000 units of output.
2.4 Total Quality Management (TQM)
It is now widely accepted that in order to succeed in business in highly competitive markets, companies must adopt strategies aimed at satisfying the customer. Customer needs can be satisfied to some extent by cutting costs and selling at lower prices. However, strategies to achieve customer satisfaction must also focus on three other critical success factors:
quality
time, and
innovation.
One approach to achieving improvements in these critical success factors is a Total Quality Management programme. Total Quality Management is a philosophy of quality management with its origins in Japan in the 1950s. CIMA Official Terminology (2005 ed.) defines Total Quality Management (TQM) as ‘integrated and comprehensive system of planning and controlling all business functions so that products or services are produced which meet or exceed customer expectations. TQM is a philosophy of business behaviour, embracing principles such as employee involvement, continuous improvement at all levels and customer focus, as well as being a collection of related techniques aimed at improving quality such as full documentation of activities, clear goal‐setting and performance measurement from the customer perspective. It is important to understand that TQM is a philosophy or culture.
For a TQM programme to succeed, it must have the full support of everyone in the organisation, from senior management to lowest-paid employees.
Everyone in the organisation is actively involved in trying to achieve improvements in processes, systems and products. Each individual accepts personal responsibility for his or her own standards of quality.
Employees are encouraged to be involved actively in the TQM process. This is achieved partly through the use of quality circles.

Chapter 10: Japanese business practices
© Emile Woolf Publishing Limited 257
TQM has several different aspects, including:
statistical quality control systems and
a ‘zero defects’ policy – similar to the approach in JIT
continuous improvement
quality circles.
2.5 Continuous improvement (Kaizen)
TQM applies the concept of continuous improvement (or ‘Kaizen’). Kaizen means ‘improvement in small steps’. In a continual improvement programme, the aim is to keep on finding ways of improving performance. It is not important that each new improvement is small. What is important, however, is that improvements should continue all the time, and that everyone should be constantly looking for ways of making improvements. The ISO 9004 international quality standard describes continuous improvement as an eight-step method:
Involve the entire organisation
Initiate quality improvement projects or activities
Investigate possible causes of quality problems
Establish cause-and-effect relationships
Take preventative or corrective action to improve quality
Confirm the improvement
Sustain the gains
Continue the improvement.
Kaizen: quality improvements and cost reductions
Kaizen has two aims. One is to improve quality without adding to cost. The other is to reduce costs without reducing quality. The process of continuous improvement therefore takes place within a framework of quality assurance. Checks are made to ensure that changes do not reduce quality, because reductions in quality create a loss in value. Loss in value reduces customer satisfaction, and this will be damaging to the company in the long term. Kaizen costing, which is a costing system to support Kaizen, is described later.
2.6 Quality circles
Quality circles might be used as a part of a continuous improvement programme. A quality circle is a small group of employees, usually five to eight people, who meet regularly to discuss work-related problems and possible solutions to them. The main focus for discussion is on the quality of processes and work systems. With quality circles, ordinary workers are encouraged to contribute ideas for improvement, and so participate in the continuous improvement programme.

P5: Advanced performance management
258 © Emile Woolf Publishing Limited
Quality circles cannot replace other quality management processes and methods, such as statistical quality control systems. Quality circles are not used in all companies that use TQM. However, a system of continuous improvement (Kaizen) does depend on work by teams of individuals representing different functions and skills. For example, a team might be established consisting of an engineer, an accountant, a person from manufacturing and a person from the buying department. The team members then combine their knowledge and skills to devise methods of achieving improvements in a particular aspect of operations for which they have been given responsibility for improvement.
2.7 Potential benefits from TQM
There are several potential benefits that might be obtained from introducing a TQM approach:
Formally establishing a TQM system will establish the importance of ‘quality’ in a way that all employees and managers should recognise.
The commitment to quality should also establish ‘customer satisfaction’ as a prime business objective.
A successful introduction of a TQM approach should result in continuous improvements in all processes and operations.
However, the successful application of TQM will depend on the provision of relevant and useful quality-related information, and in particular, information about quality-related costs.
2.8 Performance measurement for TQM
A system of TQM and continuous improvement needs the support of an information system that provides relevant information.
Management accounting information can be provided by the Kaizen costing system.
There is extensive use of non-financial performance indicators, such as production setup times, the number of times materials are moved, and the number of units scrapped or wastage levels.
A report in the US (1993) on the use of Kaizen by Japanese manufacturing companies commented: ‘These quantitative, non-financial measures allow employees to monitor their performance and interpret the results of their efforts. With relevant training and frequent reports on the company’s financial health, companies ensure employees understand how their work directly affects the company’s performance.’
2.9 TQM and JIT compared
Many of the concepts applied by total quality management are similar to those in a just-in-time management philosophy.
The aim in both should be to have zero inventory. Raw materials should be delivered from suppliers only when they are needed, and items should be

Chapter 10: Japanese business practices
© Emile Woolf Publishing Limited 259
produced only when they are required for sale to a customer. In practice, this ideal is usually impossible to achieve, and the aim should therefore be to minimise inventory of raw materials and finished goods.
A ‘pull system’ should therefore operate, with items being manufactured only when they are required by customers. This is different from the traditional ‘push’ system of manufacture, when the aim was to maximise the use of production capacity in order to minimise fully absorbed production costs per unit.
The aim should be to create a uniform factory load and continual rate of production, so that the speed of manufacture matches the rate of customer demand.
The key aim should be to provide a level of quality that satisfies customers and meets their needs.
Employees should be encouraged to participate in the TQM/JIT process. Successful implementation of both TQM and JIT requires a flexible work force, capable of switching from one task to another as requirements dictate.
Many JIT manufacturing systems use a factory layout that minimises the need to move materials. Movement of materials does not add value, and should be avoided. This is consistent with the TQM view that movement is waste.
Setup times between jobs should be minimised, because setting up does not add value.
There should be a focus on simplification of products and processes, in order to maximise the utilisation of available resources.

P5: Advanced performance management
260 © Emile Woolf Publishing Limited
Target costing and Kaizen costing
The purpose of target costing
The target costing method
Techniques for achieving the target cost
Kaizen costing
3 Target costing and Kaizen costing
3.1 The purpose of target costing
Target costing is a method of strategic profit management. It is used for new product development.
An idea for a new product is proposed. The features and functions of the product are specified – what it will do, what it should be made of, what it should look like and so on. These features and functions may be altered later in the process.
The company carries out market research to decide what price customers would be willing to pay for the product. It then decides the price that it would like to charge for the new product, in order to win a target share of the market.
The company then decides on the level of profitability that it wants to achieve for the product, in order to make the required return on investment. This target profit margin should reflect the company’s strategic planning objectives.
Having identified a target price and a target profit, the company then establishes a target cost for the product. The target cost is the target selling price minus the target profit margin. This is the cost at which the product must be manufactured and sold in order to achieve the target profits and return at the strategic market price.
The target cost is usually less than the cost that could reasonably be achieved with current manufacturing methods and materials.
Achieving this cost is a target towards which everyone involved in the project then works.
Since there is ‘gap’ between the target cost and the expected cost, the gap must be closed by finding ways of making the product more cheaply – for example, by simplifying the design or using a different material. However, the reductions in cost should be achieved without reducing the quality or value of the product, because if quality is reduced, customers will not pay the target price.
3.2 The target costing method
Target costing is based on the idea that when a new product is developed, a company will have a reasonable idea about:
the price at which it will be able to sell the product, and

Chapter 10: Japanese business practices
© Emile Woolf Publishing Limited 261
the sales volumes that it will be able to achieve for the product over its expected life.
There may also be estimates of the capital investment required, and any incremental fixed costs (such as marketing costs or costs of additional salaried staff).
Taking estimates of sales volumes, capital investment requirements and incremental fixed costs over the life cycle of the product, it should be possible to calculate a target cost. The target cost for the product is the maximum variable cost for the product, that will provide at least the minimum required return on investment.
There will be a gap between the cost at which the product can be made now and the target cost. The aim should be to close the gap, and reduce the cost of making the product to the target cost level. The most effective way of closing the gap is to re-design the product, so that it can be produced at less cost.
The steps in a target costing exercise are therefore as follows:
Decide the type of product required
Decide what the required sales volume should be (and market share)
Decide what price the product must have in order to achieve the target sales volume
Estimate the amount of investment required to develop and market the product
Estimate the required profit, measured as a return on the investment (ROI, NPV or IRR measurements are possible)
Measure the target cost for the product: the target cost per unit of product is estimated total revenue minus target profit, divided by the expected sales volume in unit.
The target cost should be compared with the estimated cost of making the product to the current specification. The current cost of the product is likely to be much higher than the target cost, and the challenge is therefore to reduce costs from the current estimated level to the target cost level. Usually, this will require a re-design of the product, to new (and cheaper) specifications.
The elements in the target costing process are shown in the diagram below.
Target costing
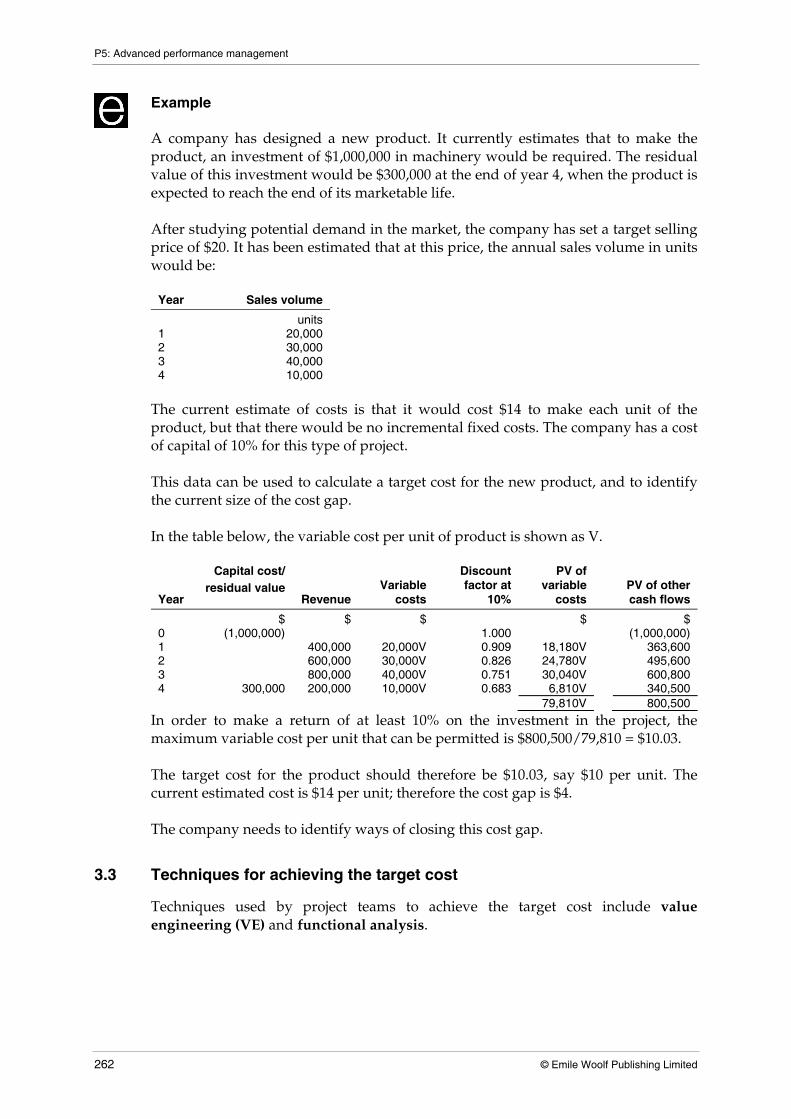
P5: Advanced performance management
262 © Emile Woolf Publishing Limited
Example A company has designed a new product. It currently estimates that to make the product, an investment of $1,000,000 in machinery would be required. The residual value of this investment would be $300,000 at the end of year 4, when the product is expected to reach the end of its marketable life.
After studying potential demand in the market, the company has set a target selling price of $20. It has been estimated that at this price, the annual sales volume in units would be:
Year Sales volume
units 1 20,000 2 30,000 3 40,000 4 10,000
The current estimate of costs is that it would cost $14 to make each unit of the product, but that there would be no incremental fixed costs. The company has a cost of capital of 10% for this type of project. This data can be used to calculate a target cost for the new product, and to identify the current size of the cost gap. In the table below, the variable cost per unit of product is shown as V.
Year
Capital cost/ residual value
Revenue
Variable
costs
Discount factor at
10%
PV of variable
costs
PV of other cash flows
$ $ $ $ $ 0 (1,000,000) 1.000 (1,000,000) 1 400,000 20,000V 0.909 18,180V 363,600 2 600,000 30,000V 0.826 24,780V 495,600 3 800,000 40,000V 0.751 30,040V 600,800 4 300,000 200,000 10,000V 0.683 6,810V 340,500 79,810V 800,500
In order to make a return of at least 10% on the investment in the project, the maximum variable cost per unit that can be permitted is $800,500/79,810 = $10.03. The target cost for the product should therefore be $10.03, say $10 per unit. The current estimated cost is $14 per unit; therefore the cost gap is $4. The company needs to identify ways of closing this cost gap.
3.3 Techniques for achieving the target cost
Techniques used by project teams to achieve the target cost include value engineering (VE) and functional analysis.

Chapter 10: Japanese business practices
© Emile Woolf Publishing Limited 263
Value engineering (VE)
Value engineering is an approach to designing new products in a way that achieves the target amount of value. The target cost is analysed into:
cost elements for each department (such as direct material costs, direct labour costs and depreciation costs), and
functional components (for example, in a motor car functional components include the engine, the transmission system, the braking system, the chassis and so on).
Value engineering then begins with an investigation into the functions of the materials and parts purchased, with a view to either reducing costs or improving the product’s performance and quality. For each material or component, the VE team might ask questions such as:
What is the function of this material or component?
Is it necessary?
Can it be simplified?
Are all the features of the product or component necessary?
Can a standard part or component be used, instead of the part or component that is currently in the product specification. Using standard components will reduce costs, because standard components are purchased in larger quantities at lower costs.
A VE project makes extensive use of cost tables. These provide a detailed analysis of the costs of the product, and help the VE project team to identify the major factors that drive the costs of the product. The team can identify areas of product design where cost reductions of the required magnitude can be made.
The cost tables can be used to provide information about how the costs of the product would be affected by:
using different production resources
using different materials, different manufacturing methods
changing the functions of the product, and
changing the product design.
Functional analysis
Functional analysis looks at each function of a product, with the aim of deciding:
whether the functions performed by the product can be modified
whether the product functions can be reduced
whether the product functions can be increased (increasing the functions of a product may increase the cost of the product, but add to its value to the customer by even more), or
whether two or more functions can be combined.

P5: Advanced performance management
264 © Emile Woolf Publishing Limited
To carry out functional analysis, cost tables are needed. These should provide detailed costs of each product function, so that the implications for cost of altering the product’s functions can be considered.
3.4 Kaizen costing
For companies that practice TQM and continuous improvement methods, Kaizen costing takes over where target costing ends.
Target costing is used in the design and development stage for a new product.
Kaizen costing is applied from the time that a product goes into full production until the end of the product’s life.
Taken together, target costing and Kaizen costing are systems for life cycle costing. The philosophy of continuous improvement (Kaizen) is based on the view that markets are highly competitive and industry must try to keep reducing costs in order to reduce selling prices in order to maintain a competitive advantage. Kaizen costing is a management accounting system that provides cost information to help with achieving improvements without loss of product quality or value. Most of the costs of a product over its entire life cycle are committed during the design and development stage. This is why target costing is a valuable technique for the control of costs (without loss of value). However, there is still some scope for further cost reduction after commercial production and marketing of the product has begun. A Kaizen costing system is therefore a costing system that is designed to help a company to reduce product costs.
A target for cost reductions is set. This target is below the current cost. The cost reduction must be achieved without any loss of value for the customer. For example, a target might be set to reduce unit costs of production by 5% within two years.
Teams are established to identify methods of making improvements.
Kaizen focuses on making small improvements, and it is unlikely that a single improvement will be sufficient to achieve the target cost reductions. Many different improvements might be needed, over a period of time.
Actual costs are continually compared with the target costs, and progress towards achieving the target cost is monitored through regular reporting.
The project teams must continually review production conditions to find ways of making more improvements and more cost reductions.
Normally, teams are rewarded with bonuses if they achieve their cost reduction targets.
When one cost reduction target is met, another cost reduction target takes its place. With Kaizen, the process of seeking improvements never ends.

Chapter 10: Japanese business practices
© Emile Woolf Publishing Limited 265
Techniques for continuous improvement
Teams that are given the responsibility for making improvements might use value analysis (VA) methods. VA is similar to value engineering, except that VA is applied to existing products and VE to products during their design and development stage. The types of questions that might be asked are as follows:
Can common materials and parts be used? The same part might be used in two or more parts of the product, or the same part might be used for several different products that the company manufactures.
How much of the cost consists of purchased materials and components? Can major suppliers be persuaded to reduce their own costs and prices?
Can improvements be made in logistics (distribution) or packaging?
Can the investment in the product (for example, working capital) be reduced?
Can improvements be made in production systems or maintenance methods?
Can the work be organised in a different way?
A system of value analysis must be supported by a management accounting system that provides relevant cost data.
Kaizen costing compared with standard costing
It is useful to compare Kaizen costing with traditional standard costing.
With standard costing, expected costs are established based on current production methods. Variances between actual and standard costs are calculated, and variance reports focus on significant variations between actual costs and the current standard. There is no motivation to make improvements and reduce costs below the existing standard.
With Kaizen costing, actual costs are compared with the target, not an existing standard. The variance reporting system is used to monitor progress towards the target cost.
With standard costing, managers are encouraged to prevent adverse variances. For example, if there is an adverse material price variance, the manager responsible might decide to buy materials at a lower price from a different supplier. The result could be a loss of quality, a fall in value and a reduction in customer satisfaction. With Kaizen costing, reductions in cost must be achieved without any loss of value.
Target costing and Kaizen costing are examples of management techniques that call for a different management accounting system. In particular, project teams need cost tables to assist them with identifying ways in which cost reductions might be achieved and they need information to monitor progress towards targets. A 1993 article on Kaizen and Kaizen costing concluded: ‘In the US, changes in the focus and methods of production need to be accompanied by changes in management accounting systems. The Japanese have provided guidance on how management accounting can play a significant role in creating sustainable competitive advantage for a firm. The more organisations rid themselves of

P5: Advanced performance management
266 © Emile Woolf Publishing Limited
traditional management accounting practices, the better is the chance that the new ideas about manufacturing can take over and really show their worth. Old ways of product costing blunt a firm’s ability to compete effectively and hinder their ability to focus on world-class performance.’

© Emile Woolf Publishing Limited 267
Paper P5 Advanced performance management
CH
AP
TER
11
Role of quality
Contents
1 Quality and quality management
2 Total Quality Management (TQM)
3 Quality management systems and certification
4 Quality in the development of information systems

Paper P5: Advanced performance management
268 © Emile Woolf Publishing Limited
Quality and quality management
Quality
The connection between quality and business strategy
Quality control
Quality assurance
Benchmarking and quality management
1 Quality and quality management
1.1 Quality
Quality has several different meanings.
Quality is often associated with the design or features of a product or service. The quality of similar products might be compared by the raw materials content or the workmanship that has gone into the making of the product. Quality might also be associated with the reliability of a product or superior design.
Product quality is also assessed in relation to price. Better quality helps to enhance the value of a product to customers. Companies try to offer a unique value proposition to customers that will make them want to buy their product and not the products of competitors. Product quality is one of the factors that help to provide value to customers through product differentiation.
Quality is also concerned with quality of processes and operations. High-quality processes deliver products to customers more efficiently and at lower cost. Quality management is concerned largely with quality in systems and processes, rather than quality in the product itself.
Quality in operations could mean producing and delivering goods or services to customers that are free from errors and faults, and that meet their design specifications exactly. In this respect, high quality means avoiding waste and inefficiency.
In more general terms, the quality of operations, processes, systems and products might be defined in terms of providing goods or services that meet the requirements of customers.
The following definitions of quality are all based on the concept of meeting customer needs efficiently and without errors or waste.
’Quality is fitness for use’ (Juran, 1988).
‘Quality means getting everyone to do what they have agreed to do; and to do it right the first time is the skeletal structure of an organisation….’ (Crosby, 1992).
Japanese companies found the old definition of quality ‘the degree of conformance to a standard’ too narrow and introduced a new definition of quality as ‘user satisfaction’.

Chapter 11: Role of quality
© Emile Woolf Publishing Limited 269
Quality is ‘the totality of characteristics of an entity that bear on its ability to satisfy [customers’] stated or implied needs’ (ISO9000 Handbook).
Quality denotes an excellence in goods and services, especially to the degree they conform to requirements and satisfy customers’ (American Society for Quality (ASQ)).
It is useful to be aware of two aspects of quality, conformance quality and perceived quality. Quality management involves managing both types of quality.
Conformance quality means compliance with technical specifications, and ensuring that operations and processes are efficient, eliminating waste, inefficiencies and errors, and so reducing costs.
Perceived quality relates to the expectations of customers about the product, and whether the product succeeds in meeting those expectations.
Reasons for quality failure
When customers are disappointed with the quality of a product or service, the reason for the ‘quality failure’ could be any of the following:
A gap between the product concept and the detailed product specification. There might be a concept for a product, but the detailed design might fail to deliver the concept. The idea might be good, but the detail might fail to match the idea.
A gap between the product design and customer expectations. The product design might succeed in delivering the concept, but the design might nevertheless fail to meet customer needs and expectations.
A gap between the actual product and its design specification. For some reason the actual product that is made fails to meet its design specifications. This might result in a high level of defective and rejected items.
A gap between what the entity promises that the product will do and what it actually does. For example the advertised features of the product or service might not actually exist. Poor quality might therefore arise from false promises.
1.2 The connection between quality and business strategy
Satisfying the needs and expectations of customers is the main factor in all these definitions. Therefore it is essential for a company to identify such needs early in the product/service development cycle. The ability to define accurately customer needs in relation to design, performance, price, safety, delivery, and other business activities and processes give a company a competitive advantage through quality.
The importance of quality in gaining a sustainable competitive advantage, and the importance of quality for business strategy, varies with conditions in the industry and market. It is probably more important in some industries and markets than in others.
Attention to quality and quality management has been a key factor in the great success of Japanese manufacturing companies in the markets for cars, motor cycles and many electrical and electronic domestic appliances.

Paper P5: Advanced performance management
270 © Emile Woolf Publishing Limited
However, there is always the possibility that competitors will copy quality initiatives, and unless quality is improved continually, a competitive advantage through better quality might be difficult to sustain.
1.3 Quality control
Quality control is a method of managing the quality of products, services, systems and processes. The purpose of quality control is to ensure that actual quality conforms to a target or standard level of quality, by:
measuring actual quality and comparing this with the target or standard
reporting quality performance to the managers responsible
requiring managers to take corrective measures when actual quality fails to meet the target or standard.
Quality can be measured in a variety of ways, including the number of items rejected in a manufacturing process on inspection/testing, or the number of customer complaints.
Quality control is concerned with maintaining quality at a target or standard level, rather than improving quality standards. It usually involves:
procedures for checking and inspecting bought-in materials and components, and output from production processes, and
some form of statistical quality control.
Measuring quality
Typically, measures of quality performance should relate to the key performance objectives of quality, speed, dependability, flexibility and cost. Several quality performance measures that might be used are listed below.
Performance objective Performance measure Quality Percentage rate of defective items The average number of fault or defects per unit
produced The number of customer complaints Customer satisfaction ratings The number or cost of warranty claims The average time between failures or
breakdowns in a process Speed Lead time for processing orders Throughput cycle time (production cycle time) Actual throughput time compared with budgeted
throughput time Dependability Percentage of customer orders met from
inventory Percentage of items delivered late Flexibility Range of products New product development time

Chapter 11: Role of quality
© Emile Woolf Publishing Limited 271
Cost Actual cost versus expected cost Cost per operating hour/per machine hour Labour productivity Added value
Statistical process control (SPC)
Statistical process control (SPC) is a system of monitoring the quality of an entire process. This may be the process of manufacturing a product and delivering it to the customer. It may be the process of delivering a service to a customer.
Quality standards might be measured and tested at various stages in the process, through inspection of a sample of items.
Quality standards can also be monitored over time, through statistical quality control charts. The quality in a system might be judged ‘out of control’ when the quality of the process is consistently below standard or falls outside acceptable variation limits (control limits).
1.4 Quality assurance
Quality control is concerned with measuring quality and comparing actual quality with the target or standard quality level. Quality assurance is concerned with:
defining quality objectives, and
ensuring that systems and processes are in place to ensure that these objectives are achieved.
Quality assurance includes quality control processes, but is much broader in scope than quality control. It is a planned and systematic approach to ensuring that all the necessary procedures are implemented and the actions are taken to be confident that the product or service fulfils customers' expectations. A quality assurance system should therefore provide reasonable assurance that a product or service is problem-free and performs the task or purpose that it was designed for. Quality assurance involves the overall surveillance of everything to do with quality throughout an organisation. It is a method of guaranteeing a standard of quality. Standard procedures and processes are established, together with quality standards. Quality assurance then involves procedures for confirming and checking that all the standard procedures and processes have been performed correctly, and that appropriate tests have also been carried out. The following definitions of quality assurance might be useful:
Quality assurance is ‘all those planned or systematic actions necessary to provide adequate confidence that a product or service is of the type and quality needed and expected by the customer.’ (However, quality assurance applies to all internal systems and processes, such as project development and process redesign.)
Quality assurance means ‘providing confidence that requirements will be met’.

Paper P5: Advanced performance management
272 © Emile Woolf Publishing Limited
1.5 Benchmarking and quality management
Benchmarking has been explained in an earlier chapter, in the context of competitive analysis. It is also relevant to quality management, since quality provides competitive advantage. Benchmarking is a method of comparing the operational performance of a company with other companies, often competitors, that are considered the ‘best in class’. Benchmarking is said to have originated with the Xerox Corporation in the US in 1982. The company was a manufacturer of photocopiers. It was in serious difficulties, operating with a costly and inefficient bureaucratic management structure and losing market share to competitors. A multi-functional project team was set up to look into the nature of the company’s problems. This team: identified quality standards that were important in areas such as order fulfilment, distribution, production costs, retail selling prices and product features, and ranked the company’s performance in each of these areas against those of its main competitors. The exercise revealed that Xerox was seriously under-performing in comparison with its competitors. The company then tried to apply what it had learned from the benchmarking process and identify areas for improvement. As a result of this initiative, costs were reduced dramatically, customer satisfaction improved and Xerox again became a major competitor in its market. There are different types of benchmarking.
Internal benchmarking. Internal benchmarking involves a comparison of performance in key area in one part of an organisation with the performance in one or more other parts of the same organisation. This might be useful, for example, when:
− an organisation consists of several different regional or area operations, and some regions appear to perform better than others
− one company takes over another, and the practices in each company are compared to decide which are better.
Competitive benchmarking. Competitive benchmarking involves a comparison of performance in key areas with the performance of the most successful competitors. A problem with competitive benchmarking is that it can be difficult to obtain much information about competitor performance and standards. Competitors’ products can be analysed for design features, but superior processes can be the cause of superior performance, and these are difficult to study in detail.
Process benchmarking (activity benchmarking). This involves identifying and making comparisons of similar processes, activities, products or services in other organisations in a different industry. The aim of this type of benchmarking is to identify best practice anywhere, and look at organisations that have acquired a

Chapter 11: Role of quality
© Emile Woolf Publishing Limited 273
reputation for excellence in particular areas of operation, such as fleet management or customer order handling.
An example in the past of process benchmarking is the collaboration between Xerox and Bean, a catalogue retailer specialising in outdoor clothing. After a wide-ranging search, Xerox identified Bean as an outstanding leader in its industry in order fulfilment and processing activities, and obtained the agreement of Bean to collaborate in a benchmarking exercise. Xerox managers visited Bean to learn about its warehousing and order fulfilment processes, and as a result, Xerox was able to improve order picking in its own warehouse.

Paper P5: Advanced performance management
274 © Emile Woolf Publishing Limited
Total Quality Management (TQM)
The nature and origins of Total Quality Management
Quality management and the views of W Edwards Deming
Quality management and the views of Juran
Quality management and the views of Crosby
Summary of the main features of TQM
2 Total Quality Management (TQM)
2.1 The nature and origins of Total Quality Management
Total Quality Management (TQM) is an approach to improving quality in processes and products that originated in Japan in the 1950s. Manufacturing methods and quality management are credited with giving Japanese manufacturers the leading position in many global industries that many of them still enjoy today.
TQM is ‘an effective system for integrating the quality development, quality maintenance and quality improvement efforts of various groups in an organisation so as to enable production and service at the most economical levels which allow for full customer satisfaction’ (Feigenbaum).
TQM is ‘the continuous improvement in quality, productivity and effectiveness obtained by establishing management responsibility for processes as well as outputs. In this every process has an identified process owner and every person in an entity operates within a process and contributes to its improvement’ (CIMA).
Many of the concepts of TQM are applicable to all business entities. Some of these concepts are explained below, by describing the views of some of the management ‘theorists’ who helped to develop TQM.
2.2 Quality management and the views of W Edwards Deming
Deming (1900 – 1993) introduced concepts of quality management into Japanese manufacturing in the 1950s. Much of his work was based on the introduction of statistical quality measurement and statistical quality control. He is also associated with the concept that companies should seek continuous improvement in their processes and methods of working. Continuous improvement (‘kaizen’) is a key aspect of Total Quality Management. Deming is perhaps most well known for his fourteen points for achieving quality.
1 Constancy of purpose. An entity should establish a constant purpose of achieving continual improvements in systems and processes. The long-term purpose of improving quality should have priority over short-term profit requirements.

Chapter 11: Role of quality
© Emile Woolf Publishing Limited 275
2 A new philosophy. Companies outside Japan should adopt the new philosophy of quality that Japanese manufacturers apply. Delays, mistakes and defects in materials and workmanship that some companies consider ‘acceptable’ should not be tolerated.
3 Cease dependence on mass inspection to achieve quality. Quality should be built into products and processes in the first place, so that defects do not happen. It is inappropriate to rely on quality checks and inspections to achieve target standards of output quality.
4 End lowest tender contracts. Companies should not always buy from the supplier who quotes the lowest prices. The quality of supplied items is important, and the purchasing decision should be based on factors other than cost.
5 Improve every process. Every process should be improved. There should be a continual search for ways of introducing further improvements into processes. Improvements should never end.
6 Institute training on the job. On-the-job training should be used to improve the skills levels of employees.
7 Institute leadership. Managers should provide leadership that helps everyone to do their job better. Managements should be responsible for quality, not just larger volumes of output.
8 Drive out fear. Two-way communications between manager s and employees should be developed, so that communications are open and honest. This mans driving out the fear of blame for making mistakes.
9 Break down barriers. The barriers between different functions and departments within the entity should be removed. Individuals in different functions and departments should learn to co-operate with each other, working in teams where necessary to deal with problems that arise.
10 Eliminate exhortations. Management should eliminate the use of slogans that urge individuals to do better. Slogans such as ‘Avoid waste!’ or ‘Keep on doing better!’ are more likely to arouse hostility than obedience.
11 Eliminate arbitrary numerical targets. Quantifiable targets should not be used of they are arbitrary. (Deming was a supporter of the concept of statistical quality control, but this does not require arbitrary quality standards: quality standards can be set objectively through statistical methods.)
12 Permit pride of workmanship. Employees should be given the opportunity to take pride in their quality performance. This could mean avoiding reward systems that reward employees for ‘good performance’, because ‘good performance’ usually means a high volume of production or sales rather than better quality.
13 Encourage education. Employees should be encouraged to improve their education, because the knowledge built up within an entity is a way of achieving competitive advantage.
14 Top management commitment and action. The success of quality management initiatives depends on the total support and commitment of top management.
Deming’s views can be applied to business strategy development, where quality is considered an important strategic objective. Deming would have argued that in order to achieve continuous quality improvements, it is essential to remain committed to the objective of better quality, even if this means some loss of profits and benefits in the short term.

Paper P5: Advanced performance management
276 © Emile Woolf Publishing Limited
2.3 Quality management and the views of Juran
Juran is another quality management ‘theorist’ whose ideas originated in the 1950s. He argued that improvements in quality must be planning, and quality planning is a crucial aspect of successful business management. A system of quality management should have the following elements.
Identify the needs of customers.
Establish optimal quality objectives that will meet these customer needs.
Establish measurements for quality, so that quality can be planned and monitored.
Plan processes that are capable of meeting the quality objectives under normal operating conditions.
Continually plan for further improvements in quality.
Juran developed a ‘quality road map’, which is a way to achieving better quality through planning.
Having identified customer needs, develop a product that meets those needs.
Optimise the features of the product so that the needs of the company are met as well as the needs of customers.
Develop a process for making the product.
Optimise the process.
Prove that the process sis capable of making the product to the required quality standard under normal operating conditions.
Make the process operational.
2.4 Quality management and the views of Crosby
Crosby (1926 – 2001) developed ideas on quality management during the 1950s, when he worked on the Pershing missile project in the US. He found that it was normal practice in industry to consider that a certain level of errors or defects in quality was acceptable. He argued that if management are willing to work with ‘acceptable quality levels’ that allows for defects, they will get the defects that they plan for. Defects can accumulate throughout the production process. As a result, tolerating a low level of defects at each stage In the production process could mean that the end product contains an unacceptably high defect level. For example if a product contains 100 components and an acceptable level of 1% defects is tolerated for each component, Crosby argued that only 36.5% of finished products would be free from defects. He therefore argued that the objective in all processes should be ‘zero defects’. There should be a continual search for improvements in processes and methods that reduce defect levels and make progress towards the ideal ‘zero defect’ quality standard.

Chapter 11: Role of quality
© Emile Woolf Publishing Limited 277
Crosby specified ‘Four Absolutes of Quality Management’.
Quality means ‘conformance to requirements’. This is not the same as ‘being good’.
Quality is achieved through preventing defects in processes and products, not through inspection to find defects.
The performance standard for quality should be zero defects.
Quality should be measured by the price of non-conformance (which is the cost of failing to achieve a zero defects standard).
2.5 Summary of the main features of TQM
The main features of TQM can be summarised as follows:
The aim should be to meet the needs and expectations of customers. Quality should be defined as meeting the needs and expectations of customers.
TQM should be applied to every process within the organisation.
TQM is achieved by involving all employees. This requires a culture of quality within the entity. Every employee contributes to one or more processes, and so has an effect on quality. It is the responsibility of every employee to get quality right. They will accept this responsibility, but only if they are empowered to make some decisions themselves, about how they organise and perform their work. The concept of empowerment of employees is closely associated with TQM.
All costs relating to quality should be measured and controlled.
In the long term it costs less to prevent defects than to discover defects after they have occurred. The costs of putting errors right (for example, dealing with customer complaints) can be very costly, especially over the long term. Customer perceptions of the quality of a company’s products or services could have a long-term strategic impact.
The aim should be to avoid mistakes, and ‘get things right the first time’.
Systems for improving quality (quality assurance) should be established. These include systems for planning quality, setting objective quality standards and quality control systems.
There should be a search for continual improvement. The ISO 9004 quality standard describes continuous improvement as an eight-step method:
1. Involve the entire organisation
2. Initiate quality improvement projects or activities
3. Investigate possible causes of quality problems
4. Establish cause-and-effect relationships
5. Take preventative or corrective action to improve quality
6. Confirm the improvement
7. Sustain the gains
8. Continue the improvement.

Paper P5: Advanced performance management
278 © Emile Woolf Publishing Limited
It is not important that each successive improvement is usually small. The key to success with continuous improvement is that it should happen all the time. There should always be a momentum for change and improvement.
Quality chains
The TQM approach recognises the importance of quality chains. The concept of a quality chain is similar to the idea of the supply chain or a value chain. Within a total operation, there are many inter-linking smaller operations. For each of these small operations within the total operation, there is an internal supplier and an internal customer. Quality can only be achieved if every internal supplier within the quality chain meets the needs and expectations of its internal customer. The strength of the total quality chain throughout an operation is only as strong as its weakest link. It only takes one person in the chain to produce work which is below the quality required for the whole chain to be broken. For example in a top-class restaurant customers expect a high quality mean with high quality service. Workers in the kitchen are internal suppliers for the head chef, who acts as internal supplier for the waiters. The quality of the end-product to the customer depends on this entire quality chain, and a weakness in any part of the chain will affect the customer’s perception of value received.

Chapter 11: Role of quality
© Emile Woolf Publishing Limited 279
Quality management systems and certification
Quality standards
ISO9000 quality standards
ISO9000 and the eight principles of quality management
ISO9000 and certification
Benefits of ISO9000 compliance
3 Quality management systems and certification
3.1 Quality standards
Total Quality Management is a philosophy of management. It includes statistical quality measurement and control, but it does not provide a specific statement of what an entity should do to achieve an acceptable quality standard in its processes and products or services. The recognition of quality as an important factor in business planning and performance has led to the development of specific quality management standards. Companies and other entities might establish their own quality standards. However, external quality standards have been developed for a wide range of business activities, including:
quality standards in specific industries or products, and
more general quality standards for management
3.2 ISO9000 quality standards
External quality standards were developed in the UK by the British Standards Institute, now called the BSI Group. There are also some organisations in the EU that establish external standards. Standards produced by the BSI influenced the development of international quality standards by the International Organisation for Standardisation (ISO) which is based in Switzerland. Like the BSI, ISO has a range of quality standards for specific industries and products, but also has a series of standards for quality management. This is called the ISO9000 series, or sometimes the ISO9000:2000 series, because the standards were revised in 2000. The ISO9000 series includes:
ISO9000:2000 ‘Quality management systems: fundamentals and vocabulary’. This provides definitions for the terms used in the ISO9000 series.

Paper P5: Advanced performance management
280 © Emile Woolf Publishing Limited
ISO9001:2000 ‘Quality management system – requirements’. This specifies the requirements that must be met by an entity wishing to meet the ISO9000 quality standards and obtain certification for having done so.
ISO9004:2000 ‘Quality management systems – guidelines for performance improvements’. As the title indicates, this provides guidelines on how an entity can continue to improve its quality management system.
The purpose of the ISO9000 series
The International Organisation for Standardisation has stated that the ISO9000 series is concerned with quality management, and what an entity should do to:
meet the quality requirements of its customers
meet applicable regulatory requirements for quality, and at the same time
enhance customer satisfaction, and
achieve continued improvement in performance in pursuit of these quality objectives.
The ISO9000 series specifies the requirements for a generic management system, and the same standards can be applied to all types of entity, large and small, business and non-business.
Definition of a quality management system
A management system is defined as the organisation structure for managing processes and activities. A quality management system is a management system that produces consistent standards of quality. The approach set out in the ISO9000 series specifies what management must do to:
specify the quality that is to be achieved
achieve the quality specified
prove that this quality standard has been achieved in practice.
‘Quality management’ refers to what the entity does to ensure that its products or services satisfy the customer's quality requirements and comply with any regulations applicable to those products or services. It concerns processes and systems, and not products. ISO9000 is not a product quality standard. The management system standards in ISO 9000 state requirements for what the organisation must do to manage processes influencing quality.
3.3 ISO9000 and the eight principles of quality management
The ISO9000 series is based on eight quality management principles.
Customer focus. Entities depend on their customers. They should therefore understand the current and future needs of their customers, and should meet these requirements and should try to exceed customer expectations. The benefits of meeting this requirement are:
- more sales revenue and a bigger market share achieved through flexible responses to market opportunities

Chapter 11: Role of quality
© Emile Woolf Publishing Limited 281
- increased effectiveness in using the resources of the entity to increase customer satisfaction
- improved customer loyalty, leading to repeat business in the future.
Leadership. The leaders of an entity provide purpose and a sense of direction. Leaders should create and maintain an ‘internal environment’ in which individuals can become fully involved in achieving the entity’s objectives. The benefits of meeting this requirement are:
- motivating individuals towards the entity’s goals and objectives
- improved communications between different levels of the organisation structure.
Involvement of people. Individuals at all levels within the organisation are the ‘essence’ of the organisation. Getting them fully involved will enable the entity to make the best use of their abilities. The benefits of meeting this requirement are:
- a motivated and committed work force
- the encouragement of innovation and creativity
- individuals willing to be accountable for their own performance
- individuals wanting to participate and find ways of achieving continual improvement.
Process approach. A desired result is achieved more efficiently when activities and related resources are managed as a process. The benefits of meeting this requirement are:
- lower costs and shorter cycle times through the more efficient use of resources
- improved and consistent results
- an ability to focus on and prioritise opportunities for improvement.
System approach to management. Interrelated processes should be identified, understood and managed as an integrated system. This will improve the efficiency and effectiveness of the entity in achieving its objectives.
Continual improvement. Continual improvement in performance should be a permanent objective of the entity.
Factual approach to decision-making. Effective decisions are based on the analysis of data and information – facts, not opinions or guesswork. The key benefits are (1) informed decision-making, (2) an ability to question the rationale for decisions and (3) change opinions and decisions if appropriate.
Mutually beneficial supplier relationships. An entity and its suppliers are interdependent. A mutually beneficial relationship helps both to create value. The benefits of meeting this requirement are:
- a better ability to improve value in the supply chain
- more flexibility and speed of joint response to changing markets and customer needs and expectations
- better uses of resources and lower costs.

Paper P5: Advanced performance management
282 © Emile Woolf Publishing Limited
3.4 ISO9000 and certification
The ISO9000 quality management standards are voluntary standards. However, entities may apply for ISO9000 certification if they believe that they comply with the ISO9000 standards. Certification means obtaining a certificate of compliance from an external auditing/inspecting body. An independent, external body (recognised by ISO) audits the entity’s quality management system and verifies that it conforms to the requirements specified in the standard. The auditing body then records the certification in its client register. The entity’s management system is therefore both certified and registered.
3.5 Benefits of ISO9000 compliance
If an entity complies with the requirements of ISO9000, it will benefit from a high standard of quality management. Many of the benefits are set out in the eight principles of quality management. In addition, if an entity is certified under ISO9000, this provides independent ‘evidence’ that the entity has an excellent system of quality management, and so is in control of its processes and is focussed on customer satisfaction. This can have marketing benefits. Some large companies and governments insist that their suppliers should have ISO9000 certification. This provides a specific commercial reason for achieving – and maintaining – ISO9000 certification.

Chapter 11: Role of quality
© Emile Woolf Publishing Limited 283
Quality in the development of information systems
Why good quality software is important for IS systems
The quality triangle for new information systems
Software quality assurance
Quality assurance and quality control in IS/IT system development
The V life cycle model
Advantages of using the V life cycle model
The Capability Maturity Model
4 Quality in the development of information systems
4.1 Why good quality software is important for IS systems
The term ‘IS/IT system’ is used to mean an information system that is provided through a computer system or computer network. IS/IT systems can be extremely important for business strategy.
Important new strategic developments might depend on the development and implementation of a major new IS/IT system.
IS/IT systems can deliver significant added value, through greater efficiency and lower costs, of improved service standards (such as speed and reliability).
Successful IS/IT systems can give an entity a sustainable competitive advantage over competitors, when the IS/IT system is developed internally as a ’bespoke’ or ‘tailor-made’ system. It might take competitors a long time, and cost them a lot of money, to copy a rival’s bespoke system.
Developing a major new IS/IT system can expose an entity to considerable risk, in the event that the new system development goes wrong. A new system might be implemented late or might cost more than expected. More significantly, a new system might fail to do what it was designed for. Instead of providing competitive advantage, a failed IS/IT system might reduce the quality of products or services to customers. This could put the entity at a serious competitive disadvantage to its rivals.
Quality features of software
When a new system is developed, the user wants the software to be of a high quality. Software can be assessed according to several quality characteristics.
It should function correctly. The software should function in the way specified in the user requirements for the system. If software does not function as intended, the user may have an inefficient or an ineffective system that fails to achieve all its objectives.
It should be robust. Software is robust if it operates without faults, and the system does not ‘crash’ continually. A system may crash, for example, because it

Paper P5: Advanced performance management
284 © Emile Woolf Publishing Limited
cannot handle the work load. When a system ‘crashes’ (or when ‘the system is down’) the user’s operations come to a halt.
It should be fairly free from ‘bugs’. Software may contain ‘bugs’ that do not cause a system crash, but that result in data being processed incorrectly, or input being rejected. It is virtually impossible to write software for a bespoke system that is ‘bug-free’, but in good quality software, the bugs are relatively few in number and not serious.
It should be user-friendly. User-friendliness has been described in an earlier chapter. If software is not user-friendly, the user may be reluctant to use it, and some of its useful functions may not be used at all.
The quality of software can also be assessed in terms of conformity to requirements, reliability, usability and degree of excellence.
Conformity to requirements. Software should do what it is supposed to do, and conform to the user’s requirements. What the user requires from the IS/IT system and what is formally specified are not always the same, because there might be weaknesses in the formal specification for the new system. A good quality IS/IT system is therefore one that meets user requirements, so that the user does not have to ask for amendments and changes to the system after it has been introduced. The problem of failure to meet user requirements can be reduced through suitable user acceptance testing (explained later).
Reliability. The IS/IT system should be reliable. This is not simply a matter of eliminating errors in programs. Systems might suffer in practice from excessive ‘down time’ and insufficient availability to the user. Excessive system downtime might possibly be due to the fact that it was not properly designed to handle such a large volume of processing.
Usability. As explained above, good quality in software can also be measured by its user-friendliness and the ease with which users are able to use it.
Degree of excellence. The quality of an IS/IT system can also be judged by factors such as:
- whether it is relatively easy to maintain
- whether it is flexible and can be adapted for other uses, and
- whether it can be expanded to handle a larger volume of ‘traffic’ or transactions.
4.2 The quality triangle for new information systems
In view of the importance of many bespoke IS/IT systems for business strategy, quality management is a key issue in IS/IT system development. New system development projects must meet certain targets or standards. Quality in IS development relates to three factors:
cost
time
performance.

Chapter 11: Role of quality
© Emile Woolf Publishing Limited 285
Cost
‘Cost’ as a quality factor in systems development means developing a new IS/IT system on budget, without overspending. If costs exceed budget, there is a risk that the system will fail to provide the required return on investment.
Time
‘Time’ in new system development means that the system should be developed and implemented on time (on schedule). Delays can be expensive, especially when there is a competitive advantage in implementing a new system ahead of similar systems that competitors might be developing.
Quality
‘Quality’ here means that a system should meet its design specifications, and perform to the standards that are expected of it.
Compromise between cost, time and performance quality
When new IS/IT systems are designed and developed, a compromise must usually be made between cost, time and performance specifications. However, once the specifications for a new system have been agreed, with an associated budget for expenditure and time schedule for completion, management should try to ensure that the system is designed and implemented within budget and on schedule and that it meets its performance specifications.
4.3 Software quality assurance
Software Quality Assurance (SQA) can be defined as a planned and systematic approach to achieving quality in software development, by means of adherence to standards:
for software products, and in software development processes and procedures, and
for the evaluation and testing of software.
SQA includes ensuring obtaining assurance that standards are established and applied throughout the life cycle for software development or acquisition.
Cost
Quality Time

Paper P5: Advanced performance management
286 © Emile Woolf Publishing Limited
Standards provide a framework for developing new software, and they provide established criteria or benchmarks for comparison with actual development and control processes. There should be quality assurance ‘approval points’ at certain stages throughout an IS/IT development project, where an SQA evaluation of the project is made in relation to the applicable standards.
New software should be both validated and verified before it is implemented.
Validation means ensuring that the software is designed to do what the user requires it to do.
Verification means ensuring that the software conforms to its design.
4.4 Quality assurance and quality control in IS/IT system development
There are external quality standards for software development. As indicated above, standard procedures and processes are an important part of quality assurance. The benefits of IT Standards are:
to ensure conformity to best IT practice throughout the organisation and in the industry (quality assurance): this will ensure that the desired quality of software and IS system is achieved
to control computer system operations and practices, and to encourage continuous improvement.
The application of IS standards means that:
well-established industry-wide procedure standards are applied
standard documentation is produced for system design and program design
program coding is developed in accordance with standards
testing is carried out in accordance with recognised standards.
IT Standards cover all aspects of IT development and operations, including:
hardware and software procurement
control and security procedures
systems development and implementation, including testing
documentation.
Whereas quality assurance is concerned with the application of suitable procedures and methods to achieve quality, quality control is concerned with testing.
Quality control in IS/IT system development involves regular testing software and systems against the desired quality standards, design specifications and user requirements. It involves a formal use of testing and acting on the results of the tests.
Quality assurance in IS/IT system development goes beyond quality control. It is concerned with the application of processes, methods and documentation standards, whereas quality control focuses on what comes out of the process.

Chapter 11: Role of quality
© Emile Woolf Publishing Limited 287
4.5 The V life cycle model
The V life cycle model for IS/IT system development is commonly used to ensure that appropriate quality assurance is exercised at each stage of a new IS/IT system development project. The model gets its name because the stages of design and testing for a bespoke IS/IT system can be shown in a ‘V’ model, as follows.
(The name ‘V’ model comes from the shape.) The V model shows the stages of system development, and the associated (dynamic) testing for each of those stages. (Dynamic tests are tests on the software itself. They involve tests of individual programs or the system as a whole, to check whether these meet the specifications. Unit testing, systems testing and acceptance testing are all examples of dynamic testing.)
The stages in developing a new system are shown on the left hand side of the V, starting at the top left hand side and moving down to the bottom of the V.
The stages in testing and implementation are shown on the right hand side, starting at the bottom of the V and moving up to the top right hand side.
Feasibility study
A feasibility study is carried out into the potential benefits of a new IS/IT system. The purpose of the study is to assess whether a new IS/IT system is feasible, what it would do, the benefits that it would provide and the time required for implementation. The study should include a financial evaluation of the proposed information system. A report is prepared for the department or business unit that will be responsible for the new system, and a decision is taken to go ahead with the system development (or decide not to go ahead).
Analysis
The next stage in the system development is the preparation of an outline specification for the new system. This outline design specification states in greater detail than the feasibility study report what the system should be capable of doing, and what it should cost to develop and operate.

Paper P5: Advanced performance management
288 © Emile Woolf Publishing Limited
Design
After a system has been defined by an outline specification, it is then planned in greater detail, by systems analysts. The total system is divided into units (programs), and specifications are prepared for how the units should integrate to produce the required output for the system as a whole. For example, the design of a bespoke accounts system might be prepared with separate programs or modules for the main ledger, receivables ledger, payables ledger, cost accounting, payroll, management information and so on. The output from this stage of the development is a detailed system specification.
Program specification
When the system has been specified in detail, and divided into separate programs or modules, a specification must be prepared for each individual program. This specification is used by the software programmers to write each program.
Coding
When the individual program specifications have been prepared and approved, the next stage is to write the programs. Coding is the activity at the bottom of the V.
The activities that follow on the right-hand side of the V are all testing activities.
Unit testing
Unit testing is the first stage of testing. Each individual program (‘unit’ of the total system) is tested in isolation. Unit testing of individual programs is also called program testing. The purpose of unit testing is to test whether the program as written meets the requirements set out in the program specification. (The program specification is on the same line of the model as unit testing, on the left-hand side of the V.)
Dynamic testing on a program is carried out by creating test input data for the program and comparing the actual output from the tests against the expected output.
Example A simple example of planning a test on software would be a test on a field of data input for the month of the year. The program may specify that the month must be two digits, between 01 and 12. The person testing the program may decide to carry out several tests to confirm that the program will process input into this field of data correctly. He might do this by devising a test with six test items, as follows.
Test item: Entry in the ‘month’ field of data
Expected output Actual test output
04 Entry accepted. 11 Entry accepted. 01 Entry accepted. 00 ‘Invalid entry’ message on screen. Entry not accepted. 7 ‘Invalid entry’ message on screen. Entry not accepted. 14 ‘Invalid entry’ message on screen. Entry not accepted.

Chapter 11: Role of quality
© Emile Woolf Publishing Limited 289
Devising suitable and comprehensive tests is difficult, because very large quantities of test data would be required to test a program comprehensively. However, the tester should try to devise specific tests that are as comprehensive as possible. Successful program tests are unlikely to provide a complete assurance that a system will function according to specifications. There are several reasons for this.
Program tests are tests on individual programs. They do not test how individual programs within the system interact with each other. Integration tests/system tests (including performance tests) are needed to check whether the system as a whole functions according to specifications.
It is usually impossible to devise test items for every logical combination of possible inputs, because there will be too many to test. Since testing cannot cover 100% of all possible situations, there will always be a risk that the software will not perform properly to specifications. This is a major reason why software errors are commonly found after a system has been implemented operationally (after systems tests and user acceptance tests, although these tests may uncover some errors that the program testing failed to identify.)
The user may eventually try to use the system in a way that was not predicted, and may input data or instructions that cause the system to fail.
Integration testing
Integration testing follows after unit testing. Integration tests are tests to check whether the program modules or units are fully integrated with each other. A program might work as specified in isolation, but it might not work when it is operating with other programs in the system. The testing aims at trying to ensure that:
The individual programs in the system integrate with each other properly. For example, the tests should show that data transferred from one program to another is not lost or corrupted in the transfer process.
The system interfaces correctly with other systems, if this is a user requirement.
The system performs as required.
The tests should include devising items of test data to process through the system, and checking whether the input has been processed correctly, that the data files are correct and that output from the system is also as expected. Integration testing can also be defined as a test that the system software as written meets the detailed design specifications prepared by the systems analysts. (The design specification is on the same line of the model as integration testing, on the left-hand side of the V.)
System testing
System testing may be carried out at the same time as integration testing. System testing is concerned with making sure that the system meets its performance objectives and that it will perform to the user’s expectations, does what it is supposed to do, is user-friendly and robust. Taken together, integration testing and

Paper P5: Advanced performance management
290 © Emile Woolf Publishing Limited
systems testing provide a check that the system that was specified has been delivered. Load testing or stress testing might be an element of system testing. This type of test is carried out to see how the system performs when it is required to process large amounts of transactions or handle large numbers of terminals concurrently. The system is tested under extreme conditions (conditions of ‘stress’). The purpose of stress testing is to check that the system is capable of handling an unusually large volume of transactions within a short period of time, without performance being adversely affected. For example, a network system with 50 terminals might be tested to see how it performs if all 50 terminals are demanding access to a central server at the same time. Stress testing is also called load testing. Tests might find, for example, that processing times deteriorate significantly when the system has to process large volumes of data, or response times might become much longer when the system is responding to inputs from a large number of terminals. In some cases, tests might find that the system crashes during load testing/performance testing.
At the end of successful system testing, the system is handed over to the user for testing.
Acceptance testing
Systems tests check whether a system meets the specifications for the system that have been developed by the systems analysts. The system specifications are based on what the systems designers consider to be the user’s requirements. Acceptance testing, in contrast, provides an opportunity for the user to test whether the system meets the original business objectives for the system. These may differ from the formal system specifications, where the design is flawed or where the user specifications were inexact. Acceptance testing is the final stage of testing. The tests are carried out by the user’s staff, using the hardware for the system when it becomes operational. In other words, the purpose of acceptance testing is to test whether the system successfully delivers what was requested in the feasibility study. (The feasibility study is on the same line of the model as acceptance testing, on the left-hand side of the V.) At the end of successful acceptance testing, the new system is ready for implementation. There are two main aspects to user acceptance testing:
functionality testing. This is testing by the user to ensure that the system performs all the functions that it is supposed to, as specified in the system requirements.
usability testing. This is testing to see how easy the system is to learn and use.

Chapter 11: Role of quality
© Emile Woolf Publishing Limited 291
In addition, since acceptance testing usually involves testing the system with large amounts of test data, it also provides an opportunity to:
identify more errors in the software or system design that were not discovered during program tests or system tests, and
train the staff of the computer user in how to operate the system.
Acceptance testing may discover errors and weaknesses in the system that are not identified by system testing:
Users may input data or commands in ways that the systems designers did not anticipate, and error conditions may be found that had not been provided for by systems testing.
The user’s staff may test for ‘real world problems ‘ - conditions and situations that the systems designers did not anticipate in the system design.
Acceptance testing may test the system with larger volumes of data that systems testing. This increases the likelihood that some software errors will be found that the program and systems testing did not find.
Testing with larger volumes of test data may also provide useful performance testing of the system (processing speeds, response times, ability to handle processing loads without crashing).
Acceptance testing on the actual hardware that the system will use may find that there is incompatibility between the software and the hardware, that earlier tests were unable to check.
The user is able to test the ‘usability’ of the system, and identify features that should be made more user-friendly.
4.6 Advantages of using the V life cycle model
The V model therefore maps each stage of ‘dynamic testing’ on the right-hand side of the V to a corresponding stage of system development on the left-hand side of the V. The advantages of the V model are as follows:
Tests are performed against specifications that are pre-determined at each stage of the IS/IT project development.
It specifies who is responsible for testing at each stage. For example, users will carry out acceptance testing; programmers will carry out unit testing.
It sets out coherent and consistent stages for the testing process.
It defines the testing that must be done at each stage before development can progress. There’s no point jumping to an integration test if the units do not work properly.
Testing is high on the agenda from the start of the project. It becomes much more expensive to correct software as projects progress, so testing should start at the earliest stages possible.
The V model, if properly applied, therefore helps to ensure system quality.

Paper P5: Advanced performance management
292 © Emile Woolf Publishing Limited
The importance of planning and documenting each test
All tests should be planned. The test plans, and the results of the tests, should be documented. Tests on software and systems must be planned for several reasons:
The person carrying out the tests has to make sure that the program or system meets its specifications. To do this, specific tests must be devised. Each part of the specification must be tested. In software testing, all logical combinations of input or processing conditions must be tested. Planning is needed to make sure that nothing is overlooked.
A test is a check on whether a program or the system will work in the way that should be expected. A program or system works properly only if it processes data in the way that it is expected. To carry out the check, it is necessary to compare the actual output from a program or system, and compare it with the output that should be expected.
Test plans can be documented, and the results of each test recorded to confirm that the software or system passed each test successfully. Errors that are found in the tests should also be recorded, and further tests should be planned and recorded after the error has been corrected. The documentation of testing provides a record that the testing has been successfully completed.
Planning tests provides a system for control over testing procedures and systems. If an error is found after testing has been completed, the test plans and results can be checked to find out why the error was not identified in testing. Presumably, when errors are not found in testing, the tests were not thorough.
4.7 The Capability Maturity Model
The Capability Maturity Model (CMM) was developed by the Software Engineering Institute (SEI) of Carnegie Mellon University. It describes how entities develop software. The model recognises five stages that entities progress through as they become more sophisticated in their use of IT. The CMM concentrates on evaluating an entity’s ability to perform its software development processes successfully and it gives guidance on how to improve these capabilities. The model is therefore often referred to as the Capability Maturity Model Integration (CMMI) process. The CMM identifies 5 levels of capability in processes. This applies to all processes, but in particular to the development of new software (IS/IT systems). Entities are encouraged to move up to a higher level, and the model provides guidance for an entity that is at one level on the best way of moving up to the next level.
The objective of SEI was to bring discipline to the development of software. This should result in better-quality software that could be developed in a more predictable way so that there is a greater chance of staying within the cost, quality time constraints. The approach relies on:
Identifying current capability level.
Identifying required or desired capabilities of the next level.

Chapter 11: Role of quality
© Emile Woolf Publishing Limited 293
Plan the move from current to desired levels.
The five capability/maturity levels
The five levels and their characteristics are as follows:
Level Characteristics
1 The process is ‘performed’
A performed process is one that meets the objective of the process. For system development, Level 1 capability means that the entity is capable of developing a new system. However, the process is performed informally, without following a documented standard specification. The rigour and success in performing the process often depends on the special efforts of individuals (‘heroes’). There is no consistent project management and the quality of performance in the process is variable.
2 The process is ‘managed’
A managed process is a performed process that is also planned and implemented in accordance with defined procedures. The process is planned, and management control is applied through comparison of actual performance against the plan. Corrective measures are taken when actual performance differs significantly from the plan. In terms of ISD/IT system development, capability at Level 2 will involve the use of a planned project management methodology and records are taken of time, cost and quality. Problems are identified and dealt with as they occur, but problems are not anticipated in advance.
3 The process is ‘defined’
The main distinction between a managed process (Level 2) and a defined process (Level 3) is that at Level 3 there are many more process standards and procedures. In terms of IS/IT development, all aspects of software development (not just the project management) are standardised and consistent. The entity uses well-established standard processes for system development that produce savings in terms of time and cost.
Problems are anticipated. Data collected about one project is shared across others.
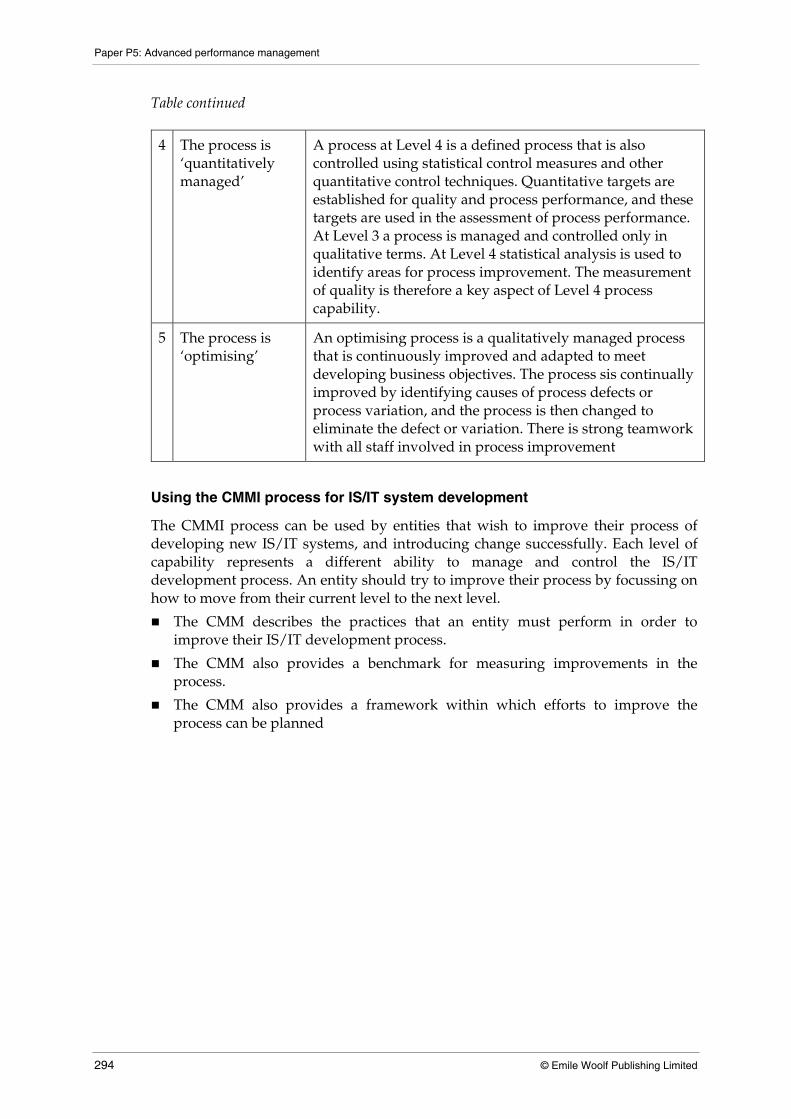
Paper P5: Advanced performance management
294 © Emile Woolf Publishing Limited
Table continued
4 The process is ‘quantitatively managed’
A process at Level 4 is a defined process that is also controlled using statistical control measures and other quantitative control techniques. Quantitative targets are established for quality and process performance, and these targets are used in the assessment of process performance. At Level 3 a process is managed and controlled only in qualitative terms. At Level 4 statistical analysis is used to identify areas for process improvement. The measurement of quality is therefore a key aspect of Level 4 process capability.
5 The process is ‘optimising’
An optimising process is a qualitatively managed process that is continuously improved and adapted to meet developing business objectives. The process sis continually improved by identifying causes of process defects or process variation, and the process is then changed to eliminate the defect or variation. There is strong teamwork with all staff involved in process improvement
Using the CMMI process for IS/IT system development
The CMMI process can be used by entities that wish to improve their process of developing new IS/IT systems, and introducing change successfully. Each level of capability represents a different ability to manage and control the IS/IT development process. An entity should try to improve their process by focussing on how to move from their current level to the next level.
The CMM describes the practices that an entity must perform in order to improve their IS/IT development process.
The CMM also provides a benchmark for measuring improvements in the process.
The CMM also provides a framework within which efforts to improve the process can be planned

© International Financial Publishing Limited 295
Paper P5 Advanced performance management
CH
AP
TER
12
Performance measurement and strategic HRM issues
Contents
1 Human resources management
2 Selection and performance appraisal
3 Reward management

Paper P5: Advanced performance management
296 © International Financial Publishing Limited
Human resources management
Human resources and Human Resource Development (HRD)
The importance of human resource management
The objectives of human resource strategy
Human resource planning
1 Human resources management
1.1 Human resources and Human Resource Development (HRD)
Business entities need to develop new business strategies to remain competitive in their industries and markets. In a complex and continually-changing environment, it is not sufficient to keep business strategies the same, making only minor incremental changes. New strategies inevitably involve change, which may be substantial. An earlier chapter explained that new business strategies are developed as a combination of:
intended strategies (planned strategies) and
emergent strategies.
Intended strategies can be decided and introduced by senior management, but the successful implementation of these strategies depends on the willingness of employees to accept the change and adapt to new processes or systems, and new business strategy objectives. Emergent strategies are developed by employees themselves, and ‘emerge’ from the way in which the entity responds to developments in its environment. For an entity to develop and implement successful emergent strategies:
it must be innovative
its employees must have the skills, knowledge and motivation to be innovative
employees must be given effective leadership by management, and should be encouraged to innovate
the entity should use the knowledge of its employees to find ways of developing business strategy.
The leadership given to employees, and the ability of an entity to develop and the knowledge of its employees, are now seen as key aspects of successful business strategy development. Human Resource Development (HRD) is an aspect of the resource-based view of strategy development. This is the view that entities should develop business strategies in a way that seeks to obtain sustainable competitive advantage from the strengths of the entity’s resources. Employees are a key resource, and should be

Chapter 12: Performance measurement and strategic HRM issues
© International Financial Publishing Limited 297
seen as an investment, not a cost. Johnson, Scholes and Whittington have commented: ‘Since the early 1990s, the resource-based view of strategy has become highly influential.’ They also comment that entities should make full use of employees’ knowledge in order to develop emergent strategies. ‘If employers can only see strategies in terms of deliberate planning, they not only risk that such strategies go unrealised, but they also waste the learning that can emerge from their employees.’ Leadership and the management and development of human resources affect all aspects of business s strategy. The examiner for Business Strategy has commented: ‘People issues will be inevitable in most questions set in this examination. Candidates must remember to explore … this perspective.’
Human Resource Development and change management
Business strategy development calls for change. The culture of an entity might resist change, or there might be a culture of welcoming change in order to move the business forward. Change management was discussed in an earlier chapter. You should be aware of the close link between the management and development of employees and other human resources is related to the management of change.
1.1 The importance of human resource management
Human resources are a key resource. The success of a business entity depends on the skills and experience of its human resources. A critical success factor for a business entity is to have sufficient human resources with the necessary skills. Top-quality performance comes from recruiting the best people, using them effectively and giving them an interest in their work performance. Operational and strategic success therefore depends on:
recruiting suitable employees and developing their skills and knowledge
managing employees effectively, and
motivating employees to perform well, and better.
The following diagram shows how five aspects of human resource management are closely related:
Recruitment and selection procedures should ensure that enough individuals are employed by an entity and that these individuals have the actual or potential skills and knowledge to perform well.
The performance of employees in their work is monitored and measured through performance appraisal.
Performance appraisal should be used to assess what is required to improve the individual’s performance, through training, new work experiences or other forms of personal development.
Performance appraisal might also be used as a basis for rewarding employees. Rewarding good performance is seen as one way of motivating employees to achieve planning targets or improve their work performance.

Paper P5: Advanced performance management
298 © International Financial Publishing Limited
Taken together, recruitment and selection, training and development and reward systems should all result in better performance from the entity’s human resources.
Employee development
Selection Performance Appraisal
Rewards
This diagram is based on a model for human resources management that was developed by Fombrun, Tichy and Devanna (1984).
Selection (staffing, recruitment)
+
Performance appraisal (appraisal of individual performance)
+
Personal development (development and training)
+
Rewards (pay and other benefits)
=
Organisational performance
1.2 The objectives of human resource strategy
A responsibility of the human resource management function is to:
assess the quantity and quality of human resources currently available, including numbers and skills
estimate the quantity and quality of human resources that will be needed in the future, including numbers and skills
consider ways of ‘filling the gap’ and ensuring that the entity has the human resources that it needs.
The objective of a human resources strategy is to ensure that the human resources are available, as required. (In some cases, it might also be necessary to consider reducing the numbers of employees whose skills are declining in importance, through programmes of redundancy or re-training and re-location).
1.3 Human resource planning
A human resource plan consists of a forecast of the human resources that will be required at a given time in the future, and plans for ensuring that the required numbers and skills will be available. A plan will typically look forward about three to five years. Beyond five years, it might be difficult to forecast requirements with any accuracy or reliability. There are four main stages in the planning process:

Chapter 12: Performance measurement and strategic HRM issues
© International Financial Publishing Limited 299
Studying the corporate objectives of the entity and the strategic objectives of each division and department. This analysis should then be used to estimate the likely total size and organisation structure of the entity. Total human resource numbers should be consistent with the corporate and divisional strategies.
Demand forecasting. The required numbers and skills of human resources should be estimated. Estimates of requirements should allow for any expected changes in technology, including the introduction of labour-saving equipment.
Assessing current resources. An assessment should be made of the current human resources, and what might happen to these existing resources each year over the forecast period. The assessment should allow for expected ‘wastage rates’ or labour turnover rates. For some employees, such as trainee accountants, the estimate might allow for the expected numbers who will pass their professional examinations and obtain a professional qualification during the period.
Preparing policies and plans. The final stage in the planning cycle is to develop policies and plans to fill the gap between the required numbers and current forecasts of future human resources.
These plans will include plans for:
recruitment of new staff
training and development to improve skills
performance appraisal, to monitor and control the development of skills
promotion
redundancies, where some employees will be surplus to requirements, or re-training.
The plans should be realistic, and should therefore take into consideration environmental factors such as:
changes in population trends, and the total size of the work force in each country where the entity has its operations
changes in government policy, such as changes in the retirement age of workers
changes in the educational system, and the numbers of students going from school into further education
the availability of individuals who are trained in a particular skill or vocation
changing patterns of employment, possibly with increasing numbers of part-time workers or home workers
competition for human resources from competitors and other businesses
trends in sub-contracting and outsourcing
trends in IT and other technological changes that might affect labour requirements.
Example
A basic requirement of a human resources plan is to estimate the future number of employees required for each type of work within the organisation over the planning period. For each year of the planning period, or taking the planning period as a

Paper P5: Advanced performance management
300 © International Financial Publishing Limited
whole, estimates for each type of job can be made as follows: Number Number
Number of employees needed by the end of Year [ ] 1,400 Current number of employees 1,200 Net increase in numbers 200 Estimate of staff turnover in the period Employees leaving employment (resignation, retirement etc) (300) Employees moving to another job in the organisation (150) Turnover of employees (450) Numbers required (total) 650 Fill from internal promotion or training 350 External recruitment (full-time equivalent) 300
Plans must then be developed to ensure that sufficient numbers of existing staff are given suitable training or personal development for promotion, and for the external recruitment of new full-time and part-time employees to fill the remaining gap.

Chapter 12: Performance measurement and strategic HRM issues
© International Financial Publishing Limited 301
Selection and performance appraisal
Performance management
Recruitment and selection
Performance appraisal
Performance measurement
2 Selection and performance appraisal
2.1 Performance management
Performance management is the process of creating a work environment in which people are enabled to perform to the best of their abilities. It begins when a job is defined and ends when the employee leaves an organisation. A performance management system includes the following:
Clear job descriptions, related to the objectives of the organisation.
Appropriate selection
Establishing and agreeing performance standards and measures
Providing the necessary training
Providing regular feedback on performance and coaching
Rewarding people for doing well
Providing a career structure.
2.2 Recruitment and selection
At a strategic level, the plan for recruitment and selection requirements should be based on the needs of the entity for human resources in order to implement the entity’s corporate and business strategies. It should recognise the changes in the mix of skills and experience that will be required from the work force in the future. Human resource planning has increased in importance for many businesses over the past two decades because, in some countries (including the UK):
birth rates have fallen so there is more competition for new people joining the job market
individuals are expected to work longer
jobs are more technically complex, so better people and more training are needed.
employees change jobs more frequently, which means that more vacancies have to be filled
an increasing proportion of the work force want to work at home and/or part-time.

Paper P5: Advanced performance management
302 © International Financial Publishing Limited
2.3 Performance appraisal
Performance appraisal is a formal process for reviewing and assessing the performance of:
individual employees, and
possibly work groups.
The appraisal process involves an interview or discussion between the employee and a manager. Usually, staff appraisals are between the employee and his or her immediate manager. However, a more senior manager may carry out the interview. Appraisal interviews should be carried out within a formal appraisal system. In many organisations, there are annual appraisal interviews for every individual. The aim of an appraisal interview should be to have a discussion between the employee and his or her manager, in which the following matters are discussed:
How are things going?
What has gone well?
What has gone badly?
What have been the problems and difficulties?
What is needed to develop the employee and improve his or her competence?
What can be done to meet these needs?
Two aspects of assessment and performance appraisal: judgement and development
There are two different aspects to performance appraisal:
Appraisal is a judgement by management on the individual. Performance appraisal is a form of judgement, carried out on the individual employee by another person who is usually in a position to decide what rewards the individual will receive for his performance. An individual might be criticised for performing badly, and rewards are often based on success or failure in achieving specific performance targets.
Appraisal systems are also used to discuss ways in which an individual can improve performance and acquire new skills and knowledge.
The main components of staff appraisal
A staff appraisal may have three different components.
A reward review. The annual appraisal interview may be seen as an opportunity for the employee and his or her manager to discuss pay and other rewards. The employee may have an opportunity to ask for more pay, or express a wish for promotion. The manager might use the appraisal interview to say what the individual’s pay will be for the next 12 months.
However, although rewards will be discussed in an appraisal interview, it is normally inappropriate to combine the annual appraisal interview with the annual pay review. This is because the interview will then focus on pay to the

Chapter 12: Performance measurement and strategic HRM issues
© International Financial Publishing Limited 303
virtual exclusion of everything else. The annual pay review – telling the employee what his pay and bonuses will be – should be a separate process.
Even so, if a separate pay review is used to discuss annual cash bonuses and other rewards, rewards are still an important part of the performance review process.
A performance review. An appraisal system might be used to assess the performance of the employee since the previous performance appraisal. One way of doing this is to agree a target or objective for the individual, and to compare the individual’s actual performance against this objective or target at subsequent appraisal interviews. The target that is set for an individual may be a target to complete a particular task. Alternatively, it might be a more general target, such as getting on better with colleagues in the work team. For a trainee accountant, the target might be to get through a particular examination within the next 12 months.
Potential review. Staff appraisal interviews can also be used to discuss the employee’s potential for career development and promotion. However, to make this discussion meaningful, there has to be a system of reporting to senior management and making recommendations that particular employees:
- should be considered for promotion, or
- should be considered for development, with a view eventually to promotion.
The benefits of staff appraisal
There are several possible benefits of staff appraisal for the employer.
It provides a formal system for assessing the performance and potential of employees, with a view to identifying candidates for promotion.
It provides a system for identifying ways of improving the competence of employees, in order to raise the general level of efficiency and effectiveness of the work force.
In a large organisation, it is therefore a valuable system for human resource planning, and ensuring that employees are ready for promotion, to fill management job vacancies that arise.
If it is well-managed, it can improve communications between managers and their employees, and so improve working relationships.
Staff appraisal also offers benefits to the employee.
The employee gets feedback about his performance at work, and an assessment of his competence.
A formal appraisal system offers the employee an opportunity to discuss his future prospects and ambitions.
An appraisal interview may be used as a basis for considering pay and rewards.
Appraisal can be used to identify and agree measures for further training and development, to improve the employee’s competence.

Paper P5: Advanced performance management
304 © International Financial Publishing Limited
Barriers to effective staff appraisal
At an operational level, potential barriers to an effective appraisal system are as follows:
It has no purpose. Employees see the appraisal interview as nothing more than an informal chat with the manager. Nothing happens as a result of the interview, which is badly organised. The entire process is seen as a waste of time and a pointless exercise.
Confrontation. Employees see the appraisal interview as an occasion for criticism from the manager. The manager (interviewer) might use the interview as an opportunity to tell the employee about his weaknesses and failures. When this is the attitude, the appraisal interview will a confrontation, and the employee will either be on the defensive throughout the interview, or will use the interview to argue back and to accuse the manager of failure. These interviews will not have a constructive outcome.
The interview is one-sided. Staff appraisals might be one-sided, with the manager telling the employee about his strengths and weaknesses, and giving him an assessment of his competence. Employees will often resist a system of appraisal in which they do not have an opportunity to answer back and give their own opinions.
Annual event. The appraisal process might be seen as an annual event, that happens every 12 months, and nothing more happens afterwards until 12 months later. To have any purpose, appraisal systems must include:
- follow-up action after the appraisal interviews and
- procedures for monitoring results.
Lack of a records system. There must be formal records for an appraisal system. Records should be kept of each appraisal interview, and what was agreed in the interview. If the employee and interviewer agree on targets or objectives for the employee, these should be recorded so that they can be discussed at the next appraisal interview. Similarly, a record should be made of any agreement about training that the employee needs or about work that the employee should be given to encourage his development. Records provide a basis for follow-up action and feedback.
Performance management is about directing and supporting employees to work as effectively and efficiently as possible in line with the needs of the organisation. (Walters 1995)
A systematic approach to improving individual and team performance in order to achieve organisational goals. (Hendry, Bradley and Perkins 1997)
2.4 Performance measurement
In order to assess the performance of individuals, there should be a benchmark, target or standard that the employee is expected to achieve. Actual performance can then be measured and compared with the benchmark.

Chapter 12: Performance measurement and strategic HRM issues
© International Financial Publishing Limited 305
Measures of performance should ideally be capable of objective assessment, and should not rely on the judgement and opinion of the person making the appraisal. Objective measures include:
Milestones for achievement. When an employee is expected to make progress toward a longer-term objective, performance can be measured in terms of whether or not the individual has reached agreed ‘milestones’ or targets on the way to the final objective.
Accomplishment of agreed tasks. An employee might have been given tasks to complete. Performance can be judged in terms of whether or not the tasks were completed successfully.
Performance might also be measured in terms of quantitative outputs. For example, a salesman might have been given the target of making annual sales of $X, and annual performance can be measured against this target.
Individuals might have more than one target for achievement. Performance might therefore be measured against several different targets. The purpose of performance measurement is to provide an objective basis for performance appraisal, and the objective of performance appraisal is to improve the performance of individuals so that the entity implements its business strategies successfully. It is therefore important that the measures that are used to assess individual performance are consistent with the strategic objectives of the entity. In practice this does not always happen. A lack of consistence between performance measurements and strategic objectives is a major problem for many reward systems that are based on performance appraisal.

Paper P5: Advanced performance management
306 © International Financial Publishing Limited
Reward management
The scope of reward management
Methods of reward
Rewards as incentives
3 Reward management
3.1 The scope of reward management
Reward management refers to all the monetary, non-monetary and psychological payments that an organisation provides employees in exchange for the work they perform.
For the employee, rewards are the benefits that are received in exchange for doing the work.
The employer must reward employees, but reward systems and methods of rewarding employees can be used to improve performance – provided that employees are motivated to perform better by the prospect of more rewards.
Bratton developed a five-stage model of reward management, which sets out the objectives and scope of a reward management system. Perspective Aim Comment
Strategic Cost leadership
or
Differentiation
Organisations pursuing a cost leadership strategy are likely to be interested in relatively ‘cheap’ employees.
A differentiation strategy needs employees who are capable of designing, producing and delivering differentiated products and services. Those employees are likely to have higher skills and will be more expensive
Providing a reward system
Performance improvement
Improve the commitment of staff to their work and their motivation.
Recruit and retain staff
Suitable employees have to be attracted and retained. Then their performance must be directed towards desired behaviour and standards.
Commitment and motivation do not necessarily depend on financial rewards.

Chapter 12: Performance measurement and strategic HRM issues
© International Financial Publishing Limited 307
Perspective Aim Comment
Selecting the methods of reward
Basic pay
Performance-related pay
Other benefits
Basic pay is a constant amount per hour, week, month or year.
Performance-related pay includes cash bonuses and the award of shares or share options.
Other benefits include health insurance, a company car, a pension entitlement, and so on
Deciding the amount of rewards to pay
Job analysis
Job evaluation
Appraisal
Job analysis is the process of collecting and evaluating information about the tasks, responsibilities and context of a specific job. It answers the question “What is the job?”
Job evaluation determines the relative worth of jobs. Note that this is very important in some anti-discrimination legislation that states that there should be equal pay for work of equal value.
Appraisal determines individuals’ performance.
Making rewards competitive, compared with other employers
Reflect conditions in the labour market
The going rate of pay in the labour market is an inescapable constraint on reward levels. If pay is set too low, then it will be difficult to recruit and retain. If it is set (or becomes too high after a number of years of pay increases), it will make the organisation uncompetitive with respect to…
Competitive forces (which put pressure on profits) constrain the amount that employers can afford to pay.
Some countries have minimum pay and maximum working week legislation. Many larger companies have ranges of pay linked to grades and this can constrain managers’ freedom to pay employees what they think is necessary and fair.

Paper P5: Advanced performance management
308 © International Financial Publishing Limited
3.2 Methods of reward
Rewards for an employee might be both extrinsic and intrinsic.
Extrinsic rewards are rewards provided to the employee by the employer, such as salary and promotion.
Intrinsic rewards are the rewards that an individual feels personally as a result of doing the work, such as job satisfaction.
Extrinsic rewards include items such as status and promotion, and benefits such as a company car or free medical insurance. However, the main element of extrinsic rewards is money, and possibly also company shares. The structure of reward systems varies between different entities.
Employees might be paid a high basic salary or wage, to attract and retain them. However, high salaries are not performance-related, and competitors are able (if they want to) to offer matching salaries.
There might also be a cash bonus payment, possibly paid annually. The payment of a cash bonus depends on meeting or exceeding agreed performance targets for the period. In some reward systems, a cash bonus is a fixed amount for achieving the target. In many organisations, the size of a cash bonus increases as performance improves. For example a sales representative might receive a sales commission based on the value of sales he makes during the year: the total commission payable increases with sales revenue.
A cash bonus might be paid to individuals for individual performance. Alternatively, a cash bonus might be paid to a work group for the collective performance of the group members. The group bonus is then divided between the members of the group on an agreed basis, such as an equal share of the total bonus for each member of the group.
Cash bonuses are usually linked to short-term performance, often annual performance, and are paid annually.
For senior managers, there might also be rewards in the form of the granting of shares or share options in the company. The purpose of awarding shares and share options is to give the manager a personal interest in the company’s share price and long-term performance, not just short-term sales and profits. These longer-term incentive schemes usually contain conditions that the manager will not receive the shares or will not be allowed to exercise the share options for at least a minimum number of years (typically three years).
Many senior executives in large companies therefore receive a reward package that includes a high basic salary, pension rights, annual cash bonuses and shares or share options in the company.
3.3 Rewards as incentives
The purpose of cash bonuses, or the grant of shares and share options, is to give employees an incentive to perform well.

Chapter 12: Performance measurement and strategic HRM issues
© International Financial Publishing Limited 309
In principle, employees perform well when they contribute to the successful achievement of the entity’s strategic objectives. Unfortunately, there are practical difficulties in establishing suitable performance targets that are closely linked to strategic objectives.
Most cash bonus systems are based on annual performance, such as the profitability of the company or business unit. Strategic objectives are more long-term. There might be occasions when maximising short-term performance damages long-term performance. For example, a company might maximise profits in the current year, but only by taking measures that will damage profitability in the longer term – such as deferring important new capital investment projects.
Bonus systems might be based on financial performance targets. However, the successful achievement of strategic objectives depends on non-financial as well as financial performance. Examples of non-financial performance include achieving better product quality, successful implementation of a new IS/IT system, successful implementation of a new process, improving the knowledge and skills of a work team, and so on. If rewards are based on financial performance only, non-financial performance will be given ‘second class’ status.
If rewards are based on non-financial performance measures, there may be difficulty in deciding which performance measures to use. There are many to choose from, but some will be more consistent with strategy objectives.
All reward systems have faults, because they fail to link rewards to strategic objectives, or because they fail to provide a sufficient incentive to employees. For example, if a cash bonus is small relative to the size of an employee’s basic pay, the bonus might not provide an incentive to the employee to perform better in order to earn the extra money.
Reward systems can de-motivate employees when they are seen to be unfair. For example, when senior managers earn bonuses but other employees do not, the other employees might consider the system unfair, and react to senior management with hostility.

Paper P5: Advanced performance management
310 © International Financial Publishing Limited

© Emile Woolf Publishing Limited 311
Paper P5 Advanced performance management
CH
AP
TER
13
Strategic models and performance measurement
Contents
1 Five Forces model
2 Boston Consulting Group (BCG) model
3 Ansoff’s growth vector analysis
4 Other models
5 Complex business models

Paper P5: Advanced performance measurement
312 © Emile Woolf Publishing Limited
Five Forces model
Competitive strength and the five forces
Existing competitors and competitive rivalry
Threat from new entrants
Bargaining power of suppliers
Bargaining power of customers
Threat from substitute products
1 Five Forces model
Using strategic models to set targets and measure performance Several strategic planning models have been developed that can be used to set strategic planning targets, and to measure and assess actual performance in relation to strategic targets. These include:
The Five Forces model of Michael Porter
The BCG matrix of the Boston Consulting Group
Ansoff’s product/market growth strategies.
Each of these models considers strategies for achieving a competitive position for products in their markets, or for developing products and markets to grow the business.
1.1 Competitive strength and the five forces
Michael Porter (in Competitive Strategy) developed a model for analysing the competitive nature of markets and the competitive position of companies. It is also a model for assessing the problems that a company faces in establishing a strong competitive position in a market. The model should be used to analyse a ‘strategic business unit’, rather than a company as a whole. A strategic business unit (or SBU) is a part of a company’s operations for which there is a separate and distinct market. The model is called the Five Forces model, because Porter suggests that there are five factors or ‘forces’ that affect the competitive position of a company in a market. These five forces are:
existing competitors and the rivalry between existing competitors
the threat from new entrants to the market
the bargaining power of suppliers
the bargaining power of customers
the threat from substitute products.
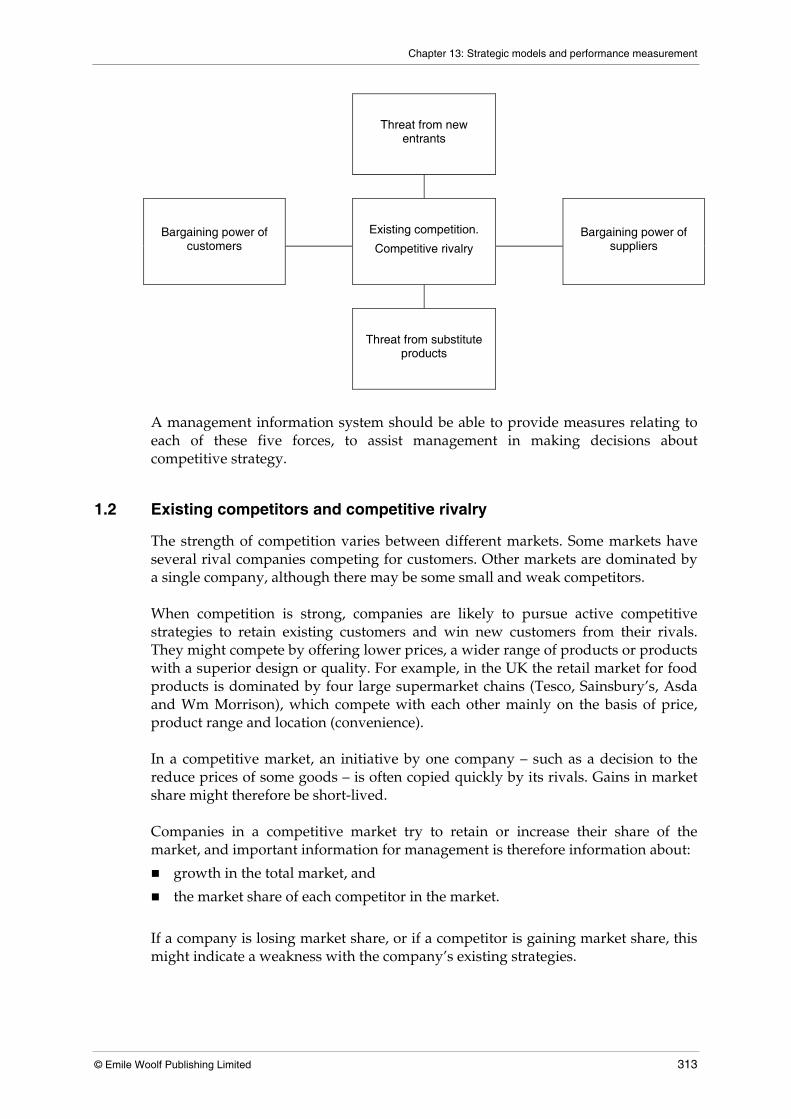
Chapter 13: Strategic models and performance measurement
© Emile Woolf Publishing Limited 313
Threat from new
entrants
Bargaining power of customers
Existing competition.
Competitive rivalry
Bargaining power of suppliers
Threat from substitute
products
A management information system should be able to provide measures relating to each of these five forces, to assist management in making decisions about competitive strategy.
1.2 Existing competitors and competitive rivalry
The strength of competition varies between different markets. Some markets have several rival companies competing for customers. Other markets are dominated by a single company, although there may be some small and weak competitors. When competition is strong, companies are likely to pursue active competitive strategies to retain existing customers and win new customers from their rivals. They might compete by offering lower prices, a wider range of products or products with a superior design or quality. For example, in the UK the retail market for food products is dominated by four large supermarket chains (Tesco, Sainsbury’s, Asda and Wm Morrison), which compete with each other mainly on the basis of price, product range and location (convenience). In a competitive market, an initiative by one company – such as a decision to the reduce prices of some goods – is often copied quickly by its rivals. Gains in market share might therefore be short-lived. Companies in a competitive market try to retain or increase their share of the market, and important information for management is therefore information about:
growth in the total market, and
the market share of each competitor in the market.
If a company is losing market share, or if a competitor is gaining market share, this might indicate a weakness with the company’s existing strategies.

Paper P5: Advanced performance measurement
314 © Emile Woolf Publishing Limited
Switching costs
Switching costs might affect the strength of competition in a market. Switching costs are the costs that a customer would incur by switching from one supplier to another. In some industries and markets, switching costs might be high. For example, it might be necessary to train employees in a different technology of the new supplier. Switching costs might be high, for example, if a customer is considering a switch to a new supplier of software. All the existing data files would have to be converted to a format suitable for the new software and employees would have to be trained to use the new system.
1.3 Threat from new entrants
In some markets, it is difficult for new competitors to enter the market. (The ‘barriers to entry’ are high.) This may be because entry to the market would require a large capital investment, and any company entering the market would therefore be taking a big risk. The strength of the threat from new entrants depends on the strength of the barriers to entry. Barriers to entry may not prevent competitors entering the market eventually, but they can delay the entry of new competitors.
The nature of barriers to entry
A variety of factors might create strong barriers to entry.
Economies of scale. Economies of scale refer to the ability of an entity to reduce the average cost per unit of sales by producing and selling a larger quantity of the product. They occur for a variety of reasons:
- By making and selling more units, fixed costs are spread over a larger quantity and fixed costs per unit fall.
- An entity might be able to use larger machines that can produce larger quantities more efficiently than smaller machines.
- An entity might be able to buy materials at a lower cost, by purchasing in larger quantities.
Capital investment. Entering a new market might require a large capital investment. This might deter a new entrant, because the investment could be high-risk.
Customer loyalty. Entities already operating in the market might have strong customer loyalty and a strong brand name. This would make it difficult for a new entrant to win market share.
A barrier to entry might exist in the form of legal or political protection. For example, the products made by a company already in the market might be protected by patent. Government protection might be provided in the form of an import ban or by law. An example in 2006 was the failure of European online gambling firms to enter the US market, because of US legislation against online gambling. This legislation protected companies that operated casinos in the US.

Chapter 13: Strategic models and performance measurement
© Emile Woolf Publishing Limited 315
Weak barriers to entry
In some markets, barriers to entry might be low, and it might be fairly easy for new competitors to enter the market. This is often the case with markets for services, where the service relies on the skill or expertise of the service provider. For example, it is often fairly easy for a professional person, such as an architect or a solicitor to set up in business. Occasionally, technological changes might reduce barriers to entry and make it easier for new companies to enter. For example, the Internet has made it possible for some companies to enter a market by offering goods or services for sale on the Internet. Selling through a web site avoids the need for large investments in retail stores or office property. Barriers to entry would be lowered the government offered a subsidy or grant to companies that invested in a particular industry.
A management information system should be able to provide information about any new entrants to the market, the type of product or service they are providing, the prices they are charging and the success they seem to be having in attracting customers.
1.4 Bargaining power of suppliers
The competitive position of a company in its market might be affected by the ability of one or more key suppliers to influence the market. Suppliers can have a very strong influence when:
there are very few suppliers to the market, and
there are a large number of companies in the market, buying from the same suppliers.
An example is the influence of producers of oil and natural gas over the energy markets. Powerful suppliers might be able to increase prices or control the supply of their product to the market. Companies in the market are exposed to the risk that the cost or the supply of a key resource could be changed by their supplier’s decision. Companies in a market should try to:
avoid reliance on a single supplier, if possible, and try to use several different suppliers, or
develop close strategic relationships with key suppliers.
When suppliers have a strong influence over a market, a company’s management information system should provide information about:
the number and identity of suppliers in the market
their prices

Paper P5: Advanced performance measurement
316 © Emile Woolf Publishing Limited
the proportion of total purchases of key products that are obtained from each supplier.
1.5 Bargaining power of customers
The competitive position of a company might also be affected by reliance on one or a small number of customers. An entire market might be dominated by a small number of potential customers. For example, the market for sophisticated weapons systems is influenced by the power of the rich governments that can afford to buy them. Similarly, the market for large passenger aircraft is strongly influenced by the bargaining power of the fairly small number of airline companies that might buy them. The bargaining power of customers is particularly strong in markets where there is a large number of suppliers but only a few customers. The UK retail market for food was referred to earlier. In this market, there are only four major supermarket chains, which buy a large proportion of all food products sold in the UK, but there are large numbers of small suppliers. The powerful buyers are often able to dictate terms to the suppliers, and can threaten to switch to different suppliers if the do not get what they want. When customers have a strong influence over a market, a company’s management information system should provide information about:
the number and identity of the major customers in the market
what these customers are asking for, in terms of product or service quality and price
the proportion of the company’s total sales that are made to each major customer.
1.6 Threat from substitute products
The competitive strength of a company might also be affected by the existence of substitute products. The company needs to be aware that its competitive strategy could result in a switch of customer demand to or from a substitute product. For example, an increase in the worldwide price of tea could lead to a switch in demand from tea to coffee. Similarly, higher prices for travel by railway could lead to a switch by customers to alternative forms of transport, such as air or road. When there are close substitutes for a company’s products or services, management should be provided with market information about these substitutes. For example, a company that supplies tea should monitor the market for coffee and other drink products.

Chapter 13: Strategic models and performance measurement
© Emile Woolf Publishing Limited 317
Boston Consulting Group (BCG) model
The BCG matrix: market growth (potential) and market share (profitability)
Categories of product in the BCG matrix
Structure of the BCG matrix
Using the BCG matrix for planning and performance measurement
Weaknesses in BCG model analysis
2 Boston Consulting Group (BCG) model
2.1 The BCG matrix: market growth (potential) and market share (profitability)
In competitive markets, management need information to evaluate their products (or services) in terms of their:
market potential, and
ability to generate profits and cash flows for the business.
The Boston Consulting Group matrix (or BCG matrix) is a model that can be used to assess which products should be developed for future growth, and whether a business entity has an appropriate mix of products for achieving future growth. It incorporates the concept of the product life cycle. It is useful for companies that provide a number of different products (or services) for different markets. The BCG matrix can be drawn as a 2 × 2 matrix, which ‘maps’ each product that a company sells, in terms of:
the expected growth in the market as a whole, and
the share of the total market that is currently held by the company’s product.
2.2 Categories of product in the BCG matrix
Products are categorised into four types:
stars
cash cows
dogs
question marks.
Stars
Stars are products where the market is growing at a fast rate, and the product enjoys a large share of the total market. They are normally new products. Stars might not yet be profitable, but new investment in the product should provide high financial

Paper P5: Advanced performance measurement
318 © Emile Woolf Publishing Limited
returns in the future. Entities need ‘stars’ in order to succeed in the future, and so should invest in them. Because the market is strong and growing, there are no problems with over-capacity in production and over-supply to the market. This means that the company has some control over prices that it can charge. (It may choose between a pricing strategy of ‘market penetration’ or ‘market skimming’. These pricing strategies are explained in another chapter.) A ‘star’ product has more potential for profits, and it is worthwhile to invest more money in the product, to increase sales. Eventually when the growth in sales slows down, a star will become a cash cow. In other words, a product that is a star early in its life cycle will become a cash cow during the mature stage of the product’s life.
Cash cows
Cash cows are products where the market is growing slowly, or is not growing at all, and the product enjoys a large share of the total market. These products are very profitable and provide large cash inflows for the entity. Every company needs cash cows to survive in the long-term. The cash from cash cows helps to finance investment in stars. Eventually, cash cows must be replaced when the product reaches the end of its economic life. The strategy for a cash cow should be maintaining and protecting the position of the product in its market, and to keep costs under control (or reduce costs). The strategy should not be to seek more sales growth, because the product has no further growth potential (or very little further growth potential).
Dogs
Dogs are products where the market is growing slowly, or is not growing at all, and the product has only a small share of the total market. These products are often (but not always) losing money. The correct strategic decision is usually to withdraw the product from the market.
Question marks
Question marks (also called ‘problem children’) are products where the market is growing at a fast rate, but the company’s product has only a small share of the total market. These products are currently losing money. New investment in ‘dogs’ (for example, more investment in research and development or marketing) might turn a ‘question mark’ into a ‘star’, but there is also a risk that it will become a ‘dog’ when the growth in the market slows down. Investing in these products will be a strategic gamble.

Chapter 13: Strategic models and performance measurement
© Emile Woolf Publishing Limited 319
2.3 Structure of the BCG matrix
A BCG matrix is shown below. The individual products (or business units) can be plotted in the matrix as a circle. The size of the circle shows the relative money value of sales for the product. A large circle represents a product with large annual sales. The position of the products in each quadrant also shows the relative rate of growth in the total market, and the relative share that the company’s product has in the total market.
BCG matrix
2.4 Using the BCG matrix for planning and performance measurement
Companies can use the BCG matrix to analyse the range of products that it sells, and to plan its future investment in products. The aim should be to ensure that there is a sufficient investment in ‘stars’, and that cash cows will generate enough cash flow to finance most or all of this investment. To carry out an analysis, information is needed for each product about:
Total market size
Rate of growth in the total market
The company’s share of the total market
Changes in the company’s share of the total market.
Example A company produces five different products, and sells each product in a different market.
The management accountant has obtained the following information about market size and market share for each product. It consists of actual data for each of the last three years and forecasts for the next two years.

Paper P5: Advanced performance measurement
320 © Emile Woolf Publishing Limited
Year - 2 Last year Year -1
Current year
Next year Year + 1
Year + 2
Actual Actual Actual Forecast Forecast Product 1 Total market size ($ million) 50 58 65 75 84 Product 1 sales 2 2 2.5 3 3.5 Product 2 Total market size ($ million) 150 152 149 153 154 Product 2 sales 78 77 80 82 82 Product 3 Total market size ($ million) 40 50 60 70 80 Product 3 sales 3 5 8 10 12 Product 4 Total market size ($ million) 60 61 61 61 60 Product 4 sales 2 2 2 2 2 Product 5 Total market size ($ million) 100 112 125 140 150 Product 5 sales 4 5 5.5 6 6.5
In the current year, the market share of the market leader, or the nearest competitor to the company, has been estimated as follows:
Market share of market leader or the company’s nearest competitor
Market for: % Product 1 37 Product 2 26 Product 3 12 Product 4 29 Product 5 20
Required (a) Using the Boston Consulting Group model, how should each of these
products be classified? (b) How might this analysis help the management of the company to make
strategic decisions about its future products and markets (‘product‐market strategy’)?
Answer A star is a product in a market that is growing quickly, where the company’s product has a large market share or where the market share is increasing. Product 3 appears to be a star. The total market is expected to double in size between Year – 2 and Year + 2. The expected market share in two years’ time is 15%, compared with 7.5% in Year – 2. Its market share in the current year is over 13%, which makes it the current market leader.
A cash cow is a product in a market that has little or no growth. The market share, however, is normally quite high, and the product is therefore able to contribute substantially to operational cash flows. Product 2 appears to be a cash cow. In the current year its market share was over 53%, and it is the market leader.

Chapter 13: Strategic models and performance measurement
© Emile Woolf Publishing Limited 321
A dog is a product in a market with no growth, and where the product has a low share of the market. Dogs are likely to be loss‐making and its cash flows are probably negative. Product 4 appears to be a dog. The total market size is not changing, and the market share for product 4 is only about 3%. This is much less than the 29% market share of the market leader. A question mark is a product with a fairly low market share in a market that is growing fairly quickly. Product 1 appears to be a question mark. The total market is growing quite quickly, but the market share of Product 1 is about 4% and this is not expected to change. Product 5 also appears to be a question mark, for the same reason. The company should decide on its strategy for the products it will sell.
It should benefit from the cash flows generated by its only cash cow, Product 2.
It should invest in its star, Product 3, with the objective that this will eventually become a cash cow.
It should give serious consideration to abandoning its dog, Product 4, and withdrawing from the market.
It has to make a decision about its two question marks, Product 1 and Product 5. The main question is whether either of these products can become a star and cash cow. Additional investment and a change of strategy for these products might be necessary, in order to increase market share.
For all the products (with the exception of Product 4, if this is abandoned) the company should also consider ways of making the products more profitable. Techniques such as value chain analysis might help to identify cost savings.
2.5 Weaknesses in BCG model analysis
There are several criticisms of the BCG model.
The BCG model assumes that the competitive strength of a product in its market depends on its market share, and the attractiveness of a market for new investment depends only on the rate of sales growth in the market. Unless a product can achieve a large share of the market, it is not sufficiently competitive. Unless a market is growing quickly enough, it is not worthwhile to invest more money in it. It can be argued that these assumptions are incorrect.
‐ A product can have a strong competitive position in its market, even with a low market share. Competitive strength can be provided by factors such as product quality, brand name or brand reputation, or low costs.
‐ A company might benefit from investing in an industry or market where sales growth is low.
It might be difficult to define the market.
‐ There might be problems with defining the geographical area of the market. A market might be defined in terms of a single country, a region of a country or as an international or global market.

Paper P5: Advanced performance measurement
322 © Emile Woolf Publishing Limited
‐ It might also be difficult to identify which products are competing with each other. For example, the total market for cars may be divided into different categories of car, but there may be problems in deciding which models of car belong to each category.
It might be that the BCG matrix is better for analysing the performance of strategic business units (SBUs) and market segments. It is not so useful for analysing entire markets, which might consist of many different market segments.
It might be difficult to define what is meant by ‘high rate’ and ‘low rate’ of growth in the market. Similarly, it might be difficult to define what is meant by ‘high’ market share and ‘low’ market share.

Chapter 13: Strategic models and performance measurement
© Emile Woolf Publishing Limited 323
Ansoff’s growth vector analysis
Four product market strategies for growth
Market penetration strategy
Product development strategy (innovation strategy)
Market development strategy
Diversification strategy
Ansoff’s growth vector and gap analysis
Management information
3 Ansoff’s growth vector analysis
3.1 Four product market strategies for growth
Ansoff’s growth vector analysis (Ansoff’s grid) is another model for strategic development and growth. The Ansoff growth vector might be presented as follows:
Product Current New Market
Current
Market penetration
Product development
New
Market development
Diversification
The model identifies four strategies for developing products and markets in order to grow the business. The four strategies are as follows:
Market penetration
Product development (innovation)
Market development
Diversification
3.2 Market penetration strategy
This is a strategy of trying to gain higher sales in the entity’s current markets with its existing products. Market penetration is achievable:
when the total market is growing, or
by increasing market share.

Paper P5: Advanced performance measurement
324 © Emile Woolf Publishing Limited
For example, a company providing mobile telephone services might pursue a market penetration strategy, by trying to sell to more customers. This is possible if the total demand for mobile telephone services is increasing, or by taking market share from competitors. A market penetration strategy is a low-risk strategy, and is unlikely to result in a high rate of sales growth. The product is not altered and there is no attempt to find new markets for the product.
3.3 Product development strategy (innovation strategy)
This is a strategy for growth that involves developing new products for existing markets and customers. For example, a software company might develop a new product or enhanced product that it tries to sell to its existing customers. Similarly, a car manufacturer might develop a new model of car, which it then tries to sell to its existing customers.
3.4 Market development strategy
This is a strategy of trying to enter new markets for the entity’s existing products. In other words, it is a strategy of selling current products to new customers by finding a new market, or a new market segment. For example:
a supermarkets company might try to increase its sales by entering the market for Internet shopping and home delivery
a company might grow by trying to enter markets in other countries.
3.5 Diversification strategy
This is a strategy of developing new products for new markets. A diversification strategy is a high‐risk strategy, because the company needs to develop a new product that will meet customer needs successfully, but it does not yet have much knowledge or understanding of customers in the market and what their needs might be. There are two types of diversification:
Related diversification, where the business entity develops new products and markets that are in a related industry. For example, a manufacturer of ice cream might diversify into producing soft drinks.
Unrelated diversification, where the business entity develops new products and markets that are in an industry where it has no previous experience. For example, a manufacturer of ice cream might diversify into making and selling shoes.
Unrelated diversification is usually a much higher‐risk strategy than related diversification. However, even a strategy of related diversification can be a high risk.

Chapter 13: Strategic models and performance measurement
© Emile Woolf Publishing Limited 325
3.6 Ansoff’s growth vector and gap analysis
Ansoff’s growth vector can be used together with gap analysis. Gap analysis is the analysis of the difference between a strategic target and the expected performance that will be achieved without any new strategies. For example, a company might measure the gap between the profits it would like to make in five years’ time and the profits it would expect to make if it did not undertake any new growth strategy. Having estimated the size of the profit gap, the company can then consider growth strategies to increase profitability. The contribution of each growth strategy to profits can be estimated. Together, a combination of growth strategies might enable a company to close the profit gap and pursue strategies that will enable it to meet its targets.
Strategies to fill the profit gap
Profit
Time
Target profit
Profit gap
Expected profit

Paper P5: Advanced performance measurement
326 © Emile Woolf Publishing Limited
3.7 Management information
Management should be provided with information that helps them to monitor the success of their growth strategy. The items of information that might be provided include:
Potential market demand
Market size
Market share
Information about competitors and their products
Pricing information
Information about costs
Information about required investment and financing
Estimated returns from a chosen strategy
The risks in the chosen strategy.

Chapter 13: Strategic models and performance measurement
© Emile Woolf Publishing Limited 327
Other models
Stakeholder mapping - Mendelow’s matrix
Risk assesment
4 Other models
4.1 Stakeholder mapping - Mendelow’s matrix
A business entity should manage its stakeholders, particularly those with the greatest influence. As a part of a review of the strategic position of a company, management should identify its major stakeholder groups, their power and their expectations.
One way of presenting the results of a stakeholder assessment is to prepare a ‘stakeholder map’. This is a simple diagram showing the main stakeholders or stakeholder groups, and their relative significance. The purpose of stakeholder mapping is to assist the directors of a company (or the governors of a public sector entity) to obtain an appreciation of who the main stakeholder groups are, and what their real and potential influences are over the entity and the entity’s strategies. One approach to stakeholder mapping is to show the relative significance of stakeholder groups using Mendelow’s 2 × 2 matrix comparing:
the amount of interest of the stakeholders on a particular issue, on a scale ranging from ‘not at all interested’ (0) to ‘very interested’ (+10), and
the relative power of the stakeholders, on a scale from ‘very weak’ (0) to ‘very powerful’ (+10).
The strength of the interest of a stakeholder group in the strategic decisions by the company will depend on their expectations of the benefits they expect the company to provide. The recommended course of action for the board of directors is indicated in each quadrant of the matrix. The key stakeholders are those who have considerable

Paper P5: Advanced performance measurement
328 © Emile Woolf Publishing Limited
power or influence, and also have strong expectations (a keen interest)about the strategic choices that the company makes.
4.2 Risk assessment
The assessment of risk is sometimes called ‘risk profiling’ or ‘risk mapping’. To assess each risk, it is necessary to consider the likelihood that losses will occur as a consequence of the risk, and the size or amount of the loss when this happens.
A simple approach to risk mapping involves taking each risk that has been identified and placing it on a map. The map is a 2 × 2 matrix, with:
one side representing the frequency of adverse events or the probability that the risk will materialise and an adverse outcome will occur, and
the other side representing the impact (loss) if an adverse event occurs or adverse circumstances arise.
The format of a simple risk map is shown below.
High impact
High impact Low probability Consider the need for control measures, such as insurance
High impact High probability Take immediate action to control the risk
Impact/size of potential loss
Low impact
Low impact Low probability Review periodically
Low impact High probability Consider the need for control action
Low probability/ frequency
High probability/ Frequency
Probability or frequency of the risk materialising
A risk map can help management to identify risks where immediate control measures are required, and where the need for control measures should be considered or reviewed periodically.
‘High impact, low probability’ risks might include the risks of damage to assets from fire or flooding, the risk of a terrorist attack or the risk of major legislation that will affect the company’s business. Some of these risks, such as risks of fire, theft and criminal damage, can be insured. Insurance reduces the residual risk by the amount of the insurance cover obtained.
All key risks should be ‘owned’ by specific individual managers, who should be required to take the necessary control measures and report to their senior manager about what they have done.

Chapter 13: Strategic models and performance measurement
© Emile Woolf Publishing Limited 329
Complex business models
Supply chains
Strategic alliance
5 Complex business models
5.5 Supply chains
A supply chain is a system of organisations, people, technology, activities, information and resources involved in moving a product or service from supplier to customer.
Supply chain activities transform natural resources, raw materials and components into a finished product that is delivered to the end customer.
Supply Chain Management integrates the key business processes from original suppliers to the end users of the product. Original suppliers are those that provide products, services and information that add value for customers and other stakeholders.
The basic idea behind the SCM is that companies and corporations involve themselves in a supply chain by exchanging information regarding market fluctuations and production capabilities.
If all relevant information is accessible to any relevant company, every company in the supply chain has the potential to help add value to the total supply chain.
4.2 Strategic alliance
A Strategic Alliance is a relationship between two or more parties to pursue a set of agreed upon goals or to meet a critical business need while remaining independent organisations.
Partners may provide the strategic alliance with resources such as products, distribution channels, manufacturing capability, project funding, capital equipment, knowledge, expertise, or intellectual property.
The alliance is a cooperation or collaboration which aims for a synergy where each partner hopes that the benefits from the alliance will be greater than those from individual efforts.
The alliance often involves shared expenses and shared risk.
A typical strategic alliance formation process involves these steps:
Strategy Development
Partner Assessment
Contract Negotiation
Alliance Operation:
Performance management is important at each of these stages. Strategic models can be used

Paper P5: Advanced performance measurement
330 © Emile Woolf Publishing Limited
Alliance operations involves comparison of actual results to budgets, , measuring and rewarding alliance performance, and assessing the performance and results of the alliance.
A joint venture is a strategic alliance in which two or more firms create a legally independent company to share some of their resources and capabilities to develop a competitive advantage.

© Emile Woolf Publishing Limited 331
Paper P5 Advanced performance management
CH
AP
TER
14
Alternative views of performance measurement
Contents
1 The balanced scorecard approach
2 The performance pyramid
3 Performance measurement in service industries
4 Performance prism
5 Activity based management
6 Predicting corporate failure
7 Product life cycle and life cycle costing

Paper P5: Advanced performance management
332 © Emile Woolf Publishing Limited
The balanced scorecard approach
The balanced scorecard: four perspectives of performance
Using the balanced scorecard
Conflicting targets for the four perspectives
1 The balanced scorecard approach
1.1 The balanced scorecard: four perspectives of performance
The balanced scorecard approach is an approach to measuring performance in relation to long-term objectives. This approach to target setting and performance measurement was developed by Kaplan and Norton in the 1990s. The most important objective for business entities is a financial objective, but to achieve long-term financial objectives, it is important to achieve goals or targets that are non-financial in nature as well as financial.
The reason for having a balanced scorecard is that by setting targets for several key factors, managers will take a more balanced and long-term view about what they should be trying to achieve. A balanced scorecard approach should remove the emphasis on financial targets and short-term results.
In a balanced scorecard, critical success factors are identified for four aspects of performance, or four ‘perspectives’:
customer perspective
internal perspective
innovation and learning perspective
financial perspective.
Perspective The key question
Customer perspective
What do customers value? By recognising what customers value most from the organisation, the organisation can focus performance on satisfying the customer more effectively. Targets might be developed for performance such as cost (value for money), quality or place of delivery.
Having established targets for performance, actual achievements should be monitored. Actual performance will help to answer another key question: How do customers see us?
Internal perspective
What must we excel at? To achieve its financial and customer objectives, what processes must the organisation perform with excellence? Management should identify the key aspects of operational performance and seek to achieve or maintain excellence in this area.
Targets should be established and actual perfformance compared with the targets.

Chapter 14: Alternative views of performance measurement
© Emile Woolf Publishing Limited 333
Perspective The key question
Innovation and learning perspective
How can the organisation continue to improve and create value? The focus here is on the ability of the organisation to maintain its competitive position, through the skills and knowledge of its work force and through developing new products and services.
Financial perspective
How does the organisation create value for its owners? Financial measures of performance in a balanced scorecard system might include share price growth, profitability and return on investment. Financial performance is likely to be the main perspective that shareholders will use to assess how well the business has performed.
1.2 Using the balanced scorecard
The focus is on strategic objectives and the critical success factors necessary for achieving them. In a balanced scorecard approach, targets are set for a range of critical financial and non-financial areas covering these four perspectives. The main performance report for management each month is a balanced scorecard report, not budgetary control reports and variance reports. Examples of measures of performance for each of the four perspectives are as follows: Perspective Outcome measures
Critical financial measures
Return on investment
Profitability Economic value added (EVA) Revenue growth Productivity and cost control Cash flow
Critical customer measures
Market share
Customer profitability Attracting new customers Retaining existing customers Customer satisfaction On-time delivery
Critical internal measures Success rate in winning contract orders Production cycle time/throughput time Amount of re-working of defective units
Capacity utilisation of a key resource

Paper P5: Advanced performance management
334 © Emile Woolf Publishing Limited
Perspective Outcome measures
Critical innovation and learning measures
Revenue per employee Employee productivity
Employee satisfaction Employee retention Percentage of total revenue earned from sales of new
products Time to develop new products Number of new products developed to market
launch stage
Example: balanced scorecard Kaplan and Norton described the example of Mobil in the early 1990s, in their book The Strategy-focussed Organisation. Mobil, a major supplier of petrol, was competing with other suppliers on the basis of price and the location of petrol stations. Its strategic focus was on cost reduction and productivity, but its return on capital was low. The company’s management re-assessed their strategy, with the aim of increasing market share and obtaining stronger brand recognition of the Mobil brand name. They decided that the company needed to attract high-spending customers who would buy other goods from the petrol station stores, in addition to petrol. As its high-level financial objective, the company set a target of increasing return on capital employed from its current level of about 6% to 12% within three years.
From a financial perspective, it identified key success factors as productivity and sales growth. Targets were set for productivity (reducing operating costs per gallon of petrol sold) and ‘asset intensity’ (ratio of operational cash flow to assets employed).
From a customer perspective, Mobil carried out market research into who its customers were and what factors influenced their buying decisions. Targets were set for providing petrol to customers in a way that would satisfy the customer and differentiate Mobil’s products from rival petrol suppliers. Key issues were found to be having petrol stations that were clean and safe, and offering a good quality branded product and a trusted brand. Targets were set for cleanliness and safety, speedy service at petrol stations, helpful customer service and rewarding customer loyalty.
From an internal perspective, Mobil set targets for improving the delivery of its products and services to customers, and making sure that customers could always buy the petrol and other products that they wanted, whenever they visited a Mobil station.
1.3 Conflicting targets for the four perspectives
A criticism that has been made against the balanced scorecard approach is that the targets for each of the four perspectives might often conflict with each other. When this happens, there might be disagreement about what the priorities should be.

Chapter 14: Alternative views of performance measurement
© Emile Woolf Publishing Limited 335
This problem should not be serious, however, if it is remembered that the financial is the most important of the four perspectives for a commercial business entity. A useful sporting analogy was provided in an article in Financial Management magazine (Gering and Mntambo, November 2001). They compared the balanced scorecard to the judgements of a football team manager during a football match. The objective is to win the match and the key performance measure is the score. However, as the match progresses, the manager will look at other important aspects of performance, such as the number of shots at the goal by each side, the number of corner kicks, the number of tackles and the percentage of possession of the ball enjoyed by the team. Shots on goal corner kicks, tackles and possession of the ball are all necessary factors in scoring goals, not conceding goals, and winning the match. The manager will therefore use them as indicators of how well or badly the match is progressing. However, the score is ultimately the only thing that matters. In the same way, targets for four perspectives are useful in helping management to judge progress towards the company’s objectives, but ultimately, success in achieving those objectives is measured in financial terms. The financial objective is the most important.

Paper P5: Advanced performance management
336 © Emile Woolf Publishing Limited
The performance pyramid
The pyramid structure: linking performance targets throughout an organisation
Interpreting the pyramid
2 The performance pyramid
Another approach to structuring the performance evaluation system is the performance pyramid. The concept of a performance pyramid is based on the idea that an organisation operates at different levels. Each level has different concerns, but these should support each other in achieving the overall business objectives. Performance can therefore be seen as a pyramid structure, with a large number of operational performance targets supporting higher-level targets, leading to targets for the achievement of overall corporate objectives at the top.
2.1 The pyramid structure: linking performance targets throughout an organisation
The performance pyramid was developed by Lynch and Cross (1991). They argued that traditional performance measurement systems were not as effective as they should be, because they had a narrow financial focus – concentrating on measures such as return on capital employed, profitability, cash flow and so on. They argued that in a dynamic business environment, achieving strategic business objectives depends on good performance with regard to:
Customer satisfaction (a ‘marketing’ objective: here, the focus is on external/market effectiveness)
Flexibility (the flexibility objective relates to both external effectiveness and internal efficiency within the organisation)
Productivity (resource utilisation: here, the focus is on internal efficiency, much of which can be measured by financial performance)
These key ‘driving forces’ can be monitored at the operational level with performance measures relating to quality, delivery, cycle time and waste. Lynch and Cross argued that within an organisation, there are different levels of management and each has its own focus. However, there must be consistency between performance measurement at each management level, so that performance measures at the operational level support the corporate strategy. They presented these ideas in the form of a pyramid of targets and performance that links operations to corporate strategy.

Chapter 14: Alternative views of performance measurement
© Emile Woolf Publishing Limited 337
A performance pyramid can be presented as follows:
Performance pyramid
2.2 Interpreting the pyramid
The performance pyramid links strategic objectives with operational targets, and internally-focused with externally-focused objectives.
Objectives and targets are set from the top level (corporate vision) down to the operational level. Performance is measured from an operational level upwards. If performance targets are achieved at the operational level, targets should be achieved at the operating systems level. Achieving targets for operating systems should help to ensure the achievement of marketing and financial strategy objectives, which in turn should enable the organisation to achieve its corporate objectives.
A key level of performance measurement is at the operating systems level – achieving targets for customer satisfaction, flexibility and productivity. To achieve performance targets at this level, operational targets must be achieved - for quality, delivery, cycle time and waste.
With the exception of flexibility, which has both an internal and an external aspect, performance measures within the pyramid (and below the corporate vision level) can be divided between:
- market measures, or measures of external effectiveness, and
- financial measures, or measures of internal efficiency.
The measures of performance are inter-related, both at the same level within the pyramid and vertically, between different levels in the pyramid. For example:
- New product development in a business operating system. When a new product is introduced to the market, success depends on meeting customer
Paper P5: Advanced performance management
338 © Emile Woolf Publishing Limited
needs (customer satisfaction), adapting customer attitudes and production systems in order to make the changes (flexibility) and delivering the product to the customer at the lowest cost for the required quality (productivity).
- Achieving improvements in productivity depends on reducing the cycle time (from order to delivery) or reducing waste.
Lynch and Cross argued that the performance measures that are chosen should link operations to strategic goals.
All operational departments need to be aware of how they are contributing to the achievement of strategic goals.
Performance measures should be a combination of financial and non-financial measures that are of practical value to managers. Reliable information about performance should be readily available to managers whenever it is needed.

Chapter 14: Alternative views of performance measurement
© Emile Woolf Publishing Limited 339
Performance measurement in service industries
The characteristics of services and service industries
Controllable performance in service industries: Fitzgerald and Moon
Fitzgerald and Moon: Performance measurement in service industries
Applying the Fitzgerald and Moon framework
3 Performance measurement in service industries
3.1 The characteristics of services and service industries
Many organisations provide services rather than products. There are many examples of service industries: hotels, entertainment, the holiday and travel industries, professional services, banking, recruitment services, cleaning services, and so on.
Performance measurement for services may differ from performance measurement in manufacturing in several ways:
Simultaneity. With a service, providing the service (‘production’) and receiving the service (‘consumption’ by the customer) happen at the same time. With production, the product is sold to the customer after it has been manufactured.
Perishability. It is impossible to store a service for future consumption: unlike manufacturing and retailing, there is no stock or inventory of unused services. The service must be provided when the customer wants it.
Heterogeneity. A product can be made to a standard specification. With a service provided by humans, there is variability in the standard of performance. Each provision of the service is different. For example, even if they perform the same songs at several concerts, the performance of a rock band at a series of concerts will be different each time. Similarly, a call centre operator answering telephone calls from customers will be unable to deal with each call in exactly the same way.
Intangibility. With a service, there are many intangible elements of service that the customer is given, and that individual customers might value. For example, a high quality of service in a restaurant is often intangible, but noticed and valued by the customer.
Since services differ to some extent from products, should performance setting and performance measurement be different in service companies, compared with manufacturing companies?
3.2 Controllable performance in service industries: Fitzgerald and Moon
A starting point for analysing performance measurement in service industries is that companies in a service industry should be able to link their competitive strategy to their operations, to make sure that the services that they are providing will enable

Paper P5: Advanced performance management
340 © Emile Woolf Publishing Limited
the company to achieve its strategic objectives. Performance management systems have an important role, because they can:
show how well or how badly the organisation has performed in achieving its strategic objectives, and
identify where improvements are needed.
Performance management systems have been developed in many organisations that:
link performance measures to objectives
include external as well as internal measures of performance, and
include non-financial as well as financial performance measures, and also
recognise that a compromise is often necessary between different performance targets, such as targets for service quality and targets for the cost or the speed of providing the service.
The performance measures that are used can vary widely between different service industries, and there is no standard set of performance measurements that apply to all services.
There have been various suggestions about how to provide a framework for performance management linked to strategic objectives. A framework can be used to analyse the strengths or weaknesses of an existing performance management system, and can be used to suggest improvements in a performance management system.
A framework for analysing performance management systems in service industries has been provided by Fitzgerald and Moon.
3.3 Fitzgerald and Moon: performance measurement in service industries
Fitzgerald and Moon (1996) suggested that a performance management system in a service organisation can be analysed as a combination of three building blocks:
dimensions
standards, and
rewards.
These are shown in the following diagram.
Building blocks for performance measurement systems (Fitzgerald and Moon 1996)

Chapter 14: Alternative views of performance measurement
© Emile Woolf Publishing Limited 341
Dimensions of performance
Dimensions of performance are the aspects of performance that are measured. A critical question is: What are the dimensions of performance that should be measured in order to assess performance? Research by Fitzgerald and others (1993) and by Fitzgerald and Moon (1996) concluded that there are six aspects to performance measurement that link performance to corporate strategy. These are:
profit (financial performance)
competitiveness
quality
resource utilisation
flexibility
innovation.
Some performance measures that might be used for each dimension are set out in the following table: Dimension of performance
Possible measure of performance
Financial performance
Profitability Growth in profits Profit/sales margins Note: Return on capital employed is possibly not so relevant in a service industry, where the company employs fairly small amounts of capital.
Competitiveness Growth in sales Retention rate for customers (or percentage of customers who buy regularly: ‘repeat sales’) Success rate in converting enquiries into sales Possibly market share, although this may be difficult to measure
Service quality Number of complaints Whether the rate of complaints is increasing or decreasing Customer satisfaction, as revealed by customer opinion surveys Number of errors discovered
Flexibility Possibly the mix of different types of work done by employees Possibly the speed in responding to customer requests
Resource utilisation
Efficiency/productivity measures Utilisation rates: percentage of available time utilised in ‘productive’ activities

Paper P5: Advanced performance management
342 © Emile Woolf Publishing Limited
Dimension of performance
Possible measure of performance
Innovation Number of new services offered Percentage of sales income that comes from services introduced in the last one or two years
Other measures of performance might be appropriate for each dimension, depending on the nature of the service industry. However, this framework of six dimensions provides a structure for considering what measures of performance might be suitable. The dimensions of performance should also distinguish between:
‘results’ of actions taken in the past, and
‘determinants’ of future performance.
Performance: results of past actions
Some dimensions of performance measure the results of decisions that were taken in the past, that have now had an effect. Fitzgerald and Moon suggested that results of past actions are measured by:
financial performance and
competitiveness.
Determinants of future performance
Other dimensions of performance will not have an immediate effect, and do not measure the effects of decisions taken in the past. Instead they measure progress towards achieving strategic objectives in the future. The ‘drivers’ or ‘determinants’ of future performance are:
quality
flexibility
resource utilisation
innovation.
These are dimensions of competitive success now and in the future, and so are appropriate for measuring the performance of current management. Measuring performance in these dimensions ‘is an attempt to address the short-termism criticism frequently levelled at financially-focused reports’ (Fitzgerald). This is because they recognise that by achieving targets now, future performance will benefit. Improvements in quality, say, might not affect profitability in the current financial period, but if these quality improvements are valued by customers, this will affect profits in the future.
Chapter 14: Alternative views of performance measurement
© Emile Woolf Publishing Limited 343
Standards
The second part of the framework for performance measurement suggested by Fitzgerald and Moon relates to setting expected standards of performance, once the dimensions of performance have been selected. There are three aspects to setting standards of performance:
To what extent do individuals feel that they own the standards that will be used to assess their performance? Do they accept the standards as their own, or do they feel that the standards have been imposed on them by senior management?
Do the individuals held responsible for achieving the standards of performance consider that these standards are achievable, or not?
Are the standards fair (‘equitable’) for all managers in all business units of the entity?
It is recognised that individuals should ‘own’ the standards that will be used to assess their performance, and managers are more likely to own the standards when they have been involved in the process of setting the standards. It has also been argued that if an individual accepts or ‘owns’ the standards of performance, better performance will be achieved when the standard is more demanding and difficult to achieve than when the standard is easy to achieve. This means that the standards of performance that are likely to motivate individuals the most are standards that will not be achieved successfully all the time. Budget targets should therefore be challenging, but not impossible to achieve. Finding a balance between standards that the company thinks are achievable and standards that the individual thinks are achievable can be a source of conflict between senior management and their subordinates. Standards should also be fair for everyone in all business units, and should not be easier to achieve for some managers than others. To achieve fairness or equity, when local conditions for the individual business units can vary, it is often necessary to assess performance by relying on subjective judgement rather than objective financial measurements.
Rewards
The third aspect of the performance measurement framework of Fitzgerald and Moon is rewards. This refers to the structure of the rewards system, and how individuals will be rewarded for the successful achievement of performance targets.
One of the main roles of a performance measurement system should be to ensure that strategic objectives are achieved successfully, by linking operational performance with strategic objectives. According to Fitzgerald, there are three aspects to consider in the reward system.
The system of setting performance targets and rewarding individuals for achieving those targets must be clear to everyone involved. Provided that managers accept their performance targets, motivation to achieve the targets
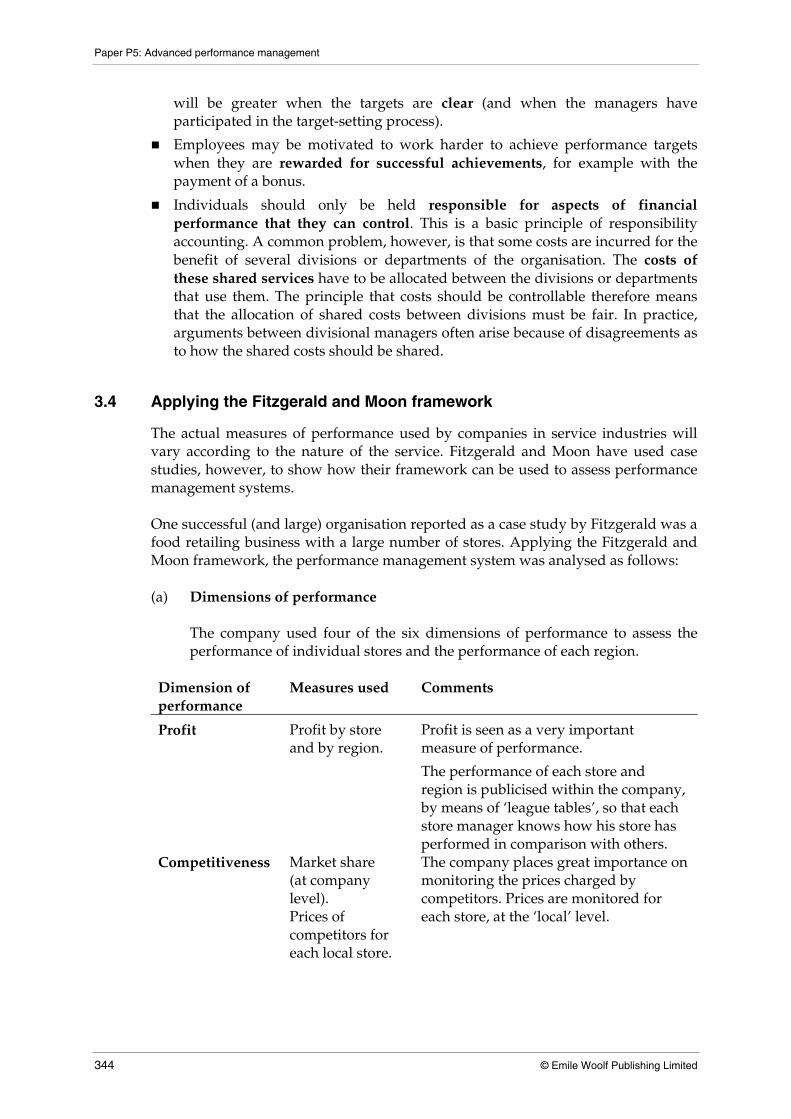
Paper P5: Advanced performance management
344 © Emile Woolf Publishing Limited
will be greater when the targets are clear (and when the managers have participated in the target-setting process).
Employees may be motivated to work harder to achieve performance targets when they are rewarded for successful achievements, for example with the payment of a bonus.
Individuals should only be held responsible for aspects of financial performance that they can control. This is a basic principle of responsibility accounting. A common problem, however, is that some costs are incurred for the benefit of several divisions or departments of the organisation. The costs of these shared services have to be allocated between the divisions or departments that use them. The principle that costs should be controllable therefore means that the allocation of shared costs between divisions must be fair. In practice, arguments between divisional managers often arise because of disagreements as to how the shared costs should be shared.
3.4 Applying the Fitzgerald and Moon framework
The actual measures of performance used by companies in service industries will vary according to the nature of the service. Fitzgerald and Moon have used case studies, however, to show how their framework can be used to assess performance management systems. One successful (and large) organisation reported as a case study by Fitzgerald was a food retailing business with a large number of stores. Applying the Fitzgerald and Moon framework, the performance management system was analysed as follows: (a) Dimensions of performance
The company used four of the six dimensions of performance to assess the performance of individual stores and the performance of each region.
Dimension of performance
Measures used Comments
Profit Profit by store and by region.
Profit is seen as a very important measure of performance.
The performance of each store and region is publicised within the company, by means of ‘league tables’, so that each store manager knows how his store has performed in comparison with others.
Competitiveness Market share (at company level). Prices of competitors for each local store.
The company places great importance on monitoring the prices charged by competitors. Prices are monitored for each store, at the ‘local’ level.

Chapter 14: Alternative views of performance measurement
© Emile Woolf Publishing Limited 345
Dimension of performance
Measures used Comments
Observation. Market share is assessed from published market share statistics.
Managers of local stores may visit the stores of competitors to see how full their car park is, and compare this with the number of cars in the car park of his own store.
Quality of service on specific transactions
Letters and other messages from customers. Observation
The quality of service is monitored by ‘mystery shoppers’ – individuals hired by the company to visit stores disguised’ as a customer, to observe the quality of service provided.
Quality of service overall
A range of measures for each store and warehouse/depot
A number of different aspects of service quality are monitored and measured, and a performance league table for stores and warehouses is published internally.
Resource utilisation
Sales per square metre. Wastage rates
Flexibility No formal performance measurement
However, managers are aware of the need for flexibility. For example, when there are staff shortages due to absenteeism, store managers will telephone part-time staff and ask them to fill the vacancies at short notice.
Innovation No formal performance measurement
The need to innovate continually is recognised, however, and innovation is discussed regularly at business planning meetings.
(b) Standards of performance
The research found a significant difference between the level of ownership for:
profit, and
quality of service.
Managers participated in the process of setting profit targets for their store or region, through the formal business planning process. However, standards for quality of service were imposed by central management (head office). The view of senior management was that quality standards must be the same at every store in the country; therefore standards must be decided at head office for the company as a whole.
‘Standards’ of performance were assessed for both profitability and quality of service.

Paper P5: Advanced performance management
346 © Emile Woolf Publishing Limited
Standard Comments
Profit Ownership Managers were involved in setting profit targets, as part of the discussions with head office about annual targets and business planning.
Achievability The standards/targets were considered achievable by the managers responsible for achieving them.
Equity In setting profit targets for each store, allowance was made for the effect of competition from local competitors to each individual store.
Quality of service
Ownership Standards were imposed by head office.
Achievability However, they were seen as achievable.
An aspect of standard-setting was the use of internal benchmarks, and comparisons of quality standards at different stores within the company.
Equity No allowances were made for different local conditions. All stores throughout the country were expected to achieve the same standards.
(c) Reward mechanisms for achieving standards
The three elements of reward systems within the Fitzgerald and Moon framework are:
clarity of goals and targets
how managers are motivated to achieve targets, and
whether there are any problems about shared costs and controllability of costs.
The research findings were as follows:
Clarity of goals Managers were aware of company strategy, and clearly understood how their performance would contribute to the achievement of strategic objectives.
Motivation: short-term financial motivation
Store managers received a bonus for achieving targets. In addition, there were ‘team’ bonus payments.
Motivation: non-financial aspects Managers had pride in their position in the league tables of stores, and were motivated to improve or maintain their position in the league.
Controllability There were no problems with controllability of costs or allocation of shared costs.

Chapter 14: Alternative views of performance measurement
© Emile Woolf Publishing Limited 347
(d) Conclusions
Conclusions drawn from this case study, based on the Fitzgerald and Moon framework, were as follows:
The company was highly successful.
It had a clear statement of strategy that was well understood by management in regions and local stores.
Performance measures were consistent with that strategy.
Performance measures were reported regularly, covering a range of financial and non-financial aspects of performance.
The performance measurements were clearly defined and communicated to employees at all levels in the company, and there were regular reports on actual achievements.
The driving force for performance targets was the satisfaction of customer needs.
The performance measurement system was reinforced by a rewards system to motivate managers and by a pride in performance.
Paper P5: Advanced performance management
348 © Emile Woolf Publishing Limited
Performance prism
Origins of the performance prism
Five sides to the performance prism
Stakeholder satisfaction
Strategies
Processes and capabilities
Stakeholder contribution
Performance prism: a summary
4 Performance prism
4.1 Origins of the performance prism
The performance prism is a model of performance management that has been developed by the Centre for Performance at Cranfield Business School. It is an attempt to overcome the limitations of earlier models or frameworks of performance measurement, such as the balanced scorecard, shareholder value added, activity based costing and competitive benchmarking.
These other performance management models have a variety of limitations.
The balanced scorecard is used to set targets on four key areas: financial performance, the customer, internal processes and innovation and learning. In doing so, it fails to recognise the potential importance of other stakeholders in the business, particularly suppliers and employees.
Shareholder value added also focuses on returns and value for shareholders, and gives no consideration to any other stakeholders in the business.
Activity based costing is concerned with analysing business processes, to identify cost drivers and eliminate activities that fail to add value. This focus on improving the efficiency of processes ignores the opinions of all stakeholders – such as shareholders, customers and employees.
Competitive benchmarking is often used as a ‘one off’ exercise to identify improvements that can be made in processes, and it is normally used to introduce short-term improvement measures. It does not provide a long-term and formal system of performance measurement.
Note: The term ‘stakeholder’ may not be familiar to you. Every company or other entity has a number of different stakeholders. ‘Stakeholder’ is a term for any individual, entity or group of similar individuals or entities that has an interest (or ‘stake’) in what the company does. The stakeholder groups for a company include its shareholders, lenders (banks and bondholders), suppliers, customers, the government and the general public (or sections of the general public).

Chapter 14: Alternative views of performance measurement
© Emile Woolf Publishing Limited 349
Each of the performance measurement models listed above looks at a different aspect of performance and each model can be very useful in particular circumstances. However, none of them provide a performance measurement framework that considers all aspects of performance and the full significance of all stakeholders. The performance prism has been developed as a framework for performance measurement that considers all aspects of performance and all significant stakeholders.
4.2 Five sides to the performance prism
The performance prism can be shown in diagram form as a solid block of glass with five sides, a top, a bottom and three vertical sides. The five sides of the prism represent:
stakeholder satisfaction
strategies
processes
capabilities
stakeholder contribution.
Performance prism
Stakeholder satisfaction
Strategies Processes
Capabilities
Stakeholder contribution
There are five aspects to successful performance in the long term.
The entity must have a very clear picture of who its key stakeholders are, and what they want. The key stakeholders of a company will include the shareholders, but other stakeholders might also be significant. (Stakeholder satisfaction)
The entity must have defined the strategies it will select and pursue in order to ensure that ‘value’ is given to all the key stakeholders. (Strategies)

Paper P5: Advanced performance management
350 © Emile Woolf Publishing Limited
They must understand the processes that will be necessary in order to achieve the strategic targets. (Processes)
They must have defined the resources that they need to perform these processes effectively, and must be capable of providing these required resources. (Capabilities)
The most successful entities will also have identified what they want to obtain from their stakeholders, such as loyalty from their employees and profitability from their customers. (Stakeholder contribution).
4.3 Stakeholder satisfaction
An entity must satisfy the needs and expectations of its key stakeholders. According to the performance prism framework, the starting point for a performance management system should be the satisfaction of key stakeholders.
Who are the most influential stakeholders?
What do they need and want?
The starting point should not be to establish performance targets for strategies. ‘Performance measures are designed to help people track whether they are moving in the direction they want to. They help managers establish whether they are going to reach the destination they set out to reach. Strategy, however, is not about destination. Instead, it is about the route you choose to take – how to reach the desired destination’ (Neely and Adams). A criticism of the balanced scorecard model for performance measurement is that it begins by establishing strategic targets, on the assumption that the aim should be to satisfy shareholders and maximise shareholder value. The approach in the performance prism framework is that although shareholders are key stakeholders for a company, other stakeholders might be just as important.
Some manufacturing companies rely heavily on suppliers, and should not establish a performance management system without considering the needs and expectations of those suppliers. In an article of the performance prism, Neely and Adams mention the example of Boeing, which manufactures only three of the components in a 777 aircraft. All the other components are manufactured by external suppliers.
Some entities rely heavily on key employees, and the performance targets they set cannot ignore their needs and expectations. An extreme example is a professional football club, which must consider the needs and expectations of its star players.
The government or government agencies can be powerful stakeholders in companies. In some countries, services such as the supply of water, gas and electricity are provided by commercial companies, but because of their monopoly position (and because of public concern about these services) companies are subject to regulation by a government-appointed regulatory body. This ‘stakeholder’ might have the power to instruct companies to reduce prices or improve the quality of their service, and companies failing to comply with the regulator’s demands might have to pay heavy fines. In many other

Chapter 14: Alternative views of performance measurement
© Emile Woolf Publishing Limited 351
industries, companies might have to consider the risk of punishment (often in the form of fines or legal settlements) for failing to comply with various government regulations.
In some industries, pressure groups might have a significant influence on the activities of companies. Pressure groups are sometimes able to organise action against a company, using the internet as their method of communication. For example, a few years ago, public pressure in some European countries successfully forced Monsanto to remove its genetically-modified food products from the market.
4.4 Strategies
When an entity has identified its key stakeholders, and their needs and wants, the next step is to select strategies that will satisfy these needs and wants. For each strategy, performance measures are needed. Performance measures are needed for four reasons.
Managers need performance measures for strategic targets so that they can monitor whether the strategies are being implemented.
Performance measures can also be used to communicate strategies to others within the organisation, so that they have a clear understanding of strategic objectives.
Performance measures are used to encourage the achievement of strategic objectives, for example by paying bonuses for the successful achievement of targets.
Actual data about performance can be used to assess whether strategic objectives are being achieved (and if they are not being achieved, to find out why not).
However, it is essential that performance targets should be consistent with the entity’s strategies. Individuals respond to performance measures, and will often do anything to succeed in meeting their targets, even if their actions are damaging and harmful. An example used by Neely and Adams is a telephone call centre that had a target of dealing with customer calls within one minute. In order to achieve this target, staff at the call centre would often cut off a customer in the middle of a call, to make it appear that the call had been dealt with on time. In this example, the objective of answering calls within one minute was not properly aligned with the company’s strategic objectives. Neely and Adams comment: ‘Measures send people messages about what matters and how they should behave. When the measures are consistent with organisation’s strategies, they encourage behaviour that is consistent with strategy. The right measures then not only offer a means of tracking whether strategy is being implemented, but also a means of communicating strategy and encouraging implementation.’

Paper P5: Advanced performance management
352 © Emile Woolf Publishing Limited
4.5 Processes and capabilities
In practice, managers often fail to achieve the strategic objectives of their company. One reason is that the performance targets that have been selected are inappropriate. Another important reason for ‘strategic failure’ is that the processes of the entity are not consistent with its strategies. The processes that the entity uses do not allow the strategies to be implemented. Neely and Adams refer to the view of Michael Hammer, advocate of Business Process Re-engineering. Hammer argues that processes should be analysed from the point of view of the customer. A customer usually wants a product or service:
with quick delivery (‘quick’)
to the required quality standard (‘right’)
at a good price (‘cheap’), and
in a way that is easy to organise and arrange (‘easy’).
Providing products or services that are ‘quick, right, cheap and easy’ should be a strategic objective, but in many cases a company’s products or services are ‘slow, wrong, expensive and unfriendly’, because its processes are inappropriate for delivering what the customer wants.
Neely and Adams argue that it is necessary to identify suitable performance measures for processes, as well as for strategies.
In addition, an entity must have the resources and capabilities to operate the processes. Capabilities are the combination of the entity’s people, policies and procedures, technology and physical infrastructure that create value for the stakeholder ‘Even the most brilliantly designed process needs people with certain skills, some policies and procedures about the way things are done, some physical infrastructure for it to happen and … some technology to enable or enhance it’ (Neely and Adams).
Taken together, the processes and capabilities of an entity are able to create a competitive advantage. Neely and Adams make a distinction between:
‘winners’: these are processes and capabilities that make the entity distinctive and give it a competitive advantage, and
‘qualifiers’: these are processes and capabilities that need to be improved or maintained at standard levels that are expected within the industry.
4.6 Stakeholder contribution
The fifth side of the performance prism is stakeholder contribution. It is important to consider not only satisfaction for key stakeholders, but also what the entity expects to obtain from its stakeholders.

Chapter 14: Alternative views of performance measurement
© Emile Woolf Publishing Limited 353
Customers are stakeholders of a business entity, and the entity should expect its customers to be profitable. Customer profitability should be an important aspect of performance measurement. However, research has shown that entities often ignore this aspect of performance.
Some types of customer might not be profitable. This should raise the question: do we want to keep these customers? Or, how can we make these customers profitable? Research in retail banking, for example, has suggested that 20% of customers generate 130% of the profits of a bank, and the remaining 80% of customers contribute a loss.
Creating an improvement in customer satisfaction might cost more than the benefits are worth.
A business entity wants its customers to be loyal and profitable, but its customers want high quality products for a low price. An entity’s ideas about stakeholder contribution are therefore different from stakeholder satisfaction. A difference also exists between:
what a business expects from its suppliers (prompt and reliable delivery, low prices, high quality), and
what is required to provide supplier satisfaction (prompt payment, a forward schedule of orders).
The performance prism includes stakeholder contribution as an element of performance measurement. ‘Gaining a clear understanding of the “dynamic tension” that exists between what stakeholders want and need from the organisation and what the organisation wants and needs from its stakeholders, can be an extremely valuable learning exercise for the vast majority of corporations and, especially, their … business units’ (Neely and Adams).
4.7 Performance prism: a summary
To provide a complete system of performance measurement, entities should consider five inter-related aspects of performance:
Who are the key stakeholders and what do they want?
What strategies must be implemented in order to satisfy the key stakeholders?
What are the critical processes needed to execute these strategies successfully?
What capabilities are needed to operate and improve these critical processes?
What contributions are required from stakeholders in order to maintain and develop these capabilities?
Paper P5: Advanced performance management
354 © Emile Woolf Publishing Limited
Activity based management (ABM)
Changes in business structure
The features of activity based management (ABM)
Adopting ABM
ABM: value-added activities and non-value added activities
Uses of ABM
5 Activity based management (ABM)
5.1 Changes in business structure
Many entities operate in a rapidly-changing business environment. In response to the changes in their environment, they undergo changes themselves. Changes in business structures and processes are necessary in order to remain competitive. When business circumstances change significantly, it might be necessary to make big changes to organisation structures and processes. Two techniques for introducing changes in business organisations are:
Activity based management (ABM), and
Business process re-engineering (BPR).
For each of these methods of managing change, information is needed to assist management. Much of this information should be provided by the management accounting system.
5.2 The features of activity based management (ABM)
In the past thirty years or so, there have been developments in management approaches to the re-design of activities, in order to improve the efficiency and effectiveness of activities and to reduce costs. The growing interest in activity management was due largely to the increase in overhead costs relative to other costs in an organisation. The ‘traditional’ focus of manufacturing companies on the control of direct costs was inadequate for controlling the much more significant costs of overhead activities.
Definitions
Activity based management (ABM) is the process of '... focusing on the management of activities to improve the value received by the customer and the profit achieved by providing this value' (CAM-I Glossary of Activity Based Management). Activity based management (ABM) is ‘the management processes that use the information provided by an activity-based cost analysis to improve organisational profitability. [ABM] includes performing activities more efficiently, eliminating the need to perform … activities that do not add value for customers, improving the

Chapter 14: Alternative views of performance measurement
© Emile Woolf Publishing Limited 355
design of products, and developing better relationships with customers and suppliers. The goal of ABM is to enable customer needs to be satisfied while making fewer demands on [the resources of the entity]’ (Horngren).
5.3 Adopting ABM
The adoption of ABM by a company will normally be accompanied by the implementation of a system of activity-based costing. The aim of a system of ABC should be to identify which activities within operations result in the consumption of resources and so in expenditure, and then to identify the main cost driver (or cost drivers) for each of those activities. In this way a more ‘accurate’ calculation of unit costs can be obtained. ABM is not a costing system. It is a system for investigating activities and how they consume resources, with a view to finding improvements in the way those activities are performed and so reducing costs. As its name implies, it is therefore a system for managing activities (which will often involve several different departments of functions within an organisation). By identifying the costs of the activity or process, it is possible to decide whether it is profitable, or whether it adds value. This helps management to make more informed decisions about matters such as pricing, product mix, capital investment, and organisational change/process change.
A distinction can be made between operational ABM and strategic ABM (Kaplan and Cooper).
Operational ABM uses information about activity-based costs to improve the efficiency of activities. This is concerned with ‘doing things the right way’. Activities that add value to a product should be identified and, if possible, improved to add further value. Activities that do not add value should be reduced or eliminated.
Strategic ABM uses ABC information in order to make decisions about which activities to use and which products to make and sell. It is concerned with ‘doing the right things’. It can apply ABC analysis to customer profitability, for example, and to the profitability of particular activities, with a view to deciding whether these should be enhanced or abandoned.
There are significant problems with the introduction of ABM systems. The operations and activities of an entity may be complex, and there is a risk that ABM analysis will make simplifying assumptions about activities and value that are not properly justified. The information produced by ABM needs to be reliable, and this is not necessarily easy to achieve.
A further problem is that an ABM approach generally assumes that ‘value’ is measured in financial terms, by more profit or lower costs. In reality, there are many aspects of an operation whose value cannot be measured financially. Qualitative factors in an activity or operation can be particularly significant from a strategic perspective. There is consequently a risk that the application of ABM will focus on financial improvements to the exclusion of important qualitative issues.
Paper P5: Advanced performance management
356 © Emile Woolf Publishing Limited
Traditional cost accounting and ABC
Traditional cost accounting measured the costs of functions and departments, rather than the costs of the activities that are carried out within the organisation (such as the cost of receiving, and the processing and despatch of orders). In many organisations (especially those with high overhead costs) activities are the real 'cost drivers' of the business. In addition:
a traditional budget often contains a significant amount of non-value-added costs that an ABM approach would possibly identify and eliminate
the annual budget often includes overhead costs as a fixed cost, based on a fixed output capacity for the budget period; in contrast, an ABM/ABC approach would begin with the activities required to meet customer demand, and plan capacity – and costs – accordingly.
5.4 ABM: value-added activities and non-value added activities
One aspect of ABM is that activities should be eliminated if they do not add value. An activity adds value when it contributes towards customer satisfaction, or increases the value of a product or service in the mind of the customer.
It might be possible to make value-added activities more efficient, or to add even more value.
Non-value added activities are a waste of time and expense. When these are identified, they should be eliminated.
Where activities add some value, but at great expense, the aim should be to reduce the cost of performing the activity.
For example, it is often suggested that a major activity in many public services, such as the hospitals service or the police service, is the completion of forms and preparing other official documents such as reports. Forms and reports add some value to a public service, but they should not take up excessive amounts of time for employees, such as doctors and policemen. In a system of activity based costing, a key activity might be identified as ‘keeping records’. If so, the costs of preparing reports and completing forms would be identified, and the factor or factors that drive the cost of this activity would be identified.
5.5 Uses of ABM
ABM can be used as a cost reduction technique. However, it can also be used to achieve significant re-design of processes, and is an alternative to Business Process Re-engineering as an approach to process re-design. By analysing the cost and the value-added element of various elements in a process or in a product or service mix, it is possible to re-design it radically to obtain competitive advantage. Activity based management (ABM) analyses the management of activities in order to improve the value obtained (‘value added’). ABM/ABC can help managers to improve their understanding of the value of what the organisation is doing, and

Chapter 14: Alternative views of performance measurement
© Emile Woolf Publishing Limited 357
whether it is using its available resources in the best way. It can provide useful information for answering questions such as:
Does the organisation understand the purpose and true cost of all of the activities it performs?
Which activities are a part of the ‘core service’? Which activities are discretionary, but add value? Which activities are non-value-added activities and which activities are a waste of resources?
When resources are in limited supply, do we prioritise activities properly, in order to maximise value?
ABM should be a recurring process, and not a ‘once-only’ exercise. This is because a common problem for organisations is to start with an effective value-adding process, but then over time to introduce ‘nice-to-have’ but costly additional features, which reduce their cost-effectiveness.
Example An example of the application of ABM is the ‘ticket-less airline’ model introduced several years ago by airlines such as RyanAir and Easyjet in Europe and Southwest Airlines in the US.
The concept of the ‘ticket-less airline’ challenged the existing assumption that passengers should be allocated a specific seat on an aircraft. Not issuing tickets might seem a relatively small cost saving, but it had enormous implications for the way the activity – booking passengers on flights – was carried out.
A ‘ticket-less airline’ operates a ‘one class’ seating system. There is no distinction between first class, business class and economy class. This reduces the time at check-in and required less check-in staff
Initially, the ticket-less airlines use laminated cards instead of tickets. This reduced printing costs.
Most passengers bought their tickets on the Internet. In doing so, they printed their own ticket receipts and processed their own payments. The costs of intermediaries – travel agents’ commissions – were eliminated.
Not having to allocate seats on the aircraft reduced time and administration costs at the airport.
By limiting the service to the core offering – a flight – the cost of providing airline food was eliminated. In addition, it increased its revenue from on-board paid-for snacks and drinks.
Since then, the airlines have developed their model still further, by getting customers to check in on-line (or pay more for checking in at the airport).
The large transaction cost savings (compared with traditional airline ticket costs) were passed on to customers in the form of highly flexible pricing, with many low-price ticket offers. The customer gained value from the improvements in the ticketing process.
Without activity based costing and activity based management, the model of the ticket-less airline would not have been possible.

Paper P5: Advanced performance management
358 © Emile Woolf Publishing Limited
Predicting corporate failure
Causes of corporate failure: two differing views
Quantitative corporate failure prediction models: financial ratio analysis
Quantitative corporate failure prediction models: the Z score model
Altman: Z score model
Predicting corporate failure: qualitative measures
Using failure prediction models to prevent corporate failure
Other indicators of failure
Avoiding failure
6 Predicting corporate failure
6.1 Causes of corporate failure: two differing views
Corporate failure occurs when a company becomes insolvent and goes out of business. Companies that fail have obviously performed badly. After a company has failed, it should be possible to analyse the reasons why failure happened and what went wrong. Corporate failure prediction is concerned with trying to identify companies that are at risk of failure, before the failure actually happens. If management can identify the signs of failure in advance, they might be able to take action to deal with the problems and prevent failure from happening. There are two differing views about predicting corporate failure.
One view is that corporate failure is caused by financial problems, such as losses or an inability to pay creditors (liquidity problems).
Another view is that the causes of failure are not financial. Financial problems are the consequences of other problems, and failure is caused by these other non-financial reasons.
Predicting the failure of companies may be based on either a quantitative approach or a qualitative approach. If failure can be predicted by the existence of financial problems, it should be possible to use financial ratios and quantitative analysis to predict the failure. On the other hand, if the causes of failure are non-financial, it might be necessary to use qualitative measures of performance – and judgement – to predict failure.
6.2 Quantitative corporate failure prediction models: financial ratio analysis
Financial ratio analysis is widely used to assess financial performance. For example:
ROCE is used to assess profitability in relation to the amount of capital invested. A low ROCE or losses are an indication of a poor financial performance.

Chapter 14: Alternative views of performance measurement
© Emile Woolf Publishing Limited 359
Financial gearing is used to assess the size of a company’s long-term debts in relation to equity capital. A high gearing ratio might indicate that the company could have difficulty in meeting its interest payment obligations.
Liquidity ratios (the current ratio and quick ratio) can be used to assess the liquidity of a company, and whether it might be at risk from a shortage of liquidity (cash).
It is generally accepted that the key factors making the difference between firms that fail and firms that survive are:
Profitability
Cash flow
Return on equity, including dividends
Gearing or debt levels
Volatility in business revenue.
The purpose of quantitative corporate failure prediction models is to identify a financial ratio (on its own) or a number of financial ratios that can be used to decide whether a company is at risk of failure. An early approach to the use of financial ratios to predict corporate failure was suggested by William Beaver in the 1960s. He studied a sample of companies that had failed and a sample of companies that had not failed. He studied whether the differences in any one particular financial ratio between these two samples of companies (failed and non-failed) were significant, so that the ratio would provide a reliable guide for failure prediction. Beaver concluded that of the financial ratios that he examined, the ratio of cash flow to total debt was the most significant, and there were differences in this ratio between most failed and most non-failed companies.
A weakness in Beaver’s approach was that he tried to identify whether any one financial ratio on its own was a good predictor of corporate failure. In reality however, individual financial ratios are probably not sufficient to provide reliable predictions of corporate failure.
It is difficult to assess when an individual financial ratio is at a dangerous level.
The ratios of a company change over time.
Financial ratios might also give contradictory signals: for example, if a company has poor liquidity (a low current ratio) but good profitability (a high ROCE), what is the probability of corporate failure?
6.3 Quantitative corporate failure prediction models: the Z score model
A quantitative corporate failure prediction model is a formula that can be used to predict corporate failure. The formula consists of a number of key financial ratios and each ratio is given a weighting. It produces a ‘score’ from the ratios, and this score can be used to decide whether the company is at risk of corporate failure.

Paper P5: Advanced performance management
360 © Emile Woolf Publishing Limited
Creating a failure prediction model
A quantitative corporate failure prediction model is based on an objective statistical analysis of historical financial data. There are several statistical methods that might be used to construct a model, but the most commonly-used method is called Multiple Discriminant Analysis or MDA. Researchers have developed different MDA models for different industries, and for different countries. The key financial ratios for predicting failure have been found to differ between industries, countries and size of company. MDA models are constructed in the following way:
A sample is taken of a number of different companies of the same type. These are grouped into two different categories: those that have failed and those that have not failed (and continue in business).
Historical financial data is gathered for all the companies in the sample, and a variety of financial ratios are calculated for each company.
Statistical analysis is used to identify the ratios that appear to discriminate most between the two different groups or categories of company (failed companies and successful companies).
Weightings are given to these key financial ratios according to how significant they appear to be in discriminating between failed and successful companies.
A ‘Z score’ model is established. This is the score obtained from the model.
A Z score can be calculated for any company. Statistical analysis is used to establish three categories of Z score.
A Z score above a certain value indicates that the company is ‘safe’ and is not at risk of failure.
A Z score below a certain value indicates that the company has a high risk of failure within a given period of time, such as within the next one or two years.
A Z score between these two values (safe and high risk) indicates that the company is in a ‘grey area’. There is some risk of corporate failure, but the risk is not (yet) high.
6.4 Altman: Z score model
Altman was the first person to develop a corporate failure prediction model using the MDA method. This model was developed in the 1970s, from a study of 22 US companies. His first Z score model used five key accounting ratios. The model was as follows: Z score = 0.012X1 + 0.014X2 + 0.33X3 + 0.06X4 + 1.0X5
where X1, X2, X3, X4 and X5 are the five financial ratios in the model. X1 = working capital/total assets X2 = retained earnings/total assets

Chapter 14: Alternative views of performance measurement
© Emile Woolf Publishing Limited 361
X3 = earnings before interest and tax/total assets X4 = market value of equity/book value of total debt X5 = sales/total assets.
(You do not need to learn this formula. It is included here to illustrate the nature of Z score models.)
With this model, Altman predicted that:
a Z score of 2.7 or higher indicated that the company was not at risk of failure
a Z score below 1.8 indicated a high risk of failure
a Z score between 1.8 and 2.7 was in the ‘grey area’ where failure was a possibility but not a high risk.
In 1982, Gritta applied the Altman model to the airline industry and successfully predicted the failure of the Braniff airline company.
Other Z score models
Other researchers have developed corporate failure prediction models. In 1991, the first industry-specific Z score model was developed for the airline industry. This is called the AIRSCORE model but is based on the Altman Z score model. In the UK, failure prediction models have been developed by Taffler and Tishaw. Researchers generally agree that their models are good for predicting corporate failure up to two years in the future, but are not reliable for longer-term predictions. H score model The H score model was devised by Company Watch. An H score is a percentage score between 0 and 100. If a company has an H score of, say, 15 this means that only 15% of companies have financial characteristics that are more indicative of a company at risk of failure. Similarly an H score of 80 means that 80% of companies have characteristics more indicative of a company at risk of failure. Company Watch suggest that an H score of 25 or less puts a company into a high risk category. The H score valuation is based on seven key financial ratios in three areas of management:
Profit management (changes in profitability)
Asset management (measured by liquidity, working capital and current asset cover
Funding management (measured by adequacy of capital, reliance on debt and reliance on current liabilities).
6.5 Predicting corporate failure: qualitative measures
A criticism of Z score models is that they focus on financial performance. It can be argued that poor financial ratios are a symptom of corporate failure, but they are

Paper P5: Advanced performance management
362 © Emile Woolf Publishing Limited
not the cause of failure. Analysing financial ratios does not help management to understand the nature of the problems that create the risk of corporate failure. John Argenti (1976) commented: ‘Whilst these (financial) ratios may show that there is something wrong … I doubt whether one would dare to predict collapse or failure on the evidence of these ratios alone.’ The factors that could be the real cause of corporate failure might be:
poor management for example, inexperienced management or autocratic management)
an inability to retain key staff
ownership of the company in the hands of a small number of individuals
poor management information systems
the loss of a big client
a large increase in interest rates
the launch of a big project (that does not go to plan).
Argenti: ‘A score’ model
Argenti developed a model for predicting corporate failure based on qualitative factors. His model produced a score that he called an ‘A score’. Like a Z score, an A score could be used to predict corporate failure, particularly in small and medium-sized companies. Argenti assigned scores to qualitative factors under three main headings:
Defects. These are weaknesses within the organisation and management structure, such as:
Management weaknesses
- an autocratic or inexperienced managing director/CEO (8 marks)
- failure to separate role of chairman and chief executive officer (4 marks)
- a passive board of directors (2 marks)
- a lack of balance in the skills of the management team – such as financial and marketing skills (4 marks)
- a weak finance director (2 marks)
- a lack of ‘management in depth’ (1 mark)
- poor ability to respond to change (15 marks).
Accounting deficiencies - no budgetary control system (3 marks)
- no cash flow planning (3 marks)
- no costing system (3 marks).
The total mark for defects is 45, and Argenti suggested that a satisfactory score is 10 or less.
Mistakes that have been made or ‘errors in action’. These are mistakes that the company makes that could have been avoided. The three main mistakes are:
Chapter 14: Alternative views of performance measurement
© Emile Woolf Publishing Limited 363
- expanding the business too quickly without the cash resources/capital to finance the expansion: this is ‘overtrading’ (15 marks)
- excessive borrowing from banks and high gearing (15 marks)
- ‘the big project’: undertaking a large and risky project, which subsequently fails (15 marks)
Argenti suggested that a satisfactory score for mistakes made is 15.
Symptoms of failure. Symptoms are evidence of a position that is getting worse, but they are not the actual cause of the company’s problems. Symptoms include:
- financial ratios getting worse, normally in the two years leading up to failure (4 marks)
- creative accounting: the use of ‘window dressing’ in the financial statements, to make the financial position appear better than it really is (4 marks)
- non-financial signs, such as frozen salaries for management, postponements of necessary capital expenditure, falling market share, increasing rate of staff turnover (3 marks)
- ‘terminal signs’ just before failure occurs: these are both financial and non-financial indicators showing even a casual observer that the company will soon fail (1 mark).
The overall ‘pass mark’ is an A score of 15 or less. Companies with a higher score should be concerned for their future and should consider measures that may be necessary to prevent failure in the future.
Other symptoms of failure
There is a wide range of non-financial as well as financial factors that could be an indicator of risk of financial failure. These may be grouped into:
Company-specific factors, such as poor management, reliance on a single customer or a small number of customers or customers concentrated in a specific industry or region, reliance on a single supplier, the level of diversification of the business, or a qualified audit report
General characteristics, such as the nature of the industry in which the company operates
Environmental factors, such as the condition of the economy and the business cycle, and the availability of credit.
It has also been suggested that the fundamental reasons for failure may be explained as:
Poor business planning. ‘If you fail to plan, you plan to fail.’ Many businesses fail because they do not have a clear and well-developed business plan, so that they know what they are ding and trying to achieve.
Poor financial planning. The main problems are poor cash flow planning and, in the case of new and small companies, starting out with insufficient capital.
Poor marketing. Companies that fail are often guilty of failing to promote themselves and their products, and ignoring the competition. In a competitive market, only those that compete successfully will survive.

Paper P5: Advanced performance management
364 © Emile Woolf Publishing Limited
Poor management. The owners of small businesses in particular often fail to recognise their own weaknesses and do not look for help Management may also lack the experience and skills to make their company a success.
6.6 Using failure prediction models to prevent corporate failure
Corporate failure prediction models might be used ‘after the event’ to explain why companies failed. However, there is no practical value in analysing the problem after it is too late and corporate failure has already happened. The value of corporate failure prediction models, if there is any at all, must lie in using a model to identify whether a particular company is at risk of failure, and if so:
how serious the risk is: the size of the risk can be judged according to the value of the Z score
what are the main causes of the problem.
Z score models can be criticised because they identify symptoms of the problem, but not the causes. ‘A score’ models can be criticised because they rely on subjective judgements of qualitative factors. A company might also be unaware that it is at risk of failure, and so might not consider hiring a firm of specialist consultants to analyse their position using a failure prediction model.
6.7 Other indicators of failure
It does not require the use of a corporate failure prediction model to identify businesses at risk of failure. In the P5 examination, you may be required to discuss the risk of failure for a company whose performance you are analysing. There will often be more than one indicator of potential failure. The following measures of performance, taken together, may indicate that a business is at risk of failure.
Declining sales and loss of market share. A company may be in a market or industry that is in decline, so that total sales in the market are failing. In addition, a company may be losing market share to its competitors. A falling market share in a declining market could be a strong sign of imminent failure.
Profitability. Low and declining profits – or losses – may indicate that a business has a limited future, unless it can turn the position around and restore profitability to an acceptable level.
Cash flow. A company can often remain in business when it is unprofitable, as long as it has sufficient liquidity (cash flow or access to cash). Evidence of financial collapse may be provided by a worsening cash position, with a bank overdraft near the limit agreed with the bank, or small amounts of cash and significant loans due for repayment in the near future
Lack of innovation. In competitive markets it is often essential for companies to continue to innovate and develop new products. Many products have a limited

Chapter 14: Alternative views of performance measurement
© Emile Woolf Publishing Limited 365
‘life cycle’ and need to be replaced or refreshed regularly. A lack of innovation – i.e. a product range that has not changed for many years – could be an indicator of eventual collapse of the business as customer demand declines over time.
Age of non-current assets. Viable businesses usually have a policy of regular replacement and updating of non-current assets, particularly plant, machinery and equipment. If a company has ‘old’ assets that it does not replace consistently and regularly, this could be an indication that it does not have the resources to reinvest in the business. Without reinvestment, a business will eventually decline.
Lack of adequate internal controls. A sound system of internal control is needed to manage the risk of failures in financial, operational and compliance systems. Weak controls increase the probability of fraud or error, with resulting losses. When controls are not working effectively, possibly because they are ignored, a company is unlikely to have the ability to succeed long-term. Eventually, something serious could easily ‘go wrong’.
Loss of key employees. When a company is declining and becoming less successful, it is often the ‘best’ employees who identify the problems first. There could be a high rate of loss of experienced and important personnel, leaving to take a job with a more successful rival.
6.8 Avoiding failure
When a company is seen to be at risk of failure, measures should be taken to reduce the risk. The measures that are needed may be apparent from the indicators of failure. A number of writers have put forward suggestions about what should be done to avoid failure. For example, Ross and Kami (1973), in an article on ‘why the mighty fall’, recommended Ten Commandments which should not be broken. Breaking any of the following commandments could result in corporate failure:
1 You must have a strategy. 2 You must have controls. 3 The board of directors must participate. 4 You must avoid a system of ‘one man rule’. 5 There must be management in depth. 6 You must keep yourself informed of change, and react to it. 7 The customer is king. 8 Do not mis-use computers. 9 Do not manipulate your accounts. 10 Organise to meet the needs of your employees.

Paper P5: Advanced performance management
366 © Emile Woolf Publishing Limited
Product life cycle and life cycle costing
The product life cycle
Financial aspects of the product life cycle
Strategic significance of the product life cycle
Product life cycle costing
Why is life cycle costing significant?
The product life cycle and the need for management information
6 The product life cycle and key financial performance measures
Strategic aspects of the product life cycle
7 Product life cycle and life cycle costing
7.1 The product life cycle
Many products have a life cycle. A ‘normal’ life cycle has four phases:
Introduction
Growth
Maturity
Decline.
Introduction
Growth
Stages
Maturity
Decline
Profit/loss
Revenue
Time

Chapter 14: Alternative views of performance measurement
© Emile Woolf Publishing Limited 367
A new product is introduced to the market, and it goes through a period of growth in market demand and profitability. The market then ‘matures’ and sales stop growing. Eventually, the market declines and sales fall: the product becomes unprofitable and production is ended. The life of a product can be made longer, by re-designing the product regularly, and through advertising and other marketing methods.
The length of a product life cycle varies. As a general rule:
a broad type of product may have a long life of several decades
the product may be produced in several different forms, and the life cycle of each form of the product may be shorter than the total life of the broad product
companies may produce a form of the product, and the life cycle of a company’s product may be shorter than the total life of broad product form.
For example, the life of the television has already been many decades long, and shows no obvious sign of coming to an end. However, the life cycle of the black-and-white picture television set has been shorter, and the end of the life of the analogue television can now be foreseen. Many companies have produced black and white picture televisions in the past, but the life cycle of their particular product will often have been quite short. For example, some companies may have stopped producing black and white televisions and switched entirely to colour televisions, long before other manufacturers stopped making black and white televisions. There is now a possibility that internet-based video systems will eventually replace the ‘traditional’ television. As some products of a company reach the end of their life cycle, they need to be replaced with new products. Product innovation is essential to survival. Companies need to have a portfolio of products that:
provides a profit, and also
ensures the survival of the company’s business in the longer term.
7.2 Financial aspects of the product life cycle
As explained earlier, the ‘traditional’ product life cycle has four phases: introduction, growth, maturity and finally, decline. At each phase in its life cycle:
selling prices will be altered
costs may differ
the amount invested (capital investment) may vary
spending on advertising and other marketing activities may change.
Sales volume, sales revenue, profitability, investment and cash flow will all vary as the product goes through the different stages of its life.
Introduction phase
When a product is new to the market, and a competitor has not already established a rival product in the market, a company may be able to choose its pricing strategy for the new product.

Paper P5: Advanced performance management
368 © Emile Woolf Publishing Limited
If a ‘market penetration’ strategy is chosen, the aim should be to sell the product at a low price in order to obtain a large share of the market as quickly as possible. This pricing strategy is therefore based on low prices and high volumes.
If a ‘market skimming’ strategy is chosen, the aim is to sell the product at a high price in order to maximise the gross profit per unit sold. Sales volumes will be low, and the product will be purchased only by customers who are willing to pay a high price to obtain a ‘unique’ item. Gradually, the selling price will be reduced, although it will be kept as high as possible for as long as possible.
Growth phase
In the growth phase of a product’s life, sales demand grows rapidly, but more competitors enter the market. Companies need to focus on cost control, mainly by achieving economies of scale by producing in larger quantities. However, it is also important to ensure that customers believe that they are receiving good value and quality for the price.
Maturity phasem
In the maturity phase of a life cycle, the objective should be to maintain market share. It may be necessary to use changes in price to sustain market share. Alternatively, a company may look for new distribution channels that offer an opportunity to sell at higher prices or at lower costs.
Decline phase
In the decline phase, total sales in the market fall. Sales price might be increased in order to maximise profitability. Almost inevitably, this will result in a continuing fall in sales volumes.
7.3 Strategic significance of the product life cycle
The strategic significance of the product life cycle for the purpose of management accounting is as follows:
Every product should be expected to go through a life cycle, although the length of the life cycle will vary for different products. In competitive markets, there is a tendency for the product life cycle to become shorter.
Companies therefore need to innovate to remain competitive, and replace products reaching the end of their life cycle with new (successful) products.
The financial performance of products changes over the different stages of its life cycle. Products start by needing large capital investment and make losses initially because sales demand has not yet grown. As they progress through their life cycle, they start to make profits and provide cash to the business.
Profit targets and the assessment of performance for different products should recognise the stage of their life cycle that they have reached.
Strategic accounting information about the product life cycle can help managers to:

Chapter 14: Alternative views of performance measurement
© Emile Woolf Publishing Limited 369
assess the likely return on investment from a new product over its full life cycle, and
predict when current products might reach the end of their life cycle, so that strategic managers can plan for new product development, and design of new products to take the place of those reaching the end of their life.
7.4 Product life cycle costing
Product life cycle costing is concerned with planning the costs of a product over the full course of its life, with the intention of:
Identifying what those costs are likely to be: in particular, a product may require significant investment early in its life and substantial spending on marketing during its growth phase. In some cases, there may be decommissioning costs or clean-up costs at the end of its life.
Trying to ensure that the product will prove an adequate return on investment over the full course of its life cycle.
Life cycle costing is the estimation of the costs for a product over its entire life cycle. These are not just the costs of producing the product, but all costs directly associated with making and selling the product. These include:
costs of production
costs of acquiring capital equipment to make and sell the product
advertising and other marketing costs
costs of repairs under guarantee or warranty
product design costs and testing costs
possibly, costs associated with the removal of equipment at the end of the product’s life.
The purpose of life cycle costing is to ensure that the product will provide the required return on investment over the full course of its expected life.
7.5 Why is life cycle costing significant?
The significance of life cycle costing is that the costs of a product over its full life cycle should be considered at an early stage in the product’s life, when it is in the early stage of product design. It is recognised that a large proportion of the total life cycle costs of a product (possibly as much as 70% or 80%) are determined when the product is designed. For example, at the design stage, decisions are taken about:
the number of components that will be in the product
the quality of the materials that will be used
whether components will be a standard design or not
the packaging that will be used
the quality of the end product, and
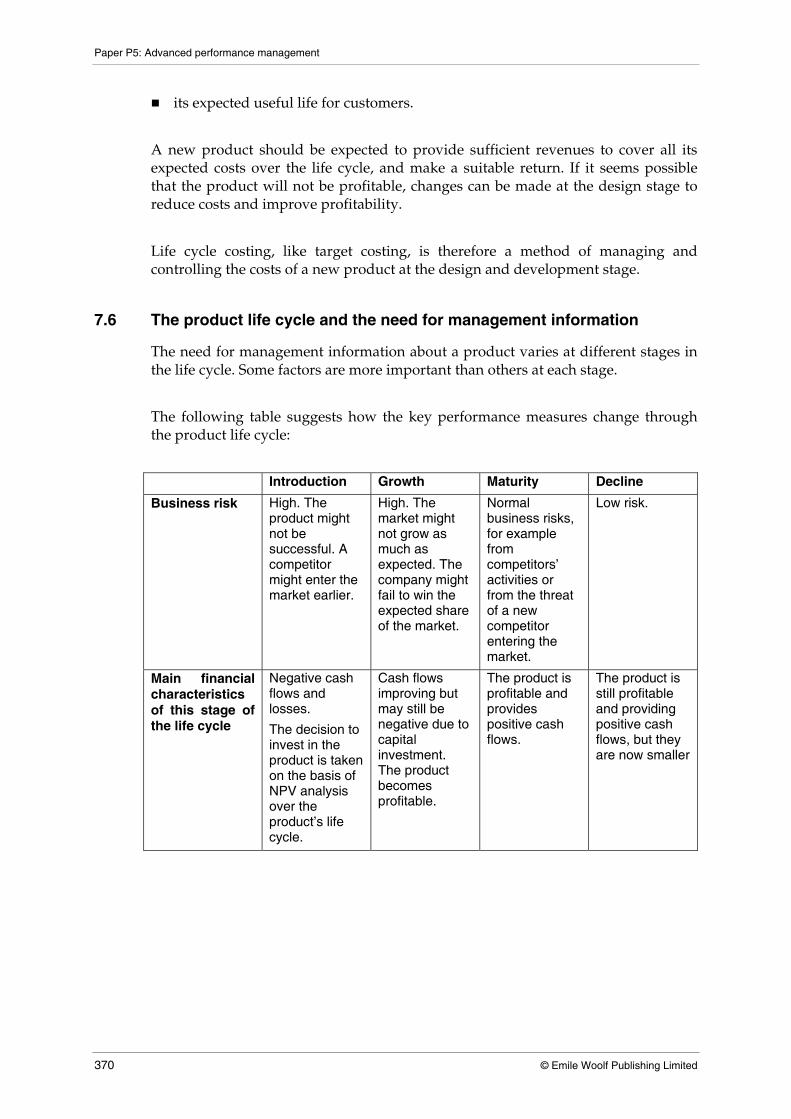
Paper P5: Advanced performance management
370 © Emile Woolf Publishing Limited
its expected useful life for customers.
A new product should be expected to provide sufficient revenues to cover all its expected costs over the life cycle, and make a suitable return. If it seems possible that the product will not be profitable, changes can be made at the design stage to reduce costs and improve profitability.
Life cycle costing, like target costing, is therefore a method of managing and controlling the costs of a new product at the design and development stage.
7.6 The product life cycle and the need for management information
The need for management information about a product varies at different stages in the life cycle. Some factors are more important than others at each stage.
The following table suggests how the key performance measures change through the product life cycle:
Introduction Growth Maturity Decline
Business risk High. The product might not be successful. A competitor might enter the market earlier.
High. The market might not grow as much as expected. The company might fail to win the expected share of the market.
Normal business risks, for example from competitors’ activities or from the threat of a new competitor entering the market.
Low risk.
Main financial characteristics of this stage of the life cycle
Negative cash flows and losses.
The decision to invest in the product is taken on the basis of NPV analysis over the product’s life cycle.
Cash flows improving but may still be negative due to capital investment. The product becomes profitable.
The product is profitable and provides positive cash flows.
The product is still profitable and providing positive cash flows, but they are now smaller
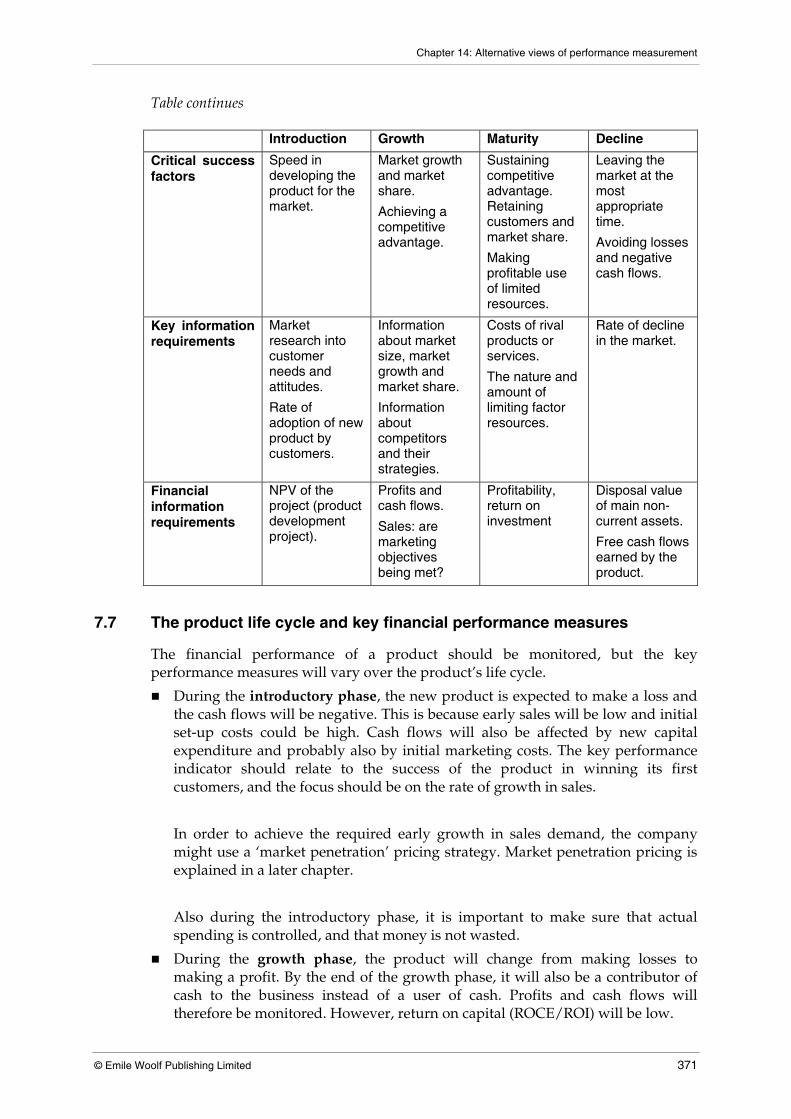
Chapter 14: Alternative views of performance measurement
© Emile Woolf Publishing Limited 371
Table continues Introduction Growth Maturity Decline
Critical success factors
Speed in developing the product for the market.
Market growth and market share.
Achieving a competitive advantage.
Sustaining competitive advantage. Retaining customers and market share.
Making profitable use of limited resources.
Leaving the market at the most appropriate time.
Avoiding losses and negative cash flows.
Key information requirements
Market research into customer needs and attitudes.
Rate of adoption of new product by customers.
Information about market size, market growth and market share.
Information about competitors and their strategies.
Costs of rival products or services.
The nature and amount of limiting factor resources.
Rate of decline in the market.
Financial information requirements
NPV of the project (product development project).
Profits and cash flows.
Sales: are marketing objectives being met?
Profitability, return on investment
Disposal value of main non-current assets.
Free cash flows earned by the product.
7.7 The product life cycle and key financial performance measures
The financial performance of a product should be monitored, but the key performance measures will vary over the product’s life cycle.
During the introductory phase, the new product is expected to make a loss and the cash flows will be negative. This is because early sales will be low and initial set-up costs could be high. Cash flows will also be affected by new capital expenditure and probably also by initial marketing costs. The key performance indicator should relate to the success of the product in winning its first customers, and the focus should be on the rate of growth in sales.
In order to achieve the required early growth in sales demand, the company might use a ‘market penetration’ pricing strategy. Market penetration pricing is explained in a later chapter.
Also during the introductory phase, it is important to make sure that actual spending is controlled, and that money is not wasted.
During the growth phase, the product will change from making losses to making a profit. By the end of the growth phase, it will also be a contributor of cash to the business instead of a user of cash. Profits and cash flows will therefore be monitored. However, return on capital (ROCE/ROI) will be low.

Paper P5: Advanced performance management
372 © Emile Woolf Publishing Limited
The rate of growth in sales remains important, and this will be monitored closely (in addition to the total market size and market share).
The company should also try to reduce average costs per unit as sales volumes increase. Costs should fall due to ‘economies of scale’ – for example because fixed costs can now be spread over a larger volume of output. Various improvements in efficiency should be achievable as sales volume grows.
During the maturity phase, the product will maximise its potential for making profits and contributing cash. The return on investment should be high. Profitability, ROI and cash flow are all significant performance indicators.
Another important factor is the length of this phase of the life cycle. An entity should want to maximise the length of time that the product remains profitable and a strong contributor of cash. The maturity phase might be extended, for example, by re-designing the product or by trying to sell the product to a new group of potential customers (for example, in a different geographical region). The company might also look for new distribution channels to continue the maturity phase of the product.
During the decline phase, the entity will probably continue to make and sell the product as long as it is contributing cash to the business. Profitability and cash flow are both important, even though sales are falling. The entity might use several financial measures to monitor performance, such as profit, EBITDA (earnings before interest, depreciation and amortisation), ROI and cash flow.
The key financial indicators are summarised in the following table.
Introduction phase
Growth phase Maturity phase Decline phase
Profit Not significant Important: how soon does the product become profitable?
Important Important
Cash flow Negative. Not significant
Important. How soon do cash flows stop being negative?
Important Important. When will they become negative? When should the product be abandoned?
ROI/residual income
Not significant Low. Not significant
Important Important

Chapter 14: Alternative views of performance measurement
© Emile Woolf Publishing Limited 373
Table continues Introduction
phase Growth phase Maturity phase Decline phase
Sales growth Important Important Less important. Sales growth should be low or possibly slightly negative
Not important
Other financial performance indicators
Control costs Average costs (economies of scale)
Customer retention/ sales to new customers
EBITDA
7.8 Strategic aspects of the product life cycle
From a strategic perspective, it is important to recognise that a company cannot survive in the long term without developing its products or services. Existing products eventually reach the end of their economic life. Measures can be taken to lengthen the remaining life of an existing product, but without innovation a business cannot survive in the long term. It should therefore be an objective for a company to have a portfolio of products or services: some of which are well-established and earning good profits and cash flows others which may be reaching the end of their economic life, but are still profitable and cash flow-positive others which are in the process of development, which will be successful eventually in the future. Some of today’s profits need to be invested in the future. Performance reporting systems need to recognise the strategic aspect of new product development, and the need to accept losses in the short term for benefits in the longer term. It is also necessary to monitor the performance of ‘ageing’ products that are reaching the end of their economic life, with a view to deciding when it is time to stop selling them.

Paper P5: Advanced performance management
374 © Emile Woolf Publishing Limited

© Emile Woolf Publishing Limited 375
Paper P5 Advanced performance management
CH
AP
TER
15
Developments in management accounting and performance
management
Contents
1 Management accountants as ‘change agents’: Burns and Scapens
2 Environmental management accounting
3 Performance management in the public sector

Paper P5: Advanced performance management
376 © Emile Woolf Publishing Limited
Management accountants as ‘change agents’: Burns and Scapens
Resistance to change in management accounting
Management accountants as agents of change
1 Management accountants as ‘change agents’: Burns and Scapens
This chapter describes a variety of developments in management accounting and performance management that are identified in the Study Guide for the examination syllabus.
1.1 Resistance to change in management accounting
Burns and Scapens (Conceptualising Management Accounting Change, 2000) have carried out research into resistance to change within organisations generally, and more particularly within management accounting practices. In many organisations, management accountants have been reluctant to adopt new techniques and methods. Resistance to change has three separate causes.
There may be formal and clearly-expressed resistance to change, due to a competing interest.
Resistance to change might be caused by an inability to cope with the change.
Resistance to change might also be caused by a ‘mental allegiance’ to established ways of thinking, and existing routines and institutions.
The arguments of Burns and Scapens are based on ‘institutional theory’. Institutions are ways of thinking and acting that make it difficult for individuals to consider change and the possibility that change might bring improvements. There are both formal and informal institutions.
Formal institutions are settled patterns of thought and actions. These are expressed in established formal rules and procedures.
Informal institutions are actions that people take because ‘things have always been done this way.’
Example The directors of a company wanted to introduce an Enterprise Resource Planning (ERP) system into the company, and instructed their key managers, including senior accountants, that the system had to be introduced. The managers resisted the implementation of the new system, and through their control over resources and systems were successful in making the project fail. The ERP system was abandoned.
Chapter 15: Developments in management accounting and performance management
© Emile Woolf Publishing Limited 377
Changes in routines and institutions can happen, but there will be much less resistance to change when the change can be accommodated within existing ways of thinking. Burns and Scapens argue that this is the reason why change in management accounting practices is often very slow. Existing management accounting systems are both formal and informal institutions that create resistance to change.
1.2 Management accountants as agents of change
Burns and Scapens argue, however, management accountants should be in a position to encourage change and act as ‘change agents’. This requires a different outlook and attitude.
Management accountants should recognise that most companies and other entities must accept change as inevitable. In order to survive and succeed in a changing environment, it is necessary to recognise changes when they occur.
Entities must change internally in order to respond to the changes in the business environment.
To help entities to change, management must be provided with relevant information.
Management accounting systems must therefore respond to change, and adapt so that they provide the required (relevant) information.

Paper P5: Advanced performance management
378 © Emile Woolf Publishing Limited
Environmental management accounting
The purpose of environmental management accounting
A framework for environmental management accounting
EMA techniques
2 Environmental management accounting
2.1 The purpose of environmental management accounting
For some companies, environmental issues are significant, in terms of both strategy and cost.
Poor environmental behaviour can result in significant costs or losses, such as fines for excessive pollution, environmental taxes, loss of land values, the cost of law suits, and so on.
Environmental behaviour can affect the perception of customers, and their attitudes to a company and its products. Increasingly, consumers take environmental factors into consideration when they make their buying decisions.
Environmental management accounting can be used to provide information to management to help with the management of environmental issues. Traditional management accounting techniques:
Under-estimate or even ignore the cost of poor environmental behaviour
over-estimate the costs of improving environmental practices, and
under-estimate the benefits of improving environmental practices.
Environmental management accounting (EMA) provides managers with financial and non-financial information to support their environmental management decision-making. EMA complements other ‘conventional’ management accounting methods, and does not replace them.
The main applications of EMA are for:
estimating annual environmental costs (for example, costs of waste control)
budgeting
product pricing
investment appraisal (for example, estimating clean-up costs at the end of a project life and assessing the environmental costs of a project)
estimating savings from environmental projects.

Chapter 15: Developments in management accounting and performance management
© Emile Woolf Publishing Limited 379
2.2 A framework for environmental management accounting
Burritt et al (2001) suggested a framework for EMA based on providing information to management:
from internal or external sources
as monetary or physical measurements
as historical or forward-looking information
where the focus is short-term or longer-term
that consists of routine reports or ad hoc information.

Four
of t
hese
ele
men
ts o
f EM
A a
re s
how
n in
the
follo
win
g ta
ble:
E
nvi
ron
men
tal m
anag
emen
t acc
oun
tin
g (E
MA
)
M
onet
ary
EM
A
Ph
ysic
al E
MA
S
hor
t-te
rm f
ocu
s L
ong-
term
foc
us
Sh
ort-
term
foc
us
Lon
g-te
rm f
ocu
s
His
tori
cal
orie
ntat
ion
Rou
tine
re
port
ing
Env
iron
men
tal c
ost
acco
unti
ng
Ana
lysi
s of
en
viro
nmen
tally
-in
duc
ed c
apit
al
expe
ndit
ures
Mat
eria
l and
en
ergy
flow
ac
coun
ting
Acc
ount
ing
for
envi
ronm
enta
l ca
pita
l im
pact
s
Ad
hoc
(one
-of
f)
info
rmat
ion
His
tori
cal
asse
ssm
ent o
f en
viro
nmen
tal
dec
isio
ns
Env
iron
men
tal
life
cycl
e co
stin
g,
envi
ronm
enta
l ta
rget
cos
ting
His
tori
cal
asse
ssm
ent o
f sh
ort-
term
en
viro
nmen
tal
impa
cts,
e.g
. of a
si
te o
r pr
oduc
t
Pos
t-in
vest
men
t as
sess
men
t of
envi
ronm
enta
l im
pact
s of
cap
ital
ex
pend
itur
es
Futu
re
orie
ntat
ion
Rou
tine
re
port
ing
Env
iron
men
tal
oper
atio
nal b
udge
ts
and
cap
ital
bud
gets
(m
onet
ary
repo
rtin
g)
Env
iron
men
tal
long
-ter
m
fina
ncia
l pl
anni
ng
E
nvir
onm
enta
l lo
ng-t
erm
phy
sica
l pl
anni
ng
Ad
hoc
(one
-of
f)
info
rmat
ion
Rel
evan
t en
viro
nmen
tal
cost
ing
(e.g
. spe
cial
or
der
s)
Env
iron
men
tal
life
cycl
e bu
dge
ting
and
ta
rget
cos
ting
Ass
essm
ent o
f en
viro
nmen
tal
impa
cts
Phys
ical
en
viro
nmen
tal
inve
stm
ent
appr
aisa
l. Sp
ecif
ic
proj
ect l
ife
cycl
e an
alys
is
Paper P5: Advanced performance management
380 © Emile Woolf Publishing Limited

Chapter 15: Developments in management accounting and performance management
© Emile Woolf Publishing Limited 381
2.3 EMA techniques
Environmental management accounting techniques include:
re-defining costs
input-output analysis
environmental activity based accounting
environmental life cycle costing
Re-defining costs
The US Environmental Protection Agency (1998) suggested terminology for environmental costing that distinguishes between:
conventional costs: these are environmental costs of materials and energy that have environmental relevance and that can be ‘captured’ in costing systems
potentially hidden costs: these are environmental costs that might get lost within the general heading of ‘overheads’
contingent costs: these are costs that might be incurred at a future date, such as clean-up costs
image and relationship costs: these are costs associated with promoting an environmental image, such as the cost of producing environmental reports. There are also costs of behaving in an environmentally irresponsible way, such as the costs of lost sales as a result of causing a major environmental disaster.
In traditional management accounting systems, environmental costs (and benefits) are often hidden. EMA attempts to identify these costs and bring them to the attention of management.
Input-output analysis
Input-output analysis is a method of analysing what goes into a process and what comes out. It is based on the concept that what goes into a process must come out or be stored. Any difference is residual, which is regarded as waste. Inputs and outputs are measured initially in physical quantities, including quantities of energy and water. They are then given a monetary value.
Inputs 100%
Output product 60%
Scrap sold for re-cycling 20% Disposed of as waste 15% Unaccounted for 5%
Environmental activity based accounting
Environmental activity based accounting is the application of environmental costs to activity based accounting. A distinction is made between:

P5: Advanced performance management
382 © Emile Woolf Publishing Limited
environmental-related costs: these are costs that are attributable to cost centres involved in environmental-related activities, such as an incinerator or a waste recycling plant
environmental-driven costs: these are overhead costs resulting from environment-related factors, such as higher costs of labour or depreciation.
The cost drivers for environment-related costs may be:
the volume of emissions or waste
the toxicity of emissions or waste
‘environmental impact added’ (units multiplied by environmental impact per unit)
the volume of emissions or waste treated.
Environmental life cycle costing
Life cycle costing is a method of costing that looks at the costs of a product over its entire life cycle. Life cycle costing can help a company to establish how costs are likely to change as a product goes through the stages of its life (introduction, growth, maturity, decline and withdrawal from the market). This analysis of costs should include environmental costs. Xerox provides a good example of the environmental aspect of life cycle costing. Xerox manufactures photocopiers, which it leases rather than sells. At the end of a lease period, the photocopiers are returned from the customer to Xerox. At one time, photocopiers were delivered to customers in packaging that could not be re-used for sending the machines back at the end of the lease period. Customers disposed of the old packaging and had to provide their own new packaging to return the machines to Xerox. Xerox then disposed of this packaging. The company therefore incurred two costs: the cost of packaging to deliver machines and the cost of disposal of the packaging for returned machines. By looking at the costs of photocopiers over their full life cycle, Xerox found that money could be saved by manufacturing standard re-usable packaging. The same packaging could be used to deliver and return machines, and could also be re-used. At the same time, the company created benefits for the environment by reducing disposals of packaging materials.

Chapter 15: Developments in management accounting and performance management
© Emile Woolf Publishing Limited 383
Environmental management accounting
The purpose of environmental management accounting
A framework for environmental management accounting
EMA techniques
3 Performance management in the public sector
3.1 Public sector portfolio matrix
The public sector portfolio matrix is a portfolio selection model for public sector services, which can be used by individual public sector entities to choose the projects in which they should invest their available funds. It is a 2 × 2 matrix.
One axis shows the organisation’s ability to serve the public effectively. A high ability to serve effectively means that it is well-funded at the moment.
The second axis looks at political attractiveness in terms of whether or not the service can gain public support and so whether it should attract funding in the future.
The matrix produces four types of public sector service. Ability to serve effectively/
current funding
Public need and support and attractiveness for future funding
High Low
High
Public sector star
Political hot box
Low
Golden fleece
Back drawer issue
Public sector stars perform well and are likely to well-funded at the moment.
They are also attractive to the public and meet a strong public need. Public sector services in this segment should attract more funding in the future. However, it can be difficult to find examples for this segment, if only because members of the public often have very different experiences of public services and would disagree about how well they perform.
Political hot boxes are very popular but deliver a service that is perceived as poor. They are probably services that are too new and inadequately resourced to be delivered effectively. These services are similar to question marks in the BCG matrix. A strategic decision has to be taken about whether more funding should be given to them in the future. Some national health services might be perceived to fall into this category.
Golden fleece services are well-resourced and are being delivered effectively. However, they are no longer meeting a strong public need. They are likely to be

P5: Advanced performance management
384 © Emile Woolf Publishing Limited
viewed as over-staffed and a drain on the public funds, and could be at risk of budget cuts in the future.
Back drawer services have a low priority with the public, have no political support and are not delivered effectively, possibly because of poor funding. If possible they should be abandoned.
An obvious weakness to this portfolio model is that the assessment of ‘meeting the needs of the public’ could be subjective. How is a distinction made between services that appear to meet a public need and those that do not? The public need cannot be measured reliably by public opinion, because public opinion is changeable.
Another weakness is that effectiveness in delivering the service often depends on the level of public funding that the service is given. A more effective service is likely when funding is adequate. The only difference between a public sector star and a political hot box might therefore be the current level of funding and its implications for the effectiveness of the service.
3.2 Targets and league tables
Successive governments in the UK have tried to improve the productivity of the public sector through the introduction of “market mechanisms”.
This is based on the belief that the introduction of market based competition will:
facilitate ‘choice’ the users of services,
encourage public sector providers to compete for ‘customers’ and
facilitate the opening up of public sector services to competition from private sector companies.
A feature of these government initiatives has been the setting of performance targets against which public sector organisations are assessed and the publication of performance information reported in performance league tables. The increasingly widespread use of league tables across the public sector has been identified both as an important means of promoting accountability but also as a cause for concern.
Specific criticisms
The system is fundamentally flawed.
There are those who work in public sector organisations (or represent those that do) who are directly opposed to such methodologies often citing some of the criticisms listed below.
For example, a schoolteachers’ union say on their website “The tables feed a culture of focusing on the alleged failures of the system rather than the significant achievements of pupils and teachers…. which are secured despite the league tables, not because of them. …..we believe that they are neither relevant nor effective and should be abolished”.
The performance measures are flawed and arbitrary and can change with political climate.

Chapter 15: Developments in management accounting and performance management
© Emile Woolf Publishing Limited 385
It is difficult to measure the output of the public sector.
Sometimes it appears that this is not the case. For example a government might set a target that 75% of pupils in all schools should achieve grades A to C. However, this poses the question of why 75%? Why not 75% or 80%?
The performance measures and targets focus on efficiency rather than the quality of public services;
A report on performance of the health service in the UK published by the Office of National Statistics stated “These (productivity) estimates should be interpreted with care. The output figures are based on a subset of activities in the English NHS and do not include changes in the quality of NHS output”.
Performance might be affected by factors outside of the control of those being held responsible.
When a table is published users assume that the position on the table is due to relative performance by the organisations. This may not be a fair view.
For example, schools in the England are ranked according to exam success but take no account of the cachement area served by the schools. It may not be fair to compare a private fee paying school with small class sizes to a state school in a poor area.
The wider reporting of performance to the end user (the public) is through the media who lack the knowledge (and perhaps inclination) to interpret the statistics in a fair and even manner.
Very few members of the public read the data for themselves. Exposure to it generally comes from politicians making statements about it in the media. Politicians will of course have bias depending on whether or not it was their party who is running things.
The media have an interest in selling a story rather than necessarily reporting the dry facts.

P5: Advanced performance management
386 © Emile Woolf Publishing Limited

© Emile Woolf Publishing Limited 387
Paper P5 Advanced performance management
AP
PE
ND
IX
1
Revision: ABC and other accounting methods
Contents
1 Revision of selected management accounting topics
2 Activity based costing (ABC)
3 Throughput accounting
4 Backflush accounting

Paper P5: Advanced performance management
388 © Emile Woolf Publishing Limited
Revision of selected management accounting topics
Management accounting techniques and the P5 examination
Revision topics
1 Revision of selected management accounting topics
1.1 Management accounting techniques and the P5 examination
The syllabus for Advanced Performance Management is concerned with the strategic role of management accounting systems in providing management with information for planning and controlling the performance of an entity. It covers the strategic relevance of management accounting at a ‘high’ level of management and also performance measurement systems at an operational level. In your examination, you may be required to comment on the relevance of some management accounting techniques, and the value of the information they provide in particular circumstances. For a variety of reasons, some ‘traditional’ management accounting techniques, such as absorption costing, budgeting and standard costing have all been criticised. These techniques may not be appropriate methods of providing information to management in a business environment where conditions are continually changing. In your examination, you might also be asked to apply some management accounting techniques that are useful, or that might be useful in particular circumstances. You should be familiar with these techniques from your previous studies. However, it is important that you should understand these techniques and why they are used. You should also be able to use the techniques and apply them, because they might be included in an examination question.
1.2 Revision topics
Some important techniques will be described later in this text. However, you should already be familiar with the following accounting methods and techniques:
Activity based costing (ABC)
Throughput accounting
Backflush accounting
Relevant costs for decision-making
Capital investment appraisal techniques, in particular the NPV method of DCF analysis
The analysis of risk and uncertainty.
These methods and techniques are described in this chapter and the chapters that follow.

Appendix 1: Revision: ABC and other accounting methods
© Emile Woolf Publishing Limited 389
Activity based costing (ABC)
Activity based costing, overhead costs and cost drivers
When using ABC might be appropriate
ABC and the cost of processes
The measurement of costs with ABC
ABC and traditional absorption costing
ABC and costing at different levels
Using ABC information
Advantages and limitations of ABC
2 Activity based costing (ABC)
2.1 Activity based costing, overhead costs and cost drivers
Activity based costing (ABC) is a form of absorption costing. However, it differs from traditional absorption costing, in which production overhead costs are traced to production departments and production activities, and absorbed at a direct labour hour rate. Instead of tracing production overhead costs to departments (functions) and then to products, ABC traces overhead costs to activities and then to products or customers. ABC can be used to:
measure product costs
measure the costs (and so the profitability) of customers
assess the value created by specific activities or processes (activity based management)
Activity based costing is based on the following assumptions:
In a modern manufacturing environment, a large proportion of total costs consists of overhead costs, and direct labour costs are relatively small.
Because overhead costs are large, it is appropriate to trace these costs as accurately as possible to the products that create the cost.
Since direct labour is a fairly small element of cost, it is inappropriate to trace production overhead costs to products by absorbing overheads at a rate per direct labour hour.
Further assumptions are that:
Many overhead costs are attributable to activities, such as customer order handling or product warehousing and despatch. These activities are not necessarily confined to single functional departments within the organisation.
The costs of each of these activities are driven by one or more factors, called cost drivers. The cost driver for an activity is not necessarily production volume. For

Paper P5: Advanced performance management
390 © Emile Woolf Publishing Limited
example, the cost driver for order-handling costs might be the number of orders, not the quantity of items in each order.
Overhead costs are therefore caused by activities, and the costs of activities are driven by factors other than production volume.
ABC is a system of costing that attempts to:
Identify the activities that create (overhead) costs
Identify the cost driver or cost drivers for each of these activities
Charge overheads to products on the basis of the activities that are required to provide the product: each product should be charged with a fair share of overhead cost, that represents the activities that go into making and selling it.
There is also an argument that in the long run, all overhead costs are variable (even though they are fixed in the short term). Measuring costs with ABC might therefore provide management with useful information for controlling activities and long-term costs.
2.2 When using ABC might be appropriate
There are several reasons why traditional absorption costing and marginal costing systems might be considered inadequate, and an activity based costing system much more appropriate.
Overhead costs are now a very large proportion of total costs, in manufacturing as well as service industries. Since overhead costs are such a large part of total costs, marginal costing provides only limited information for management, because it does not analyse fixed overhead costs.
Traditional absorption costing assumes that production overhead costs are ‘driven’ by production activity, and direct labour hours or machine hours worked. In many industries, this is not the case.
In highly competitive markets, management need much more than information merely about the profitability of products. They need to know about the profitability of particular markets, or distribution channels, and the profitability of different categories of customer. By relating costs to activities, ABC can be used to provide information about market profitability, channel profitability and customer profitability.
Activity based costing is a form of costing in which overheads are traced to each activity, and absorbed at a rate for each activity rather than a rate per direct labour hour. It is likely to be suitable as a method of costing in the following circumstances:
In a manufacturing environment, where absorption costing is required for inventory valuations.
Where a large proportion of production costs are overhead costs, and direct labour costs are relatively small.
Where products are complex.
Where products are provided to customer specifications.

Appendix 1: Revision: ABC and other accounting methods
© Emile Woolf Publishing Limited 391
Where order sizes differ substantially, and order handling and despatch activity costs are significant.
In addition, it might be possible to identify, for each activity, variable costs and fixed costs, and controllable and non-controllable costs. This will provide information to assist managers with the control of the costs of these activities.
ABC and customer profitability
As indicated earlier, activity based costing can also be used to analyse the costs of customers as well as products, and ABC can be used to assess:
the costs and profitability of different types of customer
the costs and profitability of different methods of selling (different channels of distribution).
ABC and Activity-Based Management
An ABC system of costing is essential for an activity based management approach to improving systems and processes.
2.3 ABC and the cost of processes
Processes deliver satisfaction to the customer, not departments. The approach in ABC is to identify key processes (activities), and the factors that ‘drive’ the costs of those processes (activities). This is different from measuring costs of the work done by each department.
Example A company has a customer services department, which is responsible for dealing with customers.
The main activities performed by the department include:
preparing price quotations
receiving orders from customers
confirming orders after the finance department has checked the customer’s credit
expediting orders (‘progress chasing’)
dealing with customer queries and complaints.
Although the customer relations department is responsible for dealing with the customer, most of these activities are performed in association with staff from other departments.
To prepare price quotations for customers, staff in the customer services department need to work closely with the sales staff and engineering staff.
To confirm orders after credit checks, staff in the customer services department must work closely with the finance department.

Paper P5: Advanced performance management
392 © Emile Woolf Publishing Limited
To expedite orders, customer services staff must work closely with staff in the production and distribution departments.
Dealing with customer complaints also involves other departments – sales, engineering, finance or production, depending on the nature of the complaint or query.
In an activity based costing system, if these five activities are identified as major activities within the company, costs should be identified for each activity separately. The costs will include not only the costs incurred in the customer services departments, but also significant costs incurred in the other departments. ABC crosses departmental boundaries.
2.4 The measurement of costs with ABC
To measure costs with ABC, the basic approach is a five-stage process:
(1) Identify the main activities or processes within an organisation that appear to be the reason for expenditures.
(2) Identify a cost driver for each activity.
(3) Create cost pools, for collecting costs that have the same cost driver.
(4) Measure the volume or incidence of the cost driver for each activity, and calculate an attribution rate (allocation rate or apportionment rate) for the activity costs. This is a rate per unit of cost driver.
(5) Attribute the costs from each pool to products, markets, channels of distribution or customers, based on their use of the cost drivers and using the attribution rate for each activity.
Pooled costs can be attributed directly to products. This contrasts with traditional absorption costing techniques, where production overhead costs are initially attributed to ‘service departments’ and then re-attributed from service centres to production departments and then individual products.
Example A manufacturing company has identified that a large part of its overhead costs are incurred in handling customer orders, and that the same effort goes into handling a small order as the effort required to deal with a large order. Order sizes differ substantially. The company makes four products, and the estimated costs of order handling are $250,000 per year. The company uses ABC, and wants to establish an order-handling overhead cost for each product, based on the following budget:
Product Number of orders Total number of units ordered
W 15 60,000
X 22 33,000
Y 4 40,000
Z 9 27,000
50 160,000

Appendix 1: Revision: ABC and other accounting methods
© Emile Woolf Publishing Limited 393
If the cost driver for order handling is the number of orders handled, the budgeted order handling cost will be $240,000/50 = $5,000 per order. Overhead costs will be charged to products as follows:
Product
Number of orders
Cost
$
W 15 75,000
X 22 110,000
Y 4 20,000
Z 9 45,000
50 250,000
2.5 ABC and traditional absorption costing
Although ABC is a form of absorption costing, the effect of ABC could be to allocate overheads in a completely different way between products. Product costs and product profitability will therefore be very different with ABC compared with traditional absorption costing.
Example Entity Blue makes and sells two products; X and Y. Data for production and sales each month are as follows: Sales demand 4,000 units 8,000 units Direct material cost/unit $20 $10 Direct labour hours/unit 0.1 hour 0.2 hours Direct labour cost/unit $2 $4 Production overheads are $500,000 each month. These are absorbed on a direct labour hour basis. The overhead absorption rate is $250 per direct labour hour. An analysis of overhead costs suggests that there are four main activities that cause overhead expenditure.
Activity Total cost Cost driver Total number Product X Product Y
$
Batch set-up 100,000 Number of set-ups 20 10 10
Order handling 200,000 Number of orders 40 24 16
Machining 120,000 Machine hours 15,000 6,000 9,000
Quality control 80,000 Number of checks 32 18 14
500,000
Required
Calculate the full production costs for Product X and Product Y, using:
(a) traditional absorption costing
(b) Activity based costing.
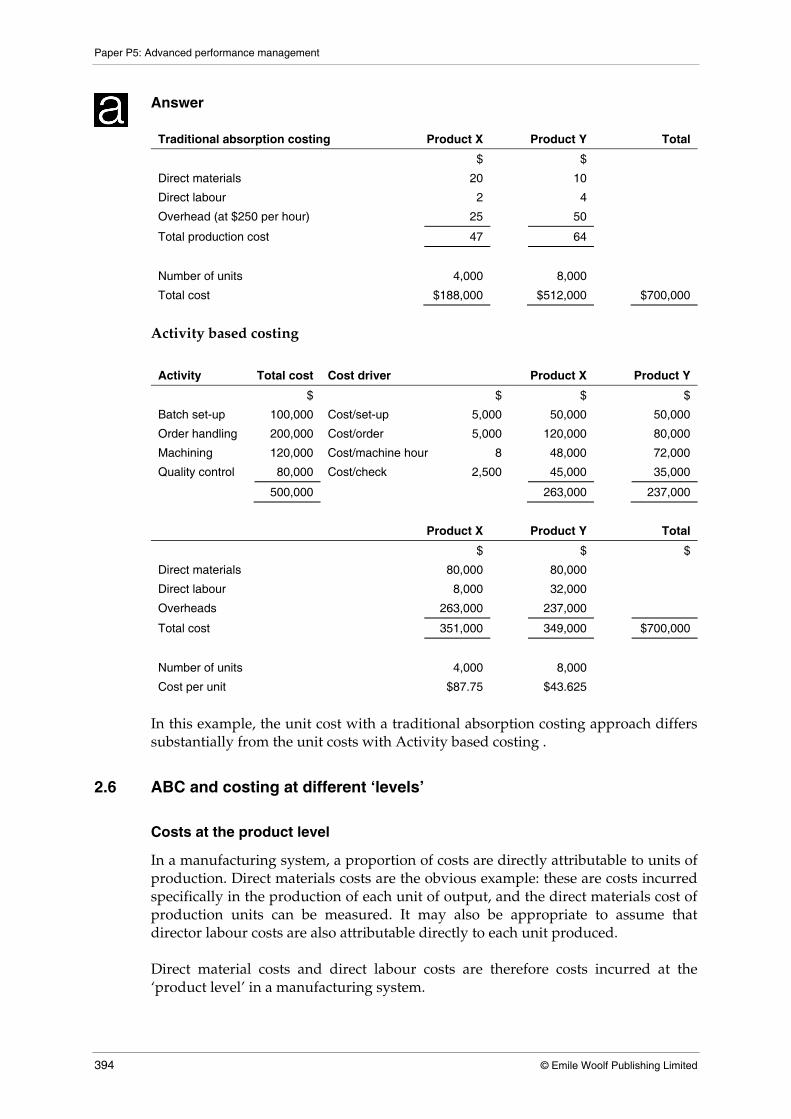
Paper P5: Advanced performance management
394 © Emile Woolf Publishing Limited
Answer
Traditional absorption costing Product X Product Y Total
$ $
Direct materials 20 10
Direct labour 2 4
Overhead (at $250 per hour) 25 50
Total production cost 47 64
Number of units 4,000 8,000
Total cost $188,000 $512,000 $700,000
Activity based costing
Activity Total cost Cost driver Product X Product Y
$ $ $ $
Batch set-up 100,000 Cost/set-up 5,000 50,000 50,000
Order handling 200,000 Cost/order 5,000 120,000 80,000
Machining 120,000 Cost/machine hour 8 48,000 72,000
Quality control 80,000 Cost/check 2,500 45,000 35,000
500,000 263,000 237,000
Product X Product Y Total
$ $ $
Direct materials 80,000 80,000
Direct labour 8,000 32,000
Overheads 263,000 237,000
Total cost 351,000 349,000 $700,000
Number of units 4,000 8,000
Cost per unit $87.75 $43.625
In this example, the unit cost with a traditional absorption costing approach differs substantially from the unit costs with Activity based costing .
2.6 ABC and costing at different ‘levels’
Costs at the product level
In a manufacturing system, a proportion of costs are directly attributable to units of production. Direct materials costs are the obvious example: these are costs incurred specifically in the production of each unit of output, and the direct materials cost of production units can be measured. It may also be appropriate to assume that director labour costs are also attributable directly to each unit produced. Direct material costs and direct labour costs are therefore costs incurred at the ‘product level’ in a manufacturing system.

Appendix 1: Revision: ABC and other accounting methods
© Emile Woolf Publishing Limited 395
Costs at the batch level
When output is produced in batches, some activities (and their costs) can be attributed to each batch of output that is produced. For example, the following activities may incur substantial costs:
Production scheduling
Set-up costs and cleaning costs.
The driver for each of these activities may be the number of batches produced. Fore ach batch produced, there will be set-up and cleaning costs. It may also be the case that the number of batches produced is the main driver for production scheduling costs. If this is so, costs can be measured for production scheduling and set-up costs, and attributed to batches of production. These would therefore be costs incurred at the ‘batch level’ in a manufacturing system.
Costs at the order level
In the same manufacturing system, other activities may incur significant costs, and the main driver for these costs may be the number of sales orders. For example, the following production/administration costs may be found to have the number of sales orders as their main driver:
Sales order expediting
Material purchasing
Engineering support
If this is so, costs can be measured for these activities, and allocated to sales orders, within an ABC system. These would be costs incurred at the ‘order level’ in the system. Within an ABC system, it may therefore be appropriate to measure costs at each of several different levels:
Direct costs of product units (unit level)
Batch costs allocated at an absorption rate per batch
Order costs allocated at an absorption rate per order
Allocation of general factory-wide overhead costs.
2.7 Using ABC information
ABC information can be used in a variety of ways. Applied to overhead costs, it provides information that could be of value for decision-making and better cost management.
Product costing and decision-making
ABC can provide a useful understanding of cost behaviour that is more meaningful than a simple division of costs into fixed and variable costs.

Paper P5: Advanced performance management
396 © Emile Woolf Publishing Limited
It can often be assumed that many activity-based costs may be fixed in the short term, but are variable in the longer term.
More activity-related costs are variable at the product-sustaining level than at the product or batch level. (The product-sustaining level is concerned with issues such as: ‘should we continue to make this product or should we discontinue production?’)
Even more activity-related costs are variable at the facility-sustaining level than at the product-sustaining level. (The facility-sustaining level is concerned with issues such as: ‘should we shut down this production plant or distribution centre?)
As indicated earlier, activity-related costs can be attributed to markets, channels of distribution and customers, giving management more information with which to make their decisions.
Drivers of cost
ABC gives management more information about the activities that drive costs. Activities can be grouped into three categories:
Core activities. These are activities that are the reason for the entity’s existence and that are related to its critical success factors. These activities add value directly. Costs of these activities should be kept low, but not at the risk of failing to achieve objectives.
Support activities. These are activities that enable core activities to be accomplished, and so are indirectly value-adding. The focus for management should be on performing these activities efficiently, and obtaining value for money. Is the activity worth the cost of delivering, and if so at what level or volume? How often does the activity need to be performed?
Diversionary activities. These are activities caused by inadequate performance, such as the correction of errors. Diversionary activities do not add value. Management should try to minimise these activities, and reduce their costs.
Cost control and cost reduction
Activity based costing can also provide management with useful information about how costs might be cut, especially where a large proportion of the costs consist of fixed salaries paid to employees. The table below shows two methods of presenting the costs of an administration in a university. Traditional costing ABC
$000 $000
Salaries 225,000 Enrolling students 176,000
Depreciation 14,000 Input of examination marks 3,000
Materials 3,000 Preparing timetables 4,000
Other operating costs 21,000 Dealing with student queries 80,000
General expenses 6,000 General expenses 6,000
269,000 269,000
Appendix 1: Revision: ABC and other accounting methods
© Emile Woolf Publishing Limited 397
The ABC format of cost reporting suggests that most resources are used in enrolling students and answering student queries. If management want to reduce costs, these are the activities where cost savings are most likely to be achieved. In contrast, the traditional costing report does not provide information that is useful for the control of costs.
2.8 Advantages and limitations of ABC
Using ABC can have advantages and disadvantages.
Advantages
ABC provides useful information about the activities that drive overhead costs. Traditional absorption costing and marginal costing do not do this.
ABC therefore provides information that could be relevant to long-term cost control and long-term product selection or product pricing.
ABC can provide the basis for a management information system to manage and control overhead costs.
It might be argued that full product costs obtained with ABC are more ‘realistic’; although it can also be argued that full product cost information is actually of little practical use or meaning for management.
ABC might be useful for pricing products, where product pricing is on a cost-plus basis.
Product cost and product profit information with ABC is possibly more useful than costs and profits based on traditional absorption costing.
Problems with the introduction of a system of ABC
If an entity does not yet have a system of ABC in place, there may be problems with the implementation of an activity-based costing system.
In a complex manufacturing operation, there may be a large number of activities that create costs and several different cost drivers for each of these activities. There is a risk that an ABC system may therefore be either too complex to use easily or over-simplified and so unreliable.
To implement an ABC system it is necessary to introduce a system for the collection and analysis of cost data and activity data. This can be a time-consuming task, because the existing costing system will not have the necessary coding and analysis systems for ABC.
The successful implementation of a system of ABC depends on the full commitment of management to the new system. There may be resistance by managers to a change in systems, who feel that the effort of introducing the new system will not be worth the time and effort involved.

Paper P5: Advanced performance management
398 © Emile Woolf Publishing Limited
Limitations
Activity based costing has several other limitations.
The analysis of costs in an ABC system may be based on unreliable data and weak assumptions. In particular, ABC systems may be based on inappropriate activities and cost pools, and incorrect assumptions about cost drivers.
ABC provides an analysis of historical costs. Decision-making by management should be based on expectations of future cash flows. It is incorrect to assume that there is a causal relationship between a cost diver and an activity cost, so that increasing or reducing the activity will result in higher or lower activity costs.
In some cases, ABC may be little more than a sophisticated absorption costing system.
Within ABC systems, there is still a large amount of overhead cost apportionment. General overhead costs such as rental costs, insurance costs and heating and lighting costs may be apportioned between cost pools. This reduces the causal link between the cost driver and the activity cost.
Many ABC systems are based on just a small number of cost pools and cost drivers. More complex systems are difficult to justify, on grounds of cost.
Many activities and cost pools have more than one cost driver. Identifying the most suitable cost driver for a cost pool/activity is often difficult.
Traditional cost accounting systems may be more appropriate for the purpose of inventory valuation and financial reporting.
It might be a costly system to design and use. The costs might not justify the benefits. It must be remembered that full product costing is of little relevance for management decision-making.
The main advantages and disadvantages of ABC are summarised in the table below.
Advantages Disadvantages Gives management a better understanding of how resources are consumed by overhead activities.
Focuses management attention on an important area of costs.
Can provide information for the control of activity/overhead costs.
Can provide information to assist with budgeting activity costs/overhead costs (activity based budgeting).
Can provide information to assist with activity based management.
There might be doubts about the quality of the information provided by ABC:
How are the major activities identified?
How are overhead costs allocated to cost pools?
How are cost drivers identified?
What if there are two or more cost drivers for the same activity?
Setting up an ABC system might be expensive. Will it provide sufficient value to justify the cost?

Appendix 1: Revision: ABC and other accounting methods
© Emile Woolf Publishing Limited 399
Throughput accounting
Optimised production technology (OPT) and the Theory of Constraints.
Assumptions in throughput accounting
Throughput, inventory and operating expenses
Profit and throughput accounting
The value of inventory in throughput accounting
Throughput accounting and the Theory of Constraints
Throughput accounting ratio
3 Throughput accounting
3.1 Optimised Production Technology (OPT) and the Theory of Constraints
Throughput accounting is a method of accounting associated with Optimised production technology and the Theory of Constraints. Optimised Production Technology or OPT is a computer system for production planning and capacity management. OPT computer systems were developed in the 1980s by Eli Goldratt and are based on his Theory of Constraints. The Theory of Constraints is based on the view that in a manufacturing system, the capacity of the system is limited (constrained) by one or more bottlenecks in the system. The production volume is restricted by these ‘limiting factors’ or bottlenecks. Production output will be optimised by focusing on the constraints that restrict production activity. By removing the constraint, or making the constraint less restricting, the ability of the system to produce more will be increased. The key constraint may be sales, in which case the entity needs to produce just enough output to meet sales demand. However, the key constraint that creates the ‘bottleneck’ in production is something different.
It may be a shortage of a particular resource, such as time on a particular type of machine or available skilled labour.
It may be inefficiency in production, with stoppages and hold-ups caused by wastage, scrapped items and machine down-time.
It may be unreliability in the supplies of key raw materials, and a shortage of key materials.
The key resource might even be intangible, such as management competence.
To optimise output, management should focus on the key constraint and try to remove it. When one key constraint is removed, there will be another key constraint to take its place, but total output capability will have increased. Until the key constraint is removed (for example, by obtaining more machines so more labour, or using

Paper P5: Advanced performance management
400 © Emile Woolf Publishing Limited
machines or labour more efficiently), management should try to optimise output within the limitations of the constraint. To optimise production, management should therefore continually identify and remove constraints in order to raise output capacity.
The Theory of Constraints and inventory
Another aspect of OPT and the Theory of Constraints is that holding inventory is considered wasteful. Inventories do not add any value. Value is created only when finished goods inventory is sold.
If a production system could produce output just in time to meet the sales demand from customers, the finished output would be sold immediately, as soon as it is produced. There would be no need for inventories of finished goods.
Similarly, if a production system could acquire raw materials and components just in time to meet the need to use the materials in production, there would be no need for inventories of materials.
Inventory can sometimes hide bottlenecks in production, by providing ‘buffer stock’. However, if there were no bottlenecks in production, and output could be produced immediately to meet customer demand, inventory would have no purpose. Inventory may therefore hide inefficiencies in production that management should be trying to eliminate.
The aim should therefore be to eliminate inventory.
An OPT computer system schedules production in a way that produces the maximum output possible within the limitations imposed by the existing key constraint. Eli Goldratt referred to ‘throughput’ rather than production output, and there is a close connection between Goldratt’s Theory of Constraints and throughput accounting.
Concepts in OPT
It is useful to understand some of the main concepts in OPT.
A bottleneck or key constraint limits production capacity for the entire production system.
Losing time in a bottleneck activity means time lost – and output lost – for the entire production system.
However, saving time in a non-bottleneck activity is a wasted effort, because it has no effect on output.
There is no reason to produce items faster than a bottleneck activity can use them. Producing items at a faster rate than they can be used simply means that inventories will increase.
Inventories are wasteful and expensive. They add no value.
The process batch sizes should be variable, to optimise throughput, and should not be a fixed or standard size.

Appendix 1: Revision: ABC and other accounting methods
© Emile Woolf Publishing Limited 401
3.2 Assumptions in throughput accounting
Throughput accounting is associated with the Theory of Constraints. It is also based on the view that the only variable cost in operations is the cost of materials bought from external suppliers. All other operating expenses, including all labour costs, should be treated as fixed costs.
In traditional marginal costing, it is assumed that direct labour costs are a variable cost, but in practice this is not usually correct. Employees are paid a fixed weekly or monthly wage or salary, and labour costs are a fixed cost.
The only variable cost is the purchase cost of materials and components purchased from external suppliers.
A business makes real profit by adding value. Value is added by selling goods or services to customers whose market value is more than the cost of the materials that go into making them. However, value is not added until the sale is actually made.
Value added should be measured as the value of the sale minus variable cost, which is the cost of the materials.
3.3 Throughput, inventory and operating expenses
Throughput accounting is therefore based on three concepts:
throughput
inventory (investment) and
operating expenses.
Throughput
Throughput is ‘term defined, in work by Goldratt, as sales minus material and component costs. Similar to contribution except material is considered the only variable cost. Goldratt argues that labour costs should be treated as fixed. In Goldrattʹs analysis operating expense is all non‐material costs and inventory cost is defined as the costs of assets employed. (CIMA Official Terminology, 2005 ed.). Value is added by creating throughput. The value of throughput can be measured as follows:
Throughput = Sales minus Variable costs Throughput is not created until a sale occurs. Throughput differs from contribution in traditional marginal costing because variable costs consist only of real variable costs, which are (mainly) materials costs. It is therefore appropriate to define throughput as:
Throughput = Sales minus Cost of raw materials and components

Paper P5: Advanced performance management
402 © Emile Woolf Publishing Limited
Inventory (or investment)
Inventory or investment is all the money that is tied up in a business, in inventories of raw materials, WIP and finished goods. Inventory is eventually converted into throughput.
Operating expenses
All expenses other than raw materials and components costs should be treated as ‘operating expenses’. Operating expenses are all the expenditures incurred to produce the throughput. They consist of all costs that are not variable costs, and so include labour costs.
3.4 Profit and throughput accounting
Profit in throughput accounting is measured as throughput minus operating expenses.
Example
$
Sales 800,000 Raw materials and components costs 350,000 Throughput 450,000 Operating expenses 340,000 Net profit 110,000
A feature of throughput accounting that makes it different from other methods of costing, such as absorption costing and marginal costing, is that operating expenses are not charged to products. The throughput from individual products is measured, but nothing else except net profit.
3.5 The value of inventory in throughput accounting
Inventories do not have value, except the variable cost of the materials and components. Even for work in progress and inventories of finished goods, the only money invested is the purchase cost of the raw materials. No value is added until the inventory is sold. In throughput accounting, all inventory is therefore valued at the cost of its raw materials and components, and nothing more. It should not include any other costs, not even labour costs. No value is added by the production process, not even by labour, until the item is sold. It is impossible to make extra profit simply by producing more output, unless the extra output is sold.

Appendix 1: Revision: ABC and other accounting methods
© Emile Woolf Publishing Limited 403
Throughput accounting and marginal costing
Throughput accounting has close similarities with marginal costing, because ‘throughput’ is similar in concept to ‘contribution’. However:
In marginal costing, profit can be increased by increasing inventories of WIP and finished goods, because direct labour costs and variable production overhead costs are added to the cost of inventory, and kept out of cost of sales.
In throughput accounting, there is no increase at all in profit from an increase in WIP and finished goods.
3.6 Throughput accounting and the Theory of Constraints
According to the Theory of Constraints, a constraint is anything that limits the output from the system. If a system had no constraint:
its output would be zero, or
the system would continue to produce more and more output without limit.
Therefore for any system whose output is not zero, there must be a constraint that stops it from producing more output than it does. In a manufacturing system, constraints can be described as bottlenecks in the system.
If the aim of a business is to make money and profit, the most appropriate method of doing this is to:
increase throughput (per unit of constraining resource)
reduce operating expenses (per unit of constraining resource), or
reduce inventory, since there is a cost in holding inventory.
Goldratt argued that the most effective of these three ways of increasing profit is to increase throughput. Throughput can be increased by identifying the bottlenecks in the system, and taking action to remove them or ease them. Note: Throughput accounting is also relevant to Just in Time production. JIT production depends on avoiding breakdowns in the flow of production and production bottlenecks. JIT is described in more detail in a later chapter.
3.7 Throughput accounting ratio
Performance can be measured using three ratios:
Throughput per unit of the bottleneck resource
Operating expenses per unit of the bottleneck resource
Throughput accounting ratio.
The throughput accounting ratio is the ratio of [throughput in a period per unit of bottleneck resource] to [operating expenses per unit of bottleneck resource].

Paper P5: Advanced performance management
404 © Emile Woolf Publishing Limited
Units of a bottleneck resource are measured in hours (labour hours or machine hours). This means that the throughput accounting ratio can be stated as:
Throughput accounting ratio =
Throughput per hour of bottleneck resourceOperating expenses per hour of bottleneck resource
Example A business manufactures Product Z that has a selling price of $20. The materials costs are $8 per unit of Product Z. Total operating expenses each month are $120,000. Machine capacity is the key constraint on production. There are only 600 machine hours available each month, and it takes three minutes of machine time to manufacture each unit of Product Z. Required
(a) Calculate the throughput accounting ratio.
(b) How might this ratio be increased?
Answer (a) Throughput per unit of Product Z = $20 - $8 = $12.
Machine time per unit of Product Z = 3 minutes = 0.05 hours. Throughput per machine hour = $12/0.05 = $240.
Operating expenses per machine hour = $120,000
600 hours= $200
Throughput accounting ratio = $240
$200=1.20
(b) To increase the throughput accounting ratio, it might be possible to:
Raise the selling price for Product Z for each unit sold, to increase the throughput per unit.
Improve the efficiency of machine time used, and so manufacture Product Z in less than three minutes.
Find ways of reducing total operating expenses, in order to reduce the operating expenses per machine hour.

Appendix 1: Revision: ABC and other accounting methods
© Emile Woolf Publishing Limited 405
Backflush accounting
The basic concept of backflush accounting
The difference between traditional costing and costing with backflush accounting
The features of backflush accounting
Backflush accounting with two ‘trigger points’
Backflush accounting with one ‘trigger point’
Backflush accounting: conclusion
4 Backflush accounting
4.1 The basic concept of backflush accounting
Backflush accounting is a method of accounting that begins by focusing on output and then works backwards, allocating costs between cost of goods sold and inventories. This is the complete opposite to traditional cost accounting, which begins by calculating the cost of production and inventories and works forwards to establish a cost of sales and value for closing inventory. It simplifies costing accounting, because it ignores labour variances and work-in-progress value. Transfers between processes are often made at standard cost, and any variances are taken directly as a total variance to the income statement as a gain or a loss. Backflush accounting is ideally suited to a JIT system of purchasing and production, and is suitable where inventory levels are low and so inventory values are immaterial. JIT is described in more detail in a later chapter. Essentially, however, a JIT approach is to:
purchase materials from suppliers just in time for when they are needed for production, and
produce goods just in time for when customers want to buy them.
If JIT purchasing and production systems can be achieved, there is no requirement to hold inventories of materials or finished goods. In any JIT system, inventories should be small and financially immaterial - even if the ideal target of zero inventories cannot be achieved in practice.
4.2 The difference between traditional costing and costing with backflush accounting
Backflush accounting is a method of cost accounting that is consistent with JIT systems.

Paper P5: Advanced performance management
406 © Emile Woolf Publishing Limited
Traditional cost accounting systems for manufacturing costs are ‘sequential tracking’ systems. They track the costs of items as they progress through the manufacturing process, from raw materials, through work in progress to finished goods. At each stage of the manufacturing process, more costs are added and recorded within the cost accounting system.
The main benefit of sequential tracking costing systems is that they can be used to put a cost to items of inventory. When inventory is large, there is a need to measure inventory costs with reasonable ‘accuracy’.
With a JIT philosophy, this benefit does not exist. Inventory should be small, or even non-existent. The cost of inventory is therefore fairly insignificant. A costing system that measures the cost of inventory is therefore of little or no value, and is certainly not worth the time, effort and expenditure involved.
Backflush accounting is an alternative costing system that can be applied in a JIT environment. It is ideally suited to a manufacturing environment where production cycle times are fairly short and inventory levels are low.
As the term ‘backflush’ might suggest, costs are calculated after production has been completed. They are allocated between the cost of goods sold and inventories in retrospect. They are not built up as work progresses through the production process.
4.3 The features of backflush accounting
With backflush accounting, the starting point for costing is the completion of production. Production costs are identified first. These are the costs of materials and other expenses that have been recorded and charged to production. If there is any inventory, this is given a value. The value should be immaterial so an estimate should be sufficient. Gross profit is then calculated in the usual way:
$ $ Sales 200,000 Opening inventory (immaterial) 50 Costs of production 10,000 100,050 Less closing inventory (immaterial) (80) Cost of sales 99,970 Profit 100,030
It is important to recognise that the great advantage of backflush accounting is that costs can be worked ‘backwards’, after the goods have been produced and sold. There is no need for a complex cost accounting system that records costs of production sequentially.
4.4 Backflush accounting with two ‘trigger points’
A backflush accounting system has one or two trigger points, when costs are recorded. When there are two trigger points, these are usually:
the purchase of raw materials and
the manufacture of completed products.

Appendix 1: Revision: ABC and other accounting methods
© Emile Woolf Publishing Limited 407
A numerical example will be used to illustrate the costing method.
Example Suppose that a manufacturing company operates a JIT system. At the beginning of a period, it has no inventory of raw materials or finished goods. It manufactures a single product, Product P, which has the following standard cost:
$
Raw materials 20 Direct labour 8 Overheads 22 50
During the period, it incurred the following costs:
Raw materials purchased $2,030,000 Direct labour costs incurred $775,000 Overhead costs incurred $2,260,000
The company made 100,000 units of Product P and sold 98,000 units. The company uses a backflush costing system, with trigger points at raw materials purchase and at completion of production. Trigger point 1
Record the purchase of raw materials
Raw materials inventory account
$ $ Creditors 2,030,000
Trigger point 2
Record the manufacture of the 100,000 units
Finished goods inventory account
$ $ Raw materials (100,000 × 20) 2,000,000 Conversion costs
(100,000 × 30) 3,000,000
Raw materials inventory account
$ $ Creditors 2,030,000 Finished goods inventory 2,000,000 Closing balance c/f 30,000 2,030,000 2,030,000
Conversion costs account
$ $ Bank (labour cost) 775,000 Finished goods inventory 3,000,000 Creditors (overheads) 2,260,000 Balance 35,000 3,035,000 3,035,000

Paper P5: Advanced performance management
408 © Emile Woolf Publishing Limited
The closing balance on the raw materials account may represent the cost of closing inventory. If so, it is carried forward as an opening balance to the start of the next period. However, any cost variance (difference between standard and actual material cost) should be taken to the income statement for the period. Similarly, the balance on the conversion costs account probably represents cost variances for labour and overhead, and this should be written off to the income statement for the period. Management should identify the cause of any variances, and take control measures where appropriate. However, variances will probably be analysed using non-financial methods of investigation, and it is unlikely that detailed cost variances will be calculated in the backflush costing system.
The cost of sales and closing inventory of finished goods are simply recorded as follows:
Finished goods inventory account
$ $ Raw materials (100,000 × 20) 2,000,000 Cost of goods
sold (98,000 × 50) 4,900,000
Conversion costs
(100,000 × 30) 3,000,000 Closing inventory
(2,000 × 50) 100,000
5,000,000 5,000,000
Example An entity uses backflush accounting, with two trigger points, the purchase of raw materials and the manufacture of finished goods. The following transactions occurred during a period when there was no opening inventory of raw materials or finished goods. Purchase of raw materials $25,600 Labour and overhead costs incurred $15,700 Finished goods completed 1,000 units Units sold 990 units Standard cost per unit = $40, consisting of $25 materials and $15 conversion costs. Using backflush accounting, material purchases are recorded when they occur but costs of production and sale can be established after the units have been produced and sold.

Appendix 1: Revision: ABC and other accounting methods
© Emile Woolf Publishing Limited 409
Recording initial costs: Debit: Raw materials inventory $25,600 Credit: Creditors/payables $25,600 Debit: Conversion costs $15,700 Credit: Creditors/payables $15,700 When the units have been produced: Debit: Finished goods (1,000 × $25) $25,000 Credit: Raw materials inventory $25,000 Debit: Finished goods (1,000 × $15) $15,000 Credit: Conversion costs $15,000 When the units are sold: Debit: Cost of sales (990 × $40) $39,600 Credit: Finished goods $39,600. This leaves a closing balance in finished goods of $400 (ten units). There is also a balance on the raw materials and conversion costs accounts. The raw materials balance may be a closing inventory value or may represent cost variances for materials. The conversion costs account balance will represent cost variances for conversion costs. These accounting entries, made in retrospect, are sufficient to account for production costs and cost of sales in the period.
4.5 Backflush accounting with one ‘trigger point’
An even simpler backflush accounting system has just one trigger point, the manufacture of finished units. Using the same example, the cost accounting entries would be as follows:
Finished goods inventory account
$ $ Creditors (100,000 × 20) 2,000,000 Cost of goods
sold (98,000 × 50) 4,900,000
Conversion costs
(100,000 × 30) 3,000,000 Closing inventory
(2,000 × 50) 100,000
5,000,000 5,000,000
Conversion costs account
$ $ Bank (labour cost) 775,000 Finished goods inventory 3,000,000 Creditors (overheads) 2,260,000 Balance 35,000 3,035,000 3,035,000

Paper P5: Advanced performance management
410 © Emile Woolf Publishing Limited
The only difference is that there is no raw materials inventory account. The $30,000 of materials that has been purchased but not used is simply not recorded in the costing system, and is therefore not included in closing inventory at the end of the period.
4.6 Backflush accounting: conclusion
The examples above should illustrate that with backflush accounting, costs are not ‘tracked’ sequentially from raw materials through work in progress to finished goods and cost of sales. They are applied in retrospect, from finished goods and back to raw materials and conversion costs. Backflush accounting therefore avoids the need to maintain a detailed cost accounting system, which can be regarded as a non-value added activity. Management must monitor performance, but performance measurement is more likely to consist of non-financial performance indicators, rather than detailed cost variances.

© Emile Woolf Publishing Limited 411
Paper P5 Advanced performance management
AP
PE
ND
IX
2
Accounting for decision-making
Contents
1 Decision-making and relevant costs
2 Short-term decisions
3 Cost-Volume-Profit (CVP) analysis

Paper P5: Advanced performance management
412 © Emile Woolf Publishing Limited
Decision-making and relevant costs
Relevant costs
Non-relevant costs
Relevant cost of materials
Relevant cost of labour
Quantitative and qualitative factors in decision-making
1 Decision-making and relevant costs
Business decisions are often based on choosing a course of action that maximises profit or value. When a decision is made, there must be a choice between at least two different possible options. If the decision is based entirely on financial considerations, the choice should be the option with:
the lowest expected cost, or
the highest expected profit or return on capital.
When decisions are made to maximise profit or value, relevant costs and relevant revenues must be used in the financial evaluation of the decision.
1.1 Relevant costs
A relevant cost is a future cash flow arising as a direct consequence of the decision. Relevant revenue is the extra revenue arising as a direct consequence of a decision. Relevant costs include:
Incremental costs: an incremental cost is an extra cost (cash flow) that will be incurred as a direct consequence of a decision.
Opportunity costs: An opportunity cost is the benefit forgone by choosing one opportunity instead of the next best alternative course of action. It is often measured as the extra contribution or profit that would have been earned by choosing the next best course of action.
Avoidable costs. Avoidable costs are future cash payments that will be avoided as a consequence of the decision. They are costs that can be identified with an activity or a business sector that would be avoided (saved) if that activity or sector did not exist. Avoidable costs are usually associated with shutdown or disinvestment decisions.
1.2 Non-relevant costs
A non-relevant cost is a cost that is not relevant to a decision. Non-relevant costs must be ignored for the financial analysis of a decision. They are costs that are or will be incurred anyway, regardless of the decision that is made.

Appendix 2: Accounting for decision-making
© Emile Woolf Publishing Limited 413
Non-relevant costs include:
sunk costs
committed costs
notional costs (or imputed costs)
Sunk costs
Sunk costs are costs that have already been incurred. Since they have been incurred, they are not relevant to any decision about the future. An example of a sunk cost is the purchase cost of an asset that has already been acquired. (The relevant cost of an existing asset that would be used if a decision is taken is the benefit that would be obtained from using the asset in the next-most-profitable way. For example, the relevant cost of an asset might be the net revenue obtainable from disposing of it). Historical costs are sunk costs. They are irrelevant for decision-making. However, historical costs might be used to estimate future costs that are relevant to a decision.
Committed costs
Committed costs are also irrelevant and should be ignored in the financial analysis of decisions. A committed cost is a future cost that will be incurred anyway, whatever decision is taken now. A committed cost is a future cost that exists because of an existing obligation.
Notional costs (or imputed costs)
Notional costs are non-relevant costs. They are costs that do not represent cash flows. Examples of non-relevant costs, which must be ignored in decision-making, are:
apportioned or absorbed overhead costs
depreciation charges.
1.3 Relevant cost of materials
The relevant cost of raw materials is usually their current replacement cost. The relevant cost is the replacement cost when:
the materials will be purchased as a direct consequence of the decision
the materials have been purchased and are held in inventory, but if they are used as a consequence of the decision, they will be replaced (additional quantities will be purchased).
When materials are already held in inventory, and will not be replaced if they are used, the relevant cost is the higher of:
their current net disposal value, and

Paper P5: Advanced performance management
414 © Emile Woolf Publishing Limited
the savings or contribution that would be obtained by putting them to another use.
If the materials are already held in inventory and have no resale value and no other possible use, the relevant cost of using them is 0.
Relevant cost of materials
Relevant cost = opportunity cost (variable cost of
the material plus the Contribution forgone)
Example Entity Blue has been asked by a customer to quote for a job, and it is prepared to quote a price based on the relevant costs of the job plus a mark-up for profit. The job would require the following materials:
Material item
Total units required
Units held in inventory
Original purchase
cost
Net disposal value
Replacement cost
$ per unit $ per unit $ per unit
W 800 0 - - 10.00
X 1,000 400 4.00 5.00 12.00
Y 1,000 700 6.00 4.00 8.00
Z 300 300 5.00 6.00 11.00
Material X is used regularly for other work. Some units of materials Y and Z are held in inventory as the result of buying too many units in the past. There is no alternative use for Material Y which could be

Appendix 2: Accounting for decision-making
© Emile Woolf Publishing Limited 415
disposed of. The units of material Z could be used in another job as substitute for 400 units of Material V, which currently costs $7 per unit. Entity Blue currently has no units of Material V in inventory. Required
Calculate the relevant costs of the materials for deciding whether or not to accept the contract.
Answer
Relevant costs of materials $
Material W: (800 × $10) 8,000
Material X: (1,000 × $12) 12,000
Material Y: (700 × $4) + (300 × $8) 5,200
Material Z: (400 × $7) 2,800
28,000
Notes on relevant costs
All the units of Material W will have to be purchased in full at a cost of $10 per unit.
Material X is in regular use. 400 units are held in inventory, but if these are used for the job, they will have to be replaced. Relevant costs are therefore 1,000 units at the replacement cost of $12 per unit.
1,000 units of Material Y are needed and 700 are already held in inventory. If they are used for the job, 300 extra units must be bought at $8 each. The existing inventory of 700 units will not be replaced when they are used. However, if they are not used for the job, they could be sold at $4 each. The disposal value of these 700 units is an opportunity cost.
The units of Material Z needed for the job are already held in inventory. They will not be replaced if they are used for the job. However, there is an opportunity cost of using the materials because the units could either be disposed of for $6 per unit ($1,800 in total) or used instead of other materials (Material V) that would cost 400 × $7 = $2,800. Since substituting the Material Z in place of Material V is more beneficial, the opportunity cost is $2,800.

Paper P5: Advanced performance management
416 © Emile Woolf Publishing Limited
1.4 Relevant costs of labour
The relevant cost of labour should be established as follows:
Relevant cost of labour
Relevant cost = opportunity cost
of the labour (cost of labour +
contribution forgone)
Example A printing company has been asked by a regular customer to do a special job at a competitive price. The management accountant has been asked to identify the minimum price to charge that would leave the printing company no worse off but no better off by doing the job. The following estimates for the job have been prepared:
$
Grade 1 labour (4 hours at $20 per hour) 80
Grade 2 labour (3 hours at $30 per hour) 90
Grade 3 labour: (2 hours at $15) 30
Paper 150
Variable overhead (9 hours at $5 per hour) 45
Fixed overhead (9 hours at $25 per hour) 225
620

Appendix 2: Accounting for decision-making
© Emile Woolf Publishing Limited 417
(a) Grade 1 employees are paid a fixed wage for a 40-hour working week. This job could be done mostly in normal working time, but two hours of Grade 1 overtime would be needed.
(b) Similarly, all Grade 2 employees are paid for a 40-hour working week. Two hours of Grade 2 overtime would be needed to do the work.
(c) All overtime is paid at 50% above normal hourly rates.
(d) The Grade 3 employees are already working at full capacity, and if they are used to do this job for the customer, a Grade 3 employee would be switched from doing other work where he is earning a contribution of $10 per hour.
(e) The paper will have to be purchased for the job.
Required
What is the price the company should charge for the job to make a 20% mark-up on the minimum price at which it would make no profit but no loss?
Answer
Relevant costs $
Grade 1 labour: (2 hours × $20) plus 50% 60
Grade 2 labour: (2 hours × $30) plus 50% 90
Grade 3 labour: (2 hours × $25) 50
Paper 150
Variable overheads: (9 hours × $5) 45
Minimum price (relevant costs) 395
Mark-up (20%) 79
Price for the customer 474
Notes on relevant costs
Grade 1 and Grade 2 labour. Labour in normal time is a committed cost, and is not relevant to decision about the minimum price. However, overtime hours, paid at 50% over the normal rate, are relevant because they will be incremental costs.
Grade 3 labour. There is an opportunity cost of using the labour on this job instead of on another job, which would earn a contribution of $10 per hour. Opportunity cost = $15 + $10 = $25 per hour.
It is assumed that variable overhead is a relevant cost.
It is assumed that fixed overhead spending would be unaffected and the absorbed fixed overheads for the job are not relevant.
1.5 Quantitative and qualitative factors in decision-making
Relevant cost analysis is based on the assumption that the decision should be to choose the option where the financial benefit will be the greatest. For decisions with a short-term payback (short-term decisions), a decision should be taken if:
Paper P5: Advanced performance management
418 © Emile Woolf Publishing Limited
there is a net cash flow benefit and no other option offers a better net cash flow benefit
the net cost, measured in relevant cash flows, is less than with any other option.
For longer-term decisions (capital expenditure decisions), the timing of cash flows and the time value of money should be taken into consideration, using discounted cash flow analysis. The assumption that decisions should be based on financial considerations alone might not be valid. Financial considerations are important, but a decision might be taken for non-financial reasons, or non-financial factors might affect the choice between two or more different courses of action. Non-financial factors that could affect a decision include:
customer satisfaction: it may be better to spend more to provide customers with a better service, or a higher quality of product
reputation: a company might choose one course of action in preference to another in order to protect its reputation in the market
speed: it is sometimes worth paying more to get a job finished more quickly, or to provide a faster delivery service
customer relationships: a company might be willing to spend money in the short-term in order to protect a well-established relationship with a customer.

Appendix 2: Accounting for decision-making
© Emile Woolf Publishing Limited 419
Short-term decisions
Short-term decisions and long-term decisions
Types of short-term decision
Discontinuance decisions (shutdown decisions)
Short-term decisions based on limiting factors
Make or buy decisions
2 Short-term decisions
2.1 Short-term decisions and long-term decisions
Relevant costs should be used for the evaluation of all decisions. However, a distinction might be made between short-term and long-term decisions because:
with short-term decisions (typically, within a time period of one year or less) the cost of capital is not relevant
with long-term decisions (typically, with a time period of more than one year) the cost of capital is relevant and future cash flows are discounted to a present value.
2.2 Types of short-term decision
There can be many types of short-term decision, but decisions that might be the subject of an examination question include:
discontinuance decisions (or shutdown decisions)
short-term decisions based on limiting factors
make or buy decisions when there is a limiting factor
decisions whether to accept or reject an order
further processing decisions.
2.3 Discontinuance decisions (shutdown decisions)
A discontinuance decision, or shutdown decision, is a decision whether or not to shut down an operation or a part of the business. The financial decision should usually be based on a comparison of:
the loss in revenue from closing down the operation, and
the saving in costs from closing down (avoidable costs).
Shutdown decisions are often long-term decisions and not short-term decisions, because a decision to shut down an operation will affect profits for several years in

Paper P5: Advanced performance management
420 © Emile Woolf Publishing Limited
the future. However, you might also come across a shutdown decision where the consequences are only for the short-term.
Example Luca Company has three operating divisions. The expected financial results of each division next year are as follows:
Division X Division Y Division Z
$ $ $
Sales 50,000 30,000 40,000
Variable costs (30,000) (18,000) (20,000)
Specific fixed costs (12,000) (10,000) (10,000)
Apportioned head office costs (5,000) (4,000) (5,000)
Profit/(loss) 3,000 (2,000) 5,000
Required
Taking only the financial results next year into consideration, recommend whether or not Division Y should be closed down.
Answer
Division Y $
Loss of sales from closure (30,000)
Saving in variable costs 18,000
Fall in contribution from closure (12,000)
Saving in specific fixed costs 10,000
Net loss from closure (2,000)
On the basis of this information, Division Y should remain open as it will make a net addition to profit next year of $2,000. This assumes that all the specific fixed costs will be saved if the division is closed but that there will be no savings in head office costs.
2.4 Short-term decisions based on limiting factors
A limiting factor is a resource that limits the volume of activity in a period, such as the volume of production and sales. A limiting factor could be a restricted supply of materials, or labour or machine time.
If there is a limiting factor, relevant cost analysis assumes that the decision should be to make and sell the items that will maximise profit in the period, making the best possible use of the scarce resource.
It is also assumed that profit will be maximised by maximising total contribution.
When there is just one scarce resource, contribution is maximised by making and selling the items that provide the maximum contribution per unit of the limiting factor (maximum contribution per unit of the scarce resource).

Appendix 2: Accounting for decision-making
© Emile Woolf Publishing Limited 421
When the sales demand for any item is restricted, items should be ranked in order of contribution per unit of the scarce resource. Profit will be maximised by making and selling the top-ranked up to the sales demand limit.
Example Entity Yellow makes and sells three products, A, B and C. Budget estimates for each product for next year are as follows:
Product A Product B Product C
$ $ $
Sales price 21 22 15
Variable costs:
Materials 7 12 9
Labour 9 6 3
Fixed cost 3 2 2
units units units
Sales demand 6,000 5,000 4,000
All three products use the same direct materials and are made by the same employees. Labour is paid $12 per hour. In the next year, the available supply of materials will be restricted to $150,000 (at cost) and the available supply of labour to 7,100 hours. Required
What products should the entity make and sell next year in order to maximise profit?
Answer There might be two scarce resources, materials and labour. The first step is to find out whether either of them (or both of them) is a limiting factor.
Materials Product A Product B Product C Total
$ $ $ $
Required to meet budget 42,000 60,000 36,000 138,000
Available 150,000
Surplus 12,000
Materials are not a limiting factor.
Labour Product A Product B Product C Total
hours hours hours hours
Required to meet budget 4,500 2,500 1,000 8,000
Available 7,100
Shortage 900
Labour is a limiting factor. Total profit and total contribution will be maximised by earning the largest contribution possible for each labour hour worked.

Paper P5: Advanced performance management
422 © Emile Woolf Publishing Limited
Product A Product B Product C
$ $ $
Sales price 21 22 15
Variable costs 16 18 12
Contribution per unit 5 4 3
Labour hours per unit 0.75 0.50 0.25
Contribution per hour $6.67 $8.00 $12.00
Ranking 3rd 2nd 1st
The profit-maximising schedule for production and sales is as follows:
Product
Number of units
Number of labour hours
Contribution
$
C 4,000 1,000 12,000
B 5,000 2,500 20,000
3,500 32,000
A (balance) 4,800 3,600 24,000
7,100 56,000
Assumptions in limiting factor analysis
The following assumptions are made in limiting factor analysis. If any of these assumptions are not correct, the profit-maximising decision might be different.
Fixed costs will be the same regardless of the decision that is taken. This means that profit will be maximised if contribution is maximised. This assumption might be wrong. Some fixed costs might be specific to a product, and the decision to reduce the production volume might result in some saving in the fixed costs.
The unit variable cost is constant at all levels of production and sales.
The estimates of sales demand for each product are known with certainty. These estimates might be wrong.
2.5 Make or buy decisions
A make or buy decision is a decision about whether to make items internally, or whether to sub-contract their manufacture to an external supplier. Work that is sub-contracted to an external supplier is ‘outsourced’. A make or buy decision might arise when an entity has a limiting factor that prevents it from masking everything itself. In this situation, it could be profitable to sub-contract some of the work. The decision to be made is:
Whether it is profitable to sub-contract work, and
If so, which items should be purchased and which should be made internally.

Appendix 2: Accounting for decision-making
© Emile Woolf Publishing Limited 423
The decision is based on a comparison of:
The relevant costs of in-house manufacture and
The costs of external purchase.
If there is a limiting factor that prevents the entity from making everything itself, the decision about what to make and what to buy is reached by:
calculating the additional cost of external purchase (extra cost) for each unit of limiting factor
ranking the products in order of extra cost per unit of limiting factor
buying the products where the extra cost is the lowest.
Example Entity Red makes four items W, X, Y and Z, for which costs and sales in the next year are expected to be as follows:
Item: W X Y Z
Sales 2,000 units 4,000 units 3,000 units 1,000 units
Variable cost/unit $ $ $ $
Materials 10 5 7.5 12.5
Labour 7 2 4.5 6.5
17 7 12.0 19.0
Sales price 29 11 18.0 39.0
Contribution 12 4 6.0 20.0
The entity is having difficulty in obtaining the materials. Each product uses the same material, and only one type of material is used in manufacture. The expected availability of materials next year is 11,000 kilos. The material costs $5 per kilo. An overseas manufacturer is willing to supply the items to Entity Red at the following costs per unit (including delivery costs):
Item $
W 20.00
X 11.00
Y 15.75
Z 21.50
Required
Which items should Entity Red make internally, and which should it buy from the external manufacturer?

Paper P5: Advanced performance management
424 © Emile Woolf Publishing Limited
Answer Are materials a limiting factor?
Materials required to meet sales kilos
W: (2,000 × 2 kilos) 4,000
X: (4,000 × 1 kilo) 4,000
Y: (3,000 × 1.5 kilos) 4,500
Z: (1,000 × 2.5 kilos) 2,500
15,000
Available 11,000
Shortage 4,000
Materials are a limiting factor.
W X Y Z
$ $ $ $
Variable cost/unit to make 17 7 12.00 19.0
Cost of buying 20 11 15.75 21.5
Extra cost of buying 3 4 3.75 2.5
Materials/unit 2 kilos 1 kilo 1.5 kilos 2.5 kilos
Extra cost of buying/kilo $1.5 $4 $2.5 $1.0
Ranking for purchase 3rd 1st 2nd 4th
The make or buy decision should be as follows, to maximise contribution and profit.
Item
Number of units
Materials
kilos
Contribution per unit
Contribution
Make $ $
X 4,000 4,000 4 16,000
Y 3,000 4,500 6 18,000
8,500
W (balance) 1,250 2,500 12 15,000
11,000 49,000
Buy
W (balance) 750 (12 – 3) 9 6,750
Z 1,000 (20 – 2.5) 9 17,500
Total contribution 73,250
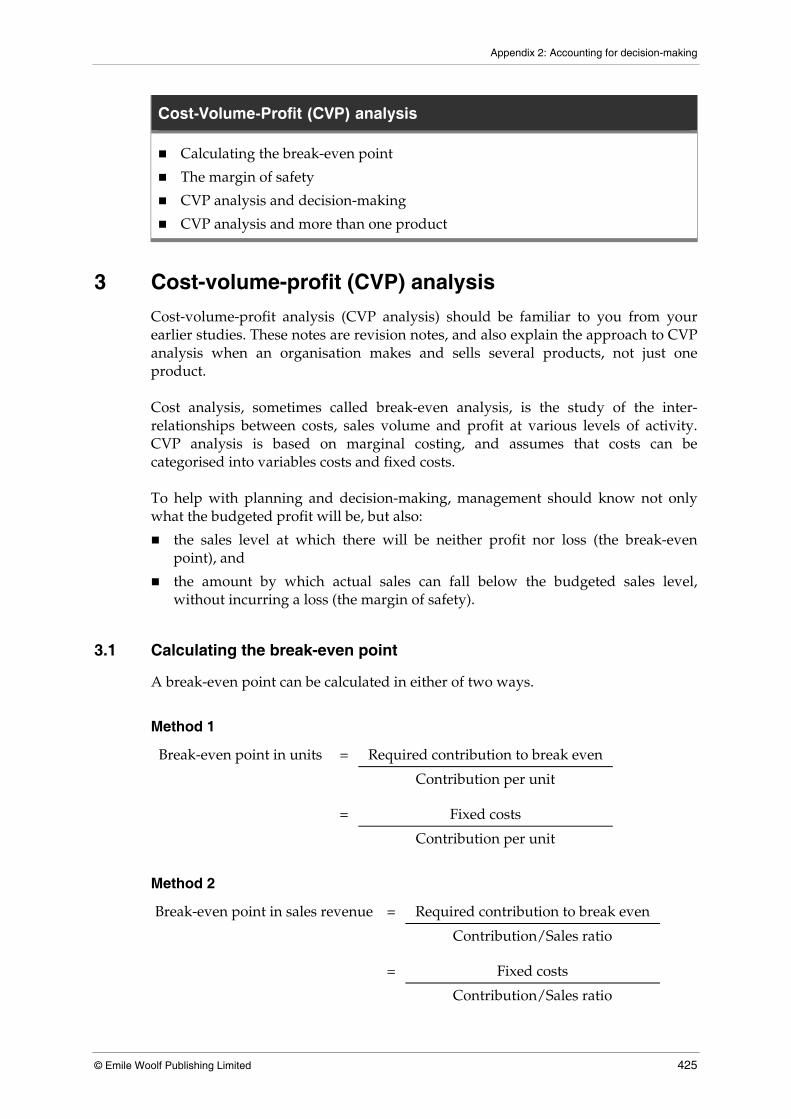
Appendix 2: Accounting for decision-making
© Emile Woolf Publishing Limited 425
Cost-Volume-Profit (CVP) analysis
Calculating the break-even point
The margin of safety
CVP analysis and decision-making
CVP analysis and more than one product
3 Cost-volume-profit (CVP) analysis
Cost-volume-profit analysis (CVP analysis) should be familiar to you from your earlier studies. These notes are revision notes, and also explain the approach to CVP analysis when an organisation makes and sells several products, not just one product. Cost analysis, sometimes called break-even analysis, is the study of the inter-relationships between costs, sales volume and profit at various levels of activity. CVP analysis is based on marginal costing, and assumes that costs can be categorised into variables costs and fixed costs. To help with planning and decision-making, management should know not only what the budgeted profit will be, but also:
the sales level at which there will be neither profit nor loss (the break-even point), and
the amount by which actual sales can fall below the budgeted sales level, without incurring a loss (the margin of safety).
3.1 Calculating the break-even point
A break-even point can be calculated in either of two ways.
Method 1
Break-even point in units = Required contribution to break even
Contribution per unit = Fixed costs
Contribution per unit
Method 2
Break-even point in sales revenue = Required contribution to break even
Contribution/Sales ratio = Fixed costs
Contribution/Sales ratio

Paper P5: Advanced performance management
426 © Emile Woolf Publishing Limited
Example An entity makes a single product that has a variable cost of $3 per unit. The selling price is $8 per unit. Fixed costs in each month are $200,000.
(a) The break-even point in units
Contribution per unit = $8 – $3 = $5. Break-even point = $200,000/$5 per unit = 40,000 units each month.
(b) The break-even point in sales revenue
Contribution/sales (C/S) ratio = $5/$8 = 0.625 Break-even point = $200,000/0.625 = $320,000.
3.2 The margin of safety
The margin of safety is the difference in units between the budgeted sales volume and the break-even sales volume and it is usually expressed as a percentage of the budgeted sales volume. The margin of safety may also be expressed as the difference between the budgeted sales revenue and break-even sales revenue, expressed as a percentage of either:
the budgeted sales revenue, or
the break-even sales volume.
It shows by how much actual sales could fall below the budget target without a loss being incurred. It is therefore a simple measure of risk in the budget estimates of sales.
Example Entity ABC makes and sells a product that has a variable cost of $15 and a selling price of $20. Budgeted fixed costs for the year are $800,000 and budgeted sales are 200,000 units. The contribution per unit is $5 ($20 – $15). Break-even point is therefore $800,000/$5 per unit = 160,000 units. The margin of safety is 40,000 units (200,000 – 160,000) This is 25% of the break-even sales volume and 20% of the budgeted sales volume.
3.3 CVP analysis and decision-making
Simple CVP analysis can be used in decision-making. Some examples are shown below.

Appendix 2: Accounting for decision-making
© Emile Woolf Publishing Limited 427
Example Entity Blue makes and sells a single product, for which variable costs are as follows:
$
Direct materials 12
Direct labour 8
Variable overheads 6
26
The sales price is $35 per unit, and fixed costs per year are $468,000. The company wishes to make a profit of $180,000 next year. Required
Calculate the sales volume required to achieve this target profit.
Answer Target profit = $180,000 Therefore target contribution = $468,000 + $180,000 = $648,000. Contribution per unit = $35 – $26 = $9 Therefore target sales = $648,000/$9 per unit = 72,000 units. Alternatively: C/S ratio = 9/35 Therefore target sales = $648,000/(9/35) = $2,520,000.
Example Entity DEF makes a product whose variable cost is $0.60 per unit. The current selling price is $1.80 per unit. Fixed costs are $80,000 per month, and the monthly profit at current sales volume is $11,000. The entity wishes to raise the sales price to $2.00 per unit, but is aware that an increase in the selling price will result in some loss of sales. Required
If the selling price is increased to $2.00, what would be the minimum volume of sales each month needed to prevent a fall in profits?

Paper P5: Advanced performance management
428 © Emile Woolf Publishing Limited
Answer Minimum target contribution = Fixed costs + Target profit = $80,000 + $11,000 = $91,000. If the selling price is increased to $2, the contribution per unit will be $1.40. Required sales volume to earn a contribution of $91,000 = $91,000/$1.40 per unit = 65,000 units.
Example Entity GHJ makes a product that has a variable cost of $18 and a sales price of $26 per unit. Fixed costs are $608,000 per year. The current annual volume of sales is 90,000 units. The entity would like to increase the annual sales volume, but in order to increase annual production and sales above 90,000 units, it would have to hire additional equipment, at an annual cost of $64,000. Required
What is the number of units that must be sold each year to achieve the same profit as is currently earned, if the additional equipment is hired?
Answer The current unit contribution is $(26 − 18) = $8.
$
Total contribution currently earned (90,000 × $8) 720,000
Extra fixed costs of hiring equipment 64,000
Minimum annual contribution required if equipment is hired 784,000
Minimum sales required = $784,000/$8 per unit = 98,000 units. The minimum sales requirement is therefore 8,000 higher than the current annual sales volume, assuming that there will be no change in the selling price or the unit variable cost.
Example Entity JKL issues mobile phones to all its sales representatives. The sales manager has been looking at two different tariffs for telephones.
(a) Tariff 1: an annual rental of $600 plus calls charged at $0.05 per minute
(b) Tariff 2: an annual rental of $360 plus calls charged at $0.08 per minute.
Below what volume of usage would Tariff 2 be cheaper?
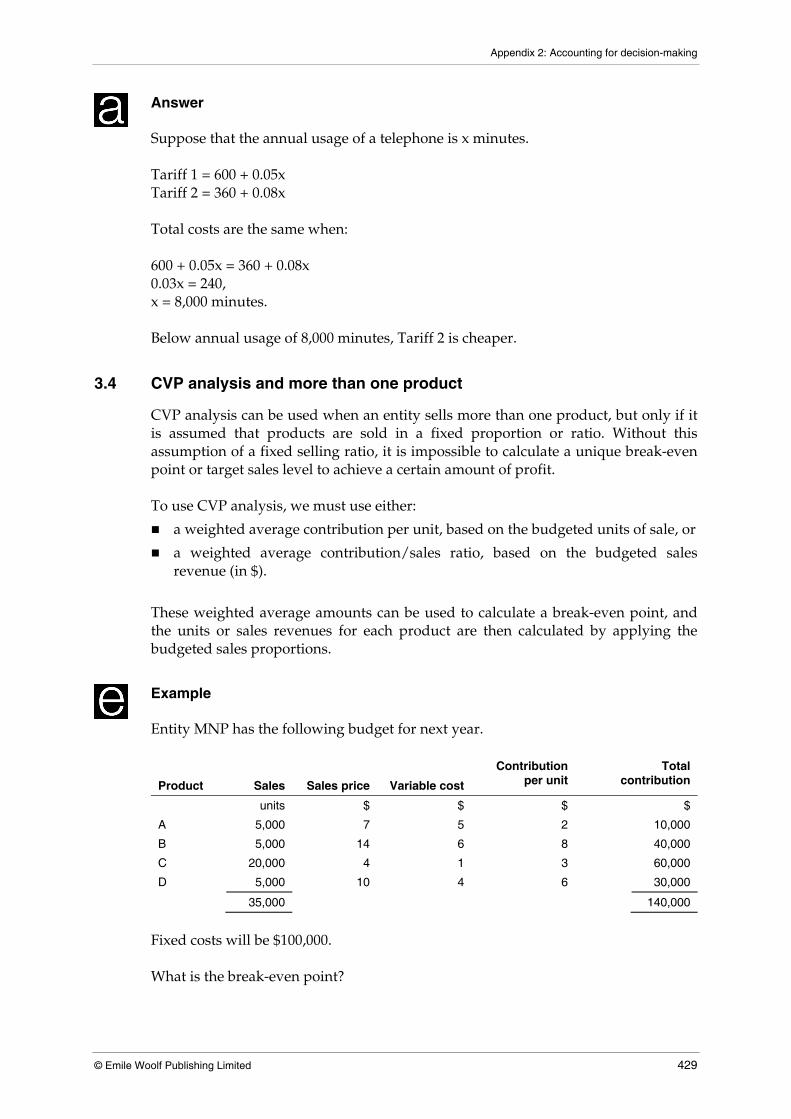
Appendix 2: Accounting for decision-making
© Emile Woolf Publishing Limited 429
Answer Suppose that the annual usage of a telephone is x minutes. Tariff 1 = 600 + 0.05x Tariff 2 = 360 + 0.08x Total costs are the same when: 600 + 0.05x = 360 + 0.08x 0.03x = 240, x = 8,000 minutes. Below annual usage of 8,000 minutes, Tariff 2 is cheaper.
3.4 CVP analysis and more than one product
CVP analysis can be used when an entity sells more than one product, but only if it is assumed that products are sold in a fixed proportion or ratio. Without this assumption of a fixed selling ratio, it is impossible to calculate a unique break-even point or target sales level to achieve a certain amount of profit. To use CVP analysis, we must use either:
a weighted average contribution per unit, based on the budgeted units of sale, or
a weighted average contribution/sales ratio, based on the budgeted sales revenue (in $).
These weighted average amounts can be used to calculate a break-even point, and the units or sales revenues for each product are then calculated by applying the budgeted sales proportions.
Example Entity MNP has the following budget for next year.
Product
Sales
Sales price
Variable cost
Contribution per unit
Total contribution
units $ $ $ $
A 5,000 7 5 2 10,000
B 5,000 14 6 8 40,000
C 20,000 4 1 3 60,000
D 5,000 10 4 6 30,000
35,000 140,000
Fixed costs will be $100,000. What is the break-even point?

Paper P5: Advanced performance management
430 © Emile Woolf Publishing Limited
Answer Break-even point in units
Total contribution = $140,000 Weighted average contribution per unit = $140,000/35,000 units = $4 per unit. Break-even point = $100,000/$4 per unit = 25,000 units. Break-even point: sales of each unit:
Product
Sales
Contribution per unit
Total contribution
units $ $
A (1/7) 3,571.4 2 7,142.8
B (1/7) 3,571.4 8 28,571.2
C (4/7) 14,285.8 3 42,857.4
D (1/7) 3,571.4 6 21,428.4
25,000.0 99,999.8
This is the break-even position, allowing for a rounding difference of $0.02. Break-even point in sales revenue
Budgeted sales = (5,000 × $7) + (5,000 × $14) + (20,000 × $4) + (5,000 × $10) = $235,000. Budgeted weighted average C/S ratio = $140,000/$235,000 = 140/235 = 0.59574468. Break-even point = $100,000/0.59574468. = $167,857. This break-even point is 71.42857% of budgeted sales (167,857/235,000).
Product
Break-even sales
Contribution/
Sales ratio
Total contribution
$ $
A 25,000 2/7 7,142.9
B 50,000 8/14 28,571.4
C 57,143 3/4 42,857.3
D 35,714 6/10 21,428.4
167,857 100,000.0

© Emile Woolf Publishing Limited 431
Paper P5 Advanced performance management
AP
PE
ND
IX
3
Decision-making with risk and uncertainty
Contents
1 Expected value and other decision rules
2 Assessing risk in decision-making

Paper P5: Advanced performance management
432 © Emile Woolf Publishing Limited
Expected value and other decision rules
Decision-making and risk and uncertainty
Risk preference
Worst, most likely and best possible outcomes
Maximax, maximin and minimax regret decision rules
Expected values
1 Expected value and other decision rules
1.1 Decision-making and risk and uncertainty
Decision-making, particularly long-term decision-making, has to be taken under conditions of risk and uncertainty.
Uncertainty occurs when there is insufficient information about what will happen, or what will probably happen, in the future. It is therefore likely that estimates of future values (future sales, future costs, and so on) will be inaccurate.
Risk occurs when future events of the future outcome could be any of several different possibilities. However, the probabilities of each possible outcome can be assessed with reasonable accuracy.
Uncertainty in decision-making can be reduced by obtaining more reliable information. Risk cannot be removed from a decision, because risk exists in the situation itself. A decision-maker can try to analyse the risk, and must make a decision on the basis of whether the risk is justified or acceptable. The Study Guide for the P5 syllabus states that you should be able to ‘evaluate how risk and uncertainty play and especially important role in long term strategic planning and decision making that relies on forecasts of exogenous variables’. ‘Exogenous’ means ‘external’. For a company or non-profit making entity, an exogenous variable is a factor or a future condition that is outside the current ability of management to control. Both risk and uncertainty relate to exogenous variables. Risk and uncertainty can be analysed and assessed, before a decision is eventually taken. However, strategic decisions and other decisions inevitably have to be taken in situations where management are not at all sure what the actual outcome will be. This chapter looks at a number of decision-making rules or methods that provide a logical basis for decision-making under conditions of risk or uncertainty. In addition, it discusses sensitivity analysis as a method of analysing risk or uncertainty, and helping management to plan strategies for the future.

Appendix 3: Decision-making with risk and uncertainty
© Emile Woolf Publishing Limited 433
1.2 Risk preference
Risk preference describes the attitude of a decision-maker towards risk. Decision-makers might be described as risk averse, risk-seeking or possibly risk neutral.
A risk-averse decision maker considers risk in making a decision, and will not select a course of action that is more risky unless the expected return is higher and so justifies the extra risk. It is not correct to state that a risk-averse decision-maker seeks to avoid risk as much as possible. However, a risk-averse decision-maker might expect a substantially higher return to make the extra risk worth taking.
A risk-neutral decision maker ignores risk in making a decision. The decision of a risk neutral decision-maker is to select the course of action with the highest expected return, regardless of risk. The highest expected return could mean the highest EV of NPV or the highest EV of profit.
A risk-seeking decision maker also considers risk in making a decision. A risk seeker, unlike a risk-averse decision-maker, will take extra risks in the hope of earning a higher return. Given two options with the same EV of NPV, a risk seeker will prefer the option with the higher risk.
Example A company must make a choice between three different projects A, B and C. These three projects are mutually exclusive. The net present values of each project have been estimated as follows:
Project A Project B Project C
NPV NPV NPV
Probability 0.5 + 800,000 + 2,000,000 + 100,000
Probability 0.5 - 500,000 - 1,700,000 + 50,000
Expected value of NPV + 150,000 + 150,000 + 75,000
Projects A and B have a higher expected NPV than project C, but are more risky. Project C would have a positive NPV, whereas projects A and B have a 50% chance of a negative NPV. Project B is more risky than project A, although it has the same expected return (NPV) of + 150,000. With project B, the NPV could be as high as + 2,000,000, but could also be as low as – 1,700,000. So which project should be undertaken?
A risk-averse decision-maker would choose either project A or project C. Project C offers a lower return but lower risk, and project A has a higher expected return but higher risk. A risk-averse decision-maker would not choose project B, because project A offers the same expected return for less risk.
A risk-seeking decision-maker would choose project B rather than project A, in the hope of making a return of + 2,000,000.
A risk-neutral decision-maker might choose either project A or project B because they both offer the same expected return, which is higher than the expected return from project C.

Paper P5: Advanced performance management
434 © Emile Woolf Publishing Limited
1.3 Worst, most likely and best possible outcomes
The choice between two or more alternative courses of action might be based on the worst, most likely or best expected outcomes from each course of action. A simple example will be used to explain this point.
Example A company must make a decision between three possible courses of action, 1, 2 and 3. The expected profit or loss from each course of action has been estimated as follows:
Course of action
Worst possible outcome
Most likely outcome
Best possible outcome
Course 1 - 1,000 + 4,000 + 5,000
Course 2 - 500 + 2,500 + 7,000
Course 3 - 3,000 + 1,000 + 9,000
The course of action chosen by the company will depend on the attitude to risk of its decision-maker.
A decision might be taken to select the project where the possible loss is the lowest. This would be course of action 2, where the worst outcome is – 500. This is not as bad as the worst outcome for courses of action 1 and 3. A risk-averse decision-maker might choose this course of action.
A decision might be taken on the basis of the most likely outcome. The preferred course of action would then be the one where the expected return is highest. In this example, the preferred course of action would be course 1, where the most likely return is + 4,000. This is better than course 2 (+ 2,500) or course 3 (+ 1,000).
A decision might be taken on the basis of the best possible return. The preferred course of action would then be the one that offers the highest return. Here, the preferred course of action would be course 3 (+ 9,000). This course of action would be the choice of a risk-seeking decision-maker.
The main disadvantage of choosing between mutually-exclusive courses of action on the basis of the worst, most likely or best possible outcome is that the choice ignores the likelihood or probability of the worst, most likely or best outcomes actually happening.
1.4 Maximax, maximin and minimax regret decision rules
Choosing between mutually-exclusive courses of action on the basis of worst, most likely or best possible outcome can be stated as ‘decision rules’. The choice may be based on a maximax, maximin or a minimax regret decision rule.
Maximax decision rule. The decision-maker will select the course of action with the highest possible pay-off. The decision-maker seeks the highest return, assuming that events turn out in the best way possible. The maximax decision rule is a decision rule for the risk-seeker.

Appendix 3: Decision-making with risk and uncertainty
© Emile Woolf Publishing Limited 435
Maximin decision rule. The decision-maker will select the course of action with the highest expected return under the worst possible conditions. This decision rule might be associated with a risk adverse decision maker.
Minimax regret decision rule. The decision-maker selects the course of action with the lowest possible ‘regret’. ‘Regret’ is the opportunity cost of having made the wrong decision, given the actual conditions that apply in the future.
Any of these decision rules may be used to make a decision, particularly when there is no reliable information about the probability of the different possible outcomes.
Example A business entity has to decide which of three projects to select for investment. The three projects are mutually exclusive, and only one of them can be selected. The expected profits from investing in each of the projects will depend on the state of the market. The following estimates of net present value have been prepared:
State of market Diminishing Static Expanding
Probability 0.4 0.3 0.3
$000 $000 $000
Project 1 100 200 950
Project 2 0 650 600
Project 3 180 190 200
Which options would be selected?
(a) under the maximax decision rule
(b) under the minimax decision rule
(c) under the minimax regret decision rule?
Answer In this example, there is an estimate of the probability of the future state of the market, diminishing (0.40 probability), static (0.30) and expanding (0.30). Using any of these three decision rules, however, the probabilities of each possible future outcome are ignored.
(a) Maximax decision rule. Using this decision rule, the preferred project is the one that offers the possibility of the largest possible NPV. In this example, the most favourable outcome is an NPV of $950,000 for Project 1, $650,000 for Project 2 and $200,000 for Project 3. Project 1 offers the highest potential return; therefore Project 1 will be selected.
(b) Minimax decision rule. Using this decision rule, the preferred project is the one that offers the best NPV if the worst possible outcome occurs. The least favourable outcome for all three projects will occur if the future market diminishes. The worst possible outcome for Project 1 is an NPV of $100,000, the worst possible is $0 for Project 2 and the worst possible is $180,000 for Project 3. If the worst happens, the best result would be obtained by selecting

Paper P5: Advanced performance management
436 © Emile Woolf Publishing Limited
Project 3. Using the minimax decision rule, Project 3 would be selected.
(c) Minimax regret decision rule. To establish the decision under the minimax regret decision rule, we must first prepare a pay-off table showing the regret the decision-maker would have choosing Project 1, Project 2 or Project 3, and the actual market conditions turn out diminishing, static or expanding.
The regret with each course of action is shown in the pay-off table below. The right-hand column of the table shows the maximum regret.
State of market Diminishing Static Expanding Maximum regret
Regret Regret Regret
$000 $000 $000
Project 1 80 450 0 450
Project 2 180 0 350 350
Project 3 0 460 750 750
If you are not sure how regret is calculated, the following notes might be helpful:
If Project 1 is selected and the market condition turns out to be diminishing, the regret will be not having chosen Project 3 3, because the NPV with Project 1 would be $100,000 and with Project 3 it would be $180,000. The regret is therefore $180,000 – $100,000 = $80,000.
If Project 1 is selected and the market condition turns out to be static, the regret will be not having chosen Project 2, because the NPV with Project 1 would be $200,000 and with Project 2 it would be $650,000. The regret is therefore $650,000 – $200,000 = $450,000.
If Project 1 is selected and the market condition turns out to be expanding, there is no regret because the best possible option has been chosen.
The maximum regret with Project 1 is the highest of $180,000; $450,000 and $0. This is $450,000.
The regret can be calculated in a similar way for both Projects 2 and 3, to complete the matrix. The ‘maximum regret’ is minimised by selecting Project 2. The biggest regret that would then happen is $350,000 (and this would happen if the future market expands). Project 2 would therefore be selected if the minimax regret rule is applied.
1.5 Expected values
Expected values can be used to analyse information and make a decision where the risk can be assessed in terms of the probability of each possible future outcome. Where probabilities are assigned to different outcomes, we can evaluate the worth of a decision as the expected value or weighted average of these outcomes. Expected value (EV) = weighted average of possible outcomes. The weighted average value is calculated by applying the probability of each possible outcome to the value of the outcome.

Appendix 3: Decision-making with risk and uncertainty
© Emile Woolf Publishing Limited 437
EV = ∑px
Where
p = the probability of each outcome and x = the value of each outcome An EV is a measurement of weighted average value.
A decision might be based on selecting the course of action that offers the highest EV of profit, or the lowest EV of cost. In other words, the ‘decision rule’ is to select the course of action with the highest EV of profit or the lowest EV of cost.
The main advantage of using EVs to make a decision, compared to the decision rules explained earlier, is that it takes into consideration the probability or likelihood of each different possible outcome.
Example A business entity has to decide which of three projects to select for investment. The three projects are mutually exclusive, and only one of them can be selected.
The expected profits from investing in each of the projects will depend on the state of the market. The following estimates of net present value have been prepared:
State of market Diminishing Static Expanding
Probability 0.4 0.3 0.3
$000 $000 $000
Project 1 100 200 900
Project 2 0 650 600
Project 3 180 190 200
(Note: This type of table is called a ‘pay-off table’ or a ‘pay-off matrix’. It shows all the possible ‘pay-offs’ or results – NPV, profit and so on – from different possible decisions or strategies).
Required
Identify which project would be selected if the decision is to choose the project with the highest expected value of NPV.
Answer
State of market Probability Project 1 Project 2 Project 3
NPV EV of NPV
NPV EV of NPV
NPV EV of NPV
$000 $000 $000 $000 $000 $000
Diminishing 0.4 100 40 0 0 180 72
Static 0.3 200 60 650 195 190 57
Expanding 0.3 900 270 600 180 200 60
370 375 189

Paper P5: Advanced performance management
438 © Emile Woolf Publishing Limited
Based on expected values, Project 2 should be selected, because it has the highest EV (although not much higher than the EV for Project 1).
Advantages of using expected values
Using EVs to make a decision has some advantages.
An EV is a weighted average value, that is based on all the different possible outcomes and the probability that each will occur.
It recognises the risk in decisions, based on the probabilities of different possible results or outcomes.
It expresses risk in a single figure.
Disadvantages of using expected values
Using EVs to make a decision also has some disadvantages.
The probabilities of the different possible outcomes may be difficult to estimate.
The EV is unlikely to be an actual outcome that could occur. In the example above, the EVs for projects 1, 2 and 3 (370, 375 and 189) are not expected to occur. They are simply weighted average values.
Unless the same decision has to be made many times, the average will not be achieved. It is therefore not a valid way of making a decision about the future when the outcome will happen only once.
An EV is an average value. It gives no indication of the range or spread of possible outcomes. It is therefore an inadequate measurement of risk.
Example A business entity has a choice of three different projects. They all involve the same amount of capital expenditure, and the entity can only afford one of the three projects. The expected NPV of the three projects will depend on future market conditions, which may be poor (probability 30%) moderate (probability 50%) or good (probability 20%). The following table sets out the NPV for each product for each possible market condition. It also shows the EV of the NPV. (Workings are not shown, but make sure that you can calculate the EVs). Project Poor (0.3) Moderate (0.5) Good (0.2)
NPV NPV NPV EV of NPV
$m $m $m $m
1 (20) 15 60 + 13.5
2 1 10 20 + 9.1
3 (10) 22 38 + 15.6
Using EV as a basis for decision-making, the decision should be to select Project 3. However, an EV is just a weighted average of different possible outcomes. The NPV is more likely to be positive than negative, but there is some risk of a negative NPV. And if the market conditions are good, it would be much better to choose Project 1.

Appendix 3: Decision-making with risk and uncertainty
© Emile Woolf Publishing Limited 439
As explained earlier, there are other ways of making a logical choice between mutually-exclusive projects.
Using the maximax decision rule, Project 1 would be selected because it offers the possibility of the highest possible NPV ($60 million).
Using the maximin decision criterion, the decision would be to choose the project with the maximum ‘minimum NPV’.
Using the maximin approach, Project 2 should be selected because its worst possible outcome is + $1 million, better than the other two projects. Whatever happens, the NPV will be at least $1 million.
Using the minimax regret decision criterion, the choice should be the project where the maximum possible regret is minimised. The following table sets out the regrets: Project Poor (0.3) Moderate (0.5) Good (0.2)
Regret Regret Regret Maximum regret
$m $m $m $m
1 21 7 0 21
2 0 12 40 40
3 11 0 22 22
For example, if the market conditions are moderate, we would not regret choosing Project 3, but if we had chosen Project 1 we would have regretted the decision by $7 million (NPV 22 - NPV 15). Using the minimax regret basis for decision-making, Project 1 should be selected because the maximum amount by which we would regret making this choice is $21 million. This will happen if the market conditions turn out to be poor. There is no ‘correct’ basis for making decisions in conditions of risk or uncertainty. There are, however, different logical approaches to making the choice.

Paper P5: Advanced performance management
440 © Emile Woolf Publishing Limited
Assessing risk in decision-making
Standard deviation of the expected return
Sensitivity analysis
Simulation
2 Assessing risk in decision-making
The decision rules considered so far do not measure risk mathematically. However, when a probability distribution of possible outcomes is available, the decision-maker can analyse the risk using a statistical or mathematical method. The decision is then made by considering both the expected return (for example, the EV of NPV) and the risk. Three approaches to measuring and analysing risk are:
calculating the standard deviation of the expected return
sensitivity analysis
simulation modelling.
For the purpose of the P5 examination, sensitivity analysis is probably the most important of these three analytical rechniques.
2.1 Standard deviation of the expected return
When the possible outcomes from a decision are estimated as a probability distribution, we can calculate both the EV of the expected return and the standard deviation of the expected return. Standard deviation is a statistical measurement of risk or variation. A higher standard deviation indicates higher risk (higher potential variation above or below the EV of return). The formula for calculating the standard deviation of a probability distribution is:
s = S ×−×( )2 prob x( )
Example The original example will again be used. A business entity has to decide which of three projects to select for investment. The three projects are mutually exclusive, and only one of them can be selected. The expected profits from investing in each of the projects will depend on the state of the market. The following estimates of net present value have been prepared:

Appendix 3: Decision-making with risk and uncertainty
© Emile Woolf Publishing Limited 441
State of market Diminishing Static Expanding EV of NPV
Probability 0.4 0.3 0.3
$000 $000 $000 $000
Project 1 100 200 900 370
Project 2 0 500 600 330
Project 3 180 190 200 189
Required
(a) Calculate the standard deviation of the expected NPV for each project.
(b) Consider how the measurements of standard deviation might affect the choice of project.
Answer
Project 1 NPV Probability
x = 370 x p x −x p(x − x )z
Diminishing 100 0.4 - 270 29,160
Static 200 0.3 - 170 8,670
Expanding 900 0.3 570 84,270
122,100
s = 122,100 = (in $000s) 349.4
Project 2 NPV Probability
x = 330 x p x −x p(x− x )z
Diminishing 0 0.4 - 330 43,560
Static 500 0.3 + 170 8,670
Expanding 600 0.3 + 270 21,870
74,100
s = 74,100 = (in $000s) 272.2
Project 3 NPV Probability
x¯ = 189 x p x – x¯ p(x – x¯)2
Diminishing 180 0.4 - 9 32.4
Static 190 0.3 + 1 0.3
Expanding 200 0.3 + 11 36.3
69.0
s = 69 = (in $000s) 8.3

Paper P5: Advanced performance management
442 © Emile Woolf Publishing Limited
Summary
Project EV of NPV Standard deviation
$000 $000
Project 1 370 349.4
Project 2 330 272.2
Project 3 189 8.3
The choice between the three projects can take risk into consideration, as well as the EV of the NPV. In this example the project with the highest EV also has the highest risk, and the project with the lowest EV has the lowest risk. With simple probability distributions, such as the probabilities shown in this example, the standard deviation has no further meaning or practical value. However, if a probability distribution showed the characteristics of a normal distribution (or another recognised probability distribution), it would be possible to carry out further detailed analysis of the risk using normal distribution tables.
Advantages of measuring standard deviation
There are several advantages to measuring the standard deviation of possible outcomes.
A standard deviation gives a numerical value to the spread of possible results around the average or expected value.
It gives recognition to risk in a decision, and quantifies the risk.
It can be used for statistical analysis when it can be assumed that the probability distribution is a normal distribution.
Disadvantages of measuring standard deviation
The meaning or significance of a standard deviation is limited when the probability distribution is not a normal distribution or (other recognisable probability distribution).
2.2 Sensitivity analysis
Sensitivity analysis is a method of risk or uncertainty analysis in which the effect on the expected outcome of changes in the values of key ‘variables’ or key factors are tested. For example, in budget planning, the effect on budgeted profit might be tested for changes in the budgeted sales volume, or the budgeted rate of inflation, or budgeted materials costs, and so on. There are several ways of using sensitivity analysis.
We can estimate by how much an item of cost or revenue would need to differ from their estimated values before the decision would change.

Appendix 3: Decision-making with risk and uncertainty
© Emile Woolf Publishing Limited 443
We can estimate whether a decision would change if estimated sales were x% lower than estimated, or estimated costs were y% higher than estimated. (This is called ‘what if…?’ analysis: for example: ‘What if sales volume is 5% below the expected amount)?
The starting point for sensitivity analysis is the original plan or estimates, giving an expected profit or value. Key variables are identified (such as sales price, sales volume material cost, labour cost, completion time, and so on). The value of the selected key variable is then altered by a percentage amount (typically a reasonable estimate of possible variations in the value of this variable) and the expected profit or value is re-calculated. In this way, the sensitivity of a decision or plan to changes in the value of the key items or key factors can be measured. An advantage of sensitivity analysis is that if a spreadsheet model is used for analysing the original plan or decision, sensitivity analysis can be carried out quickly and easily, by changing one value at a time in the spreadsheet model.
Sensitivity analysis and strategic decision making
In the examination you may be required to do some sensitivity analysis. For example, you may have produced an estimated future outcome of a decision or a strategy, and this expected outcome may fail to meet the strategic objective or target. You may therefore be required to calculate the amount by which a variable or factor in your estimate would need to change in value before the objective or target could be met. With sensitivity analysis, the technique is to assume that the value of all other factors in the forecast or estimate will remain the same, and there is only one factor whose change in value you wish to analyse. This may seem complex, but the following simple examples should illustrate the technique.
Example A company is considering a strategy of making and marketing a new product in its existing markets. Market research has been carried out, which suggests that at a selling price of $6 per unit, sales demand each year will be for 200,000 units. It has also been estimated that the variable cost per unit will be $4 and attributable annual fixed costs for the venture would be $250,000. Required (a) Suppose that the company has established a target minimum profit/sales ratio
of at least 15% for all products. By how much would the variable cost per unit need to be less than the estimated amount for the product to achieve this minimum profit/sales ratio target?

Paper P5: Advanced performance management
444 © Emile Woolf Publishing Limited
(b) Suppose instead that the company has established a target minimum contribution/sales ratio of at least 40% for all products. What would the minimum selling price need to be in order to meet this target?
Answer (a) The expected profit on the basis of the estimated figures is as follows:
$
Sales (200,000 × $6) 1,200,000
Variable costs (200,000 × $4) 800,000
Contribution 400,000
Fixed costs 250,000
Profit 150,000
Profit/sales ratio = 150,000/1,200,000 = 12.5%. This is less than the minimum target of 15%.
Given no change in any of the other variables (sales price, sales volume or
fixed costs, the amount by which the variable cost per unit need to be less than the estimated amount of $4 is calculated as follows.
$
Estimated annual sales 1,200,000
Minimum profit required to meet target (15%) 180,000
Current estmate of profit 150,000
Amount by which annual profit (and contribution) must increase 30,000
To increase the annual profit by $30,000, the variable cost per unit would need
to be lower by $30,000/200,000 units = $0.15 per unit. This is 3.75% less than the current estimate, which means that the maximum variable cost per unit should be $3.85.
Management may then wish to consider possible strategies for reducing the
variable cost per unit by $0.15. (b) The estimated contribution/sales ratio is 33.3% ($2/$6). Given no change in
the variable cost per unit, the minimum sales price required to meet the minimum target C/S ratio is calculated as follows:
Minimum C/S ratio = 40%. Therefore maximum ratio of variable cost/sales = 60%. Variable cost = $4. Therefore minimum sales price = $4/60% = $6.67.

Appendix 3: Decision-making with risk and uncertainty
© Emile Woolf Publishing Limited 445
Summary: sensitivity analysis and decision-making
To carry out sensitivity analysis within a strategic planning or decision making process, the basic technique is to:
Calculate the expected outcome (for example, annual profit) on the basis of current estimates
Establish the minimum required outcome in order to meet the strategic target or objective.
Calculate the gap between these two – current expected outcome and target outcome.
Given no change in the value of any of the other variables, calculate by how much the selected item needs to change in value in order to meet the target or objective.
2.3 Simulation
Simulation modelling is used when a plan or budget is represented by a mathematical model. The model will contain a large number of inter-related variables (sales volumes of each product, sales prices of each product, availability of constraining resources, resources per unit of product, costs of materials and labour, and so on). The model is then used to calculate the value of the outcome or result, for a given set of values for each variable. It is then used to produce the expected outcome or result again, with a different set of values for each variable. The model is used to prepare a large number of different possible outcomes, each time with different combinations of values for all the variables. As a result, the model will produce a range of many different possible results or outcomes that can be analysed statistically, by putting the possible outcomes into a probability distribution. Simulation modelling therefore leads on to further statistical analysis of risk. One example of simulation is a mathematical model which could be approached using the ‘Monte Carlo’ method. With Monte Carlo simulation, a probability distribution for the possible different values for each variable is used to allocate random numbers to each possible value. Random number allocations are given to all the different possible values for every input variable in the model. (The random number allocation should reflect the probability distribution). A special computer program can be used to generate random numbers, and the random numbers generated by the program are used to give a value to each variable in the model. These values are then used to calculate the result or outcome that would occur. Repeating the simulation many times produces a probability distribution of the possible outcomes.

Paper P5: Advanced performance management
446 © Emile Woolf Publishing Limited
Advantage of the Monte Carlo method
The advantages of Monte Carlo simulation modelling are as follows:
It gives more information about the possible outcomes and their relative probabilities.
It is useful for problems which cannot be solved analytically.
Limitation of the Monte Carlo method
It is not a technique for making a decision, only for getting more information about the risk and the probability of different possible outcomes.

© Emile Woolf Publishing Limited 447
Paper P5 Advanced performance management
AP
PE
ND
IX
4
Budgeting and quantitative techniques
in budgeting
Contents
1 Functional budgets
2 Analysing costs into fixed and variable
3 Forecasting techniques
4 Uncertainty in budgeting
5 The learning curve

Paper P5: Advanced performance management
448 © Emile Woolf Publishing Limited
Functional budgets
The master budget
The sales budget
The production budget
The direct materials usage budget
The direct labour budget
The purchases budget
Budgeted income statement
1 Functional budgets
1.1 The master budget
A ‘master budget’ is the budget for an entire organisation, and consists of functional budgets, together with:
a budgeted income statement for the financial year
a cash budget
a budgeted balance sheet as at the year end
possibly, a capital expenditure budget (covering more than one financial year, but updated on a ‘rolling’ basis each year).
An examination question might ask you to prepare functional budgets or a cash budget. This chapter describes the logical approach that can normally be used to prepare budgets for a manufacturing organisation. (The mathematics of budgeting for service industry organisations are usually easier). It is assumed here that the key budget factor is sales demand, and the initial function budget to prepare is the sales budget. The following example will be used to illustrate the preparation of the functional budgets. In practice, budgets are usually prepared with computer models, such as a spreadsheet model. This chapter demonstrates the logic of budget preparation.
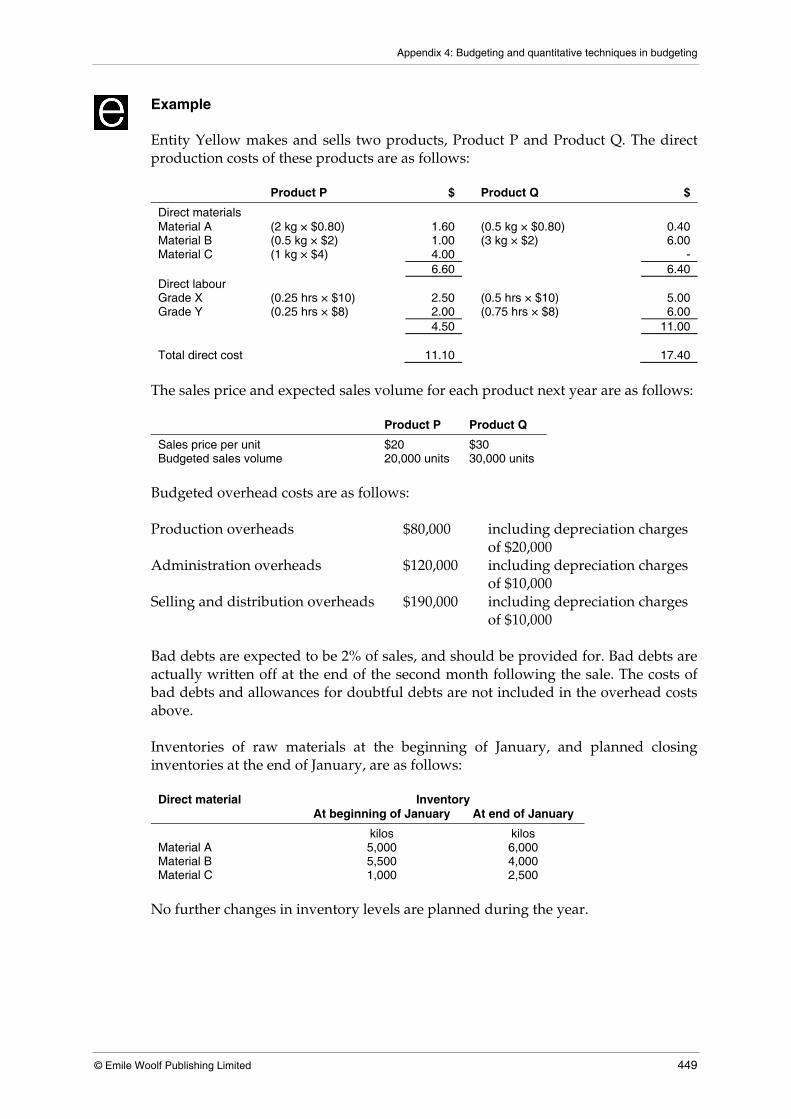
Appendix 4: Budgeting and quantitative techniques in budgeting
© Emile Woolf Publishing Limited 449
Example Entity Yellow makes and sells two products, Product P and Product Q. The direct production costs of these products are as follows:
Product P $ Product Q $
Direct materials Material A (2 kg × $0.80) 1.60 (0.5 kg × $0.80) 0.40 Material B (0.5 kg × $2) 1.00 (3 kg × $2) 6.00 Material C (1 kg × $4) 4.00 - 6.60 6.40 Direct labour Grade X (0.25 hrs × $10) 2.50 (0.5 hrs × $10) 5.00 Grade Y (0.25 hrs × $8) 2.00 (0.75 hrs × $8) 6.00 4.50 11.00 Total direct cost 11.10 17.40
The sales price and expected sales volume for each product next year are as follows:
Product P Product Q
Sales price per unit $20 $30 Budgeted sales volume 20,000 units 30,000 units
Budgeted overhead costs are as follows: Production overheads $80,000 including depreciation charges
of $20,000 Administration overheads $120,000 including depreciation charges
of $10,000 Selling and distribution overheads $190,000 including depreciation charges
of $10,000 Bad debts are expected to be 2% of sales, and should be provided for. Bad debts are actually written off at the end of the second month following the sale. The costs of bad debts and allowances for doubtful debts are not included in the overhead costs above. Inventories of raw materials at the beginning of January, and planned closing inventories at the end of January, are as follows:
Direct material Inventory At beginning of January At end of January
kilos kilos Material A 5,000 6,000 Material B 5,500 4,000 Material C 1,000 2,500
No further changes in inventory levels are planned during the year.
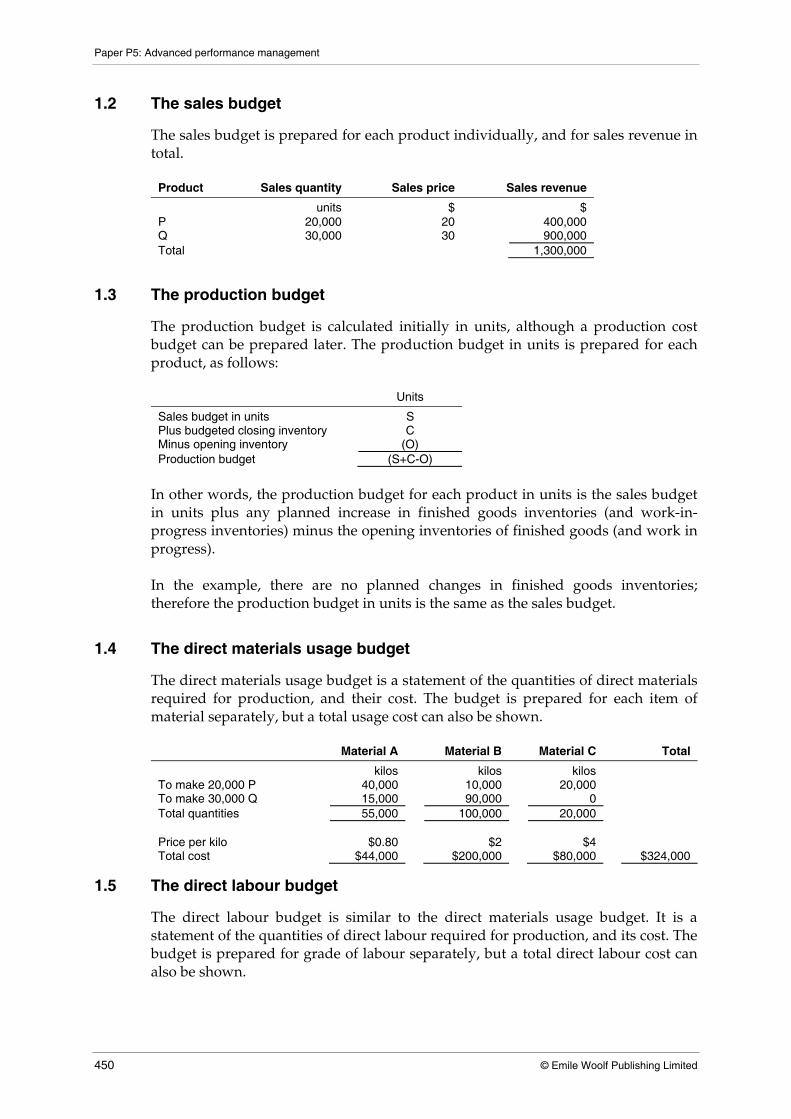
Paper P5: Advanced performance management
450 © Emile Woolf Publishing Limited
1.2 The sales budget
The sales budget is prepared for each product individually, and for sales revenue in total.
Product Sales quantity Sales price Sales revenue
units $ $ P 20,000 20 400,000 Q 30,000 30 900,000 Total 1,300,000
1.3 The production budget
The production budget is calculated initially in units, although a production cost budget can be prepared later. The production budget in units is prepared for each product, as follows:
Units
Sales budget in units S Plus budgeted closing inventory C Minus opening inventory (O) Production budget (S+C-O)
In other words, the production budget for each product in units is the sales budget in units plus any planned increase in finished goods inventories (and work-in-progress inventories) minus the opening inventories of finished goods (and work in progress). In the example, there are no planned changes in finished goods inventories; therefore the production budget in units is the same as the sales budget.
1.4 The direct materials usage budget
The direct materials usage budget is a statement of the quantities of direct materials required for production, and their cost. The budget is prepared for each item of material separately, but a total usage cost can also be shown.
Material A Material B Material C Total
kilos kilos kilos To make 20,000 P 40,000 10,000 20,000 To make 30,000 Q 15,000 90,000 0 Total quantities 55,000 100,000 20,000 Price per kilo $0.80 $2 $4 Total cost $44,000 $200,000 $80,000 $324,000
1.5 The direct labour budget
The direct labour budget is similar to the direct materials usage budget. It is a statement of the quantities of direct labour required for production, and its cost. The budget is prepared for grade of labour separately, but a total direct labour cost can also be shown.

Appendix 4: Budgeting and quantitative techniques in budgeting
© Emile Woolf Publishing Limited 451
Grade X Grade Y Total
hours hours To make 20,000 P 5,000 5,000 To make 30,000 Q 15,000 22,500 Total hours 20,000 27,500 Cost per hour $10 $8 Total cost $200,000 $220,000 $420,000
1.6 The purchases budget
The purchases budget is the budget for materials purchases. The purchases budget might be prepared for all materials, direct and indirect, or for direct materials only. The purchases budget differs from the materials usage budget by the amount of the planned increase or decrease in inventory levels of materials in the budget period. The purchase quantities are calculated first, and these are converted into a purchases cost at the budgeted price for each material item. Purchase quantities are calculated as follows:
Units
Material usage budget in units S Plus budgeted closing inventory C Minus opening inventory (O) Purchases budget, in units (S+C-O)
The purchases budget in our example is as follows:
Material A Material B Material C Total
kilos kilos kilos Usage budget 55,000 100,000 20,000 Closing inventory 6,000 4,000 2,500 61,000 104,000 22,500 Opening inventory (5,000) (5,500) (1,000) Budgeted purchases 56,000 98,500 21,500 Price per kilo $0.80 $2 $4 Purchases budget in $ $44,800 $197,000 $86,000 $327,800
1.7 Budgeted income statement
The functional budgets, together with budgets for the overhead costs and any other items of cost, should be sufficient to prepare a budgeted income statement for the period. In our example, we need to remember that the bad and doubtful debt provisions for the year are expected to be 2% × $1,300,000 = $26,000

Paper P5: Advanced performance management
452 © Emile Woolf Publishing Limited
The budgeted income statement below is presented using marginal costing.
Product P Product Q Total
$ $ $ Sales 400,000 900,000 1,300,000 Variable cost of sales Direct materials 132,000 192,000 324,000 Direct labour 90,000 330,000 420,000 Total variable costs 222,000 522,000 744,000 Contribution 178,000 378,000 556,000 $ Production overheads 80,000 Administration overheads 120,000 Sales and distribution overheads 190,000 Bad and doubtful debts 26,000 416,000 Budgeted profit 140,000

Appendix 4: Budgeting and quantitative techniques in budgeting
© Emile Woolf Publishing Limited 453
Analysing costs into fixed and variable
The need to estimate fixed and variable costs
High low method
Linear regression analysis
2 Analysing costs into fixed and variable
2.1 The need to estimate fixed and variable costs
To prepare accurate cost budgets, it is important to understand how costs ‘behave’. Cost behaviour refers to the way in which total costs increase as the volume of an activity increases. It is commonly assumed that total costs can be analysed into fixed costs and a variable cost per unit of activity, such as a variable cost per unit of product or per hour of service. Some overhead costs are a mixture of fixed costs and variable costs, but these can be separated into a fixed cost portion and a variable cost portion. To prepare reliable cost budgets or cost estimates, it may be necessary to estimate fixed costs and variable costs.
Direct material costs are normally 100% variable costs.
Direct labour costs may be treated as variable costs. However, when there is a fixed labour force, direct labour costs may be budgeted as a fixed cost.
Overhead costs maybe treated as fixed costs. However, for an accurate analysis of overhead costs, it may be necessary to make an estimate of fixed costs and variable costs. These estimates are often based on an analysis of historical costs.
You should be familiar already with two techniques for estimating fixed and variable costs:
the high low method
linear regression analysis.
It is unlikely that you will be expected to use either technique in your examination. However, you might be required to comment on each technique, and its reliability as a forecasting/budgeting technique to estimate costs.
2.2 High low method
The high low method provides an estimate of fixed and variable costs for an activity by taking two historical costs:
the total costs for the highest recorded volume of the activity, and
the total costs for the lowest recorded volume of the activity.

Paper P5: Advanced performance management
454 © Emile Woolf Publishing Limited
Where appropriate, one or both cost figures is adjusted to allow for price inflation, to bring them to the same price level. It is assumed that these two historical records of cost are an accurate guide to expected costs for the activity.
Example A company is trying to estimate its fixed and variable production overhead costs in each month. It has the following historical data of costs in the previous five months:
Production volume Total cost
000 units $000 8 25 6 22 6 19 9 24 5 16
Required
(a) Use this data to estimate fixed costs each month and the variable cost per unit, using the high low method.
(b) What should be the estimated costs for production overheads next month if the expected volume of production is 8,000 units?
Answer Using this data and the high low method, the fixed production overhead costs per month and the variable production overhead cost per unit would be estimated as follows:
The highest production volume in the available data is 9,000 units.
The lowest production volume in the available data is 5,000 units.
These are assumed to be reliable measures of cost.
The difference between the two total cost figures consists of variable costs only, because fixed costs are the same at each output volume.
units $
High Total overhead cost of 9,000 = 24,000 Low Total overhead cost of 5,000 = 16,000 Difference Variable cost of 4,000 = 8,000
Variable production overhead cost per unit = $8,000/4,000 = $2. This variable cost per unit should be used with either the high or low output volume and total cost to calculate the fixed costs per month.

Appendix 4: Budgeting and quantitative techniques in budgeting
© Emile Woolf Publishing Limited 455
$
Total cost of 9,000 units 24,000 Variable cost of 9,000 units (× $2) 18,000 Fixed costs per month 6,000
For the purpose of budgeting or cost estimation, production overhead costs will be fixed costs of $6,000 per month and a variable cost of $2 per unit produced.
Comment on the high low method
The high low method is a simple method of separating mixed costs into fixed and variable cost elements. However, it is based on the assumption that two historical records of cost are reliable indicators of cost behaviour. This assumption may be invalid, and estimates of fixed and variable costs may therefore be unreliable.
2.3 Linear regression analysis
Linear regression analysis is a technique for estimating a ‘line of best fit’ from historical data. It can be used for analysing historical data for costs in order to estimate fixed costs and variable costs. It can also be used to analyse a historical trend, for example a historical trend in sales volume, in order to prepare a forecast for future periods, on the assumptions that the trend:
is upward or downward in a ‘straight line’, and
the historical trend will continue in a straight line in the future.
Linear regression analysis is a more accurate forecasting method than the high low method. Like the high low method, it assumes that there is a straight-line formula y = a + bx. It also uses historical data to produce an estimate for the values of a and b. However, unlike the high low method, it uses any number of historical data items, not just two (the high and the low data items). The formulae are, for y = a + bx:
n
xb
n
ya ∑∑ −=
( )22 xxn
yxyxnb
∑∑∑∑∑
−
−=
Where a = fixed costs in each period b = variable cost per unit x, y = historical data, for example for activity level (x) and total cost (y) n = the number of data items used It is most unlikely that you will be asked to estimate fixed and variable costs using linear regression analysis. However, you should be familiar with the techniques from your earlier studies. For your examination, you might be required to comment

Paper P5: Advanced performance management
456 © Emile Woolf Publishing Limited
on the reliability of linear regression analysis as a technique for estimating fixed and variable costs. The technique will be illustrated using the same data that was used earlier to demonstrate the high low method.
Example A company is trying to estimate its fixed and variable production overhead costs in each month. It has the following historical data of costs in the previous five months:
Production volume Total cost
000 units $000 8 25 6 22 6 19 9 24 5 16
Required
(a) Use this data to estimate fixed costs each month and the variable cost per unit, using the high low method.
(b) What should be the estimated costs for production overheads next month if the expected volume of production is 8,000 units?
Answer The number of items of data: n = 5 The other values for the formulae are calculated as follows:
Production volume Total cost
x y xy x2 8 25 200 64 6 22 132 36 6 19 114 36 9 24 216 81 5 16 80 25 34 106 742 242
The values for y are the total costs and the values for x are the activity/output volumes. Σ x = 34 Σ y = 106 Σ xy = 742 Σ x2 = 242 n = 5 The formulae can now be used to establish a value for b and then a.

Appendix 4: Budgeting and quantitative techniques in budgeting
© Emile Woolf Publishing Limited 457
b =5 742( )− 34( )106( )
5 242( )− 34( )2
= 3,710− 3,604
1, 210−1,156= 106
54
b =1.96
a = 106
5−
1.96 34( )5
a = 21.2−13.3 = 7.9
The estimate of costs is therefore = 7,900 + 1.96x.
When output x = 8,000 units, the estimated total costs will be:
Total costs = $7,900 + (8,000 × $1.96) = $23,580, say $23,600.
The estimate of total costs using the high low method was $22,000.
Comment on linear regression analysis
Linear regression analysis should be more reliable than the high low method as a method of estimating fixed and variable costs, because it is based on more items of historical data.
However, it is not necessarily reliable. It assumes that total costs vary with changes in the selected activity. This assumption might be incorrect. Total costs may change in response to other factors, not the selected activity. For example, it might be assumed that the total costs of distribution will vary with the volume of sales, when it might be more appropriate to assume that total costs vary with the number of customer orders handled.
An advantage of linear regression analysis is that the reliability of estimates can be tested by calculating a correlation coefficient.
Correlation
Correlation refers to the extent to which values for y can be predicted from any given value for x, using the values for a and b obtained from linear regression analysis.
A high degree of correlation indicates that values for y can be estimated with a reasonable degree of confidence from values of x.
A low degree of correlation indicates that values for y estimated from any given value of x will not be particularly reliable.
The extent of correlation between values of x and values of y can be measured by a correlation coefficient, r. The correlation coefficient is calculated using the following formula:
( )[ ] ( )[ ]2222 yynxxn
yxxynr
∑−∑∑−∑
∑∑−∑=

Paper P5: Advanced performance management
458 © Emile Woolf Publishing Limited
If you look at the formula carefully, you should notice that most of the values in the formula are the same as the values used to calculate b in the linear regression analysis formula. The only additional values you need are for n∑y2 and (∑y)2. The value of r produced by this formula must always be within the range – 1 to + 1.
When r is close to + 1, there is a high degree of positive correlation. When r = + 1, there is perfect positive correlation, and all the pairs of data for x and y that have been used to estimate the values for a and b lie on a straight line, y = a + bx, when drawn graphically.
When r is close to - 1, there is a high degree of negative correlation. When r = - 1, there is perfect negative correlation, and all the pairs of data for x and y that have been used to estimate the values for a and b lie on a straight line, y = a - bx, when drawn graphically.
When r is 0, there is no correlation at all between the values of x and the values of y, and the linear regression formula would be completely unreliable. Correlation probably needs to be at the very least between 0.80 and 1.00 or between – 0.80 and – 1.00 to be considered of much significance.
Example The correlation coefficient can be calculated for the previous example, as follows:
Production volume Total cost
x y xy x2 y2 8 25 200 64 625 6 22 132 36 484 6 19 114 36 361 9 24 216 81 576 5 16 80 25 256 34 106 742 242 2,302
r = 106
54[ ] 5 2, 302( )− 106( )2[ ]
= 106
54( ) 274( )
r = 106/121.6 = + 0.87. Here, there is a reasonably strong positive correlation between the values of x and the values of y that are estimated using the linear regression formula.
Linear regression analysis and forecasting
Linear regression analysis can also be used in forecasting, where it can be assumed that there has been a linear trend in the past, and this same linear trend will continue into the future. Exactly the same method is used in forecasting as for estimating fixed and variable costs. The trend line is a formula y = a + bx, where x is the year or month. To simplify the arithmetic, you should number the years 1, 2, 3, 4 and so on (or even start at year 0, and number the years 0, 1, 2, 3 and so on).

Appendix 4: Budgeting and quantitative techniques in budgeting
© Emile Woolf Publishing Limited 459
Forecasting techniques
The nature of a time series
Trends and seasonal variations
Estimating seasonal variations
3 Forecasting techniques
In order to prepare budgets, it is necessary to make forecasts. The learning curve and linear regression analysis are both techniques for forecasting costs, and linear regression analysis can also be used to prepare other forecasts, such as forecasts of sales. You need to be aware of other forecasting techniques that might be used in budgeting, why they are used, and the extent to which management can rely on them. A common type of forecast is a forecast of a trend or time series, where there are likely to be seasonal variations in the trend.
3.1 The nature of a time series
A time series is a record of amounts or values in each period of time over a longer time period. Examples of a time series are sales each month over a period of five years, or the volume of production each year over a period of ten years. It is sometimes assumed that a time series has a predictable pattern, so that what has happened in the past can be used to predict the future. If it is assumed that there has been a straight-line trend in the past that will continue into the future, linear regression analysis can be used to forecast future values in future periods. This has been explained earlier.
3.2 Trends and seasonal variations
Sometimes, it might be assumed that there is an underlying trend, possibly a straight-line trend, but there are seasonal variations. For example, sales every month might be rising in a straight-line trend, but with variations up or down each month according to the month of the year. Regularly, sales in some months are higher than sales in other months. A straight-line trend can be assumed to exist in the long run, provided that the average seasonal variations above the line equal the average seasonal variations below the line. Average seasonal variations can be estimated, and to prepare budgets or forecasts for the future, the seasonal variation is added to or subtracted from the straight-line trend forecast, to obtain a seasonal forecast.

Paper P5: Advanced performance management
460 © Emile Woolf Publishing Limited
3.3 Estimating seasonal variations
A method of estimating seasonal variations and using these to prepare forecasts will be illustrated with an example.
Example A company has used sales records for each quarter of the year for the past few years to prepare an estimate of the trend in sales each quarter. The straight-line trend in quarterly sales is y = 150,000 + 10,000x where x = the quarter in the time series, where 0 = the sales in the first quarter of 20X1. The actual sales in each quarter are shown in the table below. These are compared with the sales that would be forecast, using a straight-line trend of y = 150,000 + 10,000x. The differences are shown in the right-hand column as seasonal variations.
Time period
Actual sales
Estimated sales, using trend line y = 150,000 + 10,000x
Difference = seasonal variation
$ $ $ Quarter 1, 20X1 119,200 150,000 - 30,800 Quarter 2, 20X1 167,500 160,000 + 7,500 Quarter 3, 20X1 219,200 170,000 +49,200 Quarter 4, 20X1 151,500 180,000 - 28,500 Quarter 1, 20X2 162,000 190,000 - 28,000 Quarter 2, 20X2 203,700 200,000 + 3,700 Quarter 3, 20X2 258,400 210,000 + 48,400 Quarter 4, 20X2 199,700 220,000 - 20,300 Quarter 1, 20X3 200,400 230,000 - 29,600 Quarter 2, 20X3 248,000 240,000 + 8,000 Quarter 3, 20X3 296,200 250,000 + 46,200 Quarter 4, 20X3 237,200 260,000 - 22,800 Quarter 1, 20X4 242,000 270,000 - 27,000 Quarter 2, 20X4 284,800 280,000 + 4,800 Quarter 3, 20X4 341,200 290,000 + 41,200 Quarter 4, 20X4 276,400 300,000 - 23,600
These figures can be used to calculate an average seasonal variation for each quarter of the year. However, the total seasonal variations must add up to 0, otherwise a straight-line trend does not exist. A simple adjustment is therefore made so that the seasonal variations do add up to 0.

Appendix 4: Budgeting and quantitative techniques in budgeting
© Emile Woolf Publishing Limited 461
Seasonal variations
Quarter 1
Quarter 2
Quarter 3
Quarter 4
Total
$ $ $ $ $ 20X1 - 30,800 + 7,500 + 49,200 - 28,500 20X2 - 28,000 + 3,700 + 48,400 - 20,300 20X3 - 29,600 + 8,000 + 46,200 - 22,800 20X4 - 27,000 + 4,800 + 41,200 - 23,600 Total - 115,400 + 24,000 + 185,000 - 95,200 Average - 28,850 + 6,000 + 46,250 - 23,800 - 400 Adjustment to 0 + 100 + 100 + 100 + 100 + 400 Adjusted average - 28,750 + 6,100 + 46,350 - 23,700
Sales forecast for 20X5
Time period
Estimated sales, using trend line y = 150,000 + 10,000x
Seasonal variation
Sales forecast
$ $ $ Quarter 1, 20X5 (x = 16) 310,000 - 27,750 282,250 Quarter 2, 20X5 (x = 17) 320,000 + 6,100 326,100 Quarter 3, 20X5 (x = 18) 330,000 +46,350 376,350 Quarter 4, 20X5 (x = 19) 340,000 - 23,700 316,300
The reliability of forecasts of trends and seasonal variations
Forecasts using estimated trends and seasonal variations are based on the assumptions that the past is a reliable guide to the future. This assumption may be incorrect. However, forecasts must be made; otherwise it is impossible to make plans beyond the very short term. The techniques described in this chapter, although they might prove inaccurate, are used because there is no better alternative.

Paper P5: Advanced performance management
462 © Emile Woolf Publishing Limited
Uncertainty in budgeting
The nature of uncertainty in budgeting
Flexible budgets
Probabilities and expected values
Spreadsheets and ‘what if’ analysis
4 Uncertainty in budgeting
4.1 The nature of uncertainty in budgeting
Uncertainty arises when there is a lack of reliable information. In budgeting, there is uncertainty because estimates and forecasts may be unreliable. Information is almost never 100% reliable (or ‘perfect’), and some uncertainty in budgeting is therefore inevitable. Risk arises in business because actual events may turn out better or worse than expected. For example, actual sales volume may be higher or lower than forecast. The amount of risk in business operations varies with the nature of the operations. Some operations are more predictable than others. The existence of risk means that forecasts and estimates in the budget, which are based on expected results, may not be accurate. Both risk and uncertainty mean that estimates and forecasts in a budget are likely to be wrong. Management should be aware of risk and uncertainty when preparing budgets and when monitoring performance.
When preparing budgets, it may be appropriate to look at several different forecasts and estimates, to assess the possible variations that might occur. In other words, managers should think about how much better or how much worse actual results may be, compared with the budget.
When monitoring actual performance, managers should recognise that adverse or favourable variances might be caused by weaknesses in the original forecasts, rather than by good or bad performance.
Several approaches may be used for analysing risk and uncertainty in budgets. These include:
flexible budgets
using probabilities and expected values
using spreadsheet models and ‘what if’ analysis (sensitivity analysis)
stress testing.

Appendix 4: Budgeting and quantitative techniques in budgeting
© Emile Woolf Publishing Limited 463
4.2 Flexible budgets
Flexible budgets may be prepared during the budget-setting process. A flexible budget is a budget based on an assumption of a different volume of output and sales than the volume in the master budget or ‘fixed budget’. For example, a company might prepare its master budget on the basis of estimated sales of $100 million. Flexible budgets might be prepared on the basis that sales will be higher or lower – say $80 million, $90 million, $110 million and $120 million. Each flexible budget will be prepared on the basis of assumptions about fixed and variable costs, such as increases or decreases in fixed costs if sales rise above or fall below a certain amount, or changes in variable unit costs above a certain volume of sales. During the financial year covered by the budget, it may become apparent that actual sales and production volume will be higher or lower than the fixed budget forecast. In such an event, actual performance can be compared with a suitable flexible budget. Flexible budgets can be useful, because they allow for the possibility that actual activity levels may be higher or lower than forecast in the master budget. The main disadvantage of flexible budgets could be the time and effort needed to prepare them. The cost of preparing them could exceed the benefits of having the information that they provide.
4.3 Probabilities and expected values
Estimates and forecasts in budgeting may be prepared using probabilities and expected values. An expected value is a weighted average value calculated with probabilities.
Example A company is preparing a sales budget. The budget planners believe that the volume of sales next year will depend on the state of the economy.
State of the economy Sales for the year
$ million No growth 40 Low growth 50 Higher growth 70
It has been estimated that there is a 60% probability of no growth, a 30% probability of low growth and a 10% probability of higher growth. The expected value (EV) of sales next year could be calculated as follows:
State of the economy Sales for the year Probability EV of sales
$ million $ million No growth 40 0.6 24 Low growth 50 0.3 15 Higher growth 70 0.1 7 EV of sales 46

Paper P5: Advanced performance management
464 © Emile Woolf Publishing Limited
The company might decide to prepare a sales budget on the assumption that annual sales will be $46 million.
The problems with using probabilities and expected values
There are two problems that might exist with the use of probabilities and expected values.
The estimates of probability might be subjective, and based on the judgement or opinion of a forecaster. Subjective probabilities might be no better than educated guesses. Probabilities should have a rational basis.
An expected value is most useful when it is a weighted average value for an outcome that will happen many times in the planning period. If the forecast event happens many times in the planning period, weighted average values are suitable for forecasting. However, if an outcome will only happen once, it is doubtful whether an expected value has much practical value for planning purposes.
This point can be illustrated with the previous example of the EV of annual sales. The forecast is that sales will be $40 million (0.60 probability), $50 million (0.30 probability) or $70 million (0.10 probability). The EV of sales is $46 million.
The total annual sales for the year is an outcome that occurs only once. It is doubtful whether it would be appropriate to use $46 million as the budgeted sales for the year. A sales total of $46 million is not expected to happen.
It might be more appropriate to prepare a fixed budget on the basis that sales will be $40 million (the most likely outcome) and prepare flexible budgets for sales of $50 million and $70 million.
When the forecast outcome happens many times in the planning period, an EV might be appropriate. For example, suppose that the forecast of weekly sales of a product is as follows:
Weekly sales Probability EV of weekly sales
$ $ 7,000 0.5 3,500 9,000 0.3 2,700
12,000 0.2 2,400 8,600
Since there are 52 weeks in a year, it would be appropriate to assume that weekly sales will be a weighted average amount, or EV. The budget for annual sales would be (52 × $8,600) = $447,200. If the probability estimates are fairly reliable, this estimate of annual sales should be acceptable as the annual sales budget.
4.4 Spreadsheets and ‘what if’ analysis
Preparing budgets is largely a ‘number crunching’ exercise, involving large amounts of calculations. This aspect of budgeting was made much easier, simpler and quicker with IT and the development of computer-based models for budgeting. Spreadsheet models, or similar planning models, are now widely used to prepare budgets.

Appendix 4: Budgeting and quantitative techniques in budgeting
© Emile Woolf Publishing Limited 465
A feature of computer-based budget models is that once the model has been constructed, it becomes a relatively simple process to prepare a budget. Values are input for the key variables, and the model produces a complete budget. Amendments to a budget can be made quickly. A new budget can be produced simply by changing the value of one or more input variables in the budget model. This ability to prepare new budgets quickly by changing a small number of values in the model also creates opportunities for sensitivity analysis and stress testing. The budget planner can test how the budget will be affected if forecasts and estimates are changed, by asking ‘what if’ questions. For example:
What if sales volume is 5% below the budget forecast?
What if the sales mix of products is different?
What if the introduction of the new production system or the new IT system is delayed by six months?
What if interest rates go up by 2% more than expected?
What if the fixed costs are 5% higher and variable costs per unit are 3% higher?
Sensitivity analysis and stress testing are similar.
Sensitivity analysis considers variations to estimates and input values in the budget model that have a reasonable likelihood of happening. For example, variable unit costs might be increased by 5% or sales forecasts reduced by 5%.
Stress testing considers the effect of much greater changes to the forecasts and estimates. For example, what might happen of sales are 20% less than expected? Or what might happen if the price of a key raw material increases by 50%?
The answers to ‘what if’ questions can help budget planners to understand more about the risk and uncertainty in the budget, and the extent to which actual results might differ from the expected outcome in the master budget. This can provide valuable information for risk management, and management can assess the ‘sensitivity’ of their budget to particular estimates and assumptions.

Paper P5: Advanced performance management
466 © Emile Woolf Publishing Limited
The learning curve
Learning curve theory
The learning curve model
Graph of the learning curve
Formula for the learning curve
Conditions for the learning curve to apply
Implications of the learning curve
Weaknesses in the application of learning curve theory
5 The learning curve
5.1 Learning curve theory
When a work force begins a task for the first time, and the task then becomes repetitive, it will probably do the job more quickly as it learns. It will find quicker ways of performing tasks, and will become more efficient as knowledge and understanding increase. When a task is well-established, the learning effect wears out, and the time to complete the task becomes the same every time the task is carried out. However, during the learning period, the time to complete each subsequent task can fall by a very large amount. The learning curve effect was first discovered in the US during the 1940s, in aircraft manufacture. Aircraft manufacture is a highly-skilled task, where:
the skill of the work force is important, and
the labour time is a significant element in production resources and production costs.
The time taken to produce the first unit of a new model of an aeroplane might take a long time, but the time to produce the next unit is much less, and the time to produce the third is even less, and so on. Labour times per extra unit therefore fall.
5.2 The learning curve model
The effect of the learning curve can be predicted mathematically, using a learning curve model. This model was developed from actual observations and analysis in the US aircraft industry. The learning curve is measured as a percentage learning curve effect. For example, for a particular task, there might be an 80% learning curve effect, or a 90% learning curve effect, and so on. When there is an 80% learning curve, the cumulative average time to produce units of an item is 80% of what it was before, every time that output doubles.

Appendix 4: Budgeting and quantitative techniques in budgeting
© Emile Woolf Publishing Limited 467
The cumulative average time per unit is the average time for all the units made so far, from the first unit onwards.
This means, for example, that if an 80% learning curve applies, the average time for the first two units is 80% of the average time for the first one unit. Similarly, the average time for the first four units is 80% of the average time for the first two units.
Example The time to make a new model of a sailing boat is 100 days. It has been established that in the boat-building industry, there is an 80% learning curve. Required
Calculate:
(a) the cumulative average time per unit for the first 2 units, first 4 units, first 8 units and first 16 units of the boat
(b) the total time required to make the first 2 units, the first 4 units, the first 8 units and the first 16 units
(c) the additional time required to make the second unit, the 3rd and 4th units, units 5 – 8 and units 9 – 16.
Answer
Total units (cumulative)
Cumulative average time per unit
Total time for all units
Incremental time for additional units
Average time for additional units
days days days days 1 100 100 100 2 80 160 60 60 4 64 256 96 48 8 51.2 409.6 153.6 38.4 16 40.96 655.36 245.76 30.72
Example The first unit of a new model of machine took 1,600 hours to make. A 90% learning curve applies. How much time would it take to make the first 32 units of this machine?
Answer Average time for the first 32 units = 1,600 hours × 90% × 90% × 90% × 90% × 90% = 944.784 hours Total time for the first 32 units = 32 × 944.784 hours = 30,233 hours.

Paper P5: Advanced performance management
468 © Emile Woolf Publishing Limited
5.3 Graph of the learning curve
The learning curve can be shown as a graph. There are two graphs following. The left-hand graph shows the cumulative average time per unit. This falls rapidly at first, but the learning effect eventually ends and the average time for each additional unit becomes constant (a standard time). The right hand graph shows how total costs increase. The total cost line is a curved line initially, because of the learning effect.
5.4 Formula for the learning curve
The learning curve is represented by the following formula (mathematical model). Learning curve: y = axb
Where y = the cumulative average time per unit for all units made x = the number of units made so far (cumulative number of units) a = the time for the first unit b = the learning factor.
The learning factor b =
Logarithm of learning rateLogarithm of 2
The learning rate is expressed as a decimal, so if the learning curve is 80%, the learning factor is: (logarithm 0.80/logarithm 2) To use this formula you must be able to calculate logarithms. Make sure that you know how to use the logarithms function on your calculator.
Example If there is an 80% learning curve, the learning factor is calculated as follows:
Logarithm 0.80Logarithm 2
= − 0.096910.30103
= − 0.32193

Appendix 4: Budgeting and quantitative techniques in budgeting
© Emile Woolf Publishing Limited 469
The learning curve formula is therefore: y = ax - 0.32193
It might help to remember that x - 0.32913 is another way of writing X0.32193
1
Going back to the previous example, the cumulative average time to produce eight units can therefore be calculated as:
80.321931
100y ×=
= 100 (0.512) = 51.20
y = 100 × ⎟⎟⎠
⎞⎜⎜⎝
⎛80.32913
1
Example It will take 500 hours to complete the first unit of a new product. There is a 95% learning curve effect. Calculate how long it will take to produce the seventh unit.
Answer The time to produce the seventh unit is the difference between:
the total time to produce the first six units, and
the total time to produce the first seven units.
(1) Learning factor
Logarithm 0.95Logarithm 2
= − 0.022276390.30103
= − 0.074
(2) Average time to produce the first 6 units
0.07461
500y ×=
= 500 (0.8758239) = 437.9 hours per unit
(3) Average time to produce the first seven units
0.07471
500y ×=

Paper P5: Advanced performance management
470 © Emile Woolf Publishing Limited
= 500 (0.86589) = 432.9 hours per unit
(4) Time to produce the 7th unit
Hours
Total time for the first 7 units (7 × 432.9) 3,030.3
Total time for the first 6 units (6 × 437.9) 2,627.4
Time for the 7th unit 402.9
5.5 Conditions for the learning curve to apply
The learning curve effect will only apply in the following conditions:
There must be stable conditions for the work, so that learning can take place. For example, labour turnover must not be high; otherwise the learning effect is lost. The time between making each subsequent unit must not be long; otherwise the learning effect is lost because employees will forget what they did before.
The activity must be labour-intensive, so that learning will affect the time to complete the work.
There must be no change in production techniques, which would require the learning process to start again from the beginning.
Employees must be motivated to learn.
In practice, the learning curve effect is not used extensively for budgeting or estimating costs (or calculating sales prices on a cost plus basis).
5.6 Implications of the learning curve
When a process benefits from a learning curve effect, there are implications for budgeting and pricing.
Budgets should allow for the reduction in the average labour time per unit. Total labour requirements (the size of the work force required) will be affected.
Pricing. If prices are calculated on a ‘cost plus’ basis, prices quoted to customers should allow for future cost savings. The sales budget will be affected by expected reductions in the sales price.
Any system of budgetary control should make allowance for the expected reduction in the production time per unit. Actual hours taken should be compared with expected hours, allowing for the learning curve effect.
5.7 Weaknesses in the application of learning curve theory
Learning curve theory assumes that stable production conditions will exist, and all subsequent units will be produced to the same specifications as the original product. In practice, the product may go through several major design changes after the first unit has been produced.

Appendix 4: Budgeting and quantitative techniques in budgeting
© Emile Woolf Publishing Limited 471
It may be difficult to measure the learning rate with sufficient accuracy. It also may be difficult to measure the time taken for the first unit accurately.

Paper P5: Advanced performance management
472 © Emile Woolf Publishing Limited

© Emile Woolf Publishing Limited 473
Paper P5 Advanced performance management
AP
PE
ND
IX
5
Discounted cash flow (DCF) and long-term decisions
Contents
1 DCF: basic revision points
2 DCF and taxation
3 DCF and inflation
4 Other aspects of DCF analysis

Paper P5: Advanced performance management
474 © Emile Woolf Publishing Limited
DCF: basic revision points
Introduction
Net present value (NPV) method of investment appraisal
Calculating the NPV of an investment project
Discount tables
Annuities
Layout of NPV calculations
Calculating cash flows: other points to remember
1 DCF: basic revision points
1.1 Introduction
You should be familiar already with discounted cash flow analysis as a technique for evaluating proposed investments, to decide whether they are financially worthwhile. The expected future cash flows from the investment (cash payments and cash receipts) are all converted to a present value by discounting at the cost of capital. The present value of investment costs and the present value of the investment returns (cash benefits of returns) can be compared. This chapter provides a brief description of the NPV method of DCF analysis, so that you can revise the topic if you need to. An examination question might expect you to calculate an NPV as part of the solution.
1.2 Net present value (NPV) method of investment appraisal
With the NPV method of investment appraisal, all the future cash flows from an investment are converted into a present value, by discounting the cash flow at the investment cost of capital. This cost of capital is the return required from the investment. The PV of a cash flow is calculated by multiplying the cash flow by a discount factor. The discount factor is 1/(1+ r)n where: r is the discount rate as a proportion: for example 12% = 0.12 n is the year in which the cash flow will occur. Cash flows at the beginning of the investment, in Year 0, are already stated at their present value. The present value of $1 in Year 0 is $1.

Appendix 5: Discounted cash flow (DCF) and long-term decisions
© Emile Woolf Publishing Limited 475
Assumptions about the timing of cash flows
In DCF analysis, the following assumptions are made about the timing of cash flows during each year:
All cash flows for the investment are assumed to occur at the end of the year
If a cash flow will occur early during a particular year, it is assumed that it will occur at the end of the previous year. Therefore an item of cash expenditure early in Year 1, for example, is assumed to occur in Year 0.
1.3 Calculating the NPV of an investment project
The net present value (NPV) of a project is the net difference between the present value of all the costs incurred and the present value of all the cash flow benefits (savings or revenues).
If the present value of benefits exceeds the present value of costs, the NPV is positive.
If the present value of benefits is less than the present value of costs, the NPV is negative.
The NPV is 0 when the PV of benefits and the PV of costs are equal.
The decision rule is that, ignoring other factors such as risk and uncertainty, and non-financial considerations, a project is worthwhile financially if the NPV is positive or zero. It is not worthwhile if the NPV is negative. The net present value of an investment project is also a measure of the value of the investment. For example, if a company invests in a project that has a NPV of $2 million, the value of the company should increase by $2 million.
1.4 Discount tables
Discount tables are available. They take away the need to calculate the value of discount factors [1/(1 + r)n]. Discount tables will be provided in your examination, if required, and the discount factors in the tables are rounded to three decimal places. An extract from discount tables is shown below.
Discount rates (r) Periods (n) 1% 2% 3% 4% 5% 6% 7% 8% 9% 10% 1 0.990 0.980 0.971 0.962 0.952 0.943 0.935 0.926 0.917 0.909 2 0.980 0.961 0.943 0.925 0.907 0.890 0.873 0.857 0.842 0.826 3 0.971 0.942 0.915 0.889 0.864 0.840 0.816 0.794 0.772 0.751 4 0.961 0.924 0.888 0.855 0.823 0.792 0.763 0.735 0.708 0.683 5 0.951 0.906 0.863 0.822 0.784 0.747 0.713 0.681 0.650 0.621
For example, suppose that you need to calculate the present value of $60,000 in Year 4 if the cost of capital (discount rate) is 7%. PV = $60,000 × 0.763 = $45,780.

Paper P5: Advanced performance management
476 © Emile Woolf Publishing Limited
1.5 Annuities
An annuity is a constant cash flow for a given number of time periods. Examples: $30,000 each year for years 1 – 5 $20,000 each year for years 3 – 10 $500 each month for months 1 – 24.
Calculating the PV of an annuity
If you need to calculate the present value of $50,000 per year for years 1 – 3 at a discount rate of 9%, you could calculate this as follows: Year Cash
flow Discount factor
at 9% Present
value $ $ 1 50,000 1/(1.09) = 0.917 45,850 2 50,000 1/(1.09)2 = 0 842 42,100 3 50,000 1/(1.09)3 = 0.772 38,600 NPV 126,550
The PV of the constant annual cash flows = [Annual cash flow] × [Sum of the discount factors for each year]. In this example, the PV = $50,000 × (0.917 + 0.842 + 0.772) = $50,000 × 2.531 = $126,550. The factor 2.531 is the annuity factor for years 1 – 3 at a discount rate of 9%. A table of annuity factors, giving the discount factor for an annuity from Year 1 to Year n inclusive, will be available in your examination, if you need it. An extract is shown below. Extract from annuity tables
Discount rates (r) Periods (n) 1% 2% 3% 4% 5% 6% 7% 8% 9% 10%
1 0.990 0.980 0.971 0.962 0.952 0.943 0.935 0.926 0.917 0.909 2 1.970 1.942 1.913 1.886 1.859 1.833 1.808 1.783 1.759 1.736 3 2.941 2.884 2.829 2.775 2.723 2.673 2.624 2.577 2.531 2.487 4 3.902 3.808 3.717 3.630 3.546 3.465 3.387 3.312 3.240 3.170 5 4.853 4.713 4.580 4.452 4.329 4.212 4.100 3.993 3.890 3.791
The annuity factors are for periods starting in period 1 (year 1). For example, the annuity factor for years 1 – 3 at 9%, from the table, is 2.531.
Using annuities and annuity factors for investment appraisal
Annuity discount factors can be used in DCF investment analysis, mainly to make the calculations easier and quicker.

Appendix 5: Discounted cash flow (DCF) and long-term decisions
© Emile Woolf Publishing Limited 477
Example What is the present value of the cash flows for a project, if the cash flows are $60,000 each year for years 1 – 7, and the cost of capital is 15%?
Answer $60,000 × 4.160 (annuity factor at 15%, n = 7) = $249,600.
Example What is the present value of the following cash flows, when the cost of capital is 12%? Year Annual
cash flow Discount
factor at 12% Present
value $ $ 0 (100,000) 1 10,000 2 15,000 3 – 15 20,000 NPV
Answer Annuity factor at 12%, years 1 – 15 = 6.811
Annuity factor at 12%, years 1 – 2 = 1.690
Therefore annuity factor at 12%, years 3 – 15 = 6.811 – 1.690 = 5.121 Year Annual
cash flow Discount
factor at 12% Present
value $ $ 0 (100,000) 1.000 (100,000) 1 10,000 0.893 8,930 2 15,000 0.797 11,955 3 – 15 20,000 5.121 102,420
NPV +23,305
Example A company is considering an investment of $70,000 in a project. The project life would be five years. What must be the minimum annual cash returns from the project to earn a return of at least 9% per annum?

Paper P5: Advanced performance management
478 © Emile Woolf Publishing Limited
Answer Investment = $70,000 Annuity factor at 9%, years 1 – 5 = 3.890 Minimum annuity required = $17,995 ($70,000 / 3.890)
1.6 Layout of NPV calculations
If you are required to present NPV calculations in the answer to an examination question, it is important that you should be able to present your calculations and workings clearly. There are two normal methods of presenting calculations, and you should try to use one of them. The two methods of presentation are shown below, with illustrative figures.
Format 1
Year Description of item Cash flow
Discount factor at 10%
Present Value
$ $ 0 Machine (40,000) 1.000 (40,000) 0 Working capital (5,000) 1.000 (5,000) 1-3 Cash profits 20,000 2.487 49,740 3 Sale of machine 6,000 0.751 4,506 3 Recovery of working capital 5,000 0.751 3,755 NPV 13,001
Format 2
Year 0 1 2 3 Description of item $ $ $ $ Machine/sale of machine
(40,000) 6,000
Working capital (5,000) 5,000 Cash receipts 50,000 50,000 50,000 Cash expenditures (30,000) (30,000) (30,000) Net cash flow (45,000) 20,000 20,000 31,000 Discount factor at 10% 1.000 0.909 0.826 0.751 Present value (45,000) 18,180 16,520 23,281 NPV + 12,981 For computations with a large number of cash flow items, the second format is probably easier. This is because the discounting for each year will only need to be done once.

Appendix 5: Discounted cash flow (DCF) and long-term decisions
© Emile Woolf Publishing Limited 479
1.7 Calculating cash flows: other points to remember
To calculate cash flows for a project, the following points should also be remembered:
Cash flows should be calculated using relevant costs. The same rules apply to the calculation of relevant costs for long-term decisions as for short-term decisions. If the project involves the purchase of capital assets, these might have a residual value at the end of the project. This residual value should be included as a cash inflow in the appropriate year.
A project may require an investment in working capital.
When there is an increase in working capital, cash flows are lower than cash profits by the amount of the increase.
Similarly, when there is a reduction in working capital, cash flows are higher than cash profits by the amount of the reduction.
Working capital is usually included in DCF analysis as follows:
The working capital for the project is included as a cash outflow at the beginning of the project, in Year 0.
At the end of the project, when working capital is reduced to $0, the reduction in working capital is included as a cash inflow. The cash inflow is normally included as a cash flow in the final year of the project.
DCF analysis should normally take taxation into consideration, and possibly also inflation. The effects of taxation and inflation are explained in the following sections.

Paper P5: Advanced performance management
480 © Emile Woolf Publishing Limited
DCF and taxation
Taxation cash flows in investment appraisal
Interest costs and taxation
Timing of cash flows for taxation
Tax-allowable depreciation (capital allowances)
Straight-line method and reducing balance method
Balancing charge or balancing allowance on disposal
2 DCF and taxation
2.1 Taxation cash flows in investment appraisal
In project appraisal, cash flows arise due to the effects of taxation. When an investment results in higher profits, there will be higher taxation. For example, if taxation on profits is 25% and a company earns $10,000 each year from an investment, the pre-tax cash inflow is $10,000, but there is a tax payment of $2,500. Similarly, if an investment results in lower profits, tax is reduced. For example, if an investment causes higher spending of $5,000 each year and the tax on profits is 30%, there will be a cash outflow of $5,000 but a cash benefit from a reduction in tax payments of $1,500. Tax cash flows should be included in DCF analysis.
2.2 Interest costs and taxation
Interest costs are allowable for tax purposes. However, interest cash flows are not included in DCF analysis, because the interest cost is in the cost of capital (discount rate). In DCF analysis, an after-tax cost of capital is used to calculate present values. An after-tax cost of capital is a discount rate that allows for the tax relief on interest payments.
2.3 Timing of cash flows for taxation
The tax on extra profits or the tax savings due to lower profits could occur either:
in the same year as the profits or losses to which they relate, or
one year later (‘one year in arrears’).
Either of these assumptions could be correct. An examination question should specify which assumption you should use.

Appendix 5: Discounted cash flow (DCF) and long-term decisions
© Emile Woolf Publishing Limited 481
Example The after-tax cost of capital is 8%. A project costing $60,000 will be expected to earn cash profits of $40,000 in year 1 and $50,000 in year 2. Taxation at 30% occurs one year in arrears of the profits or losses to which they relate. For the purpose of this exercise, assume that the cost of the project is not an allowable cost for tax purposes. Required: Calculate the NPV of the project.
Answer
Year Investment/pre-tax cash profit
Tax at 30% Net cash flow
Discount factor at 8%
Present value
$ $ $ $ 0 (60,000) (60,000) 1.000 (60,000) 1 40,000 40,000 0.926 37,040 2 50,000 (12,000) 38,000 0.857 32,566 3 (15,000) (15,000) 0.794 (11,910) NPV (2,304)
2.4 Tax-allowable depreciation (capital allowances)
When a business buys a non-current asset, depreciation is charged in the financial accounts. However, depreciation in the financial accounts is not an allowable expense for tax purposes. Instead, the tax rules provide for ‘tax-allowable depreciation’ or capital allowances. Tax-allowable depreciation affects the cash flows from an investment, and the tax effects must be included in the project cash flows.
2.5 Straight-line method and reducing balance method
There are two ways of allowing depreciation for tax purposes:
the straight-line method
the reducing balance method.
Straight-line method
With the straight-line method of tax-allowable depreciation, the depreciation expense allowed for tax purposes = (The cost of the asset minus any expected residual value)/Expected years of life
Example An asset costs $80,000 and has an expected economic life of four years with no residual value. If depreciation is allowed for tax purposes over four years using the straight-line method, the allowable depreciation would be $20,000 each year.

Paper P5: Advanced performance management
482 © Emile Woolf Publishing Limited
If the rate of tax on profits is 25%, the annual reduction in tax from the capital allowance is $20,000 × 25% = $5,000 for four years.
Reducing balance method
With the reducing balance method, the tax-allowable depreciation expense in each year is a constant percentage each year of the written down value (WDV) of the asset as at the beginning of the year. The WDV of the asset is its cost less all accumulated capital allowances to date.
Example An asset costs $80,000. Tax-allowable depreciation is 25% on a reducing balance basis. Tax on profits is payable at the rate of 30%. Tax is payable/saved one year in arrears. The cash flow benefits from the tax depreciation are calculated as follows: Year WDV at start
of year Tax allowable
depreciation (25%)
Tax saved (30%)
Year of cash flow benefit
$ $ $ 0 80,000 20,000 6,000 1 1 (80,000 – 20,000) 60,000 15,000 4,500 2 2 (60,000 – 15,000) 45,000 11,250 3,375 3 3 (45,000 – 11,250) 33,750 8,438 2,531 4 4 (33,750 – 8,438) 25,312 6,328 1,898 5 5 (25,312 – 6,328) 18,984 (Note: WDV = the tax written-down value of the asset.)
2.6 Balancing charge or balancing allowance on disposal
When an asset reaches the end of its useful life, it will be scrapped or disposed of. On disposal, there might be a balancing charge or a balancing allowance. This is the difference between:
the written-down value of the asset for tax purposes, and
its disposal value (if any).
If the written-down value of the asset for tax purposes is higher than the disposal value, the difference is a balancing allowance. The balancing allowance is set against taxable profits, and so it will result in a reduction in tax payments of: Balancing allowance × Tax rate = Cash saving If the written-down value of the asset for tax purposes is lower than the disposal value, the difference is a balancing charge. The balancing charge is a taxable amount, and will result in an increase in tax payments of: Balancing charge × Tax rate = Cash payment.

Appendix 5: Discounted cash flow (DCF) and long-term decisions
© Emile Woolf Publishing Limited 483
Example A company is considering an investment in a non-current asset costing $80,000. The project would generate the following cash profits: Year $ 1 50,000 2 40,000 3 20,000 4 10,000 The asset is eligible for tax-allowable depreciation at 25%, by the reducing balance method. It is expected to have a residual value of $20,000 at the end of year 4. The after-tax cost of capital is 9%. The rate of tax on profits is 30%. Taxation cash flows occur one year in arrears. Required Calculate the NPV of the project.
Answer The solution to the previous example shows the calculations of the tax allowance each year for depreciation. It also shows that at the beginning of year 4, the year of disposal, the written down value of the asset will be $33,750. The disposal value of the asset at the end of year 4 is $20,000. At the end of the project life (Year 4), there will therefore be a balancing allowance of: $33,750 - $20,000 = $13,750. The tax saved in Year 5 will therefore be $13,750 × 30% = $4,125. (If the residual value had been higher than $33,750, there would have been an amount chargeable to tax for the year). Year Investment Cash
profits Tax on
profits at 30%
Tax-allowable
dep’n – tax saved
Net cash flow
DCF factor at
9%
PV
$ $ $ $ $ $ 0 (80,000) (80,000) 1.000 (80,000) 1 50,000 6,000 56,000 0.917 51,352 2 40,000 (15,000) 4,500 29,500 0.842 24,839 3 20,000 (12,000) 3,375 11,375 0.772 8,782 4 20,000 10,000 (6,000) 2,531 26,531 0.708 18,784 5 (3,000) 4,125 1,125 0.650 731 NPV + 24,488

Paper P5: Advanced performance management
484 © Emile Woolf Publishing Limited
DCF and inflation
Inflation and long-term projects
The rules for inflation in DCF analysis
3 DCF and inflation
3.1 Inflation and long-term projects
When a company makes a long-term investment, there will be costs and benefits for a number of years. In all probability, the future cash flows will be affected by inflation in sales prices and inflation in costs. In practice, it is common to carry out DCF analysis for investment appraisal on the assumption that:
there will be no inflation in prices and costs, or
it is impossible to predict what inflation will be, but it should be assumed that inflation will be insignificant and immaterial.
It is certainly difficult to predict what the rate of inflation will be over the next few years, and this is probably why inflation is normally ignored for DCF analysis. However, inflation might be a significant factor in some investments. Inflation should be taken into consideration:
when it is likely to be significant, and
when reasonable estimates of the future rate of inflation can be made.
3.2 The rules for inflation in DCF analysis
The cost of capital used in DCF analysis is normally a ‘money’ cost of capital. In other words, it is a cost of capital based on current market returns and yields. When estimates are made for inflation in future cash flows, the rules are as follows:
Estimate all cash flows at their inflated amount. Since cash flows are assumed to occur at the year-end, they should be increased by the rate of inflation for the full year.
To estimate a future cash flow at its inflated amount, you can apply the formula:
Cash flow in year n at inflated amount = [Cash flow at current price level] × (1 + i)n
- where i is the annual rate of inflation.
Discount the inflated cash flows at the cost of capital, to obtain the NPV.

Appendix 5: Discounted cash flow (DCF) and long-term decisions
© Emile Woolf Publishing Limited 485
Example A company is considering an investment in an item of equipment costing $150,000. The equipment would be used to make a product. The selling price of the product at today’s prices would be $10 per unit, and the variable cost per unit (all cash costs) would be $6. The project would have a four-year life, and sales are expected to be: Year Units of sale 1 20,000 2 40,000 3 60,000 4 20,000 At today’s prices, it is expected that the equipment will be sold at the end of Year 4 for $10,000. There will be additional fixed cash overheads of $50,000 each year as a result of the project, at today’s price levels. The company expects prices and costs to increase due to inflation at the following annual rates: Item Annual inflation
rate Sales 5% Variable costs 8% Fixed costs 8% Equipment disposal value 6% The company’s cost of capital is 12%. Ignore taxation. Required Calculate the NPV of the project.
Answer All the cash flows must be re-stated at their inflated amounts. An assumption needs to be made about what the cash flows will be in Year 1. Are ‘today’s’ price levels the price levels to use in Year 1, or should the cash flows in Year 1 be increased to allow for inflation? Since Year 1 cash flows relate to the end of Year 1, the appropriate assumption is usually to start inflating the cash flows in Year 1. This assumption is used here. Item Year 1 Year 2 Year 3 Year 4 $ $ $ $ Revenue At today’s prices 200,000 400,000 600,000 200,000 At inflated prices (5% per year)
A 210,000 441,000 694,575 243,101

Paper P5: Advanced performance management
486 © Emile Woolf Publishing Limited
Costs Variable, today’s prices 120,000 240,000 360,000 120,000 Fixed, today’s prices 50,000 50,000 50,000 50,000 Total, today’s prices 170,000 290,000 410,000 170,000 At inflated prices (8% per year)
B 183,600 338,256 516,482 231,283
Net cash profit (A – B) 26,400 102,744 178,093 11,818 Equipment disposal ($10,000 × (1.06)4)
12,625
The NPV can now be calculated in the normal way. Year Cash flow Discount factor
at 12% Present
value $ $ 0 Equipment (150,000) 1.000 (150,000) 1 Cash profit 26,400 0.893 23,575 2 Cash profit 102,744 0.797 81,887 3 Cash profit 178,093 0.712 126,802 4 Cash profit 11,818 0.636 7,516 4 Disposal value 12,625 0.636 8,030 NPV + 97,810

Appendix 5: Discounted cash flow (DCF) and long-term decisions
© Emile Woolf Publishing Limited 487
Other aspects of DCF analysis
Sensitivity analysis
Asset replacement decisions
Using DCF with other project evaluation methods
Evaluation of a DCF analysis
4 Other aspects of DCF analysis
4.1 Sensitivity analysis
Sensitivity analysis should be used as a method of providing information about the risk or uncertainty in a decision. Techniques such as sensitivity analysis and expected values have been described in an earlier chapter, for the purpose of short-term decisions and budgeting. The same techniques may be applied to DCF and long-term capital investment decisions. Sensitivity analysis can be used in the following ways:
To calculate the effect on the NPV of a given percentage reduction in benefits or a given percentage increase in costs. For example, what would the NPV of the project be if sales volumes were 10% below estimate, or if annual running costs were 5% higher than estimate?
To calculate the percentage amount by which benefits must fall below estimate or costs rise above estimate before the project NPV becomes negative. For example, by how much would sales volumes need to fall below the expected volumes, before the project NPV became negative?
Example A company is considering the following project: Year Equipment Income Running
costs Net cash
flow DCF factor
at 10% PV
$ $ $ $ $ 0 (8,000) 1.000 (8,000) 1 6,000 3,500 2,500 0.909 2,273 2 8,000 4,500 3,500 0.826 2,891 3 10,000 5,500 4,500 0.751 3,379 4 4,000 2,500 1,500 0.683 1,025 NPV + 1,568 Required Estimate the sensitivity of the project to:
income being lower than estimate, and
running costs being higher than estimate.

Paper P5: Advanced performance management
488 © Emile Woolf Publishing Limited
Solution Year Equipment Income Running
costs
PV PV PV NPV $ $ $ $ 0 (8,000) 1 5,454 (3,181) 2 6,608 (3,717) 3 7,510 (4,131) 4 2,732 (1,707) PV (8,000) 22,304 (12,736) + 1,568 The sensitivity of the project to errors in the estimates can now be assessed as follows:
Income. The project would cease to have a positive NPV if income is below the
estimate by more than: 304,22
568,1 = 0.070 or 7.0%.
Running costs. The project would cease to have a positive NPV if running costs
are above the estimate by more than: 736,12
568,1 = 0.123 or 12.3%.
An assessment of risk and uncertainty could then be made on the basis of the likelihood that income will fall below estimate or running costs will increase above the estimate by more than these amounts.
4.2 Asset replacement decisions
An asset replacement decision involves deciding how frequently a non-current asset should be replaced, when it is in regular use, so that when the asset reaches the end of its useful life, it will be replaced by an identical asset. In other words, this type of decision is about what is the most appropriate useful economic life of a non-current asset, and how soon should it be replaced? Here we are not dealing with a one-off decision about whether or not to acquire an asset. Instead we are deciding when to replace an asset we are currently using with another new asset; and then when the new asset has been used up, replacing it again with an identical asset; and so on in perpetuity. We are evaluating the cycle of replacing the machine – considering the various options for how long we should keep it before replacing it. The decision rule is that the preferred replacement cycle for an asset should be the least-cost replacement cycle. This is the frequency of replacement that minimises the PV of cost.
The cash flows to consider
The cash flows that must be considered when making the asset replacement decision are:
the capital cost (purchase cost) of the asset

Appendix 5: Discounted cash flow (DCF) and long-term decisions
© Emile Woolf Publishing Limited 489
the maintenance and operating costs of the asset: these will usually increase each year as the asset gets older
tax relief on the asset (tax-allowable depreciation)
the scrap value or resale value of the asset at the end of its life.
The main problem with evaluating an asset replacement decision is comparing these costs over a similar time frame. For example, how can we compare the PV of costs for asset replacement cycles of one, two, three, four and five years? For example, you cannot simply compare the PV of cost over a two-year replacement cycle with the PV of cost over a three-year replacement cycle, because you would be comparing costs over two years with costs over three years, which is not a fair comparison.
Methods of evaluation
A method is needed for comparing the different replacement cycles over a common period of time. There are three methods of doing this:
the lowest common multiple method
the finite time method
the equivalent annual cost method: this is the method normally used.
The equivalent annual cost method is the method normally used, and the only one of these three methods that you need to know for your examination. It is the only method described here.
The equivalent annual cost method
The equivalent annual cost method of calculating the most cost-effective replacement cycle for assets is as follows:
For each choice of replacement cycle, the PV of cost is calculated over one full replacement cycle, with the asset purchased in year 0 and disposed of at the end of the life cycle.
This PV of cost is then converted into an equivalent annual cost or annuity. The equivalent annual cost is calculated by dividing the PV of cost of the life cycle by the annuity factor for the cost of capital, for the number of years in the life cycle.
The replacement cycle with the lowest equivalent annual cost is selected as the least-cost replacement cycle.
Example ABC Company is considering its replacement policy for a particular machine which it intends to replace every year, every two years or every three years. The machine has a purchase cost of $17,000 and a maximum useful life of three years. The following information is also relevant:

Paper P5: Advanced performance management
490 © Emile Woolf Publishing Limited
Year Maintenance/running costs of machine
Scrap value if sold at end of year
$ $ 1 1,900 8,000 2 2,400 5,500 3 3,750 4,000 The cost of capital for ABC Company is 10%. What is the optimum replacement cycle? Ignore taxation. Use the equivalent annual cost method.
Answer
Replace every year
Year Cash flow Discount factor at 10%
PV
$ $ 0 Purchase (17,000) 1.000 (17,000) 1 Maintenance costs (1,900) 0.909 (1,727) 1 Resale value 8,000 0.909 7,272 PV of cost (11,455) Equivalent annual cost = PV of cost/Annuity factor at 10% for 1 year = $11,455/0.909 = $12,602.
Replace every two years
Year Cash flow Discount factor at 10%
PV
$ $ 0 Purchase (17,000) 1.000 (17,000) 1 Maintenance costs (1,900) 0.909 (1,727) 2 Maintenance costs (2,400) 0.826 (1,982) 2 Resale value 5,500 0.826 4,543 PV of cost (16,166)
Equivalent annual cost = PV of cost/Annuity factor at 10% for 2 years = $16,166/1.736 = $9,312.
Replace every three years
Year Cash flow Discount factor at 10%
PV
$ $ 0 Purchase (17,000) 1.000 (17,000) 1 Maintenance costs (1,900) 0.909 (1,727) 2 Maintenance costs (2,400) 0.826 (1,982) 3 Maintenance costs (3,750) 0.751 (2,816) 1 Resale value 4,000 0.751 3,004 PV of cost (20,521) Equivalent annual cost = PV of cost/Annuity factor at 10% for three years = $20,521/2.487 = $8,251.

Appendix 5: Discounted cash flow (DCF) and long-term decisions
© Emile Woolf Publishing Limited 491
Summary
Replace Equivalent annual cost $ Every year 12,602 Every two years 9,312 Every three years 8,251
Conclusion: The least-cost decision is to replace the asset every three years, because a three-year replacement cycle has the lowest equivalent annual cost.
4.3 Using DCF with other project evaluation methods
DCF (NPV or IRR) might be used together with other methods of project appraisal.
A DCF project appraisal might be used together with an ROI or residual income assessment. The weaknesses of the ROI and residual income methods for project appraisal have already been explained in an earlier chapter.
A DCF project appraisal might also be used with the payback method. The payback of a project is the number of years it will take before the net cash inflows from the project ‘pay back’ the initial expenditures in Year 0.
A company might have a rule, for example, that capital projects will not be undertaken unless they are expected to have a positive NPV and are also expected to pay back within, say, four years.
4.4 Evaluation of a DCF analysis
In your examination, you might be asked to comment on a DCF evaluation. When managers are given a DCF analysis and intend to use the analysis to make their investment decision, it is important to ask some basic questions. To assess the figures provided by a DCF analysis, there are several factors that might need consideration.
Are the figures in the DCF evaluation reliable? Has anything been omitted? Are any of the figures incorrect?
Could the NPV be improved by delaying some costs of the project, or by reducing the investment in working capital?
Has the most appropriate discount rate been used?
Use sensitivity analysis to asses the risk in the project. What would happen if costs were to increase by 5%, say, or revenues were to be 5% lower than expected?
Example A company is considering whether to invest in a new product, for which a market is developing. The product is expected to have a four-year life, and during the life of the product, the company wants to maintain a 10% share of the total market. Its marketing team has estimated the expected market size in each year, and the price that would probably have to be charged for the product to maintain a 10% market share, as follows:
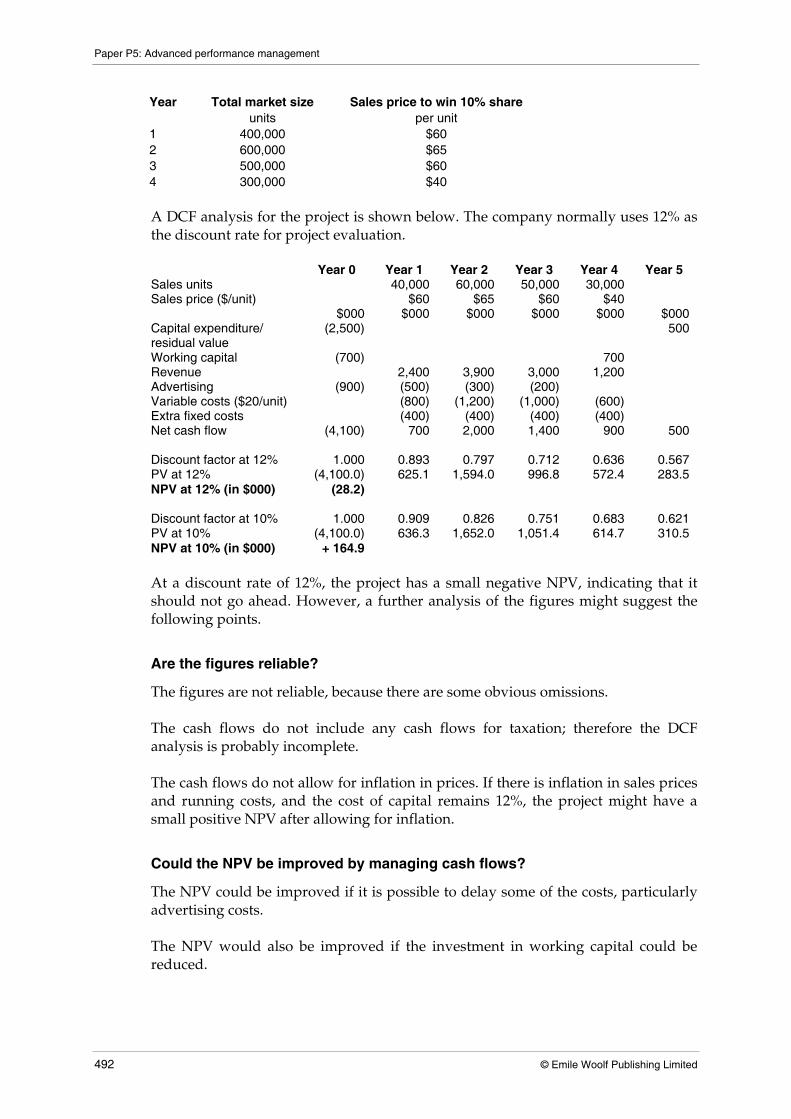
Paper P5: Advanced performance management
492 © Emile Woolf Publishing Limited
Year Total market size Sales price to win 10% share units per unit 1 400,000 $60 2 600,000 $65 3 500,000 $60 4 300,000 $40 A DCF analysis for the project is shown below. The company normally uses 12% as the discount rate for project evaluation. Year 0 Year 1 Year 2 Year 3 Year 4 Year 5 Sales units 40,000 60,000 50,000 30,000 Sales price ($/unit) $60 $65 $60 $40 $000 $000 $000 $000 $000 $000 Capital expenditure/ residual value
(2,500) 500
Working capital (700) 700 Revenue 2,400 3,900 3,000 1,200 Advertising (900) (500) (300) (200) Variable costs ($20/unit) (800) (1,200) (1,000) (600) Extra fixed costs (400) (400) (400) (400) Net cash flow (4,100) 700 2,000 1,400 900 500 Discount factor at 12% 1.000 0.893 0.797 0.712 0.636 0.567 PV at 12% (4,100.0) 625.1 1,594.0 996.8 572.4 283.5 NPV at 12% (in $000) (28.2) Discount factor at 10% 1.000 0.909 0.826 0.751 0.683 0.621 PV at 10% (4,100.0) 636.3 1,652.0 1,051.4 614.7 310.5 NPV at 10% (in $000) + 164.9 At a discount rate of 12%, the project has a small negative NPV, indicating that it should not go ahead. However, a further analysis of the figures might suggest the following points.
Are the figures reliable?
The figures are not reliable, because there are some obvious omissions. The cash flows do not include any cash flows for taxation; therefore the DCF analysis is probably incomplete. The cash flows do not allow for inflation in prices. If there is inflation in sales prices and running costs, and the cost of capital remains 12%, the project might have a small positive NPV after allowing for inflation.
Could the NPV be improved by managing cash flows?
The NPV could be improved if it is possible to delay some of the costs, particularly advertising costs. The NPV would also be improved if the investment in working capital could be reduced.

Appendix 5: Discounted cash flow (DCF) and long-term decisions
© Emile Woolf Publishing Limited 493
Cash flows might be improved by charging higher prices and taking a share of the market that is less than 10%.
Is the discount rate suitable?
It is interesting to note that the project would have a positive NPV at a lower discount rate of 10%, and it might be appropriate to check that 12% is a suitable discount rate for this project.
Sensitivity analysis
It might be useful to carry out some sensitivity analysis, by varying the sales volume each year, or the sale price per unit, or the variable cost per unit, or the residual value of the capital equipment. Sensitivity analysis would provide information about the amount of risk in the project, and possible variations in the NPV.

Paper P5: Advanced performance management
494 © Emile Woolf Publishing Limited

© Emile Woolf Publishing Limited 495
Paper P5 Advanced performance management
AP
PE
ND
IX
6
Pricing
Contents
1 Pricing strategies
2 Pricing decisions: Cost-based pricing
3 Pricing decisions: Market-based pricing
4 Selling price decisions

Paper P5: Advanced performance management
496 © Emile Woolf Publishing Limited
Pricing strategies
Market position and pricing strategies
Cost leadership
Product differentiation
Product differentiation and market segmentation
Niche marketing
Management information and pricing strategies
1 Pricing strategies
1.1 Market position and pricing strategies
A business entity that competes in its markets should develop a strategy that will enable it to compete successfully. It should ‘position’ itself in the market, and offer customers a combination of price and other product features (such as product quality) that will appeal to a sufficiently large part of the market. In most competitive markets, it is important to be different, and to be seen by customers to be different. Pricing is an important element in choosing a strategy for market position, and there are three broad categories of pricing strategy/market positioning strategy. These are:
cost leadership
product differentiation
niche marketing.
1.2 Cost leadership
A cost leadership strategy is a strategy based on being the cheapest supplier of a product or service to the market, and to charge the lowest prices. The aim of low pricing is to gain the biggest share of the total market, and make profits by selling in large volumes. For a cost leadership strategy to succeed, it is essential to minimise costs, so that the entity is able to supply the product or service at a lower price than competitors. The main problem with this strategy is that only one company can be the cheapest producer. So if three companies, say, all have a cost leadership strategy, only one will succeed. The other two might be able to sell their products at the same low price as the cost leader, but their profits will be lower because their costs are higher. A successful cost leadership strategy will reduce unit costs to a level where it is difficult for any other company to compete on the basis of price.

Chapter 11: Economic, fiscal and environmental factors. Pricing strategy
© Emile Woolf Publishing Limited 497
1.3 Product differentiation
A product differentiation strategy is an alternative to a cost leadership strategy. It is appropriate for business entities that cannot or do not want to be the cost leader in their market. With a product differentiation strategy, a company seeks to offer customers a product that is different from the similar product offered by its competitors. A product or service can be made ‘different’ in several ways.
It might be better in quality and design. The quality of a product or service can be reinforced by the use of brand names. Customers will often consider some brands to be better in quality than others.
In the case of a service, a company might include different features in the service that it provides. For example, mobile telephone operators and providers of broadband services offer different ‘packages’ to customers.
Similarly, a product might be offered with special features, such as a five-year guarantee.
It might be provided to customers in a different way. For example, a bank might offer banking services by the internet. A small food store might compete with a large supermarket by opening later at night or earlier in the morning.
It might offer faster delivery.
By offering products or services that are different, a company tries to appeal to some of the customers in the market. By offering something different, it can charge higher prices than the company that is the cost leader in the market. Through higher prices, it can achieve its strategic targets for profit and return on capital.
1.4 Product differentiation and market segmentation
A market segment is a section of the total market. A market might be divided into several large segments. For example, the total market for cars is divided into a market for family saloon cars, a market for two-seater sports cars, a market for low-cost town cars, a market for ‘4 × 4s’ and so on. Similarly, the market for clothing is divided into markets for men’s clothing, women’s clothing, children’s clothing and infant clothing, and so on. Companies might concentrate on a particular segment of the total market. Within their chosen market segment (or segments) they might have a strategy of cost leadership for that segment, or product differentiation within the market segment.
1.5 Niche marketing
A niche in a room is a corner of the room, set aside from the main part of the room. In a market, a niche market is a small part of the total market, which is set aside and different from the main market. A niche could be described as a small market segment. A niche market might have a sufficiently large number of potential customers to make it worthwhile for a company to develop products or services especially for that niche. For example, a food manufacturer might specialise in making pasta. A

Paper P5: Advanced performance management
498 © Emile Woolf Publishing Limited
radio station might concentrate on attracting an audience in a particular age range such as under 20s, or in a particular local area. A company that chooses to follow a niche market strategy should adopt a further strategy of either cost leadership or product differentiation within that niche. (This is the same as for companies that operate in a market segment, who should try to be cost leaders in their market segment or else differentiate their products from those of competitors.)
1.6 Management information and pricing strategies
In order to decide on a suitable pricing strategy and market position strategy, a company needs information about the market, such as:
the total size of the market
expected changes in the future size of the market
the prices charged by the market leader
how products are services are differentiated by other competitors, and the prices they charge
the importance of price to customers in the market.

Appendix 6: Live cycle issues and pricing
© Emile Woolf Publishing Limited 499
Pricing decisions: cost-based pricing methods
Pricing decisions and pricing strategy
Full cost plus pricing
Marginal cost plus pricing (mark-up pricing)
Return on investment (ROI) pricing
Opportunity cost pricing (minimum pricing)
Limitations of cost-based pricing
2 Pricing decisions: cost-based pricing methods
2.1 Pricing decisions and pricing strategy
Entities have to make decisions about pricing the goods they sell and the services they provide. Pricing decisions might be influenced by economic and market factors. Pricing strategies might be used as a way of achieving a competitive position in the market.
There are various methods of pricing, and the most suitable method of pricing depends on the circumstances. In your examination you might be required to discuss different approaches to making pricing decisions. There are two approaches to making pricing decisions:
calculating a price on the basis of cost
deciding a price on the basis of market factors, such as prices charged by competitors for similar items, and the prices that customers are willing to pay.
2.2 Full cost plus pricing
With full cost plus pricing, a mark-up or profit margin is added to the fully-absorbed cost of the item to obtain a selling price. Profit is expressed as either:
a percentage of the full cost (a profit ‘mark-up’) or
a percentage of the sales price (a ‘profit margin’).
$
Variable production costs 600 Other variable costs 200 Absorbed overheads: Production overheads absorbed 800 Non-production overheads absorbed 300 Full cost 1,900 Profit (added to full cost) 380 Selling price 2,280

Paper P5: Advanced performance management
500 © Emile Woolf Publishing Limited
The profit therefore represents net profit from the sale. When full cost plus pricing is used to calculate a selling price for standard units of a product, the selling price per unit may be calculated as: [ ]
units sales BudgetedPrcosts production-non budgeted Total+costs production budgeted Total ofit+
The profit is the required percentage mark-up on total cost. Notes on calculating the profit:
If the mark-up is x% of full cost, the selling price is Full cost + x%.
If the profit margin is y% of the sales price, the profit is [y/(100 – y)] × Full cost
Advantages of full cost plus pricing
A business entity might have an idea of the percentage profit margin it would like to earn. It might therefore decide the average profit mark-up on cost that it would like to earn from sales, as a general guideline for its pricing decisions. This can be useful for businesses that carry out a large amount of contract work or jobbing work, for which individual job or contract prices must be quoted regularly to prospective customers and there is no obvious ‘fair market’ price. The percentage mark-up or profit margin does not have to be a fixed percentage figure. It can be varied to suit the circumstances, such as demand conditions in the market and what the customer is prepared to pay. There are also other possible advantages in using full cost plus pricing:
If the budgeted sales volume is achieved, sales revenue will cover all costs and there will be a profit.
It is useful for justifying price rises to customers, when an increase in price occurs as a consequence of an increase in costs.
Disadvantages of full cost plus pricing
The main disadvantage of cost plus pricing is that it is calculated on the basis of cost, without any consideration of market conditions, such as competitors’ prices.
Cost plus pricing fails to allow for the fact that when the sales demand for a product is affected by its selling price, there is a profit-maximising combination of price and demand. A cost plus based approach to pricing is unlikely to arrive at the profit-maximising price for the product.
In most markets, prices must be adjusted to market and demand conditions. The pricing decision cannot be made on a cost basis only.
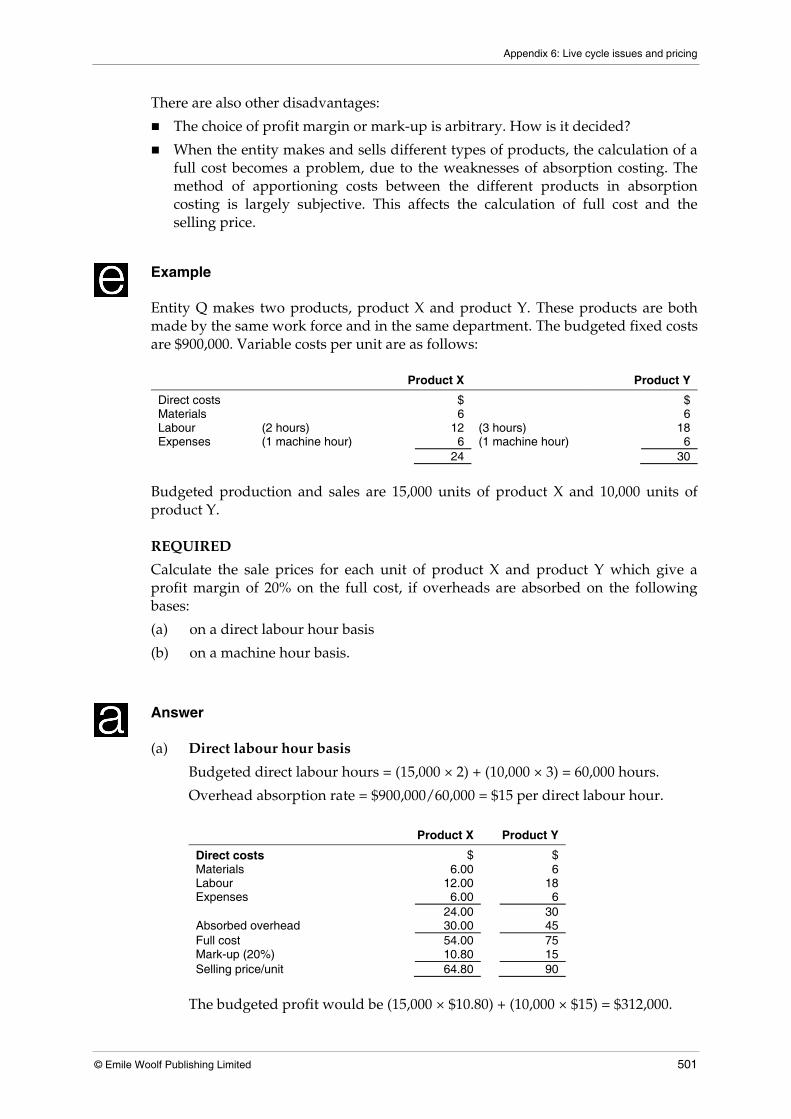
Appendix 6: Live cycle issues and pricing
© Emile Woolf Publishing Limited 501
There are also other disadvantages:
The choice of profit margin or mark-up is arbitrary. How is it decided?
When the entity makes and sells different types of products, the calculation of a full cost becomes a problem, due to the weaknesses of absorption costing. The method of apportioning costs between the different products in absorption costing is largely subjective. This affects the calculation of full cost and the selling price.
Example Entity Q makes two products, product X and product Y. These products are both made by the same work force and in the same department. The budgeted fixed costs are $900,000. Variable costs per unit are as follows:
Product X Product Y
Direct costs $ $ Materials 6 6 Labour (2 hours) 12 (3 hours) 18 Expenses (1 machine hour) 6 (1 machine hour) 6 24 30
Budgeted production and sales are 15,000 units of product X and 10,000 units of product Y. REQUIRED
Calculate the sale prices for each unit of product X and product Y which give a profit margin of 20% on the full cost, if overheads are absorbed on the following bases:
(a) on a direct labour hour basis
(b) on a machine hour basis.
Answer (a) Direct labour hour basis
Budgeted direct labour hours = (15,000 × 2) + (10,000 × 3) = 60,000 hours.
Overhead absorption rate = $900,000/60,000 = $15 per direct labour hour.
Product X Product Y
Direct costs $ $ Materials 6.00 6 Labour 12.00 18 Expenses 6.00 6 24.00 30 Absorbed overhead 30.00 45 Full cost 54.00 75 Mark-up (20%) 10.80 15 Selling price/unit 64.80 90
The budgeted profit would be (15,000 × $10.80) + (10,000 × $15) = $312,000.

Paper P5: Advanced performance management
502 © Emile Woolf Publishing Limited
(b) Machine hour basis
Budgeted machine hours = (15,000 × 1) + (10,000 × 1) = 25,000 hours.
Overhead absorption rate = $900,000/25,000 = $36 per machine hour.
Product X Product Y
Direct costs $ $ Materials 6.00 6.00 Labour 12.00 18.00 Expenses 6.00 6.00 24.00 30.00 Absorbed overhead 36.00 36.00 Full cost 60.00 66.00 Mark-up (20%) 12.00 13.20 Selling price/unit 72.00 79.20
The budgeted profit would be (15,000 × $12) + (10,000 × $13.20) = $312,000. However, the different bases of absorbing overheads would give a significantly different full cost for each product, and a different selling price. It must be doubtful whether the entity can sell 15,000 units of product X and 10,000 units of product Y, no matter which prices are chosen.
2.3 Marginal cost plus pricing (mark-up pricing)
With marginal cost plus pricing, also called mark-up pricing, a mark-up or profit margin is added to the marginal cost in order to obtain a selling price.
$
Variable production costs 600 Other variable costs 200 Marginal cost 800 Mark-up (added to marginal cost) 400 Selling price 1,200
The mark-up represents contribution. When marginal cost plus pricing is used to calculate a selling price for standard units of a product, the selling price per unit may be calculated as:
Budgeted total variable costs (production and non-production costs) + Mark-up Budgeted sales units
The total mark-up is the required percentage mark-up on total budgeted variable costs.
Advantages of marginal cost plus pricing
The advantages of a marginal cost plus approach are as follows:
It is useful in some industries such as retailing, where prices might be set by adding a mark-up to the purchase cost of items bought for resale. The size of the mark-up can be varied to reflect demand conditions. For example, in a competitive market, a lower mark-up might be added to high-volume items.
Appendix 6: Live cycle issues and pricing
© Emile Woolf Publishing Limited 503
It draws management attention to contribution and the effects of higher or lower sales volumes on profit. This can be particularly useful for short-term pricing decisions, such as pricing decisions for a market penetration policy (described later).
It is more appropriate where fixed costs are low and variable costs are high.
Disadvantages of marginal cost plus pricing
A marginal cost plus approach to pricing also has disadvantages.
Although the size of the mark-up can be varied according to demand conditions, marginal cost plus pricing is a cost-based pricing method, and does not properly take market conditions into consideration.
It ignores fixed overheads in the pricing decision. Prices must be high enough to make a profit after covering all fixed costs. Cost-based pricing decisions therefore cannot ignore fixed costs altogether.
2.4 Return on investment (ROI) pricing
This method of pricing might be used in a decentralised environment where the investment centre is required to meet a target return on capital employed. Prices might be set to achieve a target percentage return on the capital invested. With return on investment pricing, the selling price per unit may be calculated as:
[ ] volumeBudgeted
employed Capital ROI%Target +division theof costs totalBudgeted ×
When the investment centre makes and sells a single product, the budgeted
volume is sales volume.
When the investment centre makes and sells several different products, budgeted volume might be production volume in hours, and the mark-up added to cost is then a mark-up for the number of hours worked on the product item.
Alternatively, the budgeted volume might be sales revenue, and the mark-up is then calculated as a percentage of the selling price (a form of full cost plus pricing).
Advantages of ROI pricing
The advantages of an ROI approach to pricing are as follows:
ROI pricing is a method of deciding an appropriate profit margin for cost plus pricing.
The target ROI can be varied to allow for differing levels of business risk.

Paper P5: Advanced performance management
504 © Emile Woolf Publishing Limited
Disadvantages of ROI pricing
An ROI approach to pricing also has disadvantages.
Like all cost-based pricing methods, it does not take market conditions into sufficient consideration, and the prices that customers will be willing to pay.
Since it is a form of full cost plus pricing, it shares most of the other disadvantages as full cost plus pricing.
Example A manufacturer is about to launch a new product. The non-current assets needed for production will cost $4,000,000 and working capital requirements are estimated at $800,000. The expected annual sales volume is 40,000 units. Variable production costs are $60 per unit. Fixed production costs will be $600,000 each year and annual fixed non-production costs will be $200,000. Required
(a) Calculate selling price using:
(i) full cost plus 20%
(ii) marginal cost plus 40%
(iii) pricing based on a target return on investment of 10% per year.
(b) If actual sales are only 20,000 units and the selling price is set at full cost plus 20%, what will the profit be for the year?
Answer (a)
(i) Full cost plus 20% $ per unit
Variable cost 60 Fixed costs ($600,000 + $200,000)/40,000 units 20 Full cost 80 Mark-up: 20% on cost 16 Selling price 96
(ii) Marginal cost plus 40% $ per unit
Variable cost 60 Mark-up: 40% on variable cost 24 Selling price 84

Appendix 6: Live cycle issues and pricing
© Emile Woolf Publishing Limited 505
(iii) Target ROI pricing $
Non-current assets 4,000,000 Working capital 800,000 Capital employed 4,800,000 Profit required ($4,800,000 × 10%) 480,000 Profit required per unit (40,000 units) $12
$
Variable cost 60 Fixed costs (see above) 20 Full cost 80 Profit 12 Selling price 92
(b) Profit for the year $
Sales (20,000 units × $96) 1,920,000 Variable costs (20,000 units × $60) (1,200,000) Fixed costs (800,000) Net loss (80,000)
2.5 Opportunity cost pricing (minimum pricing)
Opportunity cost pricing might be used for pricing a product or a service in special circumstances. In some circumstances, an entity might be prepared to charge a price for an item that leaves it no worse off than if it were to choose the next most profitable course of action. This is the marginal price or minimum price of an item. A minimum price of an item is the total of the relevant costs of making and selling it. A profit margin can be added to the minimum price, to obtain an opportunity cost price. The profit margin added to the relevant costs is the additional profit the entity will earn from selling the item, instead of choosing the next most profitable course of action.
Minimum price = Relevant costs of making and selling the item
If a margin is added for incremental profit:
Price = Relevant costs + Profit margin. If resources are in scarce supply (limiting factors), minimum prices must include an allowance for the opportunity cost of using the resources for making and selling the item.
Example Southampton is a shipbuilding company. It uses two materials, steel and fibreglass. It needs to complete a shipping order using 500 tonnes of steel and 1,000 tonnes of fibreglass.

Paper P5: Advanced performance management
506 © Emile Woolf Publishing Limited
The work force will have to work 2,000 hours on making the boat: 1,200 hours will be in the assembly process and the remainder will be in the finishing (painting the boat and other finishing tasks). Southampton will quote a price of relevant cost plus 50%. Southampton has 200 tonnes of steel held in inventory. This originally cost $10 per tonne. It now has a current price of $12 and could be sold for $8 per tonne. Southampton no longer produces steel boats and has no other use for steel. It only produces fibreglass boats on a regular basis. There are 400 tonnes of fibreglass held in inventory. This originally cost $20 per tonne. It currently has a purchase price of $23 per tonne and a selling price of $15 per tonne. (Selling price and net realisable value can be assumed to be the same figure). All labour is paid $4 per hour. To complete the contract on time, labour for the finishing process will have to be transferred from other work which produces contribution at a rate of $3 per hour (after labour costs). There is currently surplus capacity for assembly labour amounting to 1,000 hours for the duration of the contract. Owing to other work requirements, however, any further assembly labour hours in excess of these 1,000 hours will have to be hired on a temporary basis at a rate of $5 per hour. Required
Calculate the price Southampton will quote on the contract.
Answer
$ Steel – lost net realisable value (200 × $8) 1,600 – purchases (300 × $12) 3,600 Fibreglass (1,000 × $23) 23,000 Finishing labour – cost (800 × $4) 3,200 – lost contribution (800 × $3) 2,400 Assembly labour (200 × $5) 1,000 Relevant cost 34,800 Mark-up (50%) 17,400 Quoted price 52,200
2.6 Limitations of cost-based pricing
Cost-based approaches to pricing all ignore external market factors such as the prices that customers are prepared to pay and what competitors are charging for rival products or services. Cost-based pricing does not ensure a profit, because sales volume must be sufficient to cover all fixed costs, and not even full cost plus pricing can ensure that sufficient sales volumes will be achieved to cover all fixed costs.

Appendix 6: Live cycle issues and pricing
© Emile Woolf Publishing Limited 507
Pricing decisions: market-based approaches to pricing
The economist’s demand curve and profit-maximising model
The product life cycle and pricing
Market skimming prices
Market penetration prices
Price discrimination (differential pricing)
Loss leaders
Going rate pricing
Target pricing
3 Pricing decisions: market-based approaches to pricing
There are various methods of pricing based on market conditions and marketing strategies.
3.1 The economist’s demand curve and profit-maximising model
The economist’s model can be used to identify the profit-maximising selling price and sales volume. There are two sets of market conditions to consider:
a market in which there is perfect competition
a market in which there is imperfect competition.
Perfect competition
When there is perfect competition in the market, there are many different suppliers competing to sell identical products. In the real world, perfect competition is rare, but markets with features similar to those of perfect competition include foreign exchange markets and some commodities markets. In perfect competition:
an individual firm is unable to influence the price for its own goods, because identical products are obtainable from competitors
the selling price in the market is determined by the forces of supply and demand
the selling price in the market is the price that all suppliers in the market must accept to remain competitive: every supplier can produce and sell as much output as the want to and sell it at this price.

Paper P5: Advanced performance management
508 © Emile Woolf Publishing Limited
Suppliers in a perfectly competitive market are ‘price takers’, and they will maximise their profit by:
producing output up to the limit of their output capacity, provided that the marginal cost of producing extra units is less than the sales price for the units; or
producing output up to the point where its marginal costs of producing and selling more units is higher than the marginal revenue from selling them at the ruling market price.
Imperfect competition
When there is imperfect competition in the market, a supplier has more influence over the selling price that it charges for its products. Imperfect competition exists when there are relatively few suppliers in the market, and suppliers seek to differentiate their products from those of their competitors. The effect of imperfect competition is that firms are able to decide their selling prices (they are ‘price takers’). However, the higher the sales price, the lower the sales demand for their product. In microeconomics terms, firms in imperfectly-competitive markets face a ‘downward-sloping demand curve’. In the economist’s model, a firm maximises its profits by setting the sales price at a level where: [The marginal revenue from selling an extra unit] = [The marginal cost of making and selling the unit]. In other words, profit is maximised where MR = MC. You might be expected to calculate the formula for MR, given a demand curve. The technique is explained in detail in the next section.
3.2 The product life cycle and pricing
As a product goes through the different stages of its life cycle, the pricing policy might be changed.
Introduction stage. During the introduction stage, the product is introduced to the market. If the product is new, and there are no rival products on the market, there is a choice between a market skimming policy for pricing or a market penetration policy. These are explained below.
Growth stage. During the growth stage of the life cycle, demand for the product increases rapidly, but more competitors enter the market. If the market is competitive, each firm might have to lower its prices to win a share of the growing market. However, because sales demand is strong, prices and profit margins are likely to be fairly high (although falling). Some companies might try to identify a specialist ‘niche’ of the market, where they have more control over pricing of their products. Similarly, companies might try to keep prices higher by differentiating their product from those of competitors on the basis of quality or other distinguishing features (such as design differences).

Appendix 6: Live cycle issues and pricing
© Emile Woolf Publishing Limited 509
Maturity stage. When a product reaches the maturity stage of its life cycle, total sales demand in the market becomes stable, but the product may become a ‘commodity’. Firms must then compete for market share, often by cutting prices. Companies might use product differentiation strategies to keep the price of their product higher than it might otherwise be, but prices generally will be lower than during the growth stage of the life cycle.
Decline. Eventually the market demand for a product declines. When sales demand falls, companies leave the market. Those that remain keep on selling the product as long as they can make a profit. Prices might remain very low. In some cases, however, a product might acquire ‘rarity value’, allowing companies to raise prices. However, since unit costs will also be higher, it is still difficult to make a profit.
When a business entity is trying to decide whether or not to develop and launch a new product, the expected sales demand over its life cycle should be taken into consideration in the DCF analysis.
3.3 Market skimming prices
When a company introduces a product to the market for the first time, it might choose a pricing policy based on ‘skimming the market’. When a new product is introduced to the market, a few customers might be prepared to pay a high price to obtain the product, in order to be one of the first people to have it. Buying the new product gives the buyer prestige, so the buyer will pay a high price to get it. In order to increase sales demand, the price must be gradually reduced, but with a skimming policy, the price is reduced slowly and by small amounts each time. The contribution per unit with a skimming policy is very high. To charge high prices, the firm might have to spend heavily on advertising and other marketing expenditure. Market skimming will probably be more effective for new ‘high technology’ products, such as digital televisions and plasma screen televisions. Other examples in the past have been personal computers and laptop computers. Firms using market skimming for a new product will have to reduce prices later as new competitors enter market with rival products.
Skimming prices and a product differentiation strategy
It is much more difficult to apply a market skimming pricing policy when competitors have already introduced a rival product to the market. Customers in the market will already have a view of the prices to expect, and might not be persuaded to buy a new version of a product in the market unless its price is lower than prices of existing versions.

Paper P5: Advanced performance management
510 © Emile Woolf Publishing Limited
However, it may be possible to have a policy of market skimming if it is possible to differentiate a product from its rivals, usually on the basis of quality. This is commonly found in the market for cars, for example, where some manufacturers succeed in keeping prices very high by producing and selling a high-quality product. High-quality cars cost more to produce, and sales demand may be fairly low: however, profits are obtained by charging high prices and earning a high contribution for each unit sold.
3.4 Market penetration prices
Market penetration prices is an alternative pricing policy to market skimming, when a new product is launched onto the market for the first time. With market penetration pricing, the aim is to set a low selling price for the new product, in order to create a high sales demand as quickly as possible. With a successful penetration pricing strategy, a company might ‘capture the market’. A firm might also use market penetration prices to launch their own version of a product into an established market, with the intention that offering low prices will attract customers and win a substantial share of the market.
Penetration pricing and a cost leadership strategy
A cost leadership market strategy is a strategy of trying to become the lowest-cost producer of a product in the market. Low-cost production is usually achieved through economies of scale and large-scale production and sales volumes. Penetration pricing is consistent with a cost leadership strategy, because low prices help a company to obtain a large market share, and a large market share means high volumes, economies of scale and lower costs.
3.5 Price discrimination (differential pricing)
With price discrimination (or differential pricing), a firm sells a single identical product in different segments of the market at different prices. For price discrimination to work successfully, the different market segments must be kept separate. It might be possible to charge different prices for the same product:
in different geographical areas – for example in the US and in China
at different times of the day – for example, travel tickets might be priced differently at different times of the day or the week
to customers in different age groups – for example offering special prices to individuals over a certain age, or to students or to children.
3.6 Loss leaders
Some products might be sold for a short time as ‘loss leaders’. This type of pricing is used in retailing, where some products are offered at very low prices (below cost, or

Appendix 6: Live cycle issues and pricing
© Emile Woolf Publishing Limited 511
possibly below marginal cost) in order to attract customers into the store, where they will also buy other items as well as the low-priced items.
3.7 Going rate pricing
Many firms charge a price that is the ‘going rate’ in the market. This is a pricing policy for ‘price followers’. Companies must often accept the going market price when they produce a fairly standard product (or service) and they are not in a particularly strong competitive position.
3.8 Target pricing
Target pricing has been described in an earlier chapter, in relation to target costing. When a company develops a new product, it might decide during the design stage of development what the price needs to be. The decision about price may be based on a study of the existing market and prices for similar products. A target price is the price that a company thinks it will have to charge for a new product in order to be competitive in the market. Having established a target price, the company can then establish a target cost. This is the maximum amount that the new product must cost to make and sell, so that the return on investment from the new product will be sufficient to justify its development. The designers of the product are then required to design the product so that it costs no more than the target cost, and it can be sold for an appropriate return at the target price. Target costing is explained in more detail in a later chapter.

Paper P5: Advanced performance management
512 © Emile Woolf Publishing Limited
Selling price decisions: MR = MC
Strategy and sales price
Establishing a formula for marginal revenue: MR
The profit-maximising sales price
Pricing decisions and sensitivity analysis
4 Selling price decisions: MR = MC
4.1 Strategy and sales prices
For established products, decisions about setting the sales price are usually made on the basis of:
adjusting the current price to allow for increases in costs or weakening sales demand, or
adjusting the price in response to price changes by competitors, or
making competitive adjustments to the sales price.
A different situation arises when a sales price is decided for an entirely new product or service, or for any other item where there is no direct competitor. When there is no direct competitor for a product or service, it should be possible to decide on a price to maximise profit, without any concern about how competitors will respond. An examination question may therefore ask you to identify what the selling price for an item should be if the company’s objective is to maximise profits. Typically, there will be an estimate of the sales demand at different sales prices: the higher the selling price, the lower the expected sales demand will be. It may be possible, form information in the exam question, to establish a relationship between selling price and sales demand in a mathematical formula. Given further information about the variable cost of the item, the profit-maximising sales quantity and price can be calculated using differentiation. This will be at the price and quantity where the marginal revenue per extra unit sold (MR) equals the marginal cost of sale (MC).
4.2 Establishing a formula for marginal revenue: MR
When a company is in a monopoly situation, it can set any selling price that it wants, but sales demand will vary according to the price that is chosen. If there is a linear relationship between estimated sales demand and sales price, you will be told that for every $X increase or reduction in the sales price, the expected sales demand will fall or rise by Y units.
Appendix 6: Live cycle issues and pricing
© Emile Woolf Publishing Limited 513
For example, you may be told that a company is trying to decide the price for a new and unique product, for which there is no competitor product. It has been estimated that:
at a price of $12 per unit, the expected annual sales demand would be 300,000 units
however for every $0.50 increase or reduction in price, annual sales demand would fall or increase by 2,000 units.
Formula for the relationship between sales price and sales quantity
From this information it is possible to derive a formula for the relationship between the sales price and sales quantity. You should do this by calculating the sales price at which sales demand will be 0 units.
In the example above, if the sales price is $12, sales demand is expected to be 300,000 units. For every $1 increase in the price, sales demand will fall by 4,000 units (= 2,000units/$0.50). The sales price at which demand will be 0 is therefore:
$12 + [(300,000/4,000) × $1] = $87.
A formula for the relationship between sales quantity (Q) and sales price (P) can be stated in terms of the sales price.
P = 87 – (Q × 1/4000)
P = 87 – 0.00025Q
The value 1/4000 or 0.00025 is obtained from the relationship between changes in the sales price and changes in the sales quantity (for every $1, quantity changes by 4,000 units).
Formula for total sales revenue
Total revenue (TR) is the sales quantity multiplied by the sales price per unit.
TR = P × Q
We already have a formula for P expressed in terms of Q. This can now be substituted. In the example, we have:
TR = (87 – 0.00025Q) Q
TR = 87Q – 0.00025Q2.

Paper P5: Advanced performance management
514 © Emile Woolf Publishing Limited
Formula for marginal revenue: MR
The formula for calculating marginal revenue is obtained by applying differential calculus to the formula for total revenue. If you are not familiar with differential calculus, you should learn the following technique:
(1) If total revenue (TR) = aQ – bQ2
(2) Marginal revenue (MR) = a – [2b × Q]
In the example:
TR = 87Q – 0.00025 Q2
MR = 87 – (2 × 0.00025Q) = 87 – 0.0005Q.
4.3 The profit-maximising sales price
The profit-maximising sales price is the price at which MR = MC.
Formula for marginal cost: MC
The marginal cost per unit should be its variable cost. In the example, suppose the variable cost per unit is $2. The profit-maximising sales price is where: MR = MC 87 – 0.0005Q = 2 85 = 0.0005Q Q = 170,000. P = 87 – 0.00025Q So when Q = 170,000: P = 87 – (0.00025 × 170,000) = 87 – 42.50 P = 44.50. Profit is maximised at a price of $44.50, when sales demand would be 170,000 units. The contribution per unit would be $42.50, so total annual contribution would be $7,225,000. In this example, the profit-maximising price is a long way from the initial price of $12 per unit that was considered. The following example summarises the technique just described.
Example A major hotel is planning a gala dinner, at which there will be up to 800 places available. The initial idea was to charge $1,000 per person and at this price the hotel would expect to sell 600 tickets. Market research suggests that for every $50 increase or reduction in the ticket price, demand will fall or increase by 20. The variable cost per person for the dinner will be $250, and the fixed costs attributable to the event would be $240,000.

Appendix 6: Live cycle issues and pricing
© Emile Woolf Publishing Limited 515
Required If the hotel has a policy of maximising the profitability of such events, what price per ticket should be charged for the dinner and what would be the total profit?
Answer For every $1 change in price, the sales quantity would change by 20/50 = 0.4.
At a price of $1,000, sales quantity = 600. Therefore the price at which the sales quantity would be 0 is: 1,000 + (600/0.4) = 1,000 + 1,500 = 2,500. P = 2,500 – (50/20)Q = 2,500 – 2.5Q Total revenue TR = 2,500Q – 2.5Q2 Marginal revenue MR = 2,500 – 5Q Profit is maximised where MR = MC: 2,500 – 5Q = 250 5Q = 2,250 Q = 450 The sales price would be: 2,500 – (2.5 × 450) = 1,375. Profit will be maximised by charging $1,375 per ticket, and the expected sales quantity will be 450 tickets.
$
Sales revenue (450 × $1,375) 618,750
Variable costs (450 × $250) 112,500
Total contribution 506,250
Fixed costs 240,000
Profit from the event 266,250
4.4 Pricing decisions and sensitivity analysis
Sensitivity analysis for strategic planning was described in an earlier chapter. It can be applied to strategic pricing decisions too. In the previous example, suppose that the hotel management are not satisfied with a profit of $266,250 from the gala dinner and are also would not be satisfied with sales of only 450 tickets. It is therefore decided that the price should be kept at $1,000 so that 600 tickets will be sold. However, management want to achieve a target profit of $300,000 from the event, and think that this could be achieved by reducing the variable cost per person.

Paper P5: Advanced performance management
516 © Emile Woolf Publishing Limited
We can use sensitivity analysis to calculate what the maximum variable cost per person should be if management are to achieve their target profit and sales quantity.
$
Required profit 300,000
Fixed costs 240,000
Required total contribution 540,000
If 600 tickets are sold, the contribution per unit would need to be $540,000/600 = $900. To sell 600 tickets the price must be $1,000. Therefore the maximum variable cost per person would have to be $1,000 – $900 = $100. This is $150 or 60% less than the current estimated variable cost of $250.

© Emile Woolf Publishing Limited 517
Paper P5 Advanced performance management
Q&A
Practice questions
Contents
Page
ABC and other accounting methods
1 Lard Company 520
2 LC Company 521
3 Throughput 522
4 Throughput ratio 522
5 Backflush 523
Accounting for decision making
6 Villaco 523
7 Shortages 523
8 Product B22 524
Decision making with risk and uncertainty
9 Payoff table 526
10 Grab Company 526
Quantitative techniques in budgeting
11 Learning 527
12 Greenears 528
13 Regression 528

Paper P5: Advanced performance management
518 © Emile Woolf Publishing Limited
Discounted cash flow (DCF) and long-term decisions
14 Replacement product 529
15 Probabilities 530
16 Sensitivity 530
17 The Jin Company 531
Introduction to strategic management accounting
18 Growth objective 532
19 Gap analysis 533
Budgets and alternative budgeting models
20 Zero based budgeting 534
Economic, fiscal and environmental factors. Pricing strategy
21 Marginal 534
22 MC = MR 535
23 Snap Company 535
24 Bridge company 536
Performance measurement systems
25 Responsibility 537
26 Crosstreets Hotel 537
Measuring performance
27 Three services 538
28 Private medical practice 539
29 Train times 539
30 Non‐financial performance measurements
540
31 Mission 540
32 Customer profitability 540
33 RTC 542
34 Value for money 543

Practice questions
© Emile Woolf Publishing Limited 519
Decentralisation and divisional performance
35 Decentralisation 543
36 West Division 544
37 Annuity method 544
38 Residual 545
39 Uncertain 545
Transfer pricing
40 Two divisions 546
41 Training company 547
42 Shadow price 548
43 Bricks 548
44 International transfers 549
45 Long and Short 550
Alternative views of performance measurement
46 Balanced 552
47 Pyramid 552
48 The Vet Centre 552
Developments in management accounting and performance management
49 Total quality 554
50 Poole Company 554
51 Target cost 555
52 Cost and quality 556

Paper P5: Advanced performance management
520 © Emile Woolf Publishing Limited
1 Lard Company
Lard Company is a warehousing and distribution company. It receives and stores products from customers, and then re-packs them for distribution as required. There are three customers for whom the service is provided – Customer A, Customer B and Customer C. The products stored and re-packaged for all three customers are similar in nature and size, but some are more fragile than others and break more easily. These have to be packaged more carefully. Basic budget information has been gathered for the year to 31st December 20X6 and is shown in the following table:
Products handled
units Customer A 30,000 Customer B 45,000 Customer C 25,000 Costs $000 Packaging materials (See note) 1,950 Labour: Basic pay 350 Overtime pay 30 Occupancy costs 500 Administration and management costs 60
Note
Packaging materials are used in re-packing each unit of product for Customer A, Customer B and Customer C in the ratio 1:2:3 respectively. This ratio is linked to the relative fragility of the goods for each customer. It applies to the cost of packaging materials but not to the costs of labour and overheads. Additional information has been obtained so that unit costs can be prepared for each of the three customers using an activity based costing approach. The additional information for the year to 31st December 20X6 has been estimated as follows:
(1) Labour and overhead costs have been identified as attributable to each of three work centres: receipt and inspection, storage, and packing as follows:
(2) Cost allocation proportions Receipt and
inspection
Storage
Packing
% % % Labour: Basic pay 20 10 70 Occupancy cost 20 60 20 Administration cost 40 10 50 Labour: overtime pay $15,000 $6,250 $8,750
(3) A study has shown that the fragility of different goods affects the receipt and
inspection time needed for the products for each customer. Storage required is related to the average size of the basic incoming product units from each customer. The re-packing of goods for distribution is related to the complexity

Practice questions
© Emile Woolf Publishing Limited 521
of packaging required by each customer. The relevant requirements per unit of product for each customer have been evaluated as follows:
Customer A Customer B Customer C
Receipt and inspection (minutes) 6 9 15 Storage (square metres) 0.3 0.3 0.3 Packing (minutes) 36 45 60
Required
(a) Calculate the average cost per unit of packaged products for each customer using each of the following methods:
(i) Ignoring the ABC study, calculate a cost per unit using traditional absorption costing.
(ii) Taking an activity based costing approach, using the information provided.
(b) Suggest ways in which activity based costing might improve product costing and cost control for Lard Company.
2 LC Company
LC Company has total budgeted production overheads for next year of $816,000 and has traditionally absorbed overheads on a machine hour basis. It makes two products, Product V and Product W.
Product V Product W
Direct material cost per unit $20 $60 Direct labour cost per unit $50 $40 Machine time per unit 3 hours 4 hours Annual production 6,000 units 4,000 units
Required
(a) Calculate the product cost for each of the two products on the assumption the firm continues to absorb overhead costs on a machine hour basis.
(b) The firm is considering changing to an activity based costing (ABC) system and has identified the following information:
Product V Product W
Number of set-ups 18 32 Number of purchase orders 48 112 Overhead cost analysis $ Machine-related overhead costs 204,000 Set up related overhead costs 280,000 Purchasing-related overhead costs 332,000 Total production overheads 816,000
You are required to calculate the unit cost for each of the two products on the assumption that the firm changes to an ABC system, using whatever assumptions you consider appropriate.

Paper P5: Advanced performance management
522 © Emile Woolf Publishing Limited
(c) Suggest how ABC analysis could be useful for measuring performance and improving profitability.
3 Throughput
A company manufactures two products, product X and product Y, on the same machines. Sales demand for the products exceeds the machine capacity of the company’s production department. The potential sales demand in each period is for 8,000 units of Product X and 12,000 units of Product Y. Sales prices cannot be increased due to competition from other firms in the market. The maximum machine capacity in the production department is 32,000 hours in each period. The following cost and profitability estimates have been prepared:
Product X Product Y
$ $ Sales price 22 27 Direct materials 10 9 Direct labour and variable overhead 6 11 Contribution per unit 6 7 Machine hours per unit 1.5 hours 2 hours
Fixed costs in each period are $90,000. Required
(a) Using marginal costing principles, calculate the profit-maximising output in each period, and calculate the amount of profit.
(b) Explain how throughput accounting differs from marginal costing in its approach to maximising profit.
(c) Use throughput accounting to calculate the throughput accounting ratio for Product X and for Product Y. You should assume that the direct labour cost and variable overhead cost in your answer to part (a) is fixed in the short-term.
(d) Using throughput accounting principles, calculate the profit-maximising output in each period, and calculate the amount of profit.
4 Throughput ratio
Dust Company exports cases to Spain. Each pallet of cases costs $2,000 in material costs and are sold for $3,000. Production and sales are limited by a shortage of highly trained quality control inspectors. Only 200 inspection hours are available per week. Every pallet is inspected and an inspection takes 30 minutes. Other factory costs are $300,000 per week. Required
Calculate the throughput accounting ratio.

Practice questions
© Emile Woolf Publishing Limited 523
5 Backflush
Transactions for the year for AYZ are as follows: Purchases of raw materials $5,000,000 Conversion costs $3,000,000 Finished goods manufactured 100,000 units Sales 98,000 units at $100 per unit There was no inventory at the beginning of the year. The cost per unit is $80, consisting of $50 per unit for materials and $30 per unit for conversion costs. Required
Show the book-keeping entries in the cost accounting system using backflush accounting, with two trigger points.
6 Villaco
Villaco produces two products with the following costs and revenue per unit.
Product A Product B
$ $ Sales price 20 10 Variable cost 8 6 Fixed cost 4 3 units units Sales demand 2,000 3,000
There are only 7,000 machine hours available, and Product A requires four machine hours per unit and Product B requires one machine hour per unit Required
(a) Calculate the profit-maximising production and sales mix.
(b) Assume that all the data is the same, except that we are able to sub-contract the products for an additional variable cost of $1 per unit for A and $0.50 per unit for B.
What is the profit-maximising decision?
7 Shortages
An engineering company has been experiencing problems with restricted availability of resources. The company manufactures a variety of casings. It makes four types of casing. Each casing requires the same bought-in component and some high-grade steel. The standard costs for the four types of casing are as follows:

Paper P5: Advanced performance management
524 © Emile Woolf Publishing Limited
Casing A B C D
$ $ $ $ Steel 250 500 190 390 Bought-in component 50 50 50 50 Direct labour 60 60 50 100 Variable production costs 40 50 40 50 Fixed production costs 180 240 150 270 Selling and administration costs 145 225 120 215 Profit 35 55 30 55 Selling price 760 1,180 630 1,130
All the selling and administration costs are fixed and the same single component is used for each of the four products. Direct labour is paid $8 per standard hour and each member of the workforce is capable of producing any of the casings. The company’s main customer has ordered 30 units of Casing A, 20 units of B, 30 units of C and 20 units of D for production and delivery in the next month. Senior management have agreed that this order should be treated as a priority order and that these casings must be manufactured and delivered to the customer next month. This is necessary to maintain the goodwill of the customer. It is estimated that this order represents 10% of the total demand next month for each type of casing. The company operates a just in time system, and has no inventories of steel, components or finished goods. Required
If the aim is to maximise profit for the month, establish the production and selling plan for the company next month in each of the following situations:
(a) Situation 1. Supplies of steel are limited to $250,000.
(b) Situation 2. Only 400 bought-in components are available from suppliers.
(c) Situation 3. A labour dispute restricts available productive labour hours in the month to 2,125.
(d) Situation 4. A labour dispute restricts available productive labour hours in the month to 2,125; but the manufacture of any quantities of the four casings could be sub-contracted to an outside supplier. The cost of buying the casings externally would be $475, $705, $380 and $640 for Casing A, Casing B, Casing C and Casing D respectively. In addition, it should be assumed that a major customer insists that its order is completed by the company itself and the manufacture should not be sub-contracted.
Each of the restrictions on production should be treated independently, as four different situations.
8 Product B22
BB Company has received an enquiry from a customer for the supply of 500 units of a new product, product B22. Negotiations on the final price to charge the customer are in progress and the sales manager has asked you to supply relevant cost information.

Practice questions
© Emile Woolf Publishing Limited 525
The following information is available:
(1) Each unit of product B22 requires the following raw materials:
Raw material type
X 4 kg
Y 6 kg
(2) The company has 5,000 kg of material X currently in stock. This was purchased last year at a cost of $7 per kg. If not used to make product B22, this stock of X could either be sold for $7.50 per kg or converted at a cost of $1.50 per kg, so that it could be used as a substitute for another raw material, material Z, which the company requires for other production. The current purchase price per kilogram for materials is $9.50 for material Z and $8.25 per kg for material X.
(3) There are 10,000 kilograms of raw material Y in stock, valued on a FIFO basis at a total cost of $142,750. Of this current stock, 3,000 kilograms were purchased six months ago at a cost of $13.75 per kg. The rest of the stock was purchased last month. Material Y is used regularly in normal production work. Since the last purchase of material Y a month ago, the company has been advised by the supplier that the price per kilogram has been increased by 4%.
(4) Each unit of product B22 requires the following number of labour hours in its manufacture:
Type of labour
Skilled five hours
Unskilled three hours
Skilled labour is paid $8 per hour and unskilled labour $6 per hour.
(5) There is a shortage of skilled labour, so that if production of B22 goes ahead it will be necessary to transfer skilled workers from other work to undertake it. The other work on which skilled workers are engaged at present is the manufacture of product B16. The selling price and variable cost information for B16 are as follows:
$/unit $/unit
Selling price 100 Less: variable costs of production Skilled labour (three hours) 24 Other variable costs 31 55 45
(6) The company has a surplus of unskilled workers who are paid a fixed wage
for a 37-hour week. It is estimated that there are 900 hours of unused unskilled labour time available during the period of the contract. The balance of the unskilled labour requirements could be met by working overtime, which is paid at time and a half.
(7) The company absorbs production overheads by a machine hour rate. This absorption rate is $22.50 per hour, of which $8.75 is for variable overheads and the balance is for fixed overheads. If production of product B22 is undertaken, it is estimated that an extra $4,000 will be spent on fixed costs. Spare

Paper P5: Advanced performance management
526 © Emile Woolf Publishing Limited
machining capacity is available and each unit of B22 will require two hours of machining time in its manufacture using the existing equipment. In addition, special finishing machines will be required for two weeks to complete the B22. These machines will be hired at a cost of $2,650 per week, and there will be no overhead costs associated with their use.
(8) Cash spending of $3,250 has been incurred already on development work for the production of B22. It is estimated that before production of the B22 begins, another $1,750 will have to be spent on development, making a total development cost of $5,000.
Required
Calculate the minimum price that the company should be prepared to accept for the 500 units of product B22. Explain briefly but clearly how each figure in the minimum price calculation has been obtained. (Note: the minimum price is the price equals the total relevant costs of producing the items. Any price in excess of the minimum price will add to total profit).
9 Payoff table
A baker pays $0.10 for buns and sells them for $0.30. At the end of a day, any pastries that have not been sold must be thrown away. On any particular day, the probability distribution of sales demand is as follows: Number of pastries demanded by customers 20 40 60 Probability 0.3 0.5 0.2 Required
(a) Construct a payoff matrix to show all the possible outcomes
(b) What is the maximum amount the baker should be willing to pay for perfect information (in advance) about sales demand each day.
10 Grab Company
Grab Company engages in site clearance and site preparation work. Information about its operations is as follows:
(1) It is Grab Company‘s policy to hire all the plant and machinery it needs, rather than to purchase its own plant and machinery.
(2) Grab Company will enter into an advance hire agreement contract for the coming year at one of three levels – high, medium or low – which correspond to the requirements of a high, medium or low level of orders obtained.
(3) The level of orders obtained will not be known when the advance hire agreement contract is entered into. Probabilities have been estimated by management as to the likelihood of the orders being at a high, medium or low level.

Practice questions
© Emile Woolf Publishing Limited 527
(4) Where the advance hire agreement entered into is lower than that required for the level of orders actually obtained, a premium rate must be paid to obtain the additional plant and machinery required.
(5) No refund is obtainable where the advance hire agreement for plant and machinery is at a level in excess of that required to satisfy the site clearance and preparation orders actually obtained.
A summary of the information relating to the above points is as follows: Level of orders Sales revenue Probability Plant and machinery hire costs Advance hire Conversion premium
$000 $000 $000 High 15,000 0.25 2,300 Medium 8,500 0.45 1,500 Low 4,000 0.30 1,000 Low to medium 850 Medium to high 1,300 Low to high 2,150 Variable cost (as a percentage of turnover) 70%
Required
(a) Prepare a summary which shows the forecast net margin earned by Grab Company for the coming year for each possible outcome.
(b) On the basis of maximising expected value, advise Grab Company whether the advance contract for the hire of plant and machinery should be at the low, medium or high level.
(c) Explain how the risk preferences of the management members responsible for the choice of advance plant and machinery hire contract may alter the decision reached in (b) above.
(d) Grab Company is considering employing a market research consultant who will be able to say with certainty in advance of the placing of the plant and machinery hire contract, which level of site clearance and preparation orders will be obtained. On the basis of expected value, determine the maximum sum that Grab Company should be willing to pay the consultant for this information.
11 Learning
A company has developed a design for a new product, the Widgette. It intends to sell the product at full production cost plus a profit margin of 40%. The estimated production cost and selling price for the first unit of the Widgette are as follows:
$
Direct materials 2,000 Direct labour (200 hours at $15 per hour) 3,000 Fixed production overhead ($20 per direct labour hour) 4,000 Full production cost 9,000 Profit margin (40%) 3,600 Selling price 12,600
The company’s management expects reductions in the time to produce subsequent units of the Widgette, and an 80% learning curve is expected.

Paper P5: Advanced performance management
528 © Emile Woolf Publishing Limited
A customer has expressed an interest in buying units of the Widgette, and has asked the following questions:
(1) If we bought the first Widgette for $12,600 and immediately ordered another one, what would be the selling price for the second Widgette?
(2) If we waited until you have sold the first two Widgettes to another customer, and then ordered the third and the fourth units that you produce, what will be the average price for the third and fourth units?
(3) If we decided to buy eight Widgettes immediately, and asked you to quote a single price for all eight units, what price would you charge?
Required
(a) Answer each of these questions, assuming that the policy of the company remains to make a profit margin of 40% on every unit that it makes and sells.
(b) List three limitations of learning curve theory.
12 Greenears
Greenears is a new business producing woollen hats, which it makes in small batches of a standard size. It estimates that the first batch of a new design of hand-made hats will have a labour cost of $2,000. There will be an 85% learning curve effect for subsequent batches. In month 1 production is five batches, and in month 2 production is seven batches. Required
Estimate the total labour cost in month 2 for making the hats.
13 Regression
A company has achieved the following total sales in each year for the past five years:
Year Total sales
$ million 20X2 = Year 1 12 20X3 = Year 2 15 20X4 = Year 3 15 20X5 = Year 4 18 20X6 = Year 5 19
Required
(a) Use linear regression analysis to establish a formula for the trend line in sales, and use this formula to estimate what total sales should be in 20X7 and 20X8.
(b) Calculate the correlation coefficient to decide how much reliance you can place in your forecasts.
To produce your answer, you can make use of the following calculations:

Practice questions
© Emile Woolf Publishing Limited 529
Year Total sales
x y xy x2 y2 1 12 12 1 144 2 15 30 4 225 3 15 45 9 225 4 18 72 16 324 5 19 95 25 361 15 79 254 55 1,279
14 Replacement product
A well-established company manufactures engines. One of its current products is Product T, for which sales will be 150,000 units in the year just ending (Year 1). However, after four more years, at the end of Year 5, Product T will no longer be permitted, when new government environmental regulations come into force. On or before that time, the company needs to introduce a new product to replace Product T. A replacement product has already been developed. This is Product V. A market research report has estimated that, if Product V is introduced to the market now to replace Product T, annual sales of Product V at a unit price of $350 would be:
Annual sales Probability
units 100,000 0.2 80,000 0.5 50,000 0.3
The current selling price of Product T is $250 per unit, and its variable cost of sales is $180. There is no possibility of increasing the selling price. The annual sales demand for Product T is expected to fall each year if it is kept on the market. The best estimate is that annual sales in Year 2 will be 10,000 units less than in Year 1, with a further fall in sales by 10,000 units each year until Year 5. To prepare a production facility for manufacturing Product V instead of Product T, an initial capital outlay of $2,000,000 would be required. Annual fixed costs would increase by $160,000. The variable cost of making and selling Product V would be $230 per unit. The company’s cost of capital is 8%. Ignore inflation and taxation. Required
(a) Using DCF analysis, calculate the NPV of a proposal to replace Product T with Product V from Year 2 onwards.
(b) Estimate the minimum annual sales for Product V that would be required to justify the immediate replacement of Product T with Product V. Assume that the estimates of annual sales of Product T are correct.
(c) Calculate the minimum reduction in the annual sales of Product T, in Year 2 and in each subsequent year that would be necessary before you recommended the immediate replacement of Product T with Product V. Assume that the estimates of annual sales of Product V are correct.
(d) List briefly the weaknesses or limitations in the financial analysis in part (a) to (c) above.

Paper P5: Advanced performance management
530 © Emile Woolf Publishing Limited
15 Probabilities
A company is considering whether or not to invest in a project where the initial cash investment would be $6,250,000. The project would have a five-year life, and the estimated annual cash flows are as follows:
Year Cash inflows Cash outflows
$ $ 1 3,000,000 1,500,000 2 4,000,000 1,800,000 3 5,000,000 2,400,000 4 4,000,000 1,700,000 5 3,000,000 1,000,000
The cost of capital is 10%. The estimates of cash outflows are considered fairly reliable. However, the estimates of cash inflows are much more uncertain. Several factors could make the annual cash flows higher or lower than expected.
Factor 1: There is a 20% probability that government measures to control the industry will reduce annual cash inflows by 20%.
Factor 2: There is a 30% probability that another competitor will also enter the market: this would reduce the estimated cash inflows by 10%.
Factor 3: There is a 40% probability that demand will be stronger than expected. The company would not be able to supply more products to the market, but it would be able to sell at higher prices and cash inflows would be 5% higher than estimated.
Required
Calculated the expected net present value of the project.
16 Sensitivity
A company is considering an investment in a new project to make and sell a new product that will have a five-year life. The project will require an investment of $3 million in equipment. The residual value of this equipment after five years will be 30% of its original cost. The estimates of net cash flows from operations in each year of the project are as follows:
Year Net cash flow
$ 1 400,000 2 800,000 3 800,000 4 700,000 5 400,000
These cash flows are based on estimates that the annual increase in cash spending on fixed costs will be $200,000, and the contribution/sales ratio from transactions will be 40%. The company’s cost of capital is 8%.

Practice questions
© Emile Woolf Publishing Limited 531
The management of the company are aware that actual cash flows could be higher or lower than those expected, and sensitivity analysis should be carried out to establish the extent to which costs or revenues could differ from the estimate before the project ceased to have a positive NPV. The investment in working capital will be minimal. Inflation and taxation should be ignored. Required
(a) Calculate the net present value of the project.
(b) Carry out sensitivity analysis on the following items:
(i) the cost of the equipment, assuming that the residual value will be 30% of cost
(ii) the residual value of the equipment
(iii) sales revenue
(iv) variable costs
(v) annual fixed costs.
By how much could each of these items vary in amount before the project ceased to have a positive NPV?
(c) Comment on the risk in undertaking this project.
17 The Jin Company
The directors of the Jin Company are meeting to decide about the replacement of a machine. The existing machine has to be replaced soon, and there is a choice of two machines that could be purchased to replace it. These are Machine A and a larger Machine, B. The following information is available about each machine:
Machine A Machine B Expected working life 4 years 5 years Initial cost $600,000 $750,000 Residual value $0 $0 Working capital requirement $100,000 $200,000
The forecast pre-tax cash flows that will be earned using each machine are as follows:
Year 1 Year 2 Year 3 Year 4 Year 5 $000 $000 $000 $000 $000 Machine A 470 520 490 450 Machine B 580 640 500 500 400
The Jin Company uses 10% as its cost of capital for capital expenditure evaluation.
Taxation at 30% is payable one year in arrears. Capital allowances are available at the rate of 25% each year on the reducing balance method. Inflation should be ignored.

Paper P5: Advanced performance management
532 © Emile Woolf Publishing Limited
Required (a) Calculate the NPV with each of the machines. (b) Calculate the payback period for each machine. (c) Recommend with reasons which machine should be purchased.
18 Growth objective
A company has an objective in its long-term business plan of achieving significant growth in its business in the period Year 1 to Year 5. It is now the end of Year 2. Its results for the years to 31st December Year 1 and Year 2 are summarised below.
Income statement for the year ended 31 December Year 2 Year 1
$ $ Sales 31,200,000 26,000,000 Cost of sales 18,720,000 15,600,000 12,480,000 10,400,000 Operating expenses 6,780,000 5,200,000 Interest charges 500,000 0 Depreciation 3,000,000 3,000,000 Net profit 2,200,000 2,200,000
Balance sheet as at 31st December Year 2 Year 1
$ $ Non-current assets 27,300,000 26,000,000 Net current assets 15,600,000 7,800,000 42,900,000 33,800,000 Loan 9,000,000 0 33,900,000 33,800,000 Share capital 19,500,000 19,500,000 Accumulated profit 14,400,000 14,300,000 33,900,000 33,800,000
Sales are seasonal, and are much higher in the first six months of the year than in the second six months. The half-yearly sales figures in the past two years have been as follows:
Sales Year 2 Year 1
$ $ 1st January – 30th June 21,645,000 16,900,000 1st July – 31st December 9,555,000 9,100,000 31,200,000 26,000,000
The company employs part-time workers during the first six-months of each year. Part-time workers operate for a full working week during the weeks that they are employed. Employee numbers have been as follows:
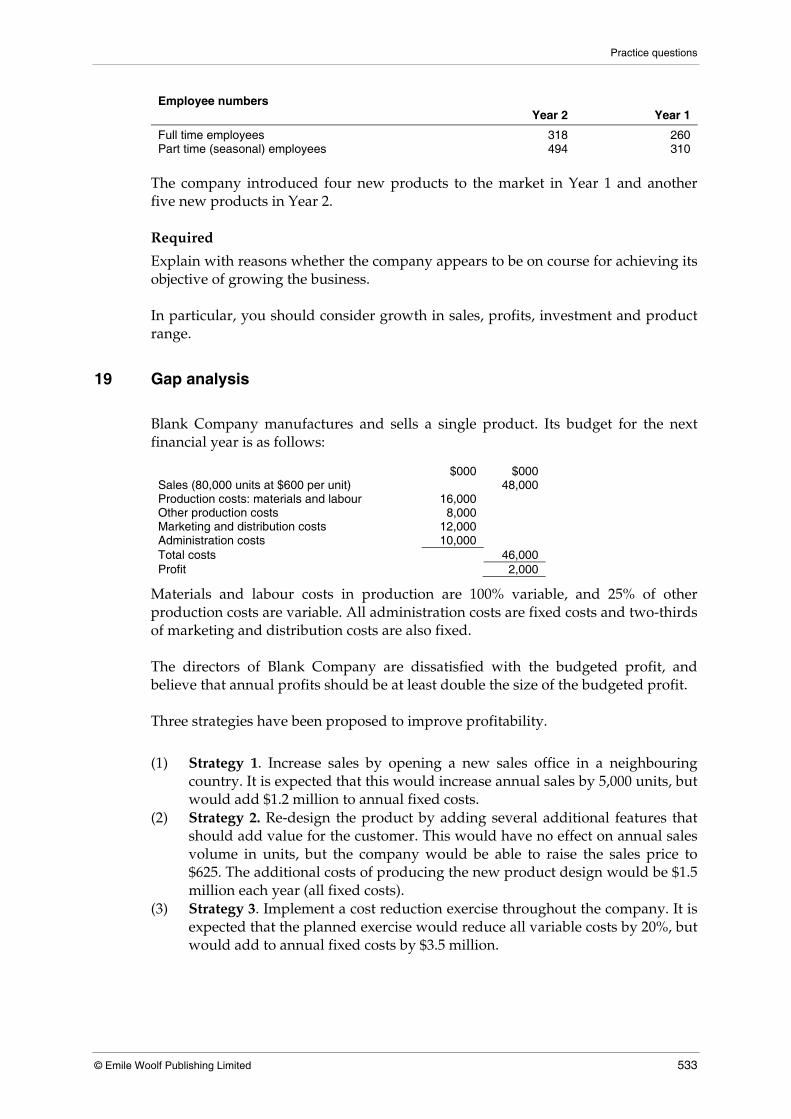
Practice questions
© Emile Woolf Publishing Limited 533
Employee numbers Year 2 Year 1
Full time employees 318 260 Part time (seasonal) employees 494 310
The company introduced four new products to the market in Year 1 and another five new products in Year 2. Required
Explain with reasons whether the company appears to be on course for achieving its objective of growing the business. In particular, you should consider growth in sales, profits, investment and product range.
19 Gap analysis
Blank Company manufactures and sells a single product. Its budget for the next financial year is as follows:
$000 $000 Sales (80,000 units at $600 per unit) 48,000 Production costs: materials and labour 16,000 Other production costs 8,000 Marketing and distribution costs 12,000 Administration costs 10,000 Total costs 46,000 Profit 2,000
Materials and labour costs in production are 100% variable, and 25% of other production costs are variable. All administration costs are fixed costs and two-thirds of marketing and distribution costs are also fixed. The directors of Blank Company are dissatisfied with the budgeted profit, and believe that annual profits should be at least double the size of the budgeted profit.
Three strategies have been proposed to improve profitability.
(1) Strategy 1. Increase sales by opening a new sales office in a neighbouring
country. It is expected that this would increase annual sales by 5,000 units, but would add $1.2 million to annual fixed costs.
(2) Strategy 2. Re-design the product by adding several additional features that should add value for the customer. This would have no effect on annual sales volume in units, but the company would be able to raise the sales price to $625. The additional costs of producing the new product design would be $1.5 million each year (all fixed costs).
(3) Strategy 3. Implement a cost reduction exercise throughout the company. It is expected that the planned exercise would reduce all variable costs by 20%, but would add to annual fixed costs by $3.5 million.
Paper P5: Advanced performance management
534 © Emile Woolf Publishing Limited
Required (a) Calculate the effect of each individual strategy on annual profit, assuming that
the strategy is implemented on its own, without the other two strategies. (b) Show whether the three strategies, if they are all introduced together, will
close the profit gap between the budgeted profit and the target profit that the directors would like to achieve.
20 Zero based budgeting
State briefly where zero based budgeting is likely to be of the greatest value and suggest how often ZBB should be used.
21 Marginal
The marketing director of a company selling home entertainment products has estimated that at a sales price of $250, a new product (the Blaze) will sell 400,000 units in the next year. He also estimates that for every $10 increase or reduction in price, annual sales will fall or increase by 20,000 units below or above this 400,000 units level. The production engineer has estimated that the costs of making the Blaze will be a variable cost of $210 per unit sold and annual fixed costs of $20 million.
(a) You are given the following formulae:
Price function: Pq = P0 – bq
Total revenue function (TR): P0q – bq2
Marginal revenue function (MR): P0 – 2bq
where
P0 = Price at zero units of demand
Pq = Price at q units of demand
b = relationship between price and demand
q = units of annual demand
Required
(i) Calculate the price at which the Blaze should be sold in order to maximise profit for the year.
(ii) Calculate the quantity of units that will be sold in the year, if the marketing director’s forecast is correct.
(iii) Calculate the annual profit that will be made from selling the Blaze.
(b) Since the total cost function is a curved line, there are two break-even points. One is below the profit-maximising output level and one is above the profit-maximising output level.
The total profit function can be expressed as a quadratic equation:
y = ax2 + bx + c

Practice questions
© Emile Woolf Publishing Limited 535
The break-even points can be calculated as the values for x that solve the following equation:
x = −b +/− b2 − 4ac
2a
Required
Calculate the levels of output and the associated selling prices for Blaze at which the company would break even.
22 MC = MR
A business entity has estimated that it faces the following price/quantity relationship.
Sales price Quantity demanded
$ Units 50 1,000 30 2,000 10 3,000
Required
(a) Calculate a formula for the demand curve, assuming that the demand curve can be drawn as a straight line on a graph.
(b) Find the formula for total revenue.
(c) If the marginal cost per unit is $8, calculate price at which contribution is maximised.
23 Snap Company
Snap Company makes product SP8 in department C. For the year commencing 1st January 20X7 the following budget has been formulated for department C:
$000
Direct costs Materials 60 Labour 40 100 Production overheads 100 Full production cost 200 Administrative and marketing overheads 50 Full cost of sale 250 Profit 50 Revenue (see note) 300
Note: From budgeted sales of 20,000 units. Production overheads are absorbed on the basis of 100% of direct costs. However, half of these costs are fixed, and the other half are variable. It is assumed that they vary with the cost of materials.

Paper P5: Advanced performance management
536 © Emile Woolf Publishing Limited
The administrative and marketing overheads are based on 25% of factory costs and do not vary within wide ranges of activity. A profit margin of 20% is applied to the full cost of sale. This also results in a price that appears to be fair to customers. Halfway through the year to 31st December 20X7, it became clear that actual sales of SP8 would be 25% below budget. At about the same time that this shortfall in sales became evident, a customer asked about buying 5,000 units of a simplified version of product SP8. If Snap Company were to produce this simplified model for the customer, the direct material and labour costs would be lower. It is estimated that materials costing $12,000 and direct labour of $8,000 would be required to produce the 5,000 units. As the production could take place within the firm’s existing capacity, fixed costs would not be affected. Required
(a) Calculate the prices that Snap Company should quote to the customer for each unit of the simplified product, assuming that the following pricing policies are applied:
(i) Full cost plus pricing, on the current basis.
(ii) A price that would enable the company to achieve its original budgeted profit.
(b) Give your advice on the price that should be quoted to the customer.
24 Bridge Company
The following costs per unit relate to the production and sale of 20,000 of a product by Bridge Company, for the financial year that has just ended.
$ per unit
Direct material 30 Direct labour 10 Overheads: Variable 10 Fixed 10 60
It has been estimated that major cost increases will apply to the following year, assuming that production and sales volumes are still 20,000 units.
Increase
Direct material 20% Direct labour 5% Variable overhead 5% Fixed overhead 10%
It would be possible to substitute a cheaper grade of direct material allowing the cost of direct materials to be $31.25 per unit. However, a rejection rate of 5% will arise. (There are currently no rejected units.) This would require an additional annual inspection costs of $30,000.
Practice questions
© Emile Woolf Publishing Limited 537
In the past, the selling price has been set using a mark-up of 50% on full cost and a price of $90 per unit was charged in the current year. However, the sales manager has estimated the price/demand relationships as follows: Price $80 $84 $88 $90 $92 $96 $100 Demand (000s units) 25 23 21 20 19 17 15 Required
(a) Decide whether the product should use the regular or the cheaper grade of material.
(b) Calculate the price that should be charged for the product to maximise the annual profit, and the profit that should be expected.
25 Responsibility
A multinational company established a new operating division in Fenland four years ago. The operating division has been established as a profit centre. Decisions relating to the purchase of capital equipment for the division, and borrowing to finance the capital, have been taken at head office. The results for the first four years of operation have been as follows:
Year 1 Year 2 Year 3 Year 4
$000 $000 $000 $000 Sales revenue 172 646 810 1,792 Operating costs 167 620 718 1,490 Depreciation 25 104 187 530 Interest charges 0 132 240 462 Profit/(loss) (20) (210) (335) (690)
The managing director of the division has been asked to explain its poor performance and the escalating losses. In response, the managing director has argued that the performance of the division has improved, and is not getting worse. Required
(a) Identify a measure of performance that would suggest that the performance of the division has been improving over the four-year period.
(b) Suggest how the performance of the division should be assessed, and state whether you agree or disagree with the view of the managing director that performance has improved.
26 Crosstreets Hotel
Crosstreets Hotel owns five hotels in the same country, providing accommodation mainly to business people and tourists. Each hotel has a bar and restaurant open to residents and non-residents. The directors of the company work in two offices in the oldest hotel in the southern region of the country, where the small finance office is also located. Until now the

Paper P5: Advanced performance management
538 © Emile Woolf Publishing Limited
company has only produced statutory financial accounts, and has not produced management accounts. The directors disagree with each other about the profitability of each of the individual hotels owned and operated by the company. The head of the finance office has proposed that performance reports should be produced, based on a system of responsibility accounting for each of the hotels. The performance of all five hotels should also be amalgamated to prepare performance reports at company level. Required
Suggest:
(a) What periodic reports this management information system should produce, and,
(b) what information the reports should contain.
27 Three services
A company provides three types of delivery service to customers: service A, service B and service C. Customers are a mix of firms with a contract for service with the company, and non-contract customers. The following information relates to performance in the year to 31st December Year 1:
Service A Service B Service C
Number of deliveries made 350,000 250,000 20,000 % of deliveries to contract customers 60% 60% 80% Price charged per delivery: Contract customers $9 $15 $300 Premium for non-contract customers + 30% + 50% + 20%
The premium for non-contract customers is in addition to the rate charged to contract customers. All employees in the company were paid $45,000 per year and sundry operating costs, excluding salaries and fuel costs, were $4,000,000 for the year.
The following operational data for the year relates to deliveries:
Services A and B Service C
Average kilometres per vehicle/day 400 600 Number of vehicles 50 18 Operating days in the year 300 300
For Year 2, the company has agreed a fixed price contract for fuel. As a result of this contract, fuel prices will be:
(a) $0.40 per kilometre for Services A and B
(b) $0.80 per kilometre for Service C.
Practice questions
© Emile Woolf Publishing Limited 539
Sales prices will be 3% higher in Year 2 than in Year 1, and salaries and operational expenses will be 5% higher. Sales volume will be exactly the same as in Year 1. The number of employees will also be the same as in Year 1: 60 employees working full-time on Services A and B and 25 employees working full-time on Service C. Required
(a) Prepare a budgeted income statement for the year to 31st December Year 2. (b) Comment on vehicle utilisation.
28 Private medical practice
A private medical practice has five full-time doctors, five full-time assistants and two administrators. Each doctor treats 18 patients each day on average. The medical centre is open for five days each week, 46 weeks each year. Charges for patients vary according to the age of the patient and the nature of the treatment provided.
Charges Adults below 65 year of age
Children and individuals aged 65 years old and over
$ $ No treatment: consultation only 50 30 Minor treatment 200 120 Major treatment 600 280
The patient mix and the treatment mix are as follows:
Patients: Treatment
Adults 45% No treatment 20% Children 25% Minor treatment 70% Over 65 years old 30% Major treatment 10%
The salary of each doctor is $240,000, assistants earn $100,000 and administrators earn $80,000. In addition, everyone receives a 5% bonus at the end of the year. The medical practice expects to pay $414,300 for materials next year and other (fixed) costs will be $733,600. Required
Using the information provided, present an income statement for the medical practice for next year. (Ignore the effects of inflation.)
29 Train times
A railway company has two operating divisions, Northern Region and Southern Region. Each division runs inter-city train services and suburban (‘commuter’) train services. Performance figures for the most recent reporting period are as follows:

Paper P5: Advanced performance management
540 © Emile Woolf Publishing Limited
Northern Region Southern Region Inter-city
services Suburban
services Inter-city services
Suburban services
Journeys 1,500 34,000 1,800 42,000 Completed on schedule 1,240 25,100 1,590 38,600 Completed within five minutes of schedule 1,350 29,500 1,690 40,300 Completed within ten minutes of schedule 1,440 33,100 1,730 41,500 Cancelled journeys 16 405 2 220 Target for on-time completion of journeys 90% 95% 90% 95%
The chief executive officer of the railway company is trying to improve standards of service, and targets have been set for the number of train journeys that should end with the train arriving at its destination on schedule. It is his intention to raise the standards still further in the future. Required
Assess the service performance of the two regions.
30 Non-financial performance measurements
Suggest three non-financial measures of performance that might be helpful to management in assessing the following aspects of operations in a commercial bank:
(1) service quality
(2) marketing effectiveness
(3) personnel
31 Mission
The managing director of Branded Company, a listed company, has recently returned from a conference entitled ‘Strategic planning and its context within the global business environment’. Whilst at the conference she attended a session on ‘corporation mission statements’. She found the session very interesting but it was rather short. She now has some questions for you.
(1) 'What does “corporate mission” mean? I don’t see how it fits in with our strategic planning process’.
(2) ‘Where does our mission come from and what areas of corporate life should it cover’?
(3) ‘Even if we were to develop one of these mission statements, what benefits would the company get from it’?
Required
Prepare brief answers to the managing director’s questions.
32 Customer profitability
PQR Company sells a range of five products. Budgeted annual data for sales and costs are as follows:

Practice questions
© Emile Woolf Publishing Limited 541
Product Selling price Variable cost
$ $ A 3.60 2.40 B 2.50 2.00 C 4.00 2.80 D 2.40 1.50 E 6.00 4.00
Budgeted total annual sales are:
Product Annual sales
units A 100,000 B 150,000 C 120,000 D 180,000 E 80,000
The products are sold to four different types or category of customer, as follows:
% of annual sales Category of customer
Product C1 C2 C3 C4 A 10% 20% 20% 50% B 40% - 30% 30% C 10% 20% 10% 60% D 30% 10% 20% 40% E 20% - 20% 60%
Rebates on sales
At the end of each year, the company will pay rebates to Category 3 and Category 4 customers, as follows:
(c) Category 3 customers: rebate = 5% of annual sales
(d) Category 4 customers: rebate = 10% of annual sales.
Fixed costs
Budgeted total fixed costs for the year are $465,000, analysed as follows:
$
Delivery costs 250,000 Order processing costs 105,000 Cost of promotion events 30,000 385,000 Other fixed costs 80,000 465,000
The company operates an activity based costing system. Relevant budgeted data relating to activities is as follows:
Category of customer
C1 C2 C3 C4 Number of deliveries 40 80 50 100 Number of orders 30 70 50 60 Number of promotion events 0 0 2 10 Average km per delivery 100 200 300 150
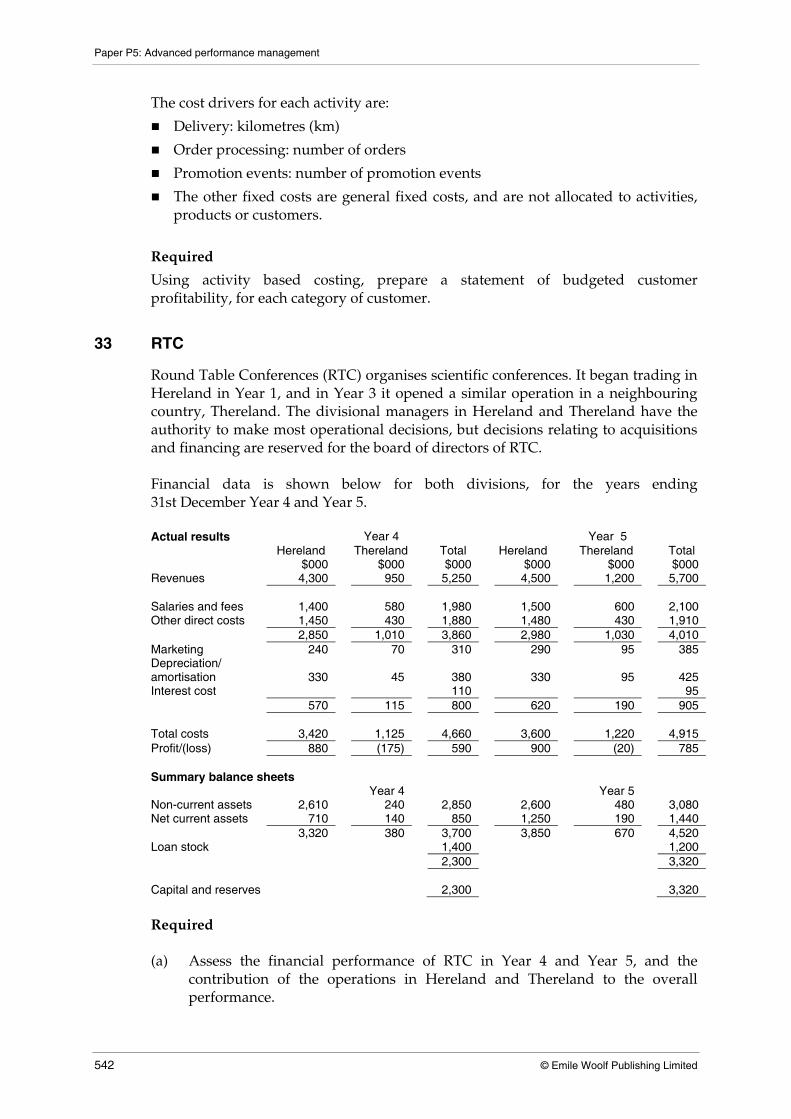
Paper P5: Advanced performance management
542 © Emile Woolf Publishing Limited
The cost drivers for each activity are:
Delivery: kilometres (km)
Order processing: number of orders
Promotion events: number of promotion events
The other fixed costs are general fixed costs, and are not allocated to activities, products or customers.
Required
Using activity based costing, prepare a statement of budgeted customer profitability, for each category of customer.
33 RTC
Round Table Conferences (RTC) organises scientific conferences. It began trading in Hereland in Year 1, and in Year 3 it opened a similar operation in a neighbouring country, Thereland. The divisional managers in Hereland and Thereland have the authority to make most operational decisions, but decisions relating to acquisitions and financing are reserved for the board of directors of RTC. Financial data is shown below for both divisions, for the years ending 31st December Year 4 and Year 5. Actual results Year 4 Year 5 Hereland Thereland Total Hereland Thereland Total $000 $000 $000 $000 $000 $000 Revenues 4,300 950 5,250 4,500 1,200 5,700 Salaries and fees 1,400 580 1,980 1,500 600 2,100 Other direct costs 1,450 430 1,880 1,480 430 1,910 2,850 1,010 3,860 2,980 1,030 4,010 Marketing 240 70 310 290 95 385 Depreciation/ amortisation 330 45 380 330 95 425 Interest cost 110 95 570 115 800 620 190 905 Total costs 3,420 1,125 4,660 3,600 1,220 4,915 Profit/(loss) 880 (175) 590 900 (20) 785 Summary balance sheets Year 4 Year 5 Non-current assets 2,610 240 2,850 2,600 480 3,080 Net current assets 710 140 850 1,250 190 1,440 3,320 380 3,700 3,850 670 4,520 Loan stock 1,400 1,200 2,300 3,320 Capital and reserves 2,300 3,320
Required (a) Assess the financial performance of RTC in Year 4 and Year 5, and the
contribution of the operations in Hereland and Thereland to the overall performance.

Practice questions
© Emile Woolf Publishing Limited 543
(b) Suggest, with reasons, four additional items of information that you would require in order to provide a more comprehensive financial analysis of performance.
(c) Suggest, with reasons four factors that should be taken into consideration when comparing performance in Hereland and Thereland.
34 Value for money
A school teaches children from the age of 11 to the age of 18. The governors of the school have been concerned that in recent years, the performance of the school has deteriorated. The chairman of the board of governors has stated his view that parents of the children at the school have a right to expect more value for money, and he proposes that a value for money exercise should be carried out. Required (i) What aspects of the school and its operations would a value for money
exercise investigate? (ii) What might be the benefits of a value for money exercise?
35 Decentralisation
(a) Define the following concepts:
(i) Responsibility accounting
(ii) An investment centre
(iii) Return on investment (for a division)
(iv) Residual income (for a division).
(b) The following information available about Divisions M and W, which are investment centres in LK Group.
Division M Division W
Divisional investment $200,000 $5,000,000 Division profit $20,000 $410,000
The weighted average cost of capital for LK Group is 8%. Ignore taxation.
Required
(a) Evaluate the performance of Division M and Division W.
(b) Re-evaluate the situation given that the weighted cost of capital is
(1) 6%
(2) 10%.

Paper P5: Advanced performance management
544 © Emile Woolf Publishing Limited
36 West Division
Large Group has several separate divisions, each operating as an investment centre within the group. West Division makes and sells three products, A, B and C. All three products are sold under the Titan brand label, but Product A and Product B are also sold through a supermarket group as unbranded products. Budgeted data for the year to 31st December Year 7 is as follows:
Product sales Product A Product B Product C
units units units Titan brand 160,000 120,000 50,000 Unbranded 450,000 600,000 -
Selling prices Product A Product B Product C
$ per unit $ per unit $ per unit Titan brand 2.50 3.20 5.00 Unbranded 1.50 2.00 -
Variable costs Production Packaging
$ per unit $ per unit Product A: Titan brand 1.20 0.30 Unbranded 1.20 0.10 Product B: Titan brand 1.60 0.40 Unbranded 1.60 0.20 Product C: Titan brand 2.50 0.50
Budgeted marketing expenditure is $180,000 for the year, and other budgeted expenditure for other fixed costs is $375,000. The average capital employed in West Division in Year 7 is expected to be $400,000 and the division’s cost of capital is 10%. Required
(a) Calculate the budgeted ROI for West Division for the year to 31st December Year 7.
(b) Calculate the budgeted residual income for West Division for the year to 31st December Year 7.
37 Annuity method
An investment centre is considering an investment in new machinery that would cost $600,000. The machines would have a life of three years and no residual value. The introduction of the machines will reduce annual operating costs (cash expenditures) by $300,000. The cost of capital for the investment centre is 12%.
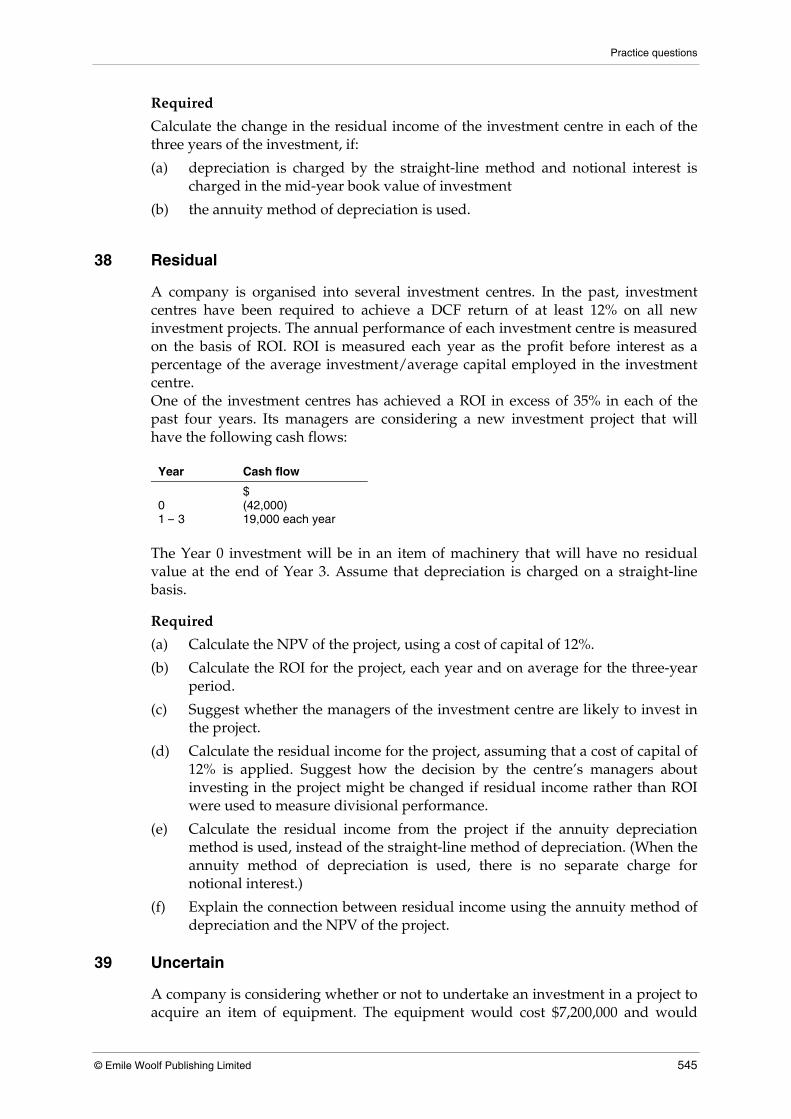
Practice questions
© Emile Woolf Publishing Limited 545
Required
Calculate the change in the residual income of the investment centre in each of the three years of the investment, if:
(a) depreciation is charged by the straight-line method and notional interest is charged in the mid-year book value of investment
(b) the annuity method of depreciation is used.
38 Residual
A company is organised into several investment centres. In the past, investment centres have been required to achieve a DCF return of at least 12% on all new investment projects. The annual performance of each investment centre is measured on the basis of ROI. ROI is measured each year as the profit before interest as a percentage of the average investment/average capital employed in the investment centre. One of the investment centres has achieved a ROI in excess of 35% in each of the past four years. Its managers are considering a new investment project that will have the following cash flows:
Year Cash flow
$ 0 (42,000) 1 – 3 19,000 each year
The Year 0 investment will be in an item of machinery that will have no residual value at the end of Year 3. Assume that depreciation is charged on a straight-line basis.
Required
(a) Calculate the NPV of the project, using a cost of capital of 12%.
(b) Calculate the ROI for the project, each year and on average for the three-year period.
(c) Suggest whether the managers of the investment centre are likely to invest in the project.
(d) Calculate the residual income for the project, assuming that a cost of capital of 12% is applied. Suggest how the decision by the centre’s managers about investing in the project might be changed if residual income rather than ROI were used to measure divisional performance.
(e) Calculate the residual income from the project if the annuity depreciation method is used, instead of the straight-line method of depreciation. (When the annuity method of depreciation is used, there is no separate charge for notional interest.)
(f) Explain the connection between residual income using the annuity method of depreciation and the NPV of the project.
39 Uncertain
A company is considering whether or not to undertake an investment in a project to acquire an item of equipment. The equipment would cost $7,200,000 and would

Paper P5: Advanced performance management
546 © Emile Woolf Publishing Limited
have a three-year operating life. At the end of that time, its residual value would be zero.
The following estimates have been made of the cash flows from the investment: Year Cash flow benefits Cash outflows
$ $ 1 6,000,000 3,000,000 2 8,000,000 4,000,000 3 5,000,000 3,000,000
However, there is some uncertainty in these cash flow figures, and it is estimated that:
(e) annual cash flow benefits could be up to 6% higher or 6% lower
(f) annual cash outflows could be up to 10% higher or lower.
The equipment would be depreciated by the straight-line method. The appropriate cost of capital for the project is 9%, but there is some uncertainty about the risk in the project and the appropriate cost of capital could be anywhere in the range 7% to 11%. Required
(a) Assuming that the most optimistic estimates should be applied, calculate:
(i) the NPV of the project
(ii) the residual income each year from the project, assuming that notional interest is calculated on the net book value of the equipment at the beginning of the year.
(b) Assuming that the most pessimistic estimates should be applied, calculate:
(i) the NPV of the project
(ii) the residual income each year from the project, assuming that notional interest is calculated on the net book value of the equipment at the beginning of the year.
(c) Suggest whether the company is likely to undertake the project.
40 Two divisions
A company has two operating divisions, X and Y, that are treated as profit centres for the purpose of performance reporting. Division X makes two products, Product A and Product B. Product A is sold to external customers for $62 per unit. Product B is a part-finished item that is sold only to Division Y. Division Y can obtain the part-finished item from either Division X or from an external supplier. The external supplier charges a price of $55 per unit. The production capacity of Division X is measured in total units of output for Products A and B. Each unit requires the same direct labour time. The costs of production in Division X are as follows:
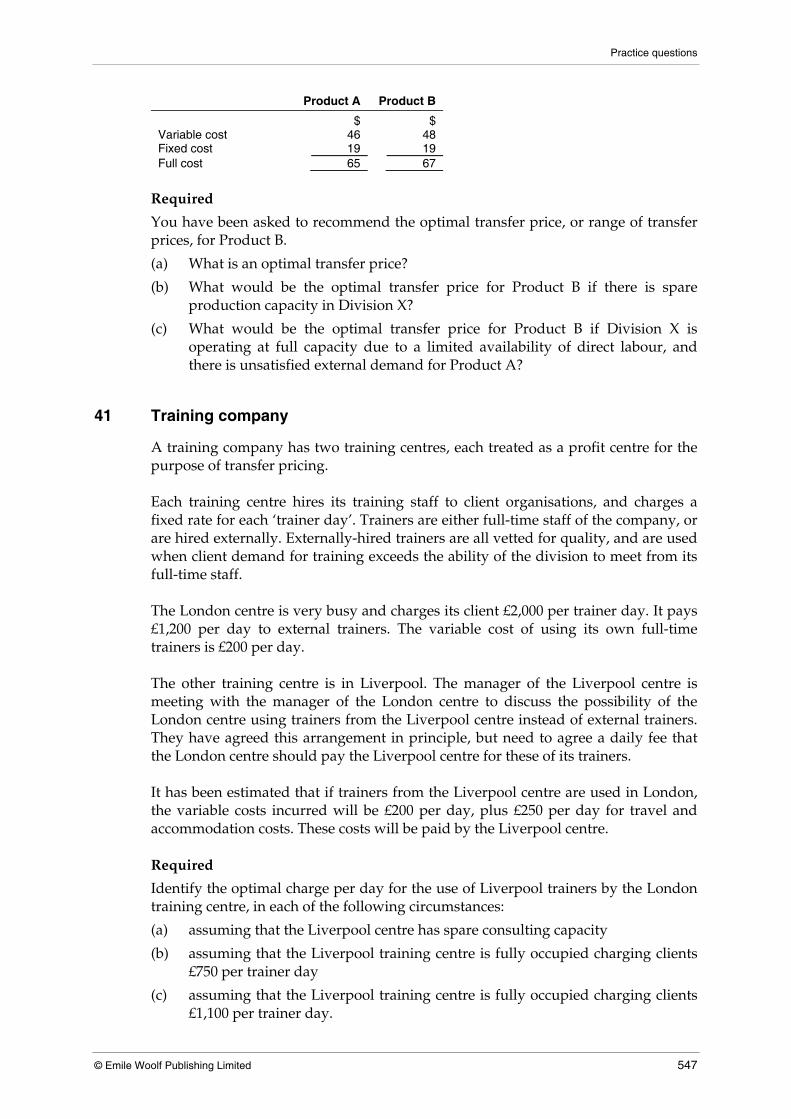
Practice questions
© Emile Woolf Publishing Limited 547
Product A Product B
$ $ Variable cost 46 48 Fixed cost 19 19 Full cost 65 67
Required
You have been asked to recommend the optimal transfer price, or range of transfer prices, for Product B.
(a) What is an optimal transfer price?
(b) What would be the optimal transfer price for Product B if there is spare production capacity in Division X?
(c) What would be the optimal transfer price for Product B if Division X is operating at full capacity due to a limited availability of direct labour, and there is unsatisfied external demand for Product A?
41 Training company
A training company has two training centres, each treated as a profit centre for the purpose of transfer pricing. Each training centre hires its training staff to client organisations, and charges a fixed rate for each ‘trainer day’. Trainers are either full-time staff of the company, or are hired externally. Externally-hired trainers are all vetted for quality, and are used when client demand for training exceeds the ability of the division to meet from its full-time staff. The London centre is very busy and charges its client £2,000 per trainer day. It pays £1,200 per day to external trainers. The variable cost of using its own full-time trainers is £200 per day. The other training centre is in Liverpool. The manager of the Liverpool centre is meeting with the manager of the London centre to discuss the possibility of the London centre using trainers from the Liverpool centre instead of external trainers. They have agreed this arrangement in principle, but need to agree a daily fee that the London centre should pay the Liverpool centre for these of its trainers. It has been estimated that if trainers from the Liverpool centre are used in London, the variable costs incurred will be £200 per day, plus £250 per day for travel and accommodation costs. These costs will be paid by the Liverpool centre. Required
Identify the optimal charge per day for the use of Liverpool trainers by the London training centre, in each of the following circumstances:
(a) assuming that the Liverpool centre has spare consulting capacity
(b) assuming that the Liverpool training centre is fully occupied charging clients £750 per trainer day
(c) assuming that the Liverpool training centre is fully occupied charging clients £1,100 per trainer day.

Paper P5: Advanced performance management
548 © Emile Woolf Publishing Limited
42 Shadow price
Division A supplies a special chemical to Division B, another profit centre in the same group. The output capacity for making the special chemical in Division A is limited.
(g) The variable cost of making the chemical is $500 per kilo.
(h) There is no external intermediate market for the chemical.
(i) Division B uses the chemical to manufacture a tablet. Each tablet uses ten grams of the chemical.
Sales demand for the tablet exceeds the production capacity of Divisions A and B. The selling price for each tablet is $10. Further variable processing costs in Division B to make the tablet from the special chemical are $2 per tablet. Required
(a) Calculate the shadow price of each kilo of the special chemical.
(b) Identify the ideal transfer price.
(c) Suggest whether this transfer price will provide a suitable basis for performance evaluation of the two divisions.
43 Bricks
ABC Company is organised into two trading groups. Group X makes materials that are used to manufacture special bricks. It transfers some of these materials to Group Y and sells some of the materials externally to other brick manufacturers. Group Y makes special bricks from the materials and sells them to traders in building materials.
The production capacity of Group X is 2,000 tonnes per month. At present sales are limited to 1,000 tonnes to external customers and 600 tonnes to Group Y.
The transfer price was agreed at $200 per tonne in line with the external sales trade price at 1st July which was the beginning of the budget year. From 1st December, however, strong competition in the market has reduced the market price for the materials to $180 per tonne.
The manager of Group Y is now saying that the transfer price for the materials from Group X should be the same as for external customers. The manager of Group X rejects this argument on the basis that the original budget established the transfer price for the entire financial year.
From each tonne of materials, Group Y produces 1,000 bricks, which it sells at $0.40 per brick. It would sell a further 40,000 bricks if the price were reduced to $0.32 per brick.
Other data relevant are given below.
Group X Group Y
$ $ Variable cost per tonne 70 60 Fixed cost per month 100,000 40,000

Practice questions
© Emile Woolf Publishing Limited 549
The variable costs of Group Y exclude the transfer price of materials from Group X.
Required
(a) Prepare estimated profit statements for the month of December for each group and for ABC Company as a whole, based on transfer prices of $200 per tonne and of $180 per tonne, when producing at
(i) 80% capacity
(ii) 100% capacity, on the assumption that Group Y reduces the selling price to $0.32.
(b) Comment on the effect that might result from a change in the transfer price from $200 to $180.
(c) Suggest an alternative transfer price that would provide an incentive for Division Y to reduce the selling price and increase sales by 40,000 bricks a month.
44 International transfers
An international company has two operating subsidiaries, one in Country X and one in Country Y. The subsidiaries operate independently, and report to head office as investment centres. Each investment centre manager has the freedom to make his own decisions about what products they should sell, who to sell them to, and the prices at which they should be sold. Each investment centre is required to maximise its annual profit The main subsidiary (X Division) is in Country X. It makes and sells two products, Product P and Product Q. Sales and cost data for X Division is as follows:
Product P Product Q
Annual sales demand 150,000 units 600,000 units $ $ Selling price 9.00 Variable cost of production 3.40 Contribution per unit 5.60 0.50
Products P and Q are made on the same machines and with the same work force, at a production centre in Country X. Each product requires exactly the same amount of machine time and labour time, and production can be switched easily from one product to another. Total production capacity is 800,000 units each year, for Product P and Product Q in total. The investment centre in Country Y (Y Division) is considering a decision to sell Product P. It would not manufacture the product itself, but would buy units of Product P either from Division X or from an external supplier. The external supplier would be willing to sell units of Product P to Division Y at a price of $5 per unit. The manager of Division Y has asked the manager of Division X to quote a price for supplying Product P. Division X has replied by saying that they would be willing to supply units of Product P at its normal selling price less 40%.

Paper P5: Advanced performance management
550 © Emile Woolf Publishing Limited
Division Y is not yet sure whether it will want to buy 50,000 units of Product P each year, or 120,000 units.
Required
(a) If Division X offers to sell units of Product P at the normal selling price in Country X less 40%, what will be the decision of the manager of Division Y if annual purchase requirements are:
(i) 50,000 units of Product P
(ii) 120,000 units of Product P?
(b) Recommend a transfer price, or a range of transfer prices, at which Division X should offer to sell units of Product P to Division Y, if the annual profits of the company as a whole are to be maximised and annual purchase requirements are:
(i) 50,000 units of Product P
(ii) 120,000 units of Product P?
Ignore taxation.
(c) Suppose that the rate of taxation on company profits is 50% in Country X and 30% in Country Y.
Recommend, with reasons, whether Division Y should obtain units of Product P from Division X or from the external supplier, if its annual purchase requirements are 120,000 units and if the transfer price is the market price in Country X less 40%.
45 Long and Short
Long and Short are two divisions in the Range Group of companies. Both require components S and M for their operations. Component S is available from Division A and component M is available from Division B. Long Division converts the components S and M into a final product, RDZ. Short Division converts the components S and M into another final product, BL. The market demand for RDZ and BL exceeds the production capacity of Range Group, because of the limited availability of components S and M. There is no external intermediate market for S or M. No other intermediate product market is available to the Long and Short Divisions.
Other data
Long Division
RDZ Selling price per unit $45 Processing cost per unit $12
Components required per unit of RDZ Component S 3 units Component M 2 units

Practice questions
© Emile Woolf Publishing Limited 551
Short Division
BL Selling price per unit $54 Processing cost per unit $14 Components required per unit of BL Component S 2 units Component M 4 units
Division A
Component S Variable cost per unit $6 Maximum production capacity 1,200 units
Division B
Component M Variable cost per unit $4 Maximum production capacity 1,600 units
The solution to a linear programming model for production planning in Range Group shows that the imputed scarcity value (shadow price) of product S is $0.50 and the imputed scarcity value of product M is $2.75 per unit. The model also indicates that the components S and M should be transferred to Long and Short Divisions such that 200 units of RDZ and 300 units of BL are produced and sold. Required
(a) Calculate the contribution earned by the Range Group if the production and sales plan indicated by the linear programming model is implemented.
(b) If the transfer prices are set on the basis of variable cost plus shadow price, show detailed calculations for the following:
(i) the contribution per unit of intermediate product earned by divisions A and B.
(ii) the contribution per unit of products RDZ and BL.
(c) Comment on the results in (b) above and on the possible attitude of management of the various divisions to the proposed transfer pricing and the production and sales plan.
(d) In the following year, the capacities of Divisions A and B have each doubled and the following changes have taken place:
(i) Component S – There is still no external market for this product, but Division A has a large demand for other products which could use its spare capacity and earn a contribution of 5% over cost. The variable cost per unit for the other products would be the same as for Component S and these products would use capacity in Division A at the same rate as Component S.
(ii) Component M – An intermediate market for this product now exists and Component M can be bought and sold in unlimited amounts at $7.50 per unit. External sales of Component M would incur additional transport costs of $0.50 per unit which are not incurred in inter-divisional transfers.
The sales demand for units of RDZ and BL will still exceed the production capacity of Divisions A and B to make component S and M for Long and Short Divisions.

Paper P5: Advanced performance management
552 © Emile Woolf Publishing Limited
Calculate the transfer prices at which Components S and M should now be offered to Long and Short Divisions, in order that the transfer policy implemented will lead to the maximisation of group profit. Determine the production and sales pattern for Component S, Component M, product RDZ and product BL that will now maximise contribution for the Range Group, and calculate the amount of this total contribution. You should assume that all the divisions will make decisions that are consistent with the financial data available.
46 Balanced
A balanced scorecard approach may be used to set performance targets and monitor performance.
(a) List the four aspects of performance in a balanced scorecard approach.
(b) Suggest how a professional football club might use a balanced scorecard approach. Indicate what key aspects of performance might be identified and suggest performance targets that a football club might use in a balanced scorecard approach.
47 Pyramid
(a) Describe briefly the performance pyramid.
(b) List the dimensions of performance for a service industry, as suggested by Fitzgerald and others.
48 The Vet Centre
The Vet Centre is a company that specialises in the medical treatment of animals. The services provided by the Centre are grouped into three categories:
(1) domestic animals (2) farm animals (3) ‘exotic’ animals. There are several other local centres for treating sick animals, and the owner of the Vet Centre is very aware of the threat from competitors. The system used by the Centre to deal with customers is as follows. Customers are required to telephone the Centre when they suspect that there might be a problem with their animal. The Centre Controller then: (1) in the case of domestic and exotic animals, suggests to the customer whether
or not the animal should be brought into the Centre for examination and treatment
(2) in the case of farm animals, suggests whether a vet should go out to visit the farmer to examine the animal (or animals), and
(3) gives an indicative price that the customer might have to pay.

Practice questions
© Emile Woolf Publishing Limited 553
Customers cannot bring their animal into the Centre without first making an appointment with the Controller. The Centre has a policy of employing no more than ten full-time veterinary surgeons (‘vets’), who work full time on either domestic animals or farm animals. ‘Exotic’ animals are treated by specialists. These are not full-time employees, but work for the Centre when required in response to telephone requests for assistance from the Centre. Full time vets are paid $60,000 each per year in salary. In addition, they receive a bonus of 50% of the amount by which actual fee income exceeds the budgeted fee income for the year. The total bonus is shared equally between the full-time vets. The full-time vets are also required to deal with complaints from customers about poor treatment or unsuccessful treatments. The owner of the Vet Centre is committed to keeping his staff fully up-to-date with current developments in the treatment of sick and injured animals. Each vet has a personal development programme, and is allowed to attend external training courses and seminars on up to eight days each year.
The Vet Centre: statistics for the year ended 31st December Year 8 Budget Actual Number of vets: Dealing with domestic animals 6 5 Dealing with farm animals 4 5 Customer enquiries by telephone New business 5,000 9,000 Repeat business 18,000 15,000 Number of examinations/treatments New business 3,000 4,000 Repeat business 16,000 14,000 Mix of examinations/treatments Domestic animals 14,880 11,800 Farm animals 4,000 5,800 ‘Exotic’ animals 120 400 Other statistics: Fee income $2,520,000 $2,820,000 Training costs $75,000 $100,000 Fess for part-time vets (exotic animals) $18,000 $60,000 Other operating costs $1,400,000 $1,610,000 Number of complaints 380 540 ‘Repeat business’ refers to customers who have used the services of the Vet Centre before. Required Fitzgerald and Moon suggested a framework for the analysis of performance systems. (a) Select a performance indicator for each of the six dimensions of performance in
the Fitzgerald and Moon framework, and use this to measure the performance of the Vet Centre in Year 8.
(b) State three factors that should be considered when setting standards of performance.
(c) State three factors that should be considered when linking rewards to the achievement of performance standards.

Paper P5: Advanced performance management
554 © Emile Woolf Publishing Limited
49 Total quality
(a) List the key aspects of Total Quality Management (TQM).
(b) What are quality-related costs? What is the TQM approach to quality-related costs, and how does this differ from the more traditional approach to these costs?
(c) List the key aspects of just-in-time (JIT) management
(d) Briefly explain the nature of activity based management (ABM).
50 Poole Company
Poole Company makes and sells a single product. The existing product specifications are as follows: Material X 8 square metres at $4 per square metre Machine time 0.6 running hours Other machine costs $40/hour Selling price $100 Poole Company needs to fulfil orders for 5,000 units per period. There will be no change in inventory level during the period. The following Information is available about performance before the introduction of a TQM programme:
(1) 5% of incoming material from suppliers is scrapped due to poor receipt and storage.
(2) 4% of material input to the machine process is wasted in process.
(3) Inspection and storage of material cost $0.10 per metre.
(4) Inspection during the cycle costs $25,000 per period.
(5) Production is increased to allow for the downgrading of 12.5% of units at the final inspection phase. Downgraded units are sold as ‘second quality’ units at a discount of 30% of the final selling price.
(6) Production is increased to allow for returns from customers. These are replaced free of charge. Returns are due to specification failure and account for 5% of units initially delivered to customers. Replacement units incur a delivery cost of $8 per unit. 80% of the returns from customers are rectified using 0.2 hours of machine running time and are resold as ‘third quality’ products at a discount of 50% on the standard selling price. The remaining returned units are sold as scrap for $5 per unit.
(7) Product liability claims are estimated at 3% of sales revenue from standard product sales.
(8) Machine idle time is 20% of gross machine hours used.
(9) Sundry costs of administration, selling and distribution total $60,000 per period.
(10) Poole Company is aware of these excess costs and currently spends $20,000 per period to prevent them from happening.

Practice questions
© Emile Woolf Publishing Limited 555
Poole Company is planning a quality management programme that will increase its cost prevention expenditure from $20,000 to $60,000 per period. The estimates of performance levels after the TQM programme are as follows:
(1) A reduction in stores losses of material to 3%.
(2) A reduction in the downgrading of products inspected to 7.5%.
(3) A reduction in material losses in the process to 2.5% of input to the machine process.
(4) A reduction in returns of products from customers to 2.5% delivered.
(5) A reduction in machine idle time to 12.5% of gross hours used.
(6) A reduction in product liability claims to 1% of sales revenue.
(7) A reduction in inspection checks by 40% of the existing figure.
(8) A reduction in sundry administration, selling and distribution costs by 10% of the existing figure.
(9) A reduction in machine running time per unit of product to 0.5 hours.
Required
(a) Prepare summaries showing total units, purchases of material and gross machine hours:
(i) before implementation of the TQM programme, and
(ii) after implementation of the TQM programme.
(b) Prepare income statements for the period both before and after implementation of the TQM programme.
51 Target cost
A company has designed a new product that it would like to introduce to the market. It has spent $250,000 on the design work so far. A market research report has indicated that the product will have a life of four years, and at a selling price of $35 per unit, annual sales would be as follows:
Year Sales
units 1 40,000 2 60,000 3 50,000 4 20,000
It has been estimated that to produce the new product, annual fixed production costs (all cash flows) will increase by $200,000, and the variable cost per unit will be $10. Other cash flows for the project will be:
Capital expenditure of $1,400,000 at the beginning of the project. There will be a residual value of $600,000 from this investment at the end of Year 4.
An investment of $400,000 will be required in working capital. This will be recovered at the end of Year 4.

Paper P5: Advanced performance management
556 © Emile Woolf Publishing Limited
Expenditure on advertising will be required, as follows:
Year Advertising costs
$ 0 800,000 1 600,000 2 400,000 3 200,000
Required
(a) Calculate the expected NPV of the project to launch the new product, if the company’s cost of capital is 12%.
(b) Calculate the target cost for the product that is needed to achieve a return of 12% on investment, and calculate the size of the current cost gap.
52 Cost and quality
Explain briefly how each of the following management accounting techniques can be used to analyse the relationship between cost and quality:
(1) Total Quality Management (TQM)
(2) Activity Based Costing (ABC)
(3) Balanced scorecard
(4) Just in Time management (JIT)
(5) Value analysis

© Emile Woolf Publishing Limited 557
Paper P5 Advanced performance management
Q&A
Answers
Contents
Page
ABC and other accounting methods
1 Lard Company 560
2 LC Company 561
3 Throughput 562
4 Throughput ratio 564
5 Backflush 564
Accounting for decision making
6 Villaco 565
7 Shortages 566
8 Product B22 568
Decision making with risk and uncertainty
9 Payoff table 569
10 Grab Company 570
Quantitative techniques in budgeting
11 Learning 571
12 Greenears 572
13 Regression 573

Paper P5: Advanced performance management
558 © Emile Woolf Publishing Limited
Discounted cash flow (DCF) and long-term decisions
14 Replacement product 574
15 Probabilities 576
16 Sensitivity 576
17 The Jin Company 578
Introduction to strategic management accounting
18 Growth objective 579
19 Gap analysis 580
Budgets and alternative budgeting models
20 Zero based budgeting 582
Economic, fiscal and environmental factors. Pricing strategy
21 Marginal 582
22 MC = MR 584
23 Snap Company 584
24 Bridge company 585
Performance measurement systems
25 Responsibility 587
26 Crosstreets Hotel 587
Measuring performance
27 Three services 590
28 Private medical practice 591
29 Train times 592
30 Non‐financial performance measurements
593
31 Mission 593
32 Customer profitability 594
33 RTC 596
34 Value for money 597

Answers
© Emile Woolf Publishing Limited 559
Decentralisation and divisional performance
35 Decentralisation 598
36 West Division 600
37 Annuity method 600
38 Residual 601
39 Uncertain 602
Transfer pricing
40 Two divisions 603
41 Training company 604
42 Shadow price 605
43 Bricks 606
44 International transfers 607
45 Long and Short 609
Alternative views of performance measurement
46 Balanced 610
47 Pyramid 611
48 The Vet Centre 612
Developments in management accounting and performance management
49 Total quality 615
50 Poole Company 616
51 Target cost 617
52 Cost and quality 618

Paper P5: Advanced performance management
560 © Emile Woolf Publishing Limited
1 Lard Company
(a) (i) Budgeted cost: traditional absorption costing
It is assumed that the weighting of 1:2:3 applies to packaging materials, but not to labour and overhead costs.
Packaging material
Output Material usage
Customer A 30,000 × 1 = 30,000 Customer B 45,000 × 2 = 90,000 Customer C 25,000 × 3 = 75,000 Weighted units of material 195,000
Therefore, packaging material per weighted unit = $1,950,000/195,000 = $10.
Labour and overheads
Total cost of labour and overheads (000s) = 350 + 30 + 500 + 60 = 940
Total units = (30,000 + 45,000 + 25,000) = 100,000.
Labour and overhead cost per unit = $940,000/100,000 = $9.40. Budgeted average cost/unit
Customer A Customer B Customer C $ $ $ Material 10.0 20.0 30.0 Labour/overhead 9.4 9.4 9.4 Product cost/metre 19.4 29.4 39.4
(ii) Activity based costing analysis of labour and overhead costs
Receipts and inspection
Storage
Packaging
$ $ $ Labour Basic pay (20:10:70) 70,000 35,000 245,000 Overtime 15,000 6,250 8,750 Occupancy cost (20: 60: 20) 100,000 300,000 100,000 Administration cost (40: 10: 50) 24,000 6,000 30,000 209,000 347,250 383,750
Activity levels (cost drivers)
Customer Units Receipts and inspection
(hours)
Storage (metres2)
Packaging (hours)
A 30,000 (× 6/60) 3,000 (× 0.3) 9,000 (× 36/60) 18,000 B 45,000 (× 9/60) 6,750 (× 0.3) 13,500 (× 45/60) 33,750 C 25,000 (× 15/60) 6,250 (× 0.3) 7,500 (× 60/60) 25,000 16,000 30,000 76,750

Answers
© Emile Woolf Publishing Limited 561
Customer Units Receipts and inspection
(hours)
Storage (metres2)
Packaging (hours)
Cost $209,000 $347,250 383,750 Cost/unit of activity $13.0625
per hour $11.575
per m2
$5 per hour
ABC-based costs
Customer A Customer B Customer C
$ $ $ Material 10.00 20.00 30.00 Receipts ($13.0625/hour) 1.31 1.96 3.27 Storage ($11.575/m2) 3.47 3.47 3.47 Packing ($5/hour) 3.00 3.75 5.00 Product cost/unit 17.78 29.18 41.74
(b) Total costs per unit for Lard Company are not much different using activity
based costing than they are with traditional absorption costing. However, ABC analysis allows management to look at the costs of overhead-related activities. This may help them to control these costs, through better management of these activities and the resources they use.
2 LC Company
(a)
Budgeted machine hours hours
Product V: 6,000 × 3 18,000 Product W: 4,000 × 4 16,000 Total budgeted machine hours 34,000 Budgeted production overheads $816,000 Absorption rate per machine hour $24
Product V Product W
$ $ Direct materials 20 60 Direct labour 50 40 Production overhead (3 hours/4 hours × $24) 72 96 Full production cost per unit 142 196
(b) Machine-related overhead costs:
Overhead cost per machine hour = $204,000/34,000 hours = $6 per machine hour Set-up related overhead costs: Overhead cost per set-up = $280,000/(18 + 32) = $5,600 per set-up. Purchasing-related overhead costs: Cost per purchase order = $332,000/(48 + 112) = $2,075 per order.

Paper P5: Advanced performance management
562 © Emile Woolf Publishing Limited
Overhead cost analysis Product V Product W Total
cost Cos
t/ unit
Total cost
Cost/
unit
Overheads: $ $ $ $ Machine-related (18,000 × 6) 108,000 18.0 (16,000 × 6) 96,000 24.0 Set-up related (18 × 5,600) 100,800 16.8 (32 × 5,600) 179,200 44.8 Purchasing-related (48 × 2,075) 99,600 16.6 (112 × 2,075) 232,400 58.1 308,400 51.4 507,600 126.9
Unit costs V W
$ $ Direct materials 20.0 60.0 Direct labour 50.0 40.0 Production overhead 51.4 126.9 Full production cost per unit 121.4 226.9
(c) ABC analysis could be used by LC Company to analyse the profitability of
Products V and W. Using ABC, the overhead cost per unit of W is much higher than with traditional absorption costing, and the cost per unit of V is less. This is because Product W has a relatively large amount of setup activity and purchasing-related activity.
Management could look at the reasons why Product W needs so many setups and purchase orders, and by trying to reduce the resources used up by these activities, it might be possible to reduce the costs (and increase the profitability) of Product W.
3 Throughput
(a) Marginal costing approach
Profit will be maximised by producing output to maximise the contribution per machine hour (contribution per unit of limiting factor).
Product X Product Y
Contribution per unit $6 $7 Machine hours per unit 1.5 hours 2 hours Contribution per machine hour $4 $3.50 Priority for manufacture 1st 2nd
Profit will be maximised by making and selling 8,000 units of Product X in each period (maximum sales demand). This will require 12,00 machine hours. The remaining 20,000 machine hours should be used to make and sell 10,000 units of Product Y.

Answers
© Emile Woolf Publishing Limited 563
$
Contribution from Product X: 8,000 × $6 48,000 Contribution from Product Y: 10,000 × $7 70,000 Total contribution 118,000 Fixed costs 90,000 Profit 28,000
(b) Throughput accounting is based on the view that value is not added to a
product until the product is eventually sold. There is no value in inventory. When there is a limiting factor restricting production, all costs except for the cost of bought-in materials (raw materials, purchased components) are fixed costs in the short term, including direct labour costs and associated ‘variable’ overheads.
The aim should be to maximise throughput in a period, where throughput is defined as sales minus the cost of bought-in materials.
The main difference between throughput accounting and marginal costing is in the treatment of direct labour and variable overhead costs as a ‘fixed cost’ in the short term. In throughput accounting, fixed costs are referred to as ‘factory cost’.
(c) Throughput accounting ratio =
Return per bottleneck unit / Factory cost per bottleneck unit
Here, the bottleneck resource is machine time.
Product X Product Y
$ $ Sales price 22 27 Materials cost 10 9 Throughput 12 18 Machine hours per unit 1.5 hours 2 hours Throughput/return per machine hour $8 $9
To calculate the cost per factory hour, we need to make an assumption about direct labour cost and variable overhead costs. It is assumed that the direct labour cost and variable overhead cost in the answer to part (a) is fixed in the short term. $
Direct labour and variable overhead costs: Product X: 8,000 × $6 48,000 Product Y: 10,000 × $11 110,000 Total contribution 158,000 Fixed costs 90,000 Factory cost in each period 248,000
Factory cost per machine hour = $248,000/32,000 hours = $7.75.
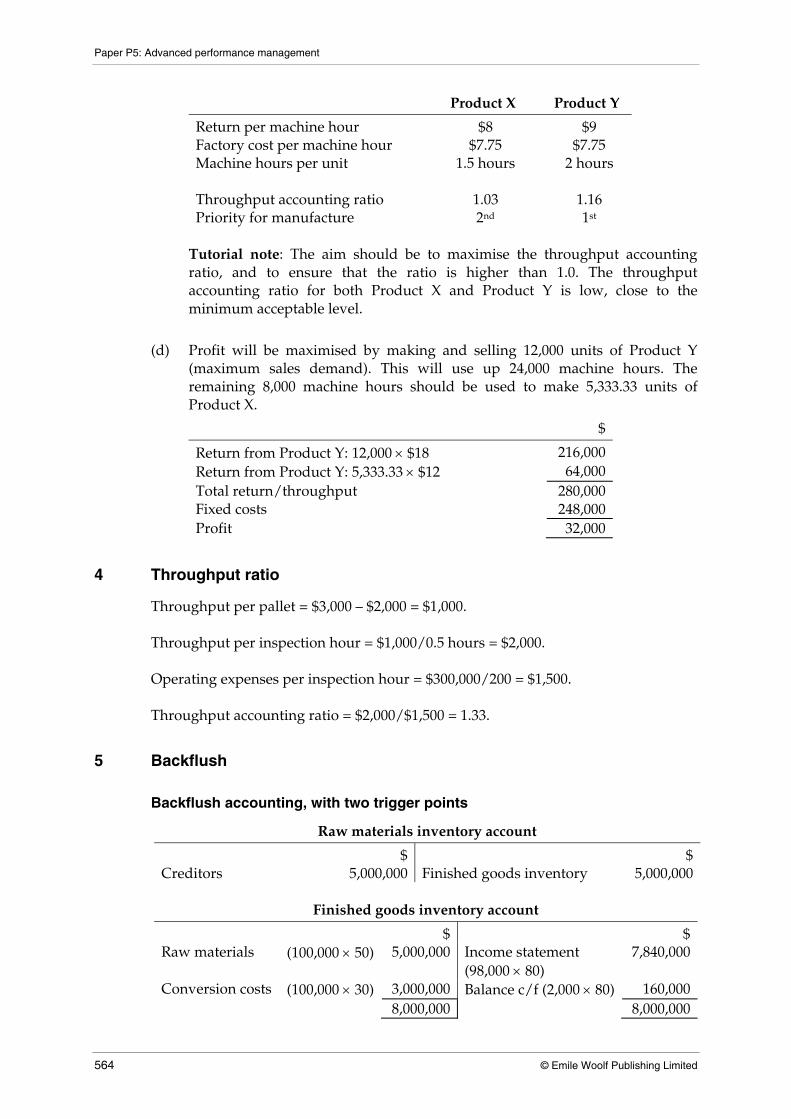
Paper P5: Advanced performance management
564 © Emile Woolf Publishing Limited
Product X Product Y
Return per machine hour $8 $9 Factory cost per machine hour $7.75 $7.75 Machine hours per unit 1.5 hours 2 hours Throughput accounting ratio 1.03 1.16 Priority for manufacture 2nd 1st
Tutorial note: The aim should be to maximise the throughput accounting ratio, and to ensure that the ratio is higher than 1.0. The throughput accounting ratio for both Product X and Product Y is low, close to the minimum acceptable level.
(d) Profit will be maximised by making and selling 12,000 units of Product Y
(maximum sales demand). This will use up 24,000 machine hours. The remaining 8,000 machine hours should be used to make 5,333.33 units of Product X.
$
Return from Product Y: 12,000 × $18 216,000 Return from Product Y: 5,333.33 × $12 64,000 Total return/throughput 280,000 Fixed costs 248,000 Profit 32,000
4 Throughput ratio
Throughput per pallet = $3,000 – $2,000 = $1,000. Throughput per inspection hour = $1,000/0.5 hours = $2,000. Operating expenses per inspection hour = $300,000/200 = $1,500. Throughput accounting ratio = $2,000/$1,500 = 1.33.
5 Backflush
Backflush accounting, with two trigger points
Raw materials inventory account
$ $ Creditors 5,000,000 Finished goods inventory 5,000,000
Finished goods inventory account
$ $ Raw materials (100,000 × 50) 5,000,000 Income statement
(98,000 × 80) 7,840,000
Conversion costs (100,000 × 30) 3,000,000 Balance c/f (2,000 × 80) 160,000 8,000,000 8,000,000

Answers
© Emile Woolf Publishing Limited 565
Conversion costs account
$ $ Creditors (overheads) 3,000,000 Finished goods inventory 3,000,000 3,000,000 3,000,000
Sales
$ $ Income statement (98,000 × 100) 9,800,000
Receivables (98,000 × 100) 9,800,000
Income statement
$ $ Finished goods 7,840,000 Sales 9,800,000 Profit 1,960,000 9,800,000 9,800,000
6 Villaco
(a) Total machine hours required to meet sales demand = (2,000 × 4) + (3,000 × 1) = 11,000. Since only 7,000 hours are available, machine hours are a limiting factor.
Product A Product B
$ $ Sales price 20 10 Variable cost 8 6 Contribution 12 4 Machine hours per unit 4 1 Contribution per hour $3 $4 Priority for manufacture 2nd 1st
Decision: produce and sell the following products
Product
Units
Machine hours
Contribution per unit
Total contribution
$ $ B 3,000 3,000 4 12,000 A (balance) 1,000 4,000 12 12,000 7,000 24,000
(b)
Product A Product B
$ $ Extra cost of external purchase 1 0.50 Machine hours saved by external purchase 4 1 Extra cost per machine hour saved $0.25 $0.50 Priority for manufacture 2nd 1st

Paper P5: Advanced performance management
566 © Emile Woolf Publishing Limited
Item Number of units
Machine hours
Contribution per unit
Contribution
Make $ $ A 1,750 7,000 12 21,000 Buy A (balance) 250 (12 – 1) 11 2,750 B 3,000 (4 – 0.5) 3.5 10,500 Total contribution 34,250
7 Shortages
Working: contribution per unit
A B C D
$/unit $/unit $/unit $/unit Profit 35 55 30 55 Fixed costs: Production 180 240 150 270 Selling 145 225 120 215 Contribution 360 520 300 540
Resources required for the priority order for the major customer
Casing
Units required
Steel
Direct labour
per unit Total per unit Total $ $ hours hours A 30 250 7,500 7.5 225.0 B 20 500 10,000 7.5 150.0 C 30 190 5,700 6.25 187.5 D 20 390 7,800 12.5 250.0 Total 31,000 812.5
(a) Steel in short supply and restricted to $250,000
Casing A B C D
$ $ $ $ Contribution/unit 360 520 300 540 Steel costs/unit 250 500 190 390 Contribution/$1 steel cost 1.44 1.04 1.58 1.38 Ranking for manufacture 2nd 4th 1st 3rd
It is assumed that the sales forecasts for the month are correct.
Profit-maximising production schedule
Steel used A B C D
$ units units units units Priority order 31,000 30 20 30 20 Sales of C 51,300 270 Sales of A 67,500 270 Sales of D 70,200 180 220,000 Balance: Sales of B 30,000 60 Total steel available 250,000 Total production/sales 300 80 300 200
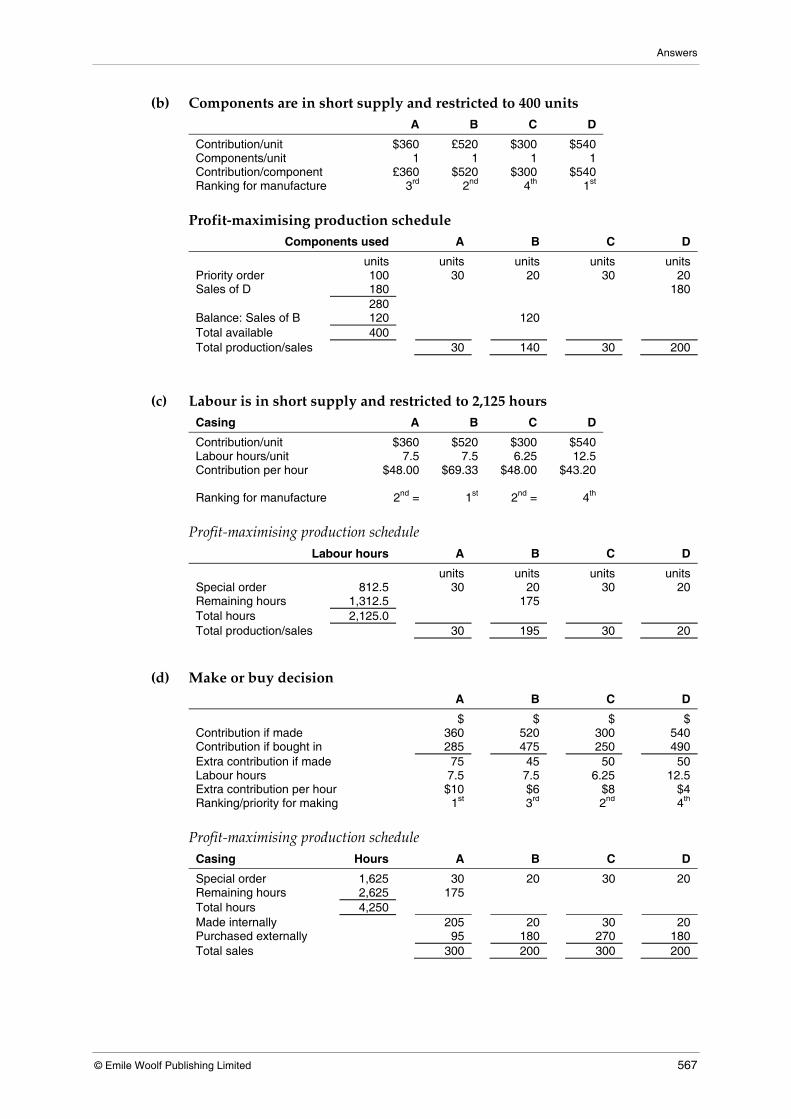
Answers
© Emile Woolf Publishing Limited 567
(b) Components are in short supply and restricted to 400 units A B C D
Contribution/unit $360 £520 $300 $540 Components/unit 1 1 1 1 Contribution/component £360 $520 $300 $540 Ranking for manufacture 3rd 2nd 4th 1st
Profit-maximising production schedule
Components used A B C D
units units units units units Priority order 100 30 20 30 20 Sales of D 180 180 280 Balance: Sales of B 120 120 Total available 400 Total production/sales 30 140 30 200
(c) Labour is in short supply and restricted to 2,125 hours
Casing A B C D
Contribution/unit $360 $520 $300 $540 Labour hours/unit 7.5 7.5 6.25 12.5 Contribution per hour $48.00 $69.33 $48.00 $43.20 Ranking for manufacture 2nd = 1st 2nd = 4th
Profit-maximising production schedule
Labour hours A B C D
units units units units Special order 812.5 30 20 30 20 Remaining hours 1,312.5 175 Total hours 2,125.0 Total production/sales 30 195 30 20
(d) Make or buy decision A B C D
$ $ $ $ Contribution if made 360 520 300 540 Contribution if bought in 285 475 250 490 Extra contribution if made 75 45 50 50 Labour hours 7.5 7.5 6.25 12.5 Extra contribution per hour $10 $6 $8 $4 Ranking/priority for making 1st 3rd 2nd 4th
Profit-maximising production schedule
Casing Hours A B C D
Special order 1,625 30 20 30 20 Remaining hours 2,625 175 Total hours 4,250 Made internally 205 20 30 20 Purchased externally 95 180 270 180 Total sales 300 200 300 200
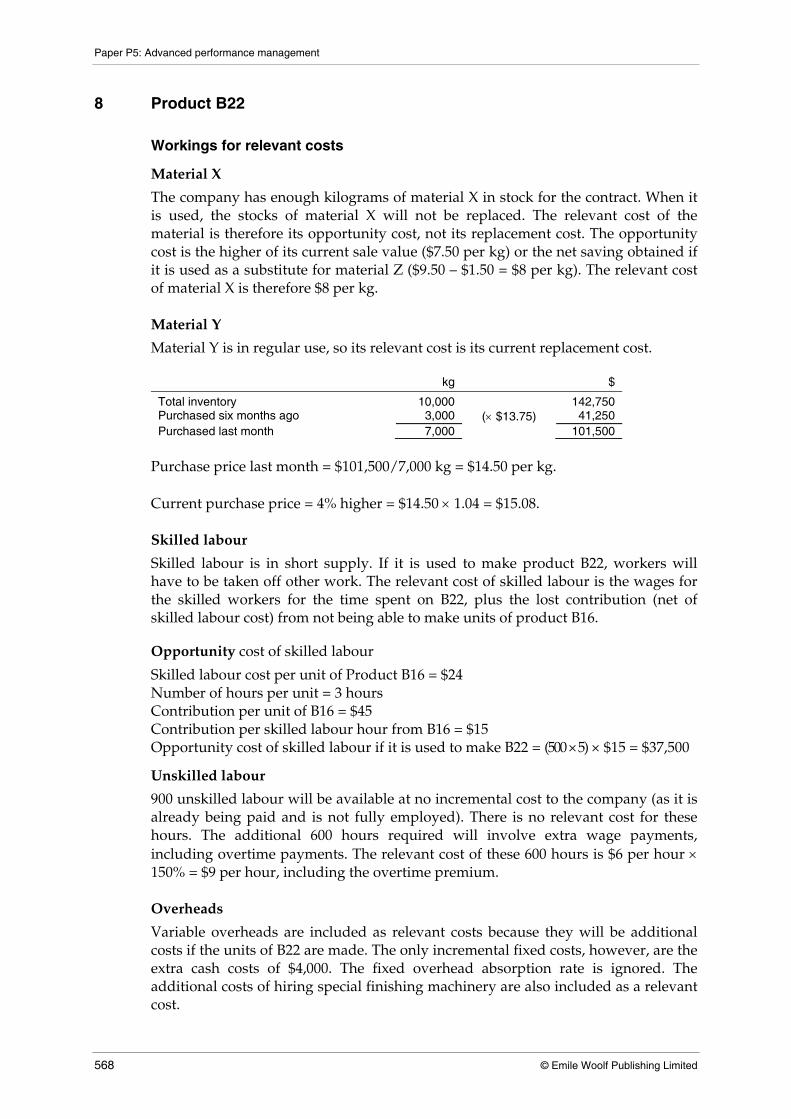
Paper P5: Advanced performance management
568 © Emile Woolf Publishing Limited
8 Product B22
Workings for relevant costs
Material X
The company has enough kilograms of material X in stock for the contract. When it is used, the stocks of material X will not be replaced. The relevant cost of the material is therefore its opportunity cost, not its replacement cost. The opportunity cost is the higher of its current sale value ($7.50 per kg) or the net saving obtained if it is used as a substitute for material Z ($9.50 – $1.50 = $8 per kg). The relevant cost of material X is therefore $8 per kg. Material Y
Material Y is in regular use, so its relevant cost is its current replacement cost.
kg $
Total inventory 10,000 142,750 Purchased six months ago 3,000 (× $13.75) 41,250 Purchased last month 7,000 101,500
Purchase price last month = $101,500/7,000 kg = $14.50 per kg. Current purchase price = 4% higher = $14.50 × 1.04 = $15.08. Skilled labour
Skilled labour is in short supply. If it is used to make product B22, workers will have to be taken off other work. The relevant cost of skilled labour is the wages for the skilled workers for the time spent on B22, plus the lost contribution (net of skilled labour cost) from not being able to make units of product B16.
Opportunity cost of skilled labour
Skilled labour cost per unit of Product B16 = $24 Number of hours per unit = 3 hours Contribution per unit of B16 = $45 Contribution per skilled labour hour from B16 = $15 Opportunity cost of skilled labour if it is used to make B22 = (500 × 5) × $15 = $37,500
Unskilled labour
900 unskilled labour will be available at no incremental cost to the company (as it is already being paid and is not fully employed). There is no relevant cost for these hours. The additional 600 hours required will involve extra wage payments, including overtime payments. The relevant cost of these 600 hours is $6 per hour × 150% = $9 per hour, including the overtime premium. Overheads
Variable overheads are included as relevant costs because they will be additional costs if the units of B22 are made. The only incremental fixed costs, however, are the extra cash costs of $4,000. The fixed overhead absorption rate is ignored. The additional costs of hiring special finishing machinery are also included as a relevant cost.

Answers
© Emile Woolf Publishing Limited 569
Development costs
Those costs already incurred are past costs (sunk costs) and are not relevant. The future development costs involve additional expenditure and are included as relevant costs. Minimum price for making 500 units of B22
Materials: £
X (500 units × 4kg) × $8 16,000 Y (500 units × 6kg) × $15.08 45,240 Labour: Skilled wages (500 units × 5 hours) × $8 20,000 Opportunity cost (500 units × 5 hours) × $15 37,500 Unskilled [(500 × 3) – 900] x 6 × 1.5 5,400 Overheads: Variable (500 units × 2 hours) × 8.75 8,750 Fixed Incremental spending 4,000 Machine hire (2 weeks × $2,650) 5,300 Development costs 1,750 Minimum price 143,940
9 Payoff table
(a)
Cost of buying Revenue from selling Quantity $ Quantity $
20 2 20 6 40 4 40 12 60 6 60 18
Pay-off table, without perfect information
Sales demand per day 20 40 60
Purchases per day $ $ $ 20 4 4 4 (6 – 2) (6 – 2) (6 – 2) 40 2 8 8 (6 – 4) (12 – 4) (12 – 4) 60 0 6 12 (6 – 6) (12 – 6) (18 – 6)
EV of buying decision, without perfect information
Sales demand
EV of daily profit
20 40 60 $ Probability 0.3 0.5 0.2 Purchases per day $ $ $ 20 4 4 4 EV 1.2 2.0 0.8 4.0 40 2 8 8 EV 0.6 4.0 1.6 6.2 60 0 6 12 EV 0 3.0 2.4 5.4

Paper P5: Advanced performance management
570 © Emile Woolf Publishing Limited
On the basis of EV, and without perfect information about daily sales demand, the decision should be to buy 40 buns per day, and the EV of daily profit will be $6.20. (b)
With perfect information
With perfect information about daily sales demand, the baker will purchase the exact number of buns to meet demand. Profit will be $4 when sales demand is 20, $8 when sales demand is 40 and $12 when sales demand is 60.
Sales and purchases Profit Probability EV
$ $ 20 4 0.3 1.2 40 8 0.5 4.0 60 12 0.2 2.4 EV of profit with perfect information 7.6 EV of profit with perfect information 6.2 Value of perfect information 1.4
The value of having perfect information about sales demand each day is $1.40 per day.
10 Grab Company
(a) Outcomes Decision Outcome
Turnover
Variable cost
Advance hire
Conversion premium
Profit
Low Low 4,000 2,800 1,000 0 200 Medium 8,500 5,950 1,000 850 700 High 15,000 10,500 1,000 2,150 1,350 Medium Low 4,000 2,800 1,500 0 (300) Medium 8,500 5,950 1,500 0 1,050 High 15,000 10,500 1,500 1,300 1,700 High Low 4,000 2,800 2,300 0 (1,100) Medium 8,500 5,950 2,300 0 250 High 15,000 10,500 2,300 0 2,200
(b) Pay-off matrix
Low Medium High Expected value
Probability (p) 0.30 0.45 0.25 ∑px Decision x = x = x = Low 200 700 1,350 712.5 Medium (300) 1,050 1,700 807.5 High (1,100) 250 2,200 332.5
The highest expected value is earned if the medium advance hire usage contract is signed.
(c) Risk preferences
The above decision assumes a neutral risk preference. It is possible the organisation may adopt a different decision criterion than expected value.

Answers
© Emile Woolf Publishing Limited 571
Other decision criteria may be based on a risk-seeking approach or a risk-averse approach.
Risk-seeking managers would prefer a maximax approach. This is to maximise the highest possible outcome. In this example this would require a high advance hire contract.
Risk-averse managers would prefer a maximin approach. This is to maximise the lowest possible outcome of a course of action. This would require a low advance hire contract.
(d) Value of perfect information
The maximum value to be paid for perfect information will be
EV(perfect information) – EV(no information)
EV(perfect information) will ensure that the decision will always maximise the EV of a given outcome.
Net profit Probability Expected value
$000 $000 High outcome – High advance hire 2,200 0.25 550.0 Medium outcome – Medium advance hire 1,050 0.45 472.5 Low outcome – Low advance hire 200 0.30 60.0 1,082.5
Value of perfect information = $1,082,500 – $807,500 = $275,000.
11 Learning
(a) (1) hours
Average time for 1st 2 units (200 hours × 80%) 160 Total time for 1st 2 units (160 × 2) 320 Time for first unit 200 Time for second unit 120
Selling price for the second unit: $
Direct materials 2,000 Direct labour (120 hours × $15) 1,800 Fixed production overhead (120 hours × $20) 2,400 Full production cost 6,200 Profit margin (40%) 2,480 Selling price 8,680
(2) hours
Average time for 1st 4 units (200 hours × 80% × 80%) 128 Total time for 1st 4 units (128 × 4) 512 Time for 1st 2 units 320
Time for 3rd and 4th units 192
Average time per unit for 3rd and 4th units 96

Paper P5: Advanced performance management
572 © Emile Woolf Publishing Limited
Average price for the 3rd and 4th units: $ Direct materials 2,000 Direct labour (96 hours × $15) 1,440 Fixed production overhead (96 hours × $20) 1,920 Full production cost 5,360 Profit margin (40%) 2,144 Average selling price 7,504
(3)
hours
Average time for 1st 8 units (200 hours × 80% × 80%× 80%) 102.4 Total time for 1st 8 units (102.4 × 8) 819.2
Selling price for the first 8 units $
Direct materials ($2,000 × 8) 16,000.0 Direct labour (819.2 hours × $15) 12,288.0 Fixed production overhead (819.2 hours × $20) 16,384.0 Full production cost 44,672.0 Profit margin (40%) 17,868.8 Selling price 62,540.8
This gives an average selling price of $7,817.6 per unit.
(b) (1) It may be difficult to establish an expected learning rate. Reliable
statistical evidence of a constant learning rate (for example, as in the aircraft manufacturing industry) is required.
(2) Learning curve theory is of little value for the development of low-cost items where direct labour input is small. The benefits from the learning curve would be small and fairly insignificant.
(3) Learning curve theory assumes that when the first unit has been made, every other unit will be similar. It does not allow for changes in design or other factors that could disrupt the learning effect and change the learning rate.
12 Greenears
The cost of producing batches 6 – 12 is the difference between:
the cost of producing batches 1 – 5, and
the cost of producing batches 1 – 12.
(1) Learning factor
Logarithm 0.85Logarithm 2
= -0.070580.30103
= -0.23446
(2) Average labour cost of producing the first five batches
0.2344651
$2,000=y ×

Answers
© Emile Woolf Publishing Limited 573
= $2,000 (0.68568)
= $1,371 per batch
(3) Average labour cost of producing the first 12 batches
y - $2,000 x 1
120.23446
= $2,000 (0.55844)
= $1,117 per batch
(4) Labour cost of producing batches 6 – 12 $
Total cost for the first 12 batches (12 × $1,117) 13,404 Total cost for the first 5 batches (5 × $1,371) 6,855 Labour cost for batches 6 – 12 6,549
13 Regression
(a)
b = 5(254) - (15)(79)
5(55) - (15)(15)
= 1, 270 - 1,185
275 - 225
b = 85/50 = 1.7
a = 79
5− 1.7(15)
5
a = 10.7 Forecast: Sales in $millions = 10.7 + 1.7x (b) Forecast for Year 6 (20X7) = 10.7 + 1.7(6) = 20.9 ($20.9 million) Forecast for Year 7 (20X8) = 10.7 + 1.7(7) = 22.6 ($22.6 million).
r = 85
(50)[5(1, 279)− (79)(79)
r = 85/87.75 = + 0.97 This is very close to + 1, suggesting that the forecast will be very reliable.

Paper P5: Advanced performance management
574 © Emile Woolf Publishing Limited
14 Replacement product
(a) Workings
If Product T is kept on the market for four more years:
Year
Unit sales
Unit contribution
Annual contribution
£ £ 1 140,000 70 9,800,000 2 130,000 70 9,100,000 3 120,000 70 8,400,000 4 110,000 70 7,700,000
If Product V is introduced:
EV of annual sales = (0.2 × 100,000) + (0.5 × 80,000) + (0.3 × 50,000) = 75,000 units.
Unit contribution = $350 – $230 = $120.
EV of annual contribution = 75,000 units × $120 = $9,000,000.
Solution
Year
Extra costs
Lost contribution from T
Contribution from V
Net cash flow
Discount factor 8%
PV
$000 $000 $000 $000 $000 0 (2,000) (2,000) 1.000 (2,000) 1 (160) (9,800) 9,000 (960) 0.926 (889) 2 (160) (9,100) 9,000 (260) 0.857 (223) 3 (160) (8,400) 9,000 440 0.794 349 4 (160) (7,700) 9,000 1,140 0.735 838 NPV (1,925)
The NPV is – $1925,000, indicating that the immediate replacement of Product T with Product V is not justified.
(b) The discount factor for Year 1- 4 at a cost of capital of 8% = 3.312.
To justify the immediate replacement of Product T with Product V, the annual contribution from Product V would need to be higher by at least: $1,925,000/3.312 = $581,220.
The annual contribution per unit from Product V is currently estimated to be $120.
Annual sales in units from Product V would therefore need to be higher by at least: $581,220/$120 per unit = 4,843.5 units – say 5,000 units.
(c) Tutorial note: Annual sales of Product T are expected to fall by an additional
amount each year. It is therefore not possible to devise a simple computation for the minimum fall in annual sales that would be required to justify immediate replacement by Product V. The method used in the solution below is therefore based on an interpolation method. The NPV is estimated assuming a fall of 15,000 units in sales each year, rather than 10,000 units. A net present value is calculated, and this is used together with the answer in (a) to obtain a ‘break-even’ point.

Answers
© Emile Woolf Publishing Limited 575
Solution
If annual sales of Product T were to fall by 15,000 units in each subsequent year from Year 2 onwards, the contribution lost by replacing Product T with Product V would be as follows:
Year
Unit sales
Unit contribution
Annual contribution
£ £ 1 135,000 70 9,450,000 2 120,000 70 8,400,000 3 105,000 70 7,350,000 4 90,000 70 6,300,000
The NPV of a decision to introduce Product V immediately would be:
Year
Extra costs
Lost contribution from T
Contribution from V
Net cash flow
Discount factor 8%
PV
$000 $000 $000 $000 $000 0 (2,000) (2,000) 1.000 (2,000) 1 (160) (9,450) 9,000 (610) 0.926 (565) 2 (160) (8,400) 9,000 440 0.857 377 3 (160) (7,350) 9,000 1,490 0.794 1,183 4 (160) (6,300) 9,000 2,540 0.735 1,867 NPV + 862
If annual sales of Product T fall by 10,000 units each year, the NPV would be $(1,925,000).
If annual sales of Product T fall by 15,000 units each year, the NPV would be $862,000.
The minimum fall in annual sales of Product T needed to justify its immediate replacement by Product V is therefore approximately:
units 10,000)-(15,000 1,925)+(862
1,925+10,000 ×⎥
⎦
⎤⎢⎣
⎡
= 13,453 units = about 13,500 units.
(d) Limitations of analysis:
(1) Expected value used for sales of Product V. Actual sales could be higher or lower than 75,000 each year.
(2) Estimates of falls in sales of Product T cannot be predicted accurately.
(3) The calculations have ignored taxation and inflation, which is inappropriate in practice.
(4) A cost of capital of 8% has been assumed. This may be inappropriate.
(5) There has been no consideration of the options to introduce Product V at the beginning of Year 3, or Year 4 or Year 5.
(6) The option to reduce the selling price of Product T to increase annual sales has not been considered. Similarly an option to sell Product V at a lower price to increase annual sales has not been considered.
(7) Non-financial factors have been ignored: for example, there could be a longer-term marketing advantage to be gained from introducing Product V as soon as possible.

Paper P5: Advanced performance management
576 © Emile Woolf Publishing Limited
15 Probabilities
Cash inflows for the project can be calculated as an EV of expected annual cash inflows.
The first step is to establish a probability distribution of possible outcomes.
Factor 1
Factor 2
Factor 3 Joint
probability
Yes, No, No 0.2 0.7 0.6 0.084 Yes, Yes, Yes 0.2 0.3 0.4 0.024 Yes, No, Yes 0.2 0.7 0.4 0.056 Yes, Yes, No 0.2 0.3 0.6 0.036 No, No, No 0.8 0.7 0.6 0.336 No, Yes, Yes 0.8 0.3 0.4 0.096 No, No, Yes 0.8 0.7 0.4 0.224 No, Yes, No 0.8 0.3 0.6 0.1440
Probability of outcome
Cash inflows as a proportion of expectation
EV
0.084 (- 25%) 0.75 0.0630 0.024 (- 25% – 10% + 5%) 0.70 0.0168 0.056 (- 25% + 5%) 0.80 0.0448 0.036 (- 25% – 10%) 0.65 0.0234 0.336 1.00 0.3360 0.096 (- 10% + 5%) 0.95 0.0912 0.224 (+ 5%) 1.05 0.2352 0.144 (- 10%) 0.90 0.1296 1.000 0.9400
The EV of cash inflows, allowing for the three additional factors, will be 94% of the original estimates.
Year
Cash inflows (0.94 of original estimate)
Cash outflows
Net cash flow
Discount factor at 10%
PV
$m $m $m $m 0 (6.25) (6.25) 1.000 (6.25) 1 2.82 1.50 1.32 0.909 1.20 2 3.76 1.80 1.96 0.826 1.62 3 4.70 2.40 2.30 0.751 1.73 4 3.76 1.70 2.06 0.683 1.41 5 1.88 1.00 1.88 0.621 1.17 NPV + 0.88
16 Sensitivity
(a) The residual value of the equipment at the end of year 5 will be 30% × $3 million = $900,000.
Year Cash flow Discount factor at 8% Present value
$ $ 0 (3,000,000) 1.000 (3,000,000) 1 400,000 0.926 370,400 2 800,000 0.857 685,600 3 800,000 0.794 635,200 4 700,000 0.735 514,500 5 400,000 0.681 272,400 5 900,000 0.681 612,900 Net present value + 91,000

Answers
© Emile Woolf Publishing Limited 577
(b) Sensitivity analysis
(i) Cost of equipment
The estimated PV of the cost of the equipment, allowing for a residual value of 30% of cost after five years, is:
3,000,000 – (0.681 × 0.30 × 3,000,000) = 2,387,100.
This estimate can be wrong by $105,400 before the project ceases to have a positive NPV. The cost of the equipment can therefore be higher by (91,000/2,387,100) = 3.8%.
(ii) Residual value of equipment
The estimated PV of the residual value is $612,900. This estimate can be wrong by $105,400 before the project ceases to have a positive NPV. The PV of the residual value could therefore be (612,900 – 105,400) = $521,900.
The residual value (without discounting) could therefore be $507,500/0.681 = $745,228. This is 24.8% of the original cost of $3,000,000.
The residual value could therefore be as low as about 25% of cost before the project ceased to have a positive NPV.
((iii),(iv) and (v)) Sales revenue and annual costs
Workings
The estimated contribution/sales ratio is 40%, therefore sales revenue will be 100/40 = 2.5 times annual contribution. Variable costs will be 60/40 = 1.5 times annual contribution. Fixed costs are $200,000 each year; therefore total contribution is $200,000 more than the annual net cash flow.
Year Contribution PV factor at 8% Revenue Variable costs Total PV Total PV
$000 $000 $ $000 $000 1 600 0.926 1,500 1,389,000 900 833,400 2 1,000 0.857 3,500 2,142,500 1,500 1,285,500 3 1,000 0.794 2,500 1,985,000 1,500 1,191,000 4 900 0.735 2,250 1,653,750 1,350 992,250 5 600 0.681 1,500 1,021,500 900 612,900 8,191,750 4,915,050
The PV of annual fixed costs = $200,000 × discount factor for years 1 – 5 at 8%
= $200,000 × 3.993 = $798,600.
Sales revenue: The PV of sales revenue could be lower by $91,000 before the project ceases to have a positive NPV. Sales revenue could therefore be lower by 91,000/8,245,750 = about 1.3%.
Similarly, variable costs could be higher by (91,000/4,947,450) 2.1% before the project ceases to have a positive NPV.
Similarly, fixed costs could be higher by (91,000/798,600) 13.2% before the project ceases to have a positive NPV.

Paper P5: Advanced performance management
578 © Emile Woolf Publishing Limited
(c) The positive NPV of the project appears to depend on the accuracy of the cash flows. If these are only a small amount worse than estimated, the NPV will be negative. The project is particularly sensitive to estimates of sales revenue, variable costs (and the contribution/sales ratio), the cost of the equipment and its residual value.
This suggests that the project could be high-risk.
17 The Jin Company
(a) Tutorial note. There are two ways of calculating the taxation cash flows. One approach is to calculate the tax on the cash profits ignoring capital allowances, and then to calculate the savings in tax payments because of the capital allowances separately. The second approach is to calculate the profit liable to tax in each year and the tax on that profit. Both methods should produce the same net cash flows. The second approach is used here.
Machine A
Workings Year 1 Year 2 Year 3 Year 4 Cost $600,000 $ $ $ $ Capital allowance (25%) 150,000 112,500 84,375 253,125 Written down value (WDV) 450,000 337,500 253,125 0 Operating cash flow 470,000 520,000 490,000 450,000 Capital allowance 150,000 112,500 84,375 253,125 Profit liable for tax 320,000 407,500 405,625 196,875 Tax at 30% on the profit 96,000 122,250 121,688 59,063
Year 0 Year 1 Year 2 Year 3 Year 4 Year 5 $ $ $ $ $ Machine (600,000) Working capital (100,000) 100,000 Operating cash flow 470,000 520,000 490,000 450,000 Tax (one year in arrears) (96,000) (122,250) (121,688) (59,063) Net cash flow (700,000) 470,000 424,000 367,750 428,312 (59,063) Discount factor 10% 1.000 0.909 0.826 0.751 0.683 0.621 Present value (700,000) 427,230 350,224 276,180 292,537 (36,678) NPV = + $609,493
Machine B Workings Year 1 Year 2 Year 3 Year 4 Year 5 Cost $750,000 $ $ $ $ $ Capital allowance (25%) 187,500 140,625 105,469 79,102 237,304 Written down value (WDV) 562,500 421,875 316,406 237,304 0 Operating cash flow 580,000 640,000 500,000 500,000 400,000 Capital allowance (187,500) (140,625) (105,469) (79,102) (237,304) Profit liable to tax 392,500 499,375 394,531 420,898 162,696 Tax at 30% on the profit 117,750 149,813 118,359 126,269 48,809

Answers
© Emile Woolf Publishing Limited 579
Year 0 Year 1 Year 2 Year 3 Year 4 Year 5 Year 6 $ $ $ $ $ $ Machine (750,000) Working capital (200,000) 200,000 Operating cash flow 580,000 640,000 500,000 500,000 400,000 Tax (one year in arrears) (117,750) (149,813) (118,359) (126,269) (48,809) Net cash flow (950,000) 580,000 522,250 350,187 381,641 473,731 (48,809) Discount factor 10% 1.000 0.909 0.826 0.751 0.683 0.621 0.564 Present value (950,000) 527,220 431,379 262,990 260,661 294,187 (27,528) NPV = + $798,909
(b)
Machine A Machine B $ $ Year 0 spending (700,000) (950,000) Year 1 net cash flow 470,000 580,000 (230,000) (370,000) Year 2 net cash flow 424,000 522,250 194,000 152,250
Payback will be during year 2 for both machines. Machine A. Payback = 1 year + (230,000/424,000) years = 1.54 years. Machine B. Payback = 1 year + (370,000/522,250) years = 1.71 years.
(c) Here is no information to assess whether strategic factors and non-financial
factors might affect the choice between Machine A and Machine B.
On purely financial grounds, Machine B has the higher NPV, but this is for a five-year project whereas the Machine A project would be only four years. Machine A has the slightly earlier payback period.
The recommendation on financial grounds should be to select the machine that will provide the higher equivalent annual value.
Machine A Machine B NPV $609,493 NPV $798,909
Annuity factor at 10%, Years 1 - 4
3.170 Annuity factor at 10%, Years 1 - 5
3.791
Equivalent annual value $192,269 $210,738 Machine B will provide the higher equivalent annual value of benefits, and should therefore be chosen in preference to Machine A.
18 Growth objective
Sales
Sales growth: Year 2 compared with Year 1 20.0% Sales growth: 1st six months of Year 2 compared with 1st six months of Year 1 28.1% Sales growth: 2nd six months of Year 2 compared with 2nd six months of Year 1 5.0%
Sales increased by 20% in Year 2 compared with Year 1. However, the strong growth in sales occurred in the first six months of the year (28% compared with the same period in Year 1). In the second half of the year, sales growth compared with

Paper P5: Advanced performance management
580 © Emile Woolf Publishing Limited
the same period in Year 1 was down to 5%. There is insufficient information to judge whether the growth in sales revenue is slowing down or coming to an end.
Net profit
There was no increase in net profit between Year 1 and Year 2. The increase in sales (20%) is offset by an increase of 30.4% in operating costs and some interest charges. In terms of annual net profit, the business is therefore not growing. If a part-time employee is the equivalent of 50% of a full-time employee, there were 415 equivalent full time employees in Year 1 (260 + 50% × 310). There were 565 equivalent full time employees in Year 2 (318 + 50% × 494). Sales revenue per equivalent full-time employee was therefore $62,651 in Year 1 and $55,221 in Year 2. This fall in employee productivity is one reason for the failure to achieve growth in the annual net profit.
Investment
The investment in non-current assets has risen by just 5%, but the investment in working capital has doubled. The increase in net assets has been almost entirely financed by borrowing. (Presumably, this means that most of the profits earned in Year 1 have been paid in taxation or distributed as dividends to shareholders.) It is difficult to draw definite conclusions from the limited amount of data, but management should be concerned about a 100% increase in working capital, when the increase in annual sales is only 20%. Could there be large quantities of unsold inventory as a result of the decline in sales growth in the second half of the year? It is not clear why it was considered necessary to borrow $9,000,000 when increases in non-current assets have been only $1,300,000. It would appear that the new borrowing might be financing unnecessary working capital investment, and not investment in non-current assets for longer-term development. On the other hand, investment in non-current assets will probably need to exceed 5% per year (by a large amount) if the company is to achieve significant long-term growth in its business.
Product range/new product sales
The data about new products is difficult to interpret, because there is no information about the total size of the product portfolio and no information about whether the new products sold well or badly.
19 Gap analysis
(a) Workings
Budgeted variable costs per unit $000 Material and labour costs 16,000 Variable other production costs (25% × 8,000) 2,000 Variable marketing and distribution costs (1/3 × 12,000) 4,000 Total variable costs 22,000

Answers
© Emile Woolf Publishing Limited 581
Volume of production and sales $80,000 Budgeted variable cost per unit 275 Budgeted contribution per unit (600 – 275) 325
Budgeted annual fixed costs $000 Fixed other production costs (75% × 8,000) 6,000 Fixed marketing and distribution costs (2/3 × 12,000) 8,000 Administration costs 10,000 Total annual fixed costs 24,000
Strategy 1 Increase in sales (units) 5,000 $000 Increase in total annual contribution ($325 × 5,000) 1,625 Increase in annual fixed costs 1,200 Increase in annual profit 425 Strategy 2 Increase in sales price and unit contribution $25 $000 Increase in total annual contribution ($25 × 80,000 units) 2,000 Increase in annual fixed costs 1,500 Increase in annual profit 500
Strategy 2 Reduction in variable cost per unit (20% × $275) $55 Therefore increase in unit contribution $55 $000 Increase in total annual contribution ($55 × 80,000 units) 4,400 Increase in annual fixed costs 3,500 Increase in annual profit 900
(b)
Taking all three strategies together $000 $000 Sales (85,000 units at $625 per unit) 53,125 Variable costs (85,000 × $220 per unit) 18,700 Total contribution Fixed costs 34,425 In the original budget 24,000 Extra fixed costs of strategies 1, 2 and 3 6,200 30,200 Profit 4,225
$000 $000 Profit taking all three strategies together 4,225 Original budget profit 2,000 Difference 2,225 Extra profit from Strategy 1 only 425 Extra profit from Strategy 2 only 500

Paper P5: Advanced performance management
582 © Emile Woolf Publishing Limited
Extra profit from Strategy 3 only 900 1,825 Balancing figure 400
The balancing figure comes from the combination of the three strategies. The
company will sell 5,000 units more than in the original budget, and the contribution per unit will be $80 per unit higher ($25 per unit from strategy 2 and $55 per unit from strategy 3).
5,000 extra units of sale × $80 extra contribution per unit = Extra total
contribution of $400,000. Gap analysis
$000 $000 Target profit 4,000 Original budget profit 2,000 Profit gap 2,000 Extra profit from Strategy 1 only 425 Extra profit from Strategy 2 only 500 Extra profit from Strategy 3 only 900 Extra profit from combination of three strategies 400 2,225 Profit in excess of the ‘gap’ 225
Conclusion: Strategies 1, 2 and 3 together will successfully close the profit gap, if
the targets for each of the strategies can be achieved.
20 Zero based budgeting
Zero based budgeting is most useful when:
There is a lot of budget slack, and wasteful spending. Zero based budgeting can be much more effective than incremental budgeting in identifying and eliminating unnecessary expenditure in a budget.
There is a shortage of resources for ‘overhead’ spending, and decisions have to be made about priorities for spending.
Zero based budgeting is more effective for the planning and control of overhead spending on overhead activities than for controlling direct costs of production. A zero based budgeting operation can be time-consuming and expensive. It should not be needed every year. A ZBB approach to the budget might be sufficient, say, every three or four years.
21 Marginal
(a) When p = 250, q = 400,000.
The quantity sold will fall by 20,000 for every $10 increase in price.
Therefore the price when q = 0 will be 250 + [(400,000/20,000) × $10] = 450

Answers
© Emile Woolf Publishing Limited 583
The price function can be stated as:
Pq = 450 – (10/20,000)q = 450 – 0.0005q.
Total revenue = pq = (450 – 0.0005q)q = 450q – 0.0005q2
Marginal revenue = 450 – (2 × 0.0005 × q) = 450 – 0.001q
Marginal cost = variable cost per unit = 210.
Profit is maximised where MR = MC:
450 – 0.001q = 210
0.001q = 240
q = 240,000 units.
At this volume of sales, p = 450 – 0.0005 (240,000) = 330.
Profit is maximised at a price of $330 per unit, and annual sales will be 240,000 units.
$000
Sales (240,000 × 330) 79,200 Variable costs (240,000 × 210) 50,400 Contribution 28,800 Fixed costs 20,000 Profit 8,800
The annual profit will be $8,800,000.
(b) Profit = Total revenue – Total costs
= (450q – 0.0005q2) – (210q + 20,000,000)
= – 0.0005q2 + 240q – 20,000,000
At break-even point, profit = 0:
- 0.0005q2 + 240q – 20,000,000 = 0
Re-arranging:
0.0005q2 – 240q + 20,000,000 = 0
The break-even points can be calculated as the values for x that solve the following equation:
x = −b +/− b2 − 4ac
2a
q = +240+/− (240)2 − 4(0.0005)(20,000,000)
2(0.0005)
The two break-even points
(1) q = (+ 240 + 132.67)/0.0010 = 372,670 [and p = 450 – 0.0005(372,670) = $263.67]
or
(2) q = (+ 240 – 132.67)/0.0010 = 107,330 [and p = 450 – 0.0005(107,030) = $396.34]

Paper P5: Advanced performance management
584 © Emile Woolf Publishing Limited
22 MC = MR
(a) The demand falls by 1,000 units for every $20 increase in price.
Demand will be 0 when the sales price is $50 + $20 × (1,000/1,000) = $70. The quantity demanded rises by 20/1,000 = 0.02 for every unit of demand.
The demand curve can therefore be expressed as:
P = 70 – 0.02Q
(b) Total revenue = PQ = (70 – 0.02Q)Q = 70Q – 0.02Q2
(c) Marginal revenue = 70 – 0.04Q
Marginal cost = 8
Profit is maximised where MC = MR 8 = 70 – 0.04Q Q = 62/0.04 = 1,550
P = 70 – 0.02Q = 70 – 0.02 (1,550) = 39.
The profit is maximised at a price of $39, when demand will be 1,550 units. Contribution per unit will be $31 ($39 – $8). Total contribution will be $48,050 ($31 × 1,550).
23 Snap Company
(a) (i) Full cost pricing plus, on the current basis $000
Direct materials 12 Direct labour 8 Direct cost 20 Production overheads (100% of direct cost) 20 Full production cost 40 Administrative and marketing overheads (25%) 10 Full cost of sale 50 Profit (20% of full cost of sale) 10 Selling price for order (5,000 units) 60
Sales price per unit = $12.
(ii) Price to maintain budgeted profit of $50,000
If sales of SP8 falls are 25% below budget, the expected profit will be as follows:
$000
Direct costs 75% × 100,000 75.0 Variable overheads 75% × 50,000 37.5 Total variable costs 112.5 Fixed production overhead 50.0 Other fixed overheads 50.0 Total costs 212.5 Sales 75% × 300,000 225.0 Profit 12.5

Answers
© Emile Woolf Publishing Limited 585
In order to make a profit of $50,000 for the year, the simplified units of SP8 must make $37,500 contribution to profit. The price for the order should be as follows:
$000
Materials 12.0 Labour 8.0 Direct cost 20.0 Variable overhead (see note) 10.0 Variable cost 30.0 Contribution 37.5 Selling price 67.5
Note: Variable overheads are assumed to vary with direct materials cost. In the original budget variable overheads, are $50,000 and direct material costs are $60,000. Variable overheads are therefore 50/60 × material costs. For the simplified units, variable overheads will be $12,000 × 50/60 = $10,000.
The selling price per unit would need to be $67,500/5,000 units = $13.50.
(b) Advice
The price of SP8 is currently $15 ($300,000/20,000 units). The price for the simplified units of SP8 must be lower than this; otherwise the customer will not buy them.
A price of $13.50 is needed to achieve the budgeted profit, but the customer may be unwilling to pay this amount. A price of $12 will give a profit of 20% on full cost, using the budgeted absorption rates for overhead, but there will be some under-absorbed overheads.
Any price in excess of the minimum price of $30,000 ($6 per unit) will make profit higher than it will be if the simplified units are not sold to the customer.
However, the company must think of the longer term. Will the customer want to buy more units of the simplified product next year? If so, the company will want to charge a price at which it will make satisfactory profits.
The recommendation should therefore be to negotiate with the customer. If the agreed price is lower than $13.50, Snap Co might want to warn the customer than more units of the simplified SP8 might not be available in the future, except at a higher price.
24 Bridge Company
(a) Budgeted variable production costs Cost in
current year
Inflation
Cost next year Current material New material
$ % Direct material 30 20 36.0 31.25 Direct labour 10 5 10.5 10.50 Variable o’hd 10 5 10.5 10.50 50 57.0 52.25 Cost of rejected units (5%) 2.75
55.00

Paper P5: Advanced performance management
586 © Emile Woolf Publishing Limited
Using the cheaper substitute material will reduce the variable unit cost by $2, but fixed costs will increase by $30,000. Since annual sales at the current price will be 20,000 units, it will be more profitable to use the cheaper material.
The unit variable cost will be $55.
Annual fixed costs will be:
$
Costs in the current year ($10 × 20,000 units) 200,000 Add inflation (10%) 20,000 Inspection costs 30,000 Total fixed costs for the year 250,000
(b) Optimal selling price
Method 1
It is assumed that the only sales prices to be considered are those in the sales manager’s estimates of sales demand.
The variable cost will be $55 per unit. Price Contribution/unit Sales Total contribution
$ $ 000 units $000
80 25 25 625 84 29 23 667 88 33 21 693 90 35 20 700 92 37 19 703 96 41 17 697
100 45 15 675 Contribution will be maximised at a price of $92, and sales will be 19,00 units.
$
Total contribution 703,000 Fixed costs 250,000 Profit 453,000
Method 2
It is assumed that the sales manager has identified a straight-line demand curve, and any sales price on this curve may be selected.
Sales demand falls by 1,000 units for every $2 increase in the sales price.
Sales demand will be 0 when the sales price is $130 [$100 + (15 × $2)]
Demand curve:
P = 130 – 2Q, where Q is sales demand in 000s units
Total revenue TR = (130 – 2Q)Q = 130Q – 2Q2
Marginal revenue MR = 130 – 4Q
Marginal cost MC = variable cost per unit = 55.
Profit is maximised when MR = MC
130 – 4Q = 55
Q = 18.75
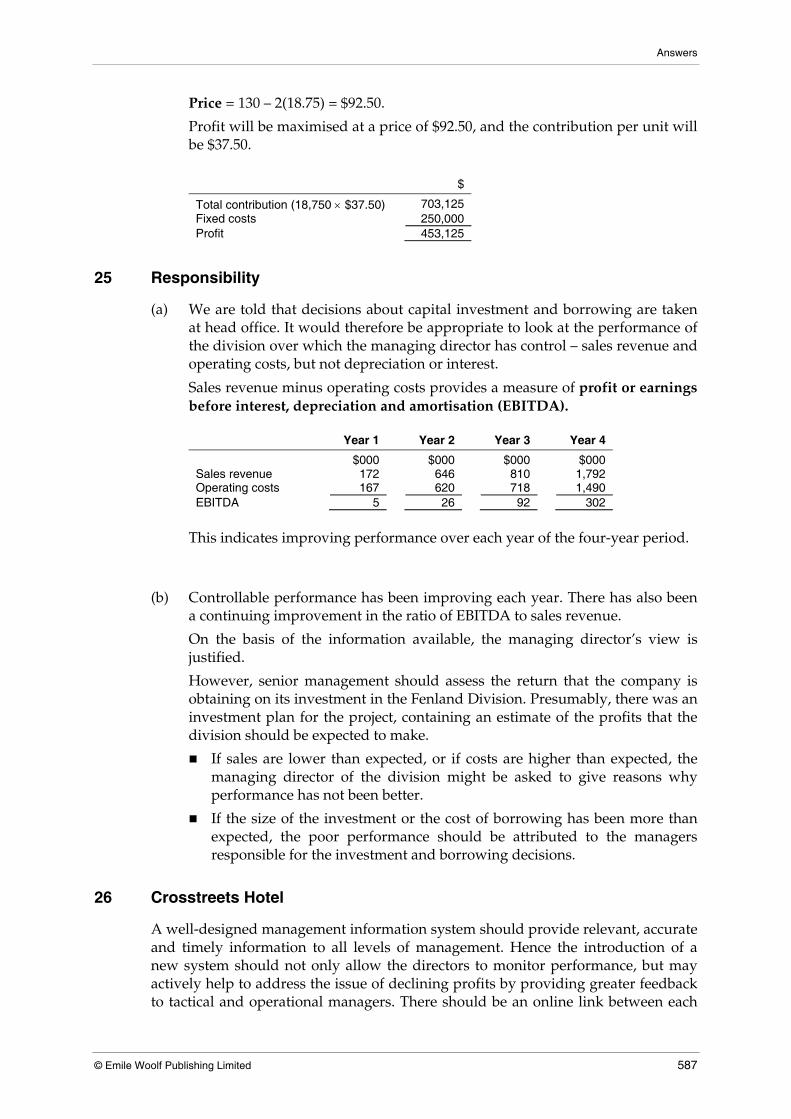
Answers
© Emile Woolf Publishing Limited 587
Price = 130 – 2(18.75) = $92.50.
Profit will be maximised at a price of $92.50, and the contribution per unit will be $37.50.
$
Total contribution (18,750 × $37.50) 703,125 Fixed costs 250,000 Profit 453,125
25 Responsibility
(a) We are told that decisions about capital investment and borrowing are taken at head office. It would therefore be appropriate to look at the performance of the division over which the managing director has control – sales revenue and operating costs, but not depreciation or interest.
Sales revenue minus operating costs provides a measure of profit or earnings before interest, depreciation and amortisation (EBITDA).
Year 1 Year 2 Year 3 Year 4
$000 $000 $000 $000 Sales revenue 172 646 810 1,792 Operating costs 167 620 718 1,490 EBITDA 5 26 92 302
This indicates improving performance over each year of the four-year period.
(b) Controllable performance has been improving each year. There has also been
a continuing improvement in the ratio of EBITDA to sales revenue.
On the basis of the information available, the managing director’s view is justified.
However, senior management should assess the return that the company is obtaining on its investment in the Fenland Division. Presumably, there was an investment plan for the project, containing an estimate of the profits that the division should be expected to make.
If sales are lower than expected, or if costs are higher than expected, the managing director of the division might be asked to give reasons why performance has not been better.
If the size of the investment or the cost of borrowing has been more than expected, the poor performance should be attributed to the managers responsible for the investment and borrowing decisions.
26 Crosstreets Hotel
A well-designed management information system should provide relevant, accurate and timely information to all levels of management. Hence the introduction of a new system should not only allow the directors to monitor performance, but may actively help to address the issue of declining profits by providing greater feedback to tactical and operational managers. There should be an online link between each

Paper P5: Advanced performance management
588 © Emile Woolf Publishing Limited
hotel and head office so that data and information can be transmitted quickly in both directions. (a) and (b) Periodic reports
The computerisation of hotel records and an online link to head office allow the head office to acquire and assimilate large volumes of data rapidly. This would permit monthly financial statements to be produced for each hotel in time for directors to review them and action their findings whilst the implications are still relevant.
The statements should comprise balance sheet, cash flow and income statement, and would enable directors to gain an overview of the effects of local management decisions and the effectiveness of corporate policy on a regional basis.
These periodic reports should include comparative data in addition to actual data. Figures could be included for budget/previous periods/industry data. Variances could be reported.
Demand reports
The new system should also be capable of producing a range of reports on demand, so that senior management can assess high-risk aspects of the business by obtaining information whenever they need it.
(i) Room occupancy report
This report gives details of the proportion or percentage of a hotel’s available rooms that were occupied. By using information from registration cards, it should be possible to split this figure between business and non-business users.
The incorporation of room charge-out rates into the same report would enable management to:
assess the accuracy of revenues from room-letting
identify whether variations in regional rates have a significant impact on occupancy rates and overall profitability
identify any trends in business/non-business usage and the opportunity for differential pricing and attracting more guests.
Room rates should also be compared to a centralised master file of approved rates and discounts to ensure hotel managers are not offering rooms at below cost in an attempt to attract business.
To ensure all income from rooms is recorded, the room occupancy report should compare rooms for which income has been recorded to a housekeeper’s report giving details of the rooms cleaned.
(ii) Late payments report
It is assumed that some regular business customers are given credit. A late payments report should highlight all receivables that are more than, say, 60 days overdue.
Bad debts could be a major contributor to declining profits, particularly if the hotels catering for business travellers are taking block corporate bookings.

Answers
© Emile Woolf Publishing Limited 589
As an additional control to ensure that all reported bookings are genuine, this report should also include a comparison of revenues with a direct room cost such as laundry bills.
(iii) Restaurant sales report
This report should compare total revenues from the restaurant to the room occupancy rate and also the number of restaurant table bookings, thereby allowing the directors to ascertain if unduly preferential arrangements are being allowed by some of their hotels.
Differentiation should also be made between billings to residents and non-residents, as this will enable attention to be focused on this separate revenue source. This is important if the restaurant is not being operated at capacity such that non-residents could be a useful source of income.
(iv) Bar sales report
Total bar sales should be compared for restaurant sales, but without the division between residents and non-residents (because reliable information about this division would be difficult to obtain in view of the large number of cash transactions).
(v) Restaurant and bar inventories report
Physical control over bar and restaurant inventories is difficult to maintain and yet losses could have a potentially significant effect on profits.
An official from head office should attend a physical count at each hotel, and this figure should then act as the benchmark for subsequent movements and be “enforced” by random spot checks.
The inventories report should compare the verified figure as adjusted for subsequent purchases and sales to occupancy rate and highlight any significant percentage variation from preceding months (indicating pilferage and misappropriation). The overall holding of inventory in each hotel should be compared to inventory turnover to ensure the former does not represent an excessive usage of working capital.
(vi) Cash availability report
Many of the bar and restaurant takings of each hotel will be in cash; as with inventories, cash is easily susceptible to misappropriation.
The head office directors will require a report that summarises the cash takings and receipts, and makes a comparison between hotels making allowances for differences in the number and type of resident (for example, business users may utilise corporate client cards rather than their own cash).
(vii) Wages report
Given that wages, often casual wages, represent a significant item of cash expenditure for hotels and one which can be directly related to revenue, a report should be produced detailing the number of wage-earning staff per week and their wages.
This could then be compared to revenue reports to identify any significant departures from the expected relationship. This may indicate general inefficiency capable of improvement or fraud.

Paper P5: Advanced performance management
590 © Emile Woolf Publishing Limited
Error/exception reports
A unique feature of computerised systems is their ability to search through large volumes of data and extract only those figures of significance to users.
These exception reports should be produced automatically to highlight matters such as:
hotel revenue falling below budget (for example, by more than 10%)
group cash reserves/funding requirements exceeding available limits
hotels selling room accommodation below the approved room rate.
27 Three services
(a) Workings
Revenue:
Service A: contract customers – 350,000 × 60% × $9 × 1.03 = $1,946,700
Service A: non-contract customers – 350,000 × 40% × $9 × 1.30 × 1.03 = $1,687,140
Service B: contract customers – 250,000 × 60% × $15 × 1.03 = $2,317,500
Service B: non-contract customers – 250,000 × 40% × $15 × 1.50 × 1.03 = $2,317,500
Service C: contract customers – 20,000 × 80% × $300 × 1.03 = $4,944,000
Service C: non-contract customers 20,000 × 20% × $300 × 1.20 × 1.03 = $1,483,200
Salaries: $45,000 × 85 employees × 1.05 = $4,016,250
Sundry operational costs: $4,000,000 × 1.05 = $4,200,000
Fuel
Services A and B – 400 km × 50 vehicles × 300 days × $0.40 = $2,400,000
Service C – 600 km × 18 vehicles × 300 days × $0.80 = $2,592,000
Budgeted income statement for the year to 31 December Year 2
Service A Service B Service C Total
Revenue: $ $ $ $ Contract customers 1,946,700 2,317,500 4,944,000 9,208,200 Non-contract customers
1,687,140 2,317,500 1,483,200 5,487,840
Total revenue 3,633,840 4,635,000 6,427,200 14,696,040 Costs: Salaries 4,016,250 Fuel: Services A and B 2,400,000 Service C 2,592,000 4,992,000 Sundry operational costs 4,200,000 Total costs 13,208,250 Net profit 1,487,790

Answers
© Emile Woolf Publishing Limited 591
(b) Vehicle utilisation
There is no information about weight carried, only about distance travelled.
All vehicles were used for 300 days in the year. Presumably, vehicles might be used for 365 days per year, indicating an overall utilisation ratio for all vehicles of 82.2%.
Other utilisation measure: a revenue measure might be used as an indication of the utilisation of vehicles.
Services A and B Service C
Revenue per vehicle ($8,268,840/50) ($6,427,200/18) $165,377 $357,067
Kilometres travelled each year might also be a measure of utilisation:
Service A and B vehicles travel on average (400 × 300) = 120,000 kilometres each year.
Service C vehicles travel on average (600 × 300) = 180,000 kilometres each year.
28 Private medical practice
Workings
Total number of patients per year = 5 doctors × 18 patients per day × 5 days per week × 46 weeks per year = 20,700.
Patients Total Adults Children 65 years and over
20,700 (45%) = 9,315 (25%) = 5,175 (30%) = 6,210 Treatment None: 20% 1,863.0 1,035.0 1,242 Minor: 70% 6,520.5 3,622.5 4,347 Major: 10% 931.5 517.5 621
Revenue:
Adults, no treatment: 1,863 × $50 = $93,150
Adults, minor treatment: 6,520.5 × $200 = $1,304,100
Adults, major treatment: 931.5 × $600 = $558,900
Children, no treatment: 1,035 × $30 = $31,050
Children, minor treatment: 3,622.5 × $120 = $434,700
Children, major treatment: 517.5 × $280 = $144,900
65 years and over, no treatment: 1,242 × $30 = $37,260
65 years and over, minor treatment: 4,347 × $120 = $521,640
65 years and over, major treatment: 621 × $280 = $173,880.

Paper P5: Advanced performance management
592 © Emile Woolf Publishing Limited
Budgeted income statement for the year to […]
Adults
Children
Aged 65 years and
over
Total
Revenue: $ $ $ $ No treatment 93,150 31,050 37,260 161,460 Minor treatment 1,304,100 434,700 521,640 2,260,440 Major treatment 558,900 144,900 173,880 877,680 Total revenue 1,956,150 610,650 732,780 3,299,580 Costs: Salaries Doctors (5 × $240,000) 1,200,000 Assistants (5 × $100,000) 500,000 Administrators (2 × $80,000) 160,000 1,860,000 Bonus 93,000 1,953,000 Materials costs 414,300 Other costs 733,600 Total costs 3,100,900 Net profit 198,680
29 Train times
Northern Region Southern Region Inter-city
services Suburban
services Inter-city
services Suburban
services
Target for completion on time 90% 95% 90% 95% Actual % on time 82.7% 73.8% 88.3% 91.9% % not on time, but less than 5 minutes late
7.3% 12.9% 5.6% 4.0%
% between 5 and 10 minutes late 6.0% 10.6% 2.2% 2.9% % cancelled 3.2% 1.2% 0.1% 0.5% 99.2% 98.5% 96.2% 99.3% Over 10 minutes late (balance) 0.8% 1.5% 3.8% 0.7% 100.0% 100.0% 100.0% 100.0%
Assessment of performance
Neither region has achieved its target for journeys completed on time, although Southern Region appears to be closer to achieving its targets. Most of the late-completed journeys were completed within ten minutes of the scheduled time. Northern Region has a fairly large proportion of cancelled trains – certainly much higher than Southern Region. However, Southern Region has a comparatively high proportion of inter-city journeys finishing over ten minutes late. The managers of the two regions should be asked to provide a report on these aspects of performance.

Answers
© Emile Woolf Publishing Limited 593
30 Non-financial performance measurements
Service quality
(1) The percentage of customers who take their account away in a period (the rate of ’churn’)
(2) The number of complaints in a period
(3) A measure of ‘satisfaction’ from responses by customers to a questionnaire about the bank’s services
(4) In some aspects of service, speed of response (for example, the average time to answer telephone calls from customers: these time measures can be obtained from the bank’s telephone systems).
Marketing effectiveness
(1) The number of new accounts or growth rate in new accounts in the period
(2) The growth in major business activities in the period (lending, foreign exchange dealing, and so on)
(3) Market share
Personnel
(1) The rate of absenteeism in the period
(2) The amount of staff training in the period (total training days, for example)
(3) The rate of staff turnover
(4) It might be possible to identify ways of measuring staff efficiency, but this can be difficult when much of the work is non-standard or non-routine.
31 Mission
Question 1: Meaning of corporate mission. Link to corporate strategy
A corporate mission embodies the overall purposes of an organisation. A corporate mission should answer fundamental questions such as:
What are the values of a company?
What is its culture?
Why does the company exist?
Who will be served by company and benefit from it?
What products or services will be provided?
The majority of mission statements are presented using general concepts rather than detailed specifications. In order to prepare an effective strategic plan, senior management should be conscious of the organisation’s mission.

Paper P5: Advanced performance management
594 © Emile Woolf Publishing Limited
One view is that the mission statement is very important and a strategic plan cannot be prepared without reference to it. An opposing view is that a mission statement is the end result of the strategic-planning process. Some critics argue that a mission statement has no practical value at all.
Question 2: The origin of a mission statement and what it covers
The mission statement should be written or approved by the company’s board of directors. It does not contain quantitative targets. It might cover the following areas:
(a) The kinds of products and services the company aims to provide
(b) The customers to be served
(c) The markets in which the company expects to operate
(d) An overview of the company’s philosophy or culture
(e) The company’s attitude towards social obligations (corporate social responsibility)
(f) The way in which the company wants to be seen by the public (its reputation).
Question 3: Benefits of a mission statement
A company might gain several benefits from a mission statement. It should help decision-makers to focus on fundamental issues in strategic planning, and ensure that strategic plans do not conflict with the basic purpose of the organisation.
The benefits of a mission statement may be summarised as follows:
Employees can use it to get an understanding of the company’s purpose and philosophy.
The company’s aspirations are expressed in terms of a long-range vision.
The purpose the company operates will be clearly stated. This should help management to develop co-ordinated plans that are consistent with this purpose.
A statement about the purpose of the company should help planners to allocate resources more effectively.
32 Customer profitability
Workings
Product Units Contribution per unit
Total contribution
Total sales revenue
$ $ $ A 100,000 1.20 120,000 360,000 B 150,000 0.50 75,000 375,000 C 120,000 1.20 144,000 480,000 D 180,000 0.90 162,000 432,000 E 80,000 2.00 160,000 480,000 661,000 2,127,000

Answers
© Emile Woolf Publishing Limited 595
Contribution per customer category Total contribution Category of customer C1 C2 C3 C4
$ $ $ $ $ Product A 120,000 12,000 24,000 24,000 60,000 Product B 75,000 30,000 0 22,500 22,500 Product C 144,000 14,400 28,800 14,400 86,400 Product D 162,000 48,600 16,200 32,400 64,800 Product E 160,000 32,000 0 32,000 96,000 Total 661,000 137,000 69,000 125,300 329,700
Rebates
Total sales C3 C4
$ $ $ Product A 360,000 20% 72,000 50% 180,000 Product B 375,000 30% 112,500 30% 112,500 Product C 480,000 10% 48,000 60% 288,000 Product D 432,000 20% 86,400 40% 172,800 Product E 480,000 20% 96,000 60% 288,000 Total 414,900 1,041,300 Rebate % 5% 10% Rebate in $ $20,745 $104,130
ABC apportionment rates
Number of deliveries
Km per delivery
Total kilometres
C1 40 100 4,000 C2 80 200 16,000 C3 50 300 15,000 C4 100 150 15,000 50,000
Apportionment rates
Delivery costs: $250,000/50,000 = $5 per kilometre
Order processing: $105,000/(30 + 70 + 50 + 60) = $500 per order
Promotion events: $30,000/12 = $2,500 per event.
Statement of customer profitability
C1 C2 C3 C4 Total
$ $ $ $ $ Contribution 137,000 69,000 125,300 329,700 661,000 Rebates 0 0 (20,745) (104,130) (124,875) 137,000 69,000 104,555 225,570 536,125 Activity costs Delivery (20,000) (80,000) (75,000) (75,000) (250,000) Order processing (15,000) (35,000) (25,000) (30,000) (105,000) Promotion events 0 0 (5,000) (25,000) (30,000) Customer profitability 102,000 (46,000) (445) 95,570 151,125 Other fixed costs (80,000) Company profit 71,125

Paper P5: Advanced performance management
596 © Emile Woolf Publishing Limited
33 RTC
(a) Workings: Year 4 Year 5 Hereland Thereland Total Hereland Thereland Total Gross profit ($000)
1,450 (60) 1,390 1,520 170 1,690
Gross profit/sales
33.7% (6.3)% 26.5% 33.8% 14.2% 29.6%
Net profit/ sales
20.5% (18.4)% 11.2% 20.0% (1.7)% 13.8%
Sales growth 4.7% 26.3% 8.6% Sales/non-current assets
1.65 3.96 1.84 1.73 2.50 1.85
ROCE (%) 18.9% 19.5% Gearing (%) 60.9% 36.1% EBITDA ($000)
1,080 1,305
Notes: 1 ROCE = profit before interest/capital + reserves + loan stock. 2 EBITDA = earnings before interest, depreciation and amortisation. Analysis
Total growth in sales revenue was 8.6% in Year 5. Sales growth was 4.7% in Hereland, but 26.3% - much stronger - in Thereland. There was an increase in both the gross profit margin and the net profit margin for RTC. The gross profit margin was up from 26.5% to 29.6%, and the net profit margin was up from 11.2% to 13.8%. There was little change in Hereland, and the improvement is due to the improvement in Thereland, where a gross loss was turned into a gross profit, and the net loss was reduced. Taking the financial performance of RTC as a whole, return on capital employed improved from 18.9% to 19.5%, and there was an increase in EBITDA from $1.08 million to $1.30 million. EBITDA is a useful approximation of cash flows from operating activities, and the growth in EBITDA would suggest that operational cash flows should be positive, in spite of the large increase in investment in non-current assets. The ratio of sales to non-current assets remained roughly the same in Year 5 as in Year 4 for RTC as a whole. However, whereas sales per $1 invested in non-current assets went up in Hereland, it fell in Thereland. Financial gearing fell in Year 5, partly because of the increase in equity invested, and partly due to the reduction on long-term debt. $200,000 of loan stock was redeemed during Year 5. (b) The following additional information would be useful:
1 Financial results for Years 1 to 3. This would make it possible to analyse the trends in performance in Homeland, and make a comparison of the

Answers
© Emile Woolf Publishing Limited 597
early years of operations in Homeland with the initial years of operating in Thereland.
2 It would also be useful to have the financial targets or budgets for Years 4 and 5, so that actual performance can be compared with planned performance.
3 Information about cash flows would also be useful, particularly for RTC as a whole. This would provide data for the analysis of cash management.
4 It would also be helpful to have some information about the market as a whole for scientific conferences in Homeland and Thereland, and in particular the estimated size of the total market and the relative size of major competitors. This would make it possible to carry out some analysis of market share and some competitor analysis.
(c) Tutorial note: Five suggestions are given here, but other ideas might be
equally acceptable. 1 It is difficult to compare the results in Hereland and Thereland because
operations in Hereland have been established for five years, and in Thereland they have been established for only three years.
2 The relative size of the total market in each country should also be considered, and the market share that RTC has in each country.
3 The number and size of competitors in each country will affect the relative performance of RTC in homeland and Thereland. Performance should be better in the country where competition is weaker, provided that the overall size of the market in each country is about the same.
4 Data about the average number of delegates at conferences in Hereland and Thereland would also be useful. Profit margins should be higher in the country where average numbers are higher.
5 The availability and cost of conference speakers in each country should be compared. This may affect the gross profit margins in each country.
34 Value for money
(a) A value for money exercise looks at economy, efficiency and effectiveness in the use of resources.
(1) Economy. A VFM study should look at major items of spending, and
assess whether the school is obtaining good value for the money it is spending. For example, is it getting teachers of a suitable quality for the amount it is paying in salaries? Is the school paying sensible prices for books and other equipment, or is it possibly paying prices that are too high? All major items of spending can be investigated in this way, to establish that resources are of a suitable quality and that the prices paid for them are not too high.
(2) Efficiency. A VFM study will also look at the efficiency of using resources. Key resources might be teachers’ time and some teaching equipment, such as laboratory equipment and a computer centre. Efficiency can be assessed by measuring the use of these resources, such

Paper P5: Advanced performance management
598 © Emile Woolf Publishing Limited
as average teaching time per teacher per week, average number of hours of computer time used per computer per day, and so on.
(3) Effectiveness. The VFM study must have a clear idea of the strategic aims of the school. These may be expressed in terms of the average grades expected in key examinations, or the percentage of school leavers going on to a university education. There may be other key objectives – such as providing an ‘all round’ education, or providing an education with an emphasis on particular skills, such as the teaching of science or art. The might also be a financial objective, such as operating the school without making a loss. The VFM study should then measure actual performance in these key areas, to establish whether the school is successful. If the school is failing to achieve its objectives, the study should try to establish the causes of the problem.
(b) The VFM study team might benefit from a benchmarking exercise –
comparing the performance of the school with the performance of similar schools in the region or country.
35 Decentralisation
(a) (i) Responsibility accounting is the structuring of performance reports for individual managers in a way that identifies the factors that are controllable by them and for which they are responsible. Depending on the factors under the control of the manager, responsibility accounting reports may be prepared for cost centres, revenue centres, profit centres or investment centres.
(ii) An investment centre is an operating division within an organisation whose manager has responsibility for both the profits of the division and the investments that it makes.
(iii) Return on investment (ROI) = The divisional profit divided by the capital employed within that division.
(iv) Residual income = Divisional income – a notional interest charge for the investment in capital investment in the division
Residual income = Divisional income – Divisional investment × cost of capital
Note: Both ROI and residual income can be used as:
ex ante targets (planning targets) – in order to motivate divisional managers and to guide their decision-making
ex post appraisal measures (actual performance measures) – to evaluate the divisional manager’s performance.
(b) Divisions M and W
(i) The performance of the two divisions will be evaluated using both ROI and residual income. There is no specific performance target for either division. To compare divisional performance, it is assumed that the division with the higher ROI or residual income has performed ‘better’.

Answers
© Emile Woolf Publishing Limited 599
Division M Division W
ROI 20/200 410/5,000 10% 8.2% $000 $000 Profit 20 410 Less: Interest on investment at 8% (16) (400) Residual income 4 10
Division M has a higher ROI than Division W. However, the reason for
this difference in performance may be that Division M has older non-current assets, and is reluctant to invest in new capital equipment. New investments would increase the division’s profit but reduce its ROI in the short-term (because capital investment will also be higher).
Division M has a higher residual income than Division W. Therefore, in a situation where both divisional managers are motivated to accept projects that meet the firm’s investment criteria (i.e. cost of capital). Division W may therefore have been more successful in finding investments that earn a return above the cost of capital. However, the difference in residual income is only $6,000, but Division W has invested $4.8 more than Division M.
Both divisions have a positive residual income, which means that they have succeeded in investing in projects with accounting returns higher than the company’s cost of capital.
(ii) (i) A change in the company’s cost of capital will only affect the residual income figure; it has no effect on the ROI. The revised residual income figures for cost of capital at 6% and 10% respectively are as follows:
Division M Division W
(1) Cost of capital 6% $000 $000 Profit 20 410 Less Interest on investment at 6% (12) (300) Residual income 8 110 (2) Cost of capital 10% Profit 20 410 Less Interest on investment at 10% (20) (500) Residual income 0 (90)
If the cost of capital for the company is only 6%, the residual income of both Division M and Division W is higher. The larger size of the investment in Division W results in a proportionally higher RI figure.
On the other hand, if the cost of capital is raised to 10%, Division M is the better performer with a residual income of 0 compared with a negative residual income (a residual loss) of $90,000 for Division W.

Paper P5: Advanced performance management
600 © Emile Woolf Publishing Limited
36 West Division
Sales price
Variable cost
Contribution per unit
Sales
Total contribution
$ per unit $ per unit $ per unit units $ Product A: Titan brand 2.50 1.50 1.00 160,000 160,000 Unbranded 1.50 1.30 0.20 450,000 90,000 Product B: Titan brand 3.20 2.00 1.20 120,000 144,000 Unbranded 2.00 1.80 0.20 600,000 120,000 Product C: Titan brand 5.00 3.00 2.00 50,000 100,000 614,000 $ Marketing costs 180,000 Other fixed costs 375,000
555,000 59,000 Notional interest: 10% × $400,000 (40,000) Residual income 19,000
(a) ROI = 59,000/400,000 = 14.75%.
(b) Residual income (see above) = $19,000.
37 Annuity method
(a) Annual depreciation = $600,000/3 years = $200,000.
Year 1 Year 2 Year 3
$ $ $ Average capital employed 500,000 300,000 100,000 Cash profit 300,000 300,000 300,000 Depreciation 200,000 200,000 200,000 Profit 100,000 100,000 100,000 Notional interest at 12% 60,000 36,000 12,000 Residual income 40,000 64,000 88,000
(b) Annual depreciation = $/Year 1 – 3 annuity factor at 12%
= $600,000/2.402 = $249,792. Year 1 Year 2 Year 3
$ $ $ Cash profit 300,000 300,000 300,000 Depreciation 249,792 249,792 249,792 Residual income 50,208 50,208 50,208
It could be argued that when an investment provides constant annual cash flows over its full life, it is appropriate that the change in annual performance should be a constant amount in each year.
The annuity method of depreciation applies a constant annual charge for depreciation and notional interest, and when the annual cash flows from an investment are constant in each year, the effect on the residual income is also a constant amount in each year.
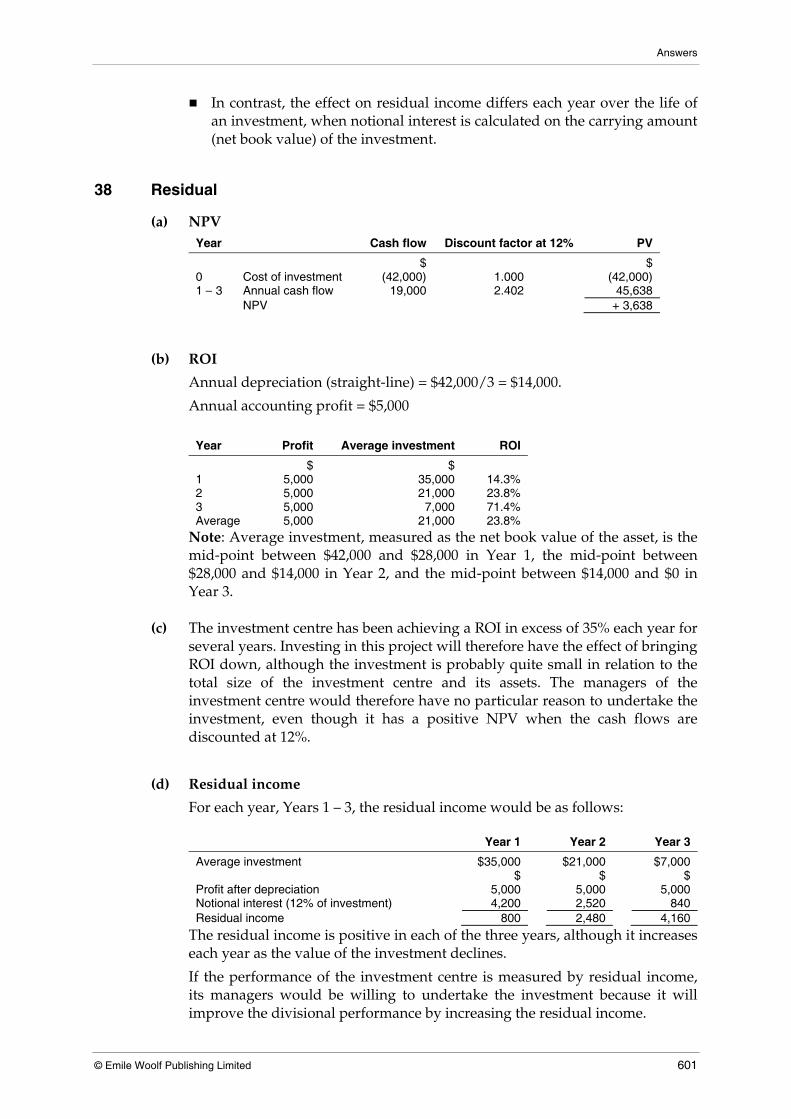
Answers
© Emile Woolf Publishing Limited 601
In contrast, the effect on residual income differs each year over the life of an investment, when notional interest is calculated on the carrying amount (net book value) of the investment.
38 Residual
(a) NPV Year Cash flow Discount factor at 12% PV
$ $ 0 Cost of investment (42,000) 1.000 (42,000) 1 – 3 Annual cash flow 19,000 2.402 45,638 NPV + 3,638
(b) ROI
Annual depreciation (straight-line) = $42,000/3 = $14,000.
Annual accounting profit = $5,000
Year Profit Average investment ROI
$ $ 1 5,000 35,000 14.3% 2 5,000 21,000 23.8% 3 5,000 7,000 71.4% Average 5,000 21,000 23.8%
Note: Average investment, measured as the net book value of the asset, is the mid-point between $42,000 and $28,000 in Year 1, the mid-point between $28,000 and $14,000 in Year 2, and the mid-point between $14,000 and $0 in Year 3.
(c) The investment centre has been achieving a ROI in excess of 35% each year for several years. Investing in this project will therefore have the effect of bringing ROI down, although the investment is probably quite small in relation to the total size of the investment centre and its assets. The managers of the investment centre would therefore have no particular reason to undertake the investment, even though it has a positive NPV when the cash flows are discounted at 12%.
(d) Residual income
For each year, Years 1 – 3, the residual income would be as follows:
Year 1 Year 2 Year 3
Average investment $35,000 $21,000 $7,000 $ $ $ Profit after depreciation 5,000 5,000 5,000 Notional interest (12% of investment) 4,200 2,520 840 Residual income 800 2,480 4,160
The residual income is positive in each of the three years, although it increases each year as the value of the investment declines.
If the performance of the investment centre is measured by residual income, its managers would be willing to undertake the investment because it will improve the divisional performance by increasing the residual income.

Paper P5: Advanced performance management
602 © Emile Woolf Publishing Limited
(e) Residual income and annuity depreciation
If the annuity method is used to calculate annual depreciation, the annual depreciation charge will be:
Cost of investment/12% annuity factor, Years 1 – 3 = $42,000/2.402 = $17,485.
The residual income reported each year for this investment would then be:
Each year
$ Profit before depreciation 19,000 Annuity depreciation 17,485 Residual income 1,515
(f) Connection with NPV
Since the annual profit before deprecation is the same in each year of the project, there is a direct mathematical connection between the residual income using annuity depreciation and the project NPV:
Residual income × Annuity factor (here, for Years 1 – 3 at 12%) = NPV
$1,515 × 2.402 = $3,639. (There is a rounding error of $1.)
39 Uncertain
(a) Most optimistic assumptions Year
Equipment
Benefits (+ 6%)
Costs (- 10%)
Net cash flow
Discount factor at 7%
Present value
$m $m $m $m $m 0 (7.20) (7.20) 1.000 (7.200) 1 6.36 2.70 3.66 0.935 3.422 2 8.44 3.60 4.88 0.873 4.260 3 5.30 2.70 2.60 0.816 2.122 + 2.604
Year
Net cash flow
Dep’n
Notional interest
Residual income
$m $m $m $m 1 3.66 (2.40) 7% × $7.2m (0.50) + 0.760 2 4.88 (2.40) 7% × $4.8m (0.34) + 2.140 3 2.60 (2.40) 7% × $2.4m (0.17) + 0.030
(b) Most pessimistic assumptions
Year
Equipment
Benefits (- 6%)
Costs (+ 10%)
Net cash flow
Discount factor at 11%
Present value
$m $m $m $m $m 0 (7.20) (7.20) 1.000 (7.200) 1 5.64 3.30 2.34 0.901 2.108 2 7.52 4.40 3.12 0.812 2.533 3 4.70 3.30 1.40 0.731 1.023 (1.536)

Answers
© Emile Woolf Publishing Limited 603
Year
Net cash flow
Dep’n
Notional interest
Residual income
$m $m $m $m 1 2.34 (2.40) 11% × $7.2m (0.79) (0.750) 2 3.12 (2.40) 11% × $4.8m (0.53) + 0.190 3 1.40 (2.40) 11% × $2.4m (0.26) (1.260)
(c) The decision whether or not to go ahead with the project will depend on management’s view of risk:
What is the probability of the most likely, most pessimistic and most optimistic outcome?
What is the appetite of management for risk?
40 Two divisions
(a) An optimal transfer price (or range of transfer prices) is a price for an internally-transferred item at which:
the selling division will want to sell units to the other profit centre, because this will add to its divisional profit
the buying division will want to buy units from the other profit centre, because this will add to its divisional profit
the internal transfer will be in the best interests of the entity as a whole, because it will help to maximise its total profit.
(b) When Division X has spare capacity, its only cost in making and selling extra units of Product B is the variable cost per unit of production, $48. Division Y can buy the product from an external supplier for $55.
It follows that a transfer that is higher than $48 but lower than $55, for additional units of production, will benefit both profit centres as well as the company as a whole. (It is in the best interests of the company to make the units in Division X at a cost of $48 than to buy them externally for $55.)
(c) When Division X is operating at full capacity and has unsatisfied external
demand for Product A, it has an opportunity cost if it makes Product B for transfer to Division Y. Product A earns a contribution of $16 per unit ($62 – $46). The minimum transfer price that it would require for Product B is:
$
Variable cost of production of Product B 48 Opportunity cost: lost contribution from sale of Product A 16 Minimum transfer price to satisfy Division X management 64
Division Y can buy the product from an external supplier for $55, and will not want to buy from Division X at a price of $64. The maximum price it will want to pay is $55.
The company as a whole will benefit if Division X makes and sells Product A.
It makes a contribution of $16 from each unit of Product A.

Paper P5: Advanced performance management
604 © Emile Woolf Publishing Limited
If Division X were to make and sell Product B, the company would benefit by only $7. This is the difference in the cost of making the product in Division X ($48) and the cost of buying it externally ($55).
The same quantity of limited resources (direct labour in Division X) is needed for each product, therefore the company benefits by $9 ($16 – $7) from making units of Product A instead of units of Product B.
On the basis of this information, the transfer price for Product X should be $64 as long as there is unsatisfied demand for Product A. At this price, there will be no transfers of Product B.
41 Training company
(a) If the Liverpool centre has spare capacity, it will be in the best interest of the company for the London centre to use Liverpool trainers, at a variable cost of £450 per day including travel and accommodation, instead of hiring external trainers at a cost of £1,200.
Since the Liverpool centre will have to pay £450 per trainer day, any transfer price per day/daily fee in excess of £450 would add to its profit.
Since the London centre can obtain external trainers for £1,200 per day, any transfer price below this amount would add to its profit.
An appropriate transfer price would therefore be a price anywhere above £450 per day and below £1,200 per day.
(b) If the Liverpool centre is operating at full capacity and is charging clients £750 per trainer day, there will be an opportunity cost of sending its trainers to work for the London centre. The opportunity cost is the contribution forgone by not using the trainers locally in Liverpool. Assuming that the variable cost of using trainers in Liverpool would be £200 per day, the opportunity cost is £550 (£750 – £200).
The minimum transfer price that the manager of the Liverpool centre would want is:
£
Variable cost of trainer day 200 Travel and accommodation 250 Opportunity cost: lost contribution 550 Minimum transfer price 1,000
The maximum price that the London centre would be willing to pay is £1,200, which is the cost of using an external trainer.
The company should encourage the use of Liverpool trainers by the London centre, because this will add to the total company profit.
The optimal transfer price is above £1,000 per day, so that the Liverpool centre will benefit from sending trainers to London, but below £1,200 so that the London centre will also benefit.
A transfer price of £1,000 per day might be agreed.

Answers
© Emile Woolf Publishing Limited 605
(c) If the Liverpool centre is operating at full capacity and is charging clients £1,100 per trainer day, the opportunity cost of sending its trainers to work for the London centre is £900 (£1,100 – £200).
The minimum transfer price that the manager of the Liverpool centre would want is:
£
Variable cost of trainer day 200 Travel and accommodation 250 Opportunity cost: lost contribution 900 Minimum transfer price 1,350
The maximum price that the London centre would be willing to pay is £1,200, which is the cost of using an external trainer.
It would be in the best interests of the company as a whole to use the Liverpool trainers to work for Liverpool clients, earning a contribution of £900 per day, rather than use them in London to save net costs of £750 per day (£1,200 – £200 – £250).
The transfer price should be set at £1,350 per trainer day. At this rate, the London centre will use external trainers, and all the Liverpool trainers will be used in Liverpool.
42 Shadow price
(a) The shadow price of the special chemical is the amount by which total contribution would be reduced (or increased) if one unit less (or more) of the chemical were available.
1 kilogram = 1,000 grams; therefore one kilogram of special chemical will produce 100 tablets (1,000/10 grams per tablet).
Shadow price of the chemical $
Sales value of 100 tablets (× $10) 1,000 Further processing costs in B (× $2) 200 800 Variable cost of making the chemical in A 500 Shadow price per kilogram of chemical 300
(b) The special chemical does not have an intermediate market.
The ideal transfer price for A is therefore any price above the variable cost of making the chemical, which is $500 per kilogram.
The ideal transfer price for B is anything below the net increase in contribution from processing a kilogram of the chemical. This is $1,000 – $200 = $800 per kilogram.
There is no single ideal price. Any price in the range above $500 and below $800 should make the managers of both profit centres want to produce up to the capacity in division A.
A transfer price in the middle of the range, say $650, might be agreed.

Paper P5: Advanced performance management
606 © Emile Woolf Publishing Limited
(c) The transfer price is needed to share the profit from selling the tablets between divisions A and B. It is an internally-negotiated price. Changing the price will not affect the total profit for the company as a whole, provided that division A produces the chemical up to its production capacity.
The transfer price itself should not be used as a basis for judging performance. Having agreed a transfer price, key financial measures of performance will be control over costs for division A and control over costs and the selling price for tablets for division B.
(The divisions are profit centres, and so the performance of the divisional managers should not be assessed on the basis of ROI or residual income.)
43 Bricks
(a) Profit statements
(i) Operating at 80% capacity Transfer price $200 Transfer price $180
Group X Group Y Total Group X Group Y Total Sales: External 180 240 420 180 240 420 Transfers 120 - 0 108 - 0 Total 300 240 420 288 240 420 Costs Transfers - (120) 0 - (108) 0 Variable (112) (36) (148) (112) (36) (148) Fixed (100) (40) (140) (100) (40) (140) Total (212) (196) (288) (212) (184) (288) Profit 88 44 132 76 56 132
(ii) Operating at 100% capacity
Transfer price $200 Transfer price $180
Group X Group Y Total
Group X Group Y Total
Sales: External 180 320 500 180 320 500 Transfers 200 - 0 180 - 0 Total 380 320 500 360 320 500 Costs Transfers - (200) 0 - (180) 0 Variable (140) (60) (200) (140) (60) (200) Fixed (100) (40) (140) (100) (40) (140) Total (240) (300) (340) (240) (280) (340) Profit 140 20 160 120 40 160
(b) The effect of a change in the transfer price from $200 to $180 will result in lower profit for Group X and higher profit for Group Y, but the total profit for the company as a whole will be unaffected.
A reduction in the transfer price to $180 (or possibly lower) is recommended, because this is the price at which Group Y can buy the materials externally. At

Answers
© Emile Woolf Publishing Limited 607
any price above $180, Group Y will want to buy externally, and this would not be in the interests of the company as a whole.
Significantly, at a transfer price of both $200 and $180, Division Y would suffer a fall in its divisional profit if it reduced the selling price of bricks to $0.32 and increased capacity by 40,000 bricks each month. A reduction in price would be in the best interests of the company as a whole, because total profit would rise from $132,000 per month to $160,000.
(c) Ignoring the transfer price, the effect on Division Y of reducing the sale price of bricks to $0.32 would be to increase external sales by $80,000 and variable costs in Division Y by $24,000 (400 tonnes × $60). Cash flows would therefore improve by $56,000 per month. To persuade Division Y to take the extra 400 tonnes, the transfer price should not exceed $140 ($56,000/400). This is below the current external market price, although there is strong price competition in the market.
The transfer price for Division X should not be less than the variable cost of production in Division X, which is $70 per tonne.
However, if the transfer price is reduced to $140 per tonne or less, Division X might try to sell more materials in the external market, by reducing the selling price.
It would appear that although the ideal transfer price might be $140 or below, this will not be easily negotiated between the group managers. An imposed settlement may be necessary. Intervention by head office might be needed to impose a transfer price, and require Division Y to reduce its sales price to $0.32.
44 International transfers
(a) The transfer price for Product P would be $9 less 40% = $5.40.
Division Y could buy from an external supplier at $5 per unit.
The manager of Division Y will want to maximise the profits of the division. The decision will therefore be to purchase Product P from the external supplier. This will be $0.40 per unit cheaper than buying from Division X.
This decision will be made regardless of the annual purchase quantity.
(b) The annual profit of the company as a whole will be maximised if the marginal revenue for the company from making the transfers exceeds the opportunity cost.
(i) Annual purchases: 50,000 units of Product P
Division X has spare production capacity for 50,000 units of Product P.
The marginal cost to Division X and to the company as a whole from making and transferring 50,000 units of Product P is therefore the marginal cost of producing them, $3.40 per unit.
A transfer price anywhere above $3.40 and below $5 would increase the annual profit of Division X and would make Division Y want to buy the units from Division X and not externally at $5.

Paper P5: Advanced performance management
608 © Emile Woolf Publishing Limited
(ii) Annual purchases: 120,000 units of Product P
Division X has spare production capacity for 50,000 units of Product P, but producing the additional 70,000 units means that production and sales of Product Q would have to be reduced by 70,000 units.
The opportunity cost for Division X and for the company as a whole of transferring 120,000 units to Division Y is therefore:
$
Variable cost of making 120,000 units × $3.40 408,000 Contribution lost: 70,000 units of Product Q × $0.50 35,000 443,000
The minimum transfer price should be excess of $443,000/120,000 units = $3.692 per unit.
The transfer price should therefore be negotiated in the range $3.70 to $5. Any transfer price between these two amounts would result in higher profits for the company, Division X and Division Y (on the reasonable assumption that Division Y will sell Product P at a price higher than the transfer price.)
(c) If Division Y buys 120,000 units of Product P externally at $5 per unit, the after-tax position of the company as a whole would be as follows:
$ $
Division X Contribution from selling 70,000 units of Product Q 35,000 Less tax at 50% (17,500) After-tax contribution, Division X 17,500 Division Y Cost of buying 120,000 units of P externally (at $5) (600,000) Less tax at 30% 180,000 Cost net of tax, Division Y (420,000) Cost to the company (402,500)
(Tutorial note: Revenue from selling the units of Product P in Country Y can be ignored because this is the same regardless of whether the units are transferred from Country X or bought externally.)
If Division Y buys 120,000 units of Product P from Division X at $5.40 per unit, the after-tax position of the company as a whole would be as follows:
$ $
Division X Transfer of 120,000 units of P at $5.40 648,000 Variable cost of 120,000 units of P at $3.40 408,000 Contribution from 120,000 units of Product P 240,000 Less tax at 50% (120,000) After-tax contribution, Division X 120,000 Division Y Cost of buying 120,000 units of P (at $5.40) (648,000) Less tax at 30% 194,400 Cost net of tax (453,600) Total cost to the company (333,600)

Answers
© Emile Woolf Publishing Limited 609
Conclusion
It is in the best interests of the company as a whole for Division Y to purchase the units of Product P from Division X. This will result in an annual profit after tax that is higher by $68,900 ($402,500 – $333,600).
45 Long and Short
(a) Group contribution (per unit and in total) RDZ BL
$ $ $ $ Selling price 45 54 Components used S (3 : 2) 18 12 M (2 : 4) 8 16 Processing costs 12 14 Cost 38 42 7 12 (× 200) (× 300) Group contribution 1,400 3,600
Total contribution = $1,400 + $3,600 = $5,000
(b) Divisional contribution
(i) Transfer price (variable cost + shadow price): supplying divisions A B
$ $ S: (6 + 0.5) 6.50 M: (4 + 2.75) 6.75 Less variable cost 6.00 4.00 Contribution per unit 0.50 2.75
(ii) Buying divisions RDZ BL
$ $ $ $ Selling price 45.0 54.0 Less Transfer price S: (3:2) 19.5 13.0 M: (2:4) 13.5 27.0 Processing cost 12.0 14.0 45.0 54.0 Contribution per unit 0.0 0.0
(c) All contribution arises in the supplying divisions. This will be unacceptable to
the buying divisions, and so will have an adverse affect on the promotion of these two products.
(d) Transfer price
Transfer price = price)clearing Marketor(
cost yOpportunitcost Variable=
+

Paper P5: Advanced performance management
610 © Emile Woolf Publishing Limited
S = $6.00 + (5% × $6.00) = $6.30
M = $7.50 – $0.50 = $7.00
Contribution of end-products in buying divisions RDZ BL
$ $ $ $ Selling price 45.0 54.0 Less Transfer price S: (3:2) 18.9 12.6 M: (2:4) 14.0 28.0 Processing cost 12.0 14.0 44.9 54.6 Contribution per unit 0.1 (0.6)
Therefore do not produce BL.
Strategy Produce RDZ: Maximum possible.
Constraint?
S 2,400 units/3 units of S per unit of RDZ = 800 units
M 3,200 units/2 units of M per unit of RDZ = 1,600 units
Therefore produce 800 units of RDZ and sell the remaining 1,600 units of M externally.
Total contribution for group $
800 units of RDZ × $7/unit (see part (a)) 5,600 1,600 units of M × $3/unit ($7 – $4) 4,800 Total group contribution 10,400
46 Balanced
(a) The four perspectives for performance targets and measuring performance in a balanced scorecard approach are:
(1) a customer perspective: identifying what customers value most
(2) an internal systems perspective: identifying the processes that must be performed with excellence to satisfy customers
(3) an innovation and learning perspective: what must the organisation do to innovate or add to its knowledge and experience
(4) a financial perspective.
(b) A professional football club
Here are some suggestions
Customer perspective
Customers value:

Answers
© Emile Woolf Publishing Limited 611
results, winning
an enjoyable time at football matches: being entertained (for example, with food and drink).
Targets for performance might be:
the size of attendances at matches
results (points, position in the league table, promotion)
revenue from catering: number of meals sold before matches.
Internal processes perspective
Processes that must be excellent to support customer expectations might include ticket selling, getting customers into the ground quickly on match days, catering efficiency, effective security and policing, and so on.
Targets for performance might be:
number of season ticket sales
targets for number of spectators per minute going through each turnstile
speed of producing meals in the catering area
number of incidents and police arrests on match days.
Innovation and learning perspective
Value can be created by developing well-trained footballers through coaching and training, and possibly selling them in the transfer market to make profits.
Targets for performance might be:
average fitness levels for players
average number of hours of training each week per player
revenue from transfers
Financial perspective Presumably, the football club will be expected to make profits for its owners. Targets for performance might be profits each year, and return on investment.
Subsidiary financial targets might be average wages per player, and revenue from sponsorship deals.
47 Pyramid
(a) The performance pyramid describes a view that all measures of performance for an organisation should be linked and consistent with each other. There is a hierarchy of suitable measures of performance, with performance measures at lower levels in the hierarchy (or pyramid) supporting performance measures at a higher level.
(1) At the bottom of the pyramid, there are operational performance measures, relating to external effectiveness and internal efficiency.
(2) Operational performance measures support higher-level measures that should relate to quality, delivery, production or service cycle time and waste.
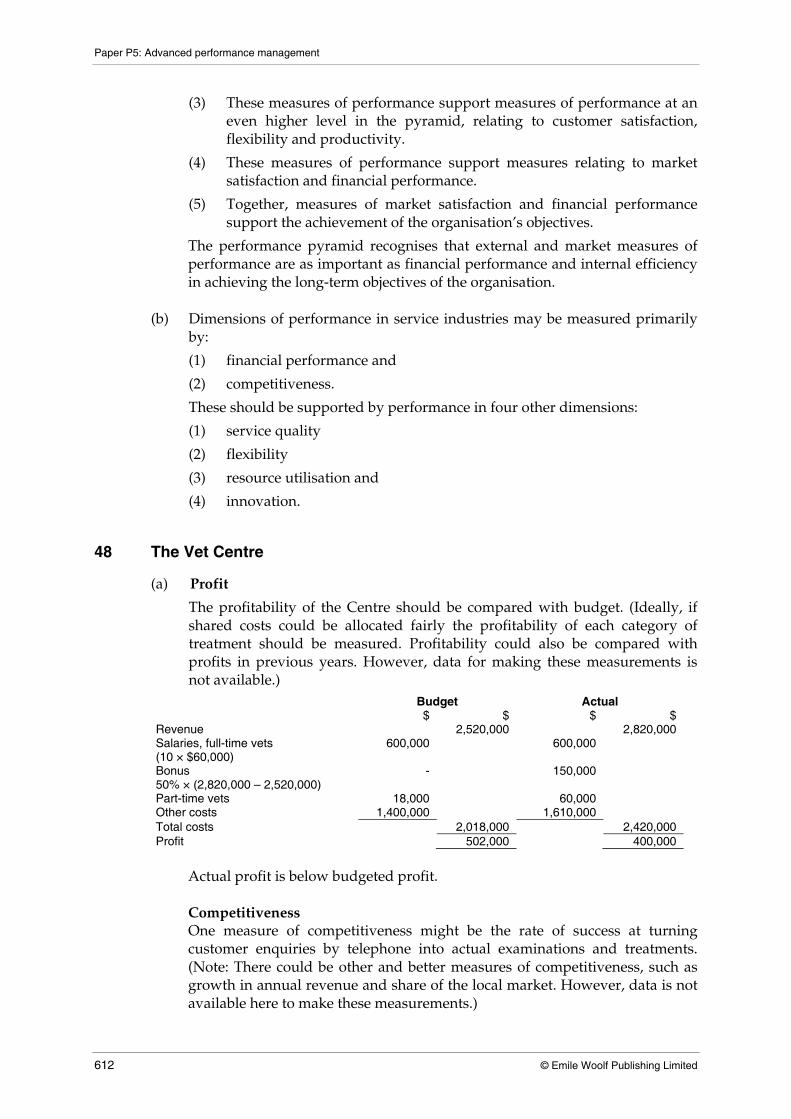
Paper P5: Advanced performance management
612 © Emile Woolf Publishing Limited
(3) These measures of performance support measures of performance at an even higher level in the pyramid, relating to customer satisfaction, flexibility and productivity.
(4) These measures of performance support measures relating to market satisfaction and financial performance.
(5) Together, measures of market satisfaction and financial performance support the achievement of the organisation’s objectives.
The performance pyramid recognises that external and market measures of performance are as important as financial performance and internal efficiency in achieving the long-term objectives of the organisation.
(b) Dimensions of performance in service industries may be measured primarily by:
(1) financial performance and
(2) competitiveness.
These should be supported by performance in four other dimensions:
(1) service quality
(2) flexibility
(3) resource utilisation and
(4) innovation.
48 The Vet Centre
(a) Profit
The profitability of the Centre should be compared with budget. (Ideally, if shared costs could be allocated fairly the profitability of each category of treatment should be measured. Profitability could also be compared with profits in previous years. However, data for making these measurements is not available.)
Budget Actual $ $ $ $ Revenue 2,520,000 2,820,000 Salaries, full-time vets (10 × $60,000)
600,000 600,000
Bonus 50% × (2,820,000 – 2,520,000)
- 150,000
Part-time vets 18,000 60,000 Other costs 1,400,000 1,610,000 Total costs 2,018,000 2,420,000 Profit 502,000 400,000
Actual profit is below budgeted profit.
Competitiveness One measure of competitiveness might be the rate of success at turning customer enquiries by telephone into actual examinations and treatments. (Note: There could be other and better measures of competitiveness, such as growth in annual revenue and share of the local market. However, data is not available here to make these measurements.)

Answers
© Emile Woolf Publishing Limited 613
In the table below, ‘success rate’ is the percentage of customer enquiries by telephone that result in an actual examination or treatment, for which a fee is charged.
Budget Actual New business Enquiries 5,000 9,000 Examinations/treatments 3,000 4,000 Success rate 60% 44% Repeat business Enquiries 18,000 15,000 Examinations/treatments 16,000 14,000 Success rate 89% 93%
The Centre has not been as successful as expected (budgeted) at converting enquiries from new customers into ‘sales’, but has been more successful than expected in converting calls from ‘repeat’ customers into sales.
(b) Quality
Quality of service can be measured by complaints. A useful measure might be the number of complaints as a percentage of examinations and treatments.
Budget Actual Complaints 380 540 Examinations/treatments 19,000 18,000 Percentage rate of complaints 2% 3%
It would be useful to analyse complaints according to the type of animals treated in each case, but the data is not available.
The rate of complaints is higher than expected, suggesting that the quality of service is not up to the expected standard.
Resource utilisation The key resource at the Centre is probably the time of the full-time vets. A useful measure of performance would therefore be average revenue per full-time vet. Ideally, income from the treatment of exotic animals should be excluded from revenue, but we do not know how much income was earned from treating exotic animals.
Budget Actual Revenue £2,520,000 $2,820,000 Number of full-time vets 10 10 Average revenue per vet $252,000 $282,000
Average revenue per vet was $30,000 (nearly 12%) above budget, although some of this increase must be due to the higher-than-budgeted quantity of treatments of exotic animals.
Flexibility A key aspect of flexibility is probably the ability of the Vet Centre to respond to requests to treat exotic animals. A suitable measure of performance might

Paper P5: Advanced performance management
614 © Emile Woolf Publishing Limited
therefore be the percentage of revenue that comes from the treatment of exotic animals. The budget might state the minimum required percentage.
Budget Actual Total number of treatments 19,000 18,000 Treatments of exotic animals 120 400 0.6% 2.2%
The Centre has possibly demonstrated its flexibility in its ability to treat more exotic animals than provided for in the budget. However, this still remains a low proportion of the total annual work done by the Centre.
Innovation There is no data for measuring innovation in a satisfactory way, although the amount spent on training (per vet) might be used as an indication of ‘new learning’ and so an ability to innovate and provide new methods of treatment.
Budget Actual Spending on training $75,000 $100,000 Full-time vets 10 10 Training costs per vet $7,500 $10,000
By spending more than budgeted on training, the Centre might demonstrate its ability to innovate and offer new treatments for animals.
(c) Standards
According to Fitzgerald and Moon, the three key factors are: (1) Ownership. Do the individuals responsible for achieving the
performance standards ‘own’ them and accept them. (Were the individuals involved in setting the standards, or were they imposed by senior management?)
(2) Achievability. Are these standards considered achievable?
(3) Equity. Are the standards equitable and ‘fair’ for every manager responsible for achieving performance targets?
Rewards for achieving targets
According to Fitzgerald and Moon, the three key factors are: (1) Clarity. Is the connection between operational performance standards
and the achievement of corporate goals clear and fully understood by all employees and managers?
(2) Motivation. Are the rewards for achieving targets (both financial rewards and non-financial rewards) sufficient to motivate the managers responsible for achieving the targets?
(3) Controllability. Are there any problems with the allocation of the costs of shared services, and charging managers with costs over which they have no proper control?

Answers
© Emile Woolf Publishing Limited 615
49 Total quality
(a) The key aspects of Total Quality Management are:
(1) continuous improvement in operations and systems, to improve quality
(2) a policy of trying to achieve zero defects in production (getting things right the first time)
(3) the use of statistical quality control to prevent defective items reaching customers
(4) employee involvement in efforts to improve quality, for example by using quality circles
(5) measures to improve production systems, such as minimising inventory levels, minimising the movement of materials, minimising setup times: all these take time and money but do not add any value.
(b) Quality-related costs can be grouped into four categories:
(1) Prevention costs: these are costs incurred in preventing quality problems. Important elements of prevention costs are costs of ensuring good product design and costs of training employees.
(2) Appraisal costs: these are the costs of testing for quality, such as inspection costs and quality control costs.
(3) Internal failure costs: these are the costs of faults and errors in processing, such as costs of waste, scrap and re-working rejected items.
(4) External failure costs: these are the costs of quality problems after the product (or service) has been delivered to the customer such as the cost of handling customer complaints, and the loss of future business/sales.
In the traditional approach, the aim should be to minimise the total of quality-related costs. At this cost-minimising level of quality, some errors will occur. The TQM approach is that all errors should be avoided and sub-standard work is unacceptable. External failure costs are under-estimated, and it is worth spending money on prevention and appraisal costs to avoid internal and external failure costs, which will be higher.
(c) Key aspects of JIT management are:
(1) Hold no inventory. This requires just-in-time purchasing (to avoid raw materials inventory) and just-in-time production (to avoid finished goods inventory). Holding inventory is wasteful, and does not add value.
(2) Just-in-time purchasing calls for close collaboration with key suppliers.
(3) Just-in-time production involves trying to produce items exactly in time to meet customer needs for delivery: this calls for fast production times and avoiding breakdowns and any hold-ups or bottleneck in production.
(4) Production systems need to be flexible, to react to changes in demand from customers.
(5) Avoid over-production (which results in finished goods inventory).
(6) Eliminate inefficiency and poor quality in production – eliminate waste, minimise the movement of materials (which adds no value), minimise waiting times, improve the layout of the factory floor (to minimise

Paper P5: Advanced performance management
616 © Emile Woolf Publishing Limited
movement of materials), reduce setup times (which do not add value) and improve visibility in the work place (by using cards or other signalling systems).
(d) Activity based management uses activity based costing to analyse the cost of activities within an organisation. It focuses on the cost of activities and the causes of these costs occuring (cost drivers). The aim of ABM should be to improve the value obtained from the activities, eliminate activities that do not add value or reduce the costs of activities.
50 Poole Company
(a) Projected data
(i) Total production units Before TQM After TQM
Sales 5,000 5,000 Returns: (5%/2.5% of sales) 263 128 5,263 5,128 Final inspection (12.5%/7.5% of production) 750 416 Total production units 6,000 5,541
(ii) Purchases of material X
Before TQM After TQM
Material usage (6,000 or 5,541 × 8 m2/unit) 48,000 44,328 Processing losses: (4%/2.5% of input) 2,000 1,137 50,000 45,465 Storage losses: (5%/3% of receipts) 2,632 1,406 52,632 46,871
(iii) Gross machine hours
Before TQM After TQM
Machine usage (6,000 × 0.6 hrs/unit)
3,600 (5,541 × 0.5hrs/unit) 2,771
Work on 3rd quality units (80% × 250 x 0.2)
40 (80% × 125 × 0.2) 20
3,640 2,791 Idle time (20% of gross machine hours)
910 (12.5% of gross machine hours) 399
4,550 3,190
(b) Income statements
Before TQM $ $ $
Sales: 1st quality (5,000 × 100) 500,000 2nd quality (750 × 70) 52,500 3rd quality (200 × 50) 10,000 Scrap (50 × 5) 250 562,750 Costs: Fixed Prevention 20,000 Sundry 60,000 Inspection 25,000 105,000
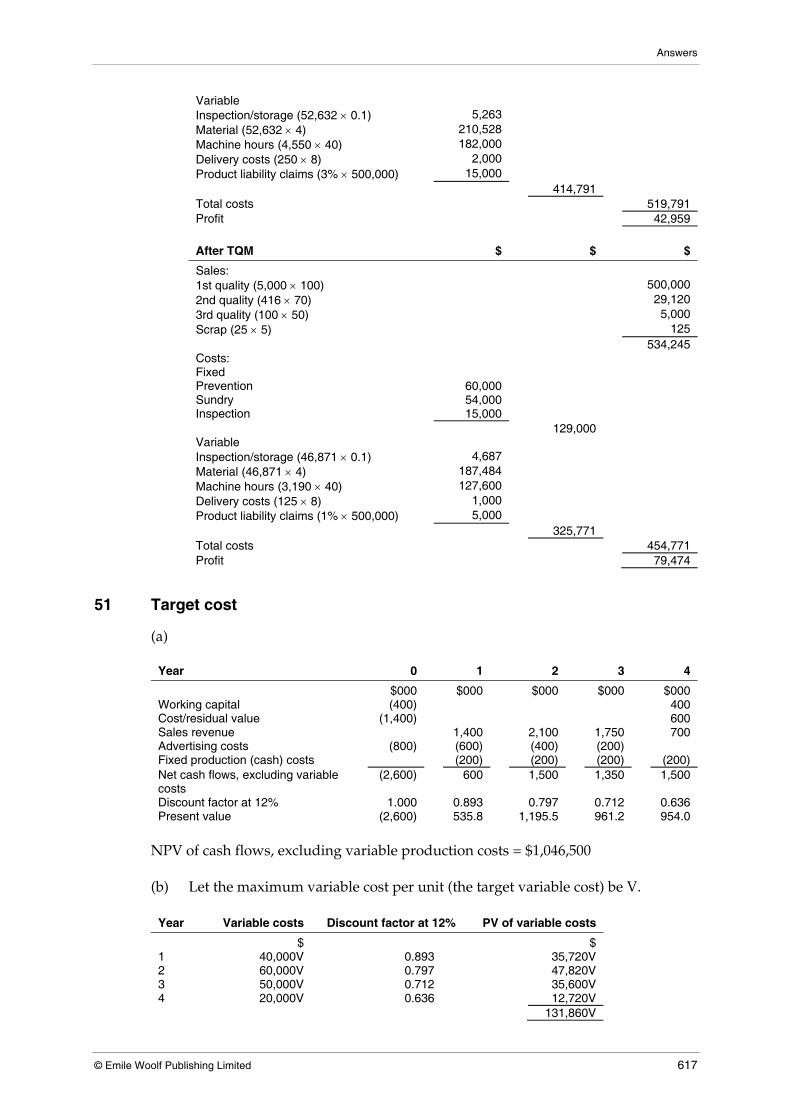
Answers
© Emile Woolf Publishing Limited 617
Variable Inspection/storage (52,632 × 0.1) 5,263 Material (52,632 × 4) 210,528 Machine hours (4,550 × 40) 182,000 Delivery costs (250 × 8) 2,000 Product liability claims (3% × 500,000) 15,000 414,791 Total costs 519,791 Profit 42,959 After TQM $ $ $
Sales: 1st quality (5,000 × 100) 500,000 2nd quality (416 × 70) 29,120 3rd quality (100 × 50) 5,000 Scrap (25 × 5) 125 534,245 Costs: Fixed Prevention 60,000 Sundry 54,000 Inspection 15,000 129,000 Variable Inspection/storage (46,871 × 0.1) 4,687 Material (46,871 × 4) 187,484 Machine hours (3,190 × 40) 127,600 Delivery costs (125 × 8) 1,000 Product liability claims (1% × 500,000) 5,000 325,771 Total costs 454,771 Profit 79,474
51 Target cost
(a)
Year 0 1 2 3 4
$000 $000 $000 $000 $000 Working capital (400) 400 Cost/residual value (1,400) 600 Sales revenue 1,400 2,100 1,750 700 Advertising costs (800) (600) (400) (200) Fixed production (cash) costs (200) (200) (200) (200) Net cash flows, excluding variable costs
(2,600) 600 1,500 1,350 1,500
Discount factor at 12% 1.000 0.893 0.797 0.712 0.636 Present value (2,600) 535.8 1,195.5 961.2 954.0
NPV of cash flows, excluding variable production costs = $1,046,500 (b) Let the maximum variable cost per unit (the target variable cost) be V.
Year Variable costs Discount factor at 12% PV of variable costs
$ $ 1 40,000V 0.893 35,720V 2 60,000V 0.797 47,820V 3 50,000V 0.712 35,600V 4 20,000V 0.636 12,720V 131,860V

Paper P5: Advanced performance management
618 © Emile Woolf Publishing Limited
The variable cost per unit that will give the project a DCF return of 12% = $1,046,500/131,860 = $7.94. The DCF return will be less than 12% if the variable cost exceeds $7.94. The current estimate of the variable cost per unit is $10. The cost gap is therefore $2.06 ($100– $7.94).
52 Cost and quality
(1) Total Quality Management
TQM seeks to reduce quality costs, where quality costs are categorised as:
Prevention costs
Appraisal costs (inspection costs, etcetera)
Internal failure costs (costs of scrap, waste, re-working and so on)
External failure costs (cost of lost customer goodwill, lost sales, returned goods from customers, warranty costs)
The aim should be to improve quality and reduce total quality costs.
TQM also seeks continuous improvement: improvement can be achieved by reducing costs or improving quality.
(2) Activity based costing
A system of ABC might identify activities related to achieving quality, such as quality planning and control, and a cost driver for those activities. ABC could then be used to identify the costs related to the quality activity.
(3) Balanced scorecard
In a balanced scorecard, cost targets could be an element for the financial perspective. Quality targets could be an element in the balanced scorecard for the internal perspective or the customer perspective.
(4) Just in Time management
JIT seeks reductions in costs through improvements in production performance. The aim is to eliminate breakdowns and bottlenecks, so that items can be manufactured as quickly as possible.
(5) Value analysis
Value analysis looks at activities and costs in the value chain, and attempts to identify ways of adding more value. Value is added by providing extra quality (where the value of the extra quality is less than any additional cost) or by providing the same quality at less cost.
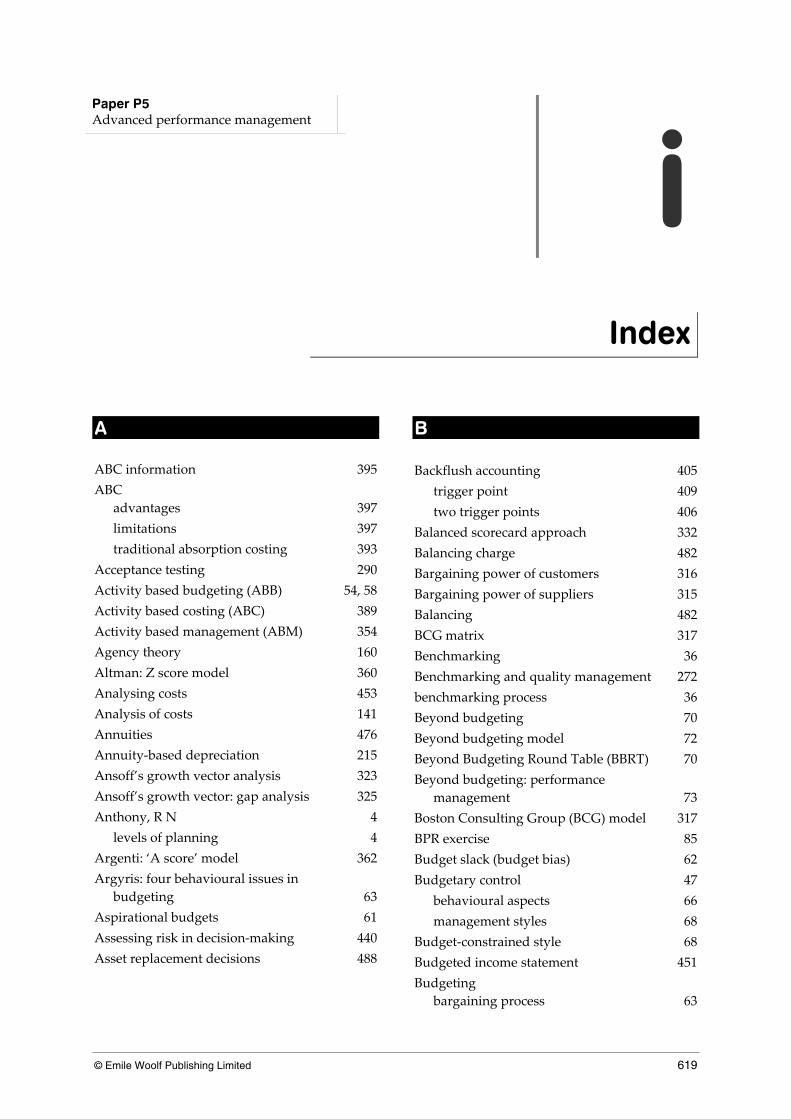
© Emile Woolf Publishing Limited 619
Paper P5 Advanced performance management
i
Index
A ABC information 395 ABC advantages 397 limitations 397 traditional absorption costing 393 Acceptance testing 290 Activity based budgeting (ABB) 54, 58 Activity based costing (ABC) 389 Activity based management (ABM) 354 Agency theory 160 Altman: Z score model 360 Analysing costs 453 Analysis of costs 141 Annuities 476 Annuity‐based depreciation 215 Ansoff’s growth vector analysis 323 Ansoff’s growth vector: gap analysis 325 Anthony, R N 4 levels of planning 4 Argenti: ‘A score’ model 362 Argyris: four behavioural issues in budgeting 63 Aspirational budgets 61 Assessing risk in decision‐making 440 Asset replacement decisions 488
B
Backflush accounting 405 trigger point 409 two trigger points 406 Balanced scorecard approach 332 Balancing charge 482 Bargaining power of customers 316 Bargaining power of suppliers 315 Balancing 482 BCG matrix 317 Benchmarking 36 Benchmarking and quality management 272 benchmarking process 36 Beyond budgeting 70 Beyond budgeting model 72 Beyond Budgeting Round Table (BBRT) 70 Beyond budgeting: performance management 73 Boston Consulting Group (BCG) model 317 BPR exercise 85 Budget slack (budget bias) 62 Budgetary control 47 behavioural aspects 66 management styles 68 Budget‐constrained style 68 Budgeted income statement 451 Budgeting bargaining process 63

Paper P5: Advanced performance management
620 © Emile Woolf Publishing Limited
behavioural aspects 60 planning and co‐ordination 46 uncertainly 462 Burns and Scapens 376 Burritt et al (2001) 379 Business Process Re‐engineering (BPR) 83
C
Capability Maturity Model (CMM) 292 Capacity utilisation 182, 183 Capital investment 314 Cash cows 318 Change agents 376 Changes in strategic plans 5 Chris Argyris (1953) 63 Classification of costs: controllability 142 Closed systems 128 Compatibility of management accounting and management accounting information 125 Competitive benchmarking 38, 272 Competitive rivalry 313 Competitive strength: five forces 312 Contingency theory: management accounting 136 Contingent variables 137 Control system theory 128, 131 Controllability 144, 156 Controllability: long‐term and short‐term 147 Controllable profit and traceable profit 201 Core activities 396 Corporate aspirations 62 Corporate failure prediction 358 Corporate vision 164 Cost centres 143 Cost control 396 Cost drivers 389, 396 Cost leadership 9, 496 Cost leadership strategy 510 Cost reduction 396 Cost‐based pricing methods 499 Cost‐based transfer prices 231 Cost‐cutting 61
Critical success factors (CSFs) 166 Crosby 276 Customer benchmarking 41 CVP analysis and decision‐making 426
D
Data tables 155 one‐way 155 two‐way 155 David Otley 69 DCF analysis: evaluation 491 DCF and inflation 484 DCF and taxation 480 DCF: basic revision points 474 Decentralisation of authority 200 Decision packages 56 Decision‐making 432 Decision‐making: quantitative and qualitative factors 417 Deming, W Edwards 274 Depreciation 213 Differentiation 9 Dimensions of performance 341 Direct labour budget 450 Direct materials usage budget 450 Discontinuance decisions (shutdown decisions) 419 Discount tables 475 Diversification strategy 9, 324 Diversionary activities 396 Divisional autonomy 230 Divisional managers 229 Divisional performance 213 Divisional performance evaluation 200 DMADV 180 Dogs 318 Drivers of cost 396 Dual pricing 244
E
Earnings per share growth 170

Index
© Emile Woolf Publishing Limited 621
EBITDA 170 Economic and market trends 113 Economic Value Added (EVA) 218 Economies of scale 314 Economist’s demand curve 507 Economy 190 Effectiveness 190 Efficiency 190 EMA techniques 381 Empowerment of employees (BPR) 85 Endogenous variables 143 Engineering‐based targets 173 Enterprise resource planning systems 132 Environmental activity based accounting 381 Environmental management accounting 378 Ethical issues 28 Existing competitors 313 Exogenous variables 143, 432 Expectancy theory of motivation 65 Expectational budgets 61 Expected future profits 171 Expected values 105, 436 Advantages 107, 438 Disadvantages 107, 438 External intermediate market 237
F
Feedback control system 129 Feed‐forward 131 Financial measures of performance 172 Financial performance long‐run 172 private sector 169 short‐run 172 Financial ratio analysis 358 Fiscal policy 114 Fitzgerald and Moon 339 Five Forces model 312 Fixed budget 48 Flexible budgets 48, 49, 463 Forecasting techniques 459 Formal strategic planning 5 Formula for the learning curve 468
Full cost plus pricing 499 Functional benchmarking 42 Functional budgets 448
G
Gaming 194 Gap analysis 8 Global competition 19 Global organisations 20 Goal congruence 229 Going rate pricing 511 Government regualtion 115 Graph of the learning curve 468 Growth vector 326
H
H score model 361 Hammer and Champy 83 Hard accountability 168 Heterogeneity 339 High low method 453 High‐level corporate objectives 165 Historical profits 171 Historical‐based targets 173 Hopwood and Otley 69 Human resource planning 298 Human resources and Human Resource Development (HRD) 296 Human resources management 296
I
Ideal transfer price 231 Imperfect competition 508 Imputed interest 209 Incremental budgeting 54 Incremental decision packages 56 Individual aspirations 62 Inflation and long‐term projects 484 Inflation in DCF analysis 484

Paper P5: Advanced performance management
622 © Emile Woolf Publishing Limited
Information overload 157 Information external sources 150 internal sources 149 Innovation strategy 324 Input‐output analysis 381 Institutional theory 140 Intangibility 339 Integration testing 289 Interest costs and taxation 480 Internal benchmarking 37, 272 Investment centres 143 ISO9000 279 IT systems and competitive advantage 24 IT systems and management accounting 23 IT systems for providers of services 24
J
Joint venture 330 Juran 276
K
Kaplan: ‘relevance lost’ 97 Key financial performance measures 371 Key performance indicators (KPIs) 166
L
League tables 38 Learning curve 466 Learning curve model 466 Learning curve theory 466 Levels of management 16 Linear regression analysis 455 correlation 457 forecasting 458 Liquidity and gearing 171 Loss leaders 510
M
Macro‐environment 108 Make or buy decisions 422 Management accounting 14 systems 96 theories 136 trends 100 Management levels 120 Management reports 153, 155 Margin of safety 426 Marginal cost plus pricing 502 marginal revenue 514 Market development strategy 9, 324 Market penetration prices 510 Market penetration strategy 9, 323 Market position 496 Market segmentation 497 Market skimming prices 509 Market‐based approaches to pricing 507 Market‐based transfer prices 231 Mark‐up pricing 502 Master budget 448 Materiality 156 Maximax 104 Maximax decision rule 434 Maximax: regret decision rules regret decision rules 434 Maximin 104 Maximin decision rule 435 Maximin: regret decision rules 434 Measure fixation 193 Measurements of quality 185 Mendelow’s matrix 327 Methods of benchmarking 37 Minimax 104 Minimax regret decision rule 434, 435 Minimum pricing 505 Misinterpretation 194 Misrepresentation 193 Mission statement 163 Monetary policy 114 Monte Carlo 445 Monte Carlo method 446 MR = MC 514

Index
© Emile Woolf Publishing Limited 623
Multinational companies (MNCs) 20 Myopia 193
N
Negotiated targets 173 Negotiated transfer prices 244 Net present value (NPV) method of investment appraisal 474 New entrants 314 New institutional theory 126 Niche marketing 497 Non‐accounting style 69 Non‐financial information for measuring performance 147 Non‐financial performance indicators (NFPIs) 182 Non‐relevant costs 412 Non‐value added activities 356 Notional costs (or imputed costs) 413 Notional interest 209 NPV calculations 478
O
Open systems 128 Operational ABM 355 Operational information 122 Operational management 17 Operational NFPIs 183 Operational performance 167 Operational planning 4 Opportunity cost pricing 505 OPT 400 Optimised production technology (OPT) 399 Organisational structure divisional 78 Ossification 194 Overhead costs 389
P
Pay‐off matrix 437
Penetration pricing 510 Perfect competition 507 Performance appraisal 302 Performance hierarchy 160 Performance management 301 Performance management systems 11 Performance measurement 14 not‐for‐profit organisations 188 service industries 339 Performance prism 348 Performance pyramid 336 Performance rewards 195 Performance through quality 186 Perishability 339 PESTEL analysis 108 Planning gap. 8 Porter: successful competitive strategy 9 Pricing 499 Predicting corporate failure 358 Predicting corporate failure: qualitative measures 361 Preparing budgets 46 Price discrimination (differential pricing) 510 Pricing decisions 499, 507 Pricing strategies 496 Primary performance objective 169 Principles of BPR 84 Probabilities and expected values 50, 463 Process benchmarking 41, 272 Process design 178 Process improvement 178 Processing methods 153 Product benchmarking (reverse engineering) 42 Product costing 395 Product development strategy 9, 324 Product differentiation 497 Product differentiation strategy 509 Product life cycle costing 369 Product life cycle 508 decline phase 368 growth phase 368 introduction phase 367 market penetration strategy 368 market skimming strategy 368

Paper P5: Advanced performance management
624 © Emile Woolf Publishing Limited
maturity phase 368 strategic significance of the product life cycle 368 pricing 508 Production budget 450 Profit centres 143 Profit‐conscious style 68 Profit‐maximising model 507 Public sector portfolio matrix 383 Purchases budget 451 Pyramid: interpretation 337
Q
Qualitative performance 187 Quality 268 Quality assurance 271 Quality chains 278 Quality control 270 Quality failure 269 Quality features of software 283 Quality in software 25 Quality management certification: ISO9000 282 Quality management systems and certification 279 Quality standards 279 Quality triangle 284 Question marks 318
R
Recording and processing methods 153 Recording data 153 Recruitment and selection 301 Reducing balance method 482 Relevance lost 96 Relevant cost of materials 413 Relevant costs 412 Relevant costs of labour 416 Relevant revenue 412 Residual income (RI) 209 Resource utilisation 183 Responsibility accounting 141, 143
Return on capital employed (ROCE) 170 Return on Investment (ROI) 203 Return on investment (ROI) pricing 503 Reward management 306 Reward review 302 Reward systems 193 Rewards as incentives 308 Risk 102, 432 Risk assessment 328 Risk neutral decision maker 433 Risk preference 102, 433 Risk profiling 328 Risk‐adverse decision maker 433 Risk‐seeking decision maker 433 ROI incentive schemes 206 investment decisions 204 measuring 203 Rolling budgets 48 Rolling budgets (continuous budgets) 52
S
Sales budget 450 Sensitivity analysis 442, 487 Setting financial targets 173 Short‐term decisions 419 Simulation 445 Simultaneity 339 Six Sigma 176 Six Sigma roles 180 Skimming prices 509 Soft accountability 168 Software Quality Assurance (SQA) 285 Sources of information 149 Spreadsheets 51 Spreadsheets and ‘what if’ analysis 464 Staff appraisal 302 Stakeholder contribution 352 Stakeholder groups 26 Stakeholder satisfaction 350 Standard deviation of the expected return 440 Stars 317 Statistical process control (SPC) 271

Index
© Emile Woolf Publishing Limited 625
Straight‐line method 481 Strategic ABM 355 Strategic alliance 329 Strategic benchmarking 42 Strategic management 16 Strategic management accounting 2 Strategic NFPIs 182 Strategic objectives 165 Strategic planning 4 Strategic planning and control 4 Strategic planning process 6 Sub‐optimisation 61, 193 Substitute products 316 Sunk costs 413 Supply chains 329 Support activities 396 SWOT analysis 32; strengths and weaknesses 32 threats and opportunities 34 System testing 289
OT
Tactical information 122 Tactical management 17 Tactical planning 4 Target pricing 511 Tax‐allowable depreciation (capital allowances) 481 Taxation cash flows in investment appraisal 480 The planning gap 166 The value chain 89 Theory of Constraints 399 throughput accounting 403 Throughput 401 Throughput accounting 399, 401 inventory 402 ratio 403 Time series 459
Timing of cash flows for taxation 480 Total Quality Management (TQM) 274 Traditional budgeting: weaknesses 70 Traditional cost accounting 356 Transfer pricing 228, 240, 242 Trend 156 Trends and seasonal variations 459 Tunnel vision 193 Two‐part transfer prices 244
U
Uncertainty 102, 432 Uncertainty in budgeting 48, 462
V
V life cycle model 287 Value chain analysis 88 Value for money (VFM) 190 Value management 197 Value system 93 Value‐added activities 356
W
What if analysis 51 Worst, most likely and best possible outcomes 434
Z
Z score model 359 ZBB and performance monitoring 58 ZBB system: framework 55 Zero based budgeting 54 Zero based budgeting (ZBB) 54

Paper P5: Advanced performance management
626 © Emile Woolf Publishing Limited

For Distance Learning Programmes
please visit our website at:
www.ewipublishing.com
ACCA
PublishingPublishing
P5 Study Text - Advanced Performance ManagementA well-written and focused text, which will prepare you for the examination and which does notcontain unnecessary information.
• Comprehensive but concise coverage of the examination syllabus
• A focus on key topic areas identified by specialist tutors
• Simple English with clear and attractive layout
• A large bank of practice questions which test knowledge and application for each chapter
• A full index
• The text is written by Emile Woolf International’s Publishing division (EWIP). The only publishing company
focused purely on the ACCA examinations.
• EWIP’s highly experienced tutors / writers produce study materials for the professional examinations of the
ACCA.
• EWIP’s books are reliable and up-to-date with a user-friendly style and focused on what students need to know
to pass the ACCA examinations.
• EWIP’s association with the world renowned Emile Woolf Colleges means it has incorporated student feedback
from around the world including China, Russia and the UK.