advanced placement human...
TRANSCRIPT

Session 1

By Geri FlanaryTo accompany
AP Human Geography: A Study Guide
3rd editionBy Ethel Wood


WHAT IS DEMOGRAPHY?
It is the scientific or statistical study of
population.
It comes from the Greek word demos
(populace or people) and graph (to describe).

POPULATION GEOGRAPHY
• Special emphasis on spatial organization
• Location of
• Places
• People
• Events
• Connections between people and landscapes
• Population geography focuses on the number,composition, and distribution of human beings onearth’s surface.
• Population changes
• How changes relate to earth’s environment and natural resources

DISTRIBUTION
• Distribution: refers to the arrangement of locations on the earth’s surface where people live.
• Distribution of the world’s population is uneven.
• Some lands are nearly uninhabited while others are densely populated.
• Distribution is best shown with a dot map.
• Half of the world’s people live near cities.

DENSITY AND SCALE
Population density (definition): the number of
people
divided by the total land area; a measure used often
by geographers
Population maps are drawn at different scales:
• Largest scale (example): In a rural county in U.S., a dot may
actually show the location of every individual.
• Medium scale (example): In a single country, a dot may represent
5000 people.
• Smallest scale (example): On a world map, a dot may represent
100,000 people.

SCALE
Conclusions about population distribution on a
global scale:
• Almost 90% of all people live north of the equator.

SCALE
Conclusions about population distribution on a
global scale:
• More than half of all people live on about 5% of the land,
and almost 9/10 on less than 20% of the land.
• Rapidly growing urban areas increasingly dominate the
globe.
• Most people live in areas close to sea level.
• Most arable land is at lower latitudes.

SCALE
Conclusions about population distribution on a
global scale:
• About 2/3 of the world population is concentrated within
300 miles of the ocean.
• Many who live inland settle in river valleys.
• Human beings have long settled around bodies of water.
That pattern is still evident today.


ARITHMETIC AND PHYSIOLOGICAL POPULATION DENSITY:
A COMPARISON
ARITHMETIC
(CRUDE) DENSITY
•Total number of people divided by
land area
•Measure used most often by
geographers
•Does not tell us anything about
population distribution in
individual countries
•Gives us only a broad idea about
the strain the population might
put on the land areas
PHYSIOLOGICAL DENSITY
•Measures the pressure that
people place on the land to
produce enough food
•Divides the number of people into
square km of arable land
•Arable land = land suitable for
agriculture

A LOOK AT EGYPT…
• Egypt has a relatively sparse population.
• Arithmetic density for the country is 74.
• Its physiological density, however, is 3500!
• Since much of Egypt is desert, its people put a great deal
of pressure on the arable land.
• As a result, the country has a very high physiological
density.

COMPARATIVE ARITHMETIC POPULATION DENSITY
Country Arithmetic Density (Per square km)
Monaco 23,660
Singapore 6,333
South Korea 480
United Kingdom 246
Nigeria 142
Turkey 97
Nicaragua 42
United States 34
Argentina 13.9
Canada 3.2


CARRYING CAPACITY: WHAT IS IT?
Definition: the number of people an area can support on a
sustained basis
How does carrying capacity relate to overpopulation?
The circumstance of too many people for the land to
support is known as overpopulation.

CARRYING CAPACITY DEPENDS ON AN AREA’S
LEVEL OF TECHNOLOGY.
• Example: A region whose farmers make use of irrigation and
fertilizers can support more people than regions that do not.
• Example: An industrial society is able to import raw materials
from other places, convert them into finished products, and
export them.
• Example: Japan
• An industrial country with a very high carrying capacity
• Relatively small land space
• Able to buy food it cannot produce at home from profits
earned by exporting finished products

POPULATION PYRAMIDS
• What do they do?
• Population pyramids represent a population’s age
and sex composition.
• The pyramids take different shapes according to the
distribution of males and females at each age level.
• What affects the shape of a country’s population
pyramid?
• Level of health care
• Impact of war
• Availability of birth control
• Level of economic development

EXAMPLE: AFGHANISTAN
• Pyramid narrows as it goes up in age group.
• Few people live above the age of 75.
• Hospitals are likely to encounter health issues among
young people.
• Example: problems of women in childbirth

EXAMPLE: FRANCE
• In older age groups, France has more women than men.
• France has fewer people in the age group of 0—4 years
olds than Afghanistan.
• France is more likely to specialize in treating diseases of
middle and older age groups.


POPULATION CONCENTRATIONS: WHERE?
• East Asia
• About 1/5 of all humans live in East Asia.
• Region consists of:
• China
• Islands of Japan
• Korean Peninsula
• Island of Taiwan

EAST ASIA
• China: world’s most populous country
• Chinese population is concentrated near the Pacific
Coast and in several river valleys, such as the Huang
and Yangtze.
• Much of the western part of China is sparsely
inhabited due to deserts and mountains.
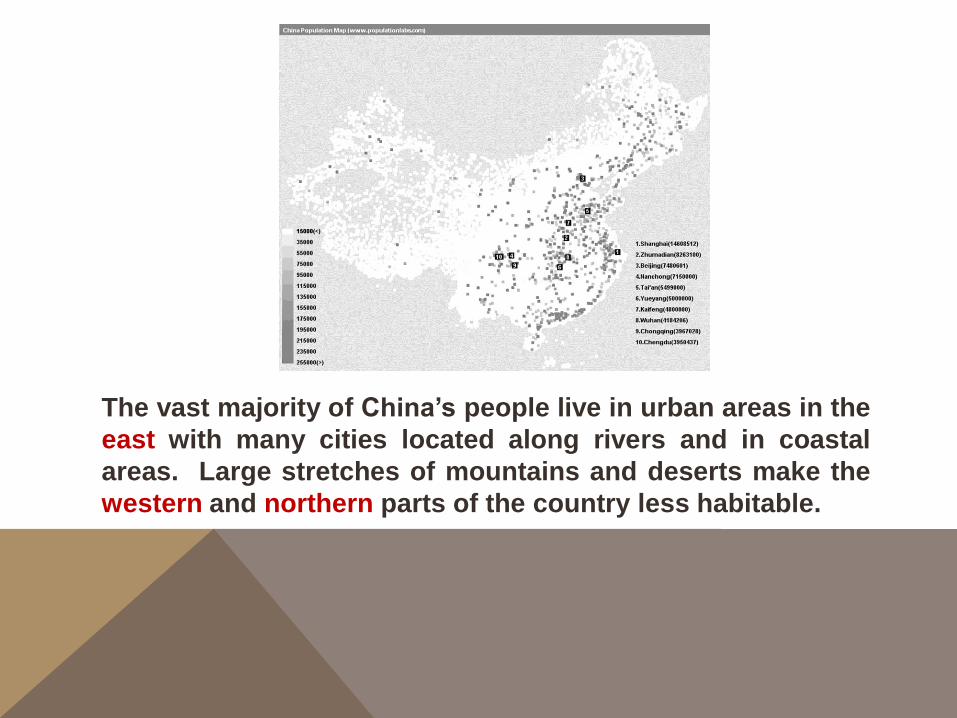
The vast majority of China’s people live in urban areas in the
east with many cities located along rivers and in coastal
areas. Large stretches of mountains and deserts make the
western and northern parts of the country less habitable.

EAST ASIA: URBAN AND RURAL AREAS
• China has more than 150 growing cities, each with at
least 1 million inhabitants.
• Two-thirds of China’s inhabitants still live in rural
areas.
• About three-fourths of all Japanese and Koreans live
in urban areas.
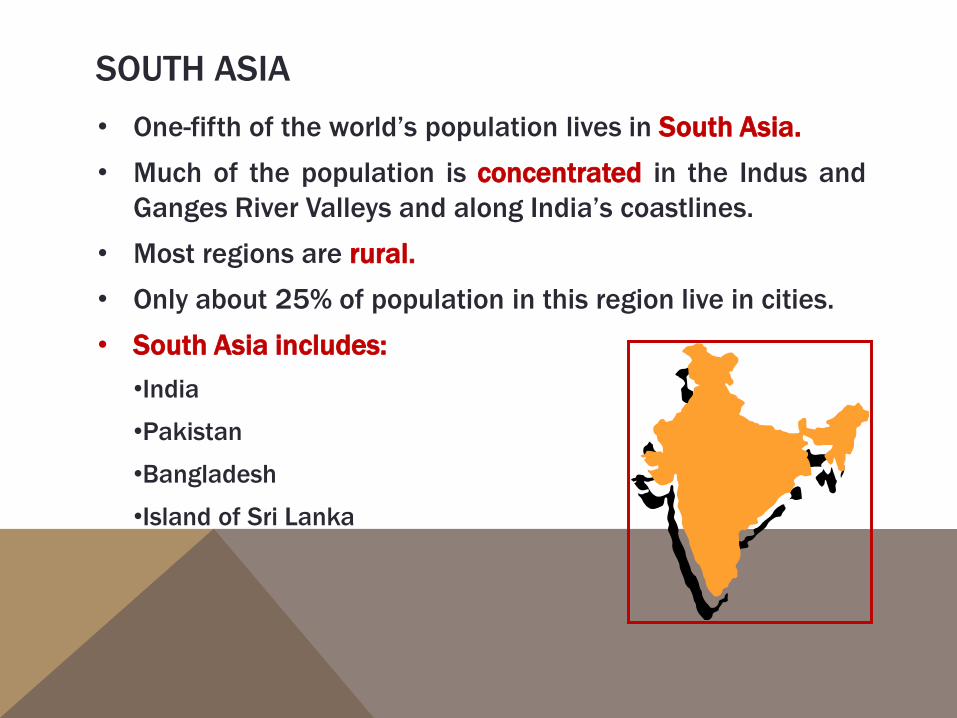
SOUTH ASIA
• One-fifth of the world’s population lives in South Asia.
• Much of the population is concentrated in the Indus and
Ganges River Valleys and along India’s coastlines.
• Most regions are rural.
• Only about 25% of population in this region live in cities.
• South Asia includes:
•India
•Pakistan
•Bangladesh
•Island of Sri Lanka

SOUTHEAST ASIA
• About 500 million people live in this region.
• The region contains the world’s fourth most populous
country—Indonesia, consisting of thousands of islands.
• Region includes such places as:
Vietnam Borneo
Thailand Papua New Guinea
Myanmar (Burma) Philippines
Java
Sumatra

EUROPE
• Europe is the only non-Asian area of
population concentration.
• Population is concentrated primarily in urban
areas.
• Less than 20% of inhabitants are farmers.

EUROPE
• European terrain and environment are not as
closely related to population distribution as in
Asia.
• An axis of densely populated areas follows
the location of Europe’s coal fields, indicative
of the importance of industrialization as it
relates to population growth.


RACE AND ETHNICITY…What’s the difference?
• Race: a category composed of people who share
biologically transmitted traits that members of a
society consider important
• Ethnicity: less based on physical characteristics and
emphasizes a shared cultural heritage, such as
• language
• religion
• customs

RACE AND ETHNICITY…What’s the difference?
Because many people live in areas or
neighborhoods with people of the
same race and/or ethnicity, patterns
of population distribution are often
determined by these two
characteristics.

A LOOK AT CANADA…
Two largest ethnic groups:
• British Isles origin
• French origin
• A study of population distribution in Canada shows a
significant division based on language-based ethnicity.
• One result: movement in Quebec to be a separate country
from the rest of Canada

LANGUAGE-BASED ETHNICITY IN CANADA

THE U.S. CENSUS BUREAU
• Census (count of the population done every 10 years)
• Maintains detailed population statistics based on race and
ethnicity
• Questionnaire done by residents asks everyone to self-
identify race and national ancestry
• Great variety reported by those responding

POPULATION CHANGE IN THE U.S.

KEY QUESTIONS TO CONSIDER FROM SESSION 1
What is demography?
What is the difference between distribution and density?
What is the difference between physiological density and
arithmetic density?
What is the relationship between carrying capacity and
overpopulation?
What areas/regions of the world are the most densely
populated?
Distinguish between the terms “race” and “ethnicity.”