advanced plug-in electric vehicle travel and charging ... · 2 preface this interim report provide...
TRANSCRIPT
Institute of Transportation Studies ◦ University of California, Davis
1605 Tilia Street ◦ Davis, California 95616
PHONE (530) 752-6548 ◦ FAX (530) 752-6572
www.its.ucdavis.edu
Research Report – UCD-ITS-RR-16-10
Advanced Plug-in Electric Vehicle Travel and Charging Behavior
Interim Report
January 2017
Michael A. Nicholas Gil Tal
Thomas S. Turrentine

1
Advanced Plug in Electric Vehicle Travel and Charging Behavior Interim Report (ARB Contract 12-319 – Funding from CARB and CEC)
January 8, 2017
Prepared By
Michael Nicholas Ph.D.
Gil Tal Ph.D.
Thomas Turrentine Ph.D.
Prepared For

2
Preface This interim report provides a status update on relevant findings in the Advanced Plug in Electric Vehicle Travel and Charging Behavior Project. The purpose of this project is to understand the emissions potential of plug-in electric vehicles (PEVs) under real world conditions, highlight benefits and challenges, and present needs for future electric vehicles. The project provides a platform to monitor how new PEVs are being used on a day to day and month to month basis within the household travel context by placing data loggers in participant households for a period of one year. The project provides a common basis to evaluate technologies side by side in a consistent way. The project began with studying 3 models of plug in vehicles: The Toyota Plug-in Prius, the first generation Chevrolet Volt, and the first generation Nissan Leaf. As the project has progressed, 6 new models have been added: the Ford C-Max Energi, Ford Fusion Energi, second generation Volt, second generation Leaf with 30kWh pack, the BMW i3 REx, and the Tesla Model S. Based on learnings from the first deployment of vehicles, households with 2 PEVs have been added to the study as an important next step to understand the transition to electric vehicles. As new questions emerge, the project can help answer them in a timely manner.
The statements and conclusions presented are those of the contractor and not necessarily those of the California Air Resources Board or the California Energy Commission. The mention of commercial products, their source, or their use in connection with material reported herein is not to be construed as actual or implied endorsement of such products.

3
Executive Summary The Advanced Plug-in Electric Vehicle (PEV) Travel and Charging Behavior project (project) provides a platform to monitor how new plug in electric vehicles (PEVs) are being used on a day to day and month to month basis within the household travel context by placing data loggers in participant households for a period of one year. This provides two advantages over simply studying the PEV for a long period or studying the household for a short period. First, only studying the PEV does not give a clear indication of what role the PEV is playing in the household and what travel needs are not covered by the PEV. Second, the shorter-term studies do not capture those infrequent events such as long trips which may have a bearing on the purchase or lease of the vehicle. This project represents the first step in understanding these important dynamics and potential barriers that need to be addressed in the transition to cleaner vehicles.
The project consists of a large survey of PEV owners/lessees, followed by intensive study of a subset of those respondents. Data monitors that collect GPS, state of charge, speed, revolutions per minute (RPM), charging events, and numerous other parameters on a nearly second-by-second basis were placed in all the vehicles in the selected households for a period of one year. The project is about midway through data collection; the first phase of the study was completed in late summer 2016, which included logging all the vehicles within 72 PEV households for a full year. Data is currently being collected from an additional 132 households, and the final number will be 264. These respondents own or lease one of the following seven PEVs with their EPA electric ranges: Toyota Plug-in Prius (PHEV11), Ford C-Max Energi (PHEV20), Ford Fusion Energi (PHEV20), Chevrolet Volt (PHEV36,53), Nissan Leaf (BEV73,86,105), BMW i3 REx (PHEV73), and Telsa Model S (BEV200+). The BMW i3 REx and Tesla are not included in many of the results presented as they were not part of the first 72 households in the first phase of this study. The results presented in this interim report comprise a combination of survey responses and results from the year-long data collection.
Results so far suggest that participants maximize the use of their PEVs, which account for more than half of household miles except in the case of the Leaf. The Leaf is used intensively as well, but the 18 Leaf households in this study had more licensed drivers than households with another PEV type, making direct comparisons difficult. Leafs were less likely to be used on days that required charging to complete a day’s travel, whereas PHEVs were more likely to be used as the distance of travel increased, and in fact PHEVs were likely to be chosen more frequently than ICEs for long travel days. Leafs were used less than 50% of the time if the day’s travel required one charging event, and very rarely if it required two charging events. In contrast, PHEVs were used more than 50% of the time for travel days that would have required the Leaf recharge at least once, but dependence on gasoline for those days was very high. These results suggest that as BEV range increases, trips done in ICEs may shift to the BEV in order to maximize travel in that vehicle, as long as it fits into the range needed for that day.

4
Charging and usage of PHEVs differs by electric range such that the usage of a PHEV36 is much different than a PHEV11. Instead of PHEVs with smaller range plugging in more, they plugged in less overall during the year-long collection period. We analyzed survey data to investigate the factors that influence the decision to plug in at the workplace, such as price, congestion, time limits on parking, and external factors such as income. Our analysis shows that the likelihood of plugging in is linked to the electric driving range that can be recovered per charging event. PHEV11’s “motivation” was limited to 11 miles of motivation, whereas PHEVs with larger battery sizes showed increased motivation to plug in up to the point that range recovered equaled their vehicle range. This may also help explain why the likelihood of abandoning plugging in increases as electric range decreases. Also, fewer people plugged in in 2016, when gasoline prices were approximately 20% lower compared to 2015. Increasing PHEV range has benefits in both the technical ability for a vehicle to do more travel with electricity and by increasing the motivation to plug in.
Criteria emissions are also important when considering the overall environmental benefits of PHEVs. All PHEVs have an engine and therefore emit tailpipe criteria pollutants, which are related to the frequency and conditions at the time of engine starts. If the engine is able to warm up before providing power, emissions are lower than starts when the engine must immediately provide power (which is likely to occur most frequently in blended PHEVs with low range). This analysis shows that at least 17% of PHEV11 engine starts were high-power cold starts. If those starts are significantly more polluting, blended PHEVs may not provide criteria emissions benefits compared to conventional vehicles.
Finally, on a GHG basis under the current electric grid emissions, low range PHEV households show lower household GHG emissions per mile ([all ICE+PEV miles]/[all associated GHG]) of travel than in those households with longer electric range vehicles. Because their gasoline efficiency is high and travel is shifted to that vehicle, this displaces other less efficient gasoline miles. However, under a zero carbon electricity scenario, GHG per mile of household travel is more favorable for longer range PEV households.
PEVs in this study were being used intensively and were preferred over the ICEs for household travel. BEVs were used more than their ICE counterparts within the limits of their range, but were less likely to be used if they require charging during the day. Increasing BEV range may result in BEVs being selected more often for journeys that exceed the range of current BEVs. The question remains, however, whether increasing range will simply shift travel within the household on longer travel days, or if it will result in a BEV becoming a viable option for ICE replacement in more households. PHEVs are currently very capable ICE replacements, but analysis thus far shows that increasing range increases the likelihood that PHEV travel will take advantage of these vehicles’ electric capabilities. Finally, blended PHEVs may have some drawbacks in terms of emissions benefits pending further analysis of the effect of high-powered cold starts. Providing more motive power through the electric motor increases the benefits that PHEVs provide.

5
Background This project seeks to answer essential questions about future travel and charging behavior of PEVs in California households and the benefits that are likely to result. What are the environmental benefits of these vehicles? How practical are PEVs for households? How much travel can and will be shifted to these PEVs? What kind of charging network do these need? What are the likely impacts on the electric grid? This study has collected data from all vehicles within 72 PEV owning households in California for a full year, allowing for a systematic comparison between technology types and vehicle ranges. At project completion, we will have collected data from 264 households and surveyed over 10,000 California PEV owners. This research helps identify ways to facilitate increased use of ZEVs by Californians. Also, longitudinal, temporal, and spatial data provide a better picture of when and where PEVs are charging, and the electric and gasoline vehicle miles traveled of PEVs and other vehicles in the household.
Recruitment and Generalization Surveys In order to recruit participants for the data collection, participants were invited to complete an online survey in order to gather data from the wider PEV community to set an appropriate sampling frame and generalize the population. The survey also helps determine if household vehicles are suitable for participation (appropriate mileage, accessible onboard diagnostics (OBD) port, household with vehicles newer than 1996). A random sampling of California PEV households were chosen based on DMV registration data.
-> -> ->
Sent invitation by mail Fill out survey Want to participate Households chosen in
consultation with ARB staff Figure 1 Recruitment process
The surveys also allow us to capture aspects about the households such as commute location, charger access, sensitivity to price, household demographics, etc. As of this interim report, a total of 3 surveys have been completed: the first in May 2015 (n=4,986), the second in May 2016 (n=519) and the third in June-November 2016 (n=4,196). The response rates for completed surveys were 13%, 15% and 17% respectively.

6
Data collection For those households recruited for data collection, a monitor was placed in all household vehicles for one year. These monitors plugged into the OBD port of each vehicle where vehicle specific parameters are available. We collected parameters in 6 categories as shown in Table 1.
Table 1 Parameters collected from subject vehicles
Travel Behavior Location* Time* Driving Behavior Speed* Acceleration* Braking Button usage (Eco Mode, EV Now, etc) Distance* Fuel level* Performance Miles per gallon (MPG)* Emissions Control/Cold start Comfort Cabin Temp Outside Temp Precooling
Electrical Power in the car Power at Battery Terminal Motor power A/C power Heater Power Accessories Losses State of charge (SOC) Charging Behavior EVSE Voltage available EVSE available amperage Plug connection time Drawing time Instantaneous power Cumulative energy SOC Location
Not all parameters were available on all vehicles. The parameters denoted by a “*” were those collected or derived for ICE vehicles. Some parameters such as MPG are derived from multiple parameters such as RPM, engine load, mass air flow, and intake air temperature while others such as distance were derived from speed and time. Most parameters were collected at a 1 Hz rate with the exception of GPS and State of Charge (SOC) which were sampled every 10 seconds. Additionally, monitors were not placed in vehicles driven less than 1,000 miles per year, although manual odometer readings were taken to estimate all household travel.
Sampling The locations of the logged participant households for Phase 1 is shown in Figure 2.

7
Figure 2 Approximate participant locations for Phase 1
The distribution of households was selected by electric utility and generally follows the market for electric vehicles with most participants being in one of the four largest metropolitan regions in California: San Francisco, Sacramento, Los Angeles, and San Diego. Some participants were in unique conditions such as in the mountains or along the coast where isolation or temperature may have an impact on how they use their vehicles compared to those in major metropolitan regions. Although the sample size is small in those cases, interacting with them and observing their behavior presents the possibility for additional learnings from the project. The second phase of the project will include interviews in various household contexts.
The sample was further stratified by income to represent the income of the larger survey sample. If possible we stratified by plug in behavior in three categories: only home charging, only public, and both home and public. No participants were chosen who did not plug in. In practice, these distinctions on plug in behavior were hard to sample for given the other stratification restrictions.
This study population, PEV households who purchased or leased their vehicle in the last 4 years, differs from average Californian households. For the general population, less than one-third of households buy a new car every 3-5 years[1] based on the 2012 California Household Travel Survey (CHTS)[2] survey. To compare PEV buyers who have taken our survey to the general
8
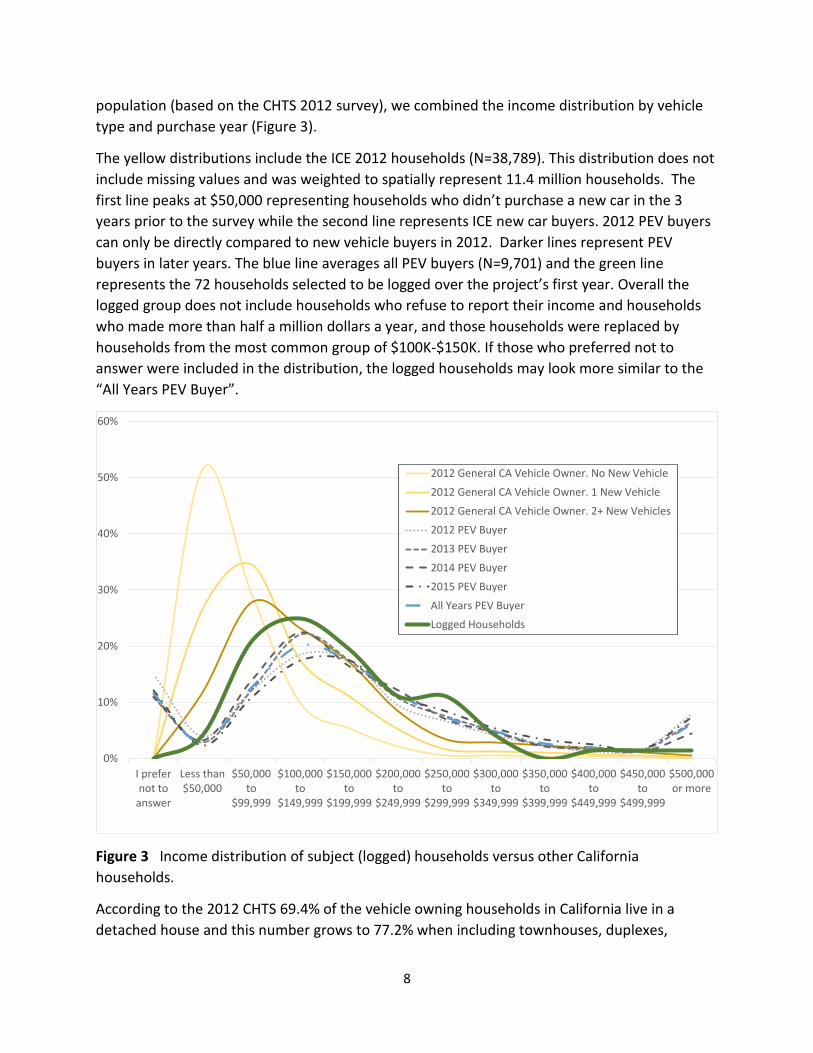
population (based on the CHTS 2012 survey), we combined the income distribution by vehicle type and purchase year (Figure 3).
The yellow distributions include the ICE 2012 households (N=38,789). This distribution does not include missing values and was weighted to spatially represent 11.4 million households. The first line peaks at $50,000 representing households who didn’t purchase a new car in the 3 years prior to the survey while the second line represents ICE new car buyers. 2012 PEV buyers can only be directly compared to new vehicle buyers in 2012. Darker lines represent PEV buyers in later years. The blue line averages all PEV buyers (N=9,701) and the green line represents the 72 households selected to be logged over the project’s first year. Overall the logged group does not include households who refuse to report their income and households who made more than half a million dollars a year, and those households were replaced by households from the most common group of $100K-$150K. If those who preferred not to answer were included in the distribution, the logged households may look more similar to the “All Years PEV Buyer”.
Figure 3 Income distribution of subject (logged) households versus other California households.
According to the 2012 CHTS 69.4% of the vehicle owning households in California live in a detached house and this number grows to 77.2% when including townhouses, duplexes,
0%
10%
20%
30%
40%
50%
60%
I prefernot to
answer
Less than$50,000
$50,000to
$99,999
$100,000to
$149,999
$150,000to
$199,999
$200,000to
$249,999
$250,000to
$299,999
$300,000to
$349,999
$350,000to
$399,999
$400,000to
$449,999
$450,000to
$499,999
$500,000or more
2012 General CA Vehicle Owner. No New Vehicle
2012 General CA Vehicle Owner. 1 New Vehicle
2012 General CA Vehicle Owner. 2+ New Vehicles
2012 PEV Buyer
2013 PEV Buyer
2014 PEV Buyer
2015 PEV Buyer
All Years PEV Buyer
Logged Households

9
triplexes with separate street entry. The sub sample of new ICE buyers includes 89% single and detached houses and only 11% condos apartments and others. The PEV surveys (N=9142) suggest that 94.2% of the PEV households live in a detached houses (including townhouses, duplex, triplex) and about 6% live in apartment and condos. The logged households have somewhat lower representation of those households with only 2.8% living in apartments or condos.
The logged households commute rate also compares well to the CHTS. Analysis of the CHTS data (weighted for California for all days) shows that 46.3% of households commuted during their one day travel diary. Using the same logic as a one day diary and, the chance that some household member in our study is commuting on a particular day is 43.9%.
Household statistics from different sources is shown in Table 2. The American Community Survey (ACS) 5-year estimate 2009-2013[3] was used for household size, licensed driver numbers and DMV[4] was used for California vehicle numbers.
Table 2 Comparison of averages for Generalization Survey, Logged Households and General California Population
The comparison shows that the logged households have more vehicles on average than the general car-owning population in California but less than the PEV owners. The household size is smaller for the logged households compared to the surveyed PEV owners and the general car-owning California population. The number of licensed drivers per household is similar for the logged households compared to the general population, but slightly higher for the surveyed PEV owners.
Project Phases The project is being completed in phases and phase 1.0 is complete. Phase 1.5 and 2.0 are completely installed (Figure 4).
Vehicles per HH (Survey)
Vehicles per HH (Logged)
Vehicles per HH (ACS-DMV)
Vehicles per Driver (Survey)
Vehicles per Driver (Logged)
Vehicles per Driver (ACS-DMV)
Household Size (Survey)
Household Size (Logged)
Household Size (ACS)
Licenced Drivers (Survey)
Licenced Drivers (Logged)
Licenced Drivers (ACS)
Chevrolet Volt 2.50 2.27 1.21 1.21 2.76 2.33 2.17 1.88Ford Energi 2.48 2.16 1.20 1.02 2.78 2.83 2.12 2.11Nissan LEAF 2.58 2.61 1.21 1.18 3.18 2.83 2.22 2.22Toyota Prius Plug In 2.38 1.88 1.13 1.03 2.91 3.00 2.18 1.83Average 2.48 2.23 1.93 1.19 1.11 0.94 2.91 2.75 2.94 2.17 2.01 2.03

10
Figure 4 Project phases and models studied
The data presented in this report will primarily be from the phase 1.0 survey and logged households.
Phase 1.0 [72 loggers]: (4.4 kWh) Plug-in Prius (18) (7.6 kWh) C-Max (9) + Fusion (9) (16-17.1 kWh) Volt (18) (24 kWh) Leaf (18)
Logging Completed
Phase 2.0 [72 loggers]: (16-17.1 kWh) used Volt (18) (7.6 kWh) C-Max (9) + Fusion (9) (18.4 kWh) Volt (18) (30 kWh, various mileage lease) Leaf (18)
Logger installation by 12/16
Phase 1.5 [60 loggers]: (4.4 kWh) Plug-in Prius (4) (7.6 kWh) C-Max (2) + Fusion (2) (16-17.1 kWh) Volt (4) (24 kWh) Leaf (4) (22 kWh) i3 REx (22) (70, 85 kWh) Model S (22)
Logger installation by 10/16
Phase 2.5 [60 loggers]: (16-17.1 kWh) used Volt (4) (7.6 kWh) C-Max (2) + Fusion (2) (18.4 kWh) Volt (4) (30 kWh) Leaf (4) (33 kWh) i3 REx (22) (70, 85 kWh) Model S (22)
2015 2016 2017 2018

11
Highlights This section presents the highlights from the research to date which are relevant for the midterm review process and also what research questions remain open. The main feature of the research is the household context in which the research takes place. It is an explicit recognition that new vehicle technology usage does not exist in isolation, but must be integrated into a household’s other vehicle options, travel needs, charging opportunities, and driver preferences. Figure 5 graphically shows different hypothetical household contexts.
Figure 5 Hypothetical household vehicle fleet with associated eVMT
When only the PEV information is known, much of the context is gone as to what the needs of the household are. When comparing a BEV to a PHEV and the electric vehicle miles traveled (eVMT) of a BEV is less, it is difficult to assess if a BEV is limiting travel or if the needs of a BEV household are simply less in terms of miles. If household 1 were to become a BEV household, it could look like Household 2, 3, or 4. Although participants in our study don’t replace a PHEV with a BEV, we can look at household travel differences between those with different technologies and vehicle ranges. Further we can examine travel needs throughout a year in a household to investigate what role ICEs are playing in travel and what role the next advanced technology vehicles must play to replace them.
eVMT as a Metric At the heart of the project is the metric of eVMT. This helps define the role of electricity as a fuel. We define eVMT as miles powered by off-board electricity. This can include “blended miles” where some power is provided by the gasoline and off-board electricity simultaneously. Notionally, it is tempting to say that more eVMT is better and its creation represents progress towards many goals including: GHG reduction, local criteria pollutant reduction, gasoline replacement, and technology advancement.
We do not attempt to address all these goals, but provide metrics and analyses to assess them and understand the relevant factors that determine how much travel is done with electricity from the electric grid. These factors include whether a vehicle is a PHEV or BEV, its electric range, household purchasing motivation, electricity rates, gasoline prices, travel needs, access
ICE 8,000 Gas Miles
PHEV 8,000 eMiles3,000 gas Miles
ICE 3,000 Gas Miles
BEV 8,000 eMiles
ICE 11,000 Gas Miles
BEV 8,000 eMiles
Household 3eVMT share 72%Total 11,000 Miles
Household 1eVMT share 42%Total 19,000 Miles
Household 2eVMT share 42%Total 19,000 Miles
ICE 6,000 Gas Miles
BEV 13,000 eMiles
Household 4eVMT share 68%Total 19,000 Miles

12
to charging and charging motivation. Even with all this complexity we can still draw generalities from the data by looking at averages and median values as shown in Figure 6 and Figure 7.
Figure 6 Three sources of average eVMT data: data collected from UCD and OEM monitors and BEVs from UCD survey
Figure 6 compares 3 sets of data - that provided to Idaho National Labs by Automobile Original Equipment Manufacturers (OEMs)[5], data collected by loggers in this project, and that gained from the recruitment survey[6]. The PHEV eVMT is only able to be determined from monitoring the vehicle directly, such as with this project and with onboard monitors installed by automobile OEMs. The BEV eVMT is from self-reported odometer readings. The results show general consistency with one exception of the Volt which has similar eVMT% at 74% for both studies, but different VMT. The j2841 utility factor line is for reference which shows the expected eVMT if a vehicle plugs in once a day and drives 12,000 miles a year.
Figure 6 shows a few important aspects of vehicle range/technology and eVMT. PHEVs get more eVMT as a function of electric range than BEVs. Annual eVMT plateaus at around 12,000 miles in current BEVs (the Tesla Model S with 265 miles range is not shown but had an average annual eVMT of 12,174). And finally, the Volt eVMT is greater than would be expected from average travel and once a day charging. The average is of course made up of a distribution. The self-reported VMT distribution of various models in the survey is shown in Figure 7.
0
2000
4000
6000
8000
10000
12000
14000
16000
18000
20000
0 20 40 60 80 100 120 140
Annu
al e
VMT
EPA Electric Range
Observed BEV and PHEV eVMT (OEM Data and UCD Data)
UCD EVMT Survey BEV eVMT INL eVMT j2841 Utility Factor (12,000 miles)

13
Figure 7 Median self-reported VMT across all PEV models from recruitment survey
From Figure 7 we can see that certain models are more likely to be driven intensively with the highest mileage models being the Plug-in Prius and the Ford Fusion Energi.
Indeed we see a similar trend in our participant households (Figure 8).
0
5000
10000
15000
20000
25000
10th Percentile 25th Percentile Median 75th Percentile 90th Percentile
VMT by PEV Model
Smart fortwo BMW i3 Fiat 500e BMW i3 REX Chevrolet Spark EV
Ford Focus Electric Nissan LEAF Honda Fit EV Toyota RAV4 EV Ford C-Max Energi
Chevrolet Volt Tesla Model S 85 Ford Fusion Energi Toyota Prius Plug In

14
Figure 8 Average daily distance driven by phase 1.0 project households with standard error bars
Although the averages are consistent between participant households and the survey, those averages include great variation and show similar trends. The Plug-in Prius and Ford Fusion Energi are more likely to be “super commuters”. This also highlights the importance of self-selection in determining eVMT. Some smaller models such as the Fiat 500e and BMW i3 drive fewer miles in general, irrespective of range.
Household Travel Dynamics As mentioned earlier, the unique feature of this study is the household context where all vehicle travel in the household is captured. With these data we can see where the non PEV miles occur.
Choice of Vehicle for Travel Within the Household First we look at the survey where the annual mileage values are a combination of odometer readings and respondent’s annual mileage estimates (Figure 9).
Figure 9 Annual mileage estimates from the PEV and first and second most used vehicle
Not all households have second or third vehicles, but if they exist, their value is shown. In Leaf households the second ICE vehicle typically travels slightly more miles than the Leaf. However, as range on a BEV increases as with the RAV4 EV, the vehicle becomes the primary household vehicle.
We examine the household interaction more closely in the data collected from vehicles in the study by categorizing the daily distance for each day driven into bins. On some days a vehicle is only driven 10 miles, so that day is categorized as a 10 mile day and so on. Zero mile days are
0
5000
10000
15000
20000
25000
30000
35000
NissanLEAF
Car 1 Car 2 RAV4EV
Car 1 Car 2 ModelS 85
Car 1 Car 2 ToyotaPrius
Plug In
Car 1 Car 2
Annu
al M
iles
Leaf / Rav 4 / Tesla / Prius Plug-in Households

15
not shown in the analysis. The categorization of days is shown in Figure 10 and Figure 11 for vehicles in the Nissan Leaf households.
Figure 10 Categorization of vehicle days into daily mile bins
0%
5%
10%
15%
20%
25%
Daily Mile Distribution in Leaf Households: Leaf vs. ICE
Percent of Total (eVMT Leaf) Percent of Total (ICE)
BEVHH 1
HH18
10 Miles per Day BEV
ICE
HH1
HH18
10 Miles per Day ICEs
BEV
ICE
1% of Days areover 200 Miles
BEV
BEV

16
Figure 11 Ratio of Leaf days versus ICE days by miles driven per day
From the data we hypothesize about four distance categories: short, medium, long and very long which correspond to electric vehicle range. If mileage requirements are short for a vehicle on a certain day, an ICE is just as likely to be chosen as a BEV since the mileage is low and the cost of travel is low regardless of the vehicle chosen. Consequently, vehicles are chosen for utility or convenience reasons. For medium distance trips within the round trip range of the BEV, travel is shifted to the Leaf as much as possible. For long trips when daily distance exceeds range, and requires at least one charge to return home, the BEV may be chosen, but the ICE is more likely. Our data set shows no very long distance trips for BEVs which require more than one charge in a day. However, 5.5% of household miles were on days over 200 miles and 11 of 18 Leaf households traveled more than 200 miles in a day over the one year data collection period.
Figure 11 also shows the percentage of total days a vehicle travels a certain distance and the total mileage accounted for in those days. Although 6% of household vehicle days of 0-10 miles (excluding days the vehicle is not driven) are Leaf vehicle days, it only accounts for less than 1% of household mileage. Conversely, 5.5% of Leaf days of 51-60 miles account for 9% of household miles. These estimates are meant to be illustrative as households have different
0%
2%
4%
6%
8%
10%
12%
0%10%20%30%40%50%60%70%80%90%
100%
Perc
ent o
f Tot
al
Vehi
cle
Split
by
Mile
aage
Bin
Miles per Day Distribution of Leaf vs. ICE
Leaf Daily Travel ICE Daily Travel
Percent of Total HH Days (Leaf) Percent of Total HH Days (ICE)
Percent of Total HH Miles (Leaf) Percent of Total HH Miles (ICE)
Short Medium Long

17
numbers of vehicles and drivers, but only one BEV meaning households with more vehicles and drivers drive more ICE miles. The percentages will change under different household contexts. Additionally, vehicles driven less than 1,000 annual miles were not logged (odometer readings were taken instead) making trip distributions impossible. These vehicles and other issues with data accounted for about 6% of travel in ICEs. Leaf data issues (unplugged loggers) accounted for 1% of data loss.
In contrast to the Leaf households, Volt Households have an increased likelihood of driving the PEV on days with many miles (Figure 12)
Figure 12 Ratio of Volt days versus ICE days by miles driven per day frequency of those days as a percentage of total driving days and miles driven on those days.
Somewhat similar to the Leaf, on very short days there is somewhat of an indifference in the vehicle chosen and a higher likelihood of the vehicle chosen if the travel fits into the all-electric distance of the Chevrolet Volt. As the distance increases, the likelihood of choosing an ICE for travel increases. There is a large spike around in 71-80 mile bin in which two frequent
0%
2%
4%
6%
8%
10%
12%
14%
0%
10%
20%
30%
40%
50%
60%
70%
80%
90%
100%
Perc
ent o
f Tot
al
Vehi
cle
Split
by
Mile
age
Bin
Miles per Day Distribution of Volt vs. ICE
Volt Daily Travel (eVMT%) Volt Daily Travel (gVMT%)
ICE Daily Travel Percent of Total HH Days (Volt)
Percent of Total HH Days (ICE) Percent of Total HH Miles (Volt)
Percent of Total HH Miles (ICE)
Short Medium Long

18
commuters with workplace charging accounted for 7.3% of all household miles for Volt participant households. The dark green shading shows the percent of miles driven on off-board electricity within the days that the vehicle was driven the distance indicated by the bins.
Looking at days over 200 miles (Figure 13), we see that on average our sample households have similar long distance needs as a group.
Figure 13 Long distance days over 200 miles
Leaf households as a group however appear to shift long distance travel to other ICE vehicles in the household whereas the majority of trips over 200 miles were done in the PHEV in those households.
Looking at the survey results, we see that as the range of BEVs increases, they are more likely to be used on long trips. In the survey we asked “How many trips longer than 200 miles round-trip did you or your household complete with each car in the last 12 months?” (Figure 14). This includes round-trips that span multiple days which the data shown in Figure 13 does not.
0
1
2
3
4
5
6
Plug-in Prius HH Ford Energi HH Chevrolet Volt HH Nissan Leaf HH
Average # Days over 200 Miles by Vehicle and Household (HH)
PEV Days over 200 Miles ICE Days Over 200 Miles
Total days over 200 Miles

19
Figure 14 Survey results: Round trips of over 200 miles per year done in a household PEV
As range increases, BEVs may increasingly be able to fill the role of an ICE with regards to long-distance travel. In fact, the vehicle most preferred for long distance travel over 200 miles is the BEV Model S 85. We see that BEVs under 100 miles range are used on average less than 10% of the time when the round-trip is more than 200 miles. Although these trips are infrequent, the ability to replace an ICE may have an impact on the purchase of long-range BEVs. These metrics will be explored more as the study progresses.
These distributions of days and miles in BEV and PHEV households highlight a few important points. First, it is difficult to determine how much pre-existing travel patterns determine the choice of vehicle to maximize its range and how much the electric range of the vehicle determines the travel patterns. We can only observe what the combination of these two factors represents. Either through matching a vehicle purchase to existing travel conditions or choosing the most appropriate vehicle for travel on a particular day, range is a determining factor and users are maximizing the electric range of their vehicle and travel in that vehicle decreases past the electric range of the vehicle. When charging is available and appropriate, some users are maximizing the electric range + charging range in PHEVs. Also important is that
0
5
10
15
20
25
0%
10%
20%
30%
40%
50%
60%
70%
Num
ber o
f Tot
al 2
00 m
i Hou
seho
ld T
rips P
er Y
ear
Aver
age
% P
EV w
as U
sed
on 2
00 m
i Trip
s vs.
ICE
Vehicle Assignment for 200 Mile Round Trips
Average Share of 200 mi Trips Assigned to PEV # of 200mi Trips Per Year (10th percentile)
# of 200mi Trips Per Year (25th percentile) # of 200mi Trips Per Year (50th percentile)
# of 200mi Trips Per Year (75th percentile) # of 200mi Trips Per Year (90th percentile)

20
a few drivers with workplace charging and the appropriate commute distance can greatly affect the results showing both the dramatic effect a few users can have on overall fleet statistics and shows the limitations of a small sample size. Finally, to put the distributions into context the number of drivers and vehicles should be highlighted. The average number of household drivers for the loggedVolt households was 1.9 versus 2.2 for Leaf households. This means that the amount of ICE travel in Figure 11 and Figure 12 cannot be directly compared.
The interaction between daily mileage requirements and vehicle chosen shows that consumers in lower range BEV households have needs that they do not try to meet with their BEV and shows the role the ICE plays in those households. Conversely, the role that the ICE plays in BEV households is largely being done with a PHEV in PHEV households.
Another important factor in the choice of vehicle for a given day is the distance between home and the destination. We calculated Euclidean distance from home to the furthest point away from home in a day. This is illustrated graphically in Figure 15.
Figure 15 Example of Euclidean Distance from a Sarcramento Home
The distance from each GPS point to a participant’s respective home was calculated and the furthest point achieved in a day was categorized. The maximum number of data points was 365 per vehicle, but was usually fewer. Each maximum point was binned in 10 mile increments for analysis. The analysis for the Leaf is shown in Figure 16.

21
Figure 16 Vehicle choice by Euclidean distance from home
With a range of 80 miles, those trips over 40 miles from home require charging to return. There were 3 participants who regularly relied on out of home charging to return accounting for the high prevalence of this behavior. Some had second homes, so if there was an overnight stay, this would count as two days where two travel days are implied by Figure 16, but was actually one trip over two days. Accounting for these participants, we see a declining likelihood of choosing the Leaf if the distance from home is farther than 40 miles.
Household Travel This section describes the travel and characteristics of the 72 participant households in the first phase of the study. It is important to look at the number of vehicles and the number of drivers in the household as more drivers create more need for travel (Figure 17).
0%
10%
20%
30%
40%
50%
60%
70%
80%
90%
100%
Daily Distance from Home of Leaf vs. ICE
Leaf ICE

22
Figure 17 Household characteristics for participant households
First we see that for our logged sample, the number of vehicles in a household is greater as the electric range increases, but the number of drivers in those households does not follow the same trend. However, the greatest number of drivers per household is observed in the Leaf.
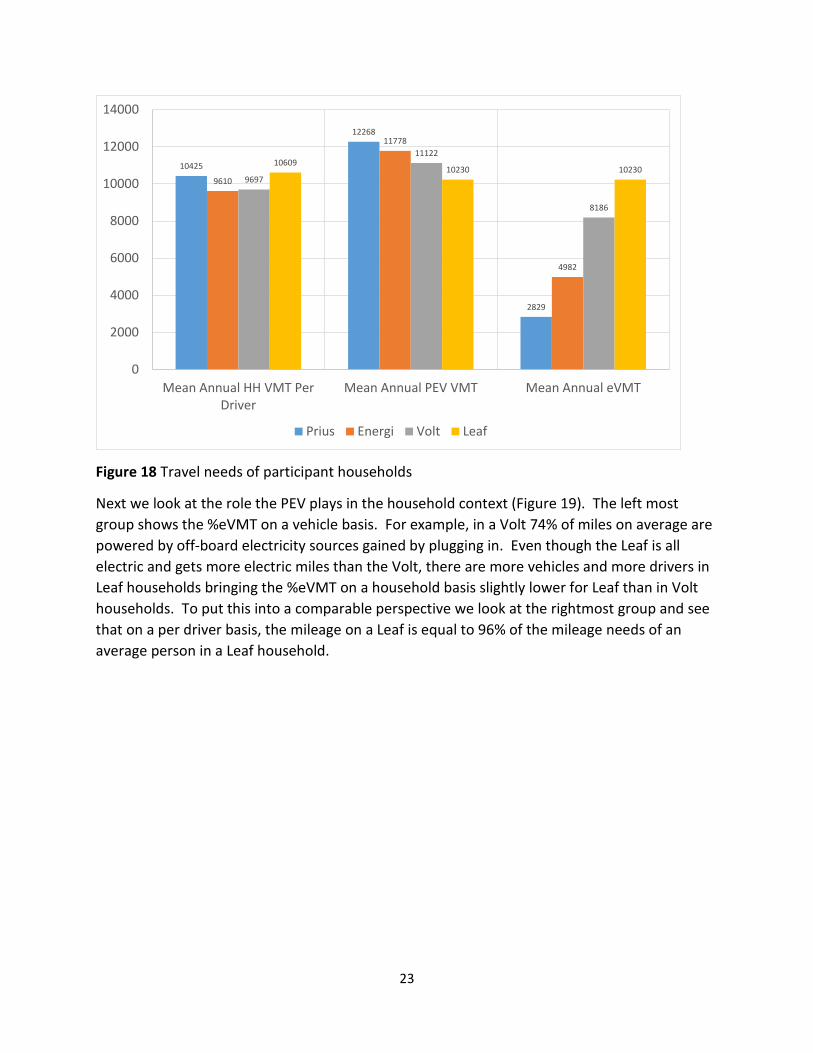
Looking at the travel needs of the participant households (Figure 18), we see a few trends. First, as shown by the left group, the travel needs per driver is relatively constant – that is (All Annual HH Miles)/(Number of Drivers) is relatively constant. Second, we see that a greater percentage of travel is shifted to lower electric range PEVs. Finally, we see that as electric range increases, eVMT increases.
1.88 1.83
2.16 2.112.27
1.88
2.61
2.22
0
0.5
1
1.5
2
2.5
3
Mean Number of Vehicles Mean Number of Drivers
Prius Energi Volt Leaf
23
Figure 18 Travel needs of participant households
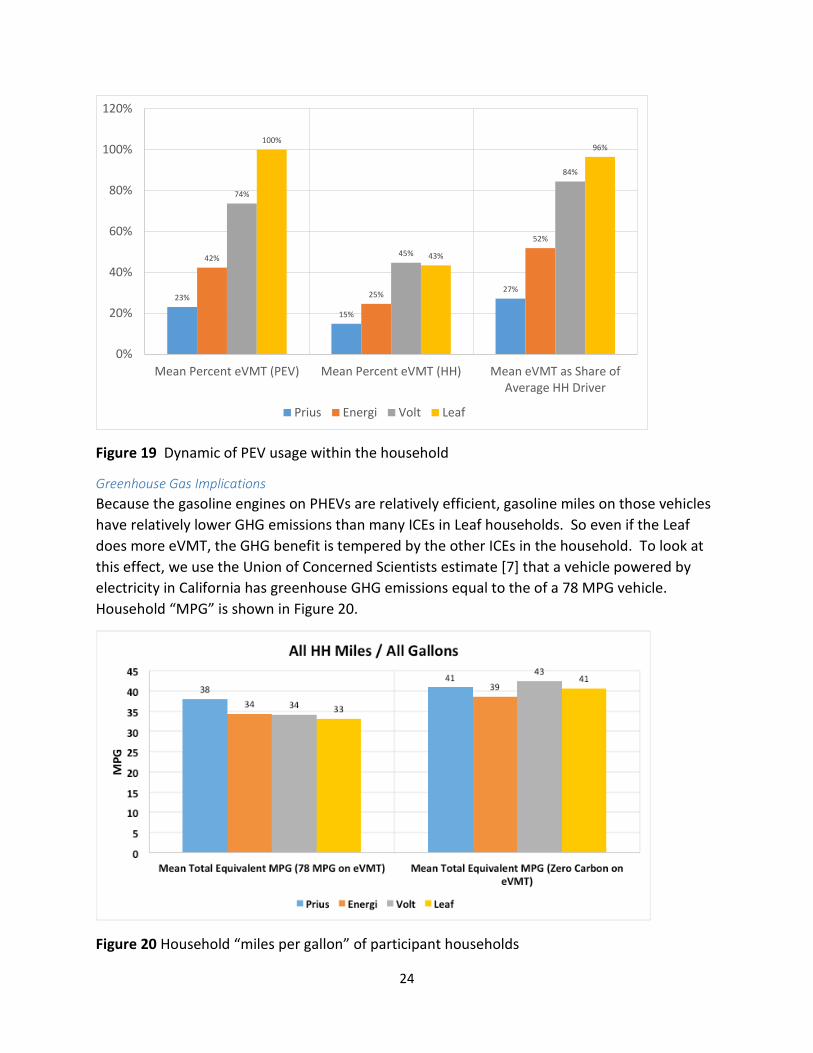
Next we look at the role the PEV plays in the household context (Figure 19). The left most group shows the %eVMT on a vehicle basis. For example, in a Volt 74% of miles on average are powered by off-board electricity sources gained by plugging in. Even though the Leaf is all electric and gets more electric miles than the Volt, there are more vehicles and more drivers in Leaf households bringing the %eVMT on a household basis slightly lower for Leaf than in Volt households. To put this into a comparable perspective we look at the rightmost group and see that on a per driver basis, the mileage on a Leaf is equal to 96% of the mileage needs of an average person in a Leaf household.
10425
12268
2829
9610
11778
4982
9697
11122
8186
1060910230 10230
0
2000
4000
6000
8000
10000
12000
14000
Mean Annual HH VMT PerDriver
Mean Annual PEV VMT Mean Annual eVMT
Prius Energi Volt Leaf
24
Figure 19 Dynamic of PEV usage within the household
Greenhouse Gas Implications Because the gasoline engines on PHEVs are relatively efficient, gasoline miles on those vehicles have relatively lower GHG emissions than many ICEs in Leaf households. So even if the Leaf does more eVMT, the GHG benefit is tempered by the other ICEs in the household. To look at this effect, we use the Union of Concerned Scientists estimate [7] that a vehicle powered by electricity in California has greenhouse GHG emissions equal to the of a 78 MPG vehicle. Household “MPG” is shown in Figure 20.
Figure 20 Household “miles per gallon” of participant households
23%
15%
27%
42%
25%
52%
74%
45%
84%
100%
43%
96%
0%
20%
40%
60%
80%
100%
120%
Mean Percent eVMT (PEV) Mean Percent eVMT (HH) Mean eVMT as Share ofAverage HH Driver
Prius Energi Volt Leaf

25
Because the Prius is fuel efficient, the Prius households logged had fewer drivers, and these households switched a large portion of miles to the PEV, the total household miles/all gallons in a year shows 38 miles per gallon for all travel versus 33 MPG for Leaf households. If we assume zero carbon electricity, those households who have more eVMT have a greater potential to improve. The policy implications are that both electricity sector decarbonization and vehicle replacement are important goals to achieve lower carbon intensity per household or per capita. PHEVs play a role in switching some longer range travel to more efficient gasoline miles, and we hypothesize that longer range BEVs will obviate the need for gasoline vehicles and have the potential for deep GHG reductions.
Effect of Purchase on Use Leased vehicles may be used in a different way than purchased vehicles for two main reasons. Lease limits may discourage use past a certain mileage threshold and second, the lease agreement may reflect the user perception of their need and may be correlated with a self-selected group. Figure 21 shows that based on the survey, leased PHEVs were driven less than purchased PHEVs that have no price difference per mile. For the BEVs, Chevrolet Sparks are being driven more if leased, but all other BEVs show no statistically significant difference.
Figure 21 Yearly miles for purchase and leased vehicles
52% of the lessees answered that they would not drive the PEV more if their lease mileage limit increased. But for the other 48%, PHEV drivers reported that they would have driven additional 3,000 average miles or more as presented in Table 3. Lease limits affect most PHEV lessees, but less than 50% of BEV lessees. The mean however does show that lease limits do affect the miles driven in all vehicle models to some degree.
Table 3 Stated preference of how lease limits affect miles driven
02000400060008000
10000120001400016000
annual miles, Leased annual miles, Purchased

26
How many more yearly miles do you think you would drive your PEV if your lease had unlimited miles?
Median Mean N
Nissan LEAF 0 2905 551 Chevrolet Volt 1000 3265 280 Fiat 500e 0 1998 236 Ford Fusion Energi 3000 6524 128 Ford C-Max Energi 1250 5448 106 Toyota Prius Plug In 3000 4554 105 Ford Focus Electric 0 2458 81 Toyota RAV4 EV 0 3131 76
Charging Behavior In order to get eVMT, one must plug in. In PHEVs this is optional and in BEVs this is mandatory. However, in BEV households, driving the BEV is usually optional and by extension so is plugging in. We investigated these dynamics both with observed data from participant households and through survey data on attitudes about charging. We found that vehicle range has an effect on charging behavior. First we looked at the observed charging rates for the first year throughout our study (Figure 22).
0
1000
2000
3000
4000
5000
6000
7000
8000
9000
0 10 20 30 40 50 60 70 80 90
Numb
er of
Even
ts
Vehicle Range
Plug In Events
Vehicle Range
Num
ber o
f Eve
nts
Home
Away
Home + AwayPlug In Events

27
Figure 22 Observed annual charging events for participant households by electric range
Even though the Volt has the longest range of any PHEV, they recorded the greatest number of charging events for participant households throughout the year. This result is counter intuitive for PHEVs as the need for charging increases as range decreases. Finally, we see that even though the Leaf households get the greatest annual eVMT of all models, they plug in fewer times than the Prius households.
Motivation to Plug in To investigate the paradox of charging need versus the likelihood of plugging in we turned to the survey where respondents indicated their charging frequency and location and access to chargers along with charger price. We focused on PHEVs, as charging is completely optional, and examined only free chargers at work. Respondents meeting these criteria numbered 481. We asked ourselves the question, why would anyone not plug in for free to recover the miles spent getting to work? We found that the likelihood of plugging in was a function of range recovered, not vehicle range. However, the maximum range recovered was limited by vehicle range. This is shown graphically in Figure 23.
Figure 23 Benefit for plugging in at a free work charger is a function of commute distance and vehicle range
Plug in Prius drivers were limited to 11 miles recovered for any commute over 11 miles, while Volt drivers’ recoverable miles increased all the way to 36 miles one-way. The likelihood of plugging in a Volt increased as miles recovered increased whereas Plug-in Prius drivers were no more likely to plug in after an 11 mile commute versus a 36 mile commute. Table 3 shows the regression model and relevant metrics.
TABLE 3 Linear Regression Model Dependent variable: percent of commute days plugging in
Term Estimate Std Error t Ratio Prob>|t| Intercept 0.4105088 0.052351 7.84 <.0001* Weekly congestion frequency (days) -0.047059 0.010829 -4.35 <.0001* Time restrictions dummy -0.0801766 0.019353 -4.14 <.0001* Income fraction from 500000 -0.172085 0.082624 -2.08 0.0378* Recoverable One Way Miles 0.0144503 0.002104 6.87 <.0001* R2 = 0.165702 R2 (adj) = 0.158691
PHEV 10
PHEV 20
PHEV 40
10 miles 20 miles 40 miles
PHEV 10
PHEV 20
PHEV 40
PHEV 10
PHEV 20
PHEV 40
$
$
$
$
$$
$$
$
$$
$$$$
Home
PHEV 10
PHEV 20
PHEV 40

28
The model shows that every mile recovered increases the likelihood of plugging in by 1.4%. Conversely, if there are any time restrictions on parking and charging, this decreases the likelihood of plugging in by 8%. In essence, time restrictions negate the value of 6 free miles of range recovered. Similarly, if dollars saved on gasoline is used instead of “Recoverable One Way Miles”, every dollar saved on gasoline increases the likelihood of plugging in by 12% although the R2 drops to 0.14. However, the model only explains 16.5% of the charging frequency and other unobserved factors determine the remaining 83.5% of the variation. The results help explain the interaction with electric range and the likelihood of plugging in shown in Figure 22. Longer range PHEVs will become very motivated to plug in as their battery depletes and this may explain the higher than expected eVMT shown in Figure 6. Additionally, it helps explain why some consumers rarely plug in. In our recruitment survey, some respondents told us that they were using the vehicle as a hybrid and rarely plugged in as shown in Figure 24.
Figure 24 Percent of survey respondents rarely plugging in as a function of PHEV electric range
As the benefit of plugging in is limited by vehicle range and battery capacity, some users don’t bother plugging in. We show results from 3 different surveys. One is from 2015 where the average price of gasoline was approximately $3.50 and another survey is from 2016 where the cost of gasoline was approximately $2.50. Finally we see from a 2016 UC Davis used PEV study that people driving used PHEVs are even less likely to plug in[8]. The results are fairly consistent with the premise that increasing vehicle electric range in PHEVs increases the likelihood of plugging in. Additionally, whether or not PHEVs are plugged in is impacted by gasoline prices and used vehicle owner user engagement.
0%
5%
10%
15%
20%
25%
30%
35%
0 5 10 15 20 25 30 35 40
Perc
ent N
ot P
lugg
ing
In
PHEV Vehicle Range
Not Plugging in Regularly (4 or Fewer Events)
2015 Survey 2016 Survey 2016 Used Survey
Power (2015 Survey) Power (2016 Survey) Power (2016 Used Survey)
2015 - New
2016 - New
2016 - Used
29
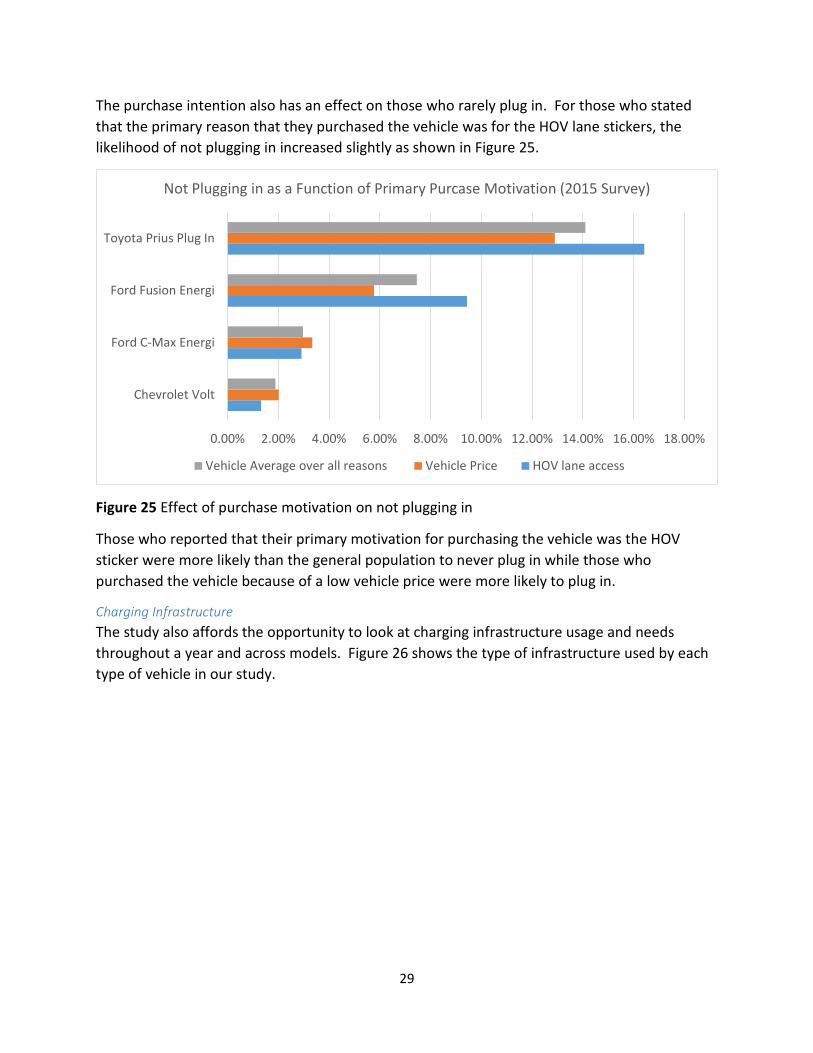
The purchase intention also has an effect on those who rarely plug in. For those who stated that the primary reason that they purchased the vehicle was for the HOV lane stickers, the likelihood of not plugging in increased slightly as shown in Figure 25.
Figure 25 Effect of purchase motivation on not plugging in
Those who reported that their primary motivation for purchasing the vehicle was the HOV sticker were more likely than the general population to never plug in while those who purchased the vehicle because of a low vehicle price were more likely to plug in.
Charging Infrastructure The study also affords the opportunity to look at charging infrastructure usage and needs throughout a year and across models. Figure 26 shows the type of infrastructure used by each type of vehicle in our study.
0.00% 2.00% 4.00% 6.00% 8.00% 10.00% 12.00% 14.00% 16.00% 18.00%
Chevrolet Volt
Ford C-Max Energi
Ford Fusion Energi
Toyota Prius Plug In
Not Plugging in as a Function of Primary Purcase Motivation (2015 Survey)
Vehicle Average over all reasons Vehicle Price HOV lane access

30
Figure 26 Energy transferred by level of charging across all charging locations
Level 2 chargers play an increasingly important role as battery size increases, to the point that Volt users in our study used Level 2 as much as Leaf drivers. Although more than half of Leaf users in our study used fast charging at some point during the year, it did not account for a great number of kWh. Prius owners were the least likely to use public charging as shown in Figure 27.
0
500
1000
1500
2000
2500
3000
Prius Energi Volt Leaf
Annual KWh By Charging Type
Annual Mean L1 kWh Consumption Annual Mean L2 kWh ConsumptionAnnual Mean DC Fast kWh Consumption

31
Figure 27 Energy used while charging across location type for participant households
Leaf users were the most likely to get the electricity from public locations even though Ford Energi owners plugged in more frequently as shown in Figure 22. This has implications for charging infrastructure energy costs if larger battery BEVs will switch more electricity to public locations as the ability to store it increases. Pricing in this case will have a greater role to reduce the demand for public charging of BEV200s. Conversely, the number of chargers (corresponding to charging events) necessary to serve PHEV20 vehicles is the highest, essentially switching costs from the vehicle to the infrastructure needed to get high eVMT. The energy cost is highest for the Leaf.
We can also see the time of use implications for different levels of charging Figure 28.
0
500
1000
1500
2000
2500
3000
Prius Energi Volt Leaf
Annual KWh By Location
Annual Mean Home kWh Consumption Annual Mean Public kWh Consumption

32
Figure 28 Charging start time as a function of level of charging
The first feature of this graph is that the starting hour of level 1 charging is generally after a person returns home for the day. In order to get enough charge a user must start early, but at 5-6 PM the electrical grid is likely to be under stress from other loads. Level 2 has two main time periods: timed charging after midnight and upon arriving to work at 7-8 AM. Level 2 shows promise for the ability to shift the time of charging to times where ample distribution and generation capacity exists. DC Fast used by Leafs (Figure 29) shows a usage patterns similar to Level 1, but for a different reason. The SOC is more likely to be low in the latter half of the day so charging is likely more necessary during those times (however, one user consistently used free fast charging at the beginning of the day). Charging at 5PM-6PM is likewise troublesome for the grid.
Mid
nigh
t 1 2 3 4 5 6 7 8 9 10 11N
oon 13 14 15 16 17 18 19 20 21 22 23
Start Hour
Start Hour by Charging Level
Level 1 Level 2 DC Fast

33
Figure 29 Charging start time for DC fast charging
Local Emissions and Cold Starts Because the data collected is second-by-second for many parameters we can monitor the existing conditions when an engine starts in a PHEV. This is important as the criteria pollutants are worse when an engine has to provide power (high-power cold start) versus starting up and beginning a journey under low power[9]. The typically lower power requirements of a gasoline engine in ICE vehicles at the beginning of a trip means that there is an opportunity to warm up before significant power is applied. In a PHEV, the first time an engine starts may be when power is required, negating the environmental benefits of reducing petroleum consumption. For example, if criteria pollutants were 5 times worse in a high-power cold start, a conventional vehicle with 4 times as many engine starts might be better from a criteria pollutant perspective than a plug-in hybrid with high-power cold starts. We summarize our preliminary results in Figure 30.
Mid
nigh
t 1 2 3 4 5 6 7 8 9 10 11N
oon 13 14 15 16 17 18 19 20 21 22 23
DC Fast Start Hour
DC Fast

34
Figure 30 SOC at the time of engine start
First we defined the percent of trips that are all electric with no engine starts. This scale is on the right. For example 87% of all Volt trips had no engine start while 23% of Prius trips had no engine start (they were typically very short trips). Of the 77% of Plug in Prius trips with an engine start, we grouped by how long the engine had been off in minutes. 720 minutes represents 12 hours and is considered a cold start by most researchers with variation of warm starts depending on the minutes the engine is idle. We then separated all engine starts into high and low SOC, if the SOC is high this can mean there is energy available in the battery, but the electric propulsion is unable to provide enough power initiating a cold start. The other possibility is user commanded engine operation though pressing mode buttons on the dash or user interface. All Volt high SOC starts are user commanded as are many of those in the Ford Fusion Energi and C-Max Energi. The starts in the Prius are less likely to be user initiated as the electric motor is small and driver demand frequently requires additional power from the gasoline engine. Over 15% of Plug-in Prius engine starts in phase 1.0 of the study were likely high-power cold starts. The implication of this is that blended operation may negate some of the emissions benefits of plug-in hybrids.
Soak Time (minutes)
eTrips
Preliminary

35
Conclusions Research is still ongoing, but the storehouse of data allows a path to address policy questions regarding plug in vehicles as they arise. The project continues to adapt to new technologies and policy relevant questions.
Results from the first year of the study provide some insights into the project goals. For GHG reductions, PHEVs with efficient gasoline engines provide benefits in the household context when the alternative is an inefficient ICE; on a household GHG basis, some Plug-in Prius households have lower GHG emissions than households with longer range PEVs. However as the electric grid becomes less GHG intensive in the future, the potential GHG benefits of longer electric range BEVs and PHEVs increase. Additionally, as BEV range grows, the survey shows that households with longer range BEVs displace the use of their ICE on these long trips. By comparison households with short range BEVs must rely on a less efficient ICE for longer trips.
For local criteria pollutant emissions, the results suggest that blended PHEVs may not be superior to conventional vehicles, at least in some cases, due to high-power cold starts, but criteria emissions benefits of large battery PHEVs and BEVs appear to be clearer. However, on a household basis, cold starts from other household vehicles may change this dynamic, and have not yet been accounted for in this study.
Plug in behavior is a focus of this research as it helps understand how vehicle technology may be used to achieve environmental and air quality goals. Paradoxically, PHEV participants in our study with larger batteries plugged in more than PHEVs with smaller batteries. Presumably, PHEVs with smaller batteries would need to plug in more than those with larger batteries. Upon further investigation with survey data, we found that the range recovered per charging event was a significant factor in the decision to plug in. Those PHEVs with longer range had a higher maximum potential, possibly explaining this paradox. Also from survey evidence, we found that lower range PHEVs were more likely to never be plugged in compared to PHEVs with longer range. These results suggest that electric range in PHEVs is not an exogenous variable in the motivation to plug in.
Finally, to the question of household travel, the data presented in this report show that users maximize daily travel within the electric range of their vehicle. This was true for both BEVs and PHEVs. Additionally, when charging is available, especially at the workplace, some PHEV users were able to greatly increase their eVMT. It’s not clear how much of this maximization is a result of a household matching a vehicle purchase to driving patterns or the reverse. It suggests however that as the electric range of future vehicles increases, maximization within that range will occur through purchase and use. For days where a vehicle travels over 200 miles, we see range as a limitation in BEVs. No Leafs in our small sample traveled more than 200 miles in one day and no Leaf travelled more than 80 miles from home. Survey data on other BEVs with more than 200 miles range showed that these vehicles were driven frequently over this 200 mile threshold.

36
The vehicles in this repot represent the first step, but also highlight the need to eventually address the needs of all household travel with cleaner vehicles. PHEVs appear to have a role and be the right choice for some household situations, and the benefits in terms of eVMT increase as PHEV electric range increases. Short range BEVs such as the Leaf have a role, but households in this study rely on other household vehicles for longer trips. Longer range BEVs show the potential to displace those other household ICE vehicles effectively.

37
References 1 Tal, Gil and Michael A. Nicholas. 2013. Studying the Pev Market in California: Comparing the Pev,
Phev and Hybrid Markets. In EVS27 Internatioanl Battery, Hybrid and Fuel Cell Electric Vehcile Symposium, 1.
2 CalTrans. 2013. 2010-2012 California Household Travel Survey Available from http://www.dot.ca.gov/hq/tsip/otfa/tab/chts_travelsurvey.html Date Accessed June 1, 2014
3 United States Census Bureau. 2016. In American Fact Finder, 2016 Available from https://factfinder.census.gov/faces/tableservices/jsf/pages/productview.xhtml?src=bkmk
4 United States Census Bureau. 2013 Urbanized Areas Cartographic Boundary Files. Accessed July 2014 2014. Available from https://www.census.gov/geo/maps-data/data/cbf/cbf_ua.html.
5 Carlson, Richard , Shawn Salisbury, Matt Shirk, and John Smart. 2014, Evmt Analysis of on-Road Data from Plug-in Hybrid Electric Vehicles and All-Electric Vehicles: Idaho National Laboratory, INL/MIS-14-32984.
6 Nicholas, Michael and Tal Gil. 2016, January 10-14. Evmt in the Household Fleet: Integrating Battery Electric Vehicles into Household Travel. In Transportation Reserch Board. Washington DC.
7 Anair, Don and Amine Mahmassani. 2012. State of Charge. Union of Concerned Scientists Available From http://www.ucsusa.org/assets/documents/clean_vehicles/electric-car-global-warming-emissions-report.pdf.
8 Tal, Gil, Michael Nicholas, and Thomas Turrentine. 2016, First Look at the Plug-in Vehicle Secondary MarketDavis, CA: Institute of Transportation Studies, University of California, Davis. UCD-ITS-WP-16-02.
9 Hart, Ryan. 2016. Analysis of Plug-in Electric Vehicle Usage. In Advanced Clean Cars Symposium. SCAQMD Diamond Bar, California. Available From https://www.arb.ca.gov/msprog/consumer_info/advanced_clean_cars/oem_pev_driving_and_charging_characteristics_ryan_hart.pdf