advanced reporting in the online report designer - sap · advanced reporting in the online report...
TRANSCRIPT
SuccessFactors HCM Suite CUSTOMER
November 2014 ReleaseVersion: 1.0 - December 5, 2014
Advanced Reporting in the Online Report DesignerAdministration Guide
Content1 Change History. . . . . . . . . . . . . . . . . . . . . . . . . . . . . . . . . . . . . . . . . . . . . . . . . . . . . . . . . . . . . . . . 3
2 Overview. . . . . . . . . . . . . . . . . . . . . . . . . . . . . . . . . . . . . . . . . . . . . . . . . . . . . . . . . . . . . . . . . . . . . 42.1 Capabilities and Limitations. . . . . . . . . . . . . . . . . . . . . . . . . . . . . . . . . . . . . . . . . . . . . . . . . . . . . . . . 4
3 Creating a New Report. . . . . . . . . . . . . . . . . . . . . . . . . . . . . . . . . . . . . . . . . . . . . . . . . . . . . . . . . . 6
4 List Report Components. . . . . . . . . . . . . . . . . . . . . . . . . . . . . . . . . . . . . . . . . . . . . . . . . . . . . . . . 104.1 Building a New Query. . . . . . . . . . . . . . . . . . . . . . . . . . . . . . . . . . . . . . . . . . . . . . . . . . . . . . . . . . . . 12
4.1.1 Additional Features. . . . . . . . . . . . . . . . . . . . . . . . . . . . . . . . . . . . . . . . . . . . . . . . . . . . . . 23
5 Running a List Report. . . . . . . . . . . . . . . . . . . . . . . . . . . . . . . . . . . . . . . . . . . . . . . . . . . . . . . . . . 295.1 Using List Report Filters. . . . . . . . . . . . . . . . . . . . . . . . . . . . . . . . . . . . . . . . . . . . . . . . . . . . . . . . . .305.2 Using Date Options. . . . . . . . . . . . . . . . . . . . . . . . . . . . . . . . . . . . . . . . . . . . . . . . . . . . . . . . . . . . . 33
6 Pivots Overview. . . . . . . . . . . . . . . . . . . . . . . . . . . . . . . . . . . . . . . . . . . . . . . . . . . . . . . . . . . . . . .356.1 Creating Pivot Tables. . . . . . . . . . . . . . . . . . . . . . . . . . . . . . . . . . . . . . . . . . . . . . . . . . . . . . . . . . . .366.2 Creating Pivot Charts. . . . . . . . . . . . . . . . . . . . . . . . . . . . . . . . . . . . . . . . . . . . . . . . . . . . . . . . . . . 40
7 Report Designer Tips. . . . . . . . . . . . . . . . . . . . . . . . . . . . . . . . . . . . . . . . . . . . . . . . . . . . . . . . . . 42
8 Sharing Reports. . . . . . . . . . . . . . . . . . . . . . . . . . . . . . . . . . . . . . . . . . . . . . . . . . . . . . . . . . . . . . 458.1 Report Menu Security. . . . . . . . . . . . . . . . . . . . . . . . . . . . . . . . . . . . . . . . . . . . . . . . . . . . . . . . . . . 458.2 Report Ownership, Editing, and Distribution. . . . . . . . . . . . . . . . . . . . . . . . . . . . . . . . . . . . . . . . . . . .46
2C U S T O M E R© 2014 SAP SE or an SAP affiliate company. All rights reserved.
Advanced Reporting in the Online Report DesignerContent
1 Change HistoryThe following table provides a historical overview of the most important changes made to this document since its initial publication.
Version Release Date Description
1.0 August 2014 Initial version
2.0 November 2014 No changes
Advanced Reporting in the Online Report DesignerChange History
C U S T O M E R© 2014 SAP SE or an SAP affiliate company. All rights reserved. 3
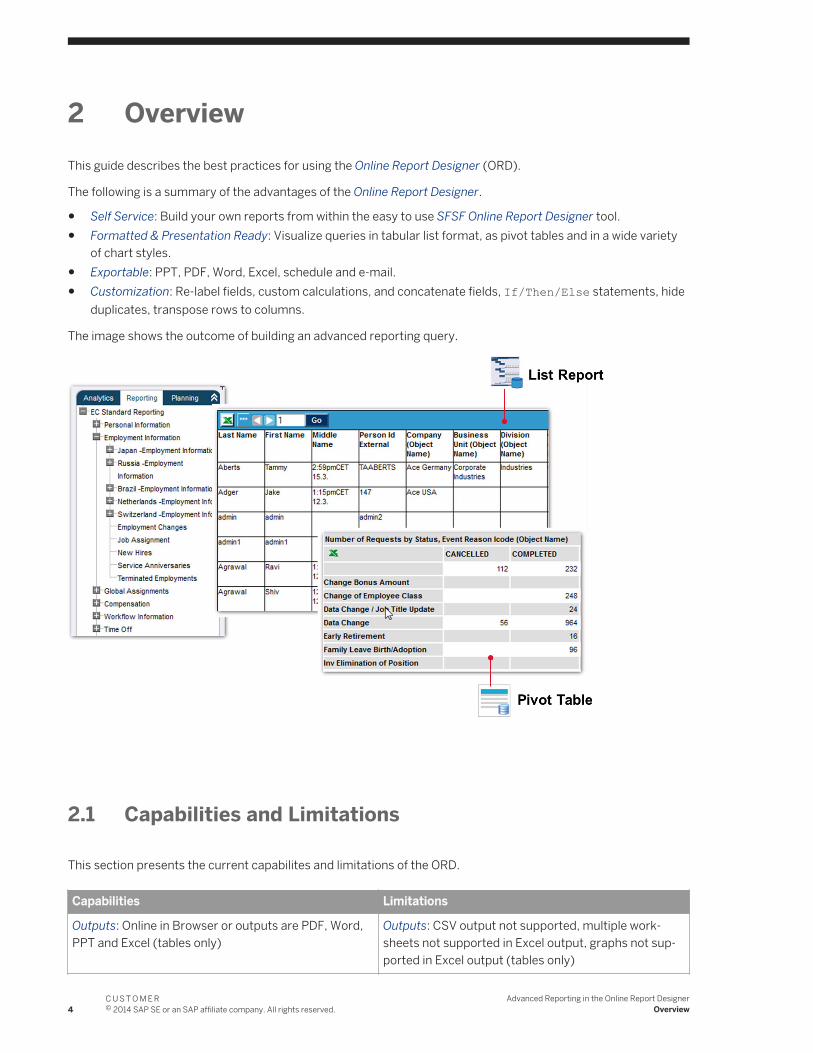
2 OverviewThis guide describes the best practices for using the Online Report Designer (ORD).
The following is a summary of the advantages of the Online Report Designer.
● Self Service: Build your own reports from within the easy to use SFSF Online Report Designer tool.● Formatted & Presentation Ready: Visualize queries in tabular list format, as pivot tables and in a wide variety
of chart styles.● Exportable: PPT, PDF, Word, Excel, schedule and e-mail.● Customization: Re-label fields, custom calculations, and concatenate fields, If/Then/Else statements, hide
duplicates, transpose rows to columns.
The image shows the outcome of building an advanced reporting query.
2.1 Capabilities and Limitations
This section presents the current capabilites and limitations of the ORD.
Capabilities Limitations
Outputs: Online in Browser or outputs are PDF, Word, PPT and Excel (tables only)
Outputs: CSV output not supported, multiple worksheets not supported in Excel output, graphs not supported in Excel output (tables only)
4C U S T O M E R© 2014 SAP SE or an SAP affiliate company. All rights reserved.
Advanced Reporting in the Online Report DesignerOverview

Capabilities Limitations
Components:
● Display data as list of transactions/records● Pivot Table (avg, sum, count, min, max)● Pivot Chart (avg, sum, count, min, max)
Customization:
● Override field names● Calculated columns (custom number formulas,
custom date formulas & text concatenation)
Date Filtering: As of Date and Date Ranges built into EC reporting
Data Manipulation: Supports If/Then/Else statements Data Manipulation: Does not support the writing of SQL statements within the queries
Data Manipulation:
● Data joining: Cross Domain/Data joins not currently supported
● Transposition: Transpose data from rows to columns
Runtime: Runtime Filters & Runtime People Scope
Report Design: Supports custom page layouts, multiple pages, formatting, images, text
Scheduling/Distribution: Supports scheduling reports offline via email of PDF through Report Distributor (end user facing tool)
Scheduling/Distribution: Does not currently support FTP scheduling or run offline to excel/non-PDF formats
Publish & Share Reports: Visibility of the reports can be set for a defined group/role
Actionable Analytics: Take action on a field by selecting User in report and link to other parts of the suite (eg. employee profile).
Bonus for WFA clients: Ability to display operational data from Ad hoc and metrics from WFA/TI into the same report
Advanced Reporting in the Online Report DesignerOverview
C U S T O M E R© 2014 SAP SE or an SAP affiliate company. All rights reserved. 5

3 Creating a New ReportThis section describes the creation of a new report.
Procedure
1. Navigate to the Report Designer. Go to Home Analytics .2. Choose Report Designer from the Tools panel.
NoteThis is a demo Portal Page (this landing page is customizable).
3. In the Manage Reports panel, choose New Report to create a new report, or Add page to either add a new page or copy an existing one.
6C U S T O M E R© 2014 SAP SE or an SAP affiliate company. All rights reserved.
Advanced Reporting in the Online Report DesignerCreating a New Report
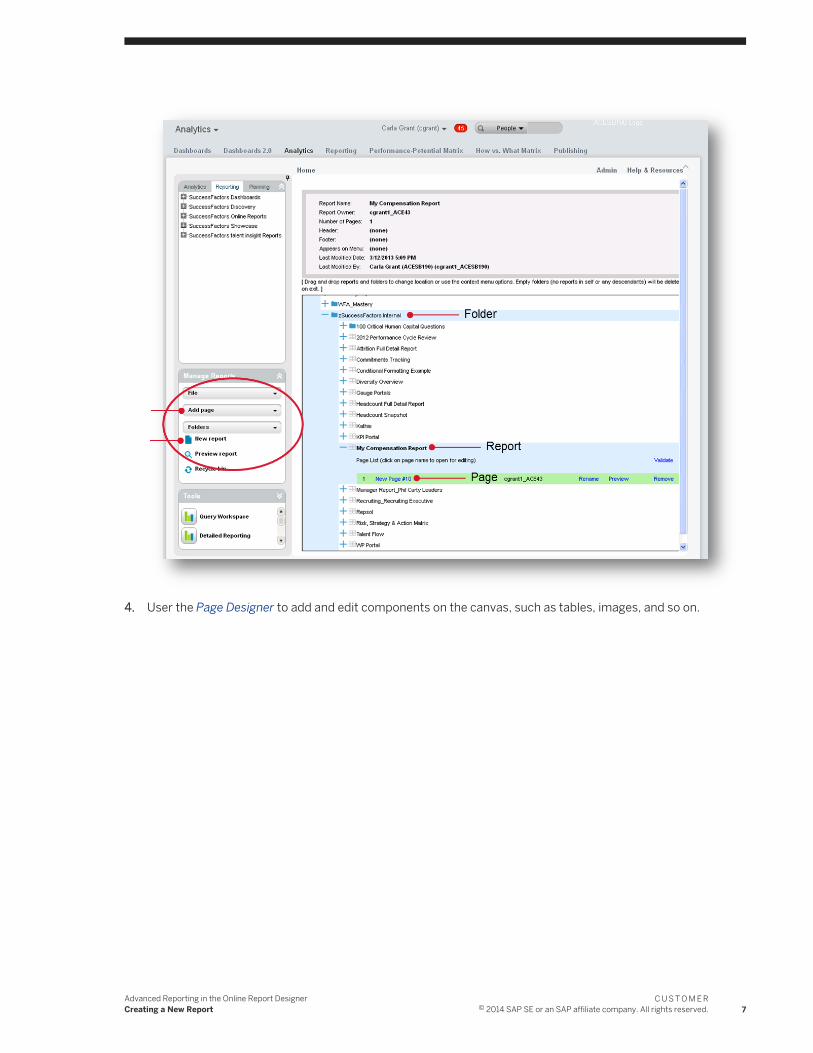
4. User the Page Designer to add and edit components on the canvas, such as tables, images, and so on.
Advanced Reporting in the Online Report DesignerCreating a New Report
C U S T O M E R© 2014 SAP SE or an SAP affiliate company. All rights reserved. 7
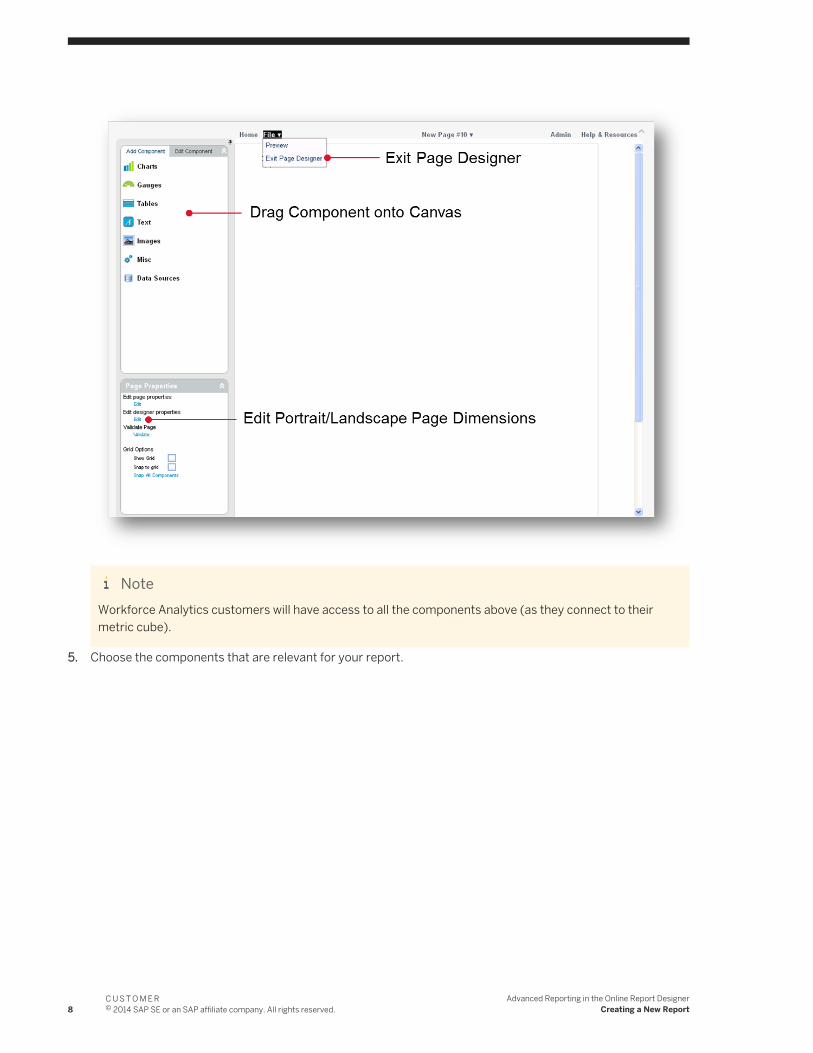
NoteWorkforce Analytics customers will have access to all the components above (as they connect to their metric cube).
5. Choose the components that are relevant for your report.
8C U S T O M E R© 2014 SAP SE or an SAP affiliate company. All rights reserved.
Advanced Reporting in the Online Report DesignerCreating a New Report
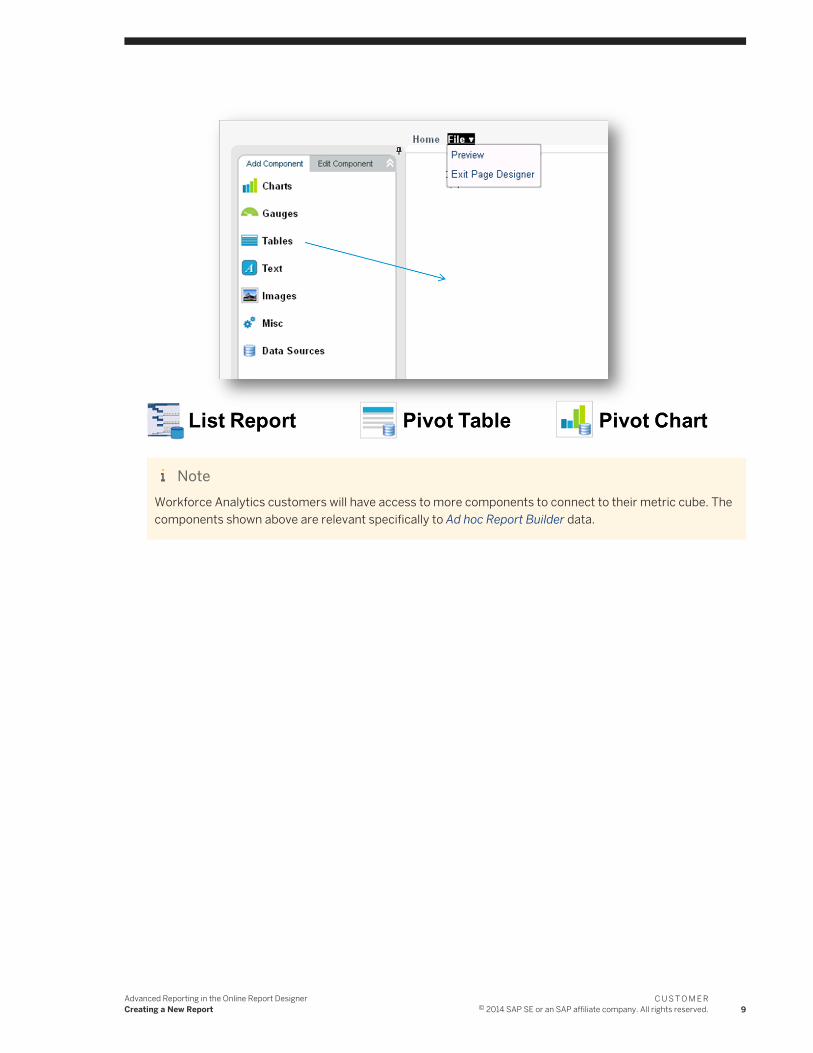
NoteWorkforce Analytics customers will have access to more components to connect to their metric cube. The components shown above are relevant specifically to Ad hoc Report Builder data.
Advanced Reporting in the Online Report DesignerCreating a New Report
C U S T O M E R© 2014 SAP SE or an SAP affiliate company. All rights reserved. 9

4 List Report ComponentsThis section describes the list report components and the process for creating a new query or opening and editing an existing one.
1. Go to Tables List Report , and add the list component to the page.2. Right click and choose Edit this component.
3. Choose Select to build a new query or to choose a pre-saved query.
The following is an overview of how to build a new query and is described in detail in the next topic.
10C U S T O M E R© 2014 SAP SE or an SAP affiliate company. All rights reserved.
Advanced Reporting in the Online Report DesignerList Report Components
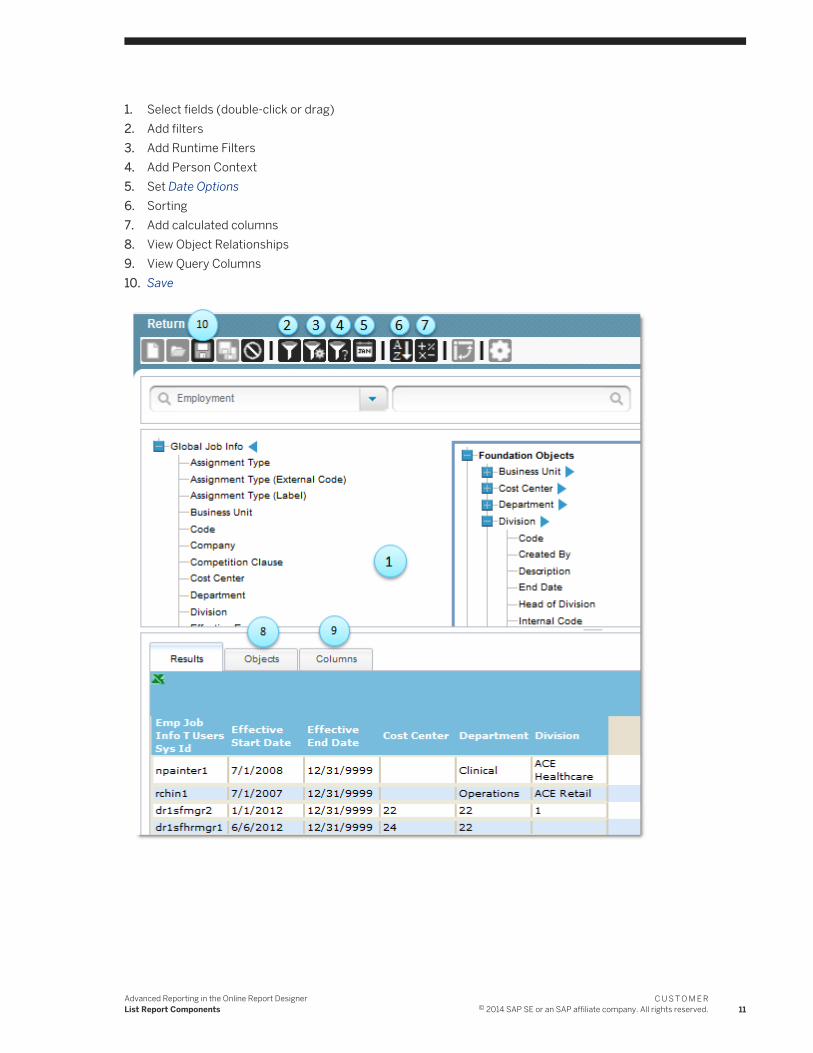
1. Select fields (double-click or drag)2. Add filters3. Add Runtime Filters4. Add Person Context5. Set Date Options6. Sorting7. Add calculated columns8. View Object Relationships9. View Query Columns10. Save
Advanced Reporting in the Online Report DesignerList Report Components
C U S T O M E R© 2014 SAP SE or an SAP affiliate company. All rights reserved. 11
4.1 Building a New Query
This section describes in detail the process for creating a new query.
Procedure
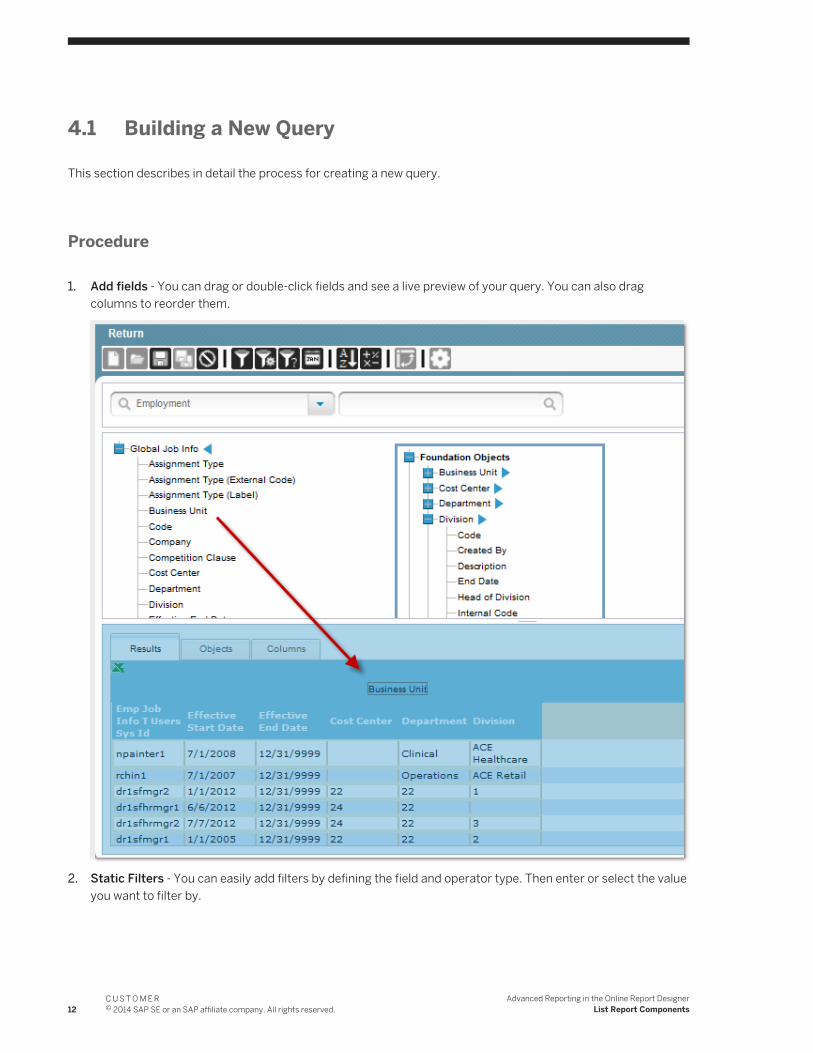
1. Add fields - You can drag or double-click fields and see a live preview of your query. You can also drag columns to reorder them.
2. Static Filters - You can easily add filters by defining the field and operator type. Then enter or select the value you want to filter by.
12C U S T O M E R© 2014 SAP SE or an SAP affiliate company. All rights reserved.
Advanced Reporting in the Online Report DesignerList Report Components
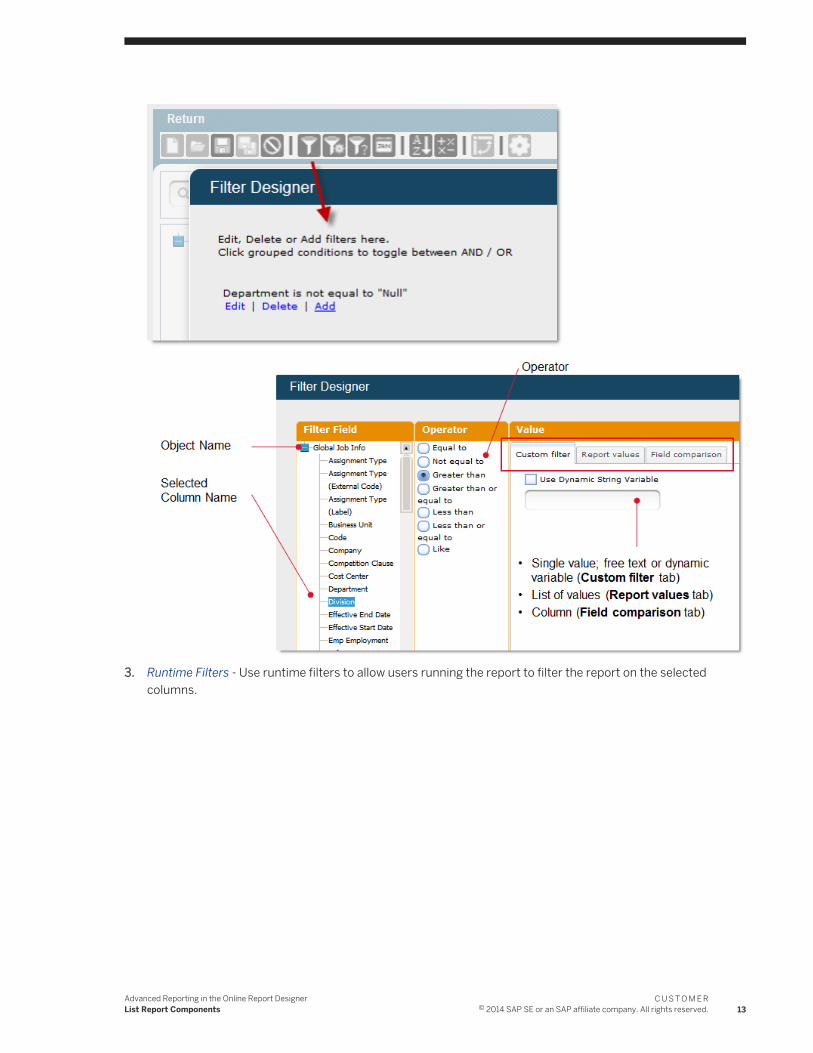
3. Runtime Filters - Use runtime filters to allow users running the report to filter the report on the selected columns.
Advanced Reporting in the Online Report DesignerList Report Components
C U S T O M E R© 2014 SAP SE or an SAP affiliate company. All rights reserved. 13
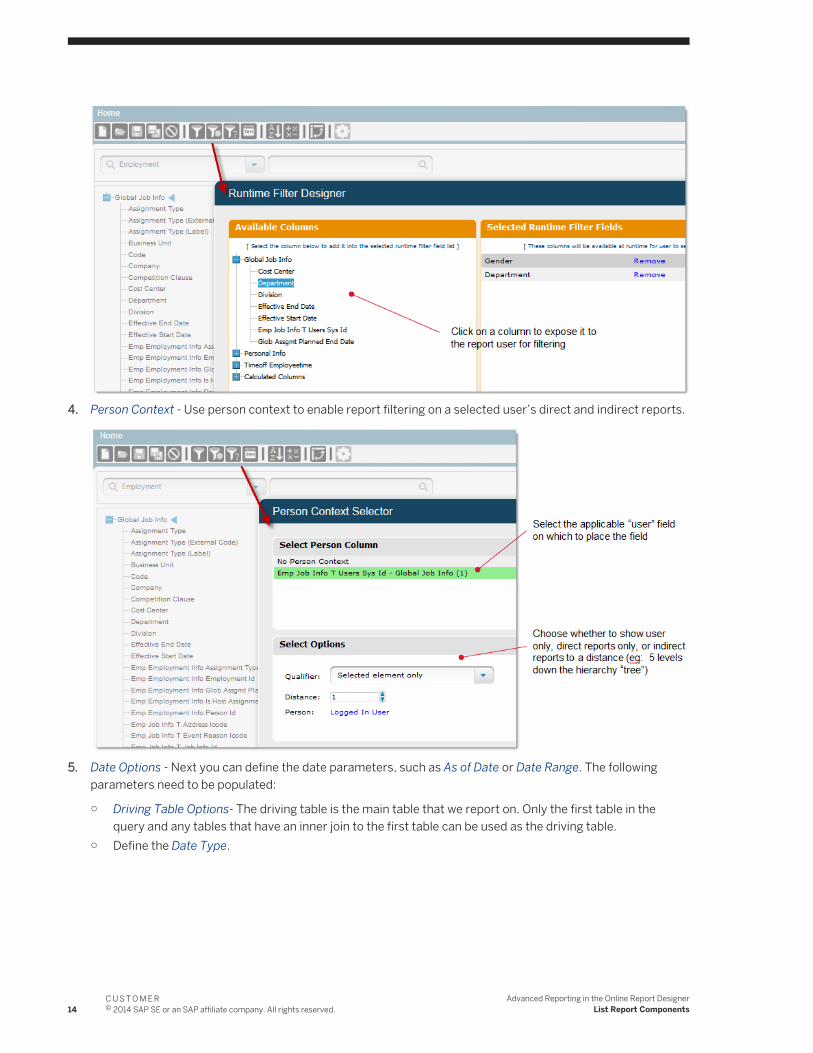
4. Person Context - Use person context to enable report filtering on a selected user’s direct and indirect reports.
5. Date Options - Next you can define the date parameters, such as As of Date or Date Range. The following parameters need to be populated:
○ Driving Table Options- The driving table is the main table that we report on. Only the first table in the query and any tables that have an inner join to the first table can be used as the driving table.
○ Define the Date Type.
14C U S T O M E R© 2014 SAP SE or an SAP affiliate company. All rights reserved.
Advanced Reporting in the Online Report DesignerList Report Components
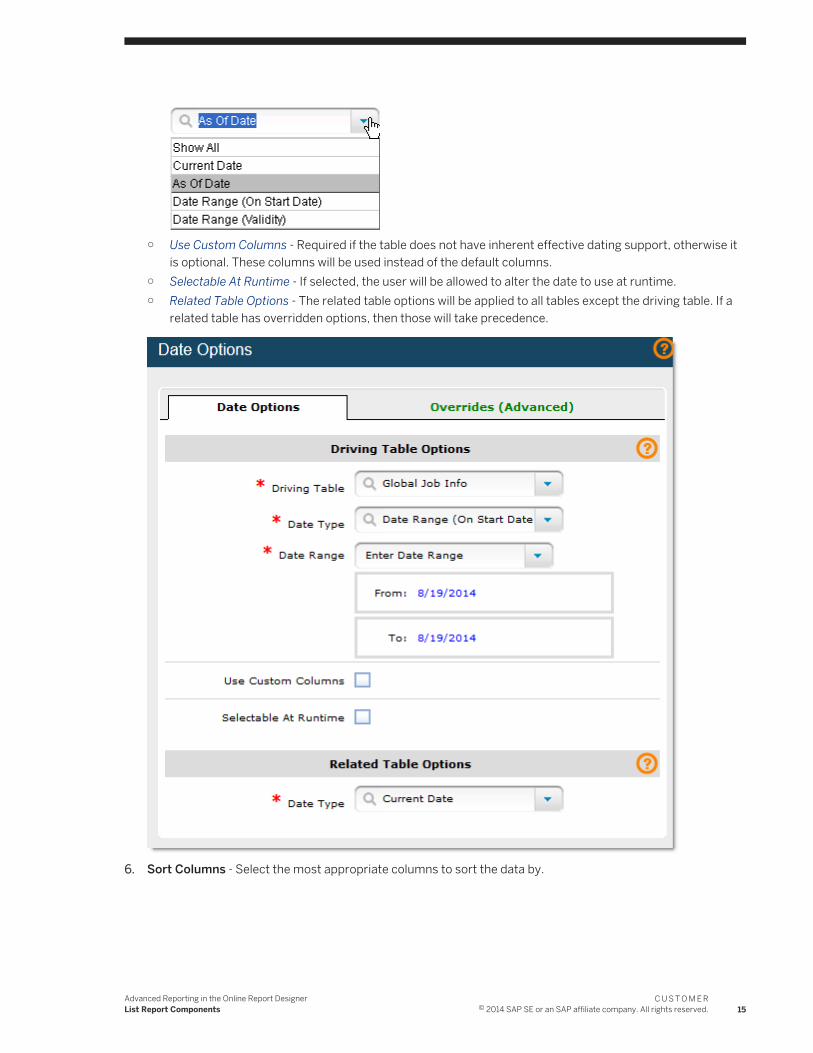
○ Use Custom Columns - Required if the table does not have inherent effective dating support, otherwise it is optional. These columns will be used instead of the default columns.
○ Selectable At Runtime - If selected, the user will be allowed to alter the date to use at runtime.○ Related Table Options - The related table options will be applied to all tables except the driving table. If a
related table has overridden options, then those will take precedence.
6. Sort Columns - Select the most appropriate columns to sort the data by.
Advanced Reporting in the Online Report DesignerList Report Components
C U S T O M E R© 2014 SAP SE or an SAP affiliate company. All rights reserved. 15
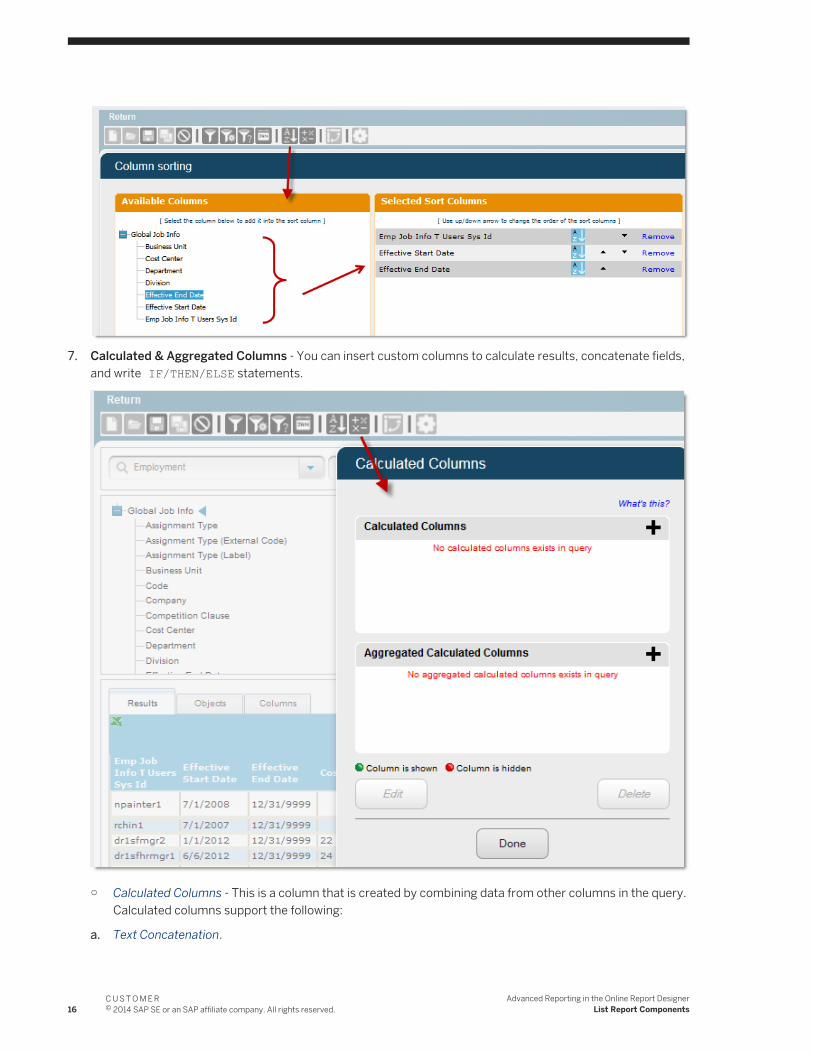
7. Calculated & Aggregated Columns - You can insert custom columns to calculate results, concatenate fields, and write IF/THEN/ELSE statements.
○ Calculated Columns - This is a column that is created by combining data from other columns in the query. Calculated columns support the following:
a. Text Concatenation.
16C U S T O M E R© 2014 SAP SE or an SAP affiliate company. All rights reserved.
Advanced Reporting in the Online Report DesignerList Report Components
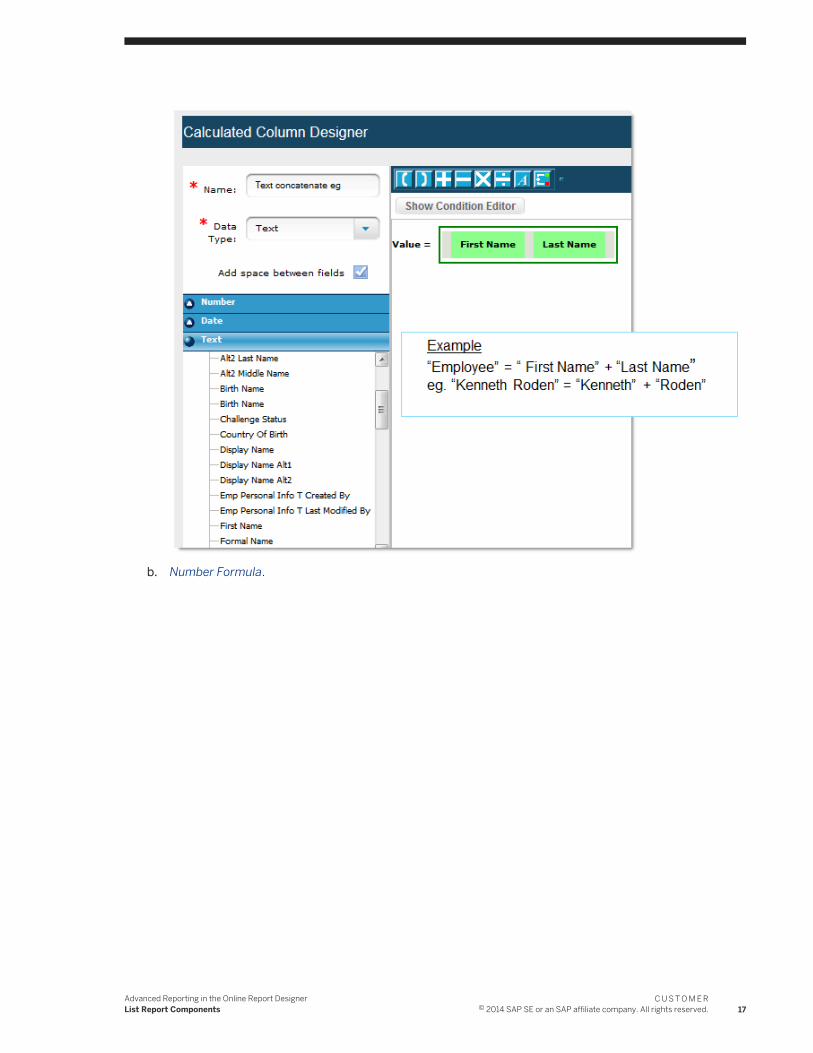
b. Number Formula.
Advanced Reporting in the Online Report DesignerList Report Components
C U S T O M E R© 2014 SAP SE or an SAP affiliate company. All rights reserved. 17
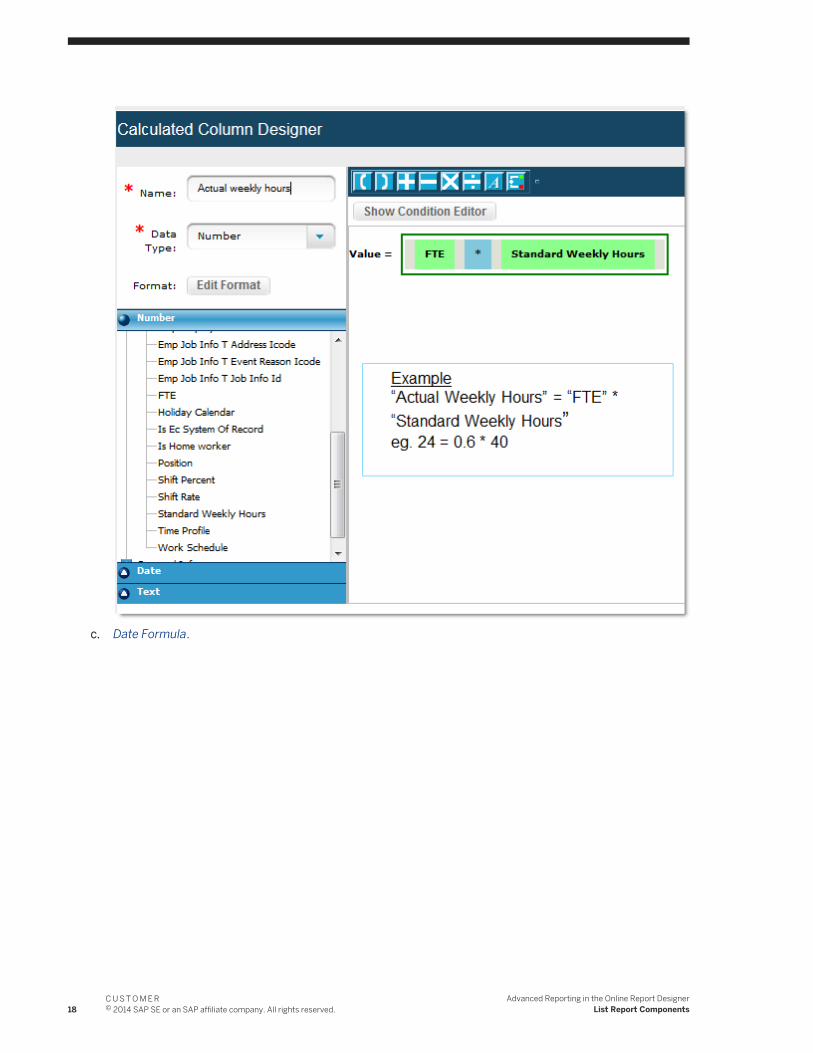
c. Date Formula.
18C U S T O M E R© 2014 SAP SE or an SAP affiliate company. All rights reserved.
Advanced Reporting in the Online Report DesignerList Report Components
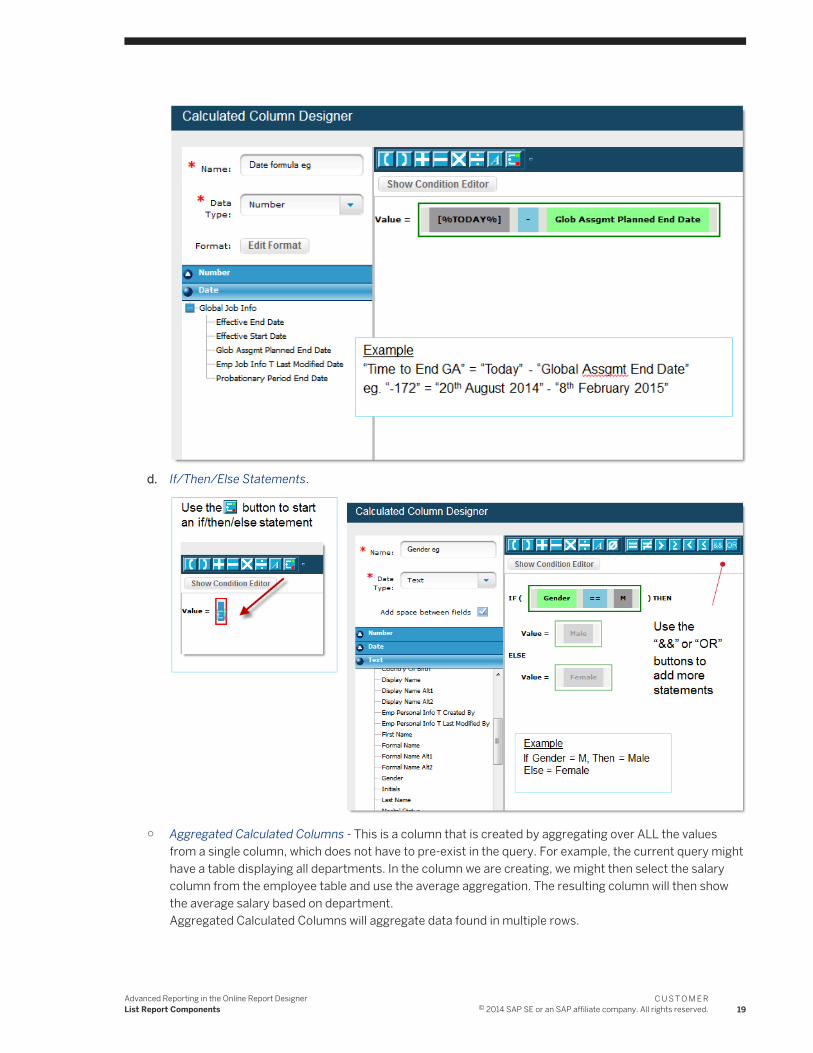
d. If/Then/Else Statements.
○ Aggregated Calculated Columns - This is a column that is created by aggregating over ALL the values from a single column, which does not have to pre-exist in the query. For example, the current query might have a table displaying all departments. In the column we are creating, we might then select the salary column from the employee table and use the average aggregation. The resulting column will then show the average salary based on department.Aggregated Calculated Columns will aggregate data found in multiple rows.
Advanced Reporting in the Online Report DesignerList Report Components
C U S T O M E R© 2014 SAP SE or an SAP affiliate company. All rights reserved. 19

Use the Aggregated Column wizard to step through building an aggregation.
8. Object Relationships - The Object view allows you to show and edit the object joins. Inner: Show all records from each object that match. Left: Show all records from the left object and only records that match from the other object.
20C U S T O M E R© 2014 SAP SE or an SAP affiliate company. All rights reserved.
Advanced Reporting in the Online Report DesignerList Report Components
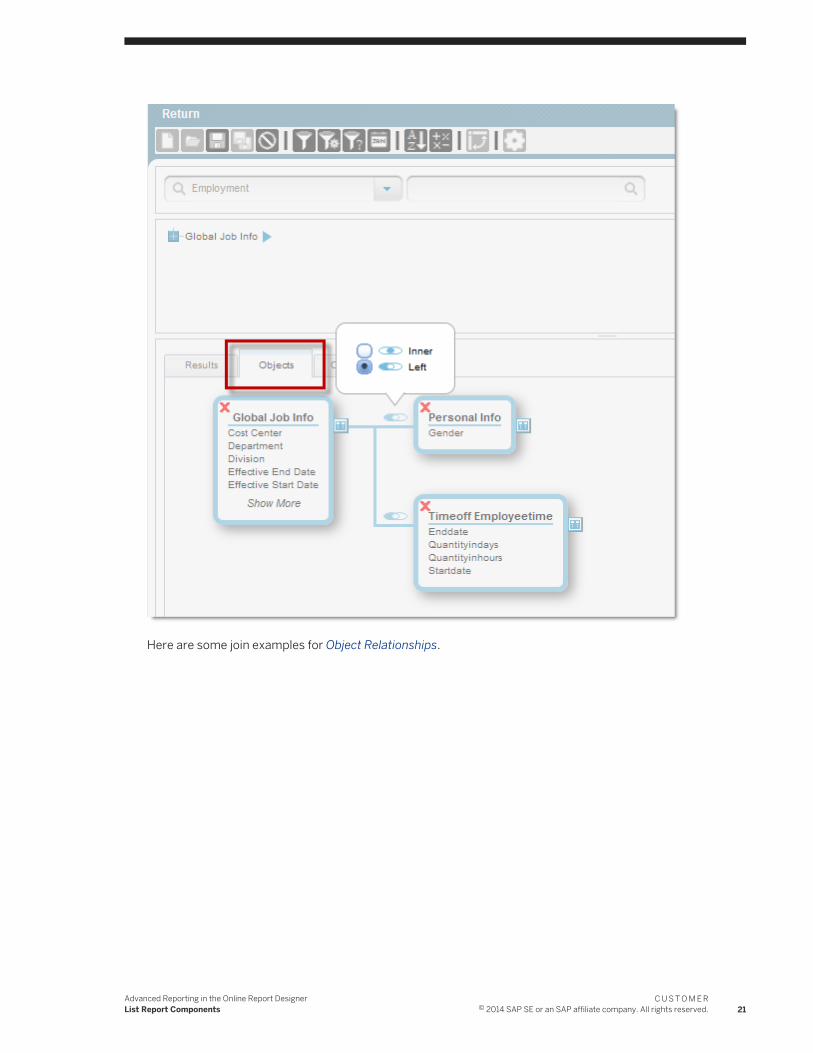
Here are some join examples for Object Relationships.
Advanced Reporting in the Online Report DesignerList Report Components
C U S T O M E R© 2014 SAP SE or an SAP affiliate company. All rights reserved. 21
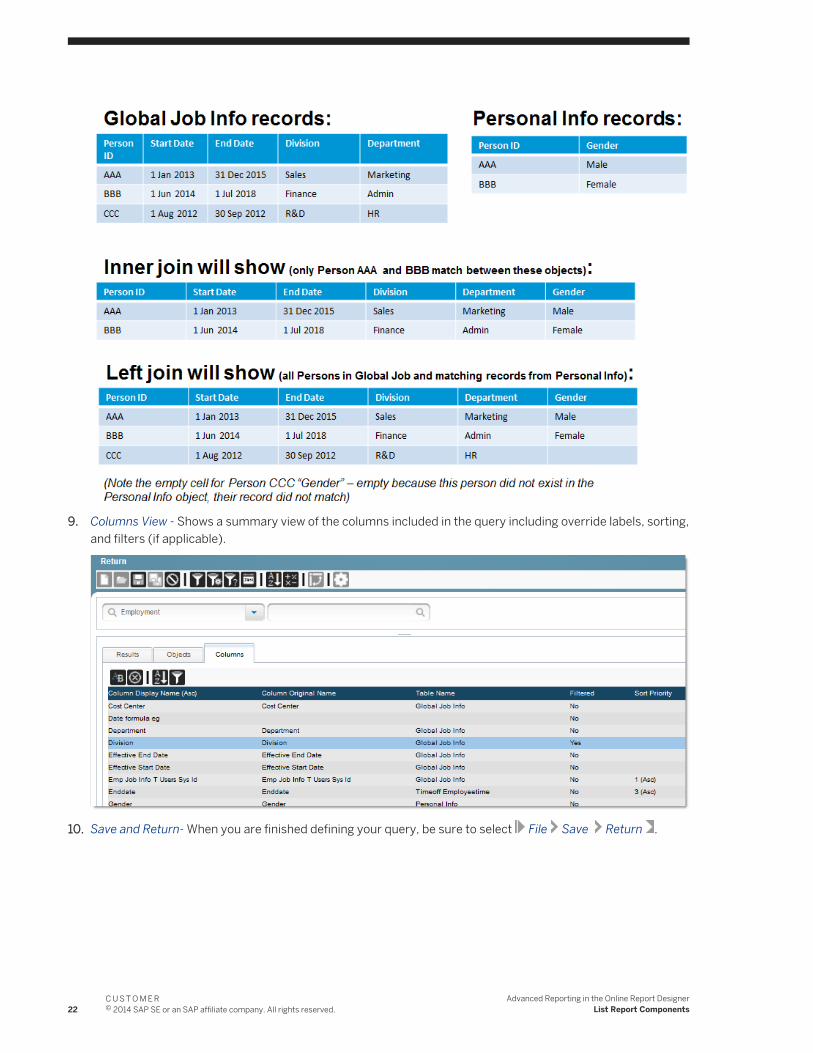
9. Columns View - Shows a summary view of the columns included in the query including override labels, sorting, and filters (if applicable).
10. Save and Return- When you are finished defining your query, be sure to select File Save Return .
22C U S T O M E R© 2014 SAP SE or an SAP affiliate company. All rights reserved.
Advanced Reporting in the Online Report DesignerList Report Components
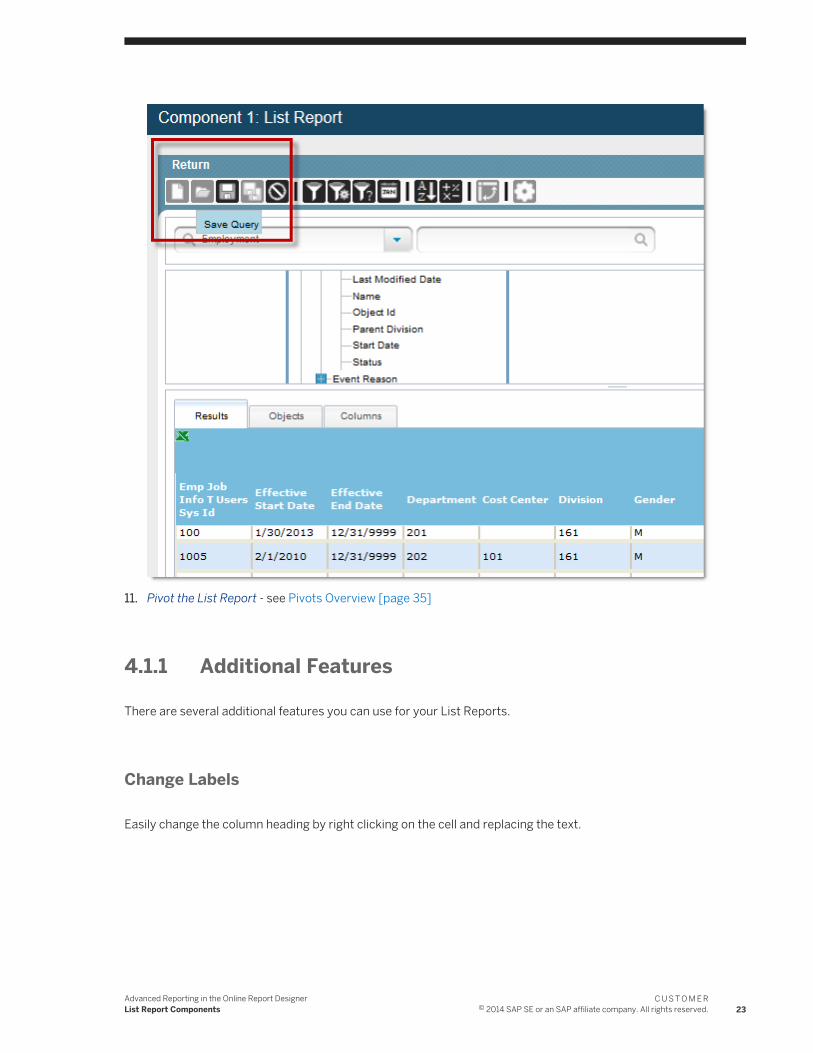
11. Pivot the List Report - see Pivots Overview [page 35]
4.1.1 Additional Features
There are several additional features you can use for your List Reports.
Change Labels
Easily change the column heading by right clicking on the cell and replacing the text.
Advanced Reporting in the Online Report DesignerList Report Components
C U S T O M E R© 2014 SAP SE or an SAP affiliate company. All rights reserved. 23
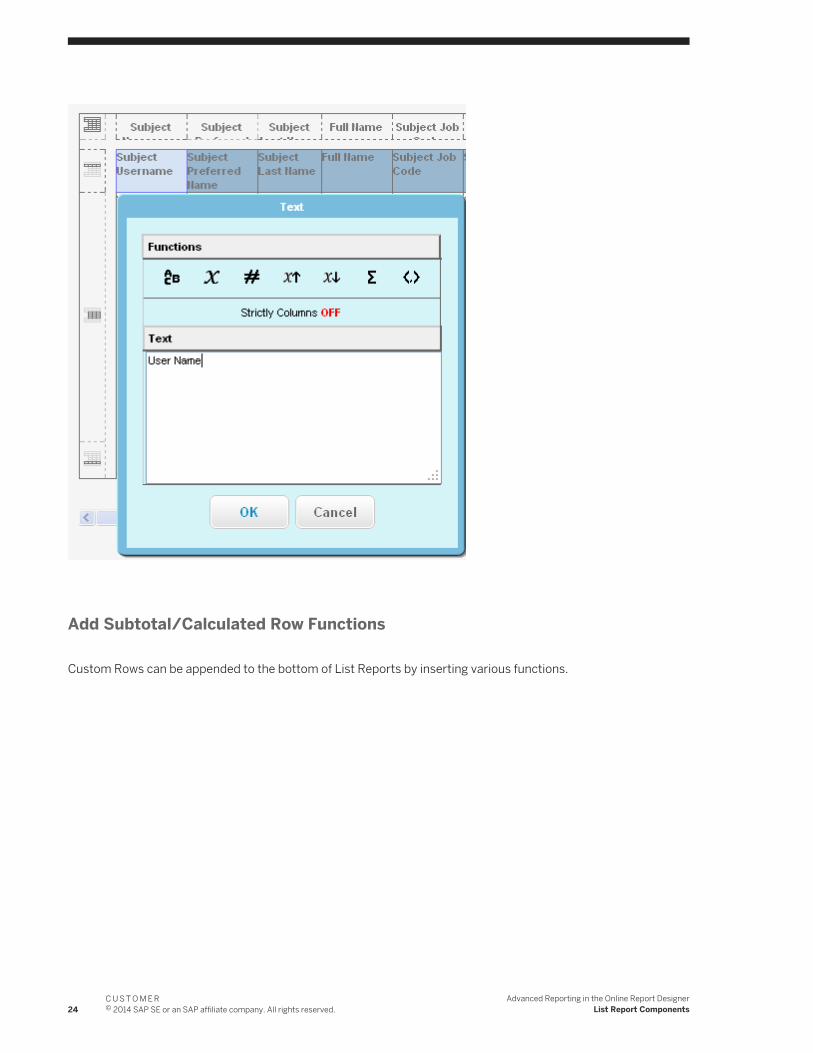
Add Subtotal/Calculated Row Functions
Custom Rows can be appended to the bottom of List Reports by inserting various functions.
24C U S T O M E R© 2014 SAP SE or an SAP affiliate company. All rights reserved.
Advanced Reporting in the Online Report DesignerList Report Components
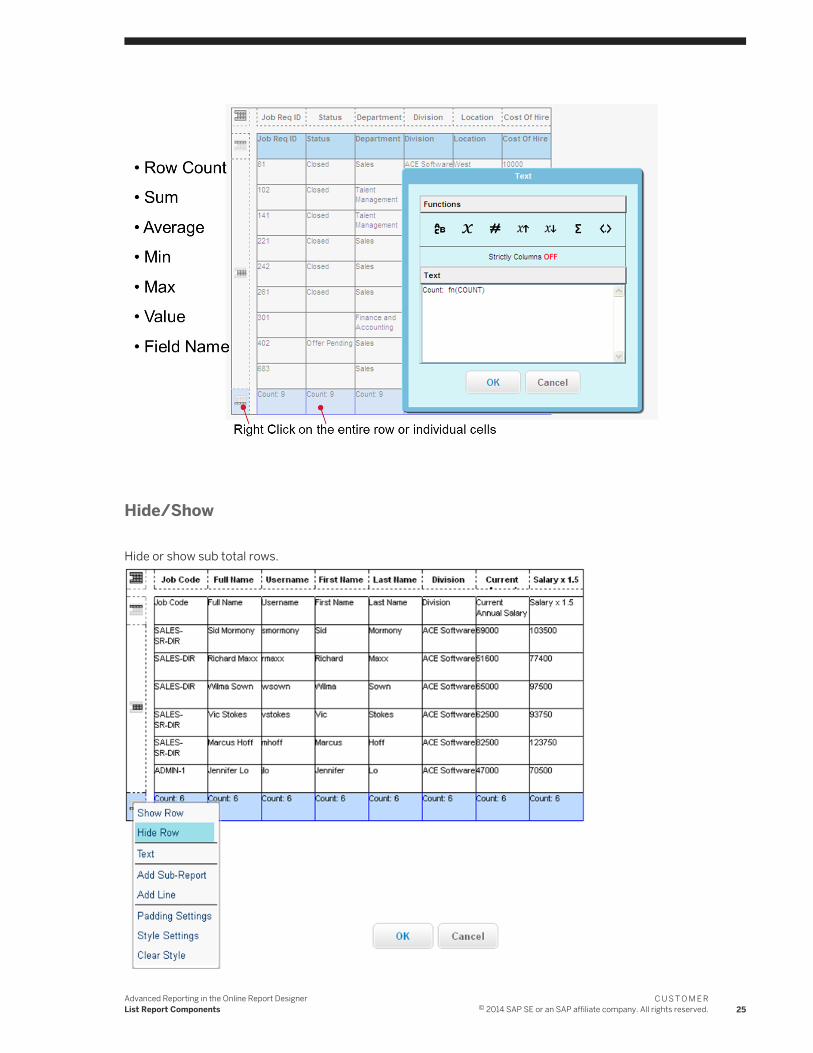
Hide/Show
Hide or show sub total rows.
Advanced Reporting in the Online Report DesignerList Report Components
C U S T O M E R© 2014 SAP SE or an SAP affiliate company. All rights reserved. 25

Group Rows
Right-click on the column you want to group by.
Form Based View
Move fields around the canvas to create a form type view.
26C U S T O M E R© 2014 SAP SE or an SAP affiliate company. All rights reserved.
Advanced Reporting in the Online Report DesignerList Report Components
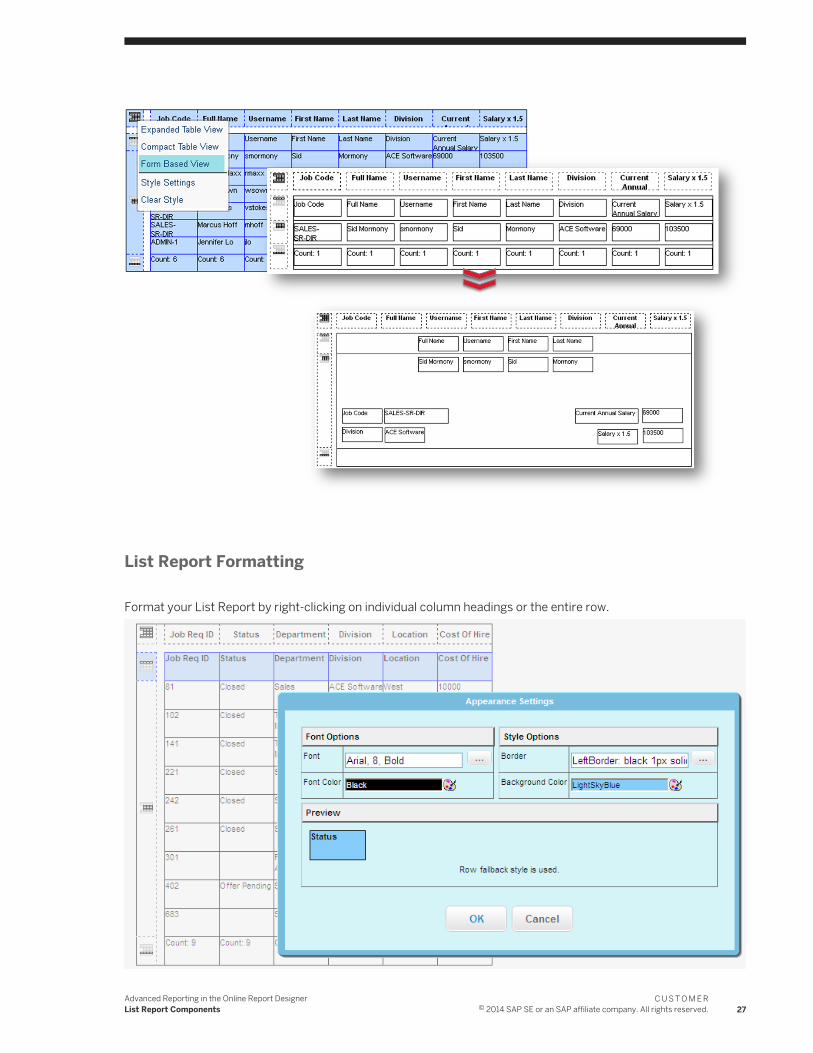
List Report Formatting
Format your List Report by right-clicking on individual column headings or the entire row.
Advanced Reporting in the Online Report DesignerList Report Components
C U S T O M E R© 2014 SAP SE or an SAP affiliate company. All rights reserved. 27
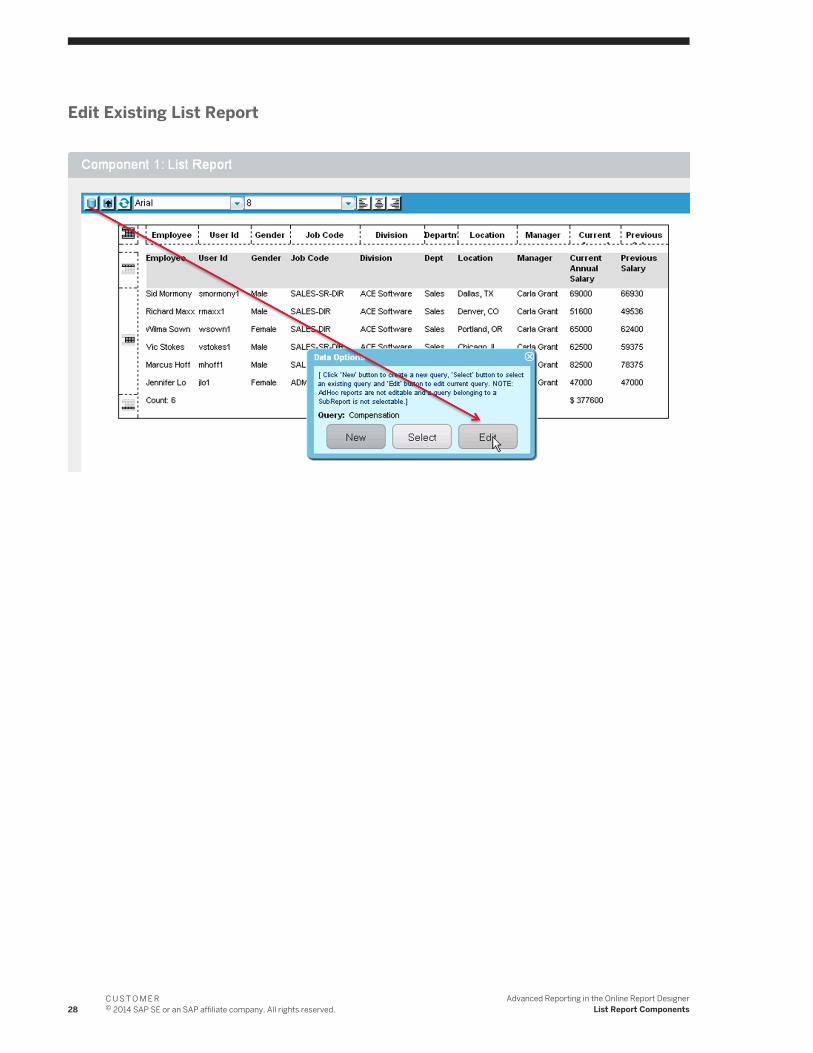
Edit Existing List Report
28C U S T O M E R© 2014 SAP SE or an SAP affiliate company. All rights reserved.
Advanced Reporting in the Online Report DesignerList Report Components
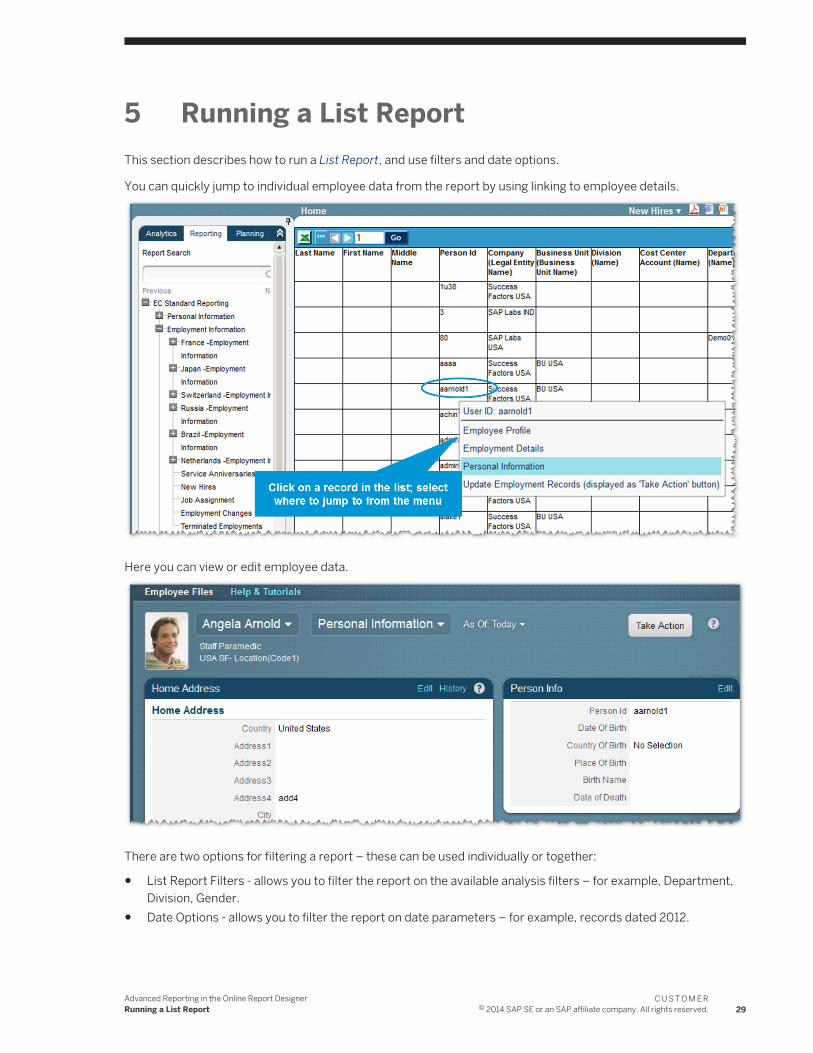
5 Running a List ReportThis section describes how to run a List Report, and use filters and date options.
You can quickly jump to individual employee data from the report by using linking to employee details.
Here you can view or edit employee data.
There are two options for filtering a report – these can be used individually or together:
● List Report Filters - allows you to filter the report on the available analysis filters – for example, Department, Division, Gender.
● Date Options - allows you to filter the report on date parameters – for example, records dated 2012.
Advanced Reporting in the Online Report DesignerRunning a List Report
C U S T O M E R© 2014 SAP SE or an SAP affiliate company. All rights reserved. 29

Related Information
Using List Report Filters [page 30]Using Date Options [page 33]
5.1 Using List Report Filters
This section describes how to use the List Report Filters.
List Report Filters
1. Select a column to filter.2. Select the value to filter on.
30C U S T O M E R© 2014 SAP SE or an SAP affiliate company. All rights reserved.
Advanced Reporting in the Online Report DesignerRunning a List Report
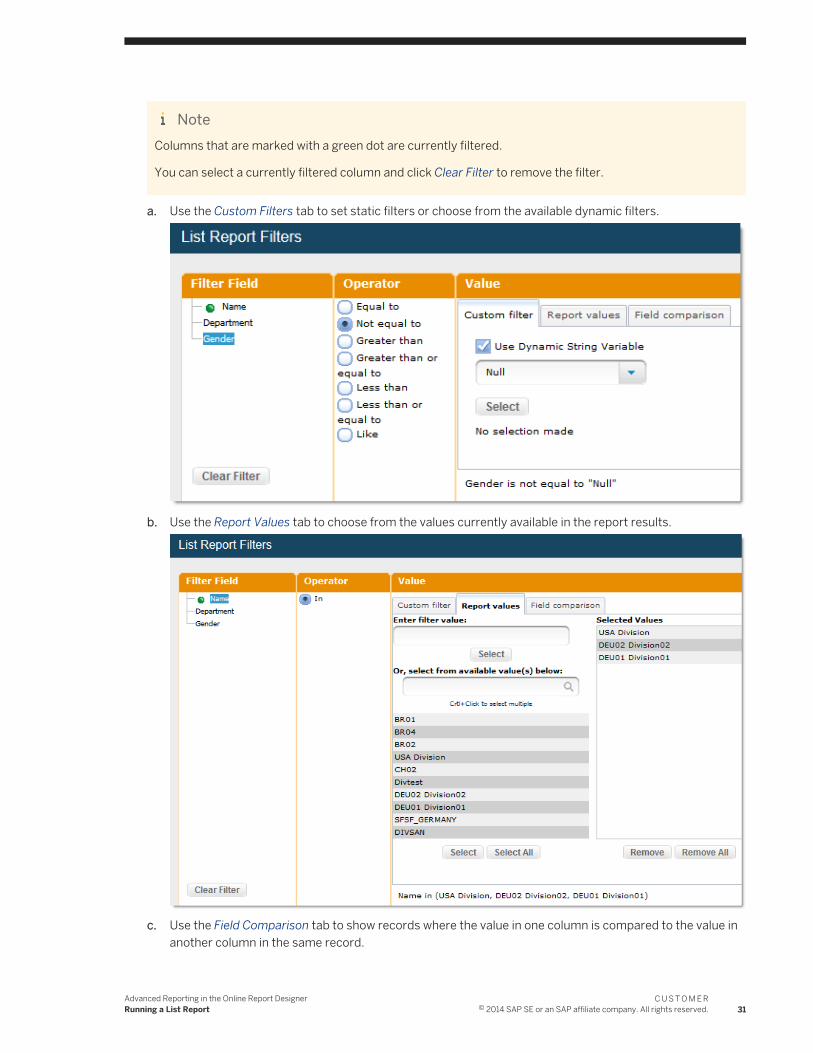
NoteColumns that are marked with a green dot are currently filtered.
You can select a currently filtered column and click Clear Filter to remove the filter.
a. Use the Custom Filters tab to set static filters or choose from the available dynamic filters.
b. Use the Report Values tab to choose from the values currently available in the report results.
c. Use the Field Comparison tab to show records where the value in one column is compared to the value in another column in the same record.
Advanced Reporting in the Online Report DesignerRunning a List Report
C U S T O M E R© 2014 SAP SE or an SAP affiliate company. All rights reserved. 31
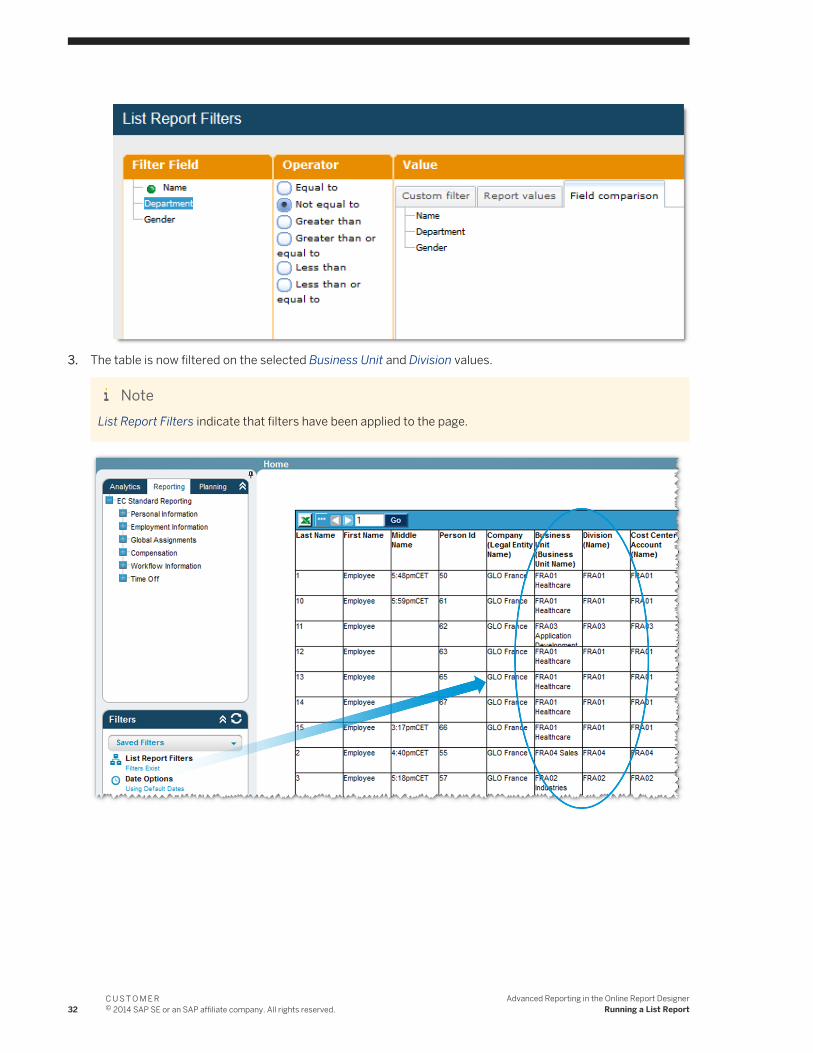
3. The table is now filtered on the selected Business Unit and Division values.
NoteList Report Filters indicate that filters have been applied to the page.
32C U S T O M E R© 2014 SAP SE or an SAP affiliate company. All rights reserved.
Advanced Reporting in the Online Report DesignerRunning a List Report

5.2 Using Date Options
This section describes how to use the date options.
As of Date Option
An As Of Date option allows you to choose a single date to filter the report. Choose from a static date, or from one of the available dynamic options. Only records that are valid as of the chosen date will be shown in the report.
NoteDate Options indicates that a date filter has been applied to the page.
Advanced Reporting in the Online Report DesignerRunning a List Report
C U S T O M E R© 2014 SAP SE or an SAP affiliate company. All rights reserved. 33
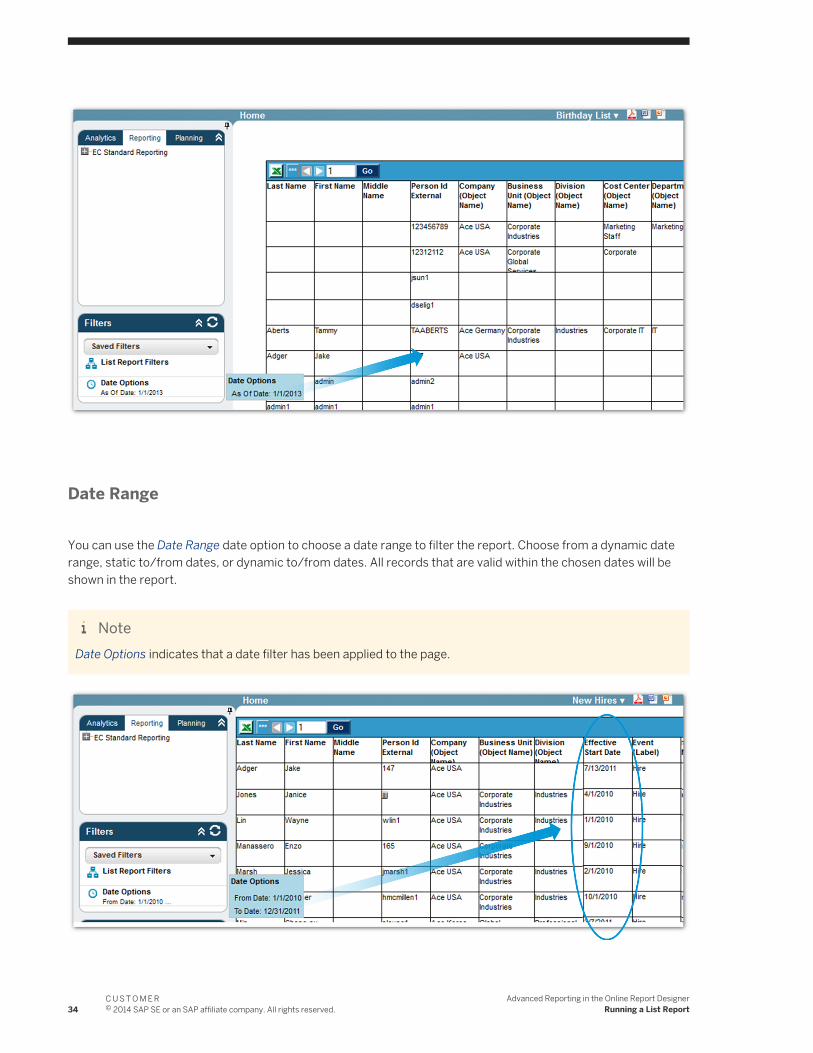
Date Range
You can use the Date Range date option to choose a date range to filter the report. Choose from a dynamic date range, static to/from dates, or dynamic to/from dates. All records that are valid within the chosen dates will be shown in the report.
NoteDate Options indicates that a date filter has been applied to the page.
34C U S T O M E R© 2014 SAP SE or an SAP affiliate company. All rights reserved.
Advanced Reporting in the Online Report DesignerRunning a List Report
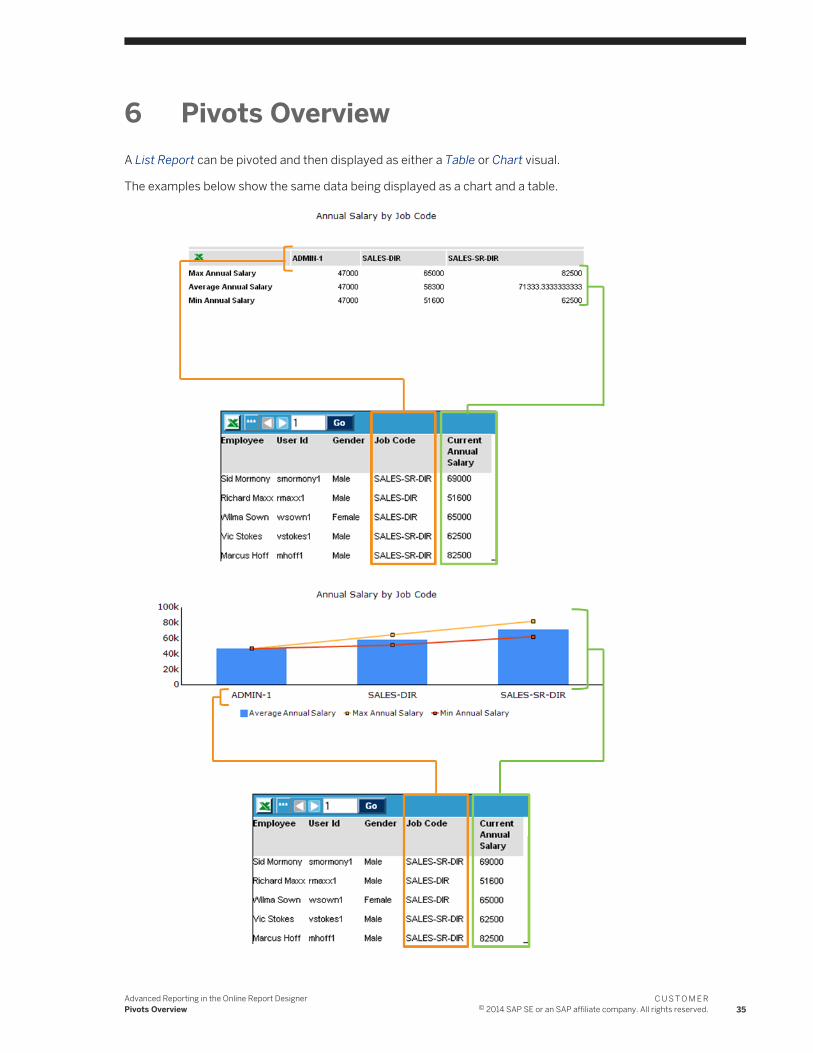
6 Pivots OverviewA List Report can be pivoted and then displayed as either a Table or Chart visual.
The examples below show the same data being displayed as a chart and a table.
Advanced Reporting in the Online Report DesignerPivots Overview
C U S T O M E R© 2014 SAP SE or an SAP affiliate company. All rights reserved. 35
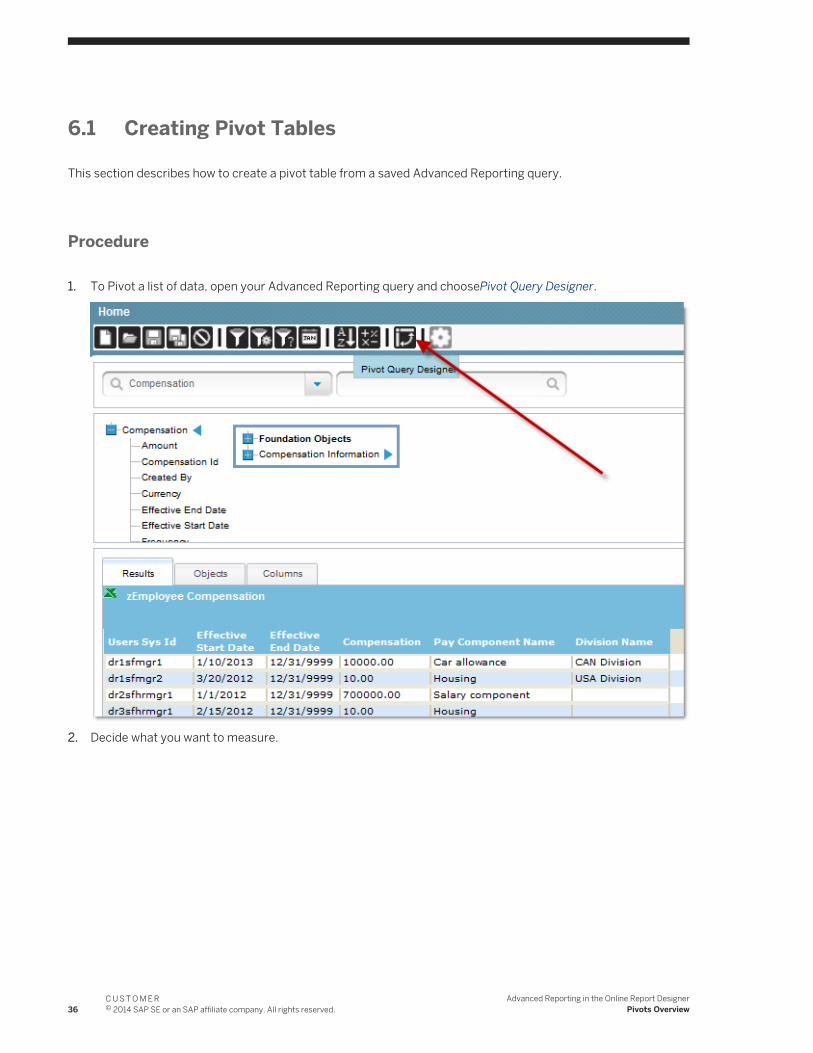
6.1 Creating Pivot Tables
This section describes how to create a pivot table from a saved Advanced Reporting query.
Procedure
1. To Pivot a list of data, open your Advanced Reporting query and choosePivot Query Designer.
2. Decide what you want to measure.
36C U S T O M E R© 2014 SAP SE or an SAP affiliate company. All rights reserved.
Advanced Reporting in the Online Report DesignerPivots Overview
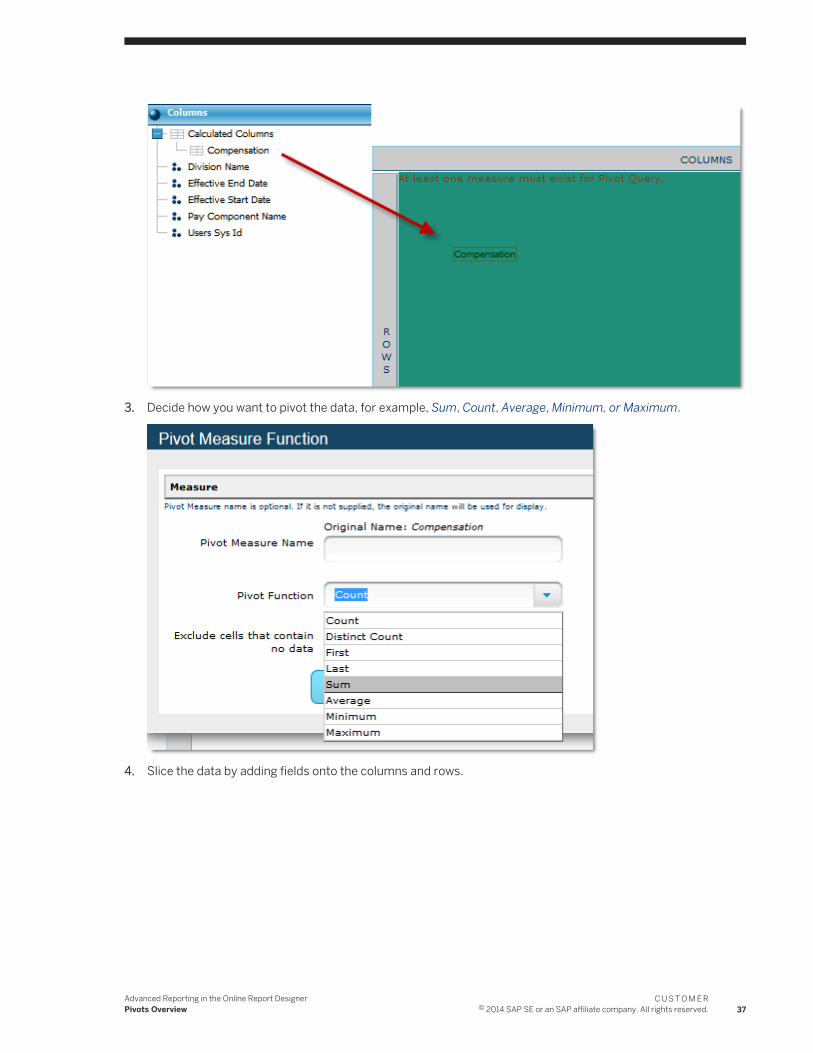
3. Decide how you want to pivot the data, for example, Sum, Count, Average, Minimum, or Maximum.
4. Slice the data by adding fields onto the columns and rows.
Advanced Reporting in the Online Report DesignerPivots Overview
C U S T O M E R© 2014 SAP SE or an SAP affiliate company. All rights reserved. 37
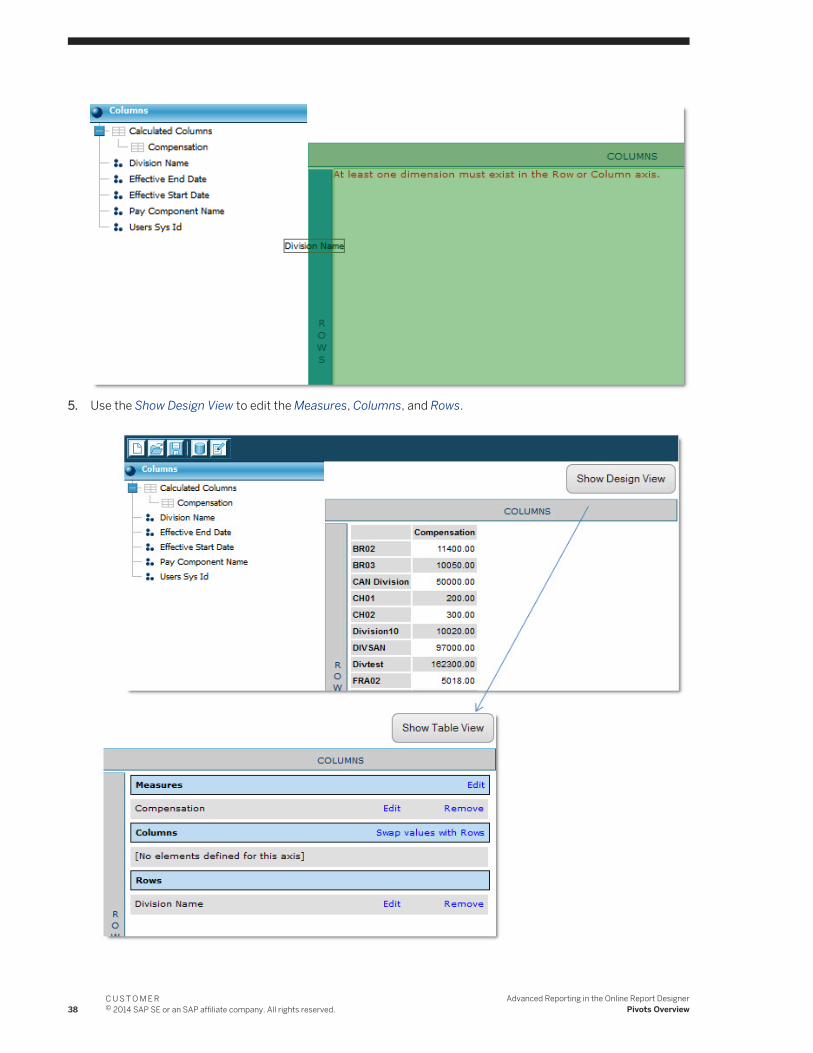
5. Use the Show Design View to edit the Measures, Columns, and Rows.
38C U S T O M E R© 2014 SAP SE or an SAP affiliate company. All rights reserved.
Advanced Reporting in the Online Report DesignerPivots Overview
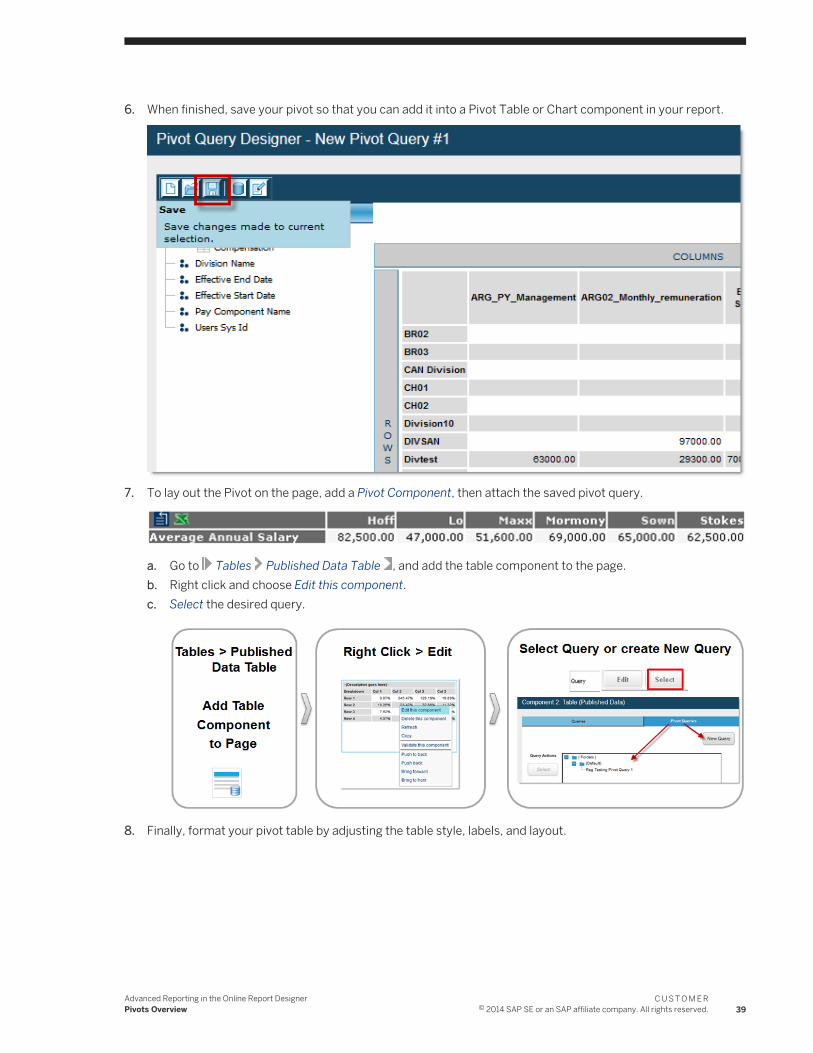
6. When finished, save your pivot so that you can add it into a Pivot Table or Chart component in your report.
7. To lay out the Pivot on the page, add a Pivot Component, then attach the saved pivot query.
a. Go to Tables Published Data Table , and add the table component to the page.b. Right click and choose Edit this component.c. Select the desired query.
8. Finally, format your pivot table by adjusting the table style, labels, and layout.
Advanced Reporting in the Online Report DesignerPivots Overview
C U S T O M E R© 2014 SAP SE or an SAP affiliate company. All rights reserved. 39
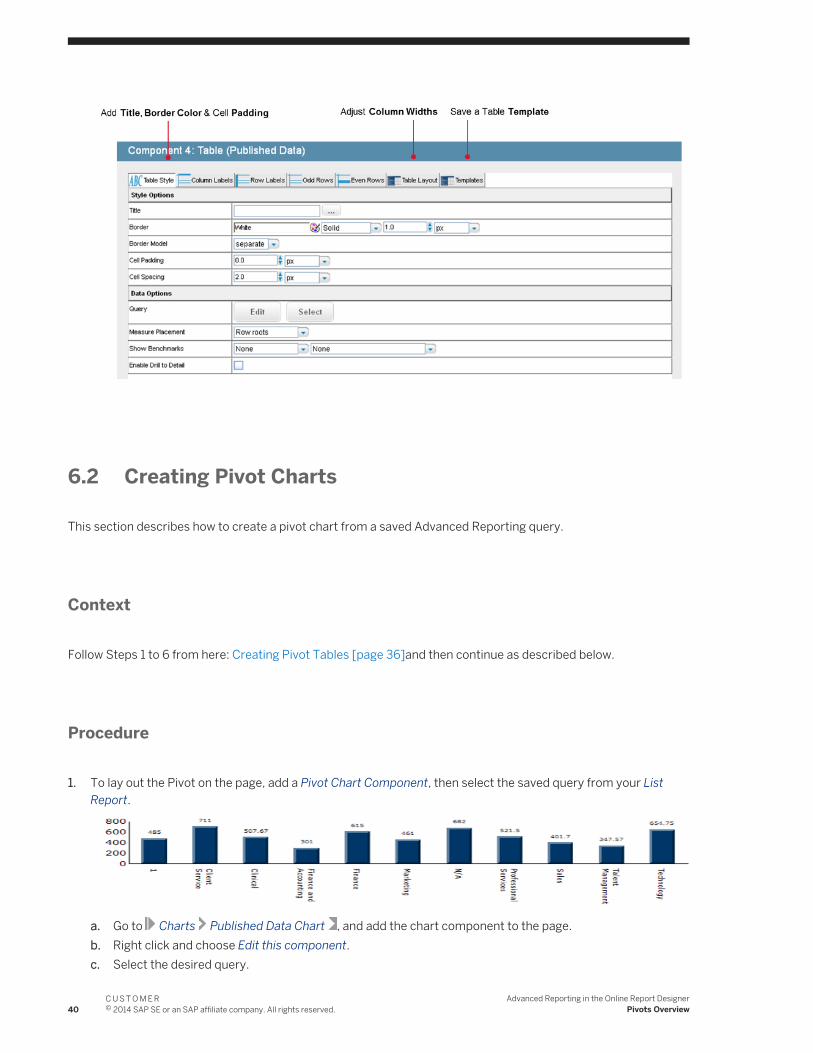
6.2 Creating Pivot Charts
This section describes how to create a pivot chart from a saved Advanced Reporting query.
Context
Follow Steps 1 to 6 from here: Creating Pivot Tables [page 36]and then continue as described below.
Procedure
1. To lay out the Pivot on the page, add a Pivot Chart Component, then select the saved query from your List Report.
a. Go to Charts Published Data Chart , and add the chart component to the page.b. Right click and choose Edit this component.c. Select the desired query.
40C U S T O M E R© 2014 SAP SE or an SAP affiliate company. All rights reserved.
Advanced Reporting in the Online Report DesignerPivots Overview
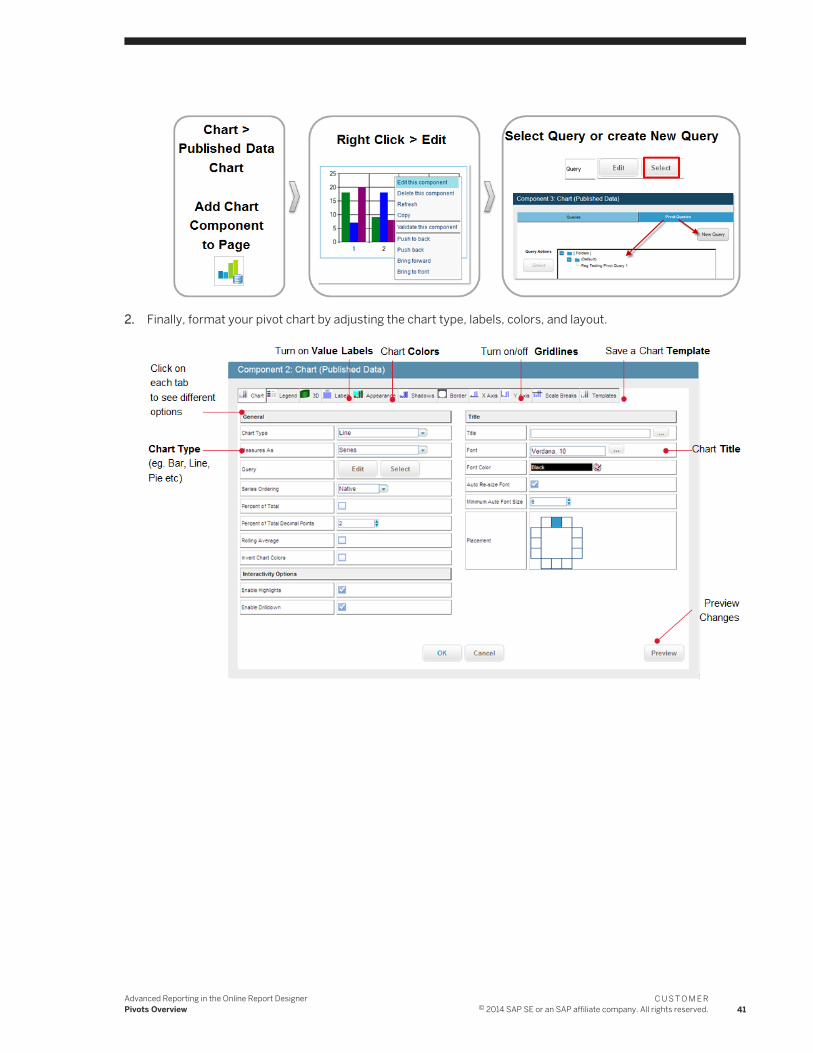
2. Finally, format your pivot chart by adjusting the chart type, labels, colors, and layout.
Advanced Reporting in the Online Report DesignerPivots Overview
C U S T O M E R© 2014 SAP SE or an SAP affiliate company. All rights reserved. 41
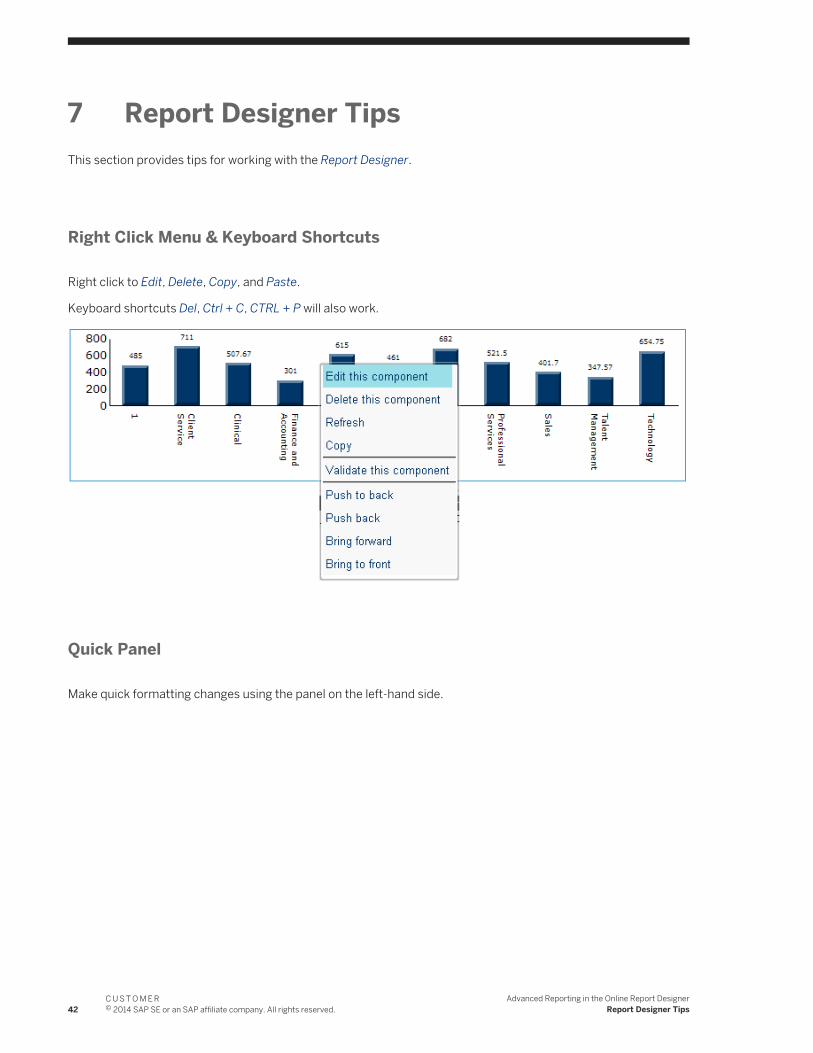
7 Report Designer TipsThis section provides tips for working with the Report Designer.
Right Click Menu & Keyboard Shortcuts
Right click to Edit, Delete, Copy, and Paste.
Keyboard shortcuts Del, Ctrl + C, CTRL + P will also work.
Quick Panel
Make quick formatting changes using the panel on the left-hand side.
42C U S T O M E R© 2014 SAP SE or an SAP affiliate company. All rights reserved.
Advanced Reporting in the Online Report DesignerReport Designer Tips
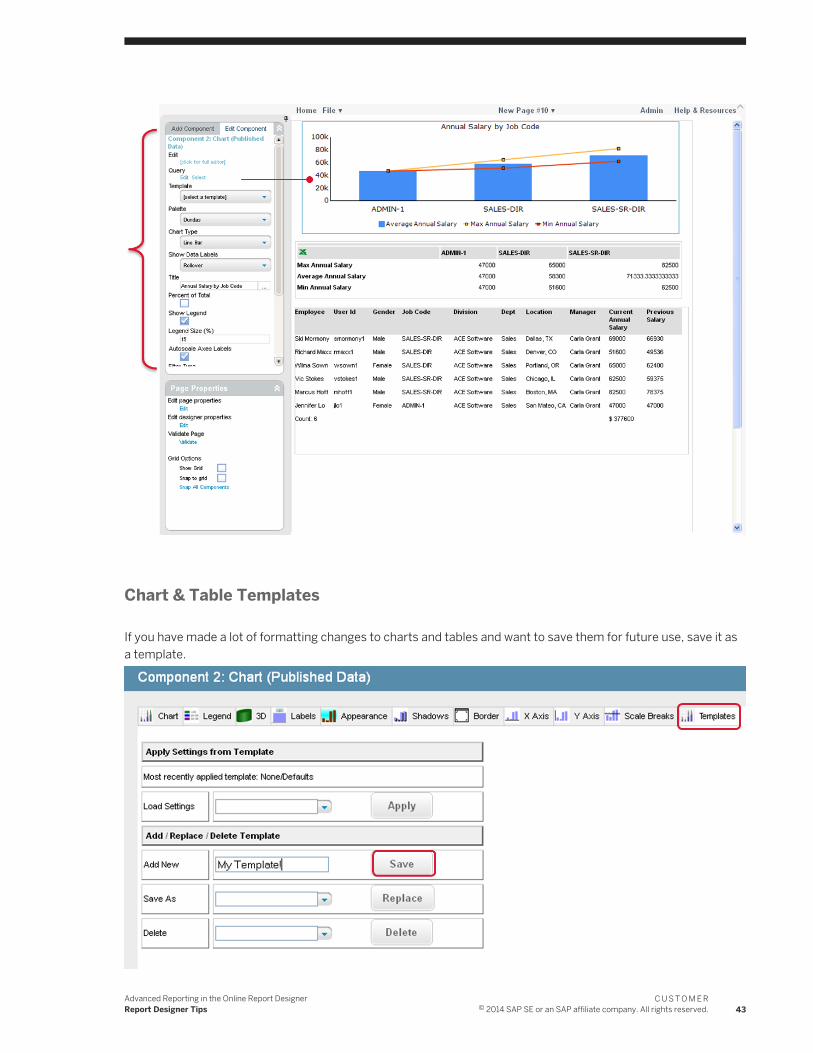
Chart & Table Templates
If you have made a lot of formatting changes to charts and tables and want to save them for future use, save it as a template.
Advanced Reporting in the Online Report DesignerReport Designer Tips
C U S T O M E R© 2014 SAP SE or an SAP affiliate company. All rights reserved. 43
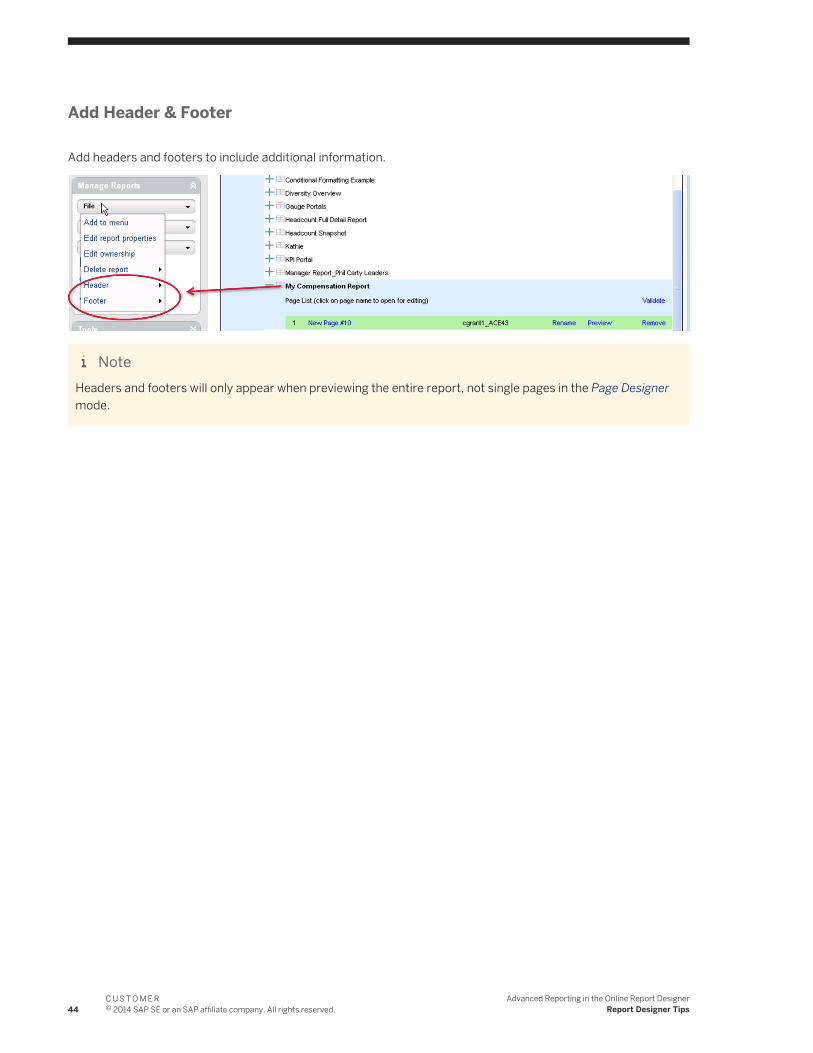
Add Header & Footer
Add headers and footers to include additional information.
NoteHeaders and footers will only appear when previewing the entire report, not single pages in the Page Designer mode.
44C U S T O M E R© 2014 SAP SE or an SAP affiliate company. All rights reserved.
Advanced Reporting in the Online Report DesignerReport Designer Tips
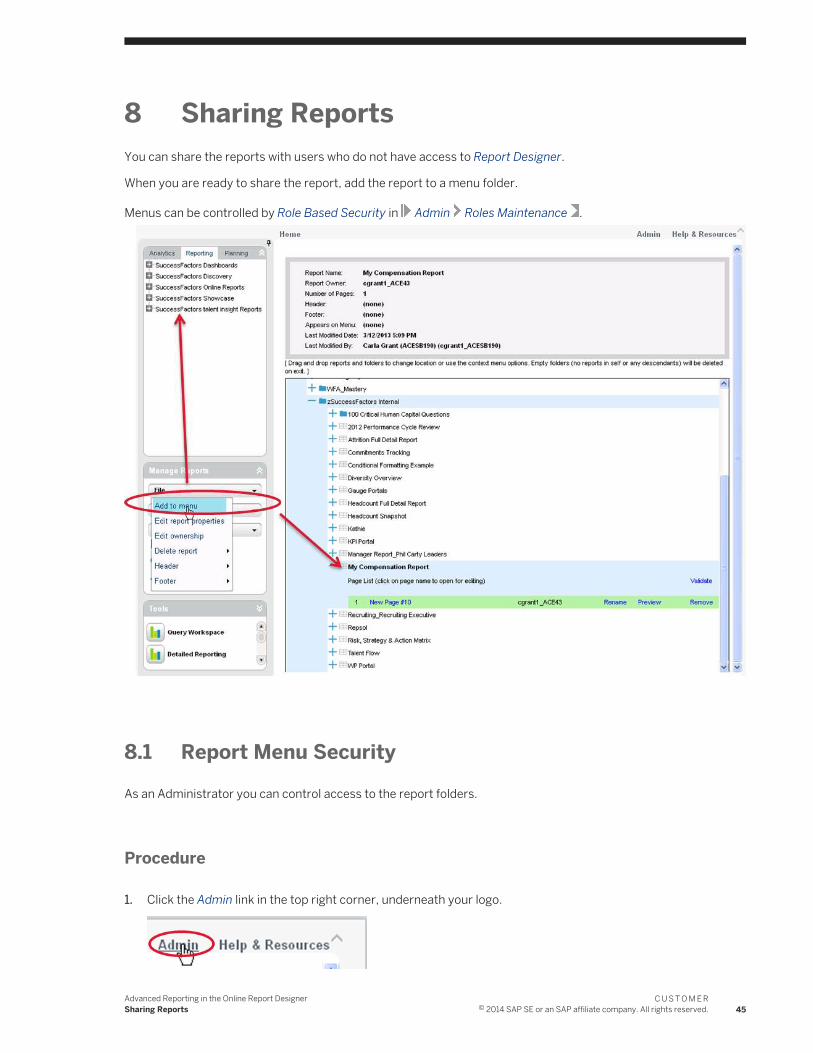
8 Sharing ReportsYou can share the reports with users who do not have access to Report Designer.
When you are ready to share the report, add the report to a menu folder.
Menus can be controlled by Role Based Security in Admin Roles Maintenance .
8.1 Report Menu Security
As an Administrator you can control access to the report folders.
Procedure
1. Click the Admin link in the top right corner, underneath your logo.
Advanced Reporting in the Online Report DesignerSharing Reports
C U S T O M E R© 2014 SAP SE or an SAP affiliate company. All rights reserved. 45
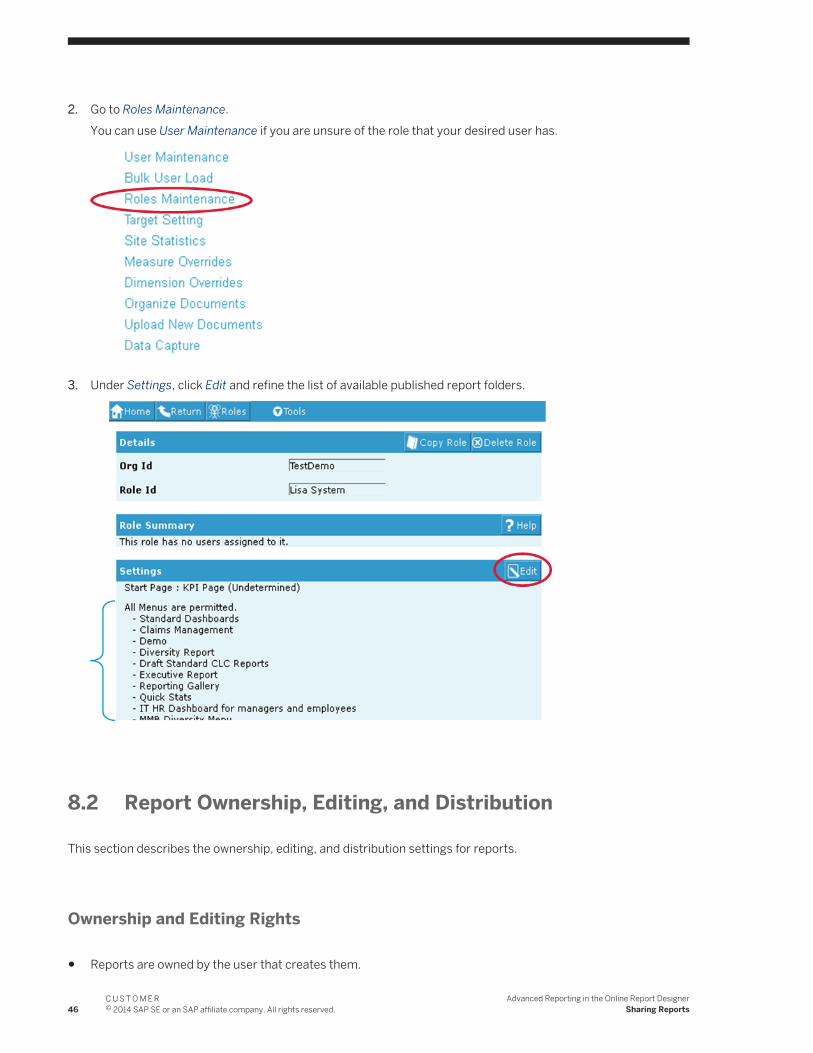
2. Go to Roles Maintenance.You can use User Maintenance if you are unsure of the role that your desired user has.
3. Under Settings, click Edit and refine the list of available published report folders.
8.2 Report Ownership, Editing, and Distribution
This section describes the ownership, editing, and distribution settings for reports.
Ownership and Editing Rights
● Reports are owned by the user that creates them.
46C U S T O M E R© 2014 SAP SE or an SAP affiliate company. All rights reserved.
Advanced Reporting in the Online Report DesignerSharing Reports
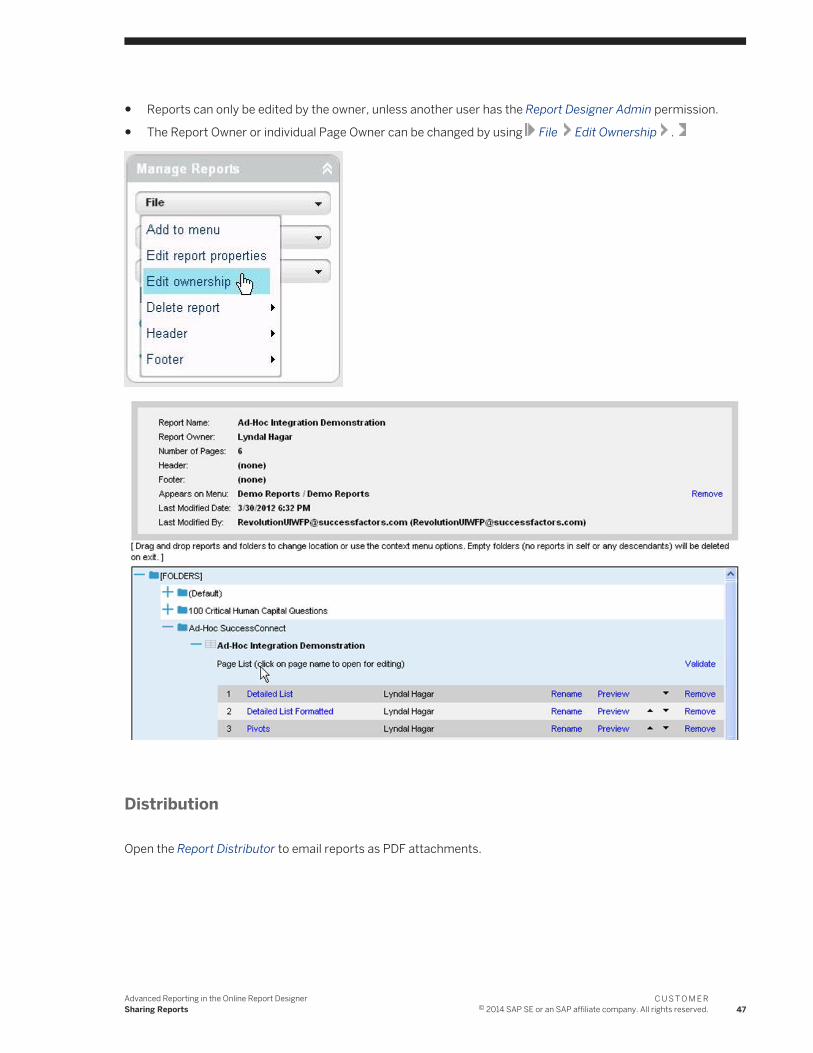
● Reports can only be edited by the owner, unless another user has the Report Designer Admin permission.
● The Report Owner or individual Page Owner can be changed by using File Edit Ownership .
Distribution
Open the Report Distributor to email reports as PDF attachments.
Advanced Reporting in the Online Report DesignerSharing Reports
C U S T O M E R© 2014 SAP SE or an SAP affiliate company. All rights reserved. 47
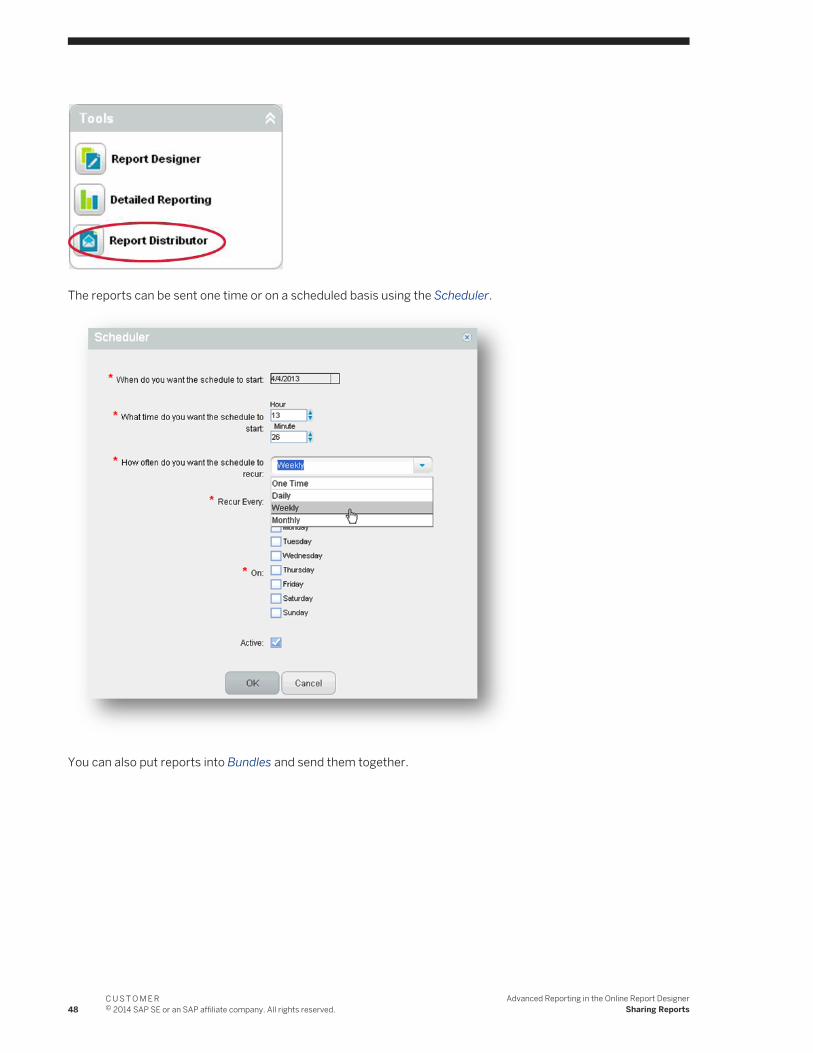
The reports can be sent one time or on a scheduled basis using the Scheduler.
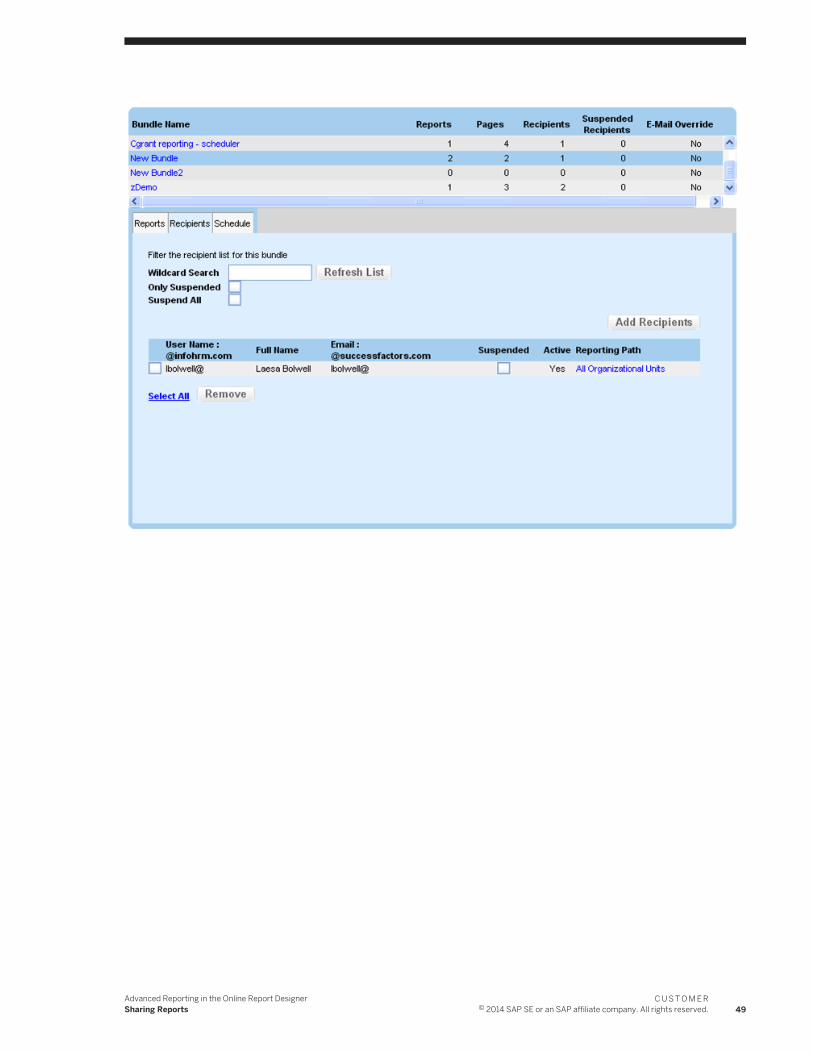
You can also put reports into Bundles and send them together.
48C U S T O M E R© 2014 SAP SE or an SAP affiliate company. All rights reserved.
Advanced Reporting in the Online Report DesignerSharing Reports
Advanced Reporting in the Online Report DesignerSharing Reports
C U S T O M E R© 2014 SAP SE or an SAP affiliate company. All rights reserved. 49
Important Disclaimers and Legal Information
Coding SamplesAny software coding and/or code lines / strings ("Code") included in this documentation are only examples and are not intended to be used in a productive system environment. The Code is only intended to better explain and visualize the syntax and phrasing rules of certain coding. SAP does not warrant the correctness and completeness of the Code given herein, and SAP shall not be liable for errors or damages caused by the usage of the Code, unless damages were caused by SAP intentionally or by SAP's gross negligence.
AccessibilityThe information contained in the SAP documentation represents SAP's current view of accessibility criteria as of the date of publication; it is in no way intended to be a binding guideline on how to ensure accessibility of software products. SAP in particular disclaims any liability in relation to this document. This disclaimer, however, does not apply in cases of wilful misconduct or gross negligence of SAP. Furthermore, this document does not result in any direct or indirect contractual obligations of SAP.
Gender-Neutral LanguageAs far as possible, SAP documentation is gender neutral. Depending on the context, the reader is addressed directly with "you", or a gender-neutral noun (such as "sales person" or "working days") is used. If when referring to members of both sexes, however, the third-person singular cannot be avoided or a gender-neutral noun does not exist, SAP reserves the right to use the masculine form of the noun and pronoun. This is to ensure that the documentation remains comprehensible.
Internet HyperlinksThe SAP documentation may contain hyperlinks to the Internet. These hyperlinks are intended to serve as a hint about where to find related information. SAP does not warrant the availability and correctness of this related information or the ability of this information to serve a particular purpose. SAP shall not be liable for any damages caused by the use of related information unless damages have been caused by SAP's gross negligence or willful misconduct. All links are categorized for transparency (see: http://help.sap.com/disclaimer).
50C U S T O M E R© 2014 SAP SE or an SAP affiliate company. All rights reserved.
Advanced Reporting in the Online Report DesignerImportant Disclaimers and Legal Information

Advanced Reporting in the Online Report DesignerImportant Disclaimers and Legal Information
C U S T O M E R© 2014 SAP SE or an SAP affiliate company. All rights reserved. 51
www.sap.com/contactsap
© 2014 SAP SE or an SAP affiliate company. All rights reserved.No part of this publication may be reproduced or transmitted in any form or for any purpose without the express permission of SAP SE or an SAP affiliate company. The information contained herein may be changed without prior notice.Some software products marketed by SAP SE and its distributors contain proprietary software components of other software vendors. National product specifications may vary.These materials are provided by SAP SE or an SAP affiliate company for informational purposes only, without representation or warranty of any kind, and SAP or its affiliated companies shall not be liable for errors or omissions with respect to the materials. The only warranties for SAP or SAP affiliate company products and services are those that are set forth in the express warranty statements accompanying such products and services, if any. Nothing herein should be construed as constituting an additional warranty.SAP and other SAP products and services mentioned herein as well as their respective logos are trademarks or registered trademarks of SAP SE (or an SAP affiliate company) in Germany and other countries. All other product and service names mentioned are the trademarks of their respective companies.Please see http://www.sap.com/corporate-en/legal/copyright/index.epx for additional trademark information and notices.