advanced research techniques in oracle · nocoug 2006 advanced research techniques in oracle tanel...
TRANSCRIPT

NoCOUG 2006
Advanced Research Techniques in Oracle
Tanel Põderhttp://integrid.info

Introduction
Name: Tanel PõderOccupation: Independent consultantCompany: integrid.infoOracle experience: 8 years as DBAOracle Certified MasterOakTable Network MemberEMEA Oracle User Group director
This presentation is about less known and possibly unsupported research/problem diagnosis techniquesTry this at home! (meaning not in your most critical production environment)

What is research?
Dictionary.com:Scholarly or scientific investigation or inquiryClose, careful study
www.cogsci.princeton.eduSystematic investigation to estabilish facts
www.mco.eduAny systematic investigation, including research development, testing and evaluation, designed to develop or contribute to generalizable knowledge
www.integrid.infoFinding out how things work ;)

Successful Research Prerequisites
InterestWork related (e.g. fixing performance issues or resolving corruptions/crashes)Writing a paper/bookPure interest on how things work
CreativityAlthough Oracle provides a lot of peep-holes into database internals, it pretty much remains a a black box for usThus creativity is needed combining various techniques
TimeTests and experiments should be as simple as possible, easily re-runnable and reproducible

Common Oracle Research Methods
Guesswork, ignoranceData Dictionary, DBA_, V$
V$SQL, V$SQLAREAV$SYSSTAT, V$SESSTATV$SYSTEM_EVENT, V$WAITSTATV$SESSION_EVENT, V$SESSION_WAIT, V$SESSION_WAIT_HISTORY
Statspack, Autotrace10046 trace (sql_trace)
With binds and waitsVarious memory dumps, blockdumps10g new stuff: ASH, AWR, ADDM

Shortcomings Of Current Methods
NB! Current methods are sufficient for performance diagnosis in most cases
However there will always be special cases where “more” is needed
V$ views show wide range db stats, but...V$SESSION_EVENT stats are aggregatedV$SESSION_WAIT cannot be sampled too frequently (direct SGA attach would be needed)V$SESSION_WAIT_HISTORY too “short”
10046 trace is great and pretty accurate... But only SQL_TRACE, waits and bindsPerformance/storage overhead in active envi-ronments

Improving File Based Tracing Framework
Allow researcher to get immediate feedback from tracefilesAllow to process tracefiles on the flyStore only interesting parts of a tracefileAllow researcher to save time, by having easily re-runnable and comparable tests
SQL> select count(*) from t;WAIT #5: nam='db file sequential read' ela= 89 p1=4 p2=195 p3=1WAIT #6: nam='db file scattered read' ela= 213 p1=4 p2=196 p3=5WAIT #6: nam='db file scattered read' ela= 10729 p1=4 p2=201 ...WAIT #4: nam='SQL*Net message to client' ela= 3 p1=1650815232...
COUNT(*)---------- 1000SQL>
tracedemo1.sql

Processing trace on the fly using pipes
Unix onlyTried once with cygwin tail -f, didn't succeed
Howto:Identify tracefile nameCreate named pipe in place of the file, be-fore Oracle tries to open it
using mknod <name> p commandStart process which reads from pipe
grep for examplewatch out for output buffering
Start tracing

Displaying processed trace output
SQL> select spid from v$process where addr = ( 2 select paddr from v$session where sid = 3 (select sid from v$mystat where rownum = 1) 4 );
SPID------------11191
SQL> host mknod /home/oracle/ORCL/udump/orcl_ora_11191.trc pSQL> set define offSQL> host grep "WAIT" /home/oracle/ORCL/udump/orcl_ora_11191.trc &SQL> set define onSQL> alter session set events '10046 trace name context forever,
level 8';Session altered.
SQL> select * from dual;WAIT #12: nam='SQL*Net message from client' ela= 4805067
p1=1650815232 p2=1 p3=0...

Tracing logical IOs
10046 level 8 can trace physical IOs using wait interface
Physical IO in Oracle means system call operation to get a datablock from OSThis datablock might be in OS buffer cache or disk array cache, not exactly being “physical”
Consistent gets can be traced using event 10200
Don't know any event for current gets thoughSQL> @traceon 10200 1 "consistent read"SQL> select * from dual;Consistent read started for block 0 : 00400742Consistent read finished for block 0 : 400742Consistent read finished for block 0 : 400742
crdemo.sql

Tracing Enqueue Operations
When resolving enqueue contention issues, it's often hard to find out who's causing high enqueue usage:10046 trace shows only waits on enqueuesX$KSQST
Kernel Service enQueue STatisticsOnly system level aggregated information
V$ENQUEUE_STAT[ISTICS]Available from 9i, based on X$KSQSTSame problems as with X$KSQST
Event 10704 traces local enqueue ops.10706 for Global enqueue operations in RACAlso _ksi_trace could be used for GES tracing
enqueuedemo.sql

Information Sources
Documentation, mailinglists, Googleoraus.msg, $OH/rdbms/admin/*.sqlMetalink / bug descriptionsV$FIXED_VIEW_DEFINITION
Search by view name or definitionV$TYPE_SIZE, V$LOCK_TYPEV$FIXED_TABLE, X$KQFCO
All X$ tables and their columnsX$KSPPI
ParametersX$KSMFSV
Fixed SGA variables, pointers to various arraysoradebug help
Public documents and people
It's worth to read the documentation firstThere's much more information than I “had al-ways thought”
Google can give some surprising resultsIf search is specific enough
Some websites:http://www.ixora.com.auhttp://www.jlcomp.demon.co.ukhttp://www.juliandyke.comhttp://www.hotsos.comOh yes, http://integrid.info too ;)
Mailinglists & discussion boardsOracle-L comp.databases.oracle.server

$OH/rdbms/mesg/oraus.msg
Descriptions for some events:10046, 00000, "enable SQL statement timing"// *Cause:// *Action:
10053, 00000, "CBO Enable optimizer trace"// *Cause:// *Action:
10231, 00000, "skip corrupted blocks on _table_scans_"
// *Cause:// *Action: such blocks are skipped in table
scans, and listed in trace files

V$ View definitions
SQL> select table_name from dba_synonyms 2 where synonym_name = 'V$INSTANCE';TABLE_NAME------------------------------V_$INSTANCE
SQL> select text from dba_views where view_name = 'V_$INSTANCE';TEXT-------------------------------------------------------------------select "INSTANCE_NUMBER","INSTANCE_NAME","HOST_NAME","VERSION", "STARTUP_TIME","STATUS","PARALLEL","THREAD#","ARCHIVER", "LOG_SWITCH_WAIT","LOGINS","SHUTDOWN_PENDING", "DATABASE_STATUS","INSTANCE_ROLE","ACTIVE_STATE" from v$instance
SQL> select view_definition from v$fixed_view_definition where view_name = 'GV$INSTANCE';
VIEW_DEFINITION-------------------------------------------------------------------select ks.inst_id,ksuxsins,ksuxssid,ksuxshst,ksuxsver,ksuxstim,decode(ksuxssts,0,'STARTED',1,'MOUNTED',2,'OPEN',3,'OPEN MIGRATE','UNKN...e,0,'NORMAL',1,'QUIESCING',2,'QUIESCED','UNKNOWN') from x$ksuxsinst ks, x$kvit kv, x$quiesce qu where kvittag = 'kcbwst'
v.sql f.sql

Getting parameter information
Interview question:Query us all Oracle instance parameters and their values. Which view would you use?
V$PARAMETERV$PARAMETER2V$SYSTEM_PARAMETERV$SYSTEM_PARAMETER2show parameterJoin: X$KSPPI <-> X$KSPPSV
SQL> select count(*) from x$ksppi;COUNT(*)-------- 1173

Getting parameter information
X$KSPPI - all Oracle instance parametersX$KSPPCV - current (session) valuesX$KSPPSV - system (instance) valuesX$KSPPCV2, X$KSPPSV2 - shows duplicate parameter values on separate linesSimple script (p.sql):
selectn.ksppinm name, c.ksppstvl value, n.ksppdesc descr
from x$ksppi n, x$ksppcv cwhere n.indx=c.indxand n.ksppinm like '%&1%';
p.sql, pd.sql

oradebug helpSQL> oradebug helpHELP [command] Describe one or all com
mandsSETMYPID Debug current processSETOSPID <ospid> Set OS pid of process to
debugSETORAPID <orapid> ['force'] Set Oracle pid of process
to debugDUMP <dump_name> <lvl> [addr] Invoke named dumpDUMPSGA [bytes] Dump fixed SGADUMPLIST Print a list of available
dumpsEVENT <text> Set trace event in processSESSION_EVENT <text> Set trace event in sessionDUMPVAR <p|s|uga> <name> [level] Print/dump a fixed
PGA/SGA/UGA variableSETVAR <p|s|uga> <name> <value> Modify a fixed PGA/SGA/UGA
variablePEEK <addr> <len> [level] Print/Dump memoryPOKE <addr> <len> <value> Modify memoryWAKEUP <orapid> Wake up Oracle processSUSPEND Suspend executionRESUME Resume executionFLUSH Flush pending writes to
trace fileCLOSE_TRACE Close trace fileTRACEFILE_NAME Get name of trace file

Suspending Oracle for analysis
Suspending single processoradebug suspendkill -SIGTSTP, -SIGSTOP and -SIGCONTtricks with alter session enable resumable, stopping archiver, suspending client, etc..
Suspending an instancekill -SIGTSTP command on all processesflash freeze: oradebug ffbeginend freeze: oradebug ffresumeinst
Suspending whole RAC clusteroradebug setinst alloradebug ffbegin

Setting watchpointsWatchpoint helps to log any changes to given memory region:oradebug watch <addr> <length> \
<self|exist|all|target>oradebug show <local|global|target> wathcpoints
SQL> oradebug watch 0x50048B54 4 selfLocal watchpoint 0 created on region [0x50048B54,
0x50048B58).
ksdxwinit: initialize OSD requestedksdxwcwpt: creating watchpoint on 0x0x50048b54, 4
with mode 1M:1110109332886167000:0x50048B54:4:0x088537DD:0x0
8863F7A:0x0A486EB6:0x0A483948:ff000000M:1110109332886972000:0x50048B54:4:0x0885555C:0x0
88640A0:0x0A48761D:0x0A483948:00000000M:1110109332890726000:0x50048B54:4:0x088537DD:0x0
8863F7A:0x0A486EB6:0x08EC23CC:ff000000

Setting watchpointsWatchpoint helps to log any changes to given memory region: 4-byte
memory? platform^|--- timestamp --- | modified |^| modifying | | | address | | instr.addr/M:1110109332886167000:0x50048B54:4:0x088537DD: 0x08863F7A:0x0A486EB6:0x0A483948:ff000000 caller prev prev new value caller caller$ addr2line -e $OH/bin/oracle -f 0x088537DDkslgetl$ addr2line -e $OH/bin/oracle -f 0x08863F7Aksfglt$ addr2line -e $OH/bin/oracle -f 0x0A486EB6kghalo$ addr2line -e $OH/bin/oracle -f 0x0A483948kghgex
_ksdxw_stack_depth sets the dump stack depth

Calling kernel functions with oradebug
oradebug call <function name> <params>Does not work on all platforms (Windows, AIX)On those, functions could be called using their starting memory address
Finding function namesErrorstacks, gotten from Oracle or w. pstack/dbnm - a standard unix utilityobjdump oradebug SKDSTTPCS - translate proc calls
$ nm $ORACLE_HOME/bin/oracle > symbols.txt$ grep dmp symbols.txtoracle:08428c0a T aopdmporacle:094b8956 T curdmporacle:0aea2f82 t dreetdmp...

Calling kernel functions with oradebug
oradebug setorapid <xx>oradebug call curdmp
dumps open cursor informationSQL> oradebug setorapid 17Unix process pid: 2763, image: oracle@local-
host.localdomain (TNS V1-V3)SQL> oradebug call curdmpFunction returned 0
**************** Cursor Dump ******************Current cursor: 2, pgadep: 0 pgactx: 526fbb24
ctxcbk: 0 ctxqbc: 0 ctxrws: 52a01ae8Cursor Dump:----------------------------------------Cursor 2 (b6b60288): CURROW curiob: b6b6c340 curflg: 46 curpar: 0 curusr: 0 curses 5421f924 cursor name: select rownum, object_id from t child pin: 52eba3a0, child lock: 52eb5900,
parent lock: 52ea4d68
Finding usable kernel functions
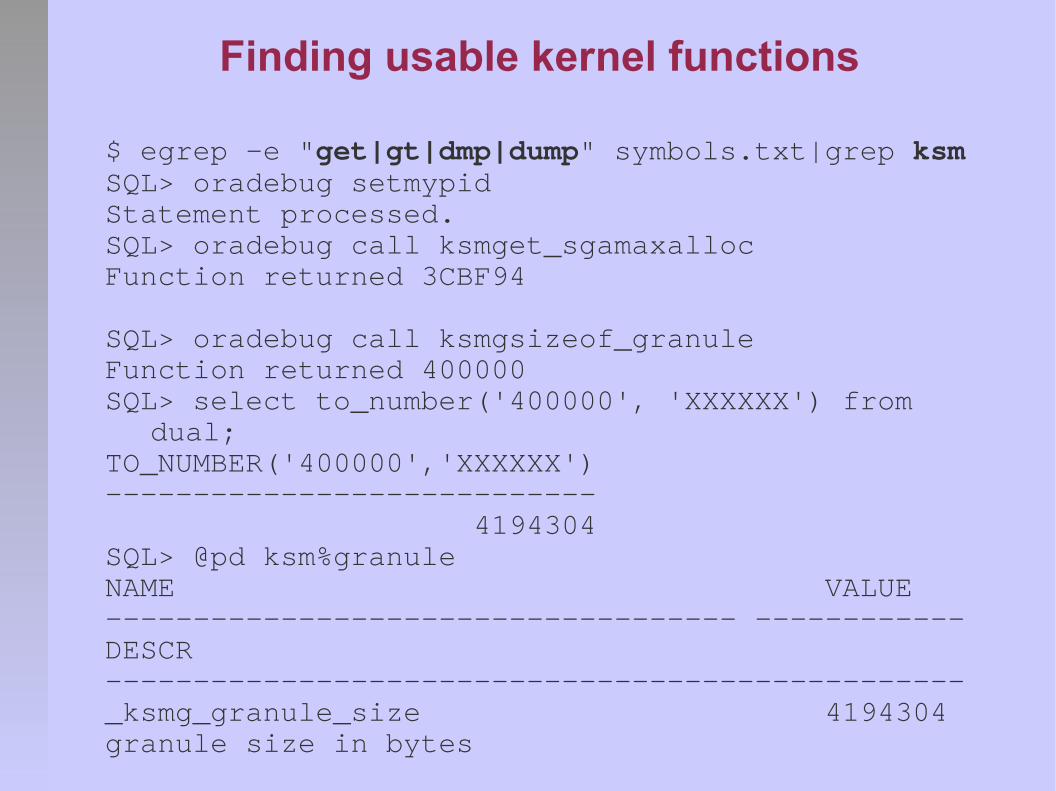
$ egrep -e "get|gt|dmp|dump" symbols.txt|grep ksmSQL> oradebug setmypidStatement processed.SQL> oradebug call ksmget_sgamaxallocFunction returned 3CBF94
SQL> oradebug call ksmgsizeof_granuleFunction returned 400000SQL> select to_number('400000', 'XXXXXX') from
dual;TO_NUMBER('400000','XXXXXX')---------------------------- 4194304SQL> @pd ksm%granuleNAME VALUE------------------------------------ ------------DESCR-------------------------------------------------_ksmg_granule_size 4194304granule size in bytes

Calling kernel functions with OS debugger
SQL> @iUSERNAME SID SERIAL# SPID OPID------------ ------- ------- ------------ -------SYS 41 8 2337 17
$ gdb
(gdb) attach 2337Attaching to program: /
home/oracle/product/10.1.0/bin/oracle, process 2337
[New Thread -1229436992 (LWP 2337)]Symbols already loaded for /
home/oracle/product/10.1.0/lib/libunwind.so.3...(gdb) call kslgetl (0x50048B54,1)$5 = 1(gdb) call kslfre (0x50048B54)$6 = 0

Invoking OS debugger on an event
Could be used for invoking any executable/script:$ cat /tmp/debug.sh/bin/echo Hello World! $*$ chmod u+x /tmp/debug.sh
SQL> alter system set "_oradbg_pathname"='/tmp/debug.sh';
System altered.SQL> alter system set events 'logon debug forever';$ sqlplus "/ as sysdba"SQL*Plus: Release 10.1.0.3.0 - Production on Sun Mar 6
09:41:59 2005Copyright (c) 1982, 2004, Oracle. All rights
reserved.Hello World! 28826Connected to:Oracle Database 10g Enterprise Edition Release
10.1.0.3.0 - ProductionWith the Partitioning and Data Mining options

Invoking OS debugger on an event
Getting process memory map on sort begin and end:
$ cat /tmp/debug.sh/usr/bin/pmap $1 | /bin/grep mapped
SQL> set pause onSQL> alter session set events '10032 debug forever';Session altered.
SQL> select * from t order by 2;mapped: 146928 KB writable/private: 16328 KB
shared: 73728 KBmapped: 146928 KB writable/private: 16328 KB
shared: 73728 KBSQL> alter session set events '10032 debug off';
Could also use pstack, gdb and so on

Tracing system calls
Really simple:truss program, strace program
$ strace pwdexecve("/bin/pwd", ["pwd"], [/* 29 vars */]) = 0uname({sys="Linux", node="localhost.localdomain",
open("/etc/ld.so.preload", O_RDONLY) = -1 ENOENT (No such file or directory)
open("/etc/ld.so.cache", O_RDONLY) = 3fstat64(3, {st_mode=S_IFREG|0644,
st_size=31589, ...}) = 0old_mmap(NULL, 31589, PROT_READ, MAP_PRIVATE, 3, 0)
= 0xb75e3000close(3) = 0open("/lib/tls/libc.so.6", O_RDONLY) = 3
Attaching to running process:truss -p <spid> - Solarix, AIXstrace -p <spid> - Linuxtrace -p <spid> - Tru64

Strace output
$ strace -p 2874Process 2874 attached - interrupt to quitread(7,
"\0\267\0\0\6\0\0\0\0\0\21i\36\320\372\t\10\1\0\0\0\1\0"..., 2064) = 183
gettimeofday({1110107664, 205983}, NULL) = 0getrusage(RUSAGE_SELF, {ru_utime={0, 80000}, ru_stime=
{0, 190000}, ...}) = 0...statfs("/home/oracle/oradata/ORCL/system01.dbf",
{f_type="EXT2_SUPER_MAGIC", f_bsize=4096, f_blocks=1008023, f_bfree=134407, f_bavail=83201, f_files=513024, f_ffree=420807, f_fsid={0, 0}, f_namelen=255, f_frsize=0}) = 0
open("/home/oracle/oradata/ORCL/system01.dbf", O_RDWR|O_SYNC|O_LARGEFILE) = 12
gettimeofday({1110107664, 292448}, NULL) = 0pread(12,
"\6\242\0\0\243\300@\0\371\261\6\0\0\0\1\6a\10\0\0\2\0%"..., 8192, 403988480) = 8192

Transparent OCI call tracing
Used-defined callback functionsDocumented featureTransparent, non-intrusiveCan do performance instrumentationPre-post processing, instead of processingWorks on Unix, WindowsCreate dynamic load librariesRegister your dynamic callback functions
OCIUserCallbackRegister()export ORA_OCI_UCBPKG=”lib1;lib2;lib3” Run the application
$ORACLE_HOME/rdbms/demo/ociucb.mkmake -f ociucb.mk user_callback \ SHARED_LIBNAME=blah.so.1.0 OBJS=cdemoucbl.o

Peeking variables, dumping memory
ORADEBUG PEEKORADEBUG DUMPORADEBUG DUMPVARORADEBUG DUMPTYPEX$KSMMEM

KST tracing and X$TRACE
In-memory buffered tracingOnly some events currently availableTrace data is accessible either from:
X$TRACEOS files dumped to disk
Good for RAC and distributed issue tracingtrace_enabled parameter must be trueSyntax for enabling:
alter system set "_trace_events"='10000-10999:1:ALL';Parameter 1: event list or rangeParameter 2: tracing level (0 - minimal, 255 verbose)Parameter 3: process ID (<ID>, ALL, BGS, FGS)

KST tracing and X$TRACE
Lots of parameters controlling KST tracingtrace_enabled TRUE_trace_processes ALL_trace_archive FALSE_trace_events 10000-10999:255:ALL_trace_buffers ALL:256_trace_flush_processes ALL_trace_file_size 65536_trace_options text,multiple_trace_buffer_wrap_timestamp TRUE
SQL> @xt TIME seq# event op sid---------- -------- ------- ---- -------1508545180 583506 10704 83 13ksqgtl: acquire CU-2587046c-00000000 mode=X
flags=SHORT why="contention"
1508545180 583507 10704 19 13ksqgtl: SUCCESS

Conclusion
It's amazing how many research and diag-nosis features Oracle has!
How many more undiscovered features is there?
On the other hand, do prefer conventional methods
No point in using hard-core internal mecha-nisms, if you can prove your point with simple methods
Be careful when testing undocumented stuff and running Oracle code completely un-conventionally
This stuff is only for experimental environments
