advanced spc for healthcare - eventpilot...
TRANSCRIPT

12/5/2011
1
Advanced SPC for Healthcare
December 5, 2011
Brent James, MD, Intermountain Healthcare
James Benneyan, PhD, Northeastern University
Victoria Jordan, PhD, UT MD Anderson Cancer Center
Introductions
Who are you? Who are we?
1 minute each:
• Name
• Where from
• Why here, what hope to learn
• Level of SPC experience
2

12/5/2011
2
Meet the Faculty – Brent James, MD
• Chief Quality Officer and Executive
Director, Institute for Health Care
Delivery Research, Intermountain
Health Care and founder of ATP
• Faculty appointments at the University
of Utah School of Medicine, Harvard
School of Public Health, University of
Sydney, Australia
• Member, National Academy of
Science’s Institute of Medicine
• Fellow, American College of Physician
Executives
• Numerous awards and honors in healthcare including the
Deming Cup, C. Jackson Grayson Medal, Distinguished
Quality Pioneer, Joint Commission Earnest A. Codman
Award, and the National Committee for Quality Assurance
Quality Award
Meet the Faculty – Jim Benneyan, PhD
Areas of expertise:
• Healthcare systems engineering
• Statistical quality control, probability, optimization
• Director, Healthcare systems engineering
program, Northeastern University (Boston)
• Faculty, Northeastern University (systems
engineering and operations research)
• Director, National Science Foundation
Center for Health Organization
Transformation (CHOT)
• PI and senior engineer, New England VA
Engineering Resource Center (VERC)
• IHI faculty, improvement advisor, fellow
• Healthcare Quality and Productivity
Incorporated, Partner

12/5/2011
3
Meet the Faculty – Victoria Jordan, PhD
• Director, Quality Measurement and
Engineering, UT MD Anderson Cancer Center
• University of Texas Chancellor’s Heath Fellow
for Systems Engineering
• University of Texas McCombs School of
Business Research Fellow
• PhD – Industrial and Systems Engineering
(Applied Statistics), MS – Industrial &
Systems Engineering, MBA, BS-Statistics
• > 25 years Experience in Quality
Improvement
• ASQ Certified Six Sigma Master Black Belt
5
Session Objectives
• Important concept of detection power to
assess effectiveness of control charts
• Appropriate chart design and sample sizes
• More advanced charts (EWMA, Cusum) to
improve detection ability
• Measurement error and impact on process
improvement
• Common errors in practice
6

12/5/2011
4
Agenda
• Introductions / Review Agenda
• SPC 101: Review of SPC Basics
• Assessing Performance
• Improving Performance
• Lunch
• Case study
• Assessment of Measurement Systems
• Top 10 Common Pitfalls and
─g charts
• Wrap up, Q&A7
Agenda
8
8:30 – 8:50 Introductions, Agenda review Exercise
8:50 – 9:30 “SPC 101”: Review of basics 1
9:30 – 10:45 Assessing performance 2
10 – 10:15 break
10:45-11:45 “SPC 201”: Improving performance 3
12:00 - 1:00 lunch
1:00 – 1:45 Case studies 4
1:45 - 3:00 “SPC 301”: Measurement as a system 5
2:15 – 2:30 break
3:00 – 4:00 More advanced topics, Pitfalls to avoid

12/5/2011
5
Handouts
You should have:
• Agenda
• SPC Excel macro
• Slides electronically
• Data sets electronically
• > 1 laptop per table (relocate if needed)
• Optional: Calculator or Excel
• coffee…9
References
1. Benneyan J (2008), “Design, Use, and Performance of Statistical
Process Control Charts for Clinical Process Improvement”,
International Journal of Six Sigma, 4(3): 219-239
2. Montgomery D (1985). Introduction to Statistical Quality Control, Wiley
3. Benneyan J (1998), “Statistical Quality Control Methods in
Epidemiology. Chart Use, Statistical Properties, and Research Issues”,
Infection Control Hospital Epidemiology, 19(4):265-283
4. Jordan V, Benneyan J (2012), Common Errors in Using Healthcare
SPC, in Statistical Methods in Healthcare, Wiley, to appear
5. Benneyan J (2001), “Number-Between g-type Statistical Control Charts
for Monitoring Adverse Events”, Health Care Management Science,
4:305-318
10

12/5/2011
6
Section I: SPC 101
Basic Methods
(Dr Brent James)
11
Learning Objectives
• Review basic concepts of SPC
• Different types of variability
• Different types of data and charts
o Binomial: np, p charts
o Poisson: c, u charts
o Normal: Xbar & S charts (or Xbar & R) (or XmR??)
• Chart construction and interpretation
12

12/5/2011
7
Review of SPC
• Slides and case study from Brent?
13
Applications of Control Charts
1. Detect and monitor process Variation over time.
2. Distinguish Special Cause variation from Common Cause Variation.
3. Common language for discussing process performance.
4. Determine process capability
5. Develop a plan for process improvement

12/5/2011
8
Definitions
1. Common Cause Variation: Causes that are inherent
over time and affect everyone in the process and the
process outcome.
2. Special Cause Variation: Causes that arise from
specific circumstances and are not part of the process
all of the time.
3. Stable Process: Implies that the variation is predictable
within common bounds.
4. Unstable Process: A process that is affected by both
special cause variation and common cause variation.
The variation from one time period to the next is
unpredictable.
16
Attribute control charts are used when it is necessary to classify or
count a particular characteristic of a process instead of measuring it.
Note:A “defective” may be caused by more than one “defect.”
There are four types of Attribute control charts:
1) NP-Chart: For the number defective, where each item is either go/no-
go, good/bad, yes/no, etc., use with constant subgroup size.
2) P-Chart: For the proportion defective, where each item is either go/no-
go, good/bad, yes/no, etc., and changing or constant subgroup size.
3) C-Chart: For counting defects with a constant area of opportunity
where the defects are drawn from. There is no upper limit on the
number of defects that could occur.
4) U-Chart: For counting defects per changing area of opportunity. There
is no upper limit on the number of defects that could occur.
Which chart should I use? Ask:
1) Is there a maximum count for each group? Yes or No?
2) Is each subgroup the same size? Or changing?
Attribute Control Charts

12/5/2011
9
Understanding Variation Choosing the right control chart
Group Exercise
Which Control Chart Should be Used?
For each of the following, identify different ways that the variable could be measured and the appropriate control chart(s) for each:
o Patient wait time
o Patient and family complaints
o Falls
o Medication Errors
o SCIP bundle delivered
o Glucose level
o Percent of patients receiving genetic counseling
o Time to next available appointment
18

12/5/2011
10
Control Charts
Zone
A
B
C
C
B
A
UPPER CONTROL LIMIT
LOWER CONTROL LIMIT
CENTERLINE
Tests for patterns in data are based on the laws
of probability, assuming a normal distribution
19
68.36%99.73% 95.44%
Understanding Variation
Non Random Patterns That Should be Investigated
TEST 1:
POINT OUTSIDE
CONTROL LIMIT
(p = 0.0027)
TEST 2:
TWO OUT OF THREE POINTS ON
ONE SIDE OF THE CENTER LINE
IN ZONE A OR BEYOND
(p = 0.0015)
TEST 3:
FOUR OF FIVE POINTS ON
ONE SIDE OF THE CENTER
LINE IN ZONE B OR BEYOND
(p = 0.0027)
TEST 4:
RUN OF EIGHT POINTS ON THE
SAME SIDE OF THE CENTER LINE
(p = 0.0039)
20

12/5/2011
11
Test 5. SIX POINTS IN A
ROW STEADILY INCREASING
(OR DECREASING)
(p = 0.0024)
Test 6. FOURTEEN POINTS
IN A ROW ALTERNATING
UP & DOWN
Test 7.
STRATIFICATION - 15
POINTS HUGGING
THE CENTERLINE
(p = 0.0033)
Test 8 . EIGHT POINTS IN A
ROW ON BOTH SIDES OF THE
CENTER LINE WITH NONE IN
ZONE C
(p = 0.0001)
21
Understanding VariationNon Random Patterns That Should be Investigated
Table Exercise
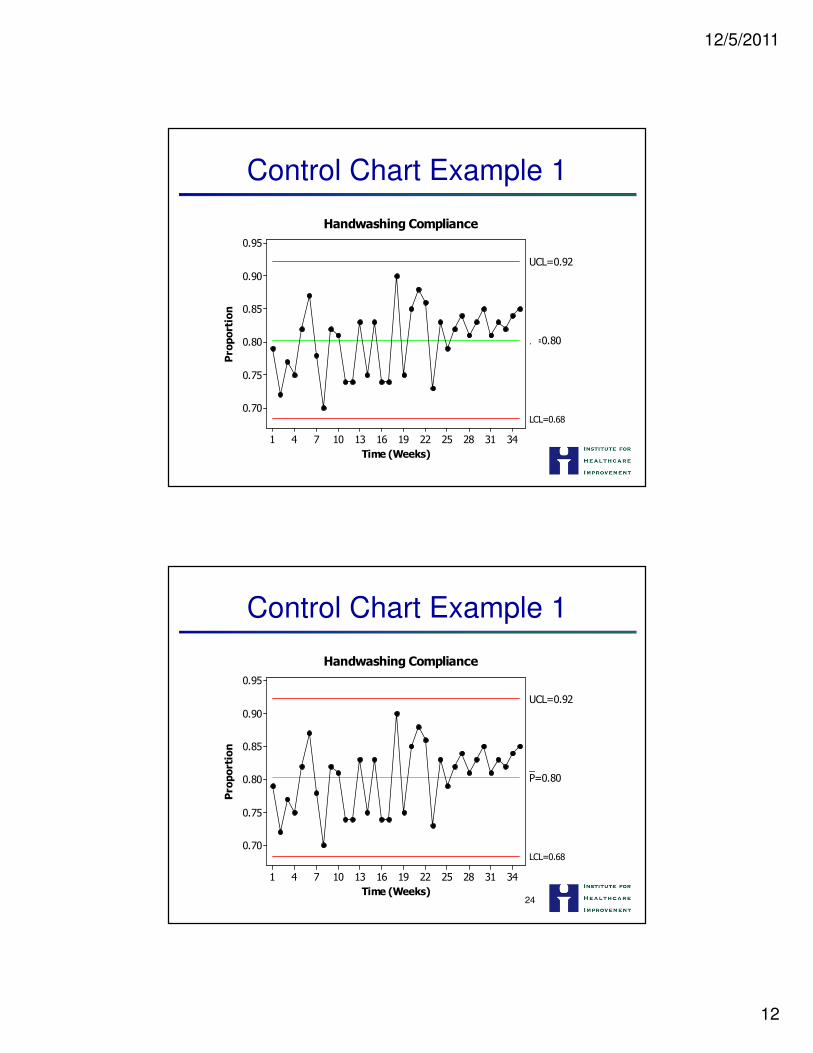
Assessment of Control
• For the following slides, determine what
type of control chart is used and whether
or not the process is in control.
• If the process is not in a state of control,
explain why (what rule is violated) and
what that means in terms of the specific
process.
12/5/2011
12
Control Chart Example 1
343128252219161310741
0.95
0.90
0.85
0.80
0.75
0.70
Time (Weeks)
Proportion
_P=0.80
UCL=0.92
LCL=0.68
Handwashing Compliance
Control Chart Example 1
24
343128252219161310741
0.95
0.90
0.85
0.80
0.75
0.70
Time (Weeks)
Proportion
_P=0.80
UCL=0.92
LCL=0.68
Handwashing Compliance

12/5/2011
13
Control Chart Example 1
343128252219161310741
0.95
0.90
0.85
0.80
0.75
0.70
Time (Weeks)
Proportion
_P=0.80
UCL=0.92
LCL=0.68
Handwashing Compliance
Control Chart Example 2
343128252219161310741
0.09
0.08
0.07
0.06
0.05
0.04
0.03
0.02
Day of Week
Proportion
_P=0.06
UCL=0.09
LCL=0.03
Available Beds

12/5/2011
14
Control Chart Example 2
343128252219161310741
0.09
0.08
0.07
0.06
0.05
0.04
0.03
0.02
Day of Week
Proportion
_P=0.06
UCL=0.09
LCL=0.03
Available Beds
343128252219161310741
0.09
0.08
0.07
0.06
0.05
0.04
0.03
0.02
Day of Week
Proportion
_P=0.06
UCL=0.09
LCL=0.03
Available Beds
Control Chart Example 2

12/5/2011
15
Control Chart Example 3
343128252219161310741
5000
4500
4000
3500
3000
Time (Weeks)
Dollars
_X=4066
UCL=5060
LCL=3072
343128252219161310741
1200
900
600
300
0
Time (Weeks)
Moving Range
__MR=374
UCL=1221
LCL=0
Amount Spent on Clinic Supplies
Control Chart Example 3
343128252219161310741
5000
4500
4000
3500
3000
Time (Weeks)
Dollars
_X=4066
UCL=5060
LCL=3072
343128252219161310741
1200
900
600
300
0
Time (Weeks)
Moving Range
__MR=374
UCL=1221
LCL=0
Amount Spent on Clinic Supplies

12/5/2011
16
Control Chart Example 4
343128252219161310741
7.00%
6.00%
5.00%
4.00%
3.00%
Time (Days)
Proportion
_P=5.17%
UCL=7.28%
LCL=3.07%
Percentage of Barcodes Containing Errors
Control Chart Example 4
343128252219161310741
7.00%
6.00%
5.00%
4.00%
3.00%
Time (Days)
Proportion
_P=5.17%
UCL=7.28%
LCL=3.07%
Percentage of Barcodes Containing Errors

12/5/2011
17
Control Chart Example 4
343128252219161310741
7.00%
6.00%
5.00%
4.00%
3.00%
Time (Days)
Proportion
_P=5.17%
UCL=7.28%
LCL=3.07%
Percentage of Barcodes Containing Errors
Control Chart Example 5
343128252219161310741
25
20
15
10
5
0
Time (Weeks)
Number of Complaints
_C=14.23
UCL=25.54
LCL=2.91
Patient Complaints

12/5/2011
18
Control Chart Example 5
343128252219161310741
25
20
15
10
5
0
Time (Weeks)
Number of Complaints
_C=14.23
UCL=25.54
LCL=2.91
Patient Complaints
Control Chart Example 5
343128252219161310741
25
20
15
10
5
0
Time (Weeks)
Number of Complaints
_C=14.23
UCL=25.54
LCL=2.91
Patient Complaints

12/5/2011
19
Section II:
Assessing Chart
Performance
(Jim Benneyan)
37