advanced tips for making oracle databases faster
TRANSCRIPT

Advanced Performance Tuning Tips
Janis Griffin
Senior DBA
1
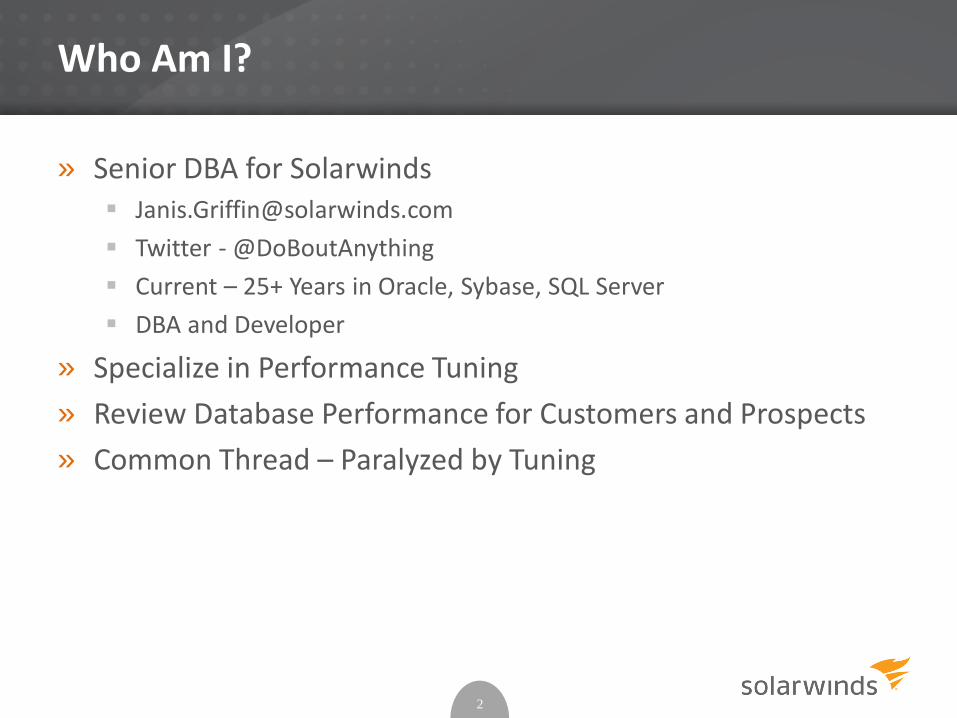
Who Am I?
» Senior DBA for Solarwinds [email protected]
Twitter - @DoBoutAnything
Current – 25+ Years in Oracle, Sybase, SQL Server
DBA and Developer
» Specialize in Performance Tuning
» Review Database Performance for Customers and Prospects
» Common Thread – Paralyzed by Tuning
2
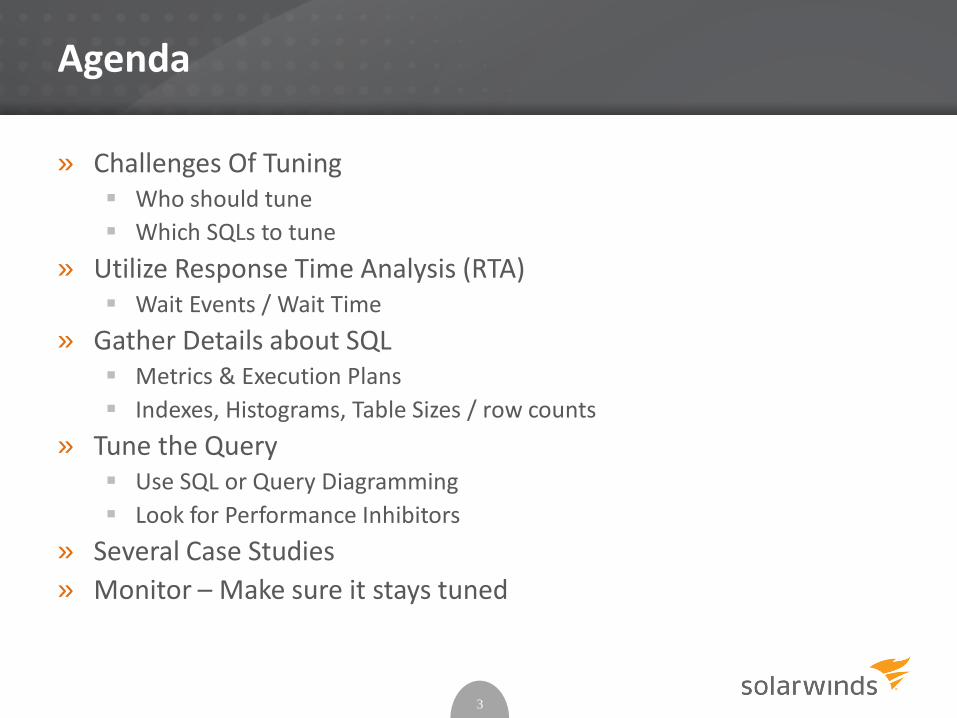
Agenda
» Challenges Of Tuning Who should tune
Which SQLs to tune
» Utilize Response Time Analysis (RTA) Wait Events / Wait Time
» Gather Details about SQL Metrics & Execution Plans
Indexes, Histograms, Table Sizes / row counts
» Tune the Query Use SQL or Query Diagramming
Look for Performance Inhibitors
» Several Case Studies
» Monitor – Make sure it stays tuned
3
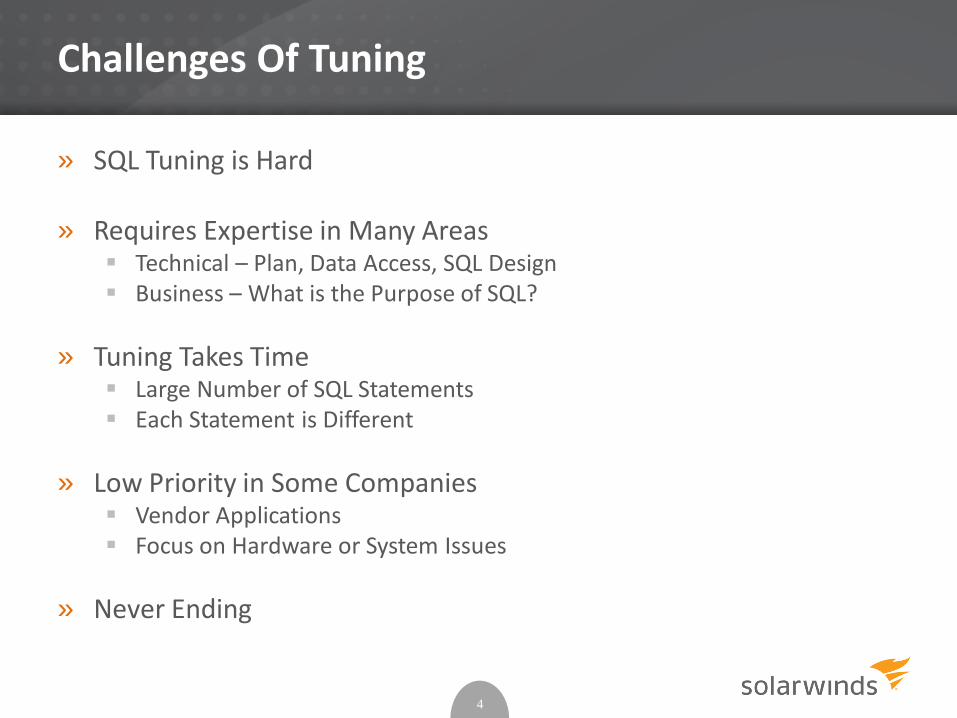
Challenges Of Tuning
» SQL Tuning is Hard
» Requires Expertise in Many Areas Technical – Plan, Data Access, SQL Design Business – What is the Purpose of SQL?
» Tuning Takes Time Large Number of SQL Statements Each Statement is Different
» Low Priority in Some Companies Vendor Applications Focus on Hardware or System Issues
» Never Ending
4
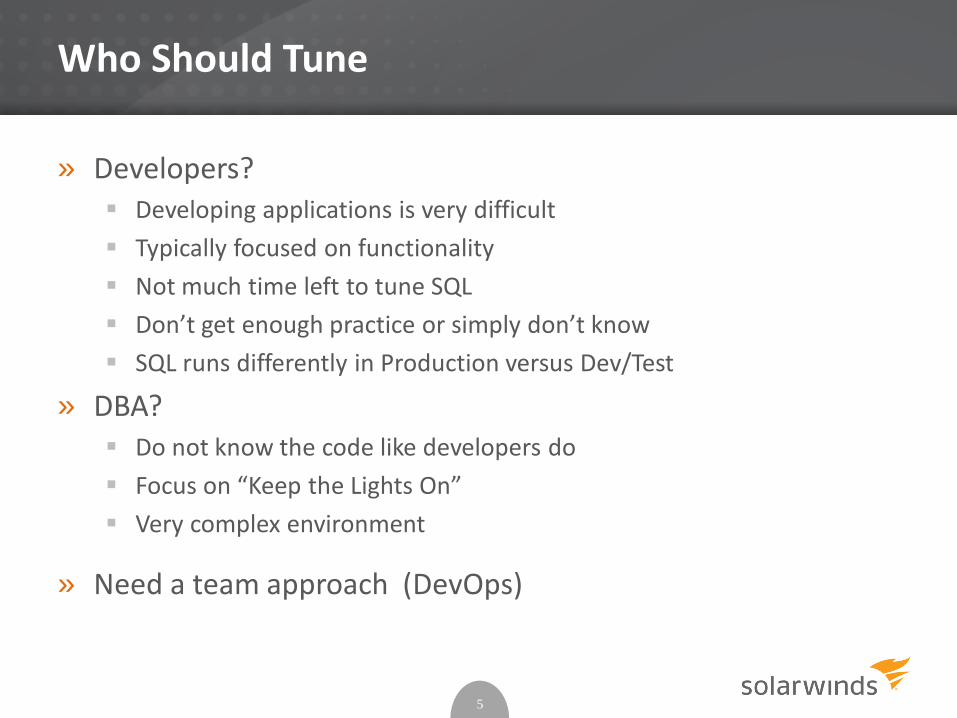
Who Should Tune
» Developers? Developing applications is very difficult
Typically focused on functionality
Not much time left to tune SQL
Don’t get enough practice or simply don’t know
SQL runs differently in Production versus Dev/Test
» DBA? Do not know the code like developers do
Focus on “Keep the Lights On”
Very complex environment
» Need a team approach (DevOps)
5
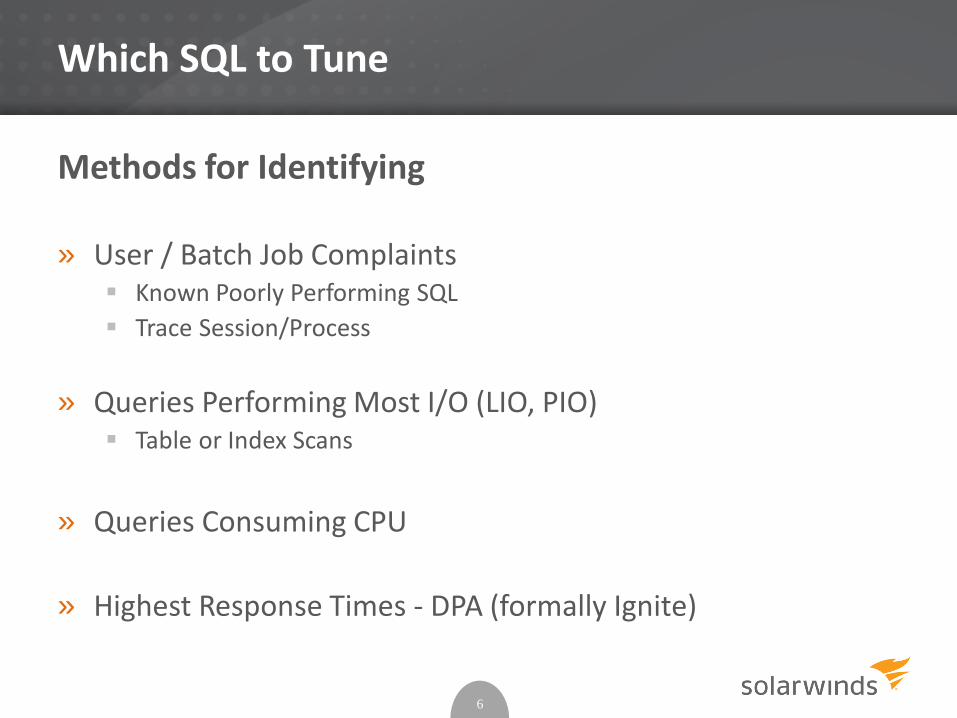
Which SQL to Tune
Methods for Identifying
» User / Batch Job Complaints Known Poorly Performing SQL
Trace Session/Process
» Queries Performing Most I/O (LIO, PIO) Table or Index Scans
» Queries Consuming CPU
» Highest Response Times - DPA (formally Ignite)
6
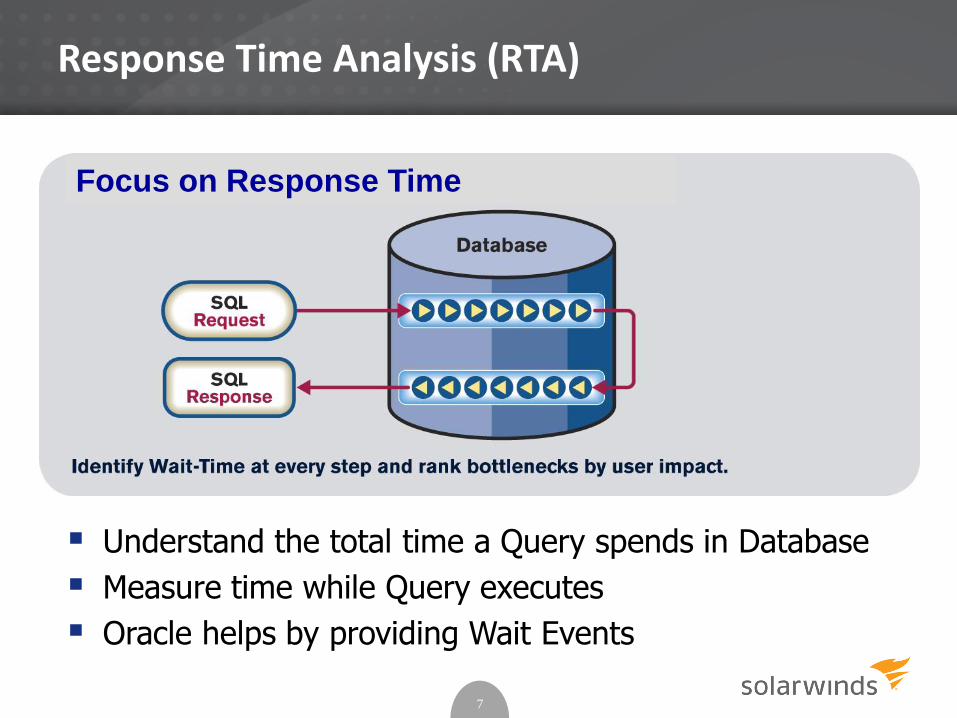
Response Time Analysis (RTA)
7
Understand the total time a Query spends in Database
Measure time while Query executes
Oracle helps by providing Wait Events
Focus on Response Time
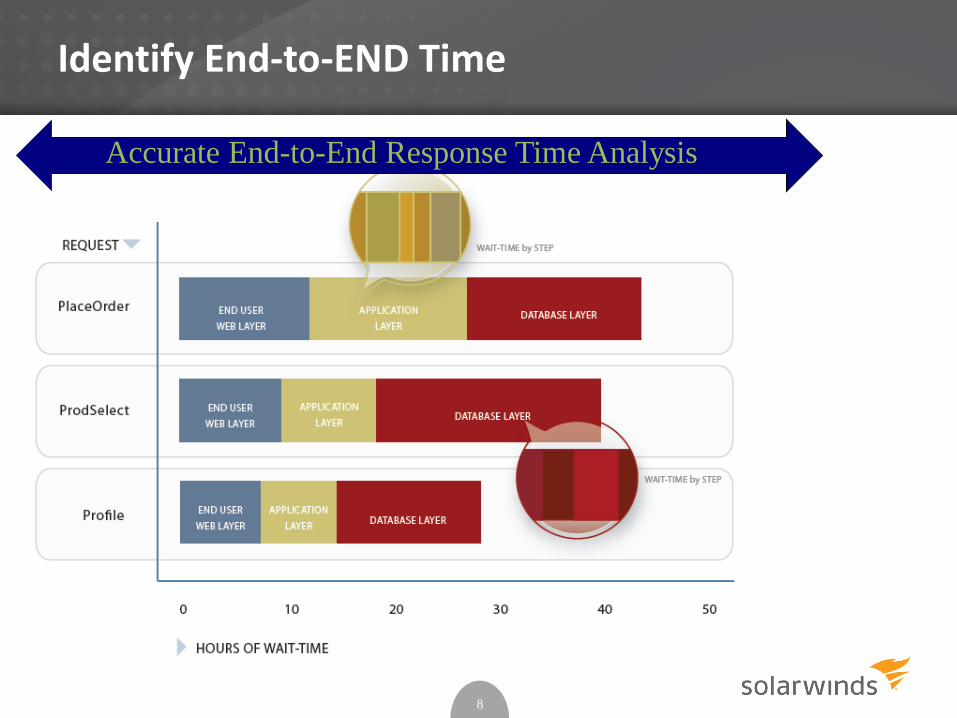
Identify End-to-END Time
8
Accurate End-to-End Response Time Analysis
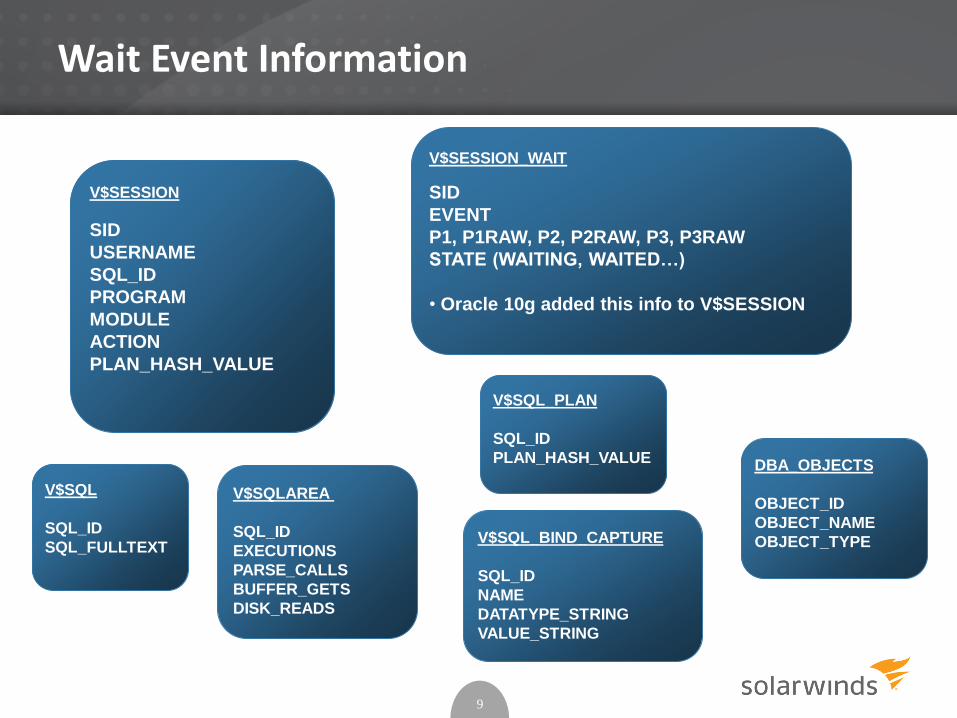
Wait Event Information
9
V$SESSION
SID
USERNAME
SQL_ID
PROGRAM
MODULE
ACTION
PLAN_HASH_VALUE
V$SQL_PLAN
SQL_ID
PLAN_HASH_VALUE DBA_OBJECTS
OBJECT_ID
OBJECT_NAME
OBJECT_TYPEV$SQL_BIND_CAPTURE
SQL_ID
NAME
DATATYPE_STRING
VALUE_STRING
V$SQL
SQL_ID
SQL_FULLTEXT
V$SESSION
SID
USERNAME
SQL_ID
PROGRAM
MODULE
ACTION
PLAN_HASH_VALUE
V$SQLAREA
SQL_ID
EXECUTIONS
PARSE_CALLS
BUFFER_GETS
DISK_READS
V$SESSION_WAIT
SID
EVENT
P1, P1RAW, P2, P2RAW, P3, P3RAW
STATE (WAITING, WAITED…)
• Oracle 10g added this info to V$SESSION
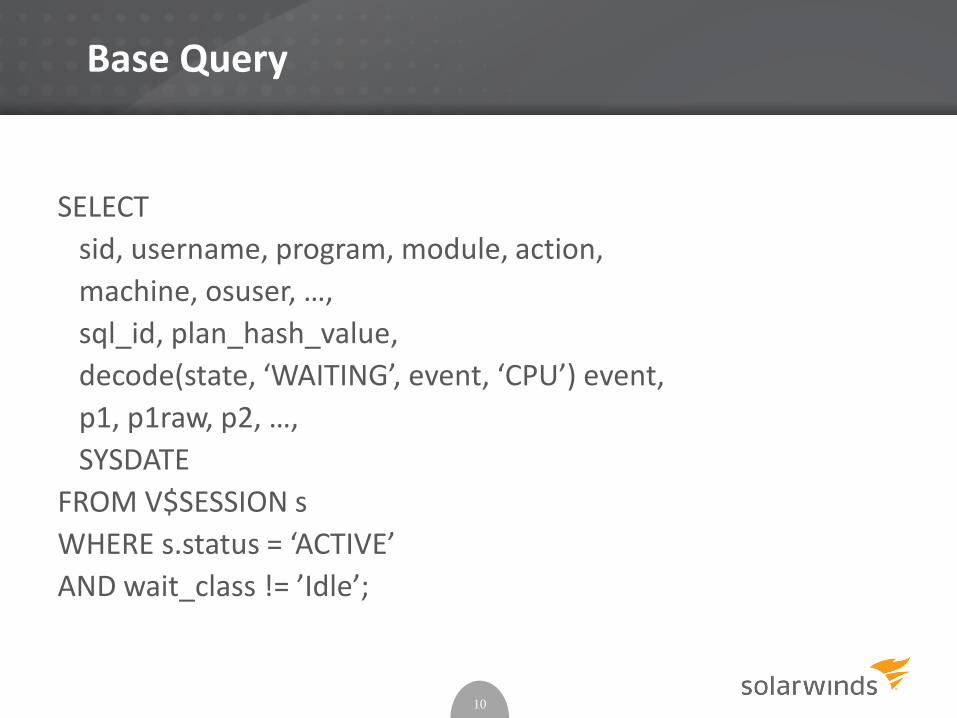
Base Query
SELECT
sid, username, program, module, action,
machine, osuser, …,
sql_id, plan_hash_value,
decode(state, ‘WAITING’, event, ‘CPU’) event,
p1, p1raw, p2, …,
SYSDATE
FROM V$SESSION s
WHERE s.status = ‘ACTIVE’
AND wait_class != ’Idle’;
10
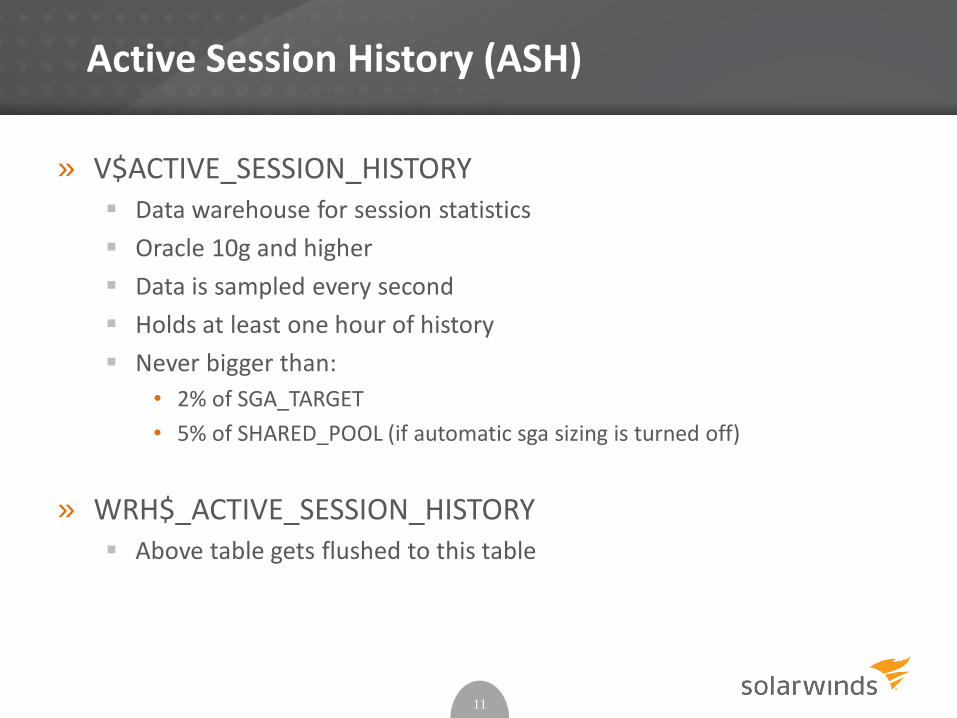
Active Session History (ASH)
» V$ACTIVE_SESSION_HISTORY Data warehouse for session statistics
Oracle 10g and higher
Data is sampled every second
Holds at least one hour of history
Never bigger than:
• 2% of SGA_TARGET
• 5% of SHARED_POOL (if automatic sga sizing is turned off)
» WRH$_ACTIVE_SESSION_HISTORY Above table gets flushed to this table
11
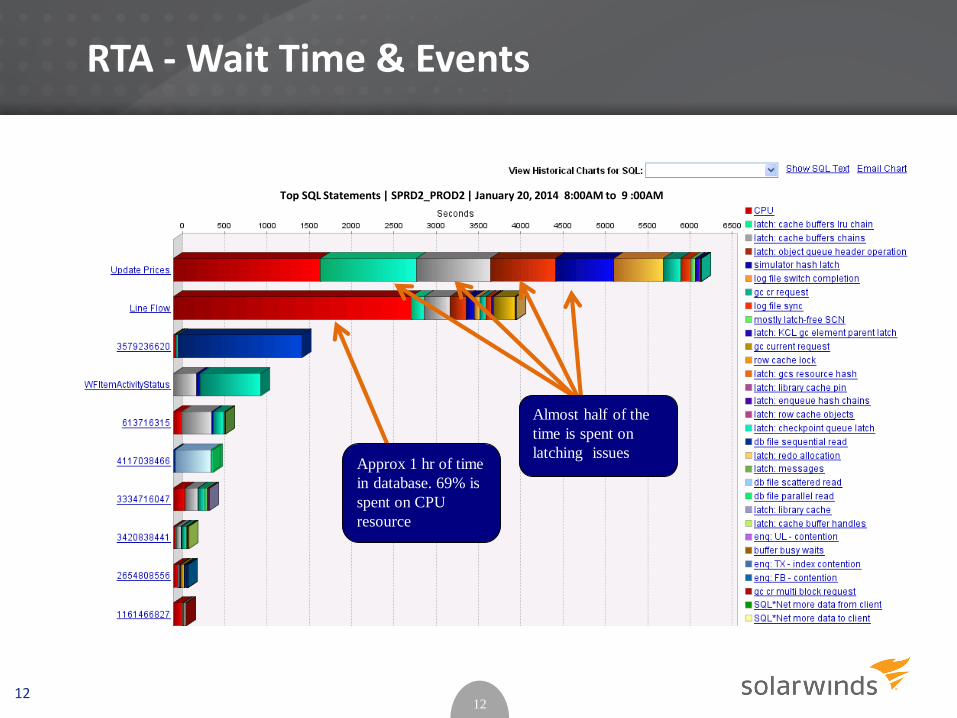
RTA - Wait Time & Events
1212
Approx 1 hr of time
in database. 69% is
spent on CPU
resource
Almost half of the
time is spent on
latching issues
Top SQL Statements | SPRD2_PROD2 | January 20, 2014 8:00AM to 9 :00AM
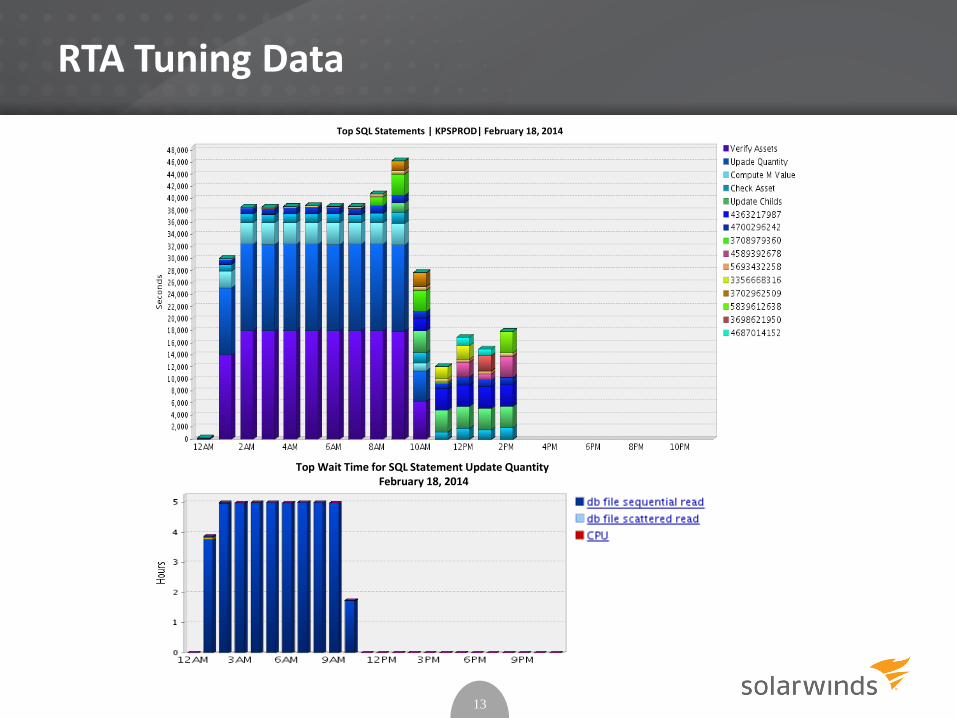
RTA Tuning Data
13
Top SQL Statements | KPSPROD| February 18, 2014
Top Wait Time for SQL Statement Update QuantityFebruary 18, 2014
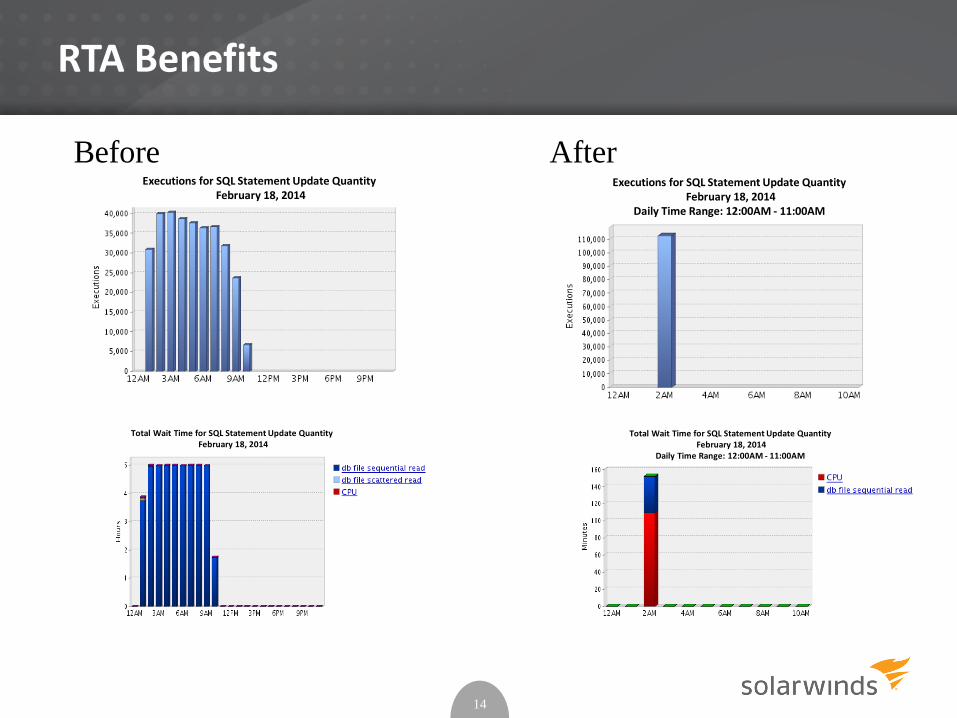
RTA Benefits
14
Before After Executions for SQL Statement Update Quantity
February 18, 2014
Total Wait Time for SQL Statement Update QuantityFebruary 18, 2014
Total Wait Time for SQL Statement Update QuantityFebruary 18, 2014
Daily Time Range: 12:00AM - 11:00AM
Executions for SQL Statement Update QuantityFebruary 18, 2014
Daily Time Range: 12:00AM - 11:00AM
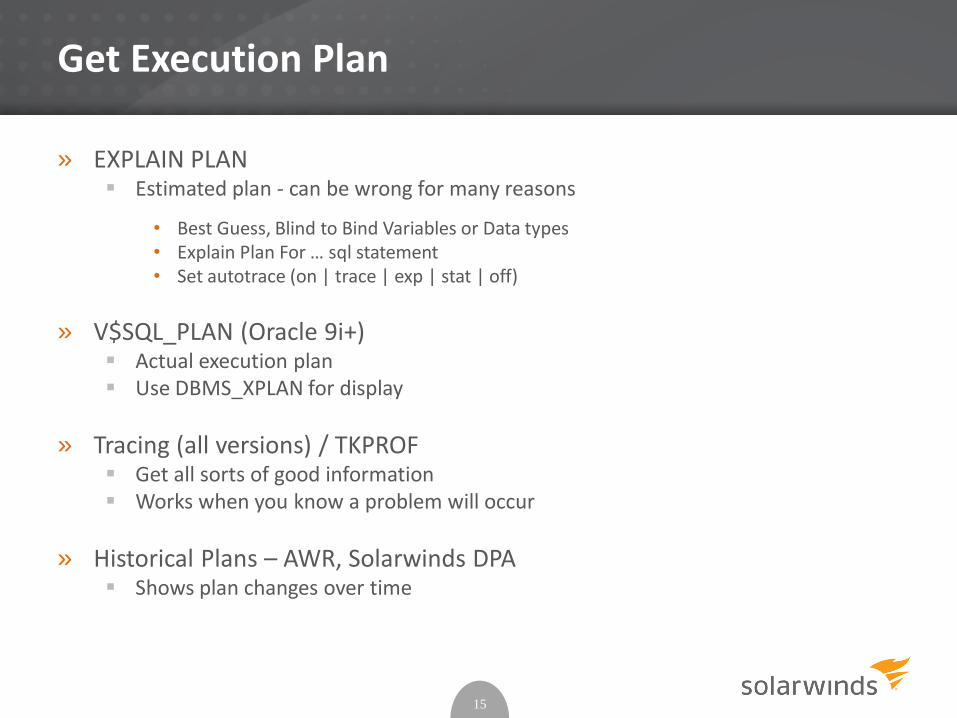
Get Execution Plan
» EXPLAIN PLAN Estimated plan - can be wrong for many reasons
• Best Guess, Blind to Bind Variables or Data types• Explain Plan For … sql statement• Set autotrace (on | trace | exp | stat | off)
» V$SQL_PLAN (Oracle 9i+) Actual execution plan Use DBMS_XPLAN for display
» Tracing (all versions) / TKPROF Get all sorts of good information Works when you know a problem will occur
» Historical Plans – AWR, Solarwinds DPA Shows plan changes over time
15
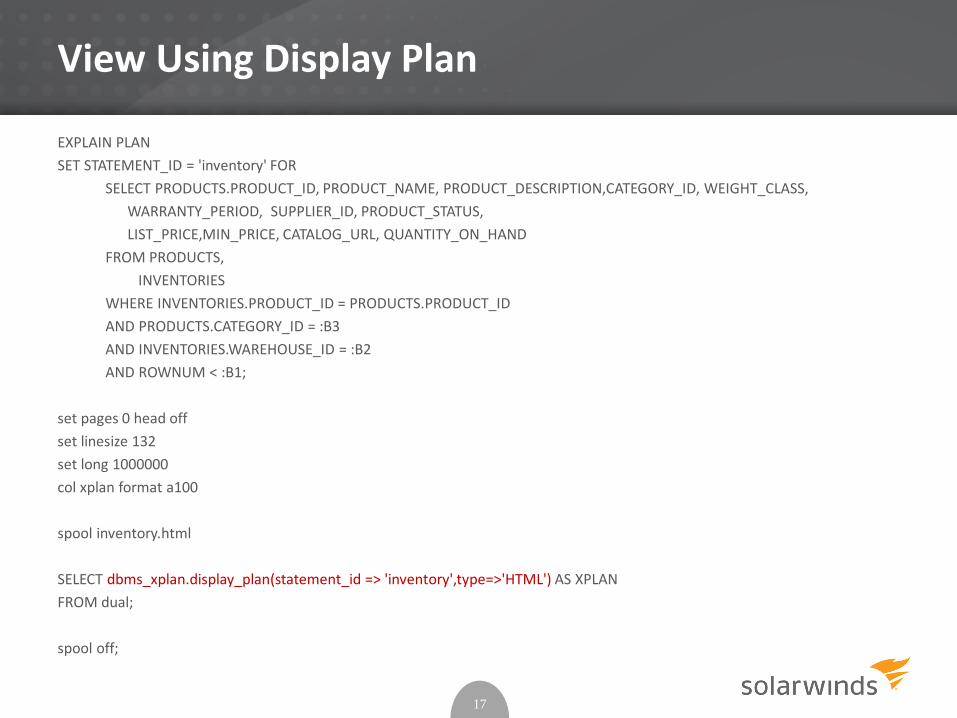
View Using Display Plan
EXPLAIN PLAN
SET STATEMENT_ID = 'inventory' FOR
SELECT PRODUCTS.PRODUCT_ID, PRODUCT_NAME, PRODUCT_DESCRIPTION,CATEGORY_ID, WEIGHT_CLASS,
WARRANTY_PERIOD, SUPPLIER_ID, PRODUCT_STATUS,
LIST_PRICE,MIN_PRICE, CATALOG_URL, QUANTITY_ON_HAND
FROM PRODUCTS,
INVENTORIES
WHERE INVENTORIES.PRODUCT_ID = PRODUCTS.PRODUCT_ID
AND PRODUCTS.CATEGORY_ID = :B3
AND INVENTORIES.WAREHOUSE_ID = :B2
AND ROWNUM < :B1;
set pages 0 head off
set linesize 132
set long 1000000
col xplan format a100
spool inventory.html
SELECT dbms_xplan.display_plan(statement_id => 'inventory',type=>'HTML') AS XPLAN
FROM dual;
spool off;
17
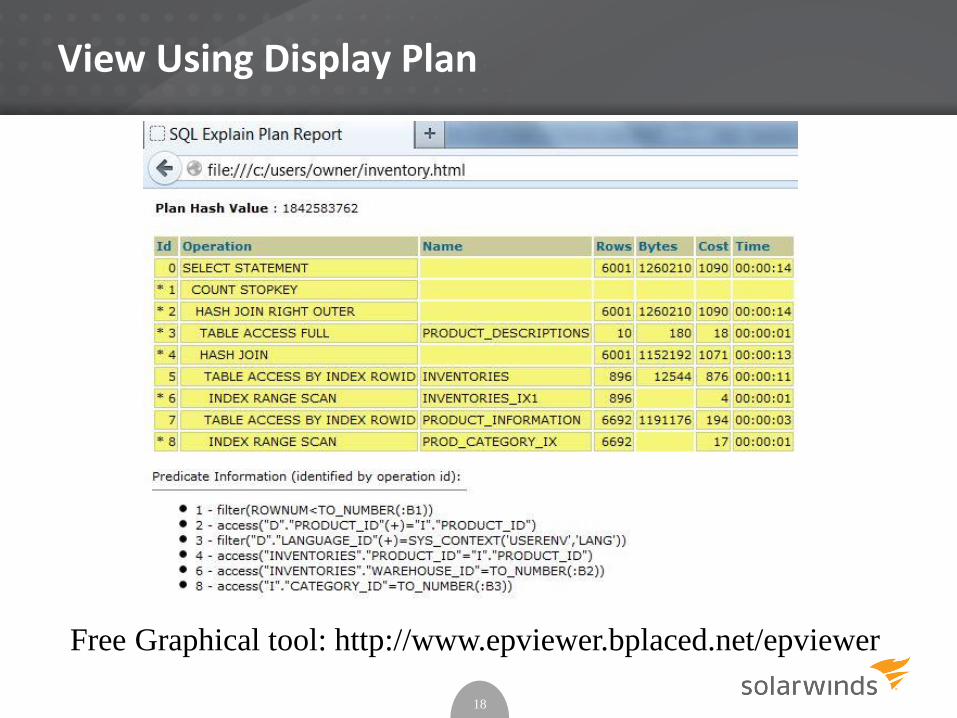
View Using Display Plan
18
Free Graphical tool: http://www.epviewer.bplaced.net/epviewer
© 2014 SOLARWINDS WORLDWIDE, LLC. ALL RIGHTS
RESERVED.
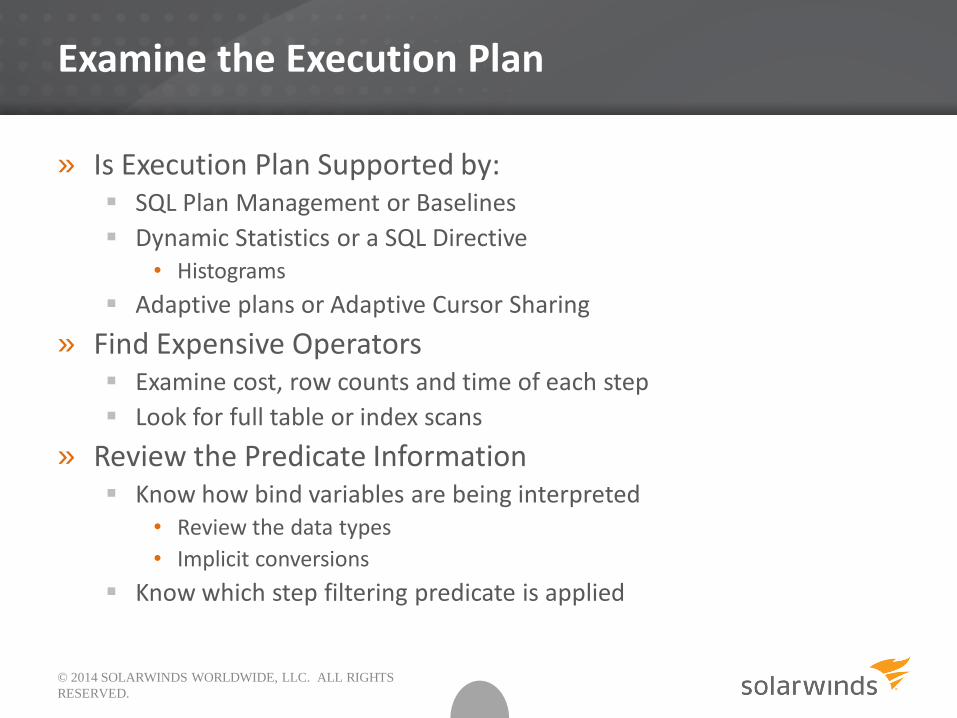
Examine the Execution Plan
» Is Execution Plan Supported by: SQL Plan Management or Baselines
Dynamic Statistics or a SQL Directive• Histograms
Adaptive plans or Adaptive Cursor Sharing
» Find Expensive Operators Examine cost, row counts and time of each step
Look for full table or index scans
» Review the Predicate Information Know how bind variables are being interpreted
• Review the data types
• Implicit conversions
Know which step filtering predicate is applied
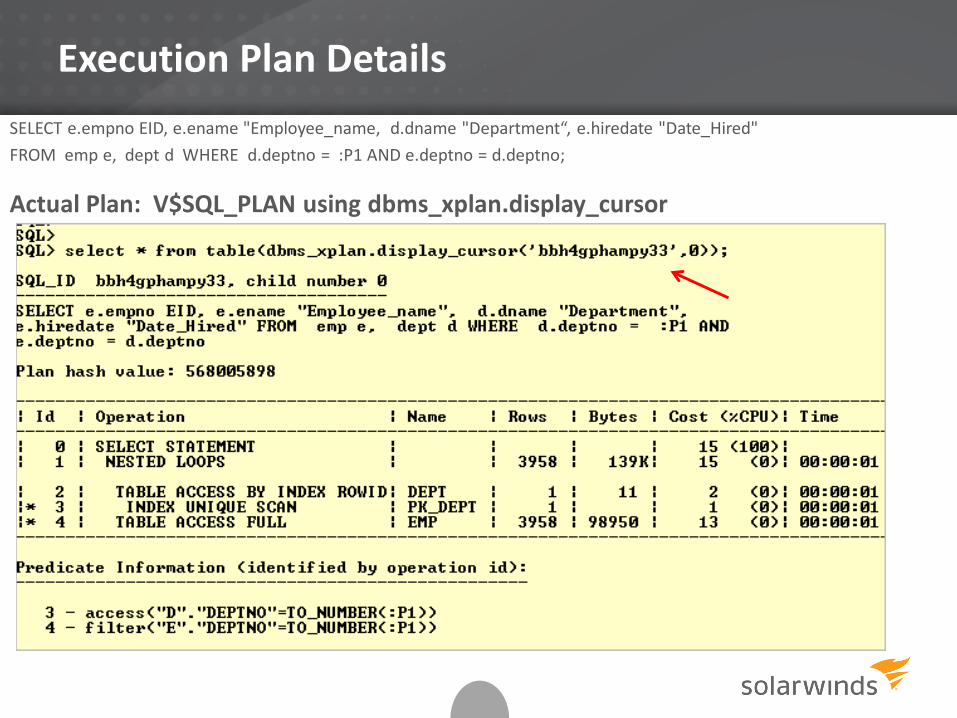
Execution Plan Details
SELECT e.empno EID, e.ename "Employee_name, d.dname "Department“, e.hiredate "Date_Hired"
FROM emp e, dept d WHERE d.deptno = :P1 AND e.deptno = d.deptno;
Actual Plan: V$SQL_PLAN using dbms_xplan.display_cursor
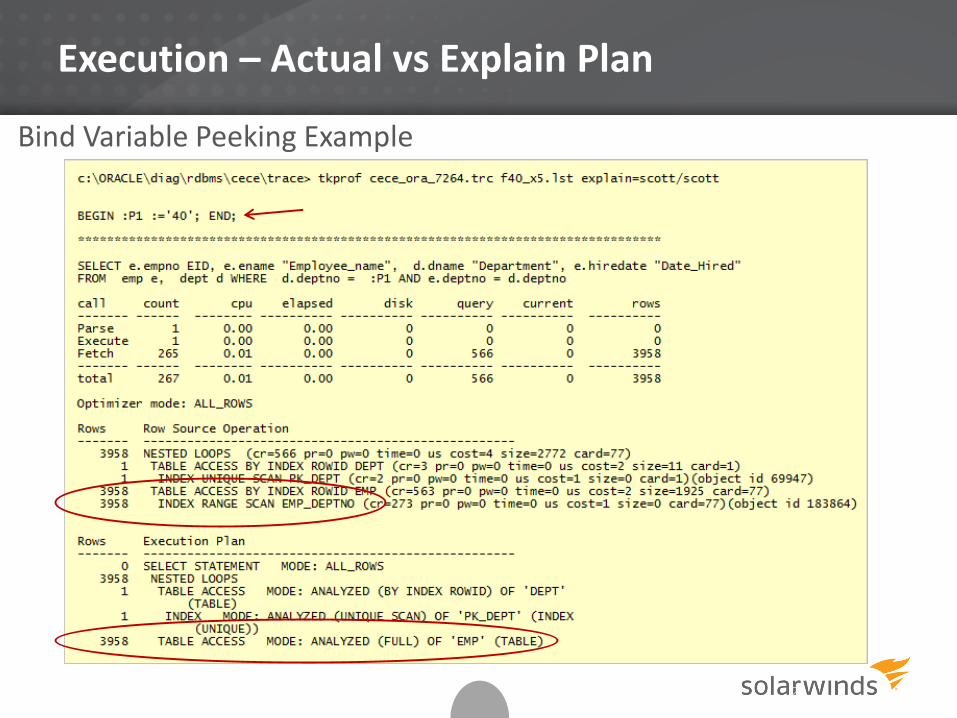
Execution – Actual vs Explain Plan
Bind Variable Peeking Example
21
© 2014 SOLARWINDS WORLDWIDE, LLC. ALL RIGHTS
RESERVED.
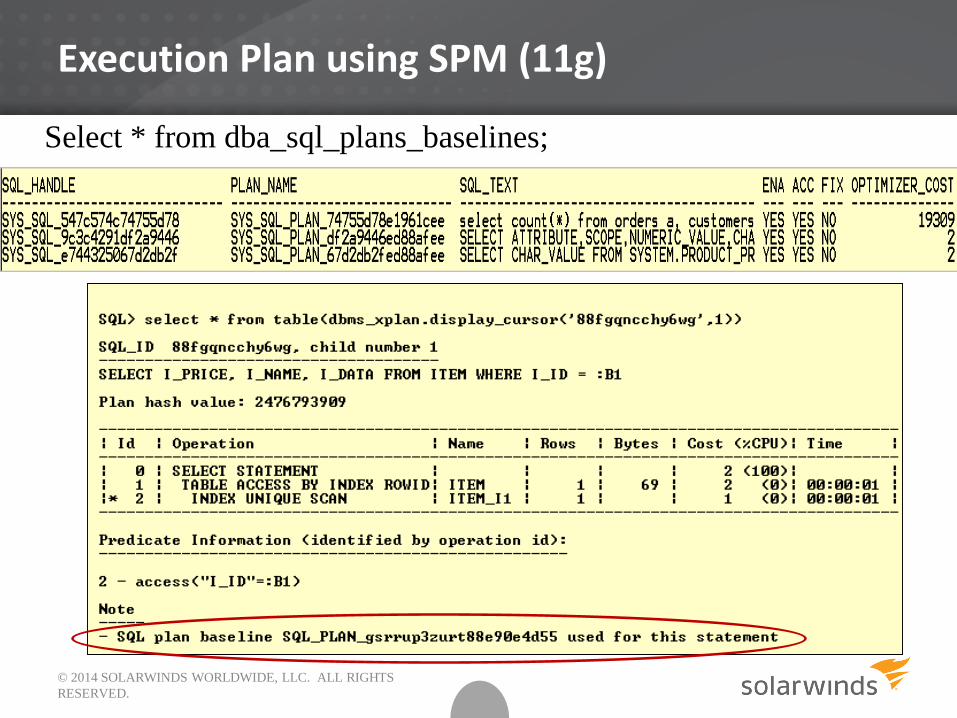
Execution Plan using SPM (11g)
Select * from dba_sql_plans_baselines;
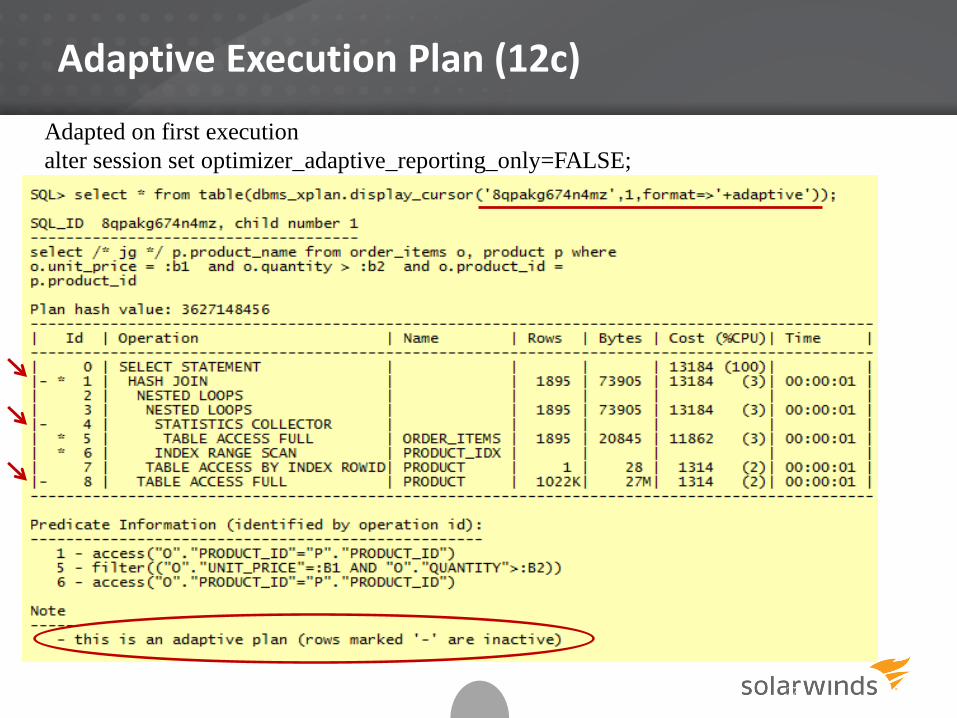
Adaptive Execution Plan (12c)
2323
Adapted on first execution
alter session set optimizer_adaptive_reporting_only=FALSE;
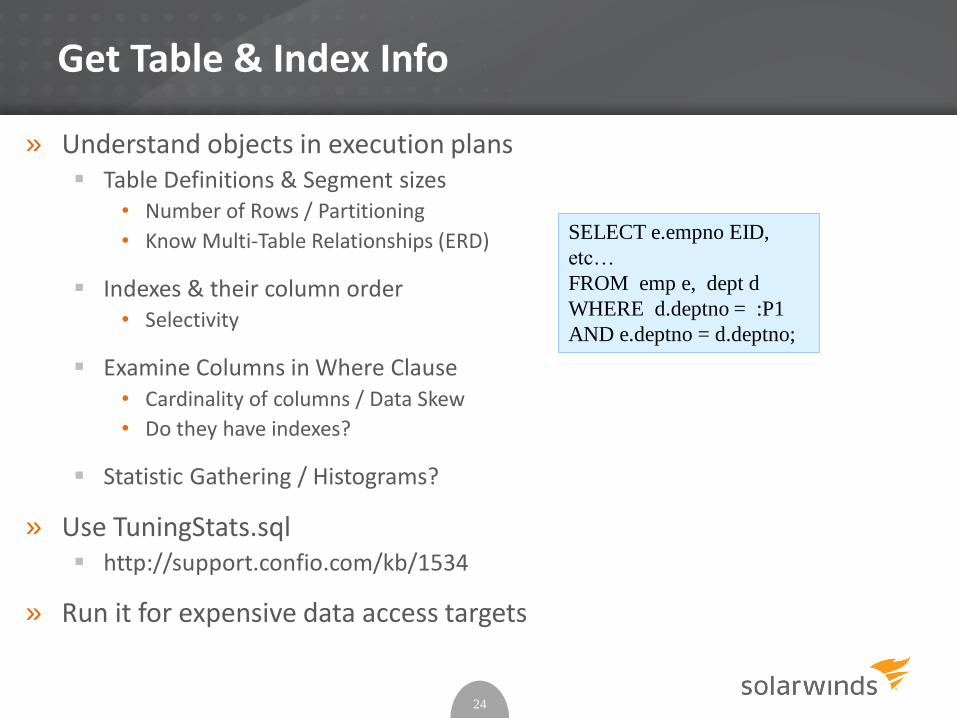
Get Table & Index Info
» Understand objects in execution plans Table Definitions & Segment sizes
• Number of Rows / Partitioning
• Know Multi-Table Relationships (ERD)
Indexes & their column order• Selectivity
Examine Columns in Where Clause• Cardinality of columns / Data Skew
• Do they have indexes?
Statistic Gathering / Histograms?
» Use TuningStats.sql http://support.confio.com/kb/1534
» Run it for expensive data access targets
24
SELECT e.empno EID,
etc…
FROM emp e, dept d
WHERE d.deptno = :P1
AND e.deptno = d.deptno;
© 2014 SOLARWINDS WORLDWIDE, LLC. ALL RIGHTS
RESERVED.
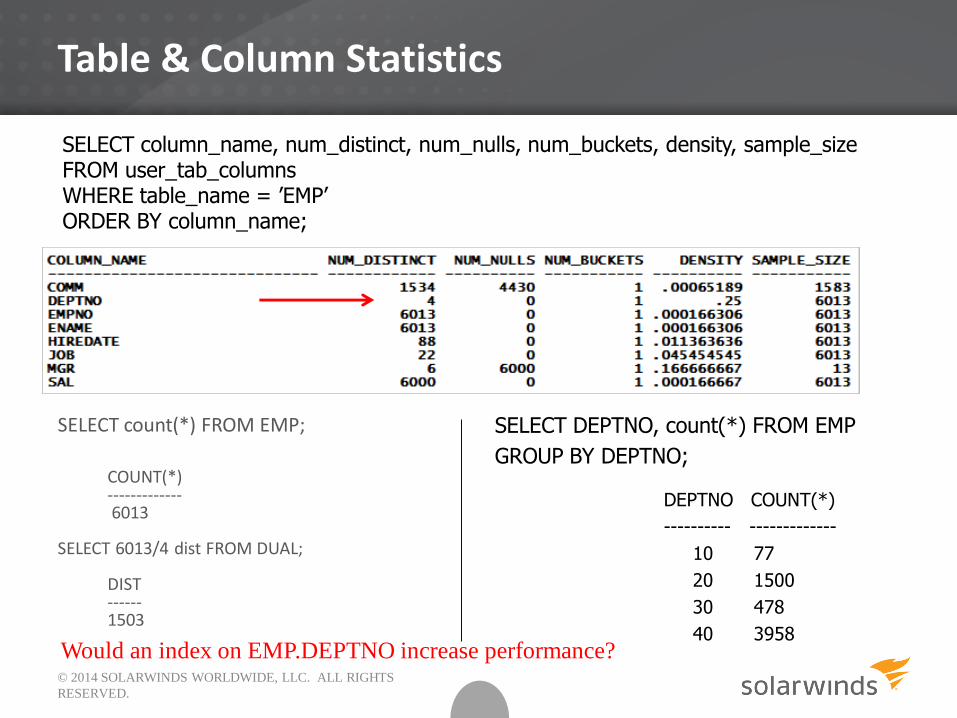
Table & Column Statistics
SELECT count(*) FROM EMP;
COUNT(*)-------------6013
SELECT 6013/4 dist FROM DUAL;
DIST------1503
SELECT column_name, num_distinct, num_nulls, num_buckets, density, sample_sizeFROM user_tab_columnsWHERE table_name = ’EMP’ORDER BY column_name;
SELECT DEPTNO, count(*) FROM EMP
GROUP BY DEPTNO;
DEPTNO COUNT(*)
---------- -------------
10 77
20 1500
30 478
40 3958Would an index on EMP.DEPTNO increase performance?
Gather Run-Time Metrics
» Get baseline metrics How long does it take now
What is acceptable (10 sec, 2 min, 1 hour)
Get number of Buffer Gets
• Measurement to compare against while tuning.
» Collect Wait Event Information Locking / Blocking (enq)
I/O problem (db file sequential read)
Latch contention (latch)
Network slowdown (SQL*Net)
May be multiple issues
All have different resolutions
26
© 2014 SOLARWINDS WORLDWIDE, LLC. ALL RIGHTS
RESERVED.
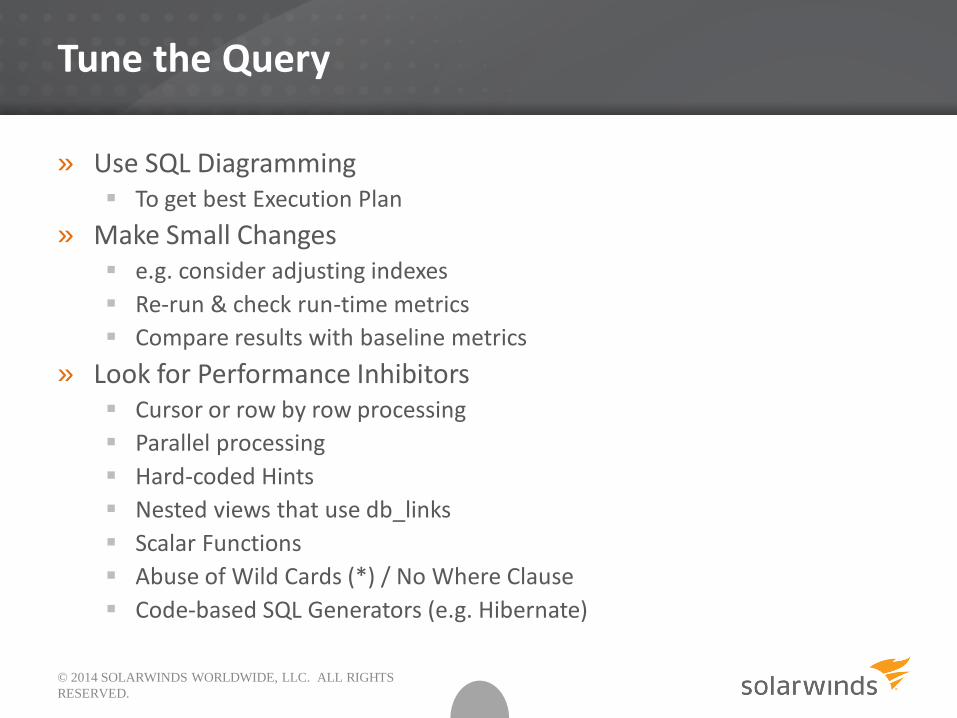
Tune the Query
» Use SQL Diagramming To get best Execution Plan
» Make Small Changes e.g. consider adjusting indexes
Re-run & check run-time metrics
Compare results with baseline metrics
» Look for Performance Inhibitors Cursor or row by row processing
Parallel processing
Hard-coded Hints
Nested views that use db_links
Scalar Functions
Abuse of Wild Cards (*) / No Where Clause
Code-based SQL Generators (e.g. Hibernate)
Case Studies
» Who registered yesterday for Tuning Class
» Lookup paycheck information
» Inventory lookup for new orders by customer
28
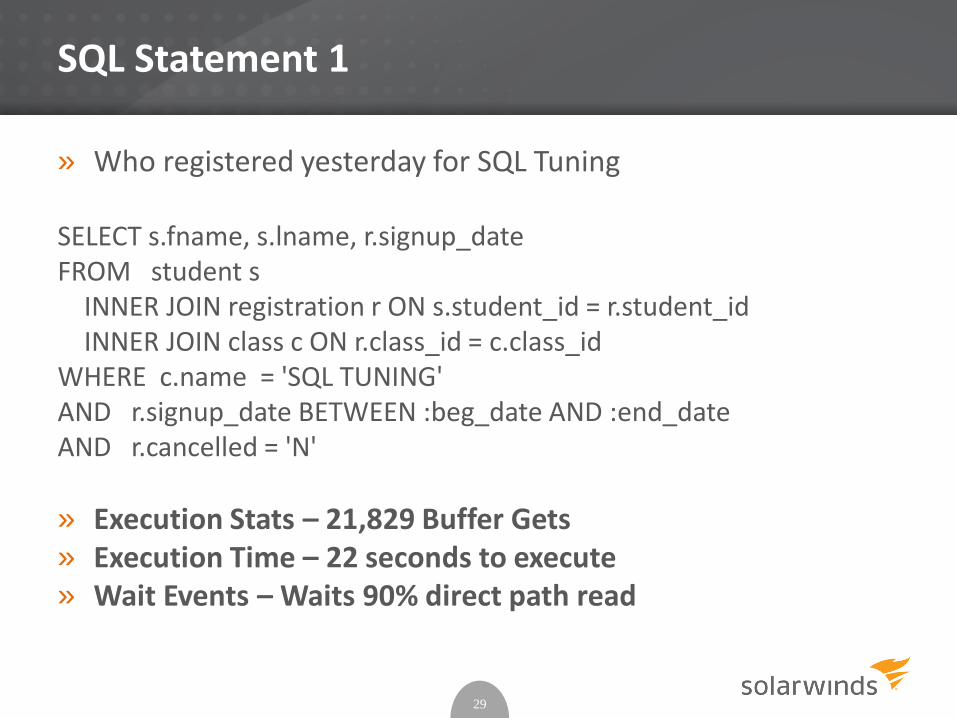
SQL Statement 1
» Who registered yesterday for SQL Tuning
SELECT s.fname, s.lname, r.signup_dateFROM student s
INNER JOIN registration r ON s.student_id = r.student_idINNER JOIN class c ON r.class_id = c.class_id
WHERE c.name = 'SQL TUNING'AND r.signup_date BETWEEN :beg_date AND :end_dateAND r.cancelled = 'N'
» Execution Stats – 21,829 Buffer Gets» Execution Time – 22 seconds to execute» Wait Events – Waits 90% direct path read
29
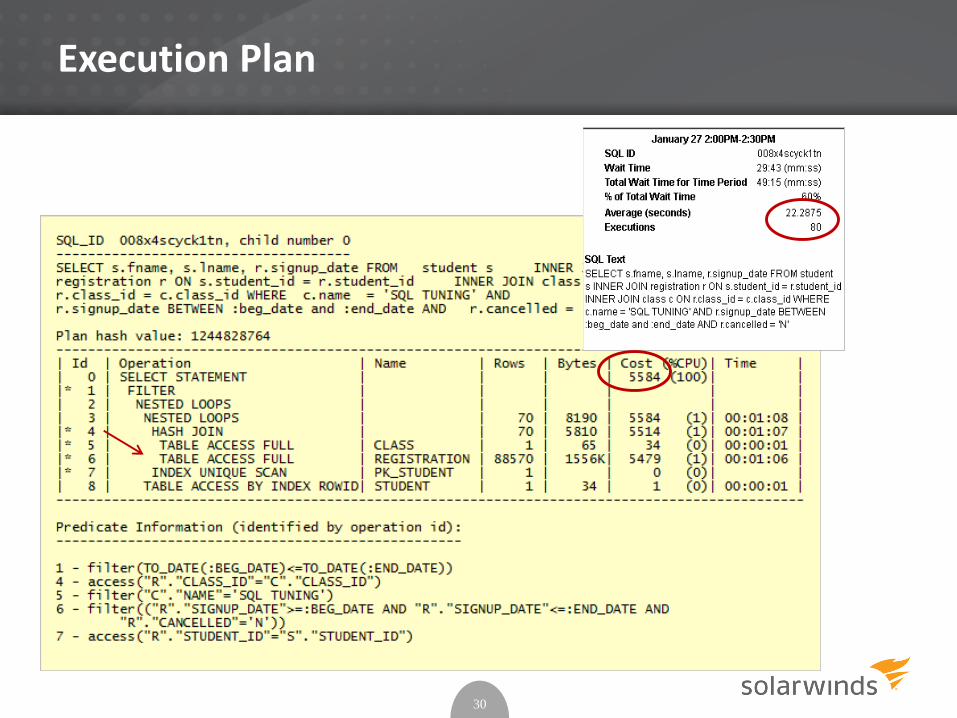
Execution Plan
30
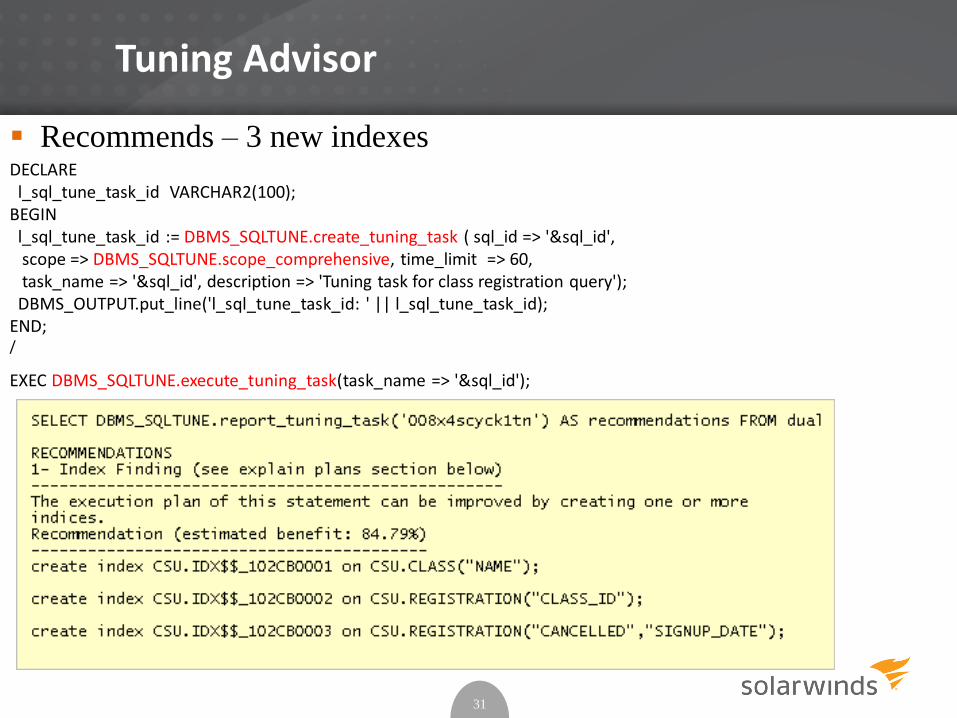
Tuning Advisor
31
Recommends – 3 new indexesDECLAREl_sql_tune_task_id VARCHAR2(100);
BEGINl_sql_tune_task_id := DBMS_SQLTUNE.create_tuning_task ( sql_id => '&sql_id', scope => DBMS_SQLTUNE.scope_comprehensive, time_limit => 60, task_name => '&sql_id', description => 'Tuning task for class registration query');DBMS_OUTPUT.put_line('l_sql_tune_task_id: ' || l_sql_tune_task_id);
END;/
EXEC DBMS_SQLTUNE.execute_tuning_task(task_name => '&sql_id');
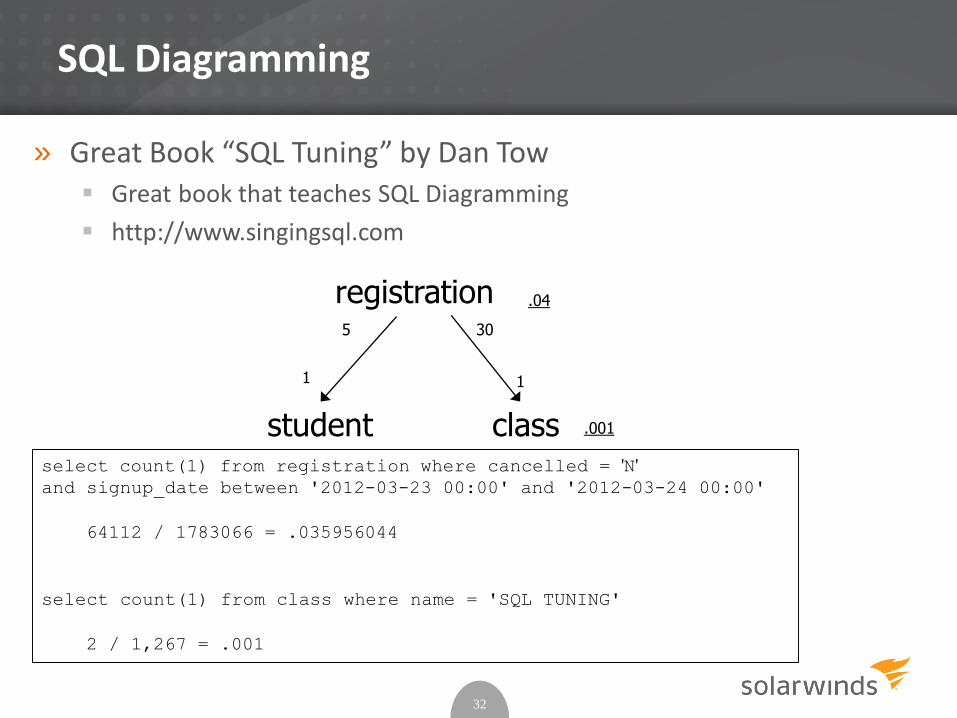
SQL Diagramming
» Great Book “SQL Tuning” by Dan Tow Great book that teaches SQL Diagramming
http://www.singingsql.com
32
registration
student class
5
1
30
1
.04
.001
select count(1) from registration where cancelled = 'N'
and signup_date between '2012-03-23 00:00' and '2012-03-24 00:00'
64112 / 1783066 = .035956044
select count(1) from class where name = 'SQL TUNING'
2 / 1,267 = .001
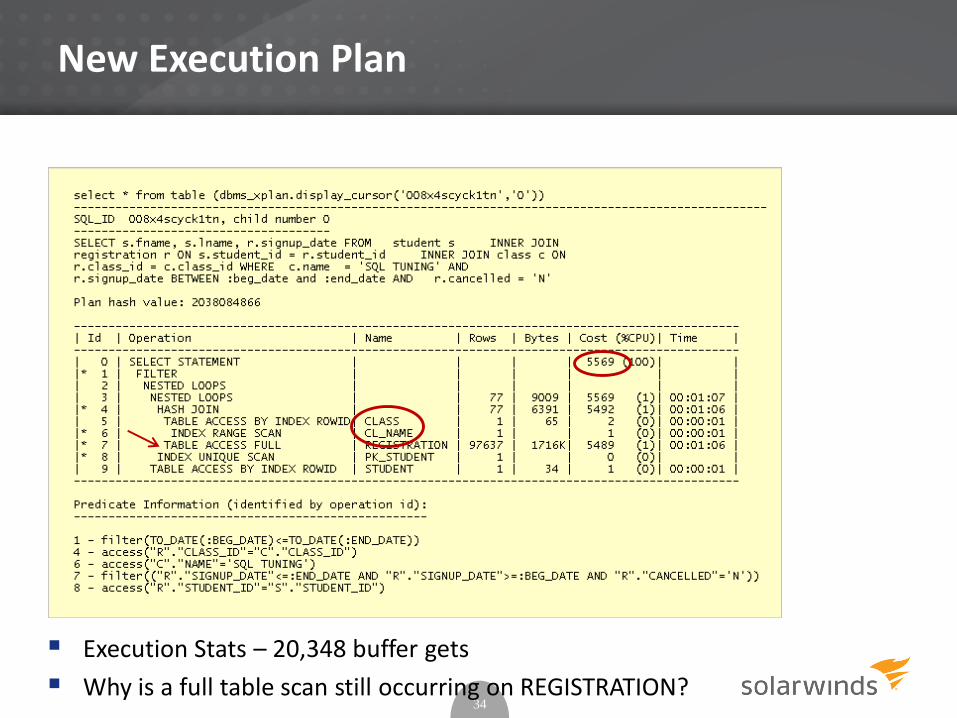
New Execution Plan
34
Execution Stats – 20,348 buffer gets
Why is a full table scan still occurring on REGISTRATION?
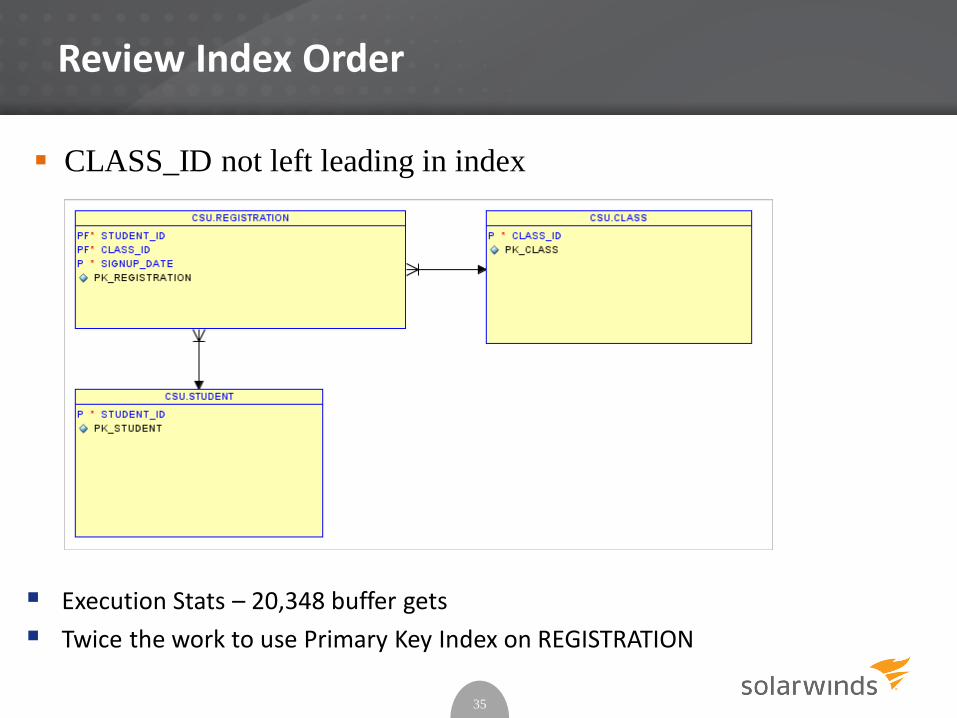
Review Index Order
35
Execution Stats – 20,348 buffer gets
Twice the work to use Primary Key Index on REGISTRATION
CLASS_ID not left leading in index
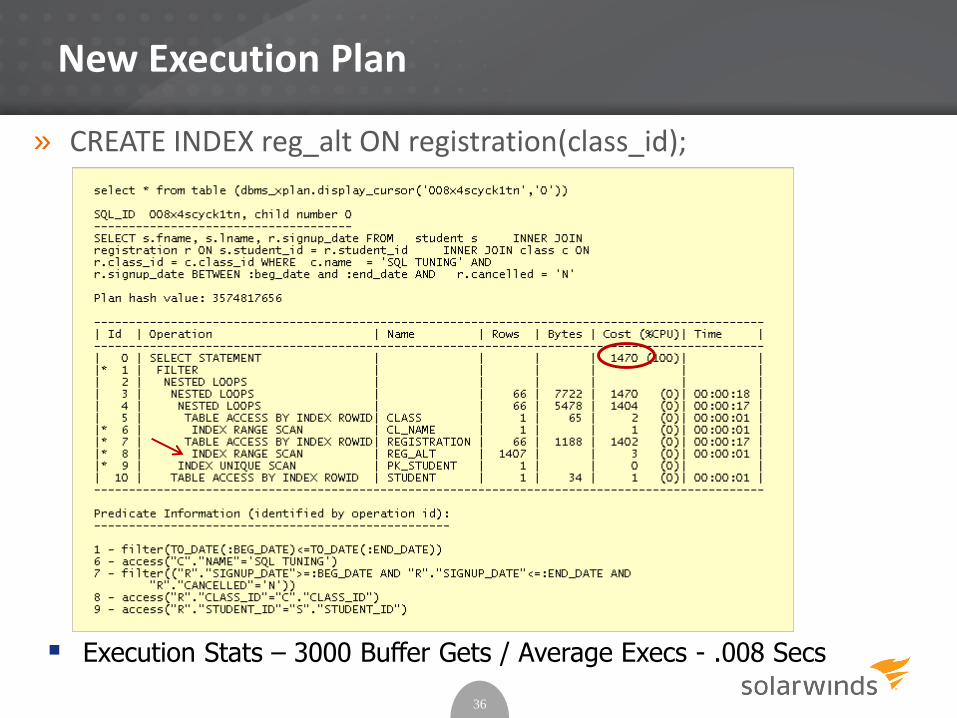
New Execution Plan
» CREATE INDEX reg_alt ON registration(class_id);
36
Execution Stats – 3000 Buffer Gets / Average Execs - .008 Secs
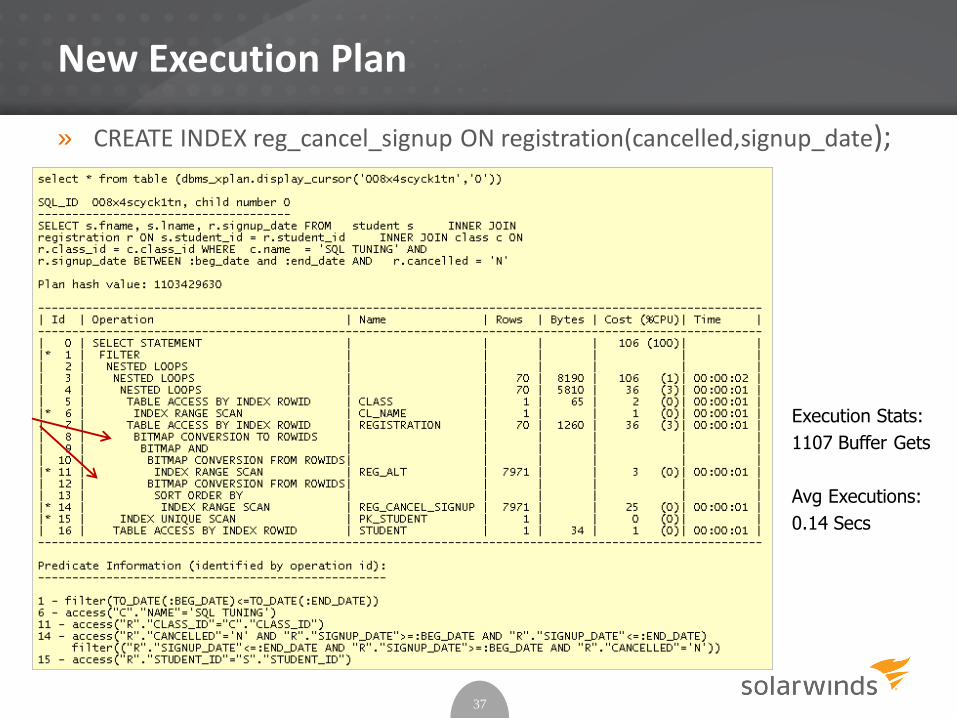
New Execution Plan
» CREATE INDEX reg_cancel_signup ON registration(cancelled,signup_date);
37
Execution Stats:
1107 Buffer Gets
Avg Executions:
0.14 Secs
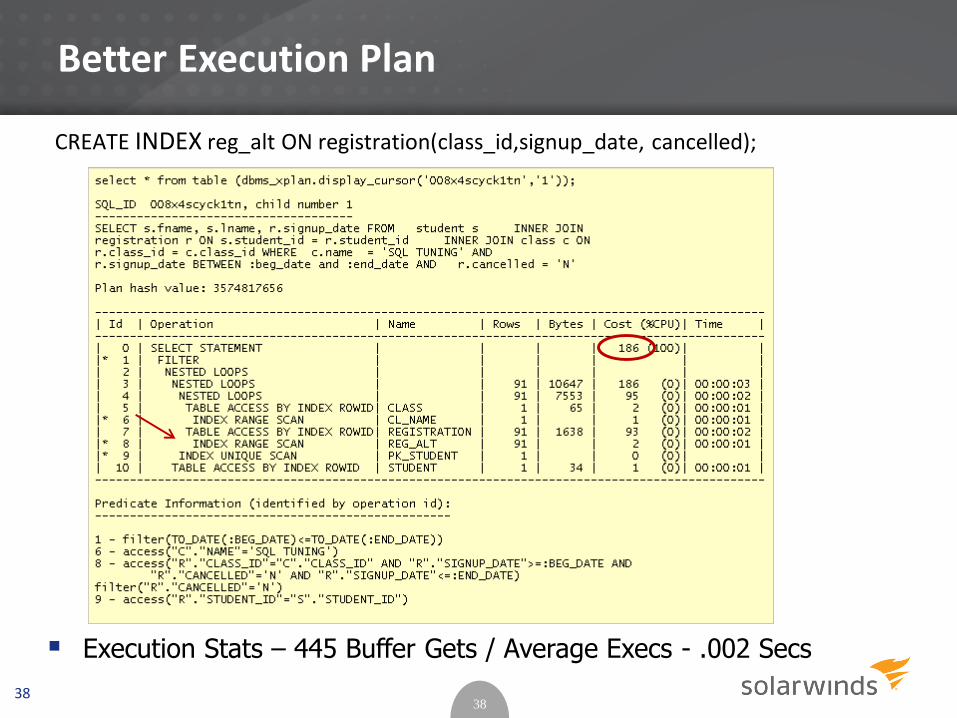
Better Execution Plan
3838
CREATE INDEX reg_alt ON registration(class_id,signup_date, cancelled);
Execution Stats – 445 Buffer Gets / Average Execs - .002 Secs
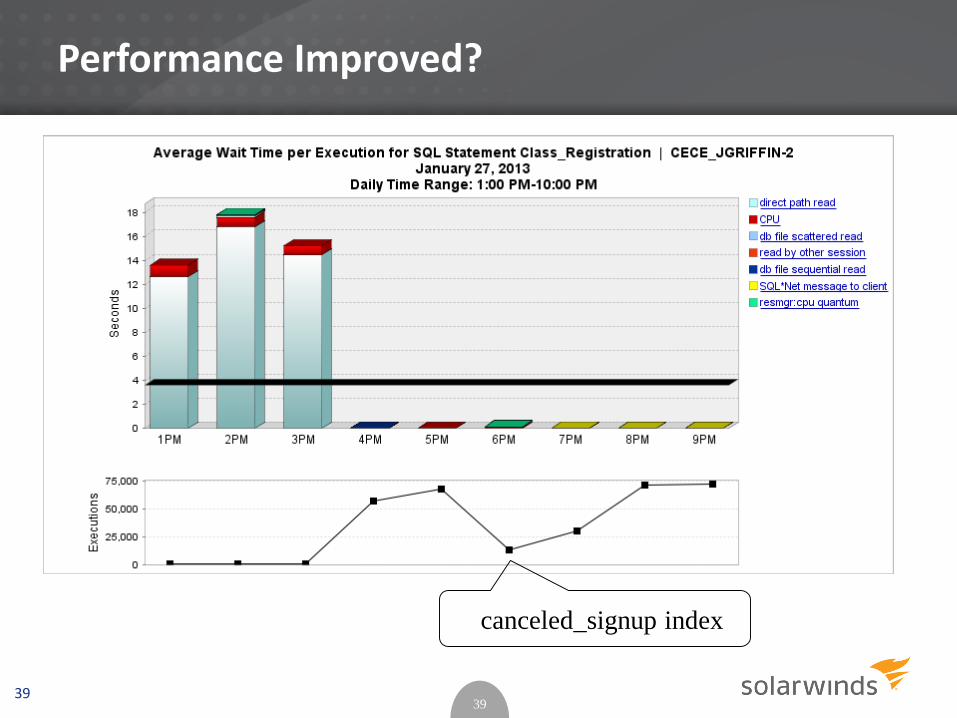
Performance Improved?
3939
canceled_signup index
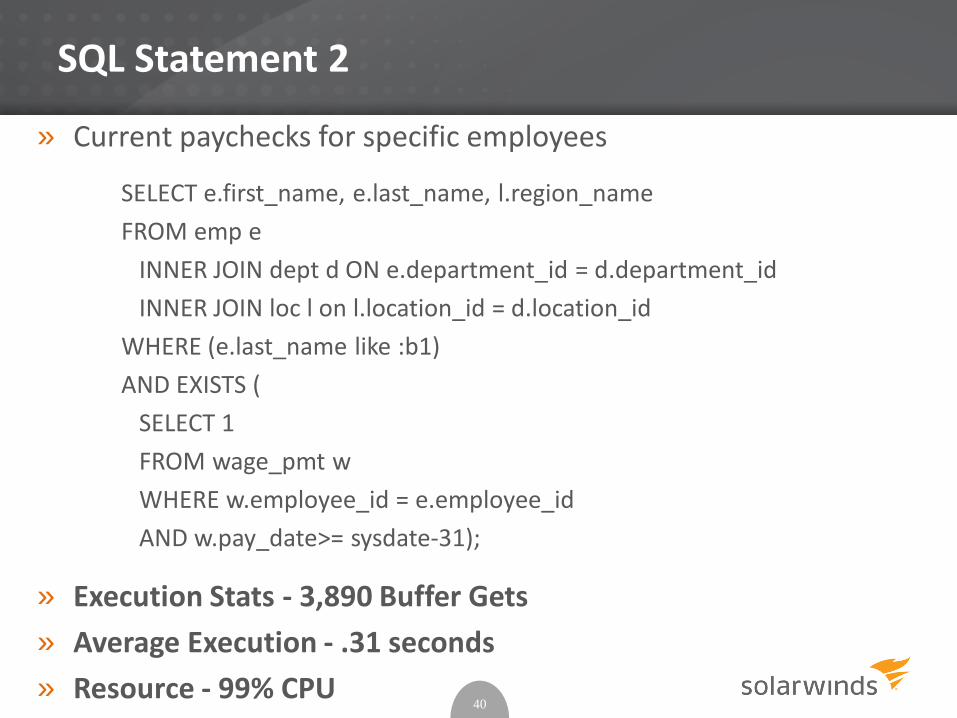
SQL Statement 2
» Current paychecks for specific employees
SELECT e.first_name, e.last_name, l.region_name
FROM emp e
INNER JOIN dept d ON e.department_id = d.department_id
INNER JOIN loc l on l.location_id = d.location_id
WHERE (e.last_name like :b1)
AND EXISTS (
SELECT 1
FROM wage_pmt w
WHERE w.employee_id = e.employee_id
AND w.pay_date>= sysdate-31);
» Execution Stats - 3,890 Buffer Gets
» Average Execution - .31 seconds
» Resource - 99% CPU40

Execution Plan
41
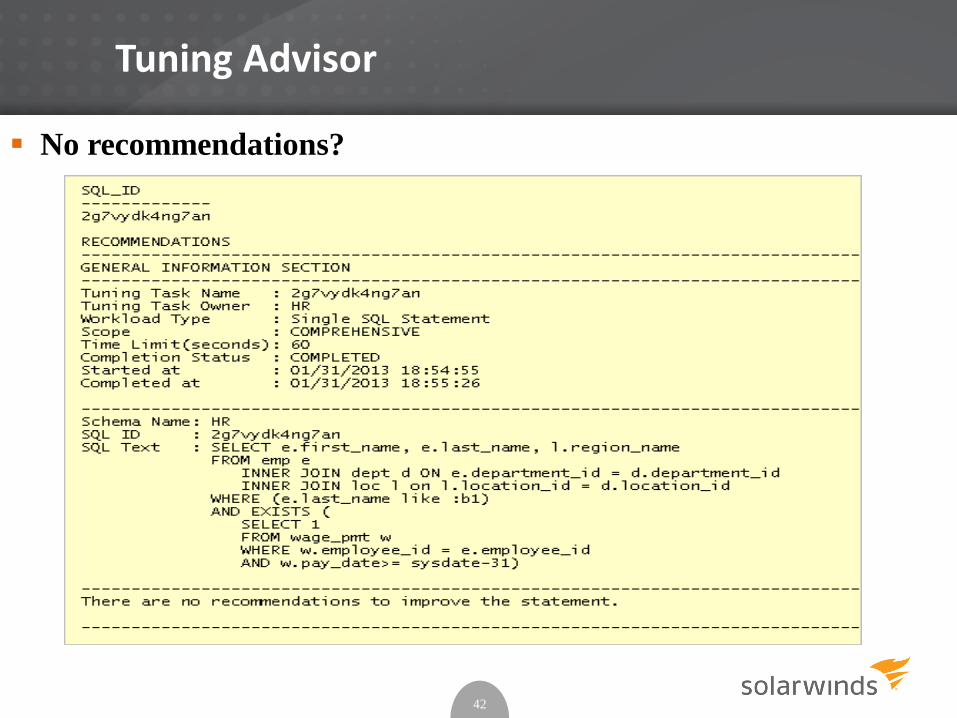
Tuning Advisor
42
No recommendations?
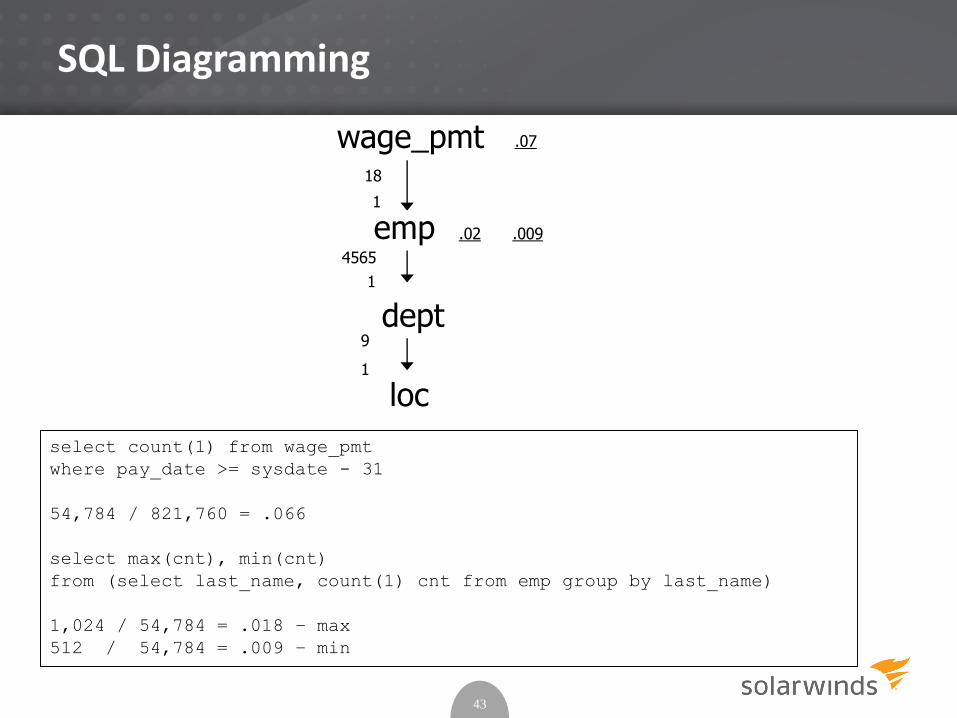
SQL Diagramming
43
select count(1) from wage_pmt
where pay_date >= sysdate - 31
54,784 / 821,760 = .066
select max(cnt), min(cnt)
from (select last_name, count(1) cnt from emp group by last_name)
1,024 / 54,784 = .018 – max
512 / 54,784 = .009 – min
emp
dept
wage_pmt
4565
1
18
1
.02
.07
loc1
9
.009
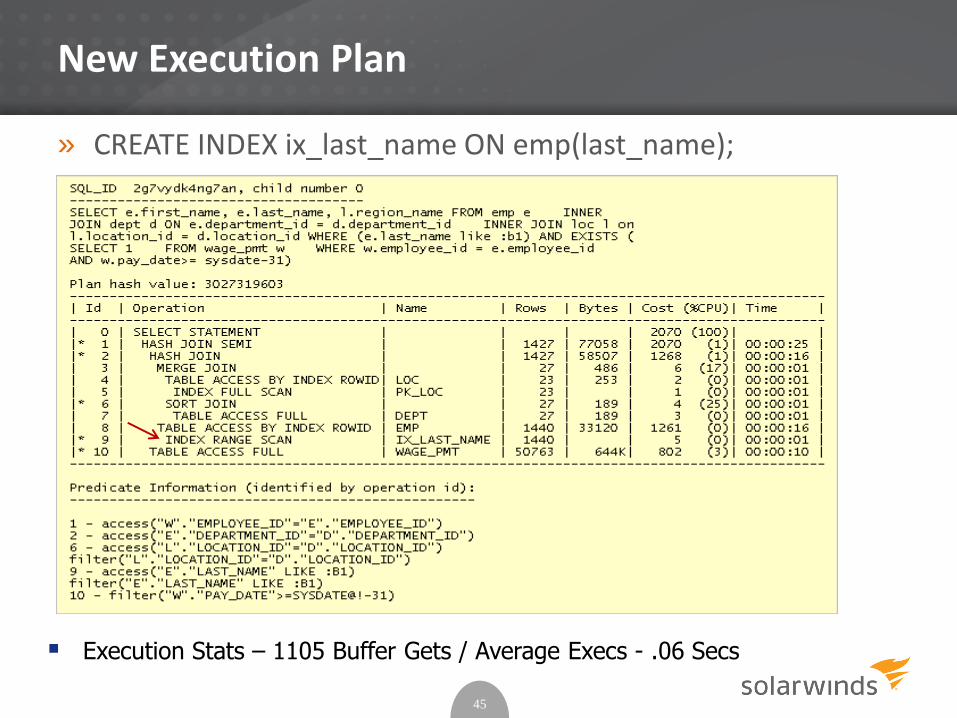
New Execution Plan
» CREATE INDEX ix_last_name ON emp(last_name);
45
Execution Stats – 1105 Buffer Gets / Average Execs - .06 Secs
New Execution Plan
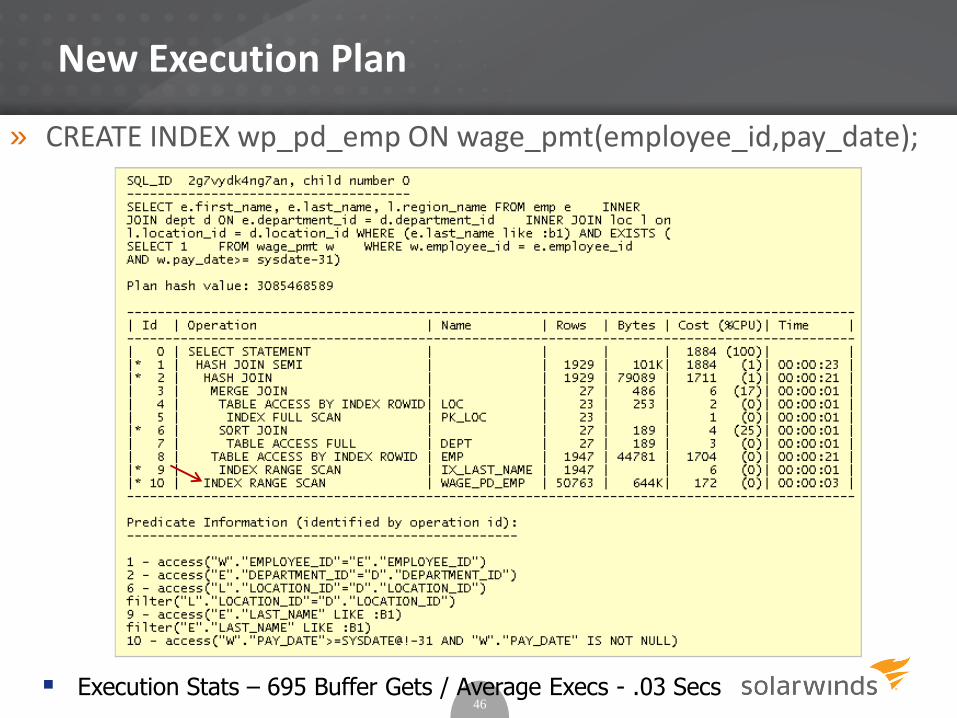
» CREATE INDEX wp_pd_emp ON wage_pmt(employee_id,pay_date);
46 Execution Stats – 695 Buffer Gets / Average Execs - .03 Secs
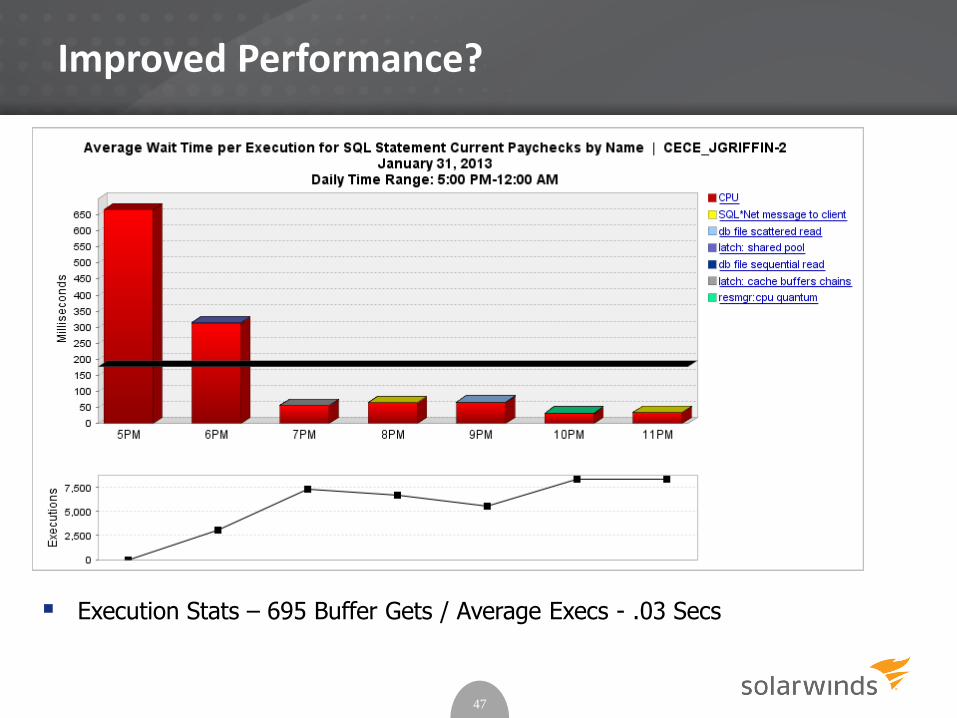
Improved Performance?
47
Execution Stats – 695 Buffer Gets / Average Execs - .03 Secs
SQL Statement 3
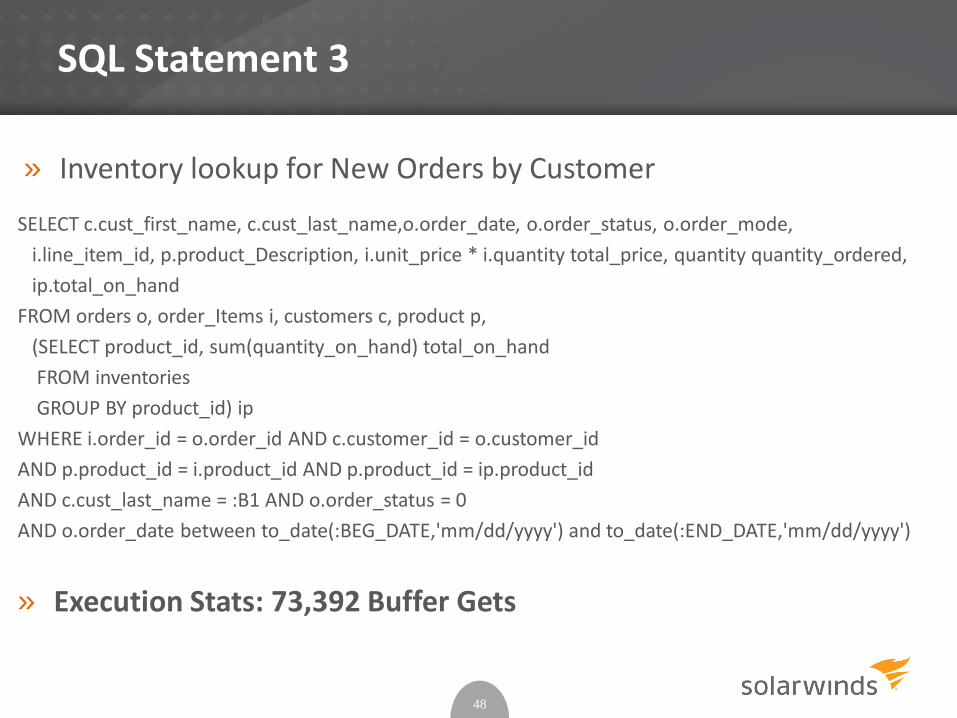
» Inventory lookup for New Orders by Customer
SELECT c.cust_first_name, c.cust_last_name,o.order_date, o.order_status, o.order_mode,
i.line_item_id, p.product_Description, i.unit_price * i.quantity total_price, quantity quantity_ordered,
ip.total_on_hand
FROM orders o, order_Items i, customers c, product p,
(SELECT product_id, sum(quantity_on_hand) total_on_hand
FROM inventories
GROUP BY product_id) ip
WHERE i.order_id = o.order_id AND c.customer_id = o.customer_id
AND p.product_id = i.product_id AND p.product_id = ip.product_id
AND c.cust_last_name = :B1 AND o.order_status = 0
AND o.order_date between to_date(:BEG_DATE,'mm/dd/yyyy') and to_date(:END_DATE,'mm/dd/yyyy')
» Execution Stats: 73,392 Buffer Gets
48
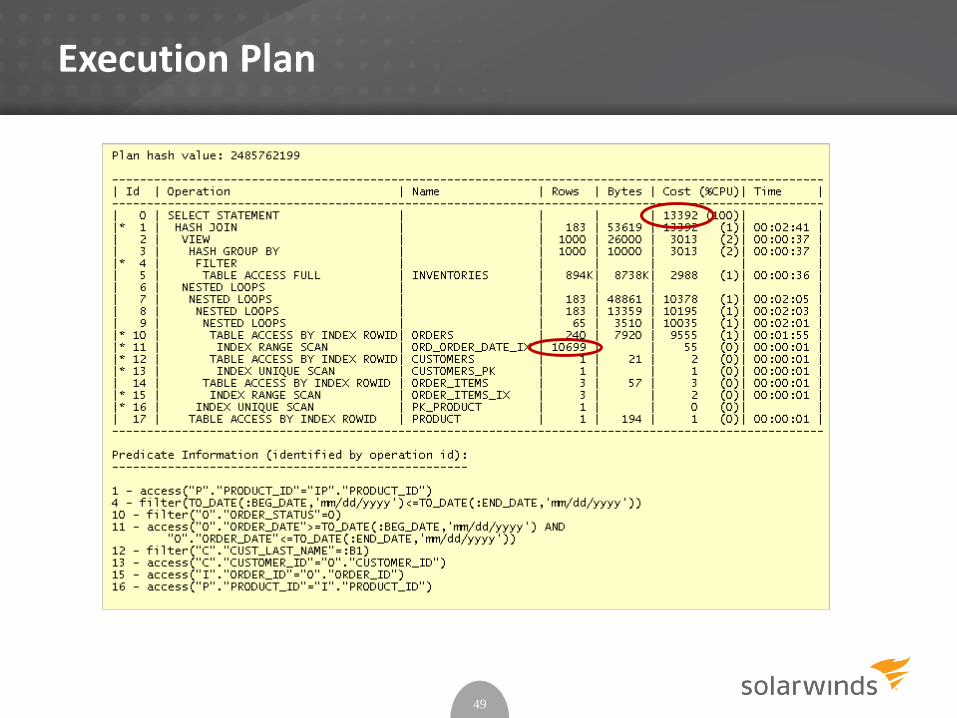
Execution Plan
49
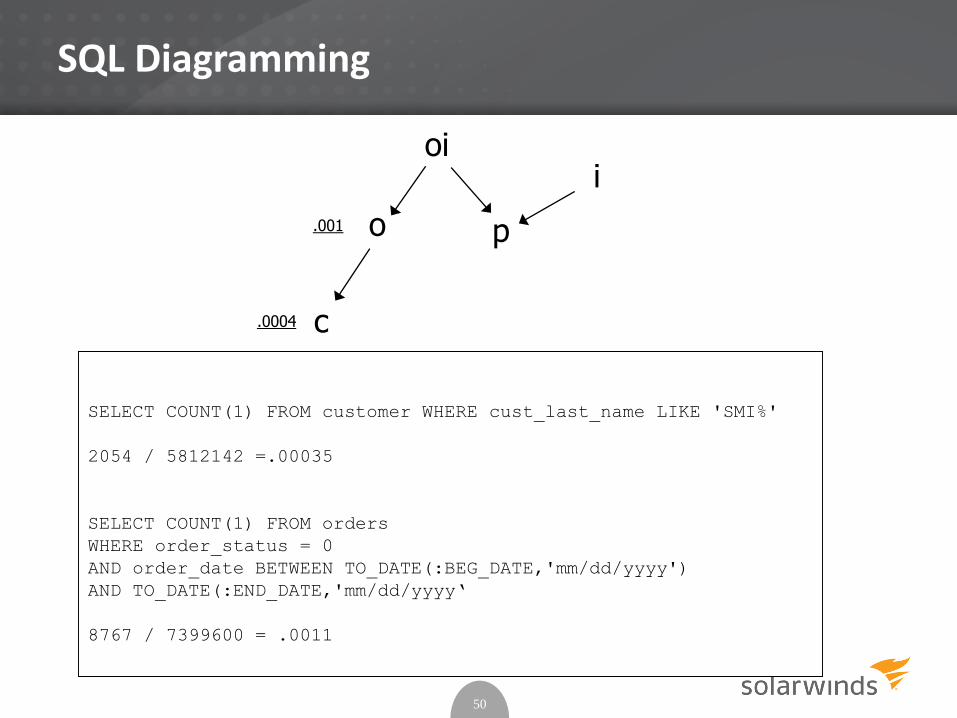
SQL Diagramming
50
SELECT COUNT(1) FROM customer WHERE cust_last_name LIKE 'SMI%'
2054 / 5812142 =.00035
SELECT COUNT(1) FROM orders
WHERE order_status = 0
AND order_date BETWEEN TO_DATE(:BEG_DATE,'mm/dd/yyyy')
AND TO_DATE(:END_DATE,'mm/dd/yyyy‘
8767 / 7399600 = .0011
oi
p
c
o
i
.001
.0004
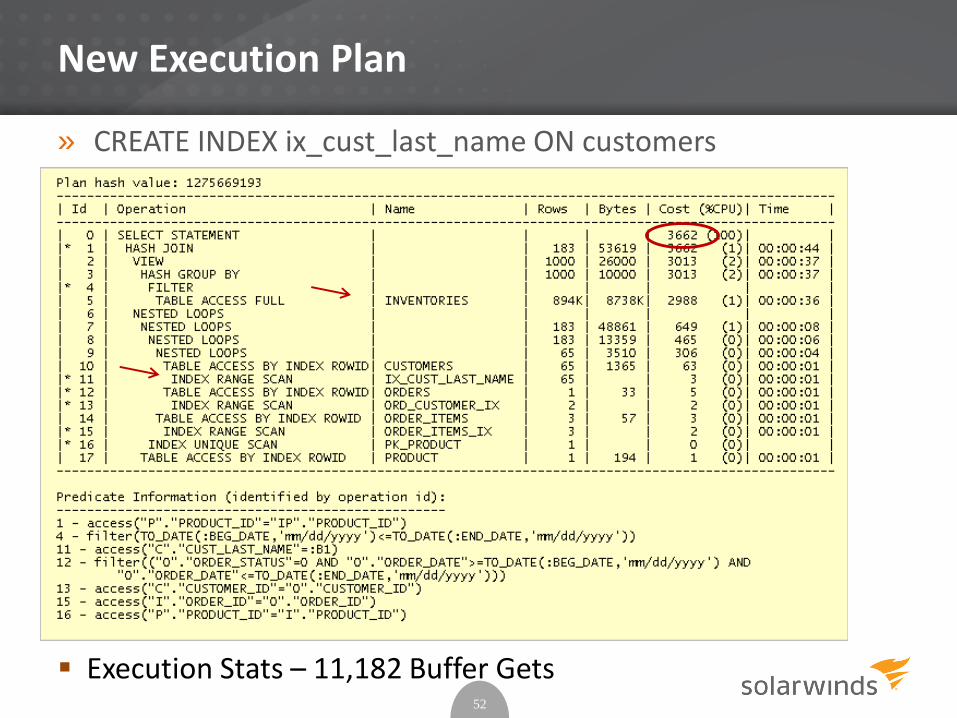
New Execution Plan
» CREATE INDEX ix_cust_last_name ON customers (cust_last_name);
52
Execution Stats – 11,182 Buffer Gets
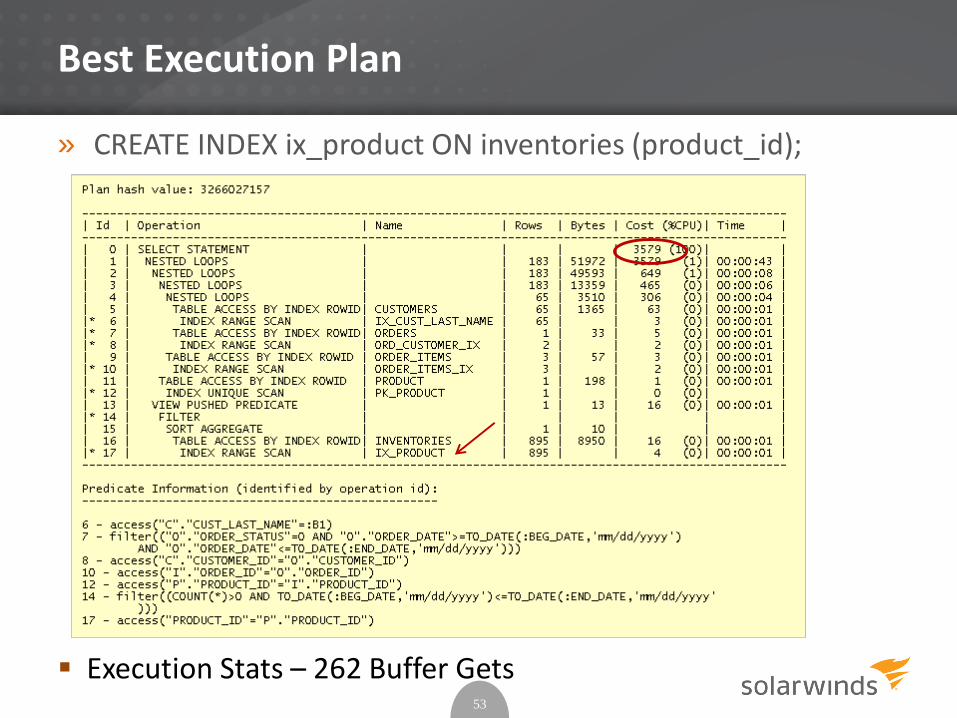
Best Execution Plan
» CREATE INDEX ix_product ON inventories (product_id);
53
Execution Stats – 262 Buffer Gets
Monitor
» Monitor the improvement Be able to prove that tuning made a difference
Take new metric measurements
Compare them to initial readings
Brag about the improvements – no one else will
» Monitor for next tuning opportunity Tuning is iterative
There is always room for improvement
Make sure you tune things that make a difference
» Shameless Product Pitch - DPA
55
© 2014 SOLARWINDS WORLDWIDE, LLC. ALL RIGHTS
RESERVED.
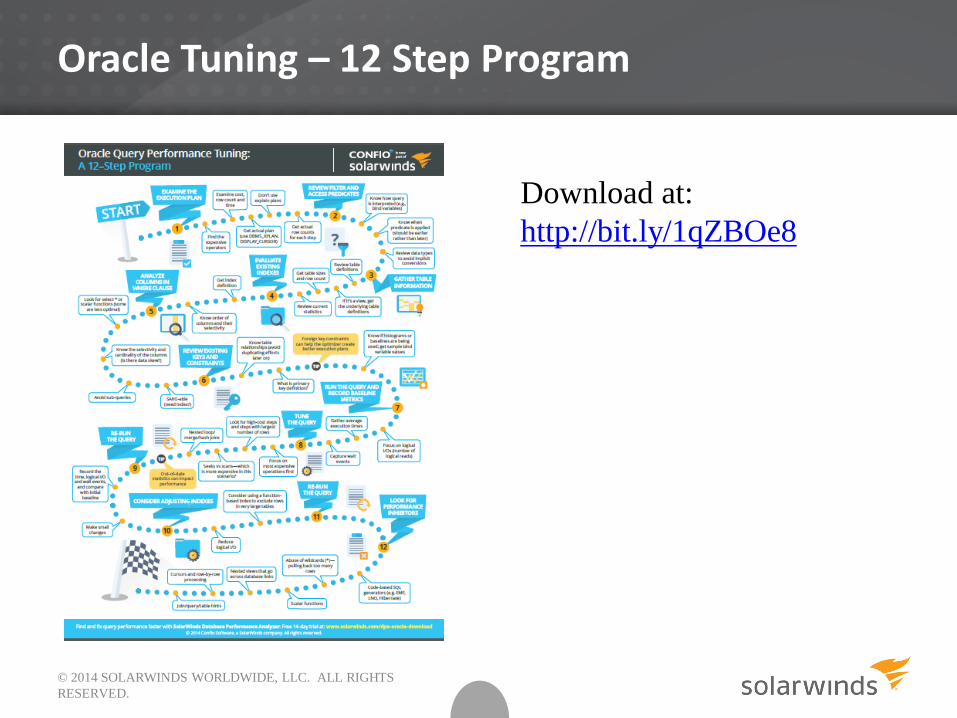
Oracle Tuning – 12 Step Program
Download at:
http://bit.ly/1qZBOe8
© 2014 SOLARWINDS WORLDWIDE, LLC. ALL RIGHTS
RESERVED.
Resolve performance issues quickly—free trial
» Try Database Performance Analyzer FREE for 14 days
» Improve root cause of slow performance Quickly identify root cause of issues that impact end-user response
time
See historical trends over days, months, and years
Understand impact of VMware® performance
Agentless architecture with no dependence on Oracle Packs, installs in minutes
www.solarwinds.com/dpa-download/

© 2014 SOLARWINDS WORLDWIDE, LLC. ALL RIGHTS
RESERVED.
Thank You!
The SOLARWINDS and SOLARWINDS & Design marks are the exclusive property of SolarWinds Worldwide, LLC, are registered with the U.S.
Patent and Trademark Office, and may be registered or pending registration in other countries. All other SolarWinds trademarks, service
marks, and logos may be common law marks, registered or pending registration in the United States or in other countries. All other
trademarks mentioned herein are used for identification purposes only and may be or are trademarks or registered trademarks of their respective
companies.