advanced vehicle propulsion technologies published 04/12/2010
TRANSCRIPT

ABSTRACTA critical element to the success of new propulsiontechnologies that enable reductions in fuel use is theintegration of component thermal management technologieswithin a viable vehicle package. Vehicle operation requiresvehicle thermal management systems capable of balancingthe needs of multiple vehicle systems that may require heatfor operation, require cooling to reject heat, or requireoperation within specified temperature ranges. As vehiclepropulsion transitions away from a single form of vehiclepropulsion based solely on conventional internal combustionengines (ICEs) toward a wider array of choices includingmore electrically dominant systems such as plug-in hybridelectric vehicles (PHEVs), new challenges arise associatedwith vehicle thermal management. As the number ofcomponents that require active thermal management increase,so do the costs in terms of dollars, weight, and size.Integrated vehicle thermal management is one pathway toaddress the cost, weight, and size challenges. The integrationof the power electronics and electric machine (PEEM)thermal management with other existing vehicle systems isone path for reducing the cost of electric drive systems. Thiswork demonstrates techniques for evaluating and quantifyingthe integrated transient and continuous heat loads ofcombined systems incorporating electric drive systems thatoperate primarily under transient duty cycles, but theapproach can be extended to include additional steady-stateduty cycles typical for designing vehicle thermalmanagement systems of conventional vehicles. The workcompares opportunities to create an integrated lowtemperature coolant loop combining the power electronicsand electric machine with the air conditioning system incontrast to a high temperature system integrated with the ICEcooling system
INTRODUCTIONVehicle thermal management systems are critical in terms ofsafety, reliability, performance, and passenger comfort. Theapplication of thermal management technologies to vehiclepropulsion technologies dominated by conventional internalcombustion engines (ICEs) developed gradually overapproximately the last hundred years, as shown by a patent in1919 related to engine cooling [1]. Changes in vehiclepropulsion configurations away from systems dominated byICEs and toward more electrically dominant systems withelectric drives will affect the potential heat load balancewithin a vehicle and require new techniques to meet themultiple demands placed on vehicle thermal managementsystems.
Since they were first introduced in the United States in 1999,interest in hybrid electric vehicles (HEVs) has grown. Thedevelopment of HEVs promoted the development of criticalelectric drive technologies applicable not only to HEVs butalso to other advanced vehicle technologies incorporatingelectric drive systems. Examples include plug-in hybridelectric vehicles (PHEVs), electric vehicles (EVs), and fuelcell vehicles (FCVs). The adoption of electric drive systemsbrings additional thermal management requirementsassociated with energy storage, power electronics, andelectric machines that can experience significant transientthermal loading. In addition to these new requirements, theconventional methods for vehicle thermal management areimpacted by the transition to alternate propulsion systems lessdependent on continuous operation of an ICE.
The additional thermal management requirements associatedwith electric drive systems are a recognized challenge interms of costs related to the thermal management hardware,not only in terms of dollars but also in weight and size thatimpact the overall vehicle mass, cargo space, componentpackaging space, and total component count. Due to the
Integrated Vehicle Thermal Management forAdvanced Vehicle Propulsion Technologies
2010-01-0836Published
04/12/2010
Kevin Bennion and Matthew ThorntonNational Renewable Energy Laboratory
NREL/CP-540-48288. Posted with permission. Presented at the 2010 SAE World Congress and Exhibition, April 13-15, 2010, Detroit, Michigan

thermal management challenges, the Department of Energy(DOE) supports research and development in thermalmanagement of electric drive technologies through theVehicle Technologies Program. The research includes theEnergy Storage System (ESS) activity and the AdvancedPower Electronics and Electric Machine (APEEM) activity.
Within the ESS and APEEM activities, the research goals areoften tied to assumptions related to available coolanttemperatures. The assumptions associated with coolanttemperature have a dramatic impact on the research goals, thetechnical targets, and the ultimate direction of technologydevelopment. Determining the impact of the cooling systemrequires a higher level vehicle system view of how coolingsystems are integrated into an overall vehicle thermalmanagement strategy for alternative vehicle configurationsthat reduce fuel use. This work is an initial attempt to addressthe need by proposing a method to quantify the integratedheat loads of combined thermal management systems over arange of usage conditions. This paper also provides an initialoverview of proposed methods for integrating the electricdrive thermal management systems with other vehiclethermal management systems.
REVIEW OF PRIOR WORKThe traditional impact of vehicle thermal managementsystems on overall vehicle efficiency can be grouped intothree general areas that include efforts to reduce thermalloads, transfer heat efficiently, and reuse available waste heat.Increasing the operating efficiency of components,transferring heat efficiently, or reducing the energy requiredfor the vehicle thermal management system to function hasbeen part of an active research task at the NationalRenewable Energy Laboratory (NREL) [2]. Specific actionsinclude research into solar-reflective glass, parked carventilation, naturally ventilated seating, and active climate-control seating. Another example includes improving theefficiency of air conditioning systems by matching theperformance to the need and thus avoiding reheat inconventional heating ventilation and air conditioning(HVAC) systems [2,3]. Also, the benefits of electroniccontrol of accessory loads such as pumps and valves[4,5,6,7,8] in relation to improved component operatingefficiency, improved control, or reduced parasitic powerloads are gaining acceptance. These improvements apply toconventional and alternative propulsion technologies, asillustrated in the 2010 model year version of the Toyota Priusand the stated benefits related to the use of an electric waterpump [9].
Vehicle thermal management technologies also enable energyefficiency improvements through reuse or waste heatutilization. Common examples include utilizing waste heat inthe engine coolant for cabin heating and using waste heat inthe exhaust for enabling emissions control devices. Waste
heat from the exhaust can also improve engine warm-up toreduce fuel consumption and emissions through an exhaustheat recirculation system [9]. Significant effort through theyears has also focused on recovering waste heat from exhaustand engine coolant to provide additional power using variouswaste heat recovery techniques. Examples include Rankinecycle heat recovery, turbocompounding, thermoelectricdevices, and thermoacoustic waste heat recovery[2,10,11,12,13,14]. Waste heat utilization also includesstoring waste heat for later use. For example, stored warmcoolant was used to decrease warm-up time during cold starts[15,16]. Waste heat can also improve the warm-up time ofbatteries [17] or improve transmission warm-up time andefficiency [18]. With the move toward more efficient vehiclepropulsion technologies comes a reduction in waste heat. Thereduced waste heat can have a negative impact on vehiclefunctions that require heat, such as cabin heating. Suggestedtechnologies discussed in literature [3,4] include electricheaters, fuel fired heaters, heat pumps, exhaust gas heaters,and viscous shear heaters. Of the proposed technologies, heatpumps have received significant attention due to potentialefficiency benefits by recovering heat from an external sink[19,20,21,22,23]. The application of these waste heattechnologies depends on the vehicle propulsionconfiguration, the quantity of waste heat, and the quality ofthe waste heat.
APPROACHIntegrated vehicle thermal management can build on theabove mentioned work to improve vehicle thermalmanagement systems to reduce thermal loads, transfer heatefficiency, and reuse available waste heat. Integrated vehiclethermal management is not an add-on, a compartmentalized,or a component-focused thermal management strategy.Integrated vehicle thermal management reduces fuel use byenabling advanced vehicle technologies that reduce energyuse directly or indirectly. Direct impacts include weightreduction and aerodynamic improvements due to componentcount reductions or size reductions. Indirect impacts includeimprovements in safety, part robustness, occupant comfort,and cost reduction, all leading to adoption of newtechnologies that reduce fuel use. All these actions supportthe development of advanced propulsion technologies toreduce fuel consumption.
The work described in this paper proposes techniques forquantifying the integrated heat loads of combined systemsand applies the techniques to electric drive systems thatexperience their primary operation over transient duty cycles.The evaluation over transient thermal duty cycles is importantbecause certain components may not experience peak thermalloads over steady-state tests typical of some conventionaltechniques for sizing thermal management systems. Theapproach consisted of three areas. The first task required theselection of representative vehicle configurations with similar

performance characteristics to provide a fair comparisonacross multiple powertrain configurations. The selection ofrepresentative vehicle configurations enabled the comparisonof heat loads across components and vehicle propulsiontypes. Second, the techniques for evaluating the transient andcontinuous heat loads were applied to the electric drivethermal management system. The results provided a methodto investigate potential integration opportunities with othercomponent thermal management systems. Finally, thermaland fluid system models were developed along with a heatexchanger sizing model for a louver fin heat exchanger toevaluate the viability of alternative concepts.
VEHICLE CONFIGURATIONSPast work performed at NREL describing a previouslypublished set of vehicle configurations provided a consistentset of vehicle configurations [24]. The paper describes fourvehicle configurations including a conventional vehicle (CV),HEV, and two PHEV configurations. The hybridconfigurations were based on a parallel hybrid configuration,as shown in Figure 1.
Simulated vehicle data over real-world or in-use conditionsprovided data for the heat load analysis. The transient dutycycles were required to stress the parallel configured electricdrive components beyond what they would experience duringa steady-state drive cycle up a grade at a fixed speed. The in-use drive cycles represented 227 vehicles from the St. Louisarea where driving data was recorded with Global PositioningSystem (GPS) equipment. Converting the GPS data intosecond-by-second drive cycles over a 24-hour periodprovided representative drive cycles of actual vehicle use.The aggressiveness of the in-use drive cycles was comparedagainst standard light-duty vehicle test cycles in the NRELpaper [24], and the aggressiveness exceeded common cyclessuch as the urban dynamometer driving schedule (UDDS)and US06 cycle.
Figure 1. Parallel hybrid vehicle configuration.
The configured vehicles provided comparable accelerationand grade performance, and the PHEV20 and PHEV40vehicles had the additional constraints related to all-electricrange capability. The PHEV20 and PHEV40 vehicles had anall-electric range over the UDDS drive cycle of 20 and 40miles, respectively. The component sizes in terms of peak
power level are listed in Table A.1. Although not listed inTable A.1, estimates for an EV configuration were alsoincluded for comparison. The power flow through the EVelectric drive system was calculated from the net power flowthrough the transmission inlet.
HEAT LOAD ESTIMATIONApproximate average component efficiency data enabledestimates for component and system heat loads. Table 1 liststhe collected efficiency data for the key components. Theactual efficiency depends on the operation of the components,but this level of detail was beyond the scope of the analysis.The values in Table 1 provided rough estimates forcomponent efficiency. For example, the electric machine andpower electronics efficiencies were based on knowledge thatthe electric drive system was not running at locations of peakefficiency, as shown in Figure 2 for the HEV configuration.The figure shows the operating location of the HEV over all227 in-use drive cycles. The same could be shown for thePHEV with a slightly expanded area of operation. Theoperation is primarily at low torque where the electric drive isless efficient relative to the absolute peak efficiency. Forexample, one can compare to efficiency data recorded forelectric drive systems in commercial HEV applications thatshow areas of higher peak operating efficiency [15,25,26].
<table 1 here>
Figure 2. HEV PEEM operating time versus operatingregion (darker color represents more time) over 227 in-
use drive cycles [33].
Using the efficiency data in Table 1, a method was developedto compare the transient and continuous heat loads from the227 in-use drive cycles. The methodology resembles aprocedure described by Markel and Pesaran [34] to calculatebattery power averaged over expanding time windows. Asimilar process was also applied by the DOE VehicleTechnologies Program APEEM activity to look at PHEVimpacts on electric drive systems [33]. The process ofcalculating the transient and continuous heat loads across all227 in-use drive profiles involved computing a movingaverage (Equation 1) of a specified heat load versus time
signal (x). The moving average sample size (n) was adjustedover a range of filter time windows (tw) using a fixed samplerate (ts). For the analysis the filter time windows ranged from2 seconds to 200 seconds. In Equation 1 the parameter “i”represents the data sample number, and “k” is a counter basedon the number of samples to include in the average.
(1)
(2)
The moving average heat load for a specified filter windowsize was computed over all 227 in-use drive cycle profiles,and the maximum value across all 227 drive cycles wasstored to represent the peak heat load for the specified filterwindow size. The process was repeated over the full range offilter time windows and for each vehicle configuration. Whenplotted, the result is a vehicle configuration specific heat loadcurve showing the peak heat load over a range of transientand continuous operations. The technique was applied toindividual systems and integrated systems involving thethermal management for the power electronics and electricmachines.
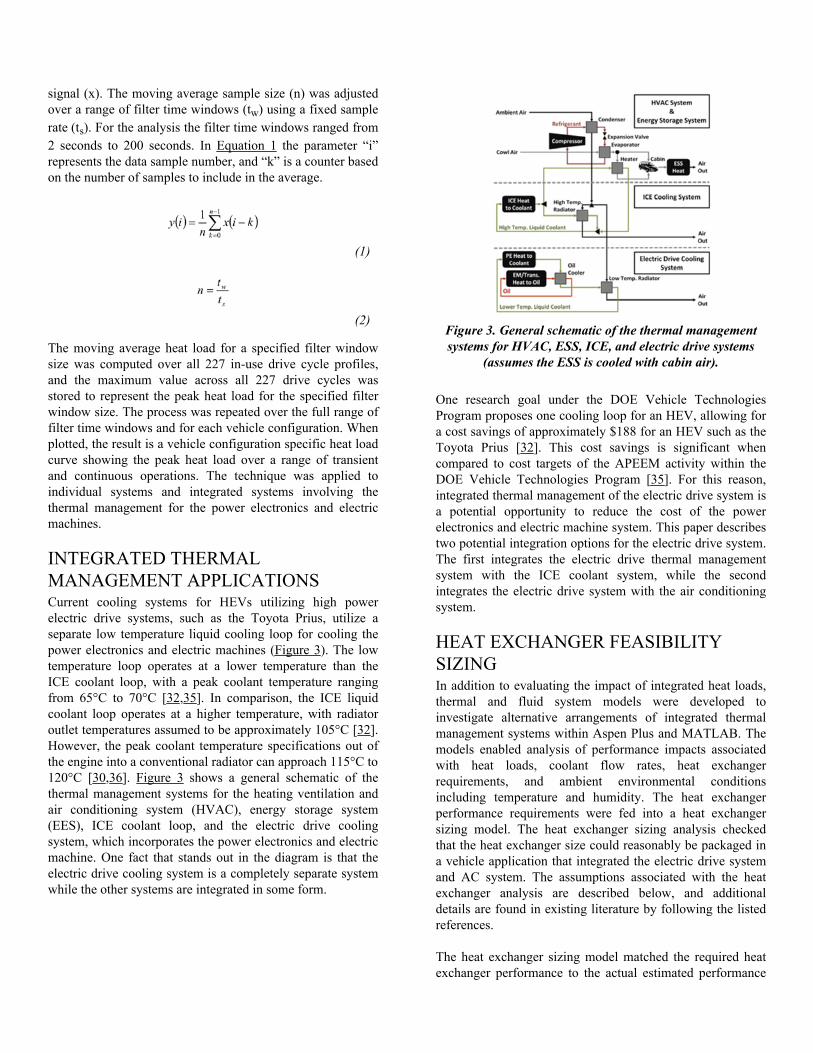
INTEGRATED THERMALMANAGEMENT APPLICATIONSCurrent cooling systems for HEVs utilizing high powerelectric drive systems, such as the Toyota Prius, utilize aseparate low temperature liquid cooling loop for cooling thepower electronics and electric machines (Figure 3). The lowtemperature loop operates at a lower temperature than theICE coolant loop, with a peak coolant temperature rangingfrom 65°C to 70°C [32,35]. In comparison, the ICE liquidcoolant loop operates at a higher temperature, with radiatoroutlet temperatures assumed to be approximately 105°C [32].However, the peak coolant temperature specifications out ofthe engine into a conventional radiator can approach 115°C to120°C [30,36]. Figure 3 shows a general schematic of thethermal management systems for the heating ventilation andair conditioning system (HVAC), energy storage system(EES), ICE coolant loop, and the electric drive coolingsystem, which incorporates the power electronics and electricmachine. One fact that stands out in the diagram is that theelectric drive cooling system is a completely separate systemwhile the other systems are integrated in some form.
Figure 3. General schematic of the thermal managementsystems for HVAC, ESS, ICE, and electric drive systems
(assumes the ESS is cooled with cabin air).
One research goal under the DOE Vehicle TechnologiesProgram proposes one cooling loop for an HEV, allowing fora cost savings of approximately $188 for an HEV such as theToyota Prius [32]. This cost savings is significant whencompared to cost targets of the APEEM activity within theDOE Vehicle Technologies Program [35]. For this reason,integrated thermal management of the electric drive system isa potential opportunity to reduce the cost of the powerelectronics and electric machine system. This paper describestwo potential integration options for the electric drive system.The first integrates the electric drive thermal managementsystem with the ICE coolant system, while the secondintegrates the electric drive system with the air conditioningsystem.
HEAT EXCHANGER FEASIBILITYSIZINGIn addition to evaluating the impact of integrated heat loads,thermal and fluid system models were developed toinvestigate alternative arrangements of integrated thermalmanagement systems within Aspen Plus and MATLAB. Themodels enabled analysis of performance impacts associatedwith heat loads, coolant flow rates, heat exchangerrequirements, and ambient environmental conditionsincluding temperature and humidity. The heat exchangerperformance requirements were fed into a heat exchangersizing model. The heat exchanger sizing analysis checkedthat the heat exchanger size could reasonably be packaged ina vehicle application that integrated the electric drive systemand AC system. The assumptions associated with the heatexchanger analysis are described below, and additionaldetails are found in existing literature by following the listedreferences.
The heat exchanger sizing model matched the required heatexchanger performance to the actual estimated performance

based on the heat exchanger type, size, and operatingconditions. The required heat exchanger performance (UA)based on the log mean temperature difference for a single-pass cross-flow heat exchanger with both fluids unmixed wascalculated using the log mean temperature difference(LMTD) [37]. The required areas were calculated from givengeometry ratios [38,39] for calculating total air side area (At)from the heat exchanger frontal area (Afr). The geometryinformation for the selected louver fin geometry is listed inTable A.2. The heat exchanger width was fixed at 0.711 m(28 in.).
The hot side convection coefficient was calculated assuminga rectangular tube with fully developed laminar flow [37].The fluid properties were based on a 50% by mass mixture ofwater and ethylene glycol with fluid properties from [40]calculated at the mean fluid temperature. The tube height wascalculated from the provided tube pitch (Tp) and fin length(Fl) listed in Table A.2. The tube wall thickness was assumedto be 0.2 mm. The Reynolds number was checked for each ofthe simulated conditions to verify laminar flow within thetube.
The air side heat transfer coefficient depended on theassumed air flow and heat exchanger construction. A louverfin geometry was selected based on published data andcorrelations [38, 39] that were also used by Shah [41]. In thisanalysis the air flow was set to maintain an 8°C temperaturerise through the heat exchanger with an inlet air temperatureof 40°C. With the mass flow determined, the next stepinvolved calculating the mass flux (G) and maximum airvelocity (Umax) as defined in Kakac and Liu [42]. In order toprevent extreme values for the air mass flux through the heatexchanger, variable limits were included in the program tolimit the mass flux to an upper limit (Gmax). If the air massflux limit was exceeded, the heat exchanger area wasincreased. The correlations for estimating the air side heattransfer coefficient used a Reynolds number based on louverpitch at the inlet cold air density [38]. The number of heatexchanger rows or sections was increased until the requiredheat exchanger performance (UA) was met.
RESULTSThe results of the analysis approach focus on the key questionrelated to integration opportunities for electric drive thermalmanagement within a larger vehicle thermal managementsystem context. The following results illustrate the challengesand opportunities for integrating the electric drive coolingsystem with either a high or low temperature vehicle thermalmanagement system.
HEAT LOAD ESTIMATIONFigure 4 shows the heat load curves for the ICE and electricdrive (PEEM) systems over multiple vehicle configurations
for all 227 in-use drive cycles. The heat load curve graphs theheat load averaged or filtered over an expanding timeduration or time window. For this reason the x-axis is labeled“Filter Time Window”. The heat load averaged over smallertime windows represents the transient heat load, while theheat load averaged over longer time windows provides anestimate for the continuous heat load. Figure 4a compares therelative heat load transferred to the ICE coolant for thesimulated CV, HEV, and PHEV configurations. As expected,the peak or transient heat load is significantly higher in theCV application. The simplified efficiency assumptions usethe same ICE efficiency for the CV, HEV, and PHEVconfigurations.
Figure 4b compares the heat loads from the electric drivesystem or the combined power electronics and electricmachine (PEEM) system. As expected, the heat load issignificantly lower than the available heat in the ICE coolant.It is interesting to note the difference between the PHEV andHEV electric drive heat loads. As pointed out in previouswork comparing HEV and PHEV operation for the DOEVehicle Technologies Program APEEM activity, for a givenPHEV energy management strategy, the impact on theelectric drive system is primarily due to the transition fromHEV to PHEV and not the transition from PHEV20 toPHEV40 [33]. The PHEV continuous heat load approachesthe EV electric drive continuous power heat load over the in-use transient drive cycles, while the peak heat load dependson whether the PHEV is a blended configuration or an all-electric configuration. For an all-electric configuration, thepeak heat load would be expected to match the approximatedfull EV electric drive peak heat load. Since this work wasbased on transient operating conditions, systems with morecontinuous operation of the electric drive system, such aselectric vehicles or series configured hybrid electric vehicles,would require additional thermal analysis over conventionalsteady-state grade tests not covered in this paper. However,the approach can be easily expanded to include other drivecycles or tests.

Figure 4. Heat load curves over 227 in-use drive cycles.(a) ICE coolant heat load curve averaged over variable
time windows for HEV, PHEV20, PHEV40, and CV; (b)PEEM heat load curve averaged over variable time
windows for HEV, PHEV20, PHEV40, and EV.
INTEGRATED THERMALMANAGEMENT APPLICATIONSThere are two high level requirements for an integratedthermal management system. The first is a similar coolanttemperature specification, and the second is a misalignmentof peak heat loads of the combined or integrated systems. Theheat load for integrated thermal management systems is notalways simply the sum of the peak or continuous heat loadsfrom the combined systems. Different componentsexperience peak heat loads at different times depending ontheir use. Misalignment of the peak heat loads can potentiallylead to an overall decrease in the net heat exchanger weightand volume. The ability of the heat load curve to illustrateboth the transient and continuous heat loads was useful forevaluating the impact of combining multiple systems onto thesame thermal management system where transient andcontinuous loading conditions are important. Two integrationoptions for the PEEM cooling system were investigated, andthe results related to temperature compatibility and heat loadmisalignment are described below.
High Temperature Coolant Ice IntegrationA single cooling loop based on the ICE thermal managementsystem requires cooling the power electronics, electricmachines, and internal combustion engine with one coolant.The power electronics inverter would thus have to tolerateinlet coolant temperatures up to 105°C [35]. When combiningthe ICE and electric drive coolant loops, the peak heat loadsare not always added because the peak heat loads occur atdifferent times depending on the electric drive configurationand vehicle control strategy. An example is shown in Figure5a with respect to the HEV parallel electric driveconfiguration.
Figure 5. HEV heat load curves over 227 in-use drivecycles for the integrated PEEM and ICE system (solid
line). The other curves compare the ICE heat load(dotted line) and the sum of the individual ICE andPEEM heat load curves (dashed line). (a) HEV; (b)
PHEV20
Figure 5a compares three values. The first is the heat load inthe ICE coolant shown by the dotted line (X marker). Thesecond is the addition of the heat load curve of the ICE andthe combined power electronics and electric machine(PEEM) heat load curve shown in Figure 4 for the HEV,which is illustrated by the dashed line (circle marker).Finally, the third solid curve (diamond marker) shows theintegrated heat load by adding the heat loads in the timedomain and generating the heat load curve using thecombined heat loads versus time, which accounts formisalignment of peak heat loads. The curves in Figure 5ashow that while the integrated system heat load is similar tothe added heat load curve, it is not the same. Simply addingthe curves assumed the peak heat loads were aligned andover-predicted the combined heat load. For transientconditions the two curves were similar, but the continuousheat load for the integrated system more closely resembledthe heat load from the ICE alone. The reduced heat loadhighlighted an opportunity to integrate the two systemswithout a large increase in the continuous cooling capacity ofthe thermal management system relative to the ICE coolingsystem. The integration could reduce the costs associatedwith the separate electric drive coolant loop.
The PHEV configurations illustrated a more dramaticdifference in the heat load curves. Figure 5b shows the sameinformation as Figure 5a except for the PHEV20configuration. The PHEV20 showed a larger differencebetween integrated heat load (solid line with square markers)and added heat load curves (dashed line with circle markers).Although not shown, the same result was also found for thePHEV40 configuration. From the results for the simulatedparallel PHEV configurations, the PHEV could be a bettercandidate for integrating the electric drive cooling systemwith the ICE cooling system.

While the integration of the electric drive thermalmanagement system and ICE thermal management systemwas attractive for a PHEV in terms of the misalignment ofpeak heat loads, the second general requirement for similarcoolant temperature specifications presented an issue. Thereare currently a number of challenges associated with coolingthe power electronics and electric machine system with ahigh temperature coolant [32].
Low Temperature Coolant AC IntegrationThe hurdles associated with using high temperature coolantfor electric drive thermal management systems led to anotheroption to integrate the low temperature liquid cooled electricdrive system with other vehicle systems that could benefitfrom a low temperature liquid coolant. Ap et al. [36]proposed the use of a low temperature liquid coolant loop forthe air conditioning (AC) condenser, charge air cooler, andfuel cooler, and mentioned that supplying 60°C coolant to theliquid-to-refrigerant condenser ensures adequate ACperformance. The 60°C coolant temperature for the ACcondenser is similar to the peak coolant temperatures forcurrent production hybrid electric vehicles. For this reason, aproposal to integrate the low temperature coolant loop for theelectric drive system with a liquid-to-refrigerant ACcondenser was also investigated. The approach is showngenerally in Figure 6. The general proposal of integrating theelectric drive cooling with the AC system met the first basicrequirement of similar coolant temperature specifications.
Figure 6. General schematic of electric drive and ACintegrated thermal management system.
Figure 7. Heat load curves of combined PEEM and ACcondenser systems over 227 in-use drive cycles. (a)
PEEM heat load (diamond markers) and AC condenserheat load fixed at 8kW (square markers); (b) CombinedPEEM and AC integrated heat load (triangle markers)and PEEM and AC integrated load with AC off when
PEEM heat was over 3 kW (circle markers).
The misalignment of the peak heat loads was also possiblethrough control of the AC system operation and the lack ofelectric drive system heat when the vehicle was idle. Theimpact of controlling the AC system on the integrated heatload is shown in Figure 7. Figure 7a shows the systemspecific heat load curves for the combined power electronicsand electric machine (PEEM) components and the ACcondenser heat load, which was fixed at 8 kW. Integrating thePEEM and AC condenser heat loads with the AC always onresulted in the combined heat load curve shown in Figure 7bwith the dashed line (triangle markers). The impact of turningoff the AC during brief periods when the PEEM heat loadexceeded 3 kW is shown in Figure 7b with the dotted line(circle markers). Controlling the AC system to turn off duringtransient high power operation of the electric drive or PEEMsystem produced a significant transient and continuous heatload reduction for the combined or integrated system.
Heat Exchanger Feasibility SizingA thermal system model was developed to look atopportunities to integrate the AC condenser with the lowtemperature cooling system, including models of the two-phase air conditioning system, single-phase low temperaturecoolant loop, ambient air inlet, and the necessary heatexchangers. The electric drive system was incorporated intothe model as a heat load into the coolant system. The conceptapplies to any electric drive system with a vehicle airconditioning system. The key advantage includes multipleuses of the low temperature loop, which enables a lowertemperature coolant for power electronics. The system couldreplace the air to refrigerant condenser at the front of thevehicle with a liquid to refrigerant condenser that can bepackaged with the HVAC system. In addition, other potentialbenefits relate to reduced refrigerant lines, leaks, and pressure
drops. The viability of the integrated thermal managementconcept required feasibility analysis for the size of the lowtemperature heat exchanger.
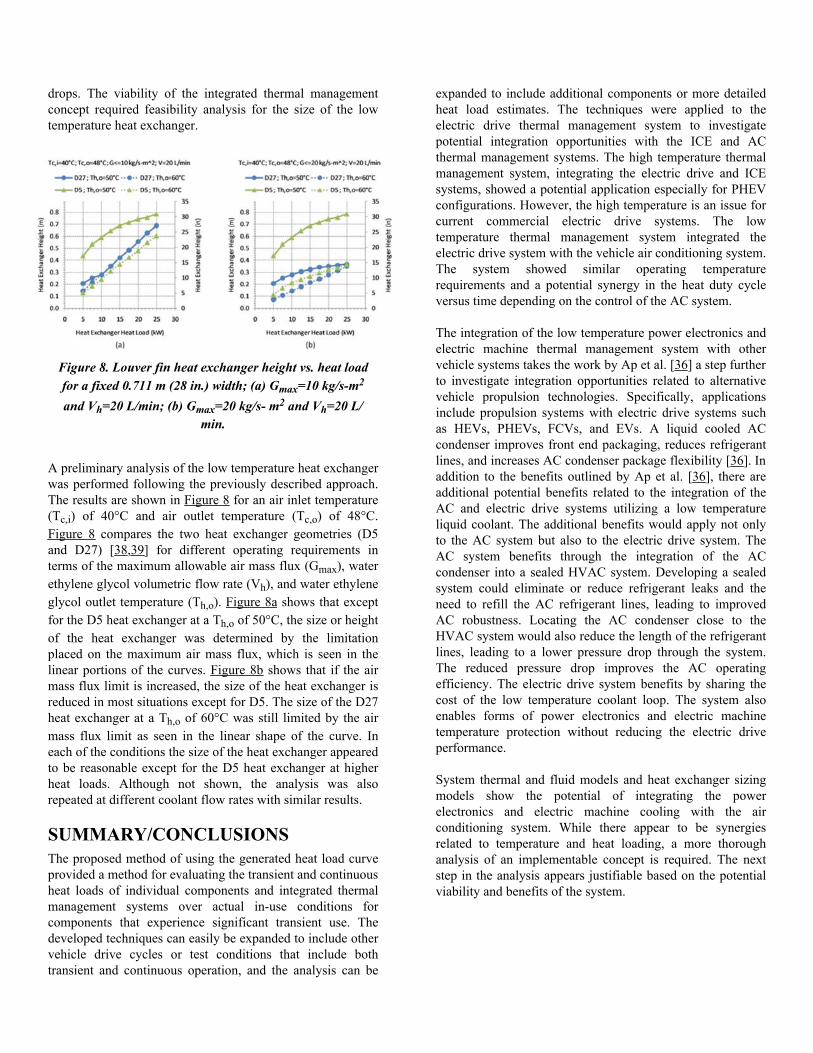
Figure 8. Louver fin heat exchanger height vs. heat loadfor a fixed 0.711 m (28 in.) width; (a) Gmax=10 kg/s-m2
and Vh=20 L/min; (b) Gmax=20 kg/s- m2 and Vh=20 L/min.
A preliminary analysis of the low temperature heat exchangerwas performed following the previously described approach.The results are shown in Figure 8 for an air inlet temperature(Tc,i) of 40°C and air outlet temperature (Tc,o) of 48°C.Figure 8 compares the two heat exchanger geometries (D5and D27) [38,39] for different operating requirements interms of the maximum allowable air mass flux (Gmax), waterethylene glycol volumetric flow rate (Vh), and water ethyleneglycol outlet temperature (Th,o). Figure 8a shows that exceptfor the D5 heat exchanger at a Th,o of 50°C, the size or heightof the heat exchanger was determined by the limitationplaced on the maximum air mass flux, which is seen in thelinear portions of the curves. Figure 8b shows that if the airmass flux limit is increased, the size of the heat exchanger isreduced in most situations except for D5. The size of the D27heat exchanger at a Th,o of 60°C was still limited by the airmass flux limit as seen in the linear shape of the curve. Ineach of the conditions the size of the heat exchanger appearedto be reasonable except for the D5 heat exchanger at higherheat loads. Although not shown, the analysis was alsorepeated at different coolant flow rates with similar results.
SUMMARY/CONCLUSIONSThe proposed method of using the generated heat load curveprovided a method for evaluating the transient and continuousheat loads of individual components and integrated thermalmanagement systems over actual in-use conditions forcomponents that experience significant transient use. Thedeveloped techniques can easily be expanded to include othervehicle drive cycles or test conditions that include bothtransient and continuous operation, and the analysis can be
expanded to include additional components or more detailedheat load estimates. The techniques were applied to theelectric drive thermal management system to investigatepotential integration opportunities with the ICE and ACthermal management systems. The high temperature thermalmanagement system, integrating the electric drive and ICEsystems, showed a potential application especially for PHEVconfigurations. However, the high temperature is an issue forcurrent commercial electric drive systems. The lowtemperature thermal management system integrated theelectric drive system with the vehicle air conditioning system.The system showed similar operating temperaturerequirements and a potential synergy in the heat duty cycleversus time depending on the control of the AC system.
The integration of the low temperature power electronics andelectric machine thermal management system with othervehicle systems takes the work by Ap et al. [36] a step furtherto investigate integration opportunities related to alternativevehicle propulsion technologies. Specifically, applicationsinclude propulsion systems with electric drive systems suchas HEVs, PHEVs, FCVs, and EVs. A liquid cooled ACcondenser improves front end packaging, reduces refrigerantlines, and increases AC condenser package flexibility [36]. Inaddition to the benefits outlined by Ap et al. [36], there areadditional potential benefits related to the integration of theAC and electric drive systems utilizing a low temperatureliquid coolant. The additional benefits would apply not onlyto the AC system but also to the electric drive system. TheAC system benefits through the integration of the ACcondenser into a sealed HVAC system. Developing a sealedsystem could eliminate or reduce refrigerant leaks and theneed to refill the AC refrigerant lines, leading to improvedAC robustness. Locating the AC condenser close to theHVAC system would also reduce the length of the refrigerantlines, leading to a lower pressure drop through the system.The reduced pressure drop improves the AC operatingefficiency. The electric drive system benefits by sharing thecost of the low temperature coolant loop. The system alsoenables forms of power electronics and electric machinetemperature protection without reducing the electric driveperformance.
System thermal and fluid models and heat exchanger sizingmodels show the potential of integrating the powerelectronics and electric machine cooling with the airconditioning system. While there appear to be synergiesrelated to temperature and heat loading, a more thoroughanalysis of an implementable concept is required. The nextstep in the analysis appears justifiable based on the potentialviability and benefits of the system.

REFERENCES1. Fulton, W., Giesler, J., and Patton, H., “Cooling Systemfor Internal Combustion Engines,” U.S. Patent 1,306,000,June 10, 1919.
2. Rugh, J., “Vehicle Ancillary Load Reduction Close-OutReport,” National Renewable Energy Laboratory Report,NREL/TP-540-42454, January 2008.
3. Eilemann, A. and Kampf, H., “Comfort-Management,”SAE Technical Paper 2001-01-1738, 2001.
4. Chalgren, R.D.Jr., “Thermal Comfort and Engine Warm-Up Optimization of a Low-Flow Advanced ThermalManagement System,” SAE Technical Paper 2004-01-0047,2004.
5. Chanfreau, M., Gessier, B., Farkh, A., and Geels, P.Y.,“The Need for an Electrical Water Valve in a THErmalManagement Intelligent System (THEMIS™),” SAETechnical Paper 2003-01-0274, 2003.
6. Jawad, B., Zellner, K., and Riedel, C., “Small EngineCooling and the Electric Water Pump,” SAE Technical Paper2004-32-0084, 2004.
7. Wagner, J.R., Srinivasan, V., Dawson, D.M., and Marotta,E.E., “Smart Thermostat and Coolant Pump Control forEngine Thermal Management Systems,” SAE TechnicalPaper 2003-01-0272, 2003.
8. Wagner, J.R., Ghone, M.C., Dawson, D.W., and Marotta,E.E., “Coolant Flow Control Strategies for AutomotiveThermal Management Systems,” SAE Technical Paper2002-01-0713, 2002.
9. Kawamoto, N., Naiki, K., Kawai, T., Shikida, T. et al.,“Development of New 1.8-Liter Engine for HybridVehicles,” SAE Technical Paper 2009-01-1061, 2009.
10. Brands, M.C., Werner, J.R., Hoehne, J.L., and Kramer,S., “Vehicle Testing of Cummins Turbocompound DieselEngine,” SAE Technical Paper 810073, 1981.
11. Doyle, E., DiNanno, L., and Kramer, S., “Installation ofa Diesel-Organic Rankine Compound Engine in a Class 8Truck for a Single-Vehicle Test,” SAE Technical Paper790646, 1979.
12. Foster, D. and Myers, P., “Heavy-Duty Diesel FuelEconomy,” ASME Mechanical Engineering, 104(12):50-55,Dec. 1982.
13. Oomori, H. and Ogino, S., “Waste Heat Recovery ofPassenger Car Using a Combination of Rankine BottomingCycle and Evaporative Engine Cooling System,” SAETechnical Paper 930880, 1993.
14. Smith, K. and Thornton, M., “Feasibility ofThermoelectrics for Waste Heat Recovery in Hybrid ElectricVehicles,” presented at EVS-23, Anaheim, CA, USA, Dec.2-5, 2007.
15. Staunton, R., Ayers, C., Marlino, L., Chiasson, C., andBurress, T., “Evaluation of 2004 Toyota Prius HybridElectric Drive System,” Oak Ridge National LaboratoryTechnical Report, ORNL/TM-2006/423, 2006.
16. Muta, K., Yamazaki, M., and Tokieda, J., “Developmentof New-Generation Hybrid System THS II - DrasticImprovement of Power Performance and Fuel Economy,”SAE Technical Paper 2004-01-0064, 2004.
17. Pesaran, A., Vlahinos, A., and Stuart, T., “Cooling andPreheating of Batteries in Hybrid Electric Vehicles,”presented at 6th ASMR-JSME Thermal EngineeringConference, Hawaii, USA, Mar. 16-20, 2003.
18. Semel, R.R., “Fuel Economy Improvements throughImproved Automatic Transmission Warmup - Stand AloneOil To Air (OTA) Transmission Cooling Strategy withThermostatic Cold Flow Bypass Valve,” SAE TechnicalPaper 2001-01-1760, 2001.
19. Ghodbane, M., Scherer, L., Baker, J., and Kadle, P.,“Potential applications of R-152a refrigerant in vehicleclimate control,” 2003 Vehicle Thermal ManagementSystems Conference (VTMS6), IMechE C599/083/2003,May 2003.
20. Pomme, V., “Reversible Heat Pump System for andElectric Vehicle,” SAE 971772, 1997.
21. Scherer, L.P., Ghodbane, M., Baker, J.A., and Kadle,P.S., “On-Vehicle Performance Comparison of an R-152aand R-134a Heat Pump System,” SAE Technical Paper2003-01-0733, 2003.
22. Vetter, F. and Memory, S., “Automotive AC/HP Systemsusing R744(CO2),” 2003 Vehicle Thermal ManagementSystems Conference (VTMS6), IMechE C599/098/2003,May 2003.
23. Zeng, X., Major, G.A., Hirao, T., and Imaiida, T., “AnAutomotive Hybrid Heating System for Parallel HybridPassenger Cars,” SAE Technical Paper 2000-01-1276, 2000.
24. Gonder, J., Markel, T., Simpson, A., and Thornton, M.,“Using GPS Travel Data to Assess the Real World DrivingEnergy Use of Plug-In Hybrid Electric Vehicles (PHEVs),”presented at the Transportation Research Board (TRB) 86thAnnual Meeting, Washington, D.C., USA, Jan. 21-25, 2007.
25. Burress, T., Coomer, C., Campbell, S., Seiber, L.,Marlino, L., Staunton, R., and Cunningham, J., “Evaluationof the 2007 Toyota Camry Hybrid Synergy Drive System,”Oak Ridge National Laboratory Technical Report, ORNL/TM-2007/190, 2008.
26. Burress, T., Coomer, C., Campbell, S., Wereszczak, A.,Cunningham, J., Marlino, L., Seiber, L., and Lin, H.,“Evaluation of the 2008 Lexus LS 600H Hybrid SynergyDrive System,” Oak Ridge National Laboratory TechnicalReport, ORNL/TM-2008/185, 2009.

27. Chammas, R.E. and Clodic, D., “Combined Cycle forHybrid Vehicles,” SAE Technical Paper 2005-01-1171, 2005.
28. Heywood, J., Internal Combustion Engine Fundamentals.McGraw-Hill, New York, 1988.
29. Stobart, R. and Weerasinghe, R., “Heat Recovery andBottoming Cycles for SI and CI Engines - A Perspective,”SAE Technical Paper 2006-01-0662, 2006.
30. Automotive Handbook, 4th ed., Robert Bosch GmbH,Germany, 1996.
31. Hughes, C.A.V. and Wiseman, M.W., “Feasibility ofIntelligent Control Strategies to Reduce Cooling SystemSize,” SAE Technical Paper 2001-01-1759, 2001.
32. Hsu, J., Staunton, R., and Starke, M., “Barriers to theApplication of High-Temperature Coolants in Hybrid ElectricVehicles,” Oak Ridge National Laboratory Technical Report,ORNL/TM-2006/514, 2006.
33. Bennion, K., “Plug-In Hybrid Electric Vehicle Impactson Power Electronics and Electric Machines,” NationalRenewable Energy Laboratory Report, NREL/MP-540-36085, September 2007.
34. Markel, T. and Pesaran, A., “PHEV Energy Storage andDrive Cycle Impacts,” presented at the 7th AdvancedAutomotive Battery Conference, Long Beach, California,May 2007.
35. FreedomCAR and Fuels Partnership. “Electrical andElectronics Technical Team Roadmap,” http://www.eere.energy.gov/vehiclesandfuels/pdfs/program/eett_roadmap.pdf, November 2006.
36. Ap, N-S., Guerrero, P., Jouanny, P., Potier, M., Genoist,J., and Thuez, J., “UltimateCooling™ New Cooling SystemConcept Using the Same Coolant to Cool All VehicleFluids,” 2003 Vehicle Thermal Management SystemsConference (VTMS6), IMechE C599/010/2003, May 2003.
37. Incropera, F. and DeWitt, D., Fundamentals of Heat andMass Transfer, 4th ed., John Wiley & Sons, New York, 1996.
38. Davenport, C., “Correlations for Heat Transfer and FlowFriction Characteristics of Louvred Fin,” Proceedings of the21st National Heat Transfer Conference, AIChE SymposiumSeries, 225:19-27, 1983.
39. Park, Y. and Jacobi, A., “Air-Side Heat Transfer andFriction Correlations for Flat-Tube Louver-Fin HeatExchangers,” Journal of Heat Transfer 131, Feb. 2009.
40. Alshamani, K., “Equations for Physical Properties ofAutomotive Coolants,” SAE Technical Paper 2003-01-0532,2003.
41. Shah, R., Kraus, A., and Metzger, D., Compact HeatExchangers, Hemisphere Publishing, New York, 1990.
42. Kakac, S. and Liu, H., Heat Exchangers Selection,Rating, and Thermal Design, CRC Press, New York, 1998.
CONTACT [email protected]
ACKNOWLEDGMENTSThe authors would like to acknowledge Lee Slezak and theprogrammatic support of the Vehicle Technologies Programin the U.S. Department of Energy's Office of EnergyEfficiency and Renewable Energy.

APPENDIX<table A.1 here>
<table A.2 here>

Table 1. Approximated output power and heat loads as percentage of input energy with approximated coolant temperatures.
Table A.1. Vehicle component power ratings [24].
**Listed electric machine (EM) power is the necessary power for all electric operation over the UDDS cycle. A 50 kW machinewas used for the PHEV configuration simulations.
Table A.2. Louver fin heat exchanger geometry [38, 39].
Variable definitions -- Ac --Minimum cross-sectional area for air flow Afr --Frontal area of heat exchanger At --Total air side heatexchanger area Dh,c --Hydraulic diameter for air passage Fl --Fin length Lh --Louver height Ll --Louver length Lp --Louver pitch
Tp --Tube pitch δf --Fin thickness
The Engineering Meetings Board has approved this paper for publication. It hassuccessfully completed SAE's peer review process under the supervision of the sessionorganizer. This process requires a minimum of three (3) reviews by industry experts.
ISSN 0148-7191
doi:10.4271/2010-01-0836
Positions and opinions advanced in this paper are those of the author(s) and notnecessarily those of SAE. The author is solely responsible for the content of the paper.
SAE Customer Service:Tel: 877-606-7323 (inside USA and Canada)Tel: 724-776-4970 (outside USA)Fax: 724-776-0790Email: [email protected] Web Address: http://www.sae.orgPrinted in USA