advances in bibliometric analysis: research performance ... · research performance assessment and...
TRANSCRIPT
3
17© The Authors. Volume compilation © 2014 Portland Press Limited
1Email: [email protected] chapter is partly an elaborated version of an earlier paper by the author [1].
Advances in bibliometric analysis: research performance assessment and science mapping
Anthony F.J. van Raan1
Centre for Science and Technology Studies, Leiden University, The Netherlands
Introduction
The daily practice of scientific research shows that inspired scientists, particularly in the natural sciences and medical research fields, go for publication in interna‑tional journals2 (see [1]). Certainly, journal articles are not in all fields the main carrier of scientific knowledge, and they differ widely in importance. But work of at least some importance provokes reactions of colleagues. They are the ‘invisible college’ by which research results are discussed, and they play their role as members of the invisible college by referring in their own work to earlier work of other scientists. This process of citation is a complex one, and it does not provide an ‘ideal’ monitor of scientific performance. This is particularly the case at a statis‑tically low aggregation level, e.g. the individual researcher. But the application of citation analysis to the work, the oeuvre of a group of researchers as a whole over a longer period of time, does yield, in many situations, a strong indicator of scientific performance. For a very long time, the Science Citation Index, now the WoS (Web of Science) (produced by Thomson Reuters) was the only large multidisciplinary citation data source worldwide. Meanwhile, Scopus, produced by Elsevier, is a second comprehensive citation database.
The motives for giving (or not giving) a reference to a particular article may vary considerably. There is, however, no empirical evidence that these reference motives are so different or randomly given to such an extent that the phenomenon of citation would lose its role as a reliable measure of impact [2].
Why bibliometric analysis of research performance? Peer review is and has to remain the principal procedure of quality judgment. But peer review may have serious shortcomings and disadvantages. Subjectivity, i.e. dependence of the outcomes on the choice of individual committee members, is one of the major problems. This dependence may result in conflicts of interests, unawareness of quality or a negative bias against younger people or newcomers to the field. To make peer review more objective and transparent, it should be supported by advanced bibliometric methods.
My institute [CWTS (Centre for Science and Technology Studies), Leiden University] has long‑standing experience of more than 25 years in developing and applying standardized bibliometric procedures based on citation analysis for assessing research performance in an international context. We analysed the research

18 A.F.J. van Raan
© The Authors. Volume compilation © 2014 Portland Press Limited
performance of hundreds of research groups, departments and institutes worldwide. Client institutions for this contract work are universities, research councils, research organizations, ministries, charities and business companies. As discussed above, this approach does not provide us an ideal instrument, working perfectly in all fields under all circumstances. But it works very well in the large majority of the natural, the medical, the applied and the behavioural sciences. These fields of science are the most cost‑intensive and the ones with the strongest socio‑economic impact.
A first and good indication of whether bibliometric analysis is applicable to a specific field is provided by the publication characteristics of the field, in particular, the role of international refereed journals. If international journals are a major means of communication in a field, then in most cases bibliometric analysis is applicable. Therefore it is important to study the publication practices of a research group, department or institute, in order to find out whether bibliometric analysis can be applied reliably. A practical measure to this end is the share of publications covered by the WoS or by Scopus in the total research output. For ‘non‑WoS publications’, a restricted type of analysis is possible, in so far as these publications are cited by articles in journals covered by the WoS. This approach is particularly important for bibliometric analysis in the social sciences and humanities [3]. But given the limited journal coverage of the WoS in these disciplines, this approach will only provide first indications.
The Internet has changed scientific communication. Researchers use the web for both information‑seeking as well as presenting. In addition to the non‑WoS publications, there are a large number of further publications and data included in institutional and personal websites. Thus next to citation analysis, the use of data provided via the Internet, webometrics, offers interesting additional opportunities to aid citation‑based bibliometric analysis in evaluation and mapping approaches.
Basics of citation analysis
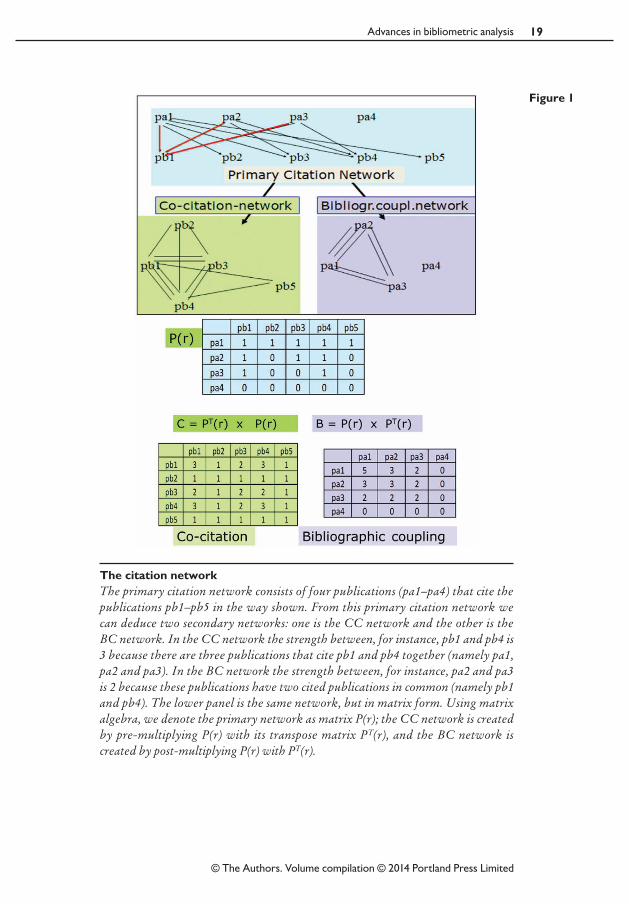
The basic principle of bibliometric analysis is the citation network. The two main bibliometric methods, citation analysis for research performance assessment and science mapping, can both be derived from the same network principle. A simple example of the citation network structure is shown in Figure 1. Citation analysis for research performance assessment basically means counting citations of specific papers, for instance paper pb1 is cited three times (by pa1, pa2 and pa3). From the primary network two secondary networks can be derived, the CC (co‑citation) and the BC (bibliographic coupling) network. Two publications are bibliograph‑ically coupled if they have references in common; the more references they have in common, the stronger their relation (BC strength). Two publications are co‑cited if they are commonly cited by other papers. The more papers a specific pair of papers cite, the stronger the CC strength.
The strength of the relations between publications provides similarity measures and thus the possibility to cluster so that both BC and CC can be used for mapping. With the BC method we can create maps on the basis of publications in their citing modality, and in the CC method the maps are on the basis of the cited modality. As the citing modality cannot be changed anymore (the references
19Advances in bibliometric analysis
© The Authors. Volume compilation © 2014 Portland Press Limited
The citation networkThe primary citation network consists of four publications (pa1–pa4) that cite the publications pb1–pb5 in the way shown. From this primary citation network we can deduce two secondary networks: one is the CC network and the other is the BC network. In the CC network the strength between, for instance, pb1 and pb4 is 3 because there are three publications that cite pb1 and pb4 together (namely pa1, pa2 and pa3). In the BC network the strength between, for instance, pa2 and pa3 is 2 because these publications have two cited publications in common (namely pb1 and pb4). The lower panel is the same network, but in matrix form. Using matrix algebra, we denote the primary network as matrix P(r); the CC network is created by pre‑multiplying P(r) with its transpose matrix PT(r), and the BC network is created by post‑multiplying P(r) with PT(r).
Figure 1
20 A.F.J. van Raan
© The Authors. Volume compilation © 2014 Portland Press Limited
in publications are fixed and thus remain the same), the BC maps are static, whereas the CC maps are dynamic (publications can be cited later on, again and again). I will come back to science mapping in the next section. I will first discuss citation analysis for research‑performance assessment.
The most crucial objective in the bibliometric methodology is to find a consistent and standardized set of indicators. Research output is defined as the number of articles of the institute, as far as they are covered by the WoS (or Scopus). I consider as ‘articles’ the following publication types: normal articles (including proceedings papers published in journals), letters, notes and reviews (but not meeting abstracts, obituaries, corrections, editorials, etc.).
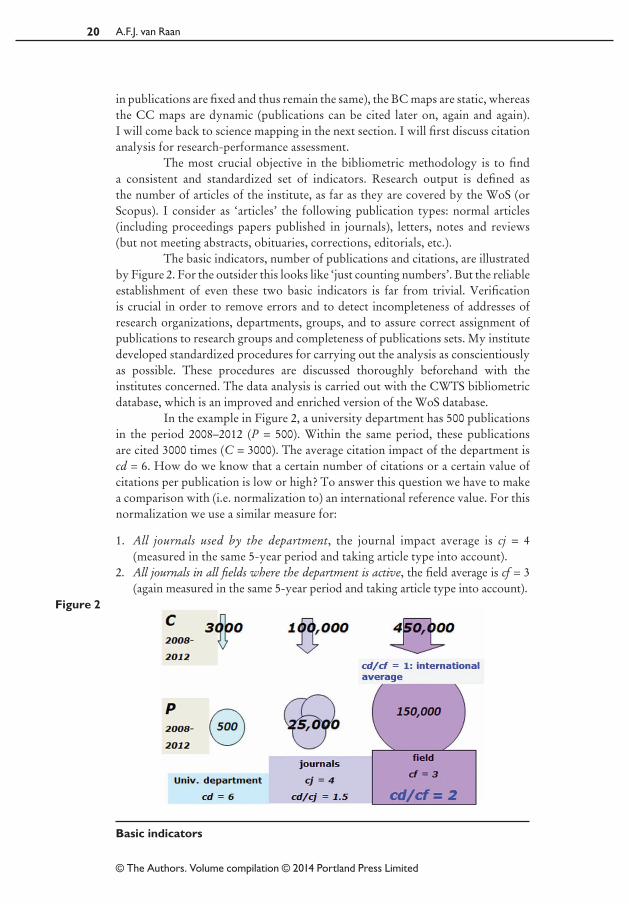
The basic indicators, number of publications and citations, are illustrated by Figure 2. For the outsider this looks like ‘just counting numbers’. But the reliable establishment of even these two basic indicators is far from trivial. Verification is crucial in order to remove errors and to detect incompleteness of addresses of research organizations, departments, groups, and to assure correct assignment of publications to research groups and completeness of publications sets. My institute developed standardized procedures for carrying out the analysis as conscientiously as possible. These procedures are discussed thoroughly beforehand with the institutes concerned. The data analysis is carried out with the CWTS bibliometric database, which is an improved and enriched version of the WoS database.
In the example in Figure 2, a university department has 500 publications in the period 2008–2012 (P = 500). Within the same period, these publications are cited 3000 times (C = 3000). The average citation impact of the department is cd = 6. How do we know that a certain number of citations or a certain value of citations per publication is low or high? To answer this question we have to make a comparison with (i.e. normalization to) an international reference value. For this normalization we use a similar measure for:
1. All journals used by the department, the journal impact average is cj = 4 (measured in the same 5‑year period and taking article type into account).
2. All journals in all fields where the department is active, the field average is cf = 3 (again measured in the same 5‑year period and taking article type into account).
Basic indicators
Figure 2
21Advances in bibliometric analysis
© The Authors. Volume compilation © 2014 Portland Press Limited
Research groups publish in more than one journal, and they are active in more than one field. Therefore weighted average values are calculated, the weights being determined by the total number of papers published by the institute in each journal or field.
We observed the following. The department performs better than both the journal and the field average (cd/cj = 1.5; cd/cf = 2.0); and the journals chosen by the department for publications are the better ones in the fields (cj/cf = 1.3). We call cd/cf our ‘crown indicator’ because this indicator directly measures the extent to which a research group, department, institute, etc. performs significantly above the international level. The above indicators are a simple representation of the normalization procedure. In reality it is somewhat more complicated [4]. Given the skewness of the distribution of citations over publications, we increasingly apply indicators related to the entire citation distribution.3
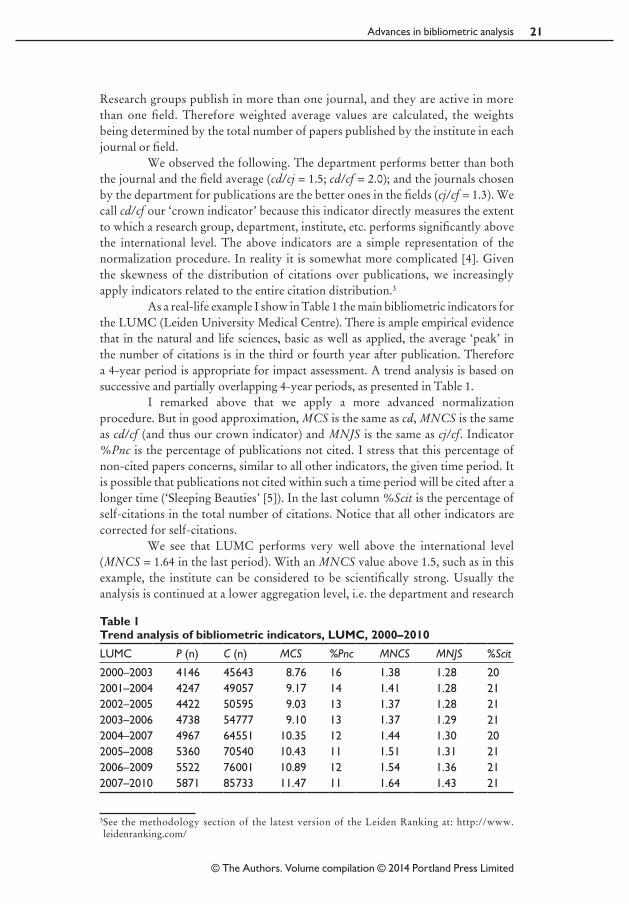
As a real‑life example I show in Table 1 the main bibliometric indicators for the LUMC (Leiden University Medical Centre). There is ample empirical evidence that in the natural and life sciences, basic as well as applied, the average ‘peak’ in the number of citations is in the third or fourth year after publication. Therefore a 4‑year period is appropriate for impact assessment. A trend analysis is based on successive and partially overlapping 4‑year periods, as presented in Table 1.
I remarked above that we apply a more advanced normalization procedure. But in good approximation, MCS is the same as cd, MNCS is the same as cd/cf (and thus our crown indicator) and MNJS is the same as cj/cf. Indicator %Pnc is the percentage of publications not cited. I stress that this percentage of non‑cited papers concerns, similar to all other indicators, the given time period. It is possible that publications not cited within such a time period will be cited after a longer time (‘Sleeping Beauties’ [5]). In the last column %Scit is the percentage of self‑citations in the total number of citations. Notice that all other indicators are corrected for self‑citations.
We see that LUMC performs very well above the international level (MNCS = 1.64 in the last period). With an MNCS value above 1.5, such as in this example, the institute can be considered to be scientifically strong. Usually the analysis is continued at a lower aggregation level, i.e. the department and research
3 See the methodology section of the latest version of the Leiden Ranking at: http://www.leidenranking.com/
Table 1 Trend analysis of bibliometric indicators, LUMC, 2000–2010
LUMC P (n) C (n) MCS %Pnc MNCS MNJS %Scit
2000–2003 4146 45 643 8.76 16 1.38 1.28 202001–2004 4247 49 057 9.17 14 1.41 1.28 212002–2005 4422 50 595 9.03 13 1.37 1.28 212003–2006 4738 54 777 9.10 13 1.37 1.29 212004–2007 4967 64 551 10.35 12 1.44 1.30 202005–2008 5360 70 540 10.43 11 1.51 1.31 212006–2009 5522 76 001 10.89 12 1.54 1.36 212007–2010 5871 85 733 11.47 11 1.64 1.43 21
22 A.F.J. van Raan
© The Authors. Volume compilation © 2014 Portland Press Limited
groups within an institute; see for instance my institute’s work for Uppsala University [6].
On the basis of my institute’s long‑standing experience with biblio‑metric indicators, we recently created an advanced menu‑driven application tool for bibliometric research performance assessment and monitoring of university departments and institutes, including geographical maps with indication of research groups worldwide citing and/or collaborating with the institutes under study.4 Also we developed a free‑access advanced journal indicator application tool based on Scopus data of approximately 20 000 journals.5
In citation analysis pitfalls and sources of error lurk. Methodological and technical problems have to be solved in order to conduct a bibliometric analysis properly [1]. Given the limited space available in this chapter, I mention briefly a number of important and topical issues with references to relevant literature.
1. Effects of language, particularly German and French on the assessment of research performance and on the ranking of universities [7,8].
2. Important publications may be cited after many years, known as ‘delayed recognition’ or Sleeping Beauties [5].
3. Statistical properties of bibliometric indicators, for instance their skewness and scaling behaviour [9–12].
4. Effects of self‑citations on ‘external’ citations [13]. 5. Relation between peer review judgment and bibliometric findings [14]. 6. Effects of open access on citation impact [15]. 7. Field‑independent normalization procedures: source normalized impact per
paper (or SNIP) [16]. 8. Bibliometric analysis in the social sciences and humanities [17]. 9. Methodological and technical problems of university rankings [8,18].10. Inconsistency of the h‑index (Hirsch‑index) [19].11. Inappropriateness of the journal impact factor (or JIF) for research‑performance
assessment [20].
All the above issues play crucial roles in the careful application of bibliometric indicators. I stress that these issues were and still are important themes within the research programmes of CWTS and other bibliometric research groups. I continue this chapter with a discussion of the second main bibliometric method: science mapping.
Science mapping
Each year approximately 1 million scientific articles are published. How can we keep track of all these developments? Are there specific patterns hidden in this mass of published knowledge at a meta‑level, and if so, how can these patterns be interpreted? I return to the citation network in Figure 1, where I explained
4See CWTS website at: http://www.socialsciences.leiden.edu/cwts/5See CWTS journal indicators website at: http://www.journalindicators.com/
23Advances in bibliometric analysis
© The Authors. Volume compilation © 2014 Portland Press Limited
how this network forms the basis of science mapping. Instead of publications characterized by a list of references (the cited publications), imagine that the same publications are also characterized by a list of keywords. Then, we can construct networks mathematically similar to CC analysis, but now it is co‑word analysis.
My institute’s science mapping methodology uses this co‑word analysis to visualize scientific fields. The development of co‑word maps has a 30‑year history. A co‑word map is a two‑dimensional representation of a field in which strongly related terms are located close to each other and less strongly related terms are located further away from each other. A co‑word map thus provides an overview of the structure of a field. Different areas in a map correspond with different subfields or research areas.
The first methodological step is the definition of scientific fields. My institute uses the (WoS‑based) CWTS bibliometric database. This database has good coverage of particularly the natural sciences and medical fields and is a long‑standing data source for professional bibliometric analyses. In particular, we use the WoS journal subject categories to define fields. There are about 250 subject categories in the WoS database, covering fields in the natural sciences and medicine, the social sciences, and the arts and humanities.
Using natural language processing techniques, titles and abstracts of the publications in a field are parsed. This yields a list of all noun phrases (i.e. sequences of nouns and adjectives) that occur in these publications. An additional algorithm selects the 2000 noun phrases that can be regarded as the most characteristic terms of the field [21,22]. This algorithm filters out general noun phrases, for instance ‘result’, ‘study’, ‘patient’ and ‘clinical evidence’. Filtering out these general noun phrases is crucial. Owing to their general meaning, these noun phrases do not relate specifically to one topic, and they therefore tend to distort the structure of a co‑word map. Apart from excluding general noun phrases, noun phrases that occur only in a small number of publications are excluded as well. This is done in order to obtain sufficiently robust results. The minimum number of publications in which a noun phrase must occur depends on the total number of publications in a field. In most cases, we use thresholds between 70 and 135 publications.
Given a selection of 2000 terms that together characterize a field, the next step is to determine the number of publications in which each pair of terms co‑occurs. Two terms are said to co‑occur in a publication if they both occur at least once in the title or abstract of the publication. The larger the number of publications in which two terms co‑occur, the stronger the terms are considered to be related to each other. In neuroscience, for instance, ‘Alzheimer’ and ‘short‑term memory’ may be expected to co‑occur a lot, indicating a strong relation between these two terms. The matrix of term co‑occurrence frequencies serves as input for the VOS mapping technique [21,22]. This technique determines for each term a location in a two‑dimensional space. Strongly related terms tend to be located close to each other in the two‑dimensional space, whereas terms that do not have a strong relation are located further away from each other. The VOS mapping technique is closely related to the technique of multidimensional scaling, but for the purpose of creating co‑word maps the VOS mapping technique has been shown to yield more satisfactory results. It is important to note that in the interpretation of a co‑word map, only the distances between terms are relevant. A map can be freely
24 A.F.J. van Raan
© The Authors. Volume compilation © 2014 Portland Press Limited
rotated because this does not affect the inter‑term distances. This also implies that the horizontal and vertical axes have no special meaning.
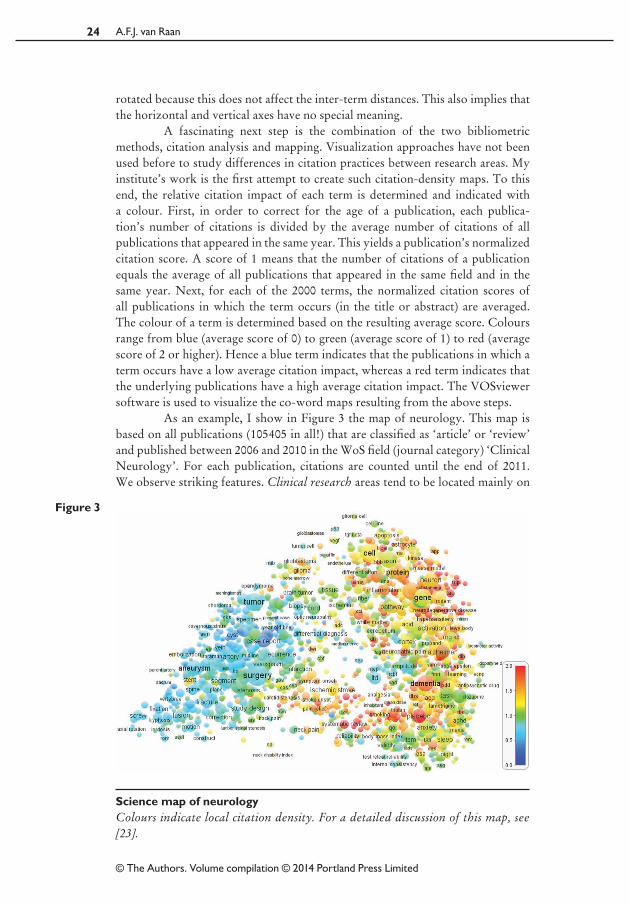
A fascinating next step is the combination of the two bibliometric methods, citation analysis and mapping. Visualization approaches have not been used before to study differences in citation practices between research areas. My institute’s work is the first attempt to create such citation‑density maps. To this end, the relative citation impact of each term is determined and indicated with a colour. First, in order to correct for the age of a publication, each publica‑tion’s number of citations is divided by the average number of citations of all publications that appeared in the same year. This yields a publication’s normalized citation score. A score of 1 means that the number of citations of a publication equals the average of all publications that appeared in the same field and in the same year. Next, for each of the 2000 terms, the normalized citation scores of all publications in which the term occurs (in the title or abstract) are averaged. The colour of a term is determined based on the resulting average score. Colours range from blue (average score of 0) to green (average score of 1) to red (average score of 2 or higher). Hence a blue term indicates that the publications in which a term occurs have a low average citation impact, whereas a red term indicates that the underlying publications have a high average citation impact. The VOSviewer software is used to visualize the co‑word maps resulting from the above steps.
As an example, I show in Figure 3 the map of neurology. This map is based on all publications (105 405 in all!) that are classified as ‘article’ or ‘review’ and published between 2006 and 2010 in the WoS field (journal category) ‘Clinical Neurology’. For each publication, citations are counted until the end of 2011. We observe striking features. Clinical research areas tend to be located mainly on
Science map of neurologyColours indicate local citation density. For a detailed discussion of this map, see [23].
Figure 3
25Advances in bibliometric analysis
© The Authors. Volume compilation © 2014 Portland Press Limited
the left‑hand side of the map and basic research areas mainly on the right‑hand side. Connections between basic research areas and clinical research areas are also visible. The maps display ‘bridges’ that seem to represent translational research, that is, research aimed at translating basic research results into clinical practice. Furthermore, the distinction between different research areas is visible not only in the structure of the maps, but also in the colours of the terms. In general, low‑impact research areas tend to focus on clinical research, in particular on surgical interventions. Research areas that are more oriented towards basic and diagnostic research usually have an above‑average citation impact. We note that within an area in a map, terms are usually coloured in a quite consistent way: terms tend to be surrounded mainly by other terms with a similar colour. This is an important indication of the robustness of the maps.
Concluding remarks
Advanced bibliometric analysis is a powerful method to, first, assess with citation analysis the international influence of scientific work in a reliable, transparent and objective way, particularly in the natural science and medical fields, and in several of the engineering and social science fields; and secondly, discover with science maps patterns in the structure of fields, which enables us to identify interdisci‑plinarity, knowledge flows such as translational medical research, and research related to important socio‑economic issues.
With advanced menu‑driven application tools for research performance assessment and monitoring of university departments and institutes, for journal indicators, ranking of universities and mapping, bibliometric methods have now reached a stage of high‑quality, reliable and very informative instruments in research evaluation practice.
References
1. van Raan, A.F.J. (2004) Measuring science. Capita selecta of current main issues. In: Handbook of Quantitative Science and Technology Research (Moed, H.F., Glänzel, W. and Schmoch, U., eds), pp. 19–50, Kluwer Publishers, Dordrecht
2. van Raan, A.F.J. (1998) In matters of quantitative studies of science the fault of theorists is offering too little and asking too much. Scientometrics 43, 129–139
3. Butler, L. and Visser, M.S. (2006) Extending citation analysis to non‑source items. Scientometrics 66, 327–343
4. Waltman, L., van Eck, N.J., van Leeuwen, T.N., Visser, M.S. and van Raan, A.F.J. (2011) Towards a new crown indicator: an empirical analysis. Scientometrics 87, 467–481
5. van Raan, A.F.J. (2004) Sleeping beauties in science. Scientometrics 59, 461–466 6. Uppsala University (2007) Quality and Renewal 2007: An Overall Evaluation of Research
at Uppsala University 2006/2007. Also available from: http://uu.diva‑portal.org/smash/get/diva2:43034/FULLTEXT01.pdf
7. van Raan, A.F.J., van Leeuwen, T.N. and Visser, M.S. (2011) Severe language effect in university rankings: particularly Germany and France are wronged in citation‑based rankings. Scientometrics 88, 495–498
8. Waltman, L., Calero‑Medina, C., Kosten, J. et al. (2012) The Leiden Ranking 2011/2012: data collection, indicators, and interpretation. Journal of the American Society for Information Science and Technology 63, 2419–2432. Open access pre‑print version: http://arxiv.org/abs/1202.3941
26 A.F.J. van Raan
© The Authors. Volume compilation © 2014 Portland Press Limited
9. van Raan, A.F.J. (2006) Statistical properties of bibliometric indicators: research group indicator distributions and correlations. Journal of the American Society for Information Science and Technology 57, 408–430
10. van Raan, A.F.J. (2006) Performance‑related differences of bibliometric statistical properties of research groups: cumulative advantages and hierarchically layered networks. Journal of the American Society for Information Science and Technology 57, 1919–1935
11. van Raan, A.F.J. (2008) Bibliometric statistical properties of the 100 largest European research universities: prevalent scaling rules in the science system. Journal of the American Society for Information Science and Technology 59, 461–475
12. van Raan, A.F.J. (2008) Scaling rules in the science system: influence of field‑specific citation characteristics on the impact of research groups. Journal of the American Society for Information Science and Technology 59, 565–576
13. van Raan, A.F.J. (2008) Self‑citation as an impact‑reinforcing mechanism in the science sys‑ tem. Journal of the American Society for Information Science and Technology 59, 1631–1643
14. Rinia, E.J., van Leeuwen, Th.N., van Vuren, H.G. and van Raan, A.F.J. (1998) Comparative analysis of a set of bibliometric indicators and central peer review criteria. Evaluation of condensed matter physics in The Netherlands. Research Policy 27, 95–107
15. Moed, H.F. (2007) The effect of “Open access” on citation impact: an analysis of ArXiv’s condensed matter section. Journal of the American Society for Information Science and Technology 58, 2047–2054
16. Moed, H.F. (2010) Measuring contextual citation impact of scientific journals. Journal of Informetrics 4, 265–277
17. Nederhof, A.J. (2006) Bibliometric monitoring of research performance in the social sciences and the humanities: a review. Scientometrics 66, 81–100
18. van Raan, A.F.J. (2005) Fatal attraction: conceptual and methodological problems in the ranking of universities by bibliometric methods. Scientometrics 62, 133–143
19. Waltman, L. and van Eck, N.J. (2012) The inconsistency of the h‑index. Journal of the American Society for Information Science and Technology 63, 406–415. Open access pre‑print version: http://arxiv.org/abs/1108.3901
20. van Leeuwen, T.N. (2012) Discussing some basic critique on journal impact factors: revision of earlier comments. Scientometrics 92, 443–455
21. van Eck, N.J. and Waltman, L. (2010) Software survey: VOSviewer, a computer program for bibliometric mapping. Scientometrics 84, 523–538
22. van Eck, N.J. and Waltman, L. (2011) Text mining and visualization using VOSviewer. ISSI Newsletter 7, 50–54
23. van Eck, N.J., Waltman, L., van Raan, A.F.J., Klautz, R.J.M. and Peul, W.C. (2013) Citation analysis may severely underestimate the impact of clinical research as compared to basic research. PLoS ONE 8, e62395
27Advances in bibliometric analysis
© The Authors. Volume compilation © 2014 Portland Press Limited
Appendix: overview of bibliometric indicators
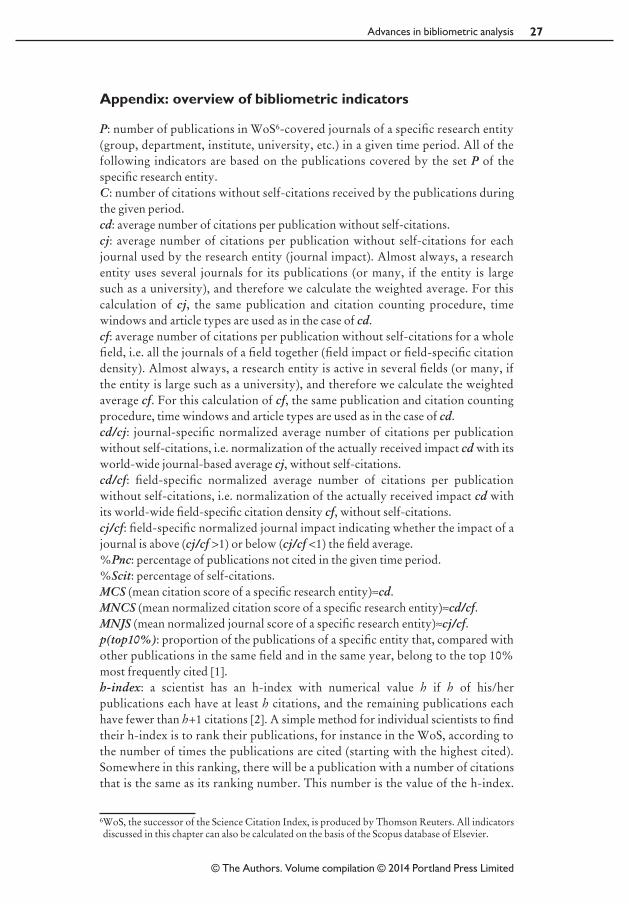
P: number of publications in WoS6‑covered journals of a specific research entity (group, department, institute, university, etc.) in a given time period. All of the following indicators are based on the publications covered by the set P of the specific research entity.C: number of citations without self‑citations received by the publications during the given period.cd: average number of citations per publication without self‑citations.cj: average number of citations per publication without self‑citations for each journal used by the research entity (journal impact). Almost always, a research entity uses several journals for its publications (or many, if the entity is large such as a university), and therefore we calculate the weighted average. For this calculation of cj, the same publication and citation counting procedure, time windows and article types are used as in the case of cd.cf: average number of citations per publication without self‑citations for a whole field, i.e. all the journals of a field together (field impact or field‑specific citation density). Almost always, a research entity is active in several fields (or many, if the entity is large such as a university), and therefore we calculate the weighted average cf. For this calculation of cf, the same publication and citation counting procedure, time windows and article types are used as in the case of cd.cd/cj: journal‑specific normalized average number of citations per publication without self‑citations, i.e. normalization of the actually received impact cd with its world‑wide journal‑based average cj, without self‑citations. cd/cf: field‑specific normalized average number of citations per publication without self‑citations, i.e. normalization of the actually received impact cd with its world‑wide field‑specific citation density cf, without self‑citations.cj/cf: field‑specific normalized journal impact indicating whether the impact of a journal is above (cj/cf >1) or below (cj/cf <1) the field average.%Pnc: percentage of publications not cited in the given time period.%Scit: percentage of self‑citations.MCS (mean citation score of a specific research entity)»cd.MNCS (mean normalized citation score of a specific research entity)»cd/cf.MNJS (mean normalized journal score of a specific research entity)»cj/cf.p(top10%): proportion of the publications of a specific entity that, compared with other publications in the same field and in the same year, belong to the top 10% most frequently cited [1].h‑index: a scientist has an h‑index with numerical value h if h of his/her publications each have at least h citations, and the remaining publications each have fewer than h+1 citations [2]. A simple method for individual scientists to find their h‑index is to rank their publications, for instance in the WoS, according to the number of times the publications are cited (starting with the highest cited). Somewhere in this ranking, there will be a publication with a number of citations that is the same as its ranking number. This number is the value of the h‑index.
6 WoS, the successor of the Science Citation Index, is produced by Thomson Reuters. All indicators discussed in this chapter can also be calculated on the basis of the Scopus database of Elsevier.
28 A.F.J. van Raan
© The Authors. Volume compilation © 2014 Portland Press Limited
Because the h‑index does not take into account the often large differences in cita‑ tion density between, and even within fields of science, this indicator is in many situations not appropriate for the assessment of research performance. Furthermore, it was recently proved that the h‑index is mathematically inconsistent [3].JIF: I define this indicator with an example: the JIF of a journal for the year 2010 is the number of citations received in 2010 for publications of 2008 and 2009 in this journal, divided by the total number of publications of 2008 and 2009 of the journal. Often, the JIF values are used to weight publications, as a ‘proxy’ for the real number of citations received by these publications. This is not a good practice as (i) the JIF values are based on a too short citation window (2 years); (ii) JIF values are strongly influenced by the review papers in a journal; reviews are mostly higher cited than ‘normal’ publications and thus it is important to correct for article type (such as in the indicators cd/cj, cd/cf, cj/cf ); and (iii) there are inconsistencies and errors in the calculations [4,5]. The JIF values for all journals covered by the WoS can be found in the Journal Citation Reports ( JCR®), a separate database of Thomson Reuters. If a university has a subscription to the WoS, the JCR® database is included in this subscription.
References
1. Waltman, L., Calero‑Medina, C., Kosten, J. et al. (2012) The Leiden Ranking 2011/2012: data collection, indicators, and interpretation. Journal of the American Society for Information Science and Technology 63, 2419–2432. Open access pre‑print version: http://arxiv.org/abs/1202.3941. See more at: http://www.leidenranking.com/methodology/indicators
2. Hirsch, J.E. (2005) An index to quantify an individual’s scientific research output. Proceedings of the National Academy of Sciences of the United States of America 102, 16569–16572. Open access pre‑print version: http://arxiv.org/abs/physics/0508025
3. Waltman, L. and van Eck, N.J. (2012) The inconsistency of the h‑index. Journal of the American Society for Information Science and Technology 63, 406–415. Open access pre‑print version: http://arxiv.org/abs/1108.3901
4. Moed, H.F. and van Leeuwen, T.N. (1996) Impact factors can mislead. Nature 381, 186 5. van Leeuwen, T.N. (2012) Discussing some basic critique on journal impact factors: revision
of earlier comments. Scientometrics 92, 443–455