advances in biosensors: reviews volume 1
TRANSCRIPT

S. YurishEditor
Advances in Biosensors: Reviews
Volume 1
International Frequency Sensor Association Publishing
S. Yurish, EditorAdvances in Biosensors: Reviews. Volume 1.
Published by IFSA Publishing, S. L., 2017 E-mail (for print book orders and customer service enquires):[email protected]
Visit our Home Page on http://www.sensorsportal.com
Advances in Biosensors: Reviews, Vol. 1 is an open access book which means that all content is freely available without charge to the user or his/her institution. Users are allowed to read, download, copy, distribute, print, search, or link to the full texts of the articles, or use them for any other lawful purpose, without asking prior permission from the publisher or the authors. This is in accordance with the BOAI definition of open access.
Neither the authors nor International Frequency Sensor Association Publishing accept any responsibility or liability for loss or damage occasioned to any person or property through using the material, instructions, methods or ideas contained herein, or acting or refraining from acting as a result of such use.
ISBN: 978-84-697-3467-4 e-ISBN: 978-84-697-3468-1BN-20170531-XXBIC: TCBS
Do
wnl
oad
ed f
rom
mo
stw
ied
zy.p
l
Chapter 7. Electronic Noses and Electronic Tongues
153
Chapter 7
Electronic Noses and Electronic Tongues
Tomasz Dymerski7
7.1. Introduction
The human senses such as smell and taste are still main tools utilized in many areas of daily life, even the fact there were numerous attempts to elaborate a devices capable to perform their function. Nevertheless, the past 30 years of the evolution of sensor technologies gives a great opportunity to apply a newest technical solutions into the systems where sensor arrays are utilized. The electronic noses and electronic tongues are still being developed in order to measure aroma and taste in a way parallel to the biological senses. Despite of the fact these devices are not used for routine analysis, their prospective application might constitute a reasonable option too many issues where rapid analysis is advisable.
This contribution summarizes the achievements on the field of artificial senses, such as electronic nose and electronic tongue. It examines multivariate data processing methods and demonstrates a promising potential for rapid routine analysis. Main attention is focused on detailed description of sensor used, construction and principle of operation of these systems. A brief review about the progress in the field of artificial senses and future trends in concerned. A special attention has been paid to the application of these systems in two dominant fields, namely in food investigations and environmental monitoring.
7 Tomasz Dymerski Department of Analytical Chemistry, Faculty of Chemistry, Gdańsk University of Technology, Gdańsk, Poland
Do
wnl
oad
ed f
rom
mo
stw
ied
zy.p
l
Designing Nanosensors for Chemical and Biological Applications
154
7.2. Senses of Smell and Taste
Gustatory sensations perceived by mammals originate when particles of volatile substances come into contact with taste receptors – specialized chemoreceptors clustered in taste buds that are located in the oral cavity. Clusters of these taste buds are located on small papillae which, depending on their location differ in shape and size. Adult humans have app. 10000 taste buds. Within each taste buds there are about 50-150 rod-shaped taste cells, which transmit the information to neuron cells which, in turn, transmits it to the brain. Five types of taste receptors which react to particular groups of chemicals present in foodstuffs or atmospheric air. Different taste sensations have different taste thresholds, highest for sweet and salty, and lowest for bitter foods. Taste sensations can be classified according to the taste-distinguishing mechanism into two groups. In the case of sour and salty tastes, the mechanism is based on hydrogen and sodium ions, respectively, reacting directly with ionic channels by changing the membrane potential of receptors [18, 23]. In the case of sweet and bitter tastes, there are protein receptor spots connected with the G protein, which, after forming a complex with a taste substance molecule, activate the G protein, leading to a series of chemical changes [4]. Both mechanisms lead to the excitation of a nerve pulse transmitted to the brain.
Sense of smell, together with the sense of taste, can be described as a ‘chemical sense’. It is the ability to discern chemical compounds or their mixtures in the surrounding air [18, 24]. The working of the sense of smell can be divided into the following steps: learning to identify and differentiate flavours, remembering and integrating different odours [25]. The ability to integrate different flavours that is exhibited by the sense of smell is a very sophisticated function which allows for the prediction and correlation between components that will combine to create a new flavour [26]. The human olfactory apparatus is able to discriminate between app. 10 000 flavour compounds with high sensitivity and accuracy [15, 22], with sensitivity in the order of parts per trillion in the case of certain chemical compounds. In some cases, even stereoisomers can be distinguished [22]. For example methyl mercaptan, a compound responsible for the characteristic aroma of garlic, has an odour threshold of less than 500 pg/L of air [21]. However, for substances such as ethane, butane or acetylene the odour detection threshold is much higher [14]. Contrary to the taste of smell, it is difficult to classify aromas into distinct groups. It has been suggested that the number of basic classes of olfactory sensations varies from 7 to 50 [22].
Do
wnl
oad
ed f
rom
mo
stw
ied
zy.p
l
Chapter 7. Electronic Noses and Electronic Tongues
155
Molecules of odorous substances are usually volatile (molecular masses up to app. 300 Da), small, polar and often hydrophobic [13, 14] organic compounds that contain one or two functional groups [27]. Simple odours, like that of ethyl alcohol, contain only one type of odorant molecule, whilst more complex ones can consist of several thousand different chemical components, each at a different concertation level [14, 15].
The sense of smell is one of the most primeval senses from the evolutionary point of view. The part of brain in which it is located is not dissimilar to its reptilian equivalent, which suggests that it developed before mammals have emerged as a distinct class of vertebrae. Mammalian olfactory receptors (OR) are seven-transmembrane domain G protein-coupled receptors and are encoded by a large number of genes. In the case of humans, 399 intact OR genes and 297 OR pseudogenes have been identified, which amounts to app. 3 % of the entire human genome [30, 31]. The human nose is app. triangular in shape, partitioned by an internal wall called the nasal septum. It is limited form the top by an orbital lamina perpendicular to the ethmoid bone, and from the bottom by a tetragonal copula [21, 26, 34]. The nasal cavity consists of two nasal tubes separated by a partition. The olfactory epithelium is located in the upper part of the nasal fossa, in the region of the nasal septum, the roof of the nasal cavity and at the front end of the superior nasal concha [21, 24]. Olfactory cells are neurons with a dual function, serving both as chemical receptors and pulse-conducting cells [21, 26, 34]. Olfactory cells are exposed to the atmospheric air, which makes them the only nerve cells in the human organism that receive the stimulus directly from the outside world. Only about 2 % of an aromatic substance reaches the olfactory epithelium which is a mechanism that protects ORs [21, 34]. In order to stimulate a single cell, less than 10 molecules are needed. Hydrophobic molecules are dissolved in the mucosa, which increases their concentration level. After a flavour molecule becomes bound to the protein cilia of the first neuron, redundant molecules are removed through mucus efflux, enzymatic degradation in sustentacular cells, and permeation to the intercellular space and to the vascular system [4, 21, 26]. From there, information is transmitted to the brain, where the analysis of sensation features is performed, allowing for discrimination of flavours and estimation of their intensity [24, 36].
The senses of taste and smell are functionally linked [4, 36] and connected with functions of the digestive system. This is demonstrated by the fact that a temporary inhibition of the sense of smell, e.g. by
Do
wnl
oad
ed f
rom
mo
stw
ied
zy.p
l
Designing Nanosensors for Chemical and Biological Applications
156
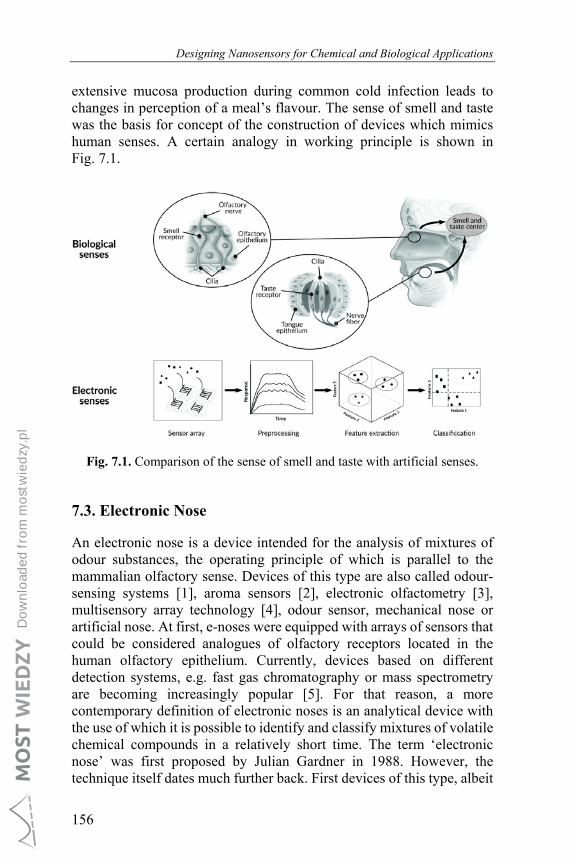
extensive mucosa production during common cold infection leads to changes in perception of a meal’s flavour. The sense of smell and taste was the basis for concept of the construction of devices which mimics human senses. A certain analogy in working principle is shown in Fig. 7.1.
Fig. 7.1. Comparison of the sense of smell and taste with artificial senses.
7.3. Electronic Nose
An electronic nose is a device intended for the analysis of mixtures of odour substances, the operating principle of which is parallel to the mammalian olfactory sense. Devices of this type are also called odour-sensing systems [1], aroma sensors [2], electronic olfactometry [3], multisensory array technology [4], odour sensor, mechanical nose or artificial nose. At first, e-noses were equipped with arrays of sensors that could be considered analogues of olfactory receptors located in the human olfactory epithelium. Currently, devices based on different detection systems, e.g. fast gas chromatography or mass spectrometry are becoming increasingly popular [5]. For that reason, a more contemporary definition of electronic noses is an analytical device with the use of which it is possible to identify and classify mixtures of volatile chemical compounds in a relatively short time. The term ‘electronic nose’ was first proposed by Julian Gardner in 1988. However, the technique itself dates much further back. First devices of this type, albeit
Do
wnl
oad
ed f
rom
mo
stw
ied
zy.p
l

Chapter 7. Electronic Noses and Electronic Tongues
157
quite unsophisticated [6, 7], were introduced 40 years before the term was coined. In 1961 Moncreif created a device mimicking the olfactory sense equipped with 6 different sensors [8, 9]. First work describing a multi-sensory system equipped with chemical sensors was published by Persaud and Dodd in 1982, who were able to identify 20 odorants [10]. The golden age of the development of artificial senses came in 1990’s, coinciding with major developments in the construction of chemical sensors. During this decade first commercial electronic noses were introduced to the market, e.g. Alpha M.O.S. in 1993, Neotronics and Aromascan in 1994 and Bloodhound and HKR Sensorsysteme in 1995. In 1998 mass spectrometry was used for the first time in this type of devices [11]. However, chemical sensors utilized in these early e-noses had some limitations, the most common being the need for frequent calibration, lack of stability, susceptibility to poisoning, response signal masking (e.g. by ethanol) and large power consumption. With the introduction of newer types of sensors, like MOSFET or piezoelectric sensors [12], some of these drawbacks were eliminated. When using MS-based electronic noses there is no issue with profile masking, sensor poisoning, and the impact of ambient conditions (e.g. relative humidity) on the response or non-linearity of the signal. Currently, the development of electronic noses is focused on increasing the sensitivity of the device’s measuring array, which would allow to detect subtle differences between similar samples, and on miniaturization, limiting the power consumption and design of portable devices.
During the analysis using an electronic nose the output signal consists of responses of individual chemical sensors which, when considered holistically, create a characteristic aroma profile of the analyzed sample. Such aroma profile is unique for each mixture of aroma compounds and is sometimes called a ‘fingerprint’ or ‘smellprint’. The identification of odour substance is achieved by comparing its fingerprint with the response to a reference sample [4]. There are many parallels between the mode of operation of an electronic nose and olfactory sense. Chemical sensors work like olfactory cells and send signals to the pattern recognition system which, similar to brain, identifies the aroma [13, 14]. E-noses ale usually comprised of an array of sensors placed in an insulated chamber, a sometimes thermostated sample chamber, electronic components (e.g. analogue-digital converter), and a pneumatic system (vacuum pump, valves, flow meters) (Fig. 7.2). For data processing software capable of statistical analysis is used.
Do
wnl
oad
ed f
rom
mo
stw
ied
zy.p
l
Designing Nanosensors for Chemical and Biological Applications
158
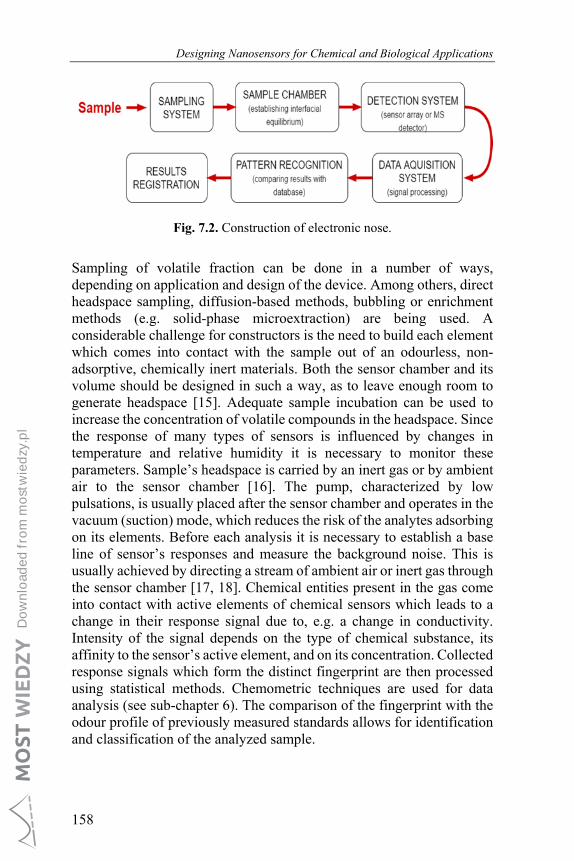
Fig. 7.2. Construction of electronic nose.
Sampling of volatile fraction can be done in a number of ways, depending on application and design of the device. Among others, direct headspace sampling, diffusion-based methods, bubbling or enrichment methods (e.g. solid-phase microextraction) are being used. A considerable challenge for constructors is the need to build each element which comes into contact with the sample out of an odourless, non-adsorptive, chemically inert materials. Both the sensor chamber and its volume should be designed in such a way, as to leave enough room to generate headspace [15]. Adequate sample incubation can be used to increase the concentration of volatile compounds in the headspace. Since the response of many types of sensors is influenced by changes in temperature and relative humidity it is necessary to monitor these parameters. Sample’s headspace is carried by an inert gas or by ambient air to the sensor chamber [16]. The pump, characterized by low pulsations, is usually placed after the sensor chamber and operates in the vacuum (suction) mode, which reduces the risk of the analytes adsorbing on its elements. Before each analysis it is necessary to establish a base line of sensor’s responses and measure the background noise. This is usually achieved by directing a stream of ambient air or inert gas through the sensor chamber [17, 18]. Chemical entities present in the gas come into contact with active elements of chemical sensors which leads to a change in their response signal due to, e.g. a change in conductivity. Intensity of the signal depends on the type of chemical substance, its affinity to the sensor’s active element, and on its concentration. Collected response signals which form the distinct fingerprint are then processed using statistical methods. Chemometric techniques are used for data analysis (see sub-chapter 6). The comparison of the fingerprint with the odour profile of previously measured standards allows for identification and classification of the analyzed sample.
Do
wnl
oad
ed f
rom
mo
stw
ied
zy.p
l
Chapter 7. Electronic Noses and Electronic Tongues
159
7.4. Electronic Tongue
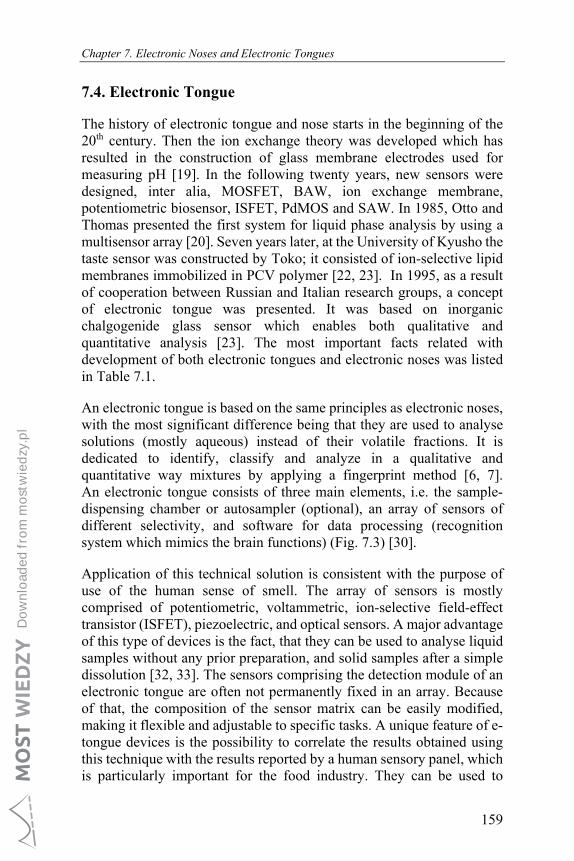
The history of electronic tongue and nose starts in the beginning of the 20th century. Then the ion exchange theory was developed which has resulted in the construction of glass membrane electrodes used for measuring pH [19]. In the following twenty years, new sensors were designed, inter alia, MOSFET, BAW, ion exchange membrane, potentiometric biosensor, ISFET, PdMOS and SAW. In 1985, Otto and Thomas presented the first system for liquid phase analysis by using a multisensor array [20]. Seven years later, at the University of Kyusho the taste sensor was constructed by Toko; it consisted of ion-selective lipid membranes immobilized in PCV polymer [22, 23]. In 1995, as a result of cooperation between Russian and Italian research groups, a concept of electronic tongue was presented. It was based on inorganic chalgogenide glass sensor which enables both qualitative and quantitative analysis [23]. The most important facts related with development of both electronic tongues and electronic noses was listed in Table 7.1.
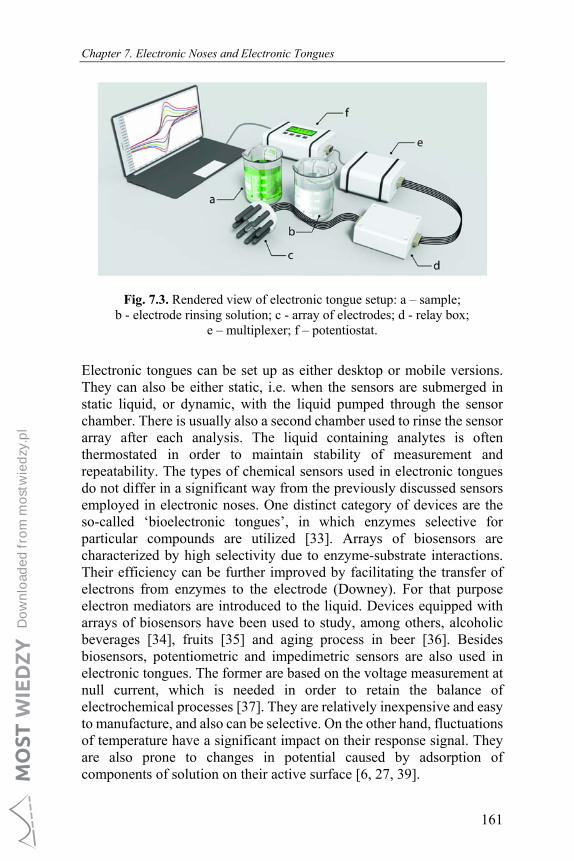
An electronic tongue is based on the same principles as electronic noses, with the most significant difference being that they are used to analyse solutions (mostly aqueous) instead of their volatile fractions. It is dedicated to identify, classify and analyze in a qualitative and quantitative way mixtures by applying a fingerprint method [6, 7]. An electronic tongue consists of three main elements, i.e. the sample-dispensing chamber or autosampler (optional), an array of sensors of different selectivity, and software for data processing (recognition system which mimics the brain functions) (Fig. 7.3) [30].
Application of this technical solution is consistent with the purpose of use of the human sense of smell. The array of sensors is mostly comprised of potentiometric, voltammetric, ion-selective field-effect transistor (ISFET), piezoelectric, and optical sensors. A major advantage of this type of devices is the fact, that they can be used to analyse liquid samples without any prior preparation, and solid samples after a simple dissolution [32, 33]. The sensors comprising the detection module of an electronic tongue are often not permanently fixed in an array. Because of that, the composition of the sensor matrix can be easily modified, making it flexible and adjustable to specific tasks. A unique feature of e-tongue devices is the possibility to correlate the results obtained using this technique with the results reported by a human sensory panel, which is particularly important for the food industry. They can be used to
Do
wnl
oad
ed f
rom
mo
stw
ied
zy.p
l
Designing Nanosensors for Chemical and Biological Applications
160
supplement the work of trained panelists especially in a situation when it is uncertain whether the analyzed substance is safe to consume.
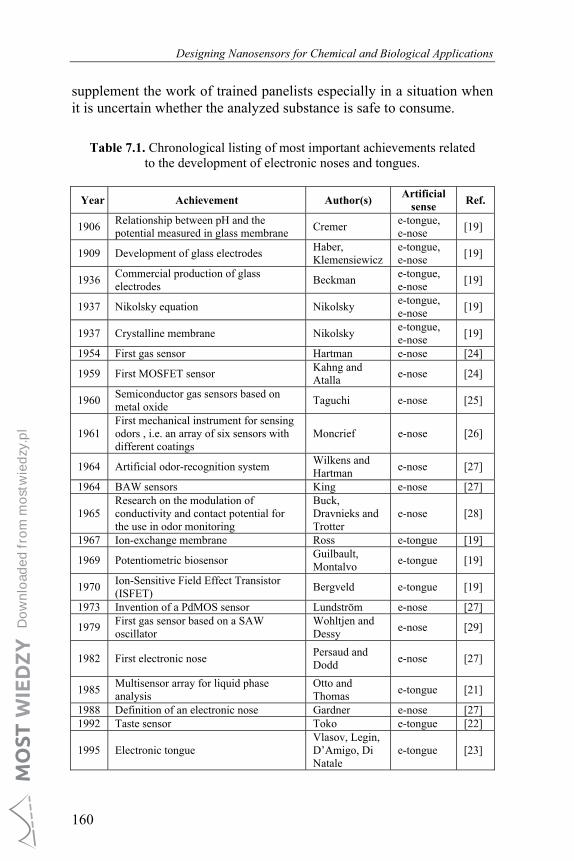
Table 7.1. Chronological listing of most important achievements related to the development of electronic noses and tongues.
Year Achievement Author(s) Artificial
sense Ref.
1906 Relationship between pH and the potential measured in glass membrane
Cremer e-tongue, e-nose
[19]
1909 Development of glass electrodes Haber, Klemensiewicz
e-tongue, e-nose
[19]
1936 Commercial production of glass electrodes
Beckman e-tongue, e-nose
[19]
1937 Nikolsky equation Nikolsky e-tongue, e-nose
[19]
1937 Crystalline membrane Nikolsky e-tongue, e-nose
[19]
1954 First gas sensor Hartman e-nose [24]
1959 First MOSFET sensor Kahng and Atalla
e-nose [24]
1960 Semiconductor gas sensors based on metal oxide
Taguchi e-nose [25]
1961 First mechanical instrument for sensing odors , i.e. an array of six sensors with different coatings
Moncrief e-nose [26]
1964 Artificial odor-recognition system Wilkens and Hartman
e-nose [27]
1964 BAW sensors King e-nose [27]
1965 Research on the modulation of conductivity and contact potential for the use in odor monitoring
Buck, Dravnieks and Trotter
e-nose [28]
1967 Ion-exchange membrane Ross e-tongue [19]
1969 Potentiometric biosensor Guilbault, Montalvo
e-tongue [19]
1970 Ion-Sensitive Field Effect Transistor (ISFET)
Bergveld e-tongue [19]
1973 Invention of a PdMOS sensor Lundström e-nose [27]
1979 First gas sensor based on a SAW oscillator
Wohltjen and Dessy
e-nose [29]
1982 First electronic nose Persaud and Dodd
e-nose [27]
1985 Multisensor array for liquid phase analysis
Otto and Thomas
e-tongue [21]
1988 Definition of an electronic nose Gardner e-nose [27] 1992 Taste sensor Toko e-tongue [22]
1995 Electronic tongue Vlasov, Legin, D’Amigo, Di Natale
e-tongue [23]
Do
wnl
oad
ed f
rom
mo
stw
ied
zy.p
l
Chapter 7. Electronic Noses and Electronic Tongues
161
Fig. 7.3. Rendered view of electronic tongue setup: a – sample; b - electrode rinsing solution; c - array of electrodes; d - relay box;
e – multiplexer; f – potentiostat.
Electronic tongues can be set up as either desktop or mobile versions. They can also be either static, i.e. when the sensors are submerged in static liquid, or dynamic, with the liquid pumped through the sensor chamber. There is usually also a second chamber used to rinse the sensor array after each analysis. The liquid containing analytes is often thermostated in order to maintain stability of measurement and repeatability. The types of chemical sensors used in electronic tongues do not differ in a significant way from the previously discussed sensors employed in electronic noses. One distinct category of devices are the so-called ‘bioelectronic tongues’, in which enzymes selective for particular compounds are utilized [33]. Arrays of biosensors are characterized by high selectivity due to enzyme-substrate interactions. Their efficiency can be further improved by facilitating the transfer of electrons from enzymes to the electrode (Downey). For that purpose electron mediators are introduced to the liquid. Devices equipped with arrays of biosensors have been used to study, among others, alcoholic beverages [34], fruits [35] and aging process in beer [36]. Besides biosensors, potentiometric and impedimetric sensors are also used in electronic tongues. The former are based on the voltage measurement at null current, which is needed in order to retain the balance of electrochemical processes [37]. They are relatively inexpensive and easy to manufacture, and also can be selective. On the other hand, fluctuations of temperature have a significant impact on their response signal. They are also prone to changes in potential caused by adsorption of components of solution on their active surface [6, 27, 39].
Do
wnl
oad
ed f
rom
mo
stw
ied
zy.p
l
Designing Nanosensors for Chemical and Biological Applications
162
7.5. Sensors Used in Electronic Noses and Electronic Tongues
During measurement process an initial form of energy (an input signal) is transformed into a different form of energy, such as: electric, magnetic, chemical, thermal or radiation energy, which constitutes an output signal [39]. The element using which the measured parameter is read is called 'senor'. Together with certain type of signal converter enables the process of described transformation [28, 40]. Sensor is the most important and primary element in electronic noses and electronic tongues. There are two main critical properties of sensors, which makes them more or less useful in dedicated application. It is sensitivity and selectivity to odorants or taste substances that may be present in the analyzed samples. Sensors can be divided into four groups, i.e. electrochemical (conductometric, potentiometric, amperometric, voltammetric, and impedimetric), piezoelectric, optical sensors and biosensors. In case of electronic noses, instead of array of chemical sensors the proper detection system can be also applied. Some of this systems are equipped with gas chromatograph and/or universal detector, e.g. flame ionization detector, ion mobility spectrometer or mass spectrometer. Sometimes as a substitute of the detector the SAW sensor can be applied [27].
7.5.1. Conductometric Sensors
Conductometric sensors is not very often used in electronic tongues [33]. Their use is primarily in electronic noses. Their principle of operation is based on the changes in conductivity. These changes result from the interactions with the volatile odorants which leads to the changes in the sensor's electrical resistance. Despite the fact there are various types this sensors, the construction and distribution of specific elements in conductometric sensors is, in principle, the same. Conductometric sensors can be divided to types, i.e., Metal Oxide Semiconductor (MOS), Metal-Oxide Semiconductor field-Effect Transistor (MOSFET) and Conductive Polymer (CP) sensor [18, 28].
By far the most commonly used type of sensors are metal oxide semiconductors (MOS). They are popular because of their durability, relatively low price, sensitivity in the range from 5 to 500 ppm, chemical resistance and ease of use [42, 43]. Their active components are usually made of zinc, tin, tungsten or iridium oxides doped with platinum or palladium. When an analyte comes into contact with the active surface the sensor’s resistance changes due to a catalytic reaction. The operating
Do
wnl
oad
ed f
rom
mo
stw
ied
zy.p
l
Chapter 7. Electronic Noses and Electronic Tongues
163
temperature of MOS sensors is in the range of 300 °C-500 °C which shortens the response and recovery time and prevents water vapour from condensing on their surface [15]. Unfortunately, this results in high power consumption, which is why this type of sensors is rarely used in portable devices. Moreover, they are susceptible to poisoning with sulphur compounds which create stable bonds with metal oxides [7, 26].
Metal oxide semiconductor field-effect transistors (MOSFET) are similar to MOS sensors, but operate at lower temperatures (100 °C - 200 °C). They are manufactured by depositing a catalytically sensitive metal in a gaseous phase on a silicon oxide surface. When analytes come into contact with the catalyst a reaction takes place, during which the sensor’s physicochemical properties are modified, which in turn leads to a change in electrical potential. The sensors response signal magnitude is proportional to the concentration of analytes in the gaseous mixture. It is possible to manufacture very small MOSFET sensors without sacrificing the repeatability of analysis [44]. Due to the fact that the number of MOSFET varieties available on the market is relatively small they are seldom used in commercial devices.
Sensors based on conductive polymers (CP) belong to the so-called cold conductometric sensors. They are made of semiconducting materials set between two gold-plated electrodes. After the interaction with volatile molecules, reversible changes in conductivity are observed in the sensor. CP sensors are mainly sensitive to polar compounds. However their selectivity and sensitivity can be modified by introducing different functional groups to the polymer structure [17, 45]. Due to such modification, polymeric or glass fiber composites may also display high sensitivity to non-polar substances [46, 47]. The advantages of CP sensors are a low price and fast response, while susceptibility to humidity is the main disadvantage. These sensors have been used in an electronic nose to, inter alia, identify the stages of wine fermentation, monitor decomposition in the Atlantic salmon during its storage at different temperatures and detect the spoiled vacuum-packed beef. Cyranose 320, Aroma Scan A32/50S and Bloodhound BH114 are commercially available electronic noses that employ CP sensors [48].
7.5.2. Potentiometric Sensors
Potentiometric sensors are main elements of electronic tongues. These devices are used to monitor cheese fermentation [49], evaluate the impact of micro-oxygenation and oak chip maceration on the wine
Do
wnl
oad
ed f
rom
mo
stw
ied
zy.p
l
Designing Nanosensors for Chemical and Biological Applications
164
composition, in particular on the presence of phenol compounds [50], monitor changes during beer brewing [51], and identify the botanical origin of honey [52]. This principle of operation is based on the voltage measurement at null current, which is usually needed to retain the balance of electrochemical process. The generated signals are the electromotive forces which depend on the analyte activity. These signals originate in the process of electrochemical reaction at the electrodes or in solution. Potentiometric sensors have a lot of advantages, such as: low cost, commercially easy to produce, possibility to obtain selective sensors, and the highest degree of similarity with the mechanism of molecular recognition. Main disadvantages of this sensors are resulted by the dependence of the measured value on temperature and adsorption of the solution components onto the electrodes [52].
7.5.3. Amperometric and Voltammetric Sensors
This type of sensors is often used in electronic noses. Their use enables to assign the correct class to wheat samples in accordance with the quality classification [53]. They are also applied in electronic tongue systems to assess the conditions under which olive oil is stored [54], identify white wines with regard to the type of grapes and geographical origin [55], and discriminate among various blends of fruit juices [56]. Additionally, similarly to potentiometric sensors, these sensors are used to monitor the aging phase of wine [57], monitor beer fermentation [57], control the freshness of milk stored at room temperature [58], detect chemically adulterated red wine [59], and identify rice wine with regard to its age [60]. The measurements by means of these sensors are based on the electric current reading between the working and reference electrode in an electrochemical cell, as a function of analyte concentration. When an analyte reacts electrochemically, i.e. it undergoes oxidation or reduction, the electric current is generated at the working electrode. The reaction usually takes place at a constant potential as controlled with a potentiostat [28, 40]. In general, the working electrodes are made of gold, iridium, palladium, platinum and rhodium [61]. The main disadvantage of such sensors is the lack of selectivity.
7.5.4. Impedimetric Sensors
Impedimetric sensors are usually employed in an electronic tongues, however it does not happen often. This type of sensor was used to
Do
wnl
oad
ed f
rom
mo
stw
ied
zy.p
l
Chapter 7. Electronic Noses and Electronic Tongues
165
discriminate brands of red wines [60]. Their principles of operation is based on measuring the impedance at one constant frequency or for a frequency spectrum by means of impedance spectroscopy [63, 64].
7.5.5. Piezoelectric Sensors
The working principle of piezoelectric sensors is based on a piezoelectric phenomenon. This group can be divided into surface acoustic wave (SAW) sensors and bulk acoustic wave (BAW) sensors which also include quartz microbalance sensors (QCM). The sensors mass changes when analytes adsorb on its surface, which in turn leads to change of frequency at which the measuring element resonates [14]. This type of sensors is commonly used for measuring temperature, pressure, force or acceleration [17, 65]. The main difference between BAW and SAW sensors is, that in the former the generated wave travels through its entire volume, while in the latter only along its surface [17]. The main advantages of piezoelectric sensors are high sensitivity, real-time measurements, small size, durability, low cost. Piezoelectric sensors are commonly used in electronic noses to determine the optimal time for harvesting apples [65] and evaluate the quality of tomatoes [66]. Their wider use in electronic tongues is just a question of time.
Bulk acoustic wave sensors are comprised of a single quartz crystal and two gold-plated electrodes [15]. The crystal is coated with a selective layer which absorbs measured chemical substances from the gaseous mixture. When this happens, the resonator’s weight increases and its resonating frequency, which ordinarily oscillates between 5 to 30 MHz changes. This gives rise to a three-dimensional acoustic wave which passes along the entire bulk of the crystal. Purging the crystal with an inert gas causes desorption of analytes and a return to default frequency [67]. The use of QCM sensors has numerous advantages, namely high sensitivity (ppb level), linearity of response at a large range of concentrations and insusceptibility to fluctuations of temperature and relative humidity.
Surface acoustic wave sensors have a higher resonating frequency of app. 100 MHz – 1 GHz. In this type of sensors a piezoelectric material with input and output transducers situated at its surface is used. A selective membrane is placed between the transducers. The membrane is usually made of porous polymers, lipids, self-assembled monolayers or Langmuir-Blodgett films. A two-dimensional acoustic wave travelling along the sensor’s surface is generated when alternating current is
Do
wnl
oad
ed f
rom
mo
stw
ied
zy.p
l
Designing Nanosensors for Chemical and Biological Applications
166
directed through the input. The piezoelectric element is made of zinc oxide, lithium niobate or quartz. SAW sensors are less sensitive than QCM, since they react to concentrations at ppm level, but their response time is relatively short [15].
7.5.6. Optical Sensors
The use of optical sensors makes possible to detect substances which are not electrochemically active and therefore cannot be detected by an electrochemical sensor. Optical sensors have some disadvantages which significantly limit their application, for example, sensor durability and the output signal distortion [67, 69]. These sensors have been employed in electronic noses to discriminate commercial drinks [68], while in electronic tongues to evaluate the quality of beer brands [69] and discriminate wines with regard to the wine age and grape variety [59]. Optical sensors are devices mostly based on the interaction of electromagnetic radiation with matter. These sensors contain various dyes which react with analytes. The sensor sensitivity depends on the type of dyes used, a plethora of dyes can be employed in electronic senses [46, 70]. Optical sensors can be based on different phenomena such as, fluorescence, reflection and absorbance. These sensors consist of an indicator, detector and the light source, the latter set at a specific wavelength in order to maximize selectivity [17, 18]. The sensors are placed on special, mostly polymeric-type membranes. Due to the interaction with an analyte, the properties of an indicator change, which influences the membrane absorbance or fluorescence. The changes are monitored via a detector, which converts the signal from optical into electric form. There is a big variety of optical sensors therefore they are characterized by low cost, simple procedure and high selectivity.
7.5.7. Biosensors
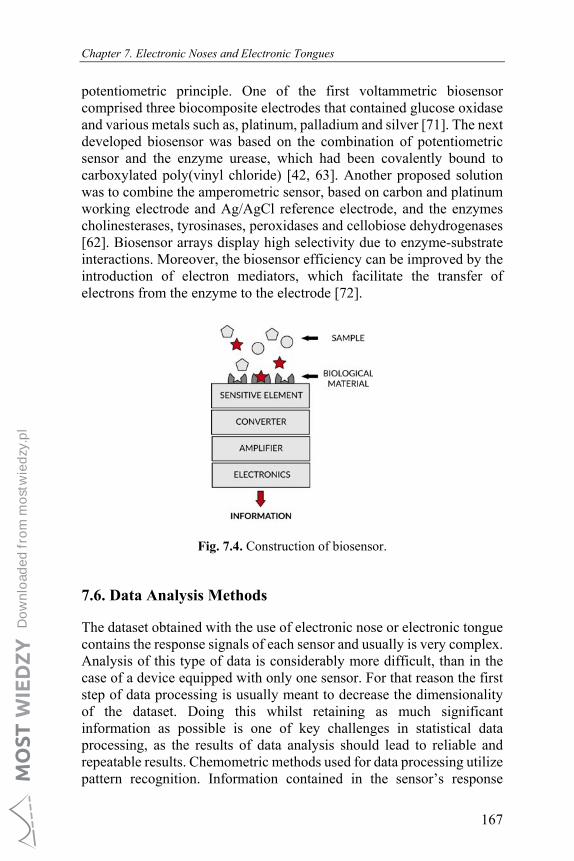
Biosensors are mainly used in electronic tongues. These sensors have been used to monitor changes occurring during the aging process in alcohols [71]. A biosensor consists of a biological measuring element, which is located close to the transducer in order to achieve high sensitivity to the target analytes (Fig. 7.4).
Biosensor-based electronic tongue is often called a bioelectronic tongue. Until now, different principles of operation of bioelectonic tongues have been proposed, including voltammetric, amperometric and
Do
wnl
oad
ed f
rom
mo
stw
ied
zy.p
l
Chapter 7. Electronic Noses and Electronic Tongues
167
potentiometric principle. One of the first voltammetric biosensor comprised three biocomposite electrodes that contained glucose oxidase and various metals such as, platinum, palladium and silver [71]. The next developed biosensor was based on the combination of potentiometric sensor and the enzyme urease, which had been covalently bound to carboxylated poly(vinyl chloride) [42, 63]. Another proposed solution was to combine the amperometric sensor, based on carbon and platinum working electrode and Ag/AgCl reference electrode, and the enzymes cholinesterases, tyrosinases, peroxidases and cellobiose dehydrogenases [62]. Biosensor arrays display high selectivity due to enzyme-substrate interactions. Moreover, the biosensor efficiency can be improved by the introduction of electron mediators, which facilitate the transfer of electrons from the enzyme to the electrode [72].
Fig. 7.4. Construction of biosensor.
7.6. Data Analysis Methods
The dataset obtained with the use of electronic nose or electronic tongue contains the response signals of each sensor and usually is very complex. Analysis of this type of data is considerably more difficult, than in the case of a device equipped with only one sensor. For that reason the first step of data processing is usually meant to decrease the dimensionality of the dataset. Doing this whilst retaining as much significant information as possible is one of key challenges in statistical data processing, as the results of data analysis should lead to reliable and repeatable results. Chemometric methods used for data processing utilize pattern recognition. Information contained in the sensor’s response
Do
wnl
oad
ed f
rom
mo
stw
ied
zy.p
l
Designing Nanosensors for Chemical and Biological Applications
168
signal is compared with reference data. The basic steps of data analysis are as follows [17, 74]:
• Pre-processing; • Selection of variables; • Classification; • Decision making.
Preliminary analysis (pre-processing) is used to smoothen the signal, average sensor responses, and to filter the background noise [74]. Moreover, at this stage operations like data normalization and centering are also performed. Next step is to reduce the dataset’s dimensionality and to employ one or more data analysis techniques. These techniques can be classified into quantitative methods and pattern analysis [76, 77] or, based on the model’s learning mechanism into supervised and unsupervised methods. In supervised techniques, in order to properly ‘teach’ the model, it is fed input values together with expected outputs. In this way a reference signal is defined. In unsupervised methods the model is built without pre-defined outputs.
One of the easiest data analysis methods is to plot raw data as histograms or radar plots. This method works well when there are significant differences between groups of samples [74, 78, 79]. When it is difficult to classify samples outright, methods like multifactorial analysis or neurocomputers are employed [80–82]. In this chapter, the briefly characterization of the most commonly used statistical data analysis methods in combination with electronic noses and electronic tongues are presented.
7.6.1. Artificial Neural Networks (ANN)
Models utilizing artificial neural networks can work both as supervised and unsupervised pattern recognition techniques. Artificial networks are comprised of interconnected computation clusters, so-called ‘nods’. In each node a simple mathematical operation that modifies the input is performed. This solution mimics the processes taking place in human neural cells. Nods are usually situated in layers. The task of the first strata is to relay the information to other nodes. Subsequent nodes modify the signal and their output is the input of other clusters. In this way, neural network ‘learns’ how to react to a given impulse, e.g. a mixture of odour compounds [82]. At this stage weights are determined, that is by what factor the signal will be multiplied in a given node. Nodes situated in the
Do
wnl
oad
ed f
rom
mo
stw
ied
zy.p
l

Chapter 7. Electronic Noses and Electronic Tongues
169
last layer ale called output neurons. A model set up in this way can be used to predict output values, classification or for pattern recognition [83]. The most commonly used Chemometric methods based on ANN are radial basis function (RBF), counter propagation – artificial neural network (CP – ANN), generalized regression neural network (GRNN), time delay neural networks (TDNN), probabilistic neural networks (PNN) and self-organizing maps (SOM) [84].
7.6.2. Cluster Analysis (CA)
In this method inputs are classified based on the distances between individual data points [85]. The result of cluster analysis is often plotted in the form of dendrograms [86]. Each strand is assigned to gradually larger agglomerates based on the similarity of data (distance between particular strands). In the end each object forms a single cluster [85]. Clusters can be grouped not only based on distance to the nearest neighbour, but also based on the distance from the furthermost neighbour or group average [86]. Each object in the dataset can be assigned to only one class. In practice, CA can be used to determine, whether or not there are distinct sub-classes in a given group [87].
7.6.3. k-Nearest Neighbour (k-NN)
K-nearest neighbour algorithm classifies data points based on distances between them in a multidimensional space. The points that are closest to each other create a separate group. Input data is compared with regard to Euclidean distances and therefore k objects that are most alike are selected. The ‘k’ parameter is chosen in such a way, as to maximize class separation [88].
7.6.4. Discriminant Function Analysis (DFA)
In this method discriminant functions are defined in such a way as to maximize the variance between various classes, and at the same time minimize the distances within the classes themselves [89]. This is achieved by using discriminant prediction equation, which allows to discard the variables that have the least impact on classification. In practice, first the F-test is performed in order to determine whether the discriminant model is entirely significant, and subsequently when the F-test has shown significance [90].
Do
wnl
oad
ed f
rom
mo
stw
ied
zy.p
l
Designing Nanosensors for Chemical and Biological Applications
170
7.6.5. Partial Least Squares (PLS)
Partial least squares method is a modification of principal component analysis. It is a good example of a multiple regression method. The algorithm tries to fit a linear combination of predictors. This predictors, just like principal components, are orthogonal to each other. New variables have to explain the input data and be correlated with output values. PLS is employed when a single response signal can be explained by a large number of variables. It can be used to develop discriminant analysis models (PLS-DA) [91].
7.6.6. Linear Discriminant Analysis (LDA)
A probabilistic classification technique, LDA is based on rotating an orthogonal data space in such a way, as to maximize the variance between classes, and minimize the variance within those classes [82], [87]. Classes should have a normal distribution, there should be a linear separation of groups and variance-covariance matrices, and the number of objects should be at least three times larger than the number of variables [92, 93]. At the model training stage outputs of classes are established, add then input data is assigned to these classes [87].
7.6.7. Soft Independent Modelling of Class Analogies (SIMCA)
In SIMCA a separate model is created for each class. To this end e.g. principal components can be used [92, 94]. Then, based on a pre-defined similarity, a confidence envelope is created which allows to determine whether an object belongs to a particular group or not. The number of principal components used to create a model varies with each class.
7.6.8. Support Vector Machines (SVMs)
Support vector machines is an increasingly popular method of data processing in electronic noses. It was first proposed by Vapnik in 1992 [95], which makes it one of most recent supervised learning techniques. In it, points in a multi-dimensional space are separated by a hyperplane to form distinct classes. How successful this separation is depends on hyperplane’s confidence margin, defined as the distance between he hyperplane and object closest to it (so-called support vectors) [96, 97]. Variants of this method are also used, such as support vector regression or least squares support vector regression (LSSVR) [98].
Do
wnl
oad
ed f
rom
mo
stw
ied
zy.p
l
Chapter 7. Electronic Noses and Electronic Tongues
171
7.6.9. Analysis of Variance (ANOVA)
This method is used to compare more than two groups, classification of which is based on a single variable (one-way ANOVA). In this parametric tool the variance of dependent variables is compared within groups which were created based on independent variables. In order to employ the analysis of variance it is necessary to know the dependent variables that are characterized by the normal distribution and by being measureable at least on an interval scale. Moreover, it is important for the groups of variables to be comprised of the same number of objects [99].
7.7. Applications
To date, a great number of studies devoted to various applications of electronic noses and electronic tongues are reported. This artificial senses were used in many different areas of everyday life, e.g. in chemical industry including explosive materials, petrochemical, cosmetic, pharmaceutical, paper, packaging industries, as well as liquid-gas distribution and bootling plants, criminological and medical tests, agriculture, transportation, manufacturing and military purposes. In respect of many years of using this technology the general conclusions can be deduced. Firstly, rather more applications are devoted to electronic noses than electronic tongues and secondly, the main area of interest of artificial senses during many years and now is still food industry. Second main application is environmental monitoring, which was the first use of electronic sense, namely electronic nose to analyze the mixtures of volatile air contaminants that had already been detected by olfaction [72]. Therefore, in present subchapter this two above-mentioned and key applications will be discussed, despite of the fact that electronic tongue utilization in second application is minor.
7.7.1. Food Investigations
In the case of food process monitoring, the electronic nose and tongue have been used to monitor fermentation in milk and cheese [50, 101]. The application of artificial senses assures the product quality at the very start of the food production line. The monitoring of food freshness and product quality during storage is the foremost application of the electronic nose and electronic tongue [32, 59, 81, 102–109]. This allows
Do
wnl
oad
ed f
rom
mo
stw
ied
zy.p
l
Designing Nanosensors for Chemical and Biological Applications
172
the exclusion of spoiled products from the market as well as the determination of appropriate shelf times and storage conditions for milk and cheese in order to avoid financial losses by the dairy industry. Chemical analyses of meat products are mainly performed via an electronic nose, the use of electronic tongue in this case is less suitable because it requires a more complex preparation of samples [31], medical condition of meat [102, 103], and the influence of storage conditions on meat quality in order to determine expiration date [111]. The electronic tongue was applied to analyze ground meat in order to predict the level of chlorides, nitrates and nitrites [110]. Actually, it is the electronic nose which has found a broader application in the field of meat product analysis. This device is used to, among others, monitor the curing process in Iberian ham in order to detect spoilage Fish and shellfish [111]. The electronic senses are employed in the fish processing industry to mainly evaluate the freshness of fish and shellfish. The electronic nose has been used to perform such analysis in sardines [112, 113], shrimp and cod roe [59, 72], and the Atlantic salmon [114], while the electronic tongue, on samples of bream [115]. The duration and conditions of storage have big influence on the freshness of fish and shellfish. In order to protect consumers from the purchase of old fish, studies on the relationship between the duration and conditions of storage, and product freshness were conducted by means of an electronic nose on cod fillets [116], fresh and frozen Atlantic salmon, tilapia [116], the Argentine hake [117], and oysters [118]. An electronic nose is also used to analyze fruits and vegetables. The application of this device is related to the monitoring of food processing, and the evaluation of freshness, shelf life and authenticity of food. On the other hand, the electronic tongue has been mostly used to classify cultivars (e.g. discrimination between onion and shallot) [119], tomatoes based on various parameters [120], apples [121] and apricots, the latter being also discriminated based on the storage duration [121]. The following fruits and vegetables have been investigated so far: bananas, apples, pears, oranges, strawberries, broccoli, potatoes and carrots. The electronic nose was used to monitor dehydration in tomatoes [122] and grapes [123] in order to determine the optimal storage time. Olive oil is very frequently analyzed because the attempts to adulterate more expensive olive oil with its cheaper alternative are very common [123]. Therefore the electronic tongue and nose were both used to discriminate among olive oils based on oil geographic origin [124], and type and quality [55, 125]. In the case of olive oil, the conducted studies were also aimed at determining rancidity [126] and the relationship between the storage time and oil quality [54]. In the case of grains and grain products, quality evaluation and
Do
wnl
oad
ed f
rom
mo
stw
ied
zy.p
l
Chapter 7. Electronic Noses and Electronic Tongues
173
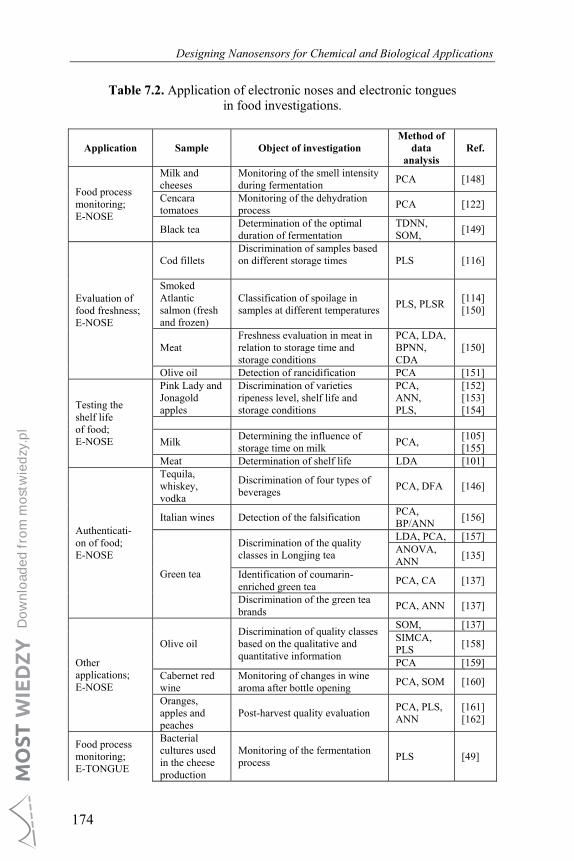
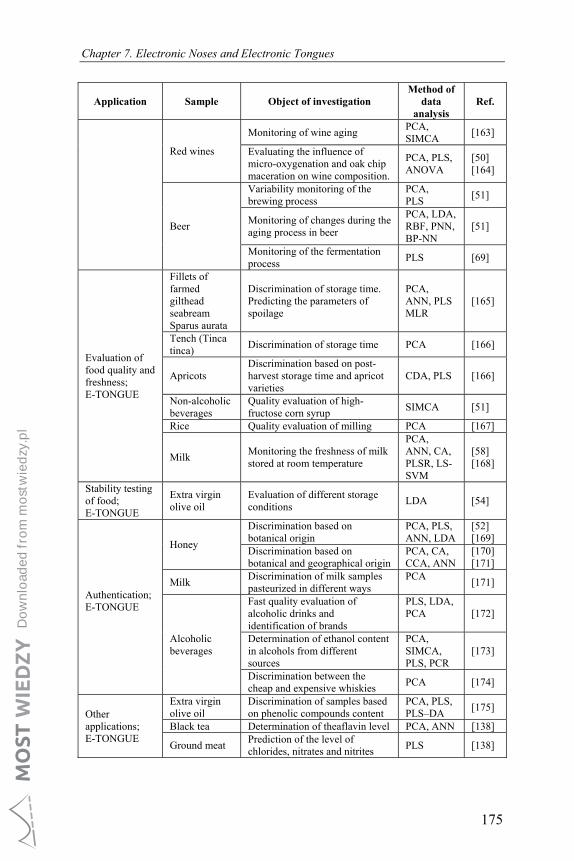
authentication are important (wheat [53, 29], rice [127], barley and oats [128, 129], and corn [130]) however the critical issue for the consumers is the evaluation of possible health risks of such products by means of electronic senses. The possible health risks are related to grain diseases, which often go unnoticed due to the fact that they are not visible to the naked eye. Mycotoxin contamination of grain, which also includes contamination with aflatoxins, and various diseases caused by fungi and bacteria are such risks. Coffees, teas and herbal infusions are mainly analyzed in order to distinguish among specific types, quality levels and brands. This is due to the fact that these products are highly variable. The products of low and high quality are frequently mixed together to lower the overall production costs, and then sold as top quality merchandise. Coffees were discriminated based on the quality [131], brand [119, 132, 133] and the ripening period [134], while teas were evaluated in relation to quality [135], brand [136], geographical origin [136], and the content of flavoring substances such as, coumarin [137], theaflavin [138]. Moreover, the electronic nose was used to monitor the fermentation process in black tea, and to determine the optimal time for producing tea with the best flavor [138]. Until now, the studies aimed at identifying brands and quality of beverages were conducted in e.g. cola type drinks [138], other commercial beverages [139], mineral water [140], and fruit juices and fruit juice-based drinks [141, 142]. On the other hand, alcoholic beverages are among the products which have been most frequently analyzed by means of electronic senses. Process monitoring in alcohol production requires fast analytical tools which can detect substandard products, discriminate among products, and authenticate products in real-time. Wine and beer is mostly subjected to such type of monitoring because both beverages undergo fermentation that results in a release of specific compounds influencing the taste and aroma of the final product. The artificial senses monitored the processes of fermentation [142], brewing [51] and aging [71] in beer. In the case of wine, these devices were employed to control the aging process, determine the influence of wooden barrels on aging and maceration [51, 58], and monitor grape fermentation [143]. Authentication of alcohols is not only aimed at detecting adulterated products with substandard characteristics, but also at identifying falsified products that can be potentially harmful to the consumer's health. Until now, the electronic nose was used to discriminate among vodkas [144], spirits [145], whiskeys [146], wines [146], tequilas [146], beers [146] and sorghum-based drinks [147]. The examples of electronic nose and electronic tongue applications in food analysis are shown in Table 7.2.
Do
wnl
oad
ed f
rom
mo
stw
ied
zy.p
l
Designing Nanosensors for Chemical and Biological Applications
174
Table 7.2. Application of electronic noses and electronic tongues in food investigations.
Application Sample Object of investigation Method of
data analysis
Ref.
Food process monitoring; E-NOSE
Milk and cheeses
Monitoring of the smell intensity during fermentation
PCA [148]
Cencara tomatoes
Monitoring of the dehydration process
PCA [122]
Black tea Determination of the optimal duration of fermentation
TDNN, SOM,
[149]
Evaluation of food freshness; E-NOSE
Cod fillets Discrimination of samples based on different storage times
PLS [116]
Smoked Atlantic salmon (fresh and frozen)
Classification of spoilage in samples at different temperatures
PLS, PLSR [114] [150]
Meat Freshness evaluation in meat in relation to storage time and storage conditions
PCA, LDA, BPNN, CDA
[150]
Olive oil Detection of rancidification PCA [151]
Testing the shelf life of food; E-NOSE
Pink Lady and Jonagold apples
Discrimination of varieties ripeness level, shelf life and storage conditions
PCA, ANN, PLS,
[152] [153] [154]
Milk Determining the influence of storage time on milk
PCA, [105] [155]
Meat Determination of shelf life LDA [101]
Authenticati- on of food; E-NOSE
Tequila, whiskey, vodka
Discrimination of four types of beverages
PCA, DFA [146]
Italian wines Detection of the falsification PCA, BP/ANN
[156]
Green tea
Discrimination of the quality classes in Longjing tea
LDA, PCA, [157] ANOVA, ANN
[135]
Identification of coumarin-enriched green tea
PCA, CA [137]
Discrimination of the green tea brands
PCA, ANN [137]
Other applications; E-NOSE
Olive oil Discrimination of quality classes based on the qualitative and quantitative information
SOM, [137] SIMCA, PLS
[158]
PCA [159] Cabernet red wine
Monitoring of changes in wine aroma after bottle opening
PCA, SOM [160]
Oranges, apples and peaches
Post-harvest quality evaluation PCA, PLS, ANN
[161] [162]
Food process monitoring; E-TONGUE
Bacterial cultures used in the cheese production
Monitoring of the fermentation process
PLS [49]
Do
wnl
oad
ed f
rom
mo
stw
ied
zy.p
l
Chapter 7. Electronic Noses and Electronic Tongues
175
Application Sample Object of investigation Method of
data analysis
Ref.
Red wines
Monitoring of wine aging PCA, SIMCA
[163]
Evaluating the influence of micro-oxygenation and oak chip maceration on wine composition.
PCA, PLS, ANOVA
[50] [164]
Beer
Variability monitoring of the brewing process
PCA, PLS
[51]
Monitoring of changes during the aging process in beer
PCA, LDA, RBF, PNN, BP-NN
[51]
Monitoring of the fermentation process
PLS [69]
Evaluation of food quality and freshness; E-TONGUE
Fillets of farmed gilthead seabream Sparus aurata
Discrimination of storage time. Predicting the parameters of spoilage
PCA, ANN, PLS MLR
[165]
Tench (Tinca tinca)
Discrimination of storage time PCA [166]
Apricots Discrimination based on post-harvest storage time and apricot varieties
CDA, PLS [166]
Non-alcoholic beverages
Quality evaluation of high-fructose corn syrup
SIMCA [51]
Rice Quality evaluation of milling PCA [167]
Milk Monitoring the freshness of milk stored at room temperature
PCA, ANN, CA, PLSR, LS-SVM
[58] [168]
Stability testing of food; E-TONGUE
Extra virgin olive oil
Evaluation of different storage conditions
LDA [54]
Authentication;E-TONGUE
Honey
Discrimination based on botanical origin
PCA, PLS, ANN, LDA
[52] [169]
Discrimination based on botanical and geographical origin
PCA, CA, CCA, ANN
[170] [171]
Milk Discrimination of milk samples pasteurized in different ways
PCA
[171]
Alcoholic beverages
Fast quality evaluation of alcoholic drinks and identification of brands
PLS, LDA, PCA
[172]
Determination of ethanol content in alcohols from different sources
PCA, SIMCA, PLS, PCR
[173]
Discrimination between the cheap and expensive whiskies
PCA [174]
Other applications; E-TONGUE
Extra virgin olive oil
Discrimination of samples based on phenolic compounds content
PCA, PLS, PLS–DA
[175]
Black tea Determination of theaflavin level PCA, ANN [138]
Ground meat Prediction of the level of chlorides, nitrates and nitrites
PLS [138]
Do
wnl
oad
ed f
rom
mo
stw
ied
zy.p
l

Designing Nanosensors for Chemical and Biological Applications
176
7.7.2. Environmental Monitoring
Electronic senses, namely electronic nose and electronic tongue, can be successfully used for monitoring environmental pollution. There is a need to develop devices capable of evaluating the state of the environment rapidly or even in real time, without supervision and at a relatively low cost. Electronic noses and tongues show promise in this regard and find application in monitoring the quality of water and of atmospheric air [176, 177]. The analysis of atmospheric air can be performed in several ways. One can, for example, measure the concentration of several pre-defined substances or analyse the air holistically. Both these tasks can be performed using sensor systems. One of the first investigations in this area was performed in the first half of 1990’ [178]. In it, a device equipped with CP sensors was used to analyse an aqueous solution of ethanol, diacetyl and dimethyl sulphide. Electronic nose was also used to measure the concentration of nitric oxide, methane and carbon monoxide at 500-2000 ppm concentrations [179]. It is important to note, that when using e-noses to determine particular substances there can occur interferences caused by the presence of other chemical compounds. A research has shown, that when determining hydrogen sulphide and nitrogen dioxide in a mixture containing carbon dioxide and water vapour the presence of humidity and CO2 had a significant impact on the sensor’s response signal, but it was possible to properly identify the components of the gaseous mixture using discriminant factor analysis [180]. It is possible to use the electronic nose to determine certain VOCs at a very low concentration level (ppb level) [181, 182], even below the threshold limit value (TLV). That was the case with benzene, methanol, ethanol, toluene and acetone determined below TLV using a device equipped with MOS sensors [183]. Sensor drift poses a significant problem, leading to high measurement uncertainties. In most recent applications electronic noses are being mounted on mobile robots [184], but because of insufficiently advanced models of gas distribution this technology is yet to find real-life applications. Another important application of electronic noses is odour classification and odour intensity evaluation. Currently, the golden standard in determination of odour nuisance is dynamic olfactometry [185]. Using this technique it is not possible to determine the nature of the odorant. Moreover, it is not sufficiently sensitive and cannot be used to constantly monitor odour nuisance [177]. A solution can be to use sensor systems. In one of the first investigations in this area two electronic noses: Odourmapper and Aromascan PLC were used for odour quantification [186]. When investigating odour intensity, the results
Do
wnl
oad
ed f
rom
mo
stw
ied
zy.p
l
Chapter 7. Electronic Noses and Electronic Tongues
177
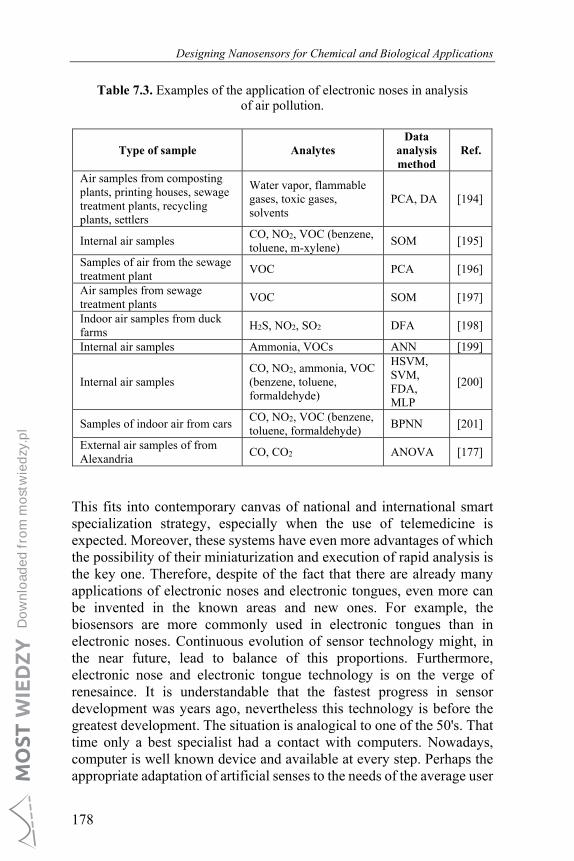
obtained using e-noses are similar in nature to those obtained using dynamic olfactometry. In one study that compared the two techniques when applied to poultry livestock nuisance monitoring has shown, in the range from 250 to 4500 oue/m3 a linear correlation with R factor of 0.89 [187]. Classification of odorous air is also an important issue. Often an unpleasant odour, even at low intensity, is less acceptable than a pleasant one at high intensity. In 2007 the use of electronic noses for classification of odours in the vicinity of a composting plant was evaluated [188]. The accuracy index of classification was 72 %. Electronic olfaction can also be used for evaluation of water quality, e.g. to determine the biological oxygen demand (BOD) [189, 190]. Electronic noses were also used to determine pesticides [191], sulphides and nitrates [192] or to detect the presence in water of microorganisms responsible for emission of odours [193]. Other applications of e-noses in environmental protection include the control of processes taking place during composting or sewage treatment and monitoring of the operation of devices used for purifying water and gasses from undesirable substances, including odours [177]. The examples of electronic nose applications in environmental monitoring are presented in Table 7.3.
Due to their limitations electronic tongues are not used as often as electronic noses in environment monitoring. The main area of their application in this area is detection of water pollution, both potable and processed at sewage treatment plants. Electronic tongues can be used e.g. to monitor semi-volatile compounds like herbicides [176] or determinate of the contents of inorganic anions and transition-metal cations in model ground, mine and sea water.
7.8. Summary
Over last 30 years the evolution of sensor technologies gives a great opportunity to apply a newest technical solutions into the systems where sensor arrays are utilized. Electronic noses and electronic tongues in the assumptions are devices dedicated to measure aroma and taste in a way parallel to the human biological senses. This gives a great opportunity to apply them where human being is not able to make proper measurements with required repeatability, objectivity and sensitivity, and in the places where toxic conditions may exists. Due to the fact that these devices are electronic ones, it gives a huge potential for applications in which on-line or data transmission systems is considered.
Do
wnl
oad
ed f
rom
mo
stw
ied
zy.p
l
Designing Nanosensors for Chemical and Biological Applications
178
Table 7.3. Examples of the application of electronic noses in analysis of air pollution.
Type of sample Analytes Data
analysis method
Ref.
Air samples from composting plants, printing houses, sewage treatment plants, recycling plants, settlers
Water vapor, flammable gases, toxic gases, solvents
PCA, DA [194]
Internal air samples CO, NO2, VOC (benzene, toluene, m-xylene)
SOM [195]
Samples of air from the sewage treatment plant
VOC PCA [196]
Air samples from sewage treatment plants
VOC SOM [197]
Indoor air samples from duck farms
H2S, NO2, SO2 DFA [198]
Internal air samples Ammonia, VOCs ANN [199]
Internal air samples CO, NO2, ammonia, VOC (benzene, toluene, formaldehyde)
HSVM, SVM, FDA, MLP
[200]
Samples of indoor air from cars CO, NO2, VOC (benzene, toluene, formaldehyde)
BPNN [201]
External air samples of from Alexandria
CO, CO2 ANOVA [177]
This fits into contemporary canvas of national and international smart specialization strategy, especially when the use of telemedicine is expected. Moreover, these systems have even more advantages of which the possibility of their miniaturization and execution of rapid analysis is the key one. Therefore, despite of the fact that there are already many applications of electronic noses and electronic tongues, even more can be invented in the known areas and new ones. For example, the biosensors are more commonly used in electronic tongues than in electronic noses. Continuous evolution of sensor technology might, in the near future, lead to balance of this proportions. Furthermore, electronic nose and electronic tongue technology is on the verge of renesaince. It is understandable that the fastest progress in sensor development was years ago, nevertheless this technology is before the greatest development. The situation is analogical to one of the 50's. That time only a best specialist had a contact with computers. Nowadays, computer is well known device and available at every step. Perhaps the appropriate adaptation of artificial senses to the needs of the average user
Do
wnl
oad
ed f
rom
mo
stw
ied
zy.p
l
Chapter 7. Electronic Noses and Electronic Tongues
179
(not R & D person) will launch a new chapter in the field of electronic nose and electronic tongue technology.
Acknowledgements
This work was financially supported by the Grant No. PBSII/B9/24/2013 obtained from the National Centre for Research and Development of Poland and Grant no. 2015/19/B/ST4/02722 received from the National Science Center of Poland.
References
[1]. J. W. Gardner, P. N. Bartlett, A brief history of electronic noses, Sens. Actuators B, Vol. 18, Issue 19, 1994, pp. 221–220.
[2]. P. Mielle, ‘Electronic noses’: Towards the objective instrumental characterization of food aroma, Trends Food Sci. Technol., Vol. 7, Issue 12, 1996, pp. 432–438.
[3]. M. P. Martı́, O. Busto, J. Guasch, R. Boqué, Electronic noses in the quality control of alcoholic beverages, TrAC Trends Anal. Chem., Vol. 24, Issue 1, 2005, pp. 57–66.
[4]. V. P. Shiers, Electronic nose technology-evaluations and developments for the food industry, in Food Ingredients Europe: Conference Proceeding, 1995, pp. 198–200.
[5]. A. D. Wilson, M. Baietto, Applications and Advances in Electronic Nose Technologies, Sensors, Vol. 9, Issue 7, 2009, pp. 5099–5148.
[6]. T. C. Pearce, Computational parallels between the biological olfactory pathway and its analogue ‘the electronic nose’: Part II. Sensor-based machine olfaction., BioSystems, Vol. 41, Issue 2, 1997, pp. 69.
[7]. E. Schaller, J. O. Bosset, F. Escher, ‘Electronic Noses’ and Their Application to Food, LWT - Food Sci. Technol., Vol. 31, Issue 4, 1998, pp. 305–316.
[8]. G. Sujatha, N. Dhivya, K. Ayyadurai, D. Thyagarajan, Advances In Electronic -Nose Technologies, Int. J. Eng. Res. Appl., Vol. 2, 2012, pp. 76–84.
[9]. A. Trinchi, An instrument for measuring and classifying odors, J. Appl. Physiol., Vol. 16, 1961, p. 742.
[10]. K. Persaud, G. Dodd, Analysis of discrimination mechanisms in the mammalian olfactory system using a model nose, Nature, Vol. 299, Issue 5881, 1982, pp. 352–355.
[11]. B. Dittmann, S. Nitz, G. Horner, A new chemical sensor on a mass spectrometric basis, Adv. Food Sci., Vol. 20, 1998, p. 115.
Do
wnl
oad
ed f
rom
mo
stw
ied
zy.p
l
Designing Nanosensors for Chemical and Biological Applications
180
[12]. D. James, S. M. Scott, Z. Ali, W. T. O’Hare, Chemical sensors for electronic nose systems, Microchim. Acta, Vol. 149, Issue 1–2, 2005, pp. 1–17.
[13]. T. Toko, T. Murata, T. Matsuno, Y. Kikkawa, K. Yamafuji, Taste Map of Beer by a Multichannel Taste Sensor, Sensors Mater., Vol. 4, 1992, pp. 145–145.
[14]. R. M. Kumar, V. R. Bhethanabotla, Sensors for Chemical and Biological Applications, CRC Press, 2010.
[15]. F. Korel, M. Ö. Balaban, Electronic Nose Technology in Food Analysis, in Handbook of Food Analysis Instruments, S. Ötleş (Ed.), CRC Press, Boca Raton, FL, 2009, pp. 365–378.
[16]. H. T. Nagle, S. S. Schiffman, R. Gutierrez-Osuna, The How and Why of Electronic Noses, IEEE Spectr., Vol. 35, Issue 9, 1998, p. 22.
[17]. K. Arshak, E. Moore, G. M. Lyons, J. Harris, S. Clifford, A review of gas sensors employed in electronic nose applications, Sens. Rev., Vol. 24, Issue 2, 2004, pp. 181–197.
[18]. A. K. Deisingh, D. C. Stone, M. Thompson, Applications of electronic noses and tongues in food analysis, Int. J. Food Sci. Technol., Vol. 39, Issue 6, 2004, pp. 587–604.
[19]. Y. Vlasov, A. Legin, Non-selective chemical sensors in analytical chemistry: from ‘electronic nose’ to ‘electronic tongue,’ Fresenius J. Anal. Chem., Vol. 361, 1998, pp. 255–260.
[20]. M. Otto, J. D. R. Thomas, Model studies on multiple channel analysis of free magnesium, calcium, sodium, and potassium at physiological concentration levels with ion-selective electrodes, Anal. Chem., Vol. 57, 1985, pp. 2647–2651.
[21]. T. Toko, T. Murata, T. Matsuno, Y. Kikkawa, Y. K., Taste map of beer by a multichannel taste sensor, Sens. Mater., Vol. 4, 1992, pp. 145–151.
[22]. K. Hayashi, Electric characteristics of lipid-modified monolayer membranes for taste sensors, Sens. Actuators B, Vol. 23, 1995, pp. 55–61.
[23]. A. Legin, A. Rudnitskaya, Y. Vlasov, C. Di Natale, F. Davide, A. D'Amico, Tasting of beverages using an electronic tongue, Sens. Actuators B, Vol. 44, 1997, pp. 291-296.
[24]. K. Mauldin, C. E. Puntambekar, Solution-Processable α,ω-Distyryl Oligothiophene Semiconductors with Enhanced Environmental Stability, Chem. Mater., Vol. 21, 2009, pp. 1927–1938.
[25]. A. Trinchi, Investigation of sol–gel prepared Ga–Zn oxide thin films for oxygen gas sensing, Sens. Actuators B, Vol. 108, 2003, pp. 263–270.
[26]. R. Moncrieff, W. An instrument for measuring and classifying odors, J. Appl. Physiol., Vol. 16, 1961, pp. 742–749.
[27]. T. M. Dymerski, T. M. Chmiel, W. Wardencki, Invited review article: an odor-sensing system-powerful technique for foodstuff studies., Rev. Sci. Instrum., Vol. 82, Issue 111101, 2011, pp. 1–32.
Do
wnl
oad
ed f
rom
mo
stw
ied
zy.p
l
Chapter 7. Electronic Noses and Electronic Tongues
181
[28]. M. García, M. Aleixandre, J. Gutiérrez, M. C. Horrillo, Electronic nose for ham discrimination, Sens. Actuators B, Vol. 114, Issue 1, 2006, pp. 418–422.
[29]. I. Y. Zayas, C. R. Martin, J. L. Steele, A. Katsevich, Wheat classification using image analysis and crush-force parameters, Trans. ASAE, Vol. 39, 1996, pp. 2199–2204.
[30]. K. Persaud, G. Dodd, Analysis of discrimination mechanisms in the mammalian olfactory system using a model nose, Nature, Vol. 299, 1982, pp. 352-363.
[31]. F. Winquist, I. Lundström, P. Wide, The combination of an electronic tongue and an electronic nose, Sens. Actuators B, Vol. 58, Issue 1–3, 1999, pp. 512-521.
[32]. L. L. Leake, Electronic Noses and Tongues, Food Technol., Vol. 6, 2006, pp. 96-101.
[33]. M. L. Homer, Novel materials and applications of electronic noses and tongues, MRS Bull., Vol. 29, Issue 10, 2004, p. 697.
[34]. P. Ciosek, Z. Brzózka, W. Wróblewski, Electronic tongue for flow-through analysis of beverages, Sens. Actuators B, Vol. 118, Issue 1–2, 2006, pp. 454-459.
[35]. E. A. Baldwin, J. Bai, A. Plotto, S. Dea, Electronic Noses and Tongues: Applications for the Food and Pharmaceutical Industries, Sensors, Vol. 11, Issue 5, 2011, pp. 4744-4750.
[36]. S. Magdalena, P. Wiśniewska, T. Dymerski, J. Namieśnik, W. Wardencki, Food Analysis Using Artificial Senses ́, J. Agric. Food Chem., Vol. 62, Issue 7, 2014, pp. 1423–1448.
[37]. J. E. Haugen, K. Rudi, S. Langsrud, S. Bredholt, Application of gas-sensor array technology for detection and monitoring of growth of spoilage bacteria in milk: A model study, Anal. Chim. Acta, Vol. 565, Issue 1, 2006, pp. 10–18.
[38]. J. R. Stetter, W. R. Penrose, The Electrochemical Nose, Electrochemistry Encyclopedia, 2001.
[39]. A. Wilson, M. Baietto, Applications and advances in electronic-nose technologies, Sensors, Vol. 9, Issue 7, 2009, pp. 5099–5148.
[40]. M. Peris, L. Escuder-Gilabert, A 21st century technique for food control: electronic noses., Anal. Chim. Acta, Vol. 638, Issue 1, 2009, pp. 1–15.
[41]. A. K. Deisingh, D. C. Stone, M. Thompson, Applications of electronic noses and tongues in food analysis, Int. J. Food Sci. Technol., Vol. 39, Issue 6, 2004, pp. 587-594.
[42]. A. K. Deisingh, Application of Electronic Noses and Tongues, in Sensors for Chemical and Biological Applications, M. K. Ram and V. R. Bhethanabotla (Eds.), Taylor & Francis Group, Boca Raton, FL, 2010, pp. 173–194.
[43]. J. Kośmider, B. Mazur-Chrzanowska, B. Wyszyński, Odory, PWN, Warsaw, 2005.
Do
wnl
oad
ed f
rom
mo
stw
ied
zy.p
l
Designing Nanosensors for Chemical and Biological Applications
182
[44]. T. C. Pearce, S. S. Schiffman, H. T. Nagle, J. W. Gardner, Handbook of Machine Olfaction: Electronic Nose Technology, Wiley-VCH Verlag GmbH, 2003.
[45]. Y. S. Kim, Fabrication of carbon black–polymer composite sensors using a position-selective and thickness-controlled electrospray method, Sens. Actuators B, Vol. 147, Issue 1, 2010, pp. 137–144.
[46]. P. Rapiejko, The sense of smell, Alergoprofil, Vol. 2, 2006, pp. 4–10. [47]. M. Huotari, V. Lantto, Measurements of odours based on response
analysis of insect olfactory receptor neurons, Sens. Actuators B, Vol. 127, 2007, pp. 284–287.
[48]. W.-X. Du, C.-M. Lin, T. Huang, J. Kim, M. Marshall, C.-I. Wei, Potential Application of the Electronic Nose for Quality Assessment of Salmon Fillets Under Various Storage Conditions, J. Food Sci., Vol. 67, 2002, pp. 307–313.
[49]. K. Esbensen, Fermentation monitoring using multisensor systems: feasibility study of the electronic tongue, Anal. Bioanal. Chem., Vol. 378, 2004, pp. 391–395.
[50]. A. Rudnitskaya, L. M. Schmidtke, I. Delgadillo, A. Legin, G. Scollaryd, Study of the influence of micro-oxygenation and oak chip maceration on wine composition using an electronic tongue and chemical analysis, Anal. Chim. Acta, Vol. 642, 2009, pp. 235–245.
[51]. T. Tan, V. Schmitt, S. Isz, Electronic tongue: A new dimension in sensory analysis, Food Technol., Vol. 55, 2001, pp. 44–50.
[52]. L. A. Dias, A. M. Peres, M. Vilas-Boas, M. A. Rocha, L. Estevinho, A. A. S. C. Machado, An electronic tongue for honey classification, Microchim. Acta, Vol. 163, 2008, pp. 97–102.
[53]. J. R. Stetter, M. W. Findlay, K. M. J. Schroeder, C. Yue, W. R. Penrose, Quality classification of grain using a sensor array and pattern recognition, Anal. Chim. Acta, Vol. 284, 1993, pp. 1–11.
[54]. M. S. Cosio, D. Ballabio, S. Benedetti, C. Gigliotti, Evaluation of different storage conditions of extra virgin olive oils with an innovative recognition tool built by means of electronic nose and electronic tongue, Food Chem., Vol. 101, Issue 2, 2007, pp. 485–491.
[55]. L. Pigani, Amperometric sensors based on poly(3,4-ethylenedioxy-thiophene)-modified electrodes: Discrimination of white wines, Anal. Chim. Acta, Vol. 614, 2008, pp. 213–222.
[56]. V. Martina, Development of an electronic tongue based on a PEDOT-modified voltammetric sensor, Anal. Bional. Chem., Vol. 387, 2007, pp. 2011–2110.
[57]. V. Parra, A. A. Arrieta, M. Fernández-Escudero, J.A. Iniguez, J. A. de Saja, M. L. Rodríguez-Méndez, Characterization of wines through the biogenic amine contents using chromatographic techniques and chemometric data analysis, Anal. Chim. Acta, Vol. 563, 2006, pp. 229–237.
Do
wnl
oad
ed f
rom
mo
stw
ied
zy.p
l
Chapter 7. Electronic Noses and Electronic Tongues
183
[58]. F. Winquist, C. Krantz-Rulcker, P. Wide, I. Lundström, Monitoring of freshness of milk by an electronic tongue on the basis of voltammetry, Meas. Sci. Technol., Vol. 9, 1998, pp. 1937–1946.
[59]. V. Parra, A. A. Arrieta, M. L. Fernández-Escudero, J.A. Rodríguez-Méndez, J. A. De Saja, Electronic tongue based on chemically modified electrodes and voltammetry for the detection of adulterations in wines, Sens. Actuators B, Vol. 118, 2006, pp. 448–453.
[60]. Z. Wei, J. Wang, L. Ye, Classification and prediction of rice wines with different marked ages by using a voltammetric electronic tongue, Biosens. Bioelectron., Vol. 26, 2011, pp. 4767–4773.
[61]. M. Scampicchio, D. Ballabio, A. Arecchi, S. M. Cosio, S. Mannino, Amperometric electronic tongue for food analysis, Microchim. Acta, Vol. 163, 2008, pp. 11–21.
[62]. L. Escuder-Gilabert, M. Peris, Review: highlights in recent applications of electronic tongues in food analysis, Anal. Chim. Acta, Vol. 665, 2010, pp. 15–25.
[63]. A. Riul, R. R. de Sousa, H. C. Malmegrim, A. dos Santos, D. S. Carvalho, F. J. Fonseca, O. N. Oliveira, L. H. C. Mattoso, Wine classification by taste sensors made from ultra-thin films and using neural networks, Sens. Actuators B, Vol. 98, 2004, pp. 77–82.
[64]. C. Caliendo, E. Verona, A. D’Amico, Surface Acoustic Wave (SAW) Gas Sensors, in Gas Sensors, Springer Netherlands, Dordrecht, 1992, pp. 281–306.
[65]. S. Saevels, J. Lammertyn, A. Z. Berna, E. A. Veraverbeke, C. Di Natale, B. M. Nicolaï, Electronic nose as a non-destructive tool to evaluate the optimal harvest date of apples, Postharvest Biol. Technol., Vol. 98, 2003, pp. 77–82.
[66]. F. Sinesio, Use of electronic nose and trained sensory panel in the evaluation of tomato quality, J. Sci. Food Agric., Vol. 80, 2000, pp. 63–71.
[67]. Keith J. Albert, Cross-Reactive Chemical Sensor Arrays, Chem. Rev., 100, 7, 2000, pp. 2595–2626.
[68]. A. Berna, Metal oxide sensors for electronic noses and their application to food analysis, Sensors Vol. 10, 2010, pp. 3882–3910.
[69]. M. Kutyła-Olesiuk, A. Zaborowski, P. Prokaryn, P. Ciosek, Monitoring of beer fermentation based on hybrid electronic tongue, Bioelectrochemistry, Vol. 87, 2012, pp. 104–113.
[70]. M. A. Ryan, A. V. Shevade, H. Zhou, M. L. Homer, Polymer–Carbon Black Composite Sensors in an Electronic Nose for Air-Quality Monitoring, MRS Bull., Vol. 29, Issue 10, 2004, pp. 714–719.
[71]. S. S. Ghasemi-Varnamkhasti, M. Rodríguez-Méndez, M.L. Mohtasebi, C. Apetrei, J. Lozano, H. Ahmadi, S. H. Razavi, J. A. de Saja, Monitoring the aging of beers using a bioelectronic tongue, Food Control, Vol. 25, 2012, pp. 216–224.
[72]. Q. Dong, L. Du, L. Zhuang, R. Li, Q. Liu, P. Wang, A novel bioelectronic nose based on brain-machine interface using implanted electrode
Do
wnl
oad
ed f
rom
mo
stw
ied
zy.p
l
Designing Nanosensors for Chemical and Biological Applications
184
recording in vivo in olfactory bulb., Biosens. Bioelectron., Vol. 49, 2013, pp. 263–269.
[73]. T. C. Pearce, S. S. Schiffman, H. T. Nagle, J. W. Gardner, Handbook of Machine Olfaction: Electronic Nose Technology, Wiley-VCH, 2003.
[74]. A. Ortega, S. Marco, T. Šundic, J. Samitier, New pattern recognition systems designed for electronic noses, Sensors Actuators B Chem., Vol. 69, Issue 3, 2000, pp. 302–307.
[75]. H. T. Nagle, R. Gutierrez-Osuna, S. S. Schiffman, The how and why of electronic noses, IEEE Spectr., Vol. 35, Issue 9, 1998, pp. 22–31.
[76]. F. Röck, N. Barsan, U. Weimar, Electronic Nose: Current Status and Future Trends, Vol. 4, Issue 3, 2007, pp. 34-43.
[77]. S. Scott, D. James, Z. Ali, Data analysis for electronic nose systems, Microchim. Acta, Vol. 2, Issue 1, 2006, pp. 112-119
[78]. W. Wardencki, T. Chmiel, T. Dymerski, Gas chromatography-olfactometry (GC-O), electronic noses (e-noses) and electronic tongues (e-tongues) for in vivo food flavour measurement, Instrumental Assessment of Food Sensory Quality, 2013, pp. 195-229.
[79]. P. E. Keller, Electronic noses and their applications, in Proceedings of the IEEE Technical Applications Conference and Workshops (Northcon/95), 1995, pp. 116.
[80]. S. Benedetti, N. Sinelli, S. Buratti, M. Riva, Shelf life of Crescenza Cheese as Measured by Electronic Nose, J. Dairy Sci., Vol. 88, Issue 9, 2005, pp. 3044–3051.
[81]. A. Bermak, S. B. Belhouari, M. Shi, D. Martinez, Pattern Recognition Techniques for Odor Discrimination in Gas Sensor Array, Encyclopedia of Sensors, 2005, pp. 1–17.
[82]. Z. Hai J. Wang, Detection of adulteration in camellia seed oil and sesame oil using an electronic nose, Eur. J. Lipid Sci. Technol., Vol. 108, Issue 2, 2006, pp. 116–124.
[83]. J. E. Dayhoff J. M. DeLeo, Artificial neural networks, Cancer, Vol. 91, Issue S8, 2001, pp. 1615–1635.
[84]. M. Śliwińska, P. Wiśniewska, T. Dymerski, J. Namieśnik, W. Wardencki, Food Analysis Using Artificial Senses, J. Agric. Food Chem., Vol. 62, Issue 7, 2014, pp. 1423–1448.
[85]. J. Y. Huang, X. P. Guo, Y. B. Qiu, Z. Y. Chen, Cluster and discriminant analysis of electrochemical noise data, Electrochim. Acta, Vol. 53, Issue 2, 2007, pp. 680–687.
[86]. Z. Haddi, Electronic nose and tongue combination for improved classification of Moroccan virgin olive oil profiles, Food Res. Int., Vol. 54, 2013, pp. 1488–1498.
[87]. D. Melucci, Rapid direct analysis to discriminate geographic origin of extra virgin olive oils by flash gas chromatography electronic nose and chemometrics, Food Chem., Vol. 204, 2016, pp. 263–273.
[88]. T. Praczyk, Using a probabilistic neural network and the nearest neighbour method to identify ship radiostations, Logistyka, Vol. 3, 2011, pp. 2235–2242.
Do
wnl
oad
ed f
rom
mo
stw
ied
zy.p
l
Chapter 7. Electronic Noses and Electronic Tongues
185
[89]. M. Bougrini, Detection of Adulteration in Argan Oil by Using an Electronic Nose and a Voltammetric Electronic Tongue, J. Sensors, Vol. 2014, pp. 1–10.
[90]. A. Loutfi, S. Coradeschi, G. K. Mani, P. Shankar, J. B. Rayappan, Electronic noses for food quality: A review, J. Food Eng., Vol. 144, 2015, pp. 103-111.
[91]. I. Stanimirova, B. Daszykowski, B. Walczak, Supervised methods with calibration and classification, in Chemometry in analitics, IES, Kraków, 2008.
[92]. Y. González Martín, Electronic nose based on metal oxide semiconductor sensors and pattern recognition techniques: characterisation of vegetable oils, Anal. Chim. Acta, Vol. 449, 2001, pp. 69–80.
[93]. J. Koronacki, J. Ćwik, Liniowe metody klasyfikacji, in Statystyczne systemy uczące się, 2nd ed., Exit, Warsaw, 2008, pp. 4–12.
[94]. M. Casale, C. Casolino, P. Oliveri, M. Forina, The potential of coupling information using three analytical techniques for identifying the geographical origin of Liguria extra virgin olive oil, Food Chem., Vol. 118, 2010, pp. 163–170.
[95]. B. E. Boser, I. M. Guyon, V. N. Vapnik, A training algorithm for optimal margin classifiers, in Proceedings of the 5th Annual Workshop on Computational Learning Theory (COLT ’92), 1992, pp. 144–152.
[96]. N. Cristianini and B. Scholkopf, Support Vector Machines and Kernel Methods: The New Generation of Learning Machines, AI Mag., Vol. 23, Issue 3, 2002, pp. 31.
[97]. N. El Barbri, E. Llobet, N. El Bari, X. Correig, B. Bouchikhi, Application of a portable electronic nose system to assess the freshness of Moroccan sardines, Mater. Sci. Eng., Vol. 28, Issue 5–6, 2008, pp. 666–670.
[98]. J. Goszczyński, Klasyfikacja tekstur za pomocą SVM - Maszyny Wektorów Wspierających, Inżynieria Rol., 2006, pp. 119–126.
[99]. G. Gamst, L. S. Meyers, A. J. Guarino, Analysis of variance designs: A conceptual and computational approach with SPSS and SAS, Cambridge University Press, 2008.
[100]. L. Marilley, S. Ampuero, T. Zesiger, M. G. Casey, Screening of aroma-producing lactic acid bacteria with an electronic nose, Int. Dairy J., Vol. 14, 2004, pp. 849.
[101]. F. Winquist, E. G. Hörnsten, H. Sundgren, I. Lundström, Performance of an electronic nose for quality estimation of ground meat, Meat Sci. Technol., Vol. 4, 1993, pp. 1493.
[102]. A. Jonsson, F. Winquist, J. Schnürer, H. Sundgren, I. Lundström, Electronic nose for microbial quality classification of grains, Int. J. Food Microbiol., Vol. 35, Issue 2, 1997, pp. 187.
[103]. A. Spetz, F. Winquist, H. Sundgren, I. Lundström, Field effect gas sensors, in Gas Sensors, G. Sberveglieri (Ed.), Kluwer Academic Publishers, Dordrecht, 1992, pp. 219–280.
Do
wnl
oad
ed f
rom
mo
stw
ied
zy.p
l
Designing Nanosensors for Chemical and Biological Applications
186
[104]. N. Magan, A. Pavlou, I. Chrysanthakis, Milk-sense: a volatile sensing system recognises spoilage bacteria and yeasts in milk, Sens. Actuators B, Vol. 72, Issue 1, 2001, pp. 28.
[105]. S. Capone, M. Epifani, F. Quaranta, P. Siciliano, A. Taurino, L. Vasanelli, Monitoring of rancidity of milk by means of an electronic nose and a dynamic PCA analysis, Sens. Actuators B, Vol. 78, Issue 1–3, 2001, pp. 174–179.
[106]. P. Wiśniewska, T. Dymerski, W. Wardencki, J. Namieśnik, Chemical composition analysis and authentication of whisky, Journal of the Science of Food and Agriculture, Vol. 95, Issue 11, 2015, pp. 2159–2166.
[107]. T. Dymerski, J. Gebicki, W. Wardencki, J. Namieśnik, Application of an electronic nose instrument to fast classification of Polish honey types, Sensors, Vol. 14, Issue 6, 2014, pp. 10709–10724.
[108]. W. Wardencki, T. Chmiel, T. Dymerski, P. Biernacka, Instrumental techniques used for assessment of food quality, in Procedings of the ECOpole, Vol. 3, Issue 2, 2009, pp. 273–279.
[109]. A. C. M. Oliveira, M. O. Balaban, Comparison of a colorimeter with a machine vision system in measuring color of Gulf of Mexico sturgeon fillets, Appl. Eng. Agr., Vol. 22, 2006, pp. 583–587.
[110]. I. Camposa, Accurate Concentration Determination of Anions Nitrate, Nitrite Chloride in Minced Meat Using A Voltammetric Electronic Tongue, Sens. Actuators B, Vol. 149, 2010, pp. 71–78.
[111]. M. García, M. Aleixandre, M. C. Horrillo, Electronic nose for the identification of spoiled Iberian hams, in Procedings of the Spanish Conf. Electron Devices, Tarragona, 2005, pp. 537–540.
[112]. N. El Barbri, An electronic nose system based on a micro-machined gas sensor array to assess the freshness of sardines, Sens. Actuators B, Vol. 141, Issue 2, 2009, pp. 538.
[113]. N. El Barbria, E. Llobetb, N. El Baric, X. Correigb, B. Bouchikhi, Application of a portable electronic nose system to assess the freshness of Moroccan sardines, Mater. Sci. Eng., Vol. 28, 2008, pp. 666–670.
[114]. G. Olafsdottir, Prediction of microbial and sensory quality of cold smoked Atlantic salmon (Solmo salar) by electronic nose, J. Food Sci., Vol. 70, Issue 9, 2005, pp. 563–574.
[115]. J. Laothawornkitkul, Discrimination of plant volatile signatures by an electronic nose: a potential technology for plant pest disease monitoring, Env. Sci Technol., Vol. 42, 2008, pp. 8433–8439.
[116]. C. Di Natale, G. Olafsdottir, S. Einarsson, E. Martinelli, R. Paolesse, A. D’Amico, Comparison and integration of different electronic noses for freshness evaluation of cold-fish fillets, Sens. Actuators B, Vol. 77, 2001, pp. 572–578.
[117]. F. Korel, D. A. Luzuriaga, M. Ö. Balaban, Objective quality assessment of raw Tilapia (Oreochromis niloticus) fillets using electronic nose and machine vision, J. Food Sci., Vol. 66, 2001, pp. 1018–1024.
Do
wnl
oad
ed f
rom
mo
stw
ied
zy.p
l

Chapter 7. Electronic Noses and Electronic Tongues
187
[118]. X. Hu, P. K. Mallikarjunan, D. Vaughan, Development of non-destructive methods to evaluate oyster quality by electronic nose technology, Sens. Instrumen. Food Qual., Vol. 2, Issue 1, 2008, pp. 51.
[119]. A. Legin, A. Rudnitskaya, B. Seleznev, G. Sparfel, C. Doré, Electronic tongue distinguishes onions and shallots, in Procedings of the ISHS Acta Hortic. 634 XXVI Int. Hortic. Congr. IV Int. Symp. Taxon. Cultiv. Plants., Toronto, 2004.
[120]. K. Beullens, P. Mészáros, S. Vermeir, D. Kirsanov, A. Legin, S. Buysens, N. Cap, B. M. Nicolaï, J. Lammertyn, Analysis of tomato taste using two types of electronic tongues, Sens. Actuators B, Vol. 131, 2008, pp. 10–17.
[121]. A. Rudnitskaya, Analysis of apples varieties – comparison of electronic tongue with different analytical techniques, Sens. Actuators B, Vol. 116, 2006, pp. 23–28.
[122]. P. Pani, A. A. Leva, M. Riva, A. Maestrelli, D. Torreggiani, Influence of an osmotic pre-treatment on structure-property relationships of air-dehydrated tomato slices, J. Food Eng., Vol. 86, Issue 1, 2008, p. 105.
[123]. M. Santonico, A. Bellincontro, D. De Santis, C. Di Natale, F. Mencarelli, Electronic nose to study postharvest dehydration of wine grapes, Food Chem., Vol. 121, 2010, pp. 789–796.
[124]. C. Oliveros, R. Boggia, M. Casale, C. Armanino, M. Forina, Optimisation of a new headspace mass spectrometry instrument, J. Chromatogr. A, Vol. 1076, 2005, pp. 7–15.
[125]. G. Pioggia, M. Ferro, F. Di Francesco, Towards a Real-Time Transduction and Classification of Chemoresistive Sensor Array Signals, IEEE Sens. J., Vol. 7, Issue 2, 2007, pp. 237-243.
[126]. R. Aparicio, R. Aparicio-Ruíz, Authentication of vegetable oils by chromatographic techniques, J. Chromatogr. A, Vol. 881, Issue 1–2, 2000, pp. 93–104.
[127]. X. Zheng, Y. Lan, J. Zhu, J. Westbrook, W. C. Hoffmann, R. E. Lacey, Rapid Identification of Rice Samples Using an Electronic Nose, J. Bionic Eng., Vol. 6, 2009, pp. 290–297.
[128]. T. Borjesson, Detection of off-odours in grains using an electronic nose, in Proceedings of the Olfaction Electron. Nose: 3rd Int. Symp., Toulouse, 1996.
[129]. T. Börjesson, T. Eklöv, A. Jonsson, H. Sundgren, J. Schnürer, Electronic Nose for Odor Classification of Grains, Cereal Chem., Vol. 73, 1996, pp. 457–461.
[130]. S. Panigrahi, M. K. Misra, S. Willson, Evaluations of fractal geometry and invariant moments for shape classification of corn germplasm, Comput. Electron. Agric., Vol. 20, Issue 1, 1998, pp. 1–20.
[131]. J. W. Gardner, H. V. Shurmer, T. T. Tan, Application of an electronic nose to the discrimination of coffees, Sens. Actuators B, Vol. 6, Issue 1–3, 1992, pp. 71.
Do
wnl
oad
ed f
rom
mo
stw
ied
zy.p
l
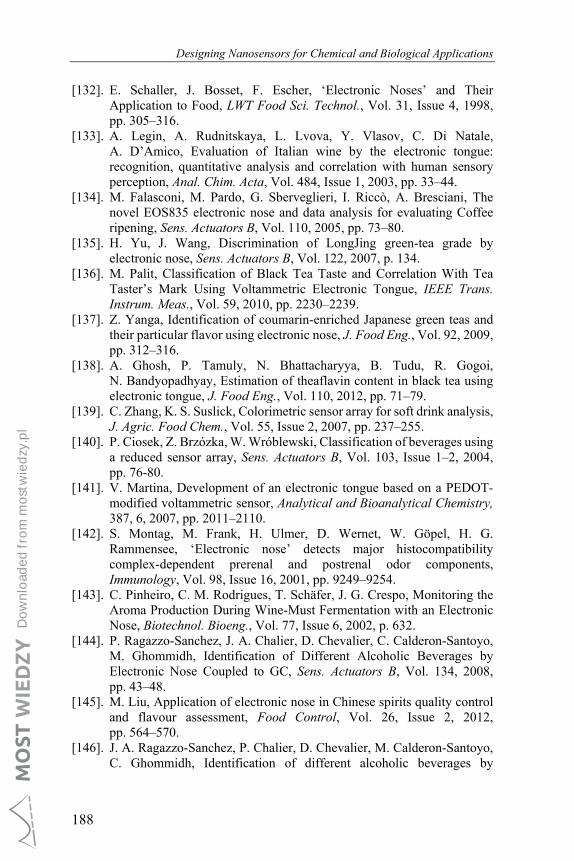
Designing Nanosensors for Chemical and Biological Applications
188
[132]. E. Schaller, J. Bosset, F. Escher, ‘Electronic Noses’ and Their Application to Food, LWT Food Sci. Technol., Vol. 31, Issue 4, 1998, pp. 305–316.
[133]. A. Legin, A. Rudnitskaya, L. Lvova, Y. Vlasov, C. Di Natale, A. D’Amico, Evaluation of Italian wine by the electronic tongue: recognition, quantitative analysis and correlation with human sensory perception, Anal. Chim. Acta, Vol. 484, Issue 1, 2003, pp. 33–44.
[134]. M. Falasconi, M. Pardo, G. Sberveglieri, I. Riccò, A. Bresciani, The novel EOS835 electronic nose and data analysis for evaluating Coffee ripening, Sens. Actuators B, Vol. 110, 2005, pp. 73–80.
[135]. H. Yu, J. Wang, Discrimination of LongJing green-tea grade by electronic nose, Sens. Actuators B, Vol. 122, 2007, p. 134.
[136]. M. Palit, Classification of Black Tea Taste and Correlation With Tea Taster’s Mark Using Voltammetric Electronic Tongue, IEEE Trans. Instrum. Meas., Vol. 59, 2010, pp. 2230–2239.
[137]. Z. Yanga, Identification of coumarin-enriched Japanese green teas and their particular flavor using electronic nose, J. Food Eng., Vol. 92, 2009, pp. 312–316.
[138]. A. Ghosh, P. Tamuly, N. Bhattacharyya, B. Tudu, R. Gogoi, N. Bandyopadhyay, Estimation of theaflavin content in black tea using electronic tongue, J. Food Eng., Vol. 110, 2012, pp. 71–79.
[139]. C. Zhang, K. S. Suslick, Colorimetric sensor array for soft drink analysis, J. Agric. Food Chem., Vol. 55, Issue 2, 2007, pp. 237–255.
[140]. P. Ciosek, Z. Brzózka, W. Wróblewski, Classification of beverages using a reduced sensor array, Sens. Actuators B, Vol. 103, Issue 1–2, 2004, pp. 76-80.
[141]. V. Martina, Development of an electronic tongue based on a PEDOT-modified voltammetric sensor, Analytical and Bioanalytical Chemistry, 387, 6, 2007, pp. 2011–2110.
[142]. S. Montag, M. Frank, H. Ulmer, D. Wernet, W. Göpel, H. G. Rammensee, ‘Electronic nose’ detects major histocompatibility complex-dependent prerenal and postrenal odor components, Immunology, Vol. 98, Issue 16, 2001, pp. 9249–9254.
[143]. C. Pinheiro, C. M. Rodrigues, T. Schäfer, J. G. Crespo, Monitoring the Aroma Production During Wine-Must Fermentation with an Electronic Nose, Biotechnol. Bioeng., Vol. 77, Issue 6, 2002, p. 632.
[144]. P. Ragazzo-Sanchez, J. A. Chalier, D. Chevalier, C. Calderon-Santoyo, M. Ghommidh, Identification of Different Alcoholic Beverages by Electronic Nose Coupled to GC, Sens. Actuators B, Vol. 134, 2008, pp. 43–48.
[145]. M. Liu, Application of electronic nose in Chinese spirits quality control and flavour assessment, Food Control, Vol. 26, Issue 2, 2012, pp. 564–570.
[146]. J. A. Ragazzo-Sanchez, P. Chalier, D. Chevalier, M. Calderon-Santoyo, C. Ghommidh, Identification of different alcoholic beverages by
Do
wnl
oad
ed f
rom
mo
stw
ied
zy.p
l
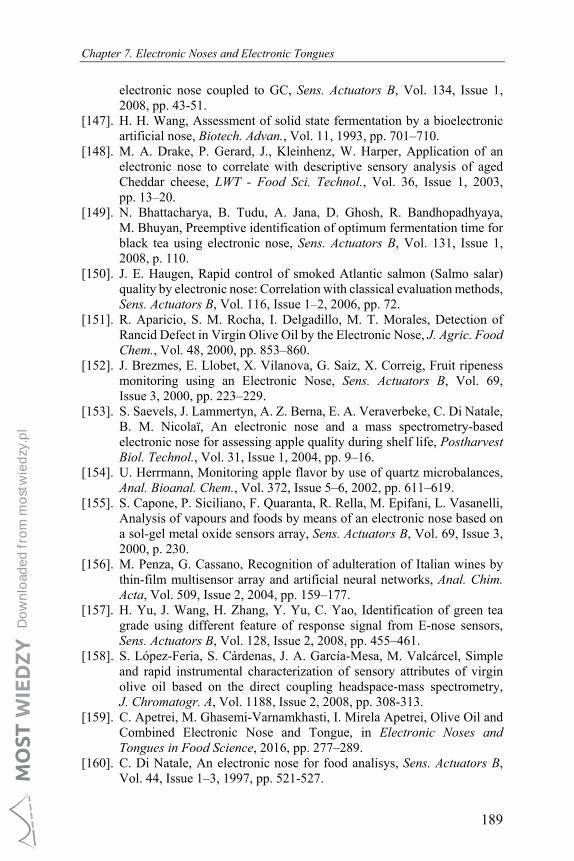
Chapter 7. Electronic Noses and Electronic Tongues
189
electronic nose coupled to GC, Sens. Actuators B, Vol. 134, Issue 1, 2008, pp. 43-51.
[147]. H. H. Wang, Assessment of solid state fermentation by a bioelectronic artificial nose, Biotech. Advan., Vol. 11, 1993, pp. 701–710.
[148]. M. A. Drake, P. Gerard, J., Kleinhenz, W. Harper, Application of an electronic nose to correlate with descriptive sensory analysis of aged Cheddar cheese, LWT - Food Sci. Technol., Vol. 36, Issue 1, 2003, pp. 13–20.
[149]. N. Bhattacharya, B. Tudu, A. Jana, D. Ghosh, R. Bandhopadhyaya, M. Bhuyan, Preemptive identification of optimum fermentation time for black tea using electronic nose, Sens. Actuators B, Vol. 131, Issue 1, 2008, p. 110.
[150]. J. E. Haugen, Rapid control of smoked Atlantic salmon (Salmo salar) quality by electronic nose: Correlation with classical evaluation methods, Sens. Actuators B, Vol. 116, Issue 1–2, 2006, pp. 72.
[151]. R. Aparicio, S. M. Rocha, I. Delgadillo, M. T. Morales, Detection of Rancid Defect in Virgin Olive Oil by the Electronic Nose, J. Agric. Food Chem., Vol. 48, 2000, pp. 853–860.
[152]. J. Brezmes, E. Llobet, X. Vilanova, G. Saiz, X. Correig, Fruit ripeness monitoring using an Electronic Nose, Sens. Actuators B, Vol. 69, Issue 3, 2000, pp. 223–229.
[153]. S. Saevels, J. Lammertyn, A. Z. Berna, E. A. Veraverbeke, C. Di Natale, B. M. Nicolaï, An electronic nose and a mass spectrometry-based electronic nose for assessing apple quality during shelf life, Postharvest Biol. Technol., Vol. 31, Issue 1, 2004, pp. 9–16.
[154]. U. Herrmann, Monitoring apple flavor by use of quartz microbalances, Anal. Bioanal. Chem., Vol. 372, Issue 5–6, 2002, pp. 611–619.
[155]. S. Capone, P. Siciliano, F. Quaranta, R. Rella, M. Epifani, L. Vasanelli, Analysis of vapours and foods by means of an electronic nose based on a sol-gel metal oxide sensors array, Sens. Actuators B, Vol. 69, Issue 3, 2000, p. 230.
[156]. M. Penza, G. Cassano, Recognition of adulteration of Italian wines by thin-film multisensor array and artificial neural networks, Anal. Chim. Acta, Vol. 509, Issue 2, 2004, pp. 159–177.
[157]. H. Yu, J. Wang, H. Zhang, Y. Yu, C. Yao, Identification of green tea grade using different feature of response signal from E-nose sensors, Sens. Actuators B, Vol. 128, Issue 2, 2008, pp. 455–461.
[158]. S. López-Feria, S. Cárdenas, J. A. García-Mesa, M. Valcárcel, Simple and rapid instrumental characterization of sensory attributes of virgin olive oil based on the direct coupling headspace-mass spectrometry, J. Chromatogr. A, Vol. 1188, Issue 2, 2008, pp. 308-313.
[159]. C. Apetrei, M. Ghasemi-Varnamkhasti, I. Mirela Apetrei, Olive Oil and Combined Electronic Nose and Tongue, in Electronic Noses and Tongues in Food Science, 2016, pp. 277–289.
[160]. C. Di Natale, An electronic nose for food analisys, Sens. Actuators B, Vol. 44, Issue 1–3, 1997, pp. 521-527.
Do
wnl
oad
ed f
rom
mo
stw
ied
zy.p
l

Designing Nanosensors for Chemical and Biological Applications
190
[161]. C. Di Natale, A. Macagnano, E. Martinelli, R. Paolesse, E. Proietti, A. D’Amico, The evaluation of quality of post-harvest oranges and apples by means of an electronic nose, Sens. Actuators B, Vol. 78, Issue 1–3, 2001, pp. 26–32.
[162]. C. Di Natale, Electronic nose based investigation of the sensorial properties of peaches and nectarines, Sens. Actuators B, Vol. 77, Issue 1–2, 2001, p. 561–570.
[163]. N. García-Villar, S. Hernández-Cassou, J. Saurina, Characterization of wines through the biogenic amine contents using chromatographic techniques and chemometric data analysis, J. Agric. Food Chem., Vol. 55, Issue 18, 2007, pp. 7453–7461.
[164]. M. J. Cejudo-Bastante, I. Hermosín-Gutiérrez, M. S. Pérez-Coello, Micro-oxygenation and oak chip treatments of red wines: Effects on colour-related phenolics, volatile composition and sensory characteristics. Part II: Merlot wines, Food Chem., Vol. 124, Issue 3, 2011, pp. 738–748.
[165]. L. Gil, J. M. Barat, I. Escriche, E. Garcia-Breijo, R. Martínez-Máñez, and J. Soto, An electronic tongue for fish freshness analysis using a thick-film array of electrodes, Microchim. Acta, Vol. 163, Issue 1–2, 2008, pp. 121–129.
[166]. M. L. Rodríguez-Méndez, M. Gay, C. Apetrei, J. A. de Saja, Biogenic amines and fish freshness assessment using a multisensor system based on voltammetric electrodes. Comparison between CPE and screen-printed electrodes, Electrochim. Acta, Vol. 54, 2009, pp. 7033–7041.
[167]. T. U. Tran, K. Suzuki, H. Okadome, S. Homma, K. Ohtsubo, Analysis of the tastes of brown rice and milled rice with different milling yields using a taste sensing system, Food Chem., Vol. 88, 2004, pp. 557–566.
[168]. Z. Wei, J. Wang, X. Zhang, Monitoring of quality and storage time of unsealed pasteurized milk by voltammetric electronic tongue, Electrochim. Acta, Vol. 88, 2013, pp. 231–239.
[169]. I. Escriche, M. Kadar, E. Domenech, L. Gil-Sánchez, A potentiometric electronic tongue for the discrimination of honey according to the botanical origin. Comparison with traditional methodologies: Physicochemical parameters and volatile profile, J. Food Eng., Vol. 109, 2012, pp. 449–456.
[170]. Z. Wei, J. Wang, W. Liao, Technique potential for classification of honey by electronic tongue, J. Food Eng., Vol. 94, Issue 3–4, 2009, pp. 260–266.
[171]. N. Major, K. Marković, M. Krpan, G. Sarić, M. Hruškar, N. Vahčić, Rapid honey characterization and botanical classification by an electronic tongue, Talanta, Vol. 85, Issue 1, 2011, pp. 569–574.
[172]. A. Legin, A. Rudnitskaya, B. Seleznev, Y. Vlasov, Electronic tongue for quality assessment of ethanol, vodka and eau-de-vie, Anal. Chim. Acta, Vol. 534, Issue 1, 2005, pp. 129–135.
Do
wnl
oad
ed f
rom
mo
stw
ied
zy.p
l
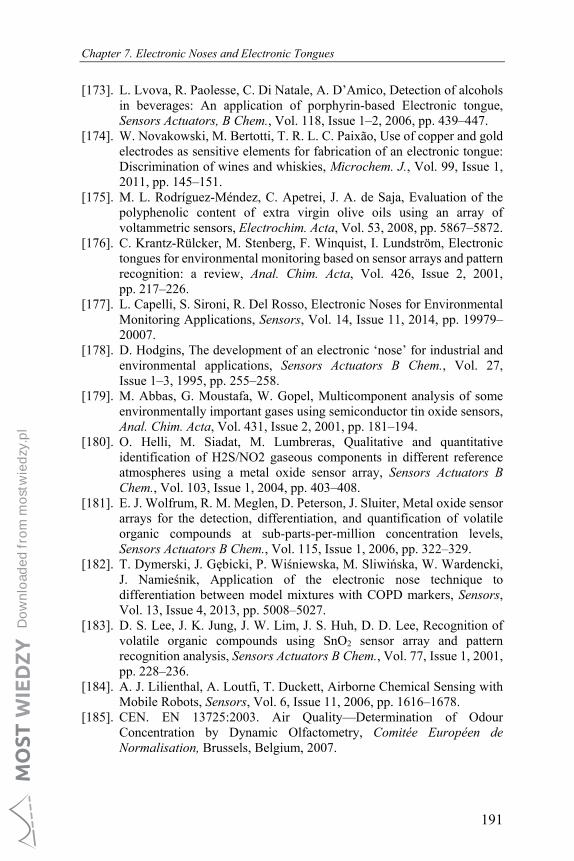
Chapter 7. Electronic Noses and Electronic Tongues
191
[173]. L. Lvova, R. Paolesse, C. Di Natale, A. D’Amico, Detection of alcohols in beverages: An application of porphyrin-based Electronic tongue, Sensors Actuators, B Chem., Vol. 118, Issue 1–2, 2006, pp. 439–447.
[174]. W. Novakowski, M. Bertotti, T. R. L. C. Paixão, Use of copper and gold electrodes as sensitive elements for fabrication of an electronic tongue: Discrimination of wines and whiskies, Microchem. J., Vol. 99, Issue 1, 2011, pp. 145–151.
[175]. M. L. Rodríguez-Méndez, C. Apetrei, J. A. de Saja, Evaluation of the polyphenolic content of extra virgin olive oils using an array of voltammetric sensors, Electrochim. Acta, Vol. 53, 2008, pp. 5867–5872.
[176]. C. Krantz-Rülcker, M. Stenberg, F. Winquist, I. Lundström, Electronic tongues for environmental monitoring based on sensor arrays and pattern recognition: a review, Anal. Chim. Acta, Vol. 426, Issue 2, 2001, pp. 217–226.
[177]. L. Capelli, S. Sironi, R. Del Rosso, Electronic Noses for Environmental Monitoring Applications, Sensors, Vol. 14, Issue 11, 2014, pp. 19979–20007.
[178]. D. Hodgins, The development of an electronic ‘nose’ for industrial and environmental applications, Sensors Actuators B Chem., Vol. 27, Issue 1–3, 1995, pp. 255–258.
[179]. M. Abbas, G. Moustafa, W. Gopel, Multicomponent analysis of some environmentally important gases using semiconductor tin oxide sensors, Anal. Chim. Acta, Vol. 431, Issue 2, 2001, pp. 181–194.
[180]. O. Helli, M. Siadat, M. Lumbreras, Qualitative and quantitative identification of H2S/NO2 gaseous components in different reference atmospheres using a metal oxide sensor array, Sensors Actuators B Chem., Vol. 103, Issue 1, 2004, pp. 403–408.
[181]. E. J. Wolfrum, R. M. Meglen, D. Peterson, J. Sluiter, Metal oxide sensor arrays for the detection, differentiation, and quantification of volatile organic compounds at sub-parts-per-million concentration levels, Sensors Actuators B Chem., Vol. 115, Issue 1, 2006, pp. 322–329.
[182]. T. Dymerski, J. Gębicki, P. Wiśniewska, M. Sliwińska, W. Wardencki, J. Namieśnik, Application of the electronic nose technique to differentiation between model mixtures with COPD markers, Sensors, Vol. 13, Issue 4, 2013, pp. 5008–5027.
[183]. D. S. Lee, J. K. Jung, J. W. Lim, J. S. Huh, D. D. Lee, Recognition of volatile organic compounds using SnO2 sensor array and pattern recognition analysis, Sensors Actuators B Chem., Vol. 77, Issue 1, 2001, pp. 228–236.
[184]. A. J. Lilienthal, A. Loutfi, T. Duckett, Airborne Chemical Sensing with Mobile Robots, Sensors, Vol. 6, Issue 11, 2006, pp. 1616–1678.
[185]. CEN. EN 13725:2003. Air Quality—Determination of Odour Concentration by Dynamic Olfactometry, Comitée Européen de Normalisation, Brussels, Belgium, 2007.
Do
wnl
oad
ed f
rom
mo
stw
ied
zy.p
l
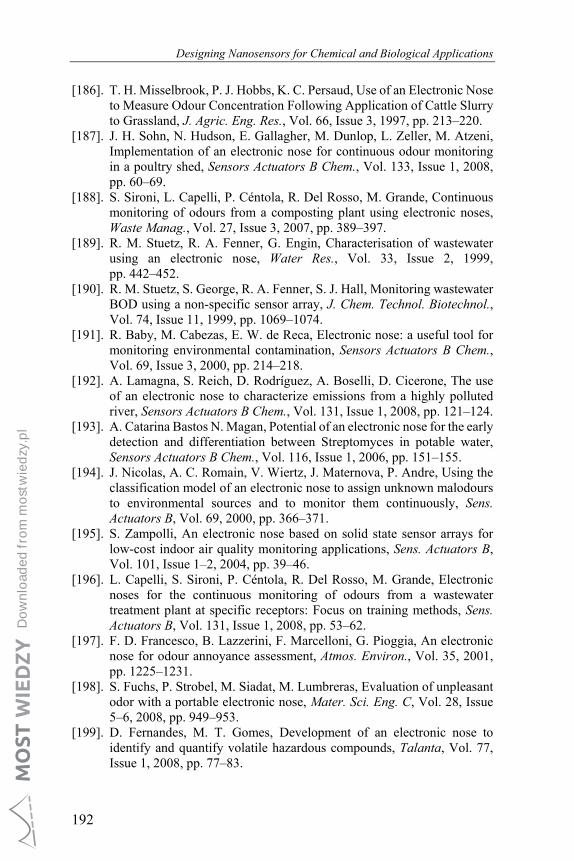
Designing Nanosensors for Chemical and Biological Applications
192
[186]. T. H. Misselbrook, P. J. Hobbs, K. C. Persaud, Use of an Electronic Nose to Measure Odour Concentration Following Application of Cattle Slurry to Grassland, J. Agric. Eng. Res., Vol. 66, Issue 3, 1997, pp. 213–220.
[187]. J. H. Sohn, N. Hudson, E. Gallagher, M. Dunlop, L. Zeller, M. Atzeni, Implementation of an electronic nose for continuous odour monitoring in a poultry shed, Sensors Actuators B Chem., Vol. 133, Issue 1, 2008, pp. 60–69.
[188]. S. Sironi, L. Capelli, P. Céntola, R. Del Rosso, M. Grande, Continuous monitoring of odours from a composting plant using electronic noses, Waste Manag., Vol. 27, Issue 3, 2007, pp. 389–397.
[189]. R. M. Stuetz, R. A. Fenner, G. Engin, Characterisation of wastewater using an electronic nose, Water Res., Vol. 33, Issue 2, 1999, pp. 442–452.
[190]. R. M. Stuetz, S. George, R. A. Fenner, S. J. Hall, Monitoring wastewater BOD using a non-specific sensor array, J. Chem. Technol. Biotechnol., Vol. 74, Issue 11, 1999, pp. 1069–1074.
[191]. R. Baby, M. Cabezas, E. W. de Reca, Electronic nose: a useful tool for monitoring environmental contamination, Sensors Actuators B Chem., Vol. 69, Issue 3, 2000, pp. 214–218.
[192]. A. Lamagna, S. Reich, D. Rodríguez, A. Boselli, D. Cicerone, The use of an electronic nose to characterize emissions from a highly polluted river, Sensors Actuators B Chem., Vol. 131, Issue 1, 2008, pp. 121–124.
[193]. A. Catarina Bastos N. Magan, Potential of an electronic nose for the early detection and differentiation between Streptomyces in potable water, Sensors Actuators B Chem., Vol. 116, Issue 1, 2006, pp. 151–155.
[194]. J. Nicolas, A. C. Romain, V. Wiertz, J. Maternova, P. Andre, Using the classification model of an electronic nose to assign unknown malodours to environmental sources and to monitor them continuously, Sens. Actuators B, Vol. 69, 2000, pp. 366–371.
[195]. S. Zampolli, An electronic nose based on solid state sensor arrays for low-cost indoor air quality monitoring applications, Sens. Actuators B, Vol. 101, Issue 1–2, 2004, pp. 39–46.
[196]. L. Capelli, S. Sironi, P. Céntola, R. Del Rosso, M. Grande, Electronic noses for the continuous monitoring of odours from a wastewater treatment plant at specific receptors: Focus on training methods, Sens. Actuators B, Vol. 131, Issue 1, 2008, pp. 53–62.
[197]. F. D. Francesco, B. Lazzerini, F. Marcelloni, G. Pioggia, An electronic nose for odour annoyance assessment, Atmos. Environ., Vol. 35, 2001, pp. 1225–1231.
[198]. S. Fuchs, P. Strobel, M. Siadat, M. Lumbreras, Evaluation of unpleasant odor with a portable electronic nose, Mater. Sci. Eng. C, Vol. 28, Issue 5–6, 2008, pp. 949–953.
[199]. D. Fernandes, M. T. Gomes, Development of an electronic nose to identify and quantify volatile hazardous compounds, Talanta, Vol. 77, Issue 1, 2008, pp. 77–83.
Do
wnl
oad
ed f
rom
mo
stw
ied
zy.p
l
Chapter 7. Electronic Noses and Electronic Tongues
193
[200]. L. Zhang, Chaos based neural network optimization for concentration estimation of indoor air contaminants by an electronic nose, Sens. Actuators B, Vol. 189, 2013, pp. 161–167.
[201]. L. Zhang, On-line sensor calibration transfer among electronic nose instruments for monitoring volatile organic chemicals in indoor air quality, Sensors Actuators, B Chem., Vol. 160, Issue 1, 2011, pp. 899–909.
Do
wnl
oad
ed f
rom
mo
stw
ied
zy.p
l