advances on the automatic estimation of the p-wave … · advances on the automatic estimation of...
TRANSCRIPT

ANNALS OF GEOPHYSICS, 59, 4, 2016, S0434; doi:10.4401/ag-7087
S0434
Advances on the automatic estimation of the P-wave onset time
Luz García1,*, Isaac Álvarez1, Carmen Benítez1, Manuel Titos1, Ángel Bueno1, Sonia Mota1,Ángel de la Torre1, José C. Segura1, Gerardo Alguacil2, Alejandro Díaz-Moreno2,Janire Prudencio2,4, Araceli García-Yeguas2,5, Jesús M. Ibáñez2,3, Luciano Zuccarello3,Ornella Cocina3, Domenico Patanè3
1 Universidad de Granada, Departamento de Teoría de la Señal Telemática y Comunicaciones, Granada, Spain2 Instituto Andaluz de Geofísica, Universidad de Granada, Granada, Spain3 Istituto Nazionale di Geofisica e Vulcanologia, Sezione di Catania, Osservatorio Etneo, Catania, Italy4 University of California, Department of Earth and Planetary Sciences, Berkeley, USA5 Universidad de Cádiz, Departamento de Física Aplicada, Cádiz, Spain
ABSTRACT
This work describes the automatic picking of the P-phase arrivals of the3*106 seismic registers originated during the TOMO-ETNA experiment.Air-gun shots produced by the vessel “Sarmiento de Gamboa” and con-temporary passive seismicity occurring in the island are recorded by adense network of stations deployed for the experiment. In such scenario,automatic processing is needed given: (i) the enormous amount of data,(ii) the low signal-to-noise ratio of many of the available registers and,(iii) the accuracy needed for the velocity tomography resulting from the ex-periment. A preliminary processing is performed with the records ob-tained from all stations. Raw data formats from the different types ofstations are unified, eliminating defective records and reducing noisethrough filtering in the band of interest for the phase picking. The ad-vanced multiband picking algorithm (AMPA) is then used to process thebig database obtained and determine the travel times of the seismicphases. The approach of AMPA, based on frequency multiband denoisingand enhancement of expected arrivals through optimum detectors, is de-tailed together with its calibration and quality assessment procedure. Ex-amples of its usage for active and passive seismic events are presented.
1. IntroductionThe picking of the seismic wave arrival can be de-
fined as the detection of the instant of time when thefirst energy of the phase (the longitudinal P-phase) ar-rives at a seismometer. Such arrival is often identifiedby a change from the background noise, in energy, am-plitude, frequency contents or wave polarization. Forseismic signals containing also transversal waves (S-phases), picking the S-wave onset is more challengingbecause of its contamination by the P coda and other
converted phases. Signals will have diverse, often low,signal-to-noise ratios (SNR) due to the seismic noisegenerated in their path towards the station and the lowdensity of the materials they have to travel across. In fact,often the most relevant information about Earth struc-ture will precisely be supplied by those waves traversingattenuative internal structures with a consequent lowSNR. In volcanic environments seismic signals are oftencontaminated by both effects, noise and other type ofvolcanic events such as volcanic tremor, providing signalswith high complexity [e.g. Chouet 1996, 2003; Alguacilet al. 1999; Ibáñez et al. 2000, 2003, 2008; Martínez-Aré-valo et al. 2003; Almendros et al. 2007; Chouet and Ma-toza 2013]. Taking into account seismic attenuation,the first arrival of the signal changes to a more emer-gent onset [e.g. Bianco et al. 1999; Martínez-Arévalo etal. 2005; Prudencio et al. 2015a, 2015b, 2015c].
Automatic real-time processing of the seismicphases and noise reduction permits outperforminghuman analysis in terms of precision and consistencyof the travel time estimations. Many approaches for au-tomatic picking have been proposed in time and fre-quency domains like: the pioneer classical picker ofAllen based on STA/LTA [Allen 1978] improved by[Baer and Kradolfer 1987], approaches based on higherorder statistics like kurtosis or skewness [Saragiotis etal. 2002; Küperkoch et al. 2010; Langet et al. 2014], pick-ing based on the waveforms predominant period [Hild-yard et al. 2008], or wavelet analysis [Zhang et al. 2003]and multiband frequency analysis [Álvarez et al. 2013]
Article historyReceived February 5, 2016; accepted June 1, 2016.Subject classification:Multiband frequency analysis, Automatic P-phase picking, Active/passive seismic phases, TOMO-ETNA.

as examples in the frequency domain. Autoregressivetechniques based on the Akaike information criterion(AIC) like Takanami and Kitagawa [1988], pattern recog-nition systems like artificial neural networks (ANN)[Gentili and Michelini 2006] and polarization analysis(specially for the S-wave picking) have also been suc-cessfully implemented [Reading et al. 2001; Kurzon et al.2014; Ross et al. 2014]. Latest tendencies in automaticpicking opt for combinations of several of the refereedtechniques, selected according to specific needs and dataavailable. Iterative, tandem or parallel approaches like,e.g., Nippress et al. [2010], Küperkoch et al. [2012], Ál-varez et al. [2013] and Ross and Ben-Zion [2014], are oftenjointly applied to combine complementary strengthens.
Accurate picking of P and S phases constitutes themost important step for earthquake location, tomo-graphic studies, and any further understanding of theEarth’s crustal and upper mantle structure. In that sce-nario, the aim of the TOMO-ETNA experiment [Coltelliet al. 2016, in this volume; Ibáñez et al. 2016a, 2016b,in this volume] is to enlighten the internal structure ofMt. Etna volcano performing a seismic velocity tomog-raphy of the Island of Sicily [Díaz-Moreno et al. 2016,in this volume]. In order to do so, a large seismic data-base combining active seismicity (air-gun shots) gener-ated by the Spanish oceanographic vessel “Sarmiento de
Gamboa” and the passive seismicity (earthquakes) oc-curring at the time of the experiment in the island [Bar-beri et al. 2016, in this volume] has been registered bya dense seismic network of more than 200 stations ofdifferent types. Travel times of such active and passivephase arrivals, used as input for the tomography [Díaz-Moreno et al. 2016, in this volume], must be detectedwith the highest possible precision. An automatedhighly accurate picking of the phase arrivals is there-fore mandatory: besides the demand of capacity toprocess the massive dataset produced, signals present-ing low SNR after traversing attenuative regions are ofspecial interest.
In the present manuscript we describe the signalprocessing involved in the automatic picking of 3·106
seismic arrivals registered during the TOMO-ETNA ex-periment. First, a description of the active and passivesources and seismic stations deployed for the experi-ment will be done in Section 2. Further we will detailthe pre-processing of the waveforms registered beforeapplying them the automatic picking algorithm AMPA[Álvarez et al. 2013] described in Section 4. Finally wewill present our current working lines to improve theaccuracy of the automatic picking performed and toincrement the number of registers usable for the to-mography.
2. Seismic stations and sourcesTravel times of active and passive phases occurred
during the experiment have to be automatically pickedand combined as input for the seismic velocity tomog-raphy of the island resulting from the TOMO-ETNAexperiment [Díaz-Moreno et al. 2016, in this volume].Benefits of both types of sources are combined. Activeseismicity provides a large amount of data in a short pe-riod of time with a homogeneous and optimal distribu-tion of sources and seismic stations. Meanwhile passiveseismicity provides deeper structure information.
Active and passive seismicity occurred during theexperiment has been registered by the dense seismicnetwork plotted in Figure 1 (see Ibáñez et al. [2016a,2016b] for details). A total of 267 seismic stations wereused in this experiment. The distribution of this networkis: 90 short period portable stations (CUBE; Figure 1,yellow dots), 17 broadband stations (BB; Figure 1, orangedots), 70 permanent stations provided by the IstitutoNazionale di Geofisica e Vulcanologia (INGV; Figure 1,red dots), and finally a total to 27 ocean bottom seis-mometers (OBS; Figure 1, green dots) were deployed.
The oceanographic vessel “Sarmiento de Gamboa”generated more than 26,200 air-gun shots along approx-imately 2560 km long (Figure 1, red lines). The source ofacoustic pulses consisted of an array of two batteries of
GARCÍA ET AL.
2
Figure 1. Map of Sicily and Aeolian islands. Locations of short pe-riod seismic stations (yellow dots), INGV permanent stations (reddots), broadband stations (orange dots) and ocean bottom seis-mometers (green dots) are shown. The shooting lines of the vesselare depicted with red lines.

3
air-guns, each having 8 guns (Sercel, G-GUN II), seeColtelli et al. [2016, in this volume] and Ibáñez et al.[2016b, in this volume] for details. In Figure 2 we showsa simulation of frequency contents of the signature ofthe source signal produced by the air-guns, for calibrationpurposes, using the GUNDALF array modeling program[Gundalf 2012] particularized for the experiment config-uration taking into account all air-gun interactions. Fig-ure 3a shows a series of real air-gun shots registered by anOBS. Figure 3b depicts a shot recorded in time and fre-quency domains, being remarkable its similarity to thecalibration simulation previously shown.
The quality of the records varies according to sev-eral facts such as the distance from the vessel to the seis-mic station, the nature of the structures, and the noiselevel. Figure 4 gives an example of different qualities ofsignals in order to indicate the degrees of difficulty to
perform the picking of their onset. On its central andright panels it shows the records of a series of 100 air-gun shots generated by the vessel while following thetrajectory parallel to the shore depicted with a blue linein the left panel (from south-west to north-east). Seis-mic waves were recorded by four seismic stations areplotted. P-phase arrivals are expected to be in the time-window that range from a theoretical maximum ve-locity of 8000 m/s to a minimum value of 2000 m/s(both plotted using pink lines). The yellow line depictedplots the theoretical arrival of the water wave travel-ling at 1500 m/s. Plots show that distance to the stationis a determinant factor. For each seismometer, arrivalsare more clearly detected when the vessel gets closerto it. Comparing stations with a first visual approxima-tion, E-64 (closest to the shore) has the clearer phase ar-rivals, while stations E-93 and E-95 recorded more noisysignals with no clear first onset arrivals.
A total of 452 earthquakes, described in depth in
AUTOMATIC P-PHASE PICKING
Figure 2. Frequency contents of the active source simulated with the GUNDALF air-gun array modeling program [Gundalf 2012] under theconditions of the TOMO-ETNA experiment.
Figure 3. (a). Set of ten shots recorded by the OBS ‘SPAI03’ on June 29, 2014. (b) Waveform detail and spectrogram for the registration ofthe shot done while the vessel was located on the exact vertical of OBS ‘SPAI03’.
(a) (b)

Barberi et al. [2016, in this volume], occurred in the areaduring the experiment, from June to November 2014.They have been used in combination with the activedatabase to produce the 3-D tomography. Their localmagnitudes range from 0.3 to 3.8. The quality of theseismic phases registered varies in a wide range de-pending on the depth of the epicenter, the magnitudeof the event, the distance to the seismic station, thelocal noise present at the station and the nature of thematerials traversed by the seismic ray. Figure 6 showstwo earthquakes occurred in the island during the ex-periment, registered by a broad set of stations from theseismic network deployed. They represent extreme ex-amples of high and low quality signals registered dur-
ing the experiment. Raw registers are plotted orderedby increasing distances from the epicenter of the earth-quake to the seismic station. The origin of time is set asthe instant when the earthquake occurred, using infor-mation from the Istituto Nazionale di Geofisica e Vul-canologia (INGV), Sezione di Catania - OsservatorioEtneo. Figure 5a shows an earthquake of magnitude3.7 and focal depth of around 26 km with high signal-to-noise ratio for the first onset. On the other side, Fig-ure 5b depicts a shallow earthquake with low magnitudeproducing signals with low SNR and subsequent diffi-culties to pick their phase arrival time.
As preliminary analysis [see in this volume: Bar-beri et al. 2016; Ibáñez et al. 2016b] the P arrivals of
GARCÍA ET AL.
4
Figure 4. Example of a series of 100 air-gun shots registered in four seismic stations with different distances to the vessel.
Figure 5. (a) An example of an earthquake of magnitude 3.7 and focal depth of around 26 km. We plot a seismogram 60 seconds long recordedin 78 seismic stations and ordered by increasing epicentral distance. (b) Same for an earthquake of magnitude 0.6 and focal depth of 1.3 km.
(a) (b)

5
these 452 earthquakes were manually picked in severalstations of the INGV permanent network and located.Such catalogue with locations, magnitudes, and P traveltimes of the earthquakes, has been used for comparingmanual and automatic processing.
3. Signal pre-processing Before estimating arrival times, the huge amount
of continuous raw seismograms are automaticallyprocessed to improve their SNR and delimit time win-dows for phase picking. Firstly the four different for-mats of raw data corresponding to the four types ofstations are converted into a unique readable format onwhich automatic processing will be applied. In thisprocess, faulty registers with lack of GPS, extremelybad SNRs, abrupt offset in amplitude and other errors,are detected and discarded. Secondly, continuous reg-isters are segmented into windows of analysis aroundthe expected arrival times based on the catalogue ofshooting times for the active database, and the earth-quake catalogue for the passive data. Thirdly, band-passfiltering in the band of interest is done. All the stationsused in this experiment allow the recording of the threecomponents, east-west (X), north-south (Y) and verti-cal component (Z). Figure 6 shows the signal associatedto the three components recorded by the CUBE stationE-108 on July 10, 2014. The movement of the vessel andthe locations of the stations and Etna volcano are de-picted with a blue line, a red spot, and a black spot re-
spectively. Upper panel shows the seismogram registered40 seconds after air-gun shot number 70 (i.e., zero timecorresponds to the time when the shot took place).Lower panel presents the spectrograms associated toeach component. The P-wave onset corresponds to apacket of energy in the frequency range of 6 to 8 Hz.
According to the Fermat’s principle, the verticalcomponent is the one providing the best informationof the wave arrival. Following this criterion (that canbe observed in Figure 6), the signals registered in thevertical component (Z) have been used in this work forestimating the wave arrival associated to the air-gun
AUTOMATIC P-PHASE PICKING
Figure 6. Example of standard noise register of three components X, Y and Z before filtering. Registers from CUBE-station E-109 depictedin time and frequency domains.
Figure 7. Comparison of a series of shots before filtering (left panel)and after filtering (right panel).

shot or earthquake. Most of the signals registered inthe different stations used in the experiment have a lowSNR. They are affected by strong background noiseand/or non-stationary noise processes. For example,the three components in Figure 6 present low SNR,with a strong noisy artifact centered at about 18 Hzaround 20 seconds of time. Taking into account deband of activity of the events we want to pick, and inorder to emphasize only P-wave arrivals both for air-gun shots and earthquakes, all the Z-components havebeen filtered using a band-pass linear phase filter in theband of 4 to 12 Hz. The group delay was compensatedaccordingly. This type of filter was opportunely cho-sen, based on previous simulations on which zero-phase filters demonstrated a worse behavior in thepresence of an impulsive arrival. Left panel of Figure 7shows the recording of the vertical component in thesame site and date than Figure 6, for the first 80 shots.Right panel shows the signals after filtering. Improve-
ment in terms of SNR is visible. P-wave arrivals are dif-ficult to identify in unfiltered signals, while they be-come clearly observed in the ones filtered.
4. Advanced multiband picking algorithm (AMPA)
4.1. The algorithmThe automatic P-phase picking algorithm used to
calculate the travel times of the TOMO-ETNA data-base, named AMPA, is fully detailed in [Álvarez et al.2013]. In such work, the finest picking is obtained withAMPA working in tandem with the autoregressive tech-niques applied by Takanami and Kitagawa [1988]. Dueto the ineffective computational cost of the tandem ap-proach for the TOMO-ETNA database, plain AMPAhas been used. The picking algorithm is also available inan open-source toolkit with a user-friendly windowsenvironment described and downloadable in [Romeroet al. 2016]. AMPA, standing for adaptive multiband
GARCÍA ET AL.
6
Figure 8. (a) Block diagram of the AMPA picking algorithm. Detail of the first multiband de-noising phase. (b) Block diagram of the AMPApicking algorithm. Detail of the P-arrival enhancement phase.
(a)
(b)
7
picking algorithm, is a picking strategy focused on de-termining the P-phase arrival time for signals stronglyaffected by a low SNR or processes involving non-sta-tionary noises. In order to do so, AMPA performs twosteps with the signal to be picked:
(i) Multiband envelope detection and noise reduc-tion, eliminating contributions below band-dependentenvelope thresholds.
(ii) Enhancement of signal envelopes with dura-tions corresponding to P-phase arrivals.
Given the need of reliability for certain picking ap-plications like high-resolution tomographies, the traveltimes determined by AMPA have quality assessmentsto permit different trade-offs between high pickingrates and quality of the picking, depending on the spe-cific needs of the application.
Figure 8a pictures the path for step (i) of the AMPApicking process, denoting Sv(n) the filtered window ofsignal (see Section 3), on which a P-phase arrival is ex-pected. Sv(n) is first divided into k bands of analysisthrough band-pass filtering. For each subband, enve-lope is detected (referred as xi, i=1,..., k for each of kbands), and a threshold quantization is applied to it.Right panel of Figure 8a shows an example on whichsix subband envelopes (z1, ...,z6) are plotted after thresh-old quantization. Envelope samples with amplitudesmaller than a certain threshold are quantized to value1. The final signal of this first AMPA step, named lztot,is the addition of all the bands’ de-noised envelopes de-picted in the lowest graph of right panel in Figure 8a.
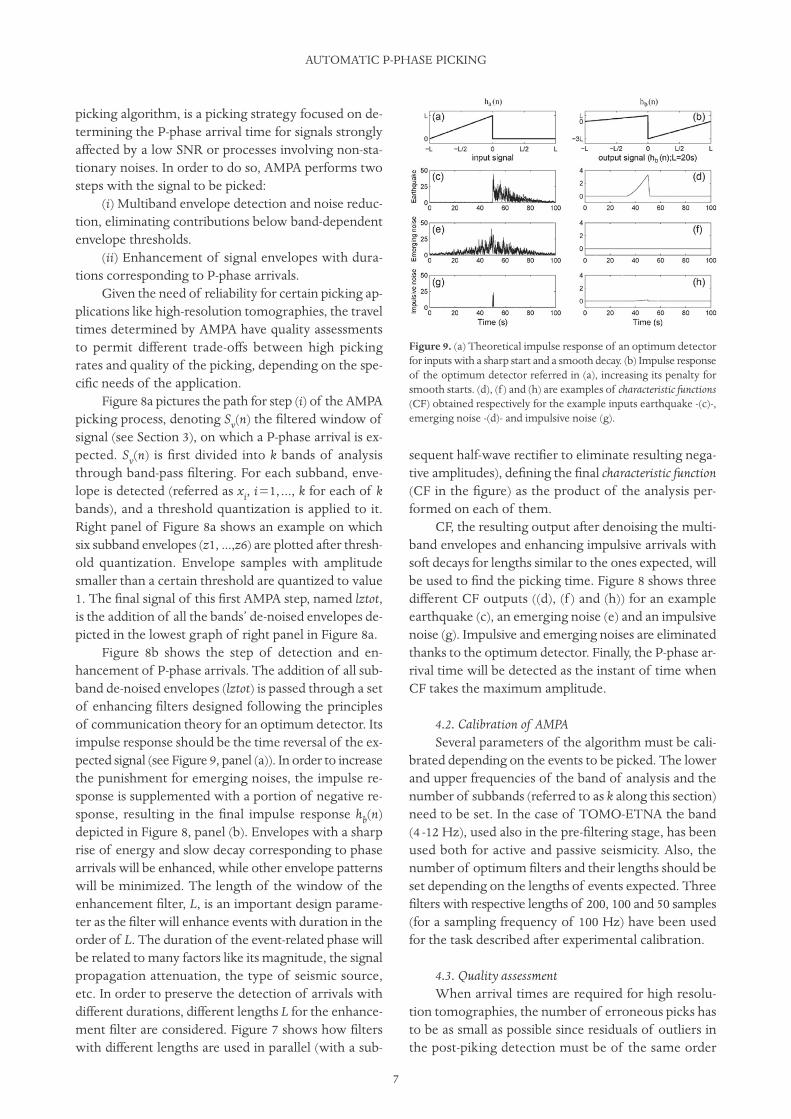
Figure 8b shows the step of detection and en-hancement of P-phase arrivals. The addition of all sub-band de-noised envelopes (lztot) is passed through a setof enhancing filters designed following the principlesof communication theory for an optimum detector. Itsimpulse response should be the time reversal of the ex-pected signal (see Figure 9, panel (a)). In order to increasethe punishment for emerging noises, the impulse re-sponse is supplemented with a portion of negative re-sponse, resulting in the final impulse response hb(n)depicted in Figure 8, panel (b). Envelopes with a sharprise of energy and slow decay corresponding to phasearrivals will be enhanced, while other envelope patternswill be minimized. The length of the window of theenhancement filter, L, is an important design parame-ter as the filter will enhance events with duration in theorder of L. The duration of the event-related phase willbe related to many factors like its magnitude, the signalpropagation attenuation, the type of seismic source,etc. In order to preserve the detection of arrivals withdifferent durations, different lengths L for the enhance-ment filter are considered. Figure 7 shows how filterswith different lengths are used in parallel (with a sub-
sequent half-wave rectifier to eliminate resulting nega-tive amplitudes), defining the final characteristic function(CF in the figure) as the product of the analysis per-formed on each of them.
CF, the resulting output after denoising the multi-band envelopes and enhancing impulsive arrivals withsoft decays for lengths similar to the ones expected, willbe used to find the picking time. Figure 8 shows threedifferent CF outputs ((d), (f ) and (h)) for an exampleearthquake (c), an emerging noise (e) and an impulsivenoise (g). Impulsive and emerging noises are eliminatedthanks to the optimum detector. Finally, the P-phase ar-rival time will be detected as the instant of time whenCF takes the maximum amplitude.
4.2. Calibration of AMPASeveral parameters of the algorithm must be cali-
brated depending on the events to be picked. The lowerand upper frequencies of the band of analysis and thenumber of subbands (referred to as k along this section)need to be set. In the case of TOMO-ETNA the band(4 -12 Hz), used also in the pre-filtering stage, has beenused both for active and passive seismicity. Also, thenumber of optimum filters and their lengths should beset depending on the lengths of events expected. Threefilters with respective lengths of 200, 100 and 50 samples(for a sampling frequency of 100 Hz) have been usedfor the task described after experimental calibration.
4.3. Quality assessmentWhen arrival times are required for high resolu-
tion tomographies, the number of erroneous picks hasto be as small as possible since residuals of outliers inthe post-piking detection must be of the same order
AUTOMATIC P-PHASE PICKING
Figure 9. (a) Theoretical impulse response of an optimum detectorfor inputs with a sharp start and a smooth decay. (b) Impulse responseof the optimum detector referred in (a), increasing its penalty forsmooth starts. (d), (f ) and (h) are examples of characteristic functions(CF) obtained respectively for the example inputs earthquake -(c)-,emerging noise -(d)- and impulsive noise (g).
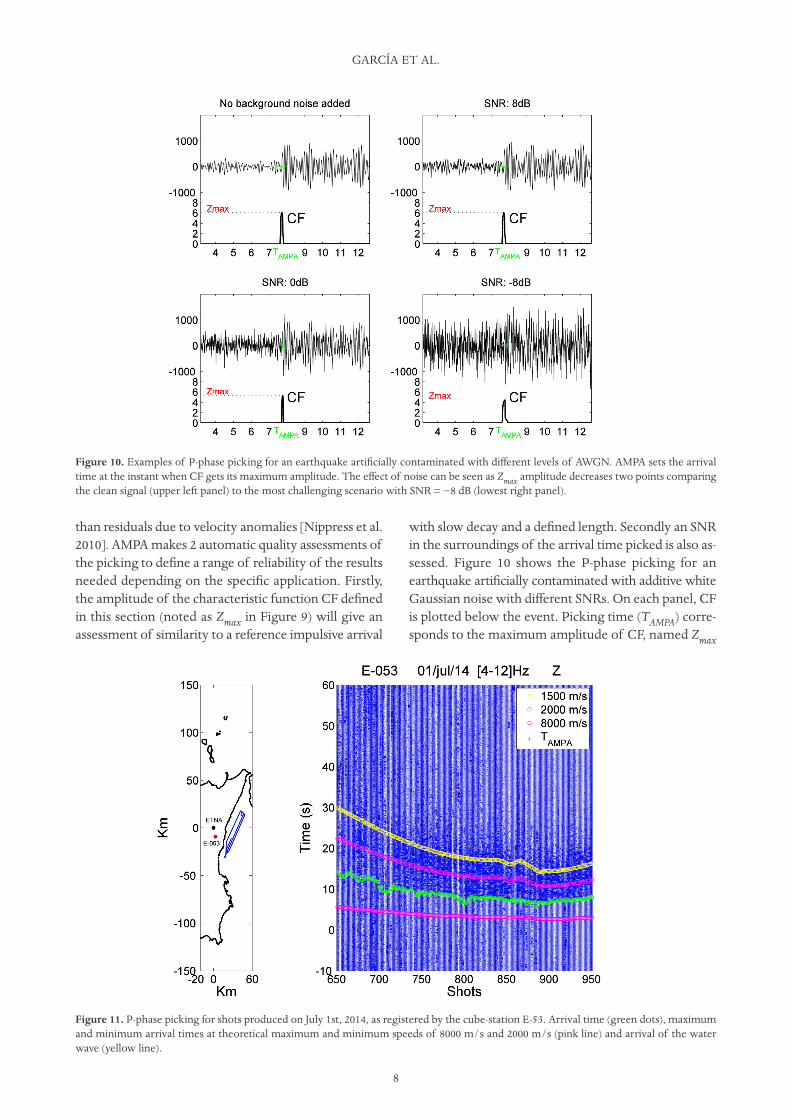
than residuals due to velocity anomalies [Nippress et al.2010]. AMPA makes 2 automatic quality assessments ofthe picking to define a range of reliability of the resultsneeded depending on the specific application. Firstly,the amplitude of the characteristic function CF definedin this section (noted as Zmax in Figure 9) will give anassessment of similarity to a reference impulsive arrival
with slow decay and a defined length. Secondly an SNRin the surroundings of the arrival time picked is also as-sessed. Figure 10 shows the P-phase picking for anearthquake artificially contaminated with additive whiteGaussian noise with different SNRs. On each panel, CFis plotted below the event. Picking time (TAMPA) corre-sponds to the maximum amplitude of CF, named Zmax
GARCÍA ET AL.
8
Figure 10. Examples of P-phase picking for an earthquake artificially contaminated with different levels of AWGN. AMPA sets the arrivaltime at the instant when CF gets its maximum amplitude. The effect of noise can be seen as Zmax amplitude decreases two points comparingthe clean signal (upper left panel) to the most challenging scenario with SNR = −8 dB (lowest right panel).
Figure 11. P-phase picking for shots produced on July 1st, 2014, as registered by the cube-station E-53. Arrival time (green dots), maximumand minimum arrival times at theoretical maximum and minimum speeds of 8000 m/s and 2000 m/s (pink line) and arrival of the waterwave (yellow line).

9
in the figure. It can be observed that parameter Zmax de-creases slightly as the SNR decreases sharply in subse-quent subfigures, perceiving a robust behavior againstnoise in all of them.
4.4. Examples of automatic pickingRight panel of Figure 11 depicts the P-phase arrival
of a series of 300 air-gun shots produced the 1st of Julyby the “Sarmiento de Gamboa”. The shots were regis-tered by the CUBE station E-53 located close to theshore ahead of Mt. Etna as indicated in the left panelof the figure. Waves registered are plotted in blue, over-lapping a green dot to indicate the arrival times auto-matically picked by AMPA as described in Section 4.1.AMPA is applied to a window-frame of the waveformdefined considering potential arrivals travelling at speedbetween 8000 m/s and 2000 m/s (see Figure 11, thepink marks representing the windows of analysis). Theyellow line depicted represents the theoretical arrivalof the water wave travelling at 1500 m/s. The consis-tency of both the picking (green line) and the vesselmovement (yellow line), when moving away and ap-proaching the shore, indicates reasonable P-phase ar-rival detections.
Figures 12 and 13 show the automatic P-phasepicking for the example earthquakes of magnitude 3.7and 0.6 depicted in Figures 5a and 5b. After processingthe registers, applying AMPA and setting the minimumthreshold of quality described above, the final subset ofthe registers and picking times usable for the tomogra-phy are plotted. For the earthquake of magnitude 3.7registered in 78 stations in Figure 5a, 65 of the totalinitial 78 registers (see Figure 12) match the pickingquality criteria and would be used as input for the to-mography. For the earthquake of magnitude 0.6 shownin Figure 5b, only 15 out of the original 67 registers
match the picking quality criteria and would be se-lected as input for the tomography. They are plot in Fig-ure 13. Figure 14 shows a detailed zoom of the pickingfor a few arrivals of both example earthquakes.
With the aim of validating the automatic pickingproposed, Figure 15 shows the difference in secondsamong the arrival times picked by AMPA (TAMPA), andby human experts from INGV (TMANUAL) for a set of3000 randomly selected earthquakes occurred during
AUTOMATIC P-PHASE PICKING
Figure 12. Automatic P-phase picking using AMPA for the earth-quake of magnitude 3.7 and depth 25.73 shown in Figure 5a. Stationsare ordered starting from the closest to the most distant to the epi-center of the earthquake.
Figure 13. Automatic P-phase picking using AMPA for the earth-quake of magnitude 0.6 and depth 1.27 km shown in Figure 5b. Sta-tions are ordered starting from the closest to the most distant to theepicenter of the earthquake.
Figure 14. Detailed zoom of the picking of a few events from Fig-ures 12 and 13.

the TOMO-ETNA experiment. The difference in pick-ing time, calculated as TAMPA− TMANUAL, is in the rangeof hundredths of seconds for most of the pickings.
Compared to other automatic procedures, AMPA[Álvarez et al. 2013, Romero et al. 2016] is an automaticP-phase picking method with a relative low computa-tional cost, no complex configuration and effective per-formance in noisy environments. In Álvarez et al. [2013]AMPA is contrasted to the classical STA/LTA, aloneand in combination with the autoregressive methodproposed by Takanami and Kitagawa [1988]. In suchwork, demanding P-phase picking tasks are performedusing a database of natural earthquakes and computer-generated ones contaminated with severe noise condi-tions with positive results. AMPA outperforms STA/LTAin all cases. When combining AMPA with Takanami’sautoregressive method both techniques are improved.They show complementary strengths that overcomethe limitations of autoregressive methods adding accu-racy to the original AMPA.
5. Ongoing workSeveral improvements are under analysis to in-
crease the accuracy of the picking and therefore augmentthe number of registers usable for the velocity tomog-raphy. Noise reduction techniques based on waveletanalysis are being considered. Also polarization analy-sis, especially to detect S-phase arrivals, is needed to takemore advantage of the rich passive seismicity of the re-gion. In addition, usage of information from neighbor
stations is needed to make a joint analysis searching forcoherent behaviors in noisy registers.
As a parallel approach, automatic recognition sys-tems for seismic events [e.g. Benítez et al. 2006, 2007;Ibáñez et al. 2009; Cortés et al. 2013, 2015] can be usedto detect air-gun shots and earthquakes in continuousseismic registers. The number of active and passiveevents detected can be increased, not to depending ex-clusively on catalogues of events made by human ex-perts. Tandem approximations combining automaticevent detection prior to automatic P-phase picking canincrease the quality of the picking and the tomographyderived from it.
Acknowledgements. This paper has been partially funded bythe following research projects: the European project MED-SUVfunded by the European Union’s Seventh Framework Program forresearch, technological development and demonstration undergrant agreement No. 308665; the Spanish COCSABO project(COC-DI-2011-08); the European project EUROFLEETS2 (SeventhFramework Programme, grant agreement No. 312762) throughtransnational access to the research vessels “Sarmiento de Gamboa”operated by CSIC (Spain) and “Aegaeo” by HCMR (Greece); theGeophysical Instrument Pool Potsdam (GIPP) from GFZ (Potsdam)with the project (Seismic TOMOgraphy of ETNA volcano and Eo-lian Islands, Italy, using active and passive seismic data). We wouldlike to thank the following supporting institutions: DipartimentoRegionale della Protezione Civile, Regione Siciliana; DipartimentoAzienda Regionale Foreste Demaniali, Ufficio Provinciale di Cata-nia; Ente Parco dell’Etna; Unidad de Tecnología Marina - CSIC inBarcelona (Spain); Stato Maggiore Marina (Italian Navy General Staff ),CINCNAV (Command in Chief of the Fleet) and Marisicilia (NavyCommand of Sicily); Coastal Guard of Messina and Riposto; to obtainsupport and navigation permissions for the oceanographic cruises:
GARCÍA ET AL.
10
Figure 15. Histogram of differences (in seconds) between automatic P-picks obtained with AMPA and manual picks obtained by experts fromthe Istituto Nazionale di Geofisica e Vulcanologia, Sezione di Catania - Osservatorio Etneo, Catania, Italy. Comparison performed for 3000registers obtained from stations of the INGV permanent network.

11
Spanish Foreign Office and Italian Foreign Office. This paper has beenpartially supported by the Spanish projects TEC2015-68752-R(MINECO/FEDER), KNOWAVES and CGL2015-67130-C2-2. Wewould like to thank all private and public owners of the sites se-lected to deploy seismic stations for their kind and unselfish disposalto use their properties. This manuscript has been largely improvedby the insightful comments of Dr. Antonio Rubio and an anonymousreviewer and by the editor José Morales.
ReferencesAlguacil, G., Almendros, J., Del Pezzo, E., García, A.,
Ibáñez, J.M., La Rocca, M., Morales, J., and Ortiz,R. (1999). Observations of volcanic earthquakes andtremor at Deception island - Antarctica, Annali diGeofisica, 42, 417-436.
Allen, R.V. (1978). Automatic earthquake recognitionand timing from single traces, B. Seismol. Soc. Am.,6, 1521-1532.
Almendros, J., Ibáñez, J.M., Carmona, E., and Zan-domeneghi, D. (2007). Array analyses of volcanicearthquakes and tremor recorded at Las Cañadascaldera (Tenerife Island, Spain), during the May2004 seismic activation of Teide volcano, J. Vol-canol. Geoth. Res., 160, 285-299.
Álvarez, I., García, L., Mota, S., Cortés, G., Benítez, C.,and De la Torre, A., (2013). An Automatic P-PhasePicking Algorithm Based on Adaptive Multiband Pro-cessing, IEEE Geosci. Remote S., 10(6), 1488-1492.
Baer, M., and Kradolfer, U. (1987). An automatic phasepicker for local and teleseismic events, B. Seismol.Soc. Am., 77(4), 1437-1445.
Barberi, G., Giampiccolo, E., Musumeci, C., Scarfì, L.,Bruno, V., Cocina, O., Díaz-Moreno, A., Sicali, S.,Tusa, G., Tuvè, T., Zuccarello, L., Ibáñez, J.M., andPatanè, D. (2016). Seismic and volcanic activity dur-ing 2014 in the region involved by TOMO-ETNAseismic active experiment, Annals of Geophysics,59(4), S0429, doi:10.4401/ag-7082.
Benítez, C., Ramírez, J., Segura, J.C., Rubio, A., Ibáñez,J.M., Almendros, J., García Yeguas, A. (2006). Con-tinuous Hmm-Based Volcano Monitoring At De-ception Island, Antarctica, IEEE International Con-ference on Acoustics Speech and Signal Processing,May. Acoustics, Speech and Signal Processing, 2006.ICASSP 2006 Proceedings. 2006 IEEE InternationalConference on Volume: 5, On page(s): V-VISSN: 1520-6149 ISBN: 1-4244-0469-X INSPEC Accession Num-ber: 9174974, doi:10.1109/ICASSP.2006.1661384.
Benítez, C., Ramírez, J., Segura, J.C., Ibáñez, J.M., Al-mendros, J., García-Yeguas, A., and Cortés, G. (2007).Continuous HMM-based seismic event classificationat Deception Island, Antarctica, IEEE T. Geosci. Re-mote, 44 (12), 40-49.
Bianco, F., Castellano, M., Del Pezzo, E., and Ibáñez,J.M. (1999). Attenuation of the short period seismic
waves at Mt. Vesuvius, Italy, Geophys. J. Int., 138,67-76.
Chouet, B.A. (1996). New methods and future trendsin seismological volcano monitoring, In: Monitor-ing and mitigation of volcano hazards, Springer,Berlin/Heidelberg, 23-97.
Chouet, B. (2003). Volcano seismology, Pure Appl. Geo-phys., 160(3-4), 739-788.
Chouet, B.A., and Matoza, R.S. (2013). A multi-decadalview of seismic methods for detecting precursorsof magma movement and eruption, J. Volcanol.Geoth. Res., 252, 108-175.
Coltelli, M., et al. (2016). The marine activities per-formed within the TOMO-ETNA experiment, Annalsof Geophysics, 59(4), S0428, doi:10.4401/ag-7081.
Cortés, G., García, L., Álvarez, I., Benítez, C., De laTorre, A., and Ibáñez, J.M. (2013). Parallel SystemArchitecture (PSA): An efficient approach for Auto-matic Recognition of Volcano-Seismic Events, J. Vol-canol. Geoth. Res., 271, 1-10, doi:10.1016/j.jvolgeo-res.2013.07.004.
Cortés, G., Benítez, M.C., García, L., Álvarez, I., andIbáñez, J.M. (2015). A Comparative Study of Di-mensionality Reduction Algorithms Applied to Vol-cano-Seismic Signals, IEEE J. Sel. Top. Appl., 9(1),253-263, doi:0.1109/JSTARS.2015.2479300.
Díaz-Moreno, A., Koulakov, I., García-Yeguas, A.,Jakovlev, A., Barberi, G., Cocina, O., Zuccarello, L.,Scarfì, L., Patanè, D., Álvarez, I., García, L., Benítez,C., Prudencio, J., and Ibáñez, J.M. (2016). PARTOS- Passive and Active Ray TOmography Software: de-scription and preliminary analysis using TOMO-ETNA experiment’s dataset, Annals of Geophysics,59(4), S0435, doi:10.4401/ag-7088.
Gentili, S., and Michelini, A. (2006). Automatic pickingof Pand S phases using a neural tree, J. Seismol., 10,39-63.
Gundalf (2012). GUNDALF array modeling suite -Array report. Gundalf revision AIR8.1c, Date 2013-04-30, Epoch 2012-10-12 Fri May 2307:58:31 GMTStandard Time 2014 (UTMSIS-MICA); https://www.gundalf.com/.
Hildyard, M.W., Nippress, S.E.J., and Rietbrock, A.(2008). Event Detection and Phase Picking Using aTime-Domain Estimate of Predominate PeriodTpd, B. Seismol. Soc. Am., 98(6), 3025-3032.
Ibáñez, J.M., Del Pezzo, E., Almendros, J., La Rocca,M., Alguacil, G., Ortiz, R., and García, A. (2000).Seismo volcanic signals at Deception Island volcano(Antarctica): wavefield analysis and source model-ing, J. Geophys. Res., 105(6), 13905-13931.
Ibáñez, J.M., Almendros, J., Carmona, E., Martínez-Arévalo, C, and Abril, M. (2003). The recent seismo-
AUTOMATIC P-PHASE PICKING
volcanic activity at Deception Island volcano, Deep-Sea Res. Pt. II, 50 (Special vol. ed. by K. Smith,ERUPT: Ecosystem studies of an enclosed bay withinDeception Island, Antarctica), 1611-1629.
Ibáñez, J.M., Del Pezzo, E., Bengoa, C., Caselli, A., Badi,G., and Almendros, J. (2008). Volcanic tremor andlocal earthquakes at Copahue volcano, SouthernAndes, Argentina, J. Volcanol. Geoth. Res., 174, 184-294.
Ibáñez, J.M., Benítez, C., Gutiérrez, L.A., Cortés, G.,García-Yeguas, A., and Alguacil, G. (2009). Discrim-ination between different volcanic signals using Hid-den Markov Model: an example of Stromboli and Etnavolcanoes, J. Volcanol. Geoth. Res., 187, 218-226.
Ibáñez, J.M., Prudencio, J., Díaz-Moreno, A., Patanè,D., Puglisi, G., Lühr, B.-G., Carrión, F., Dañobeitia,J.J., Coltelli, M., Bianco, F., Del Pezzo, E., Dahm, T.,Willmott ,V., and Mazauric, V. (2016a). The TOMO-ETNA experiment: an imaging active campaign atMt. Etna volcano. Context, main objectives, work-ing-plans and involved research projects, Annals ofGeophysics, 59(4), S0426, doi:10.4401/ag-7079.
Ibáñez, J.M., et al. (2016b). TOMO-ETNA experimentat Etna volcano: activities on land, Annals of Geo-physics, 59(4), S0427, doi:10.4401/ag-7080.
Küperkoch, L., Meier, T., Lee, J., Friederich, W., andEGELADOS working group (2010). Automatic de-termination of P-wave arrival times at regional orlocal distances using higher order statistics, Geophys.J. Int., 181, 1159-1170.
Küperkoch, L., Meier, T., and Diehl, T. (2012). Auto-mated Event and Phase Identification, In: Bormann,P. (ed.), New Manual of Seismological ObservatoryPractice 2 (NMSOP-2), Potsdam, Deutsches Geo-ForschungsZentrum GFZ, 1-52.
Kurzon, I., Vernon, F.L., Rosenberg, A., and Ben-Zion,Y. (2014). Real-time automatic detectors of P and Swaves using singular value decomposition, B. Sismol.Soc. Am., 104, 229-246.
Langet, N., Maggi, A., Michelini, A. and Brenguier, F.(2014). Continuous kurtosis-based migration forseismic event detection and location, with applica-tion to Piton de la Fournase Volcano, La Reunion, B.Sismol. Soc. Am., 104, 229-246.
Martínez-Arévalo, C, Bianco, F., Ibáñez, J.M., and DelPezzo, E. (2003). Shallow seismic attenuation andshear waves splitting in the short period range ofDeception Island volcano (Antarctica), J. Volcanol.Geoth. Res., 128, 89-113.
Martínez-Arévalo, C., Patanè, D., Rietrebock, A., andIbáñez, J.M. (2005). The intrusive process leading tothe Mt. Etna 2011 flank eruption: Constrain from 3-D attenuation tomography, Geophys. Res. Lett., 32,
21309-21313.Nippress, S.E.J., Rietbrock, A., and Heath, A.E. (2010).
Optimized automatic pickers: application to theANCORP data set, Geophys. J. Int., 181, 911-925.
Prudencio, J., De Siena, L., Ibáñez, J.M., Del Pezzo, E.,García-Yeguas, A., and Díaz-Moreno, A. (2015a). The3D attenuation structure of Deception Island (Antarc-tica), Surv. Geophys., 36(3), 371-390, doi:10.1007/s10712-015-9322-6.
Prudencio, J., Del Pezzo, E., Ibáñez, J.M., Giampiccolo,E., and Patanè, D. (2015b). Two-dimensional seismicattenuation images of Stromboli Island using activedata, Geophys. Res. Lett., 42, 1-8, doi:10.1002/2015GL063293.
Prudencio, J., Ibáñez, J.M., Del Pezzo, E., Martí, J., Gar-cía-Yeguas, A., De Siena, L. (2015c). 3D attenuationtomography of the volcanic island of Tenerife (Ca-nary Islands, Spain), Surv. Geophys., 36(5), 693-716,doi:10.1007/s10712-015-9333-3.
Reading, A.M., Mao, W.J., and Gubbins, D. (2001). Po-larization filtering for automatic picking of seismicdata and improved converted phase detection, Geo-phys. J. Int., 147(1), 227-234.
Romero, J.M., Titos, M., Álvarez, I., García, L., De laTorre, A., and Benítez, C. (2016). APASVO: a freesoftware tool for automatic P-phase picking andevent detection in seismic traces, Comput. Geosci.,90(A), 213-220.
Ross, Z.E., and Ben-Zion, Y. (2014). Automatic pickingof direct P, S seismic phases and fault zone headwaves, Geophys. J. Int., 199, 368-381.
Saragiotis, C.D., Hadjileontiadis, L.J., and Panas, S.M.(2002). PAI-S/K: A robust automatic seismic P-phasearrival identification scheme, IEEE T. Geosci. Re-mote, 40(6), 1395-1404.
Takanami, T., and Kitagawa, G. (1988). A new efficientprocedure for the estimation of onset times of seis-mic waves, J. Phys. Earth, 36(6), 267-290.
Zhang, H., Thurner, C., and Rowe, C. (2003). Auto-matic P-Wave Arrival Detection and Picking withMulti-scale Wavelet Analysis for Single-ComponentRecordings, B. Sismol. Soc. Am., 93(5), 1904-1912.
*Corresponding author: Luz García,Universidad de Granada, Departamento de Teoría de la SeñalTelemática y Comunicaciones, Granada, Spainemail: [email protected].
© 2016 by the Istituto Nazionale di Geofisica e Vulcanologia. Allrights reserved.
GARCÍA ET AL.
12