advancing the climate benefits of electric vehicles to
TRANSCRIPT

Advancing the climate benefits of electric vehicles to reduce greenhouse gas
emissions
Ran Tu (Postdoctoral fellow), and Marianne Hatzopoulou (Associate Professor)
Transformative Transportation ’20, iCity-CATTS Research Day
June 3, 2020
June 3, 2020 Transformative Transportation ‘20, iCity-CATTS Research Day 1
The Transportation & Air Quality Research Group
TRAQ

Transportation: a major source ofgreenhouse gas (GHG) emissions
• Transportation: 2nd largest source of national total Greenhouse Gas (GHG) emissions; largest of Nitrogen Oxides (NOx) emissions
• Toronto emission inventory in 2017 shows:
June 3, 2020 Transformative Transportation ‘20, iCity-CATTS Research Day 2

June 3, 2020 Transformative Transportation ‘20, iCity-CATTS Research Day 3
• TransformTO: Toronto’s ambitious climate action strategy (2017)
• Automobile-related goals:
• 45% low- carbon vehicles by 2030;
• 100% low-carbon vehicles by 2050.
A climate emergency has been declared in 2019
GAS

June 3, 2020 Transformative Transportation ‘20, iCity-CATTS Research Day 4
However, electric vehicle is not “zero-emissions”…
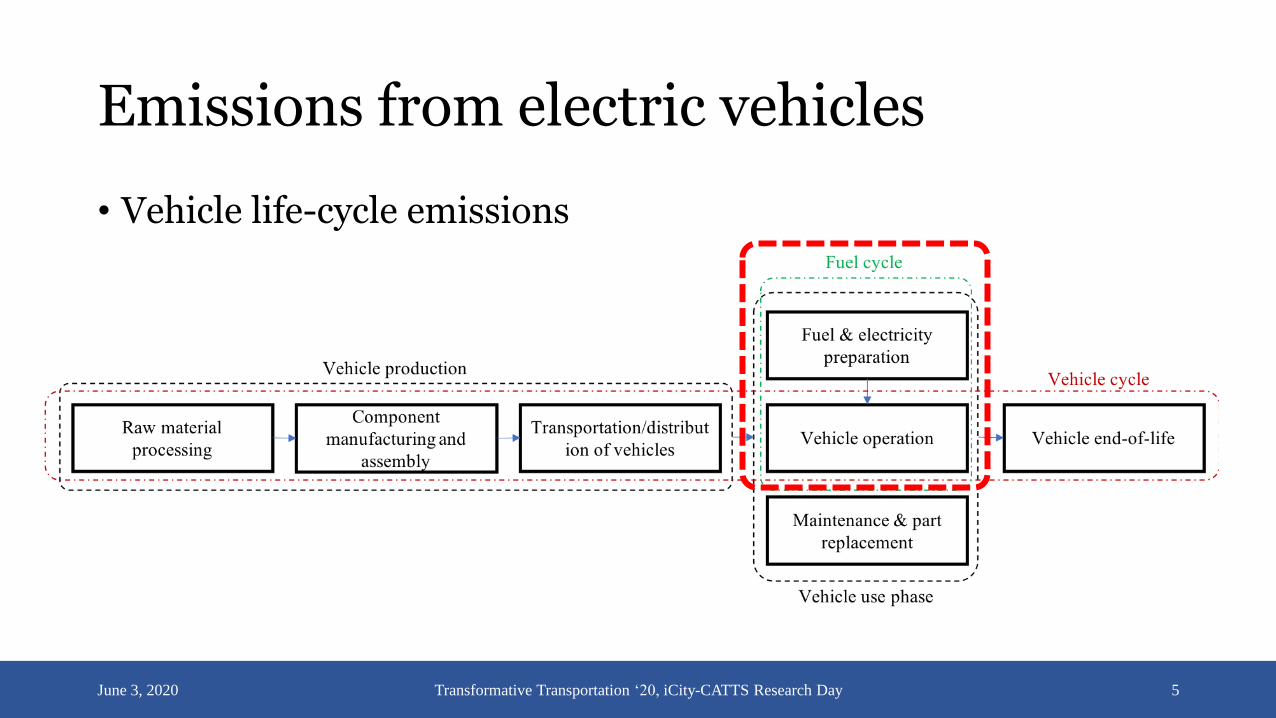
Emissions from electric vehicles
June 3, 2020 Transformative Transportation ‘20, iCity-CATTS Research Day 5
• Vehicle life-cycle emissions

In this presentation:
June 3, 2020 Transformative Transportation ‘20, iCity-CATTS Research Day 6
1) Electric vehicles
4) Different charging schedules
• Reduction of GHG emissions in thefollowing electric vehicle scenarios:
2) Electricity supply mix3) Connected
autonomous vehicles
Study domain and data source
• Greater Toronto and Hamilton Area (GTHA)
• Demand data: Transportation Tomorrow Survey (TTS) data
• Travel distance and time: GTAModel
June 3, 2020 Transformative Transportation ‘20, iCity-CATTS Research Day 7

1. Electric vehicles with different penetration ratesWang, An, Ran Tu, Yijun Gai, Lucas G. Pereira, J. Vaughan, I. Daniel Posen, Eric J. Miller, and Marianne Hatzopoulou. "Capturing uncertainty in emission estimates related to vehicle electrification and implications for metropolitan greenhouse gas emission inventories." Applied Energy 265 (2020): 114798.
June 3, 2020 Transformative Transportation ‘20, iCity-CATTS Research Day 8
Electric vehicles

Methodology
• Road link-based emission factors (gram/km) and energy consumption factors(kJ/km) are applied;
• Fuel cycle GHG emissions in 2011 and 2017 are calculated for conventional gasoline vehicles and electric vehicles;
• 25%, 50%, 75%, 100% EV penetration rates are implemented;
• Emission uncertainties from vehicle on-road operation, electricity generation, and gasoline supply are considered with the Monte-Carlo random process.
June 3, 2020 Transformative Transportation ‘20, iCity-CATTS Research Day 9

Sources of uncertainties
June 3, 2020 Transformative Transportation ‘20, iCity-CATTS Research Day 10
• Vehicle operation: variation of microscopic driving operations;
• Gasoline supply: monthly difference of supply share and
emission intensity of different supply sources;
• Electricity generation: monthly difference of electricity
generation mix.

Fuel-cycle emission comparison
June 3, 2020 Transformative Transportation ‘20, iCity-CATTS Research Day 11
From a probabilistic perspective, having
more EVs does not ensure the emission
reduction;
Besides having more EVs, keeping a good
traffic condition and a cleaner energy source
can enhance the climate benefit of EVs.

2. Electric vehicles and connected autonomous vehiclesTu, Ran, Alfaseeh, L., Djavadian, S., Farooq, B., Hatzopoulou, M. “Quantifying the impacts of dynamic control in connected and automated vehicles on greenhouse gas emissions and urban NO2 concentrations.” Transp. Res. Part D Transp. Environ (2019). 73, 142–151. doi:10.1016/j.trd.2019.06.008
June 3, 2020 Transformative Transportation ‘20, iCity-CATTS Research Day 12
Electric vehicles
(EV)
Connected autonomous
vehicles (CAV)

June 3, 2020 Transformative Transportation ‘20, iCity-CATTS Research Day 13
Scenario settings
All EV
Three levels of
demand
Low demand
Medium demand
High demand
Three levels of CAV
penetration rate
0%
5%
100%
2016 Ontario
energy mix
CAV algorithm: minimize total travel time
June 3, 2020 Transformative Transportation ‘20, iCity-CATTS Research Day 14
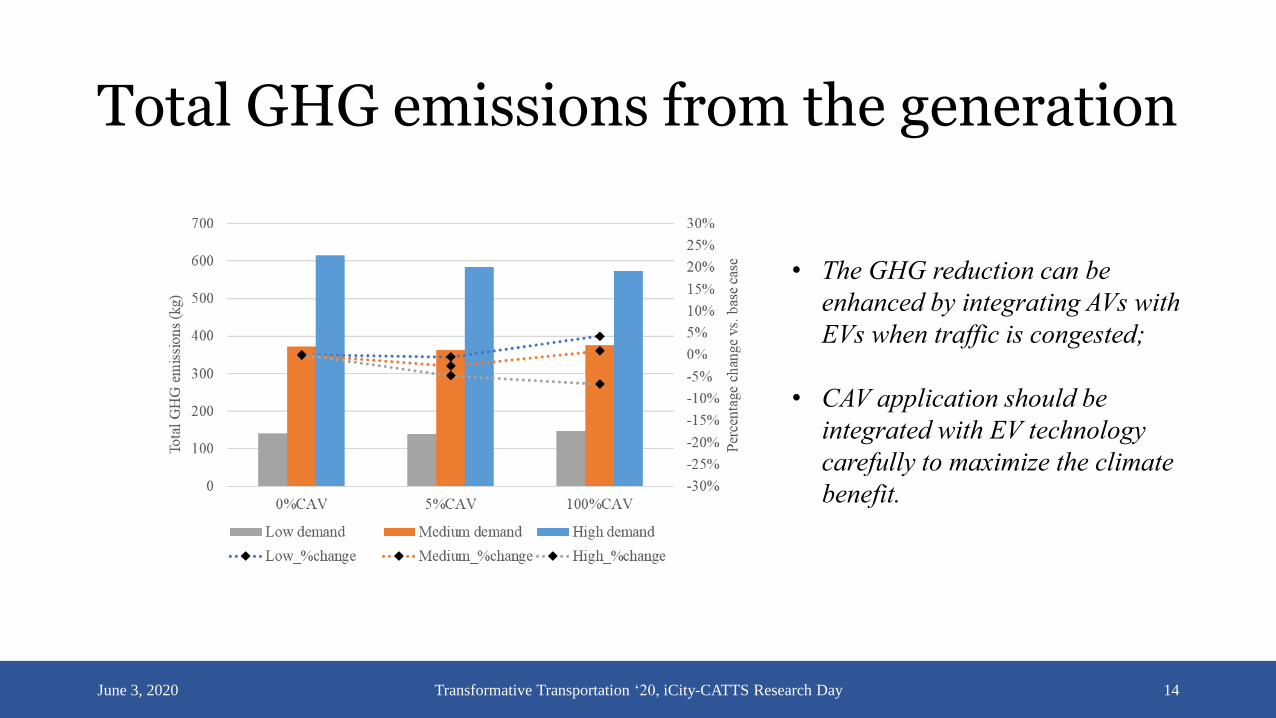
Total GHG emissions from the generation
• The GHG reduction can be
enhanced by integrating AVs with
EVs when traffic is congested;
• CAV application should be
integrated with EV technology
carefully to maximize the climate
benefit.

June 3, 2020 Transformative Transportation ‘20, iCity-CATTS Research Day 15
Electric vehicles
(EV)
3. Electric vehicles and electricity supply mixWang, An, et al. "Automated, electric, or both? Investigating the effects of transportation and technology scenarios on metropolitan greenhouse gas emissions." Sustainable cities and society 40 (2018): 524-533.
Electricity supply mix

Energy sources of vehicles
June 3, 2020 Transformative Transportation ‘20, iCity-CATTS Research Day 16
Light duty vehicles
Gasoline or electricity Mix 1: 2016 Ontario electricity generation mix
Mix 2: 100% natural gas
Mix 3: Hydro and natural gas
Mix 4: Wind and solar
June 3, 2020 Transformative Transportation ‘20, iCity-CATTS Research Day 17
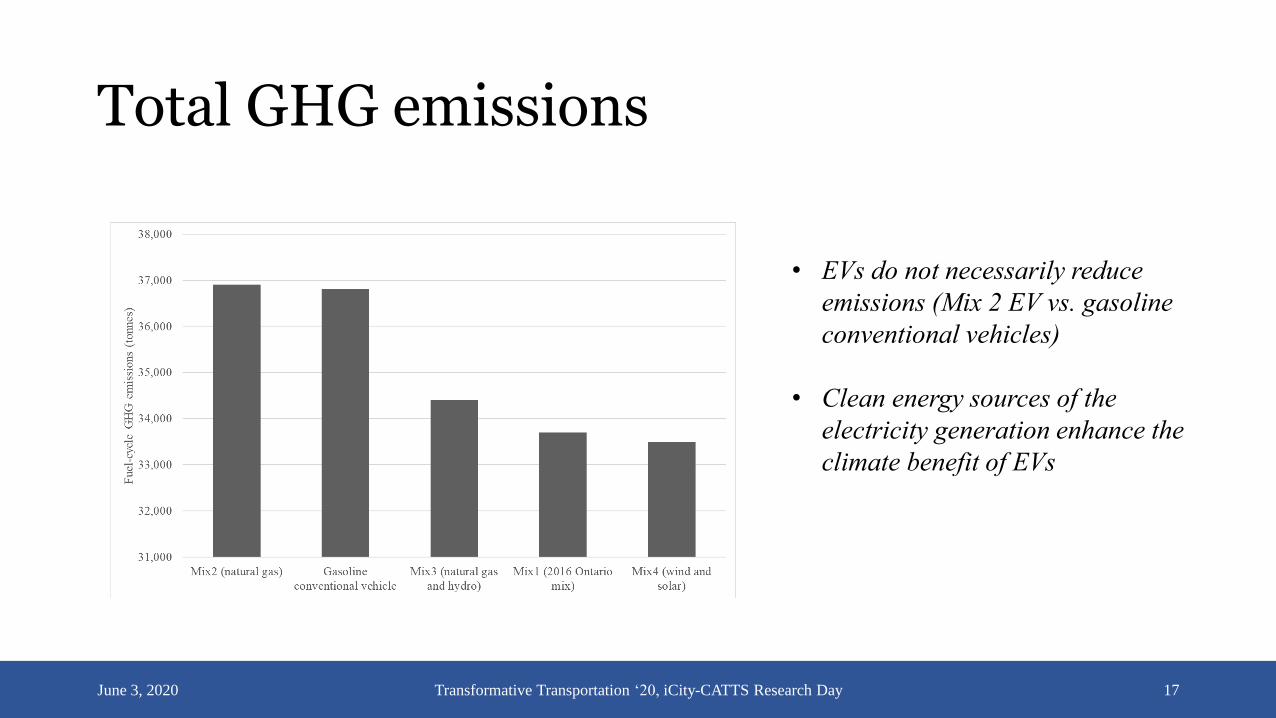
Total GHG emissions
• EVs do not necessarily reduce
emissions (Mix 2 EV vs. gasoline
conventional vehicles)
• Clean energy sources of the
electricity generation enhance the
climate benefit of EVs

June 3, 2020 Transformative Transportation ‘20, iCity-CATTS Research Day 18
4. Electric vehicles and different charging schedulesGai, Yijun, et al. "Marginal Greenhouse Gas Emissions of Ontario’s Electricity System and the Implications of Electric Vehicle Charging." Environmental science & technology 53.13 (2019): 7903-7912.
Tu, Ran, Yijun Gai, Bilal Farooq, Daniel Posen, Marianne Hatzopoulou. “Electric Vehicle Charging Optimization to Minimize Marginal Greenhouse Gas Emissions”. The 99th
Transportation Research Board Annual Meeting. January 2020. Washington DC, USA
Electric vehiclesDifferent charging schedules

Introducing marginal emission factors
June 3, 2020 Transformative Transportation ‘20, iCity-CATTS Research Day 19
Average emission factor:
𝑆ℎ𝑎𝑟𝑒𝑒𝑛𝑒𝑟𝑔𝑦 𝑠𝑜𝑢𝑟𝑐𝑒 𝑖 × 𝐸𝑚𝑖𝑠𝑠𝑖𝑜𝑛 𝑖𝑛𝑡𝑒𝑛𝑠𝑖𝑡𝑦𝑒𝑛𝑒𝑟𝑔𝑦 𝑠𝑜𝑢𝑟𝑐𝑒 𝑖
However, only some specific generators (usually
they are dispatchable) respond to the near-term
increase of the electricity demand
The marginal emission factor (MEF):
capture the marginal change of the generator
and the corresponding change on the emission
intensity.

Marginal emission factor model
June 3, 2020 Transformative Transportation ‘20, iCity-CATTS Research Day 20
Where:
Gi is network electricity load at time i;
∆𝐺𝑖 is the change of electricity demand;
𝐷𝑚𝑜𝑛𝑡ℎ is the dummy variable indicating the specific month;
β0, β1, β2, and β3 are constant coefficients in the MEF model;
This set of MEF formula is for August 2017.
(a). 𝑀𝐸𝐹𝑖 = (𝛽0+ + 𝛽1
+ × 𝐺𝑖 + 𝛽2+ × ∆𝐺𝑖) 𝐷𝑚𝑜𝑛𝑡ℎ, if ∆𝐺𝑖≥ 0;
(b). 𝑀𝐸𝐹𝑖 = (𝛽0− + 𝛽1
− × 𝐺𝑖 + 𝛽2− × ∆𝐺𝑖) 𝐷𝑚𝑜𝑛𝑡ℎ, if ∆𝐺𝑖< 0;
MEF is related to :
• year, month;
• electricity demand at the current hour;
• Marginal change of the electricity
demand
The MEF varies in different hours of a
day
→ EV charging schedules can influence
the total emissions

Optimizing EV charging schedule
• Objective: minimize GHG emissions from the generation
June 3, 2020 Transformative Transportation ‘20, iCity-CATTS Research Day 21
Objective: min𝑍 =σ𝑖𝑀𝐸𝐹𝑖×σ𝑗 𝑥𝑖,𝑗
𝛿× 1−𝛾
(I). Vehicle cannot be charged during driving;
(II). Total energy consumption cannot exceed total charged energy plus battery capacity;
(III). At the end of the day, total energy consumed should be approximately same as total energy
charged;
(IV). Total charging demand of the network cannot exceed the generation spare capacity.
S.t.
𝑥𝑖,𝑗: charging levels (0, level1, level2,
level3) of vehicle 𝑗 in timeslot 𝑖.

Scenario settings
• 5% random samples out of all drivers in the TTS data
• Scenarios:• Optimized plan: minimizing GHG emissions as the objective;
• Home charging: only charge at home;
• Out-of-home charging: cannot charge at home;
• After-trip charging: charging is available after each trip;
• After 3am charging: charging is available after 3am.
June 3, 2020 Transformative Transportation ‘20, iCity-CATTS Research Day 22

Scenario comparison
June 3, 2020 Transformative Transportation ‘20, iCity-CATTS Research Day 23
Total emissions from the generation

Scenario comparison
June 3, 2020 Transformative Transportation ‘20, iCity-CATTS Research Day 24
Optimized
After-trip
After-3am
Total emissions from the generation Charging schedules
An optimized charging
schedule with a proper
charging level management
can maximize the GHG
reduction from EVs.

Distribution of charging durations
June 3, 2020 Transformative Transportation ‘20, iCity-CATTS Research Day 25
Level 1
Level 2 and Level 3 charging events follow
the similar distribution, but different
numbers of event.
Home location is the most popular option

Total number of public charging ports
June 3, 2020 Transformative Transportation ‘20, iCity-CATTS Research Day 26
The availability of charging facilities ensures
the possibility of the optimized charging
schedule;
Optimized plan and after-3am plan request
the most public charging ports;
Level 1 is the highest requested public
charging level;
Conflicts exist between the climate benefit of
EVs and the investment cost of the
infrastructure.

A closing remark
June 3, 2020 Transformative Transportation ‘20, iCity-CATTS Research Day 27

The share of EVs is far from the goal
• TransformTO:
• 45% low- carbon vehicles by 2030;
• 100% low-carbon vehicles by 2050.
June 3, 2020 Transformative Transportation ‘20, iCity-CATTS Research Day 28

The share of EVs is far from the goal
• TransformTO:
• 45% low- carbon vehicles by 2030;
• 100% low-carbon vehicles by 2050.
• Currently (in 2019):
June 3, 2020 Transformative Transportation ‘20, iCity-CATTS Research Day 29
Technological improvements,
incentives are needed to increase
the EV share.

Pathway to enhance the climate benefit ofelectric vehicles• A better traffic condition with less congestion saves electrical
energy;
• A cleaner electricity generation mix reduces emission intensityper kWh of electrical energy;
• With the same energy consumption, a proper EV charging plancan reduce marginal emissions;
• An appropriate allocation of charging facilities is theprerequisite of the optimized EV charging plan.
June 3, 2020 Transformative Transportation ‘20, iCity-CATTS Research Day 30

Thank you!
June 3, 2020 31
Ran Tu, Marianne Hatzopoulou
Department of Civil and Mineral Engineering
University of Toronto
June 3, 2020
The Transportation & Air Quality Research Group
TRAQ