advertisement effectiveness estimation based on...
TRANSCRIPT

Abstract
In this paper, we estimate the effectiveness of an
advertisement using online data collection and the remote
measurement of facial expressions and physiological
responses. Recently, the online advertisement market has
expanded, and the measurement of advertisement
effectiveness has become very important. We collected a
significant number of videos of Japanese faces watching
video advertisements in the same scenario in which media
is normally used via the Internet. Facial expression and
physiological responses such as heart rate and gaze were
remotely measured by analyzing facial videos. By
combining the measured responses into multimodal
features and using machine learning, we show that ad
liking can be predicted (ROC AUC = 0.93) better than
when only single-mode features are used. Furthermore,
intent to purchase can be estimated well (ROC AUC = 0.91)
using multimodal features.
1. Introduction
The diversification of video content provided on the
Internet has progressed, and viewing it is becoming a daily
habit. Moreover, in the communication between companies
and users, video content is becoming accepted. Against this
backdrop, the video advertising market continues to grow
more quickly than the previous year, and it has become the
driving force behind the growth of the Internet advertising
market as a whole. In the US, the costs of the Internet
advertising market exceeded those of television advertising
in 2017. In Japan, the size of the video advertisement
market in 2017 reached 137.4 billion JPY, which is 163%
that of the previous year, and is expected to increase from
now on. By 2021, 1.9 billion people worldwide will watch
online videos and are expected to watch 3 trillion minutes of
videos each month. It can be predicted using simple
calculations that, globally, each person will watch more
than 1,500 hours of online videos per month on average.
The goal of video advertisement is to get the target layer
to recognize products and services (awareness), ask them to
consider making a purchase (consideration), and ultimately
achieve sales (action). The important and interesting criteria
that measure the achievement of these goals are ad liking
and purchase intent. Recently, these criteria can not only be
measured using costly questionnaires but also can be
predicted from viewers' facial expressions and
physiological responses [1][2][3][4]. Although facial
expressions have been shown to predict liking, which is a
relatively simple emotion, purchase intent, which is
relatively ambiguous, cannot be predicted as accurately. To
improve the prediction accuracy of purchase intent, it is
useful to analyze physiological responses such as heart rate,
which are effective for ambiguous emotion estimation, and
to use multimodal features combined with facial
expressions. In addition, Japanese people have brief facial
expressions [5], so it is necessary to understand the
relationship between facial expressions in the Japanese and
these metrics.
Traditionally, video advertising consumer tests, whether
using questionnaires, facial reactions, or physiological
responses, have been performed in laboratory environments.
Studies in laboratory environments have many advantages
such as the ability to measure physiological responses and
muscle movements with high accuracy. However, the
subjects might be influenced by irrelevant factors such as
the existence of the experimenter and the discomfort of the
experimental environment. Moreover, computer-based
machine learning and pattern analysis are highly dependent
on the number of training samples. In particular, the
diversity and complexity of naturalistic and spontaneous
emotional expressions means that a large quantity of data is
required for effective learning. This is because individual
differences, such as cultural and gender differences, can be
substantial. Recently, studies to analyze natural facial
reactions using crowdsourcing have attracted attention
because data collection is performed very efficiently using
the Internet. Crowdsourcing means "outsourcing" tasks to
an unspecified number of individuals in a "crowd." Remote
measurements using the Internet can be collected far more
efficiently and more diverse participants from groups with
different backgrounds can be used than in a laboratory
environment.
Advertisement effectiveness estimation
based on crowdsourced multimodal affective responses
Genki Okada
Chiba University
Chiba, Japan [email protected]
Kenta Masui
Chiba University
Chiba, Japan [email protected]
Norimichi Tsumura
Chiba University
Chiba, Japan [email protected]
1376

In this paper, we estimate the effectiveness of the
emotional content of advertisements within the same
scenario that media is normally used by using online data
collection and contactless measurement methods of facial
expression and physiological responses. First, we collected
a significant number of videos of Japanese faces watching
video advertisements via the Internet. Next, facial
expressions and physiological responses such as heart rate
and gaze were remotely measured by analyzing the facial
videos. Finally, by combining the measured responses as
multimodal features and using a support vector machine
(SVM), ad liking and purchase intent were estimated.
2. Related work
2.1. Facial expression
Numerous studies have been demonstrated that facial
behavior conveys basic emotional information. Moreover,
some of these expressions are consistent throughout all
cultures [6][7][8][9][10]. Furthermore, expression is
continuous and dynamic, and it is possible to express how
emotions change over time. However, in recent years,
Girard collected a large number of smile responses, a
globally common facial expression, and showed that there
are cultural and geographical differences in the expression
of smiles [5]. Of them, Japanese people have a weak smile
and short expression time, so emotion estimation from
facial expression only might be more difficult than in other
countries. Friesen compared the behavior of the face of 25
Japanese and 25 American college students during stressful
movie viewing [11]. The result, called a display rule,
showed that Japanese masked negative emotions with a
positive expression in the presence of authority [12].
Teixeira et al. showed that inducing emotion is important
for reducing the frequency of "zapping," or skipping
advertisements, and concentrate the attention of viewers of
online video advertisements [1].
2.2. Heart Rate
In the study of physiological psychology, it is known that
there is a strong correlation between a physiological
response caused by the autonomic nervous system and a
human emotional state. Furthermore, physiological signals
are less affected by social and cultural differences [13]. We
can estimate the original emotions that people are trying to
hide or that cannot be recognized even by themselves. In
recent years, the ability to measure heart rate without
contact has been developed and various applications are
expected. Poh et al. measured heart rate using the
independent component analysis (ICA) of RGB signals of
facial images photographed using a webcam [14]. McDuff
et al. further analyzed heart rate variability (HRV) to detect
participant stress with 85% accuracy [15]. Okada et al
measured heart rate from the RGB facial images of
participants watching a video that evokes the five basic
emotions, and estimated each emotional state with an
accuracy of 94% by analyzing HRV [16]. Variability in
heart rate has been used to capture the arousal and attention
of ad viewers. This was demonstrated by studying the
reactions of participants who watched television
advertisements inserted between two situation comedies to
simulate a more realistic viewing experience [2].
2.3. Gaze
Eye movements are controlled by six extraocular muscles
and involve involuntary movements as well as spontaneous
movement. Yonezawa et al. showed that the staying time of
the gaze on the image of a face that is judged to be attractive
is longer than one that is considered unattractive [17].
Venkatraman showed a significant correlation between
advertisement preference and gaze ratio [3]. Eyeballs also
have involuntary micromovements called microsaccades,
even when the gaze is fixed. This involuntary eye movement
reflects the state of the attention induced by the external
stimulus and potential attention without gaze change [18].
2.4. Multimodal features
In recent years, recognition accuracy has been improved
by combining not only single-mode features but also
features from multiple modes in machine emotion
recognition. Kapoor et al. presented one of the first
examples of multimodal features in emotion estimation
using physiological response and facial behavior to predict
frustration [19]. Mansoorizadeh et al. recognized basic
emotions by combining facial expressions and speech
features. They obtained better accuracy than when only
single-mode features were used [20]. Monkaresi et al.
estimated engagement with higher accuracy when
multimodal features consisting of facial expressions and
noncontact heartbeat measurements were used [21]. Pham
et al. used a combination of contact-based photo
plethysmography (PPG) sensing and remote facial
expression analysis to predict a viewer's attention,
engagement, and sentiment when watching video
advertisements on smartphones [4]. They found that facial
expression analysis is more effective with strong emotions
such as joy or anger, while the PPG channel is more
beneficial for subtle reactions and emotions. Moreover, the
PPG and facial expression features are complementary.
Burzo et al. showed that it is possible to effectively predict
changes in human affect using four different modalities
consisting of visual facial behaviors, thermal imaging, heart
rate measurement, and verbal descriptions [22].
1377
2.5. Crowdsourcing
Many video advertisement consumer tests, including the
studies described above, were conducted in a laboratory
environment. Research in laboratory environments have
many advantages such as the ability to measure
physiological responses and muscle movements with high
accuracy, but there are also many problems. Participants
might be influenced by factors unrelated to the stimuli under
study, such as the presence of the experimenter and the
discomfort of the experimental environment. Therefore,
such a problem can be avoided by performing an
experiment without using a sensor that makes participants
uncomfortable in a context other than the laboratory
environment. Teixeira et al. extended the study that showed
that joy is one of the conditions stimulating viewer's
retention in commercials [1] by collecting viewer responses
on the Internet [23]. McDuff et al. modeled the relationship
between the large-scale analysis of facial responses to video
content measured on the Internet and advertisement
effectiveness [24]. As a result, they showed that ad liking
and change in purchase intent can be accurately predicted
from facial reactions acquired by webcams.
3. Data acquisition by crowdsourcing
Figure 1 shows the online data collection framework.
Figure 1. Online data collection framework
The facial video and self-reports were collected via the
Internet. First, participants were asked to agree to the use of
the webcam and the recording of the facial video. Next, as a
baseline of purchase intent, they answered the following
question:
How likely are you to purchase this product, now?
5 4 3 2 1
Likely to purchase Neutral Not likely to purchase
If participants did not know the product, they could
indicate this rather than entering an evaluation.
Prior to watching the video advertisements, they viewed
their webcam stream to check the position of the face (in the
middle of the display) and the brightness (sufficiently
bright). Wearing a hat or mask, eating, drinking, and using a
mobile phone were not allowed.
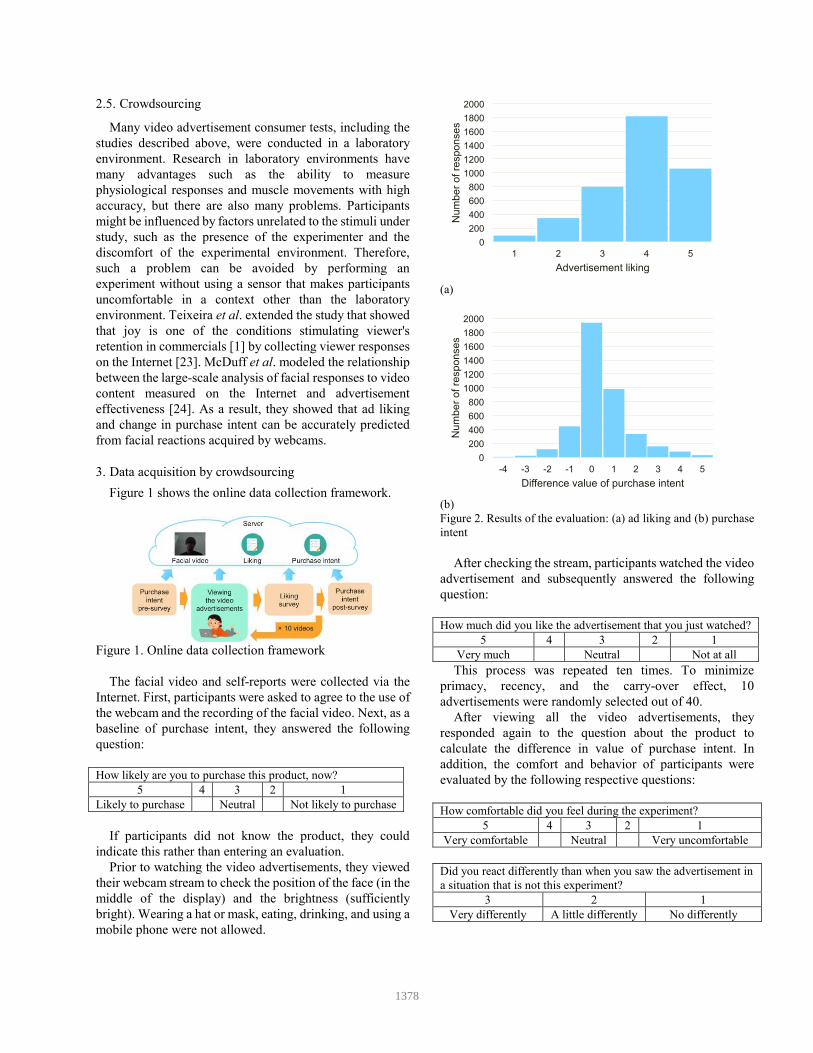
(a)
(b)
Figure 2. Results of the evaluation: (a) ad liking and (b) purchase
intent
After checking the stream, participants watched the video
advertisement and subsequently answered the following
question:
How much did you like the advertisement that you just watched?
5 4 3 2 1
Very much Neutral Not at all
This process was repeated ten times. To minimize
primacy, recency, and the carry-over effect, 10
advertisements were randomly selected out of 40.
After viewing all the video advertisements, they
responded again to the question about the product to
calculate the difference in value of purchase intent. In
addition, the comfort and behavior of participants were
evaluated by the following respective questions:
How comfortable did you feel during the experiment?
5 4 3 2 1
Very comfortable Neutral Very uncomfortable
Did you react differently than when you saw the advertisement in
a situation that is not this experiment?
3 2 1
Very differently A little differently No differently
1378

Of the viewers, 24% reported that they felt “very comfortable,” 49% felt “comfortable,” 23% felt “neutral,” 3% felt “uncomfortable.” Moreover, 61% reported “no differently,” 36% reported “a little differently,” and 3% reported “very differently.” Figure 2 shows the result of the
evaluation. These aggregate results suggest that the
reactions of viewers recorded while they viewed video
advertisements were natural.
The video advertisements used for experiments were
broadcast in Japan between 2014 and 2017. The average
length of the video was 31.25 s and its standard deviation
was 1.13 s. Each advertisement was watched by an average
of 108 subjects. The videos were advertisements for eight
products from the categories of alcohol, drink, food,
confectionery, or daily items. We focused on products that
might be bought frequently rather than those that require
long-term purchase decisions such as cars.
(a)
Employee
36%
Self
employed
11%
House
maker
20%
Student
17%
Unemployed
9%
Other
7%
〜20018%
201〜400
25%401〜600
25%
601〜800
12%
801〜1000
7%
1000〜7%
Other
6%
(b) (c)
Figure 3. Distribution of the participants: (a) age and gender, (b) job,
and (c) annual income (million JPY)
In this study, 411 Japanese people participated and 4,108
facial responses were collected over a short period of about
3 weeks. Figure 3 shows the distribution of participants.
Using crowdsourcing, we were able to collect the data from
participants with a wide range of ages, genders, locations,
occupations, household compositions, and income, which
helped reduce the influence of self-selection bias. At least
76% of the viewers were users of the product category being
advertised. Subjects took about 30 min to complete the
experiment, and when the work was approved, they earned
500 JPY. Not all participants visiting the task page had a
webcam nor agreed to record the facial videos, and, in either
case, the experiment was terminated. Approximately 88%
of the participants who visited the task page had webcams,
and of these 88%, about 98% agreed to record facial
responses. In addition, of the more than 13,000 people who
visited the recruitment page, the proportion of visits to the
task page was about 4%.
4. Multi-modal features
4.1. Facial expression
To calculate the facial expression feature, first, 68 face
parts were detected from each frame of the recorded facial
video using Kazemi and Sullivan's method [25]. Figure 4
shows the detected face parts.
Figure 4. Example of detected face parts
In addition, we calculated the histogram of oriented
gradients (HOG) features of the detected face region. Using
the coordinates of the facial parts and the HOGs, 17 action
units (AUs) shown in Table 1 are detected by a linear kernel
with support vector regression. The time mean value,
standard deviation, maximum value, minimum value,
median value and entropy of each AU are calculated as a
feature of facial expression.
Translation and rotation of the face were also calculated
as features. Translation and rotation represent the relative
movement of the face with respect to the camera and have
three degrees of freedom. Translation is the movement of
the coordinates in the X-, Y-, and Z-axes in
three-dimensional (3D) coordinates. Rotation indicates
rotation of the head around the axes roll, pitch, and yaw axes.
Translation and rotation are estimated by projecting the 3D
coordinate points of the head model onto the image plane
using a perspective projection transformation and
minimizing the reprojection error (the sum of squares of the
distance between the detected point and the projected point).
For simplicity, we approximate the optical center as the
70s
40s
20s
60s
50s
30s
10s
100 80 60 40 20 0 100806040200
Male FemaleAge
The number of people
1379

AU Description
1 Inner brow raise
2 Outer brow raise
4 Brow lower
5 Upper lid raise
6 Cheek raise
7 Lid tighten
9 Nose wrinkle
10 Upper lip raise
12 Lip corner pulling
14 Dimpler
15 Lip corner depression
17 Chin raise
20 Lip stretch
23 Lip tighten
25 Lips parting
26 Jaw drop
45 Blink
Table 1. AUs
center of the image and the focal length as the width of the
image, and assume that radial distortion does not exist. To
calculate reprojection error, the detected ends of the left and
right eyes, nose apex, left and right ends of the mouth, and
jaw tip are used. Finally, the average value, standard
deviation, maximum value, minimum value, median value,
entropy, skewness, and kurtosis of the estimated translation
and rotation are calculated to form the facial expression
feature.
4.2. Heart Rate
Figure 5. Remote heart rate measurement
Heart rate was measured remotely using the original
method based on Poh et al.’s method [14]. Figure 5 shows
the flow of the remote heart rate measurement. First, the
skin region extracted using the mask image created by
removing the eyes, nose, and mouth based on the
coordinates of the detected contour of the face and face
parts is taken as the region of interest (ROI). The ROI is
divided into red, green, and blue channels, and the spatial
average of each channel is calculated. Temporal changes in
the spatial average of each channel are detrended using a
smoothness prior approach [26]. Then, ICA based on the
joint approximate diagonalization of eigenmatrices (JADE)
algorithm [27] is used for the detrended signals. A band
pass filter is applied to the output signals of the ICA to
reduce noise. Unlike the conventional method [14], an
adaptive multibandpass filter is used in which the pass
bands are the width of the highest peak within the range of
0.75–3.00 Hz and the peak width of the second harmonic.
Because the blood volume pulse (BVP) signal is more
periodic than the other signals, a signal including the
spectrum with the highest peak in the frequency domain is
selected as the BVP signal. ICA outputs three signals, which
includes the BVP signal. The interbeat intervals (IBI) are
calculated by interpolating the selected signal to 50 Hz
using a cubic spline function and detecting the peak using a
moving window.
HRV, which is the variability of the continuous IBI, is
controlled by the sympathetic and parasympathetic nerves
of the autonomic nervous system. The function of the
autonomic nervous system can be evaluated by analyzing
IBI in the time domain and nonlinearly.
The time domain method can be easily executed because
it directly analyzes the IBI. The average and standard
deviation of IBI and the average and standard deviation of
the heart rate calculated by dividing 60 by the average IBI is
the most easily obtainable index. The standard deviation of
IBI reflects the overall change while the root mean square of
the successive difference reflects the short term variation.
Furthermore, NN50, which is the number of IBIs for which
the successive difference is 50 ms or longer, and the pNN50,
which is the relative number of NN50 to the total number of
consecutive IBIs, are also used as indicators of the
parasympathetic nerve. In addition to these statistical
features, geometric indicators can be obtained by analyzing
the histogram of the IBI [28]. RRtri is a value obtained by
dividing the integral value (total number of IBIs) of the
histogram of the IBI by the maximum value of the histogram.
TINN (the triangular interpolation of the NN interval
histogram) is obtained by calculating the base of the triangle
approximated by the IBI histogram.
Because the cardiac control system is very complex, it is
reasonable to assume that nonlinear mechanisms affect
heart rate variability. Nonlinear methods using Poincaré
plots are commonly used to analyze heart rate variability.
Poincaré plots are graphs showing the correlation between
consecutive IBIs. The shape of the plot is used as an
indicator and is generally quantified by applying an ellipse
to the plot. The standard deviation in the minor axis
direction represented by SD1 reflects short-term
fluctuations due to respiratory sinus arrhythmia. The
standard deviation in the long axis direction represented by
SD2 is an index showing long-term fluctuation.
1380

4.3. Gaze
We used the coordinates of the detected face parts to
detect eye areas including the eyelids, iris, and pupil. When
the positions of the eyes and the pupil are detected, the gaze
vector of the eye is individually calculated for each eye. We
calculate the intersection of the eyeball sphere with the ray
emitted from the camera's origin toward the center of the
pupil in the image plane. This gives us the position of the
pupil in 3D coordinates. A vector from the 3D eyeball
center to the pupil position is the estimated gaze vector.
This is a quick and accurate method for human-independent
gaze estimation in webcams.
5. Classification
Classification is performed by an SVM using the
calculated features and labels. The radial basis function
(RBF) is used as the kernel function. To create a
generalizable model, learning and classification were
carried out by K-fold cross-validation. In the K-fold
cross-validation, the sample group is divided into K parts.
One of them is a test case and the remaining K − 1 are
training cases. In the cross-validation, each sample group is
verified K times as a test case. The average of the K
evaluations obtained in this way is obtained and a single
estimate is calculated. During the validation, parameter K
was 10. The RBF SVM parameters γ and C were selected by using Bayesian optimization to minimize 10-fold
cross-validation loss.
5.1. Labeling
The labels used were obtained by the crowdsourcing
participants' survey answers. For both purchase intent and
ad liking, the data are divided into two groups to create a
two-class classification problem .
5.1.1 Purchase intent
To label the purchase intent for the products of each video
advertisement, we calculate the difference in the responses
to the pre-survey and post-survey question ("How likely are
you to purchase this product, now?"). The data are divided
into two classes, those with differences greater than 0 and
those with differences equal to or less than 0.
5.1.2 Liking
To label the liking for each video advertisement, we
divided the data by the response to the question immediately
after viewing each video advertisement ("How much did
you like the advertisement that you just watched?"). The
data are divided into two classes, those with responses
greater than 3 and those with responses equal to or less than
3.
5.2. Oversampling
The number of samples in each class is not uniform, as
shown in Figure 2. Handling such imbalanced data can
markedly reduce the classification accuracy. Therefore, we
solved this imbalance problem by oversampling using
Synthetic Minority Over-Sampling Technique (SMOTE)
[29]. First, an instance is selected from the minority class
and the k nearest neighbor instances are extracted. Then,
new instances are added randomly between the k nearest
neighbor instances and the selected instance. As a result, the
classes were balanced in size.
5.3. Feature selection
Too many features with respect to the number of class or
samples to be classified might reduce classification
accuracy due to noise-like or redundant features. Excluding
such features and selecting only useful ones not only
improves classification accuracy but also improves
processing speed and readability. In this study, because the
quantity of data was huge, reduction of calculation cost was
prioritized. Therefore, ReliefF [30] was used for feature
selection. ReliefF outputs the weight of each feature in
relation to the inputs including the features normalized to
the range of [0, 1] in each feature and the corresponding
class values. First, the weights of all features are initialized
to 0 and the following steps are repeated for all instances.
The distances from one instance selected from the input
feature to the k nearest neighbor instances in the same class
and to the k nearest neighbor instances in other classes are
calculated. One instance is selected from the input features
and the distance from the k nearest neighbor instances in the
same class and the distance to the k nearest neighbor
instances in the other class are calculated. The Manhattan
distance is used for distance calculation. The weights of
each feature are updated by subtracting the average value of
the distances in the same class and adding the average value
of the distances in the other classes. Finally, the weights are
iteratively calculated for all the output instances. In general,
10 is considered to be the optimal value for k. In this study,
we selected the features whose output weights were positive
for the estimation.
6. Results and discussion
6.1. Purchase intent
Figure 6 shows the receiver operating characteristic (ROC)
curve for the purchase intent estimation, which is obtained
by changing the threshold of SVM. Figure 7 shows the area
under the curve (AUC) of the ROC. We compared the
estimation performance of single-mode and multimodal
methods.
1381

0
0.2
0.4
0.6
0.8
1
0 0.5 1
Re
ca
ll
False Positive Rate
:FE
:FE+HR
:HR
:G
:FE+G
:HR+G
:FE+HR+G
0
0.2
0.4
0.6
0.8
1
0 0.5 1
Re
ca
ll
False Positive Rate
:FE
:FE+HR
:HR
:G
:FE+G
:HR+G
:FE+HR+G
Figure 6. ROC curve for purchase intent estimation: FE = facial
expression, HR = heart rate, and G = gaze
Figure 7. AUC for the ROC for purchase intent estimation.
Abbreviations are the same as in Figure 6
The estimation accuracy was the highest (ROC AUC =
0.91) when features acquired from all three modes were
used. In addition, when using features calculated from the
two modes of facial expression and heart rate, the
classification accuracy (ROC AUC = 0.90) was equivalent
to that obtained by combining the features from all
modalities.
6.2. Ad Liking
Figure 8 shows the ROC curve for the ad liking estimation
obtained by changing the threshold of the SVM. Figure 9
shows the AUC for the ROC. We compared the estimation
performance for single mode and multimodal features.
Figure 8. ROC curve for ad liking estimation. Abbreviations are
the same as in Figure 6
Figure 9. AUC of the ROC for ad liking estimation. Abbreviations
are the same as in Figure 6
Similar to the purchase intent estimation, the estimation
accuracy was the highest (ROC AUC = 0.93) when feature
values acquired from all three modes were used. Even when
using features calculated from only facial expressions,
facial expressions and heart rate, or facial expressions and
gaze, ad liking was estimated with high accuracy (ROC
AUC = 0.90, 0.91, and 0.93, respectively).
The difference between these results seems to support the
finding of a previous study [4], which is that facial
expression analysis is effective for stronger emotions such
as ad liking while heart rate is more beneficial for subtle
reactions and emotions such as purchase intent.
7. Conclusion and future work
We estimated advertisement effectiveness by acquiring
and analyzing multimodal features from face reactions
when a person views video advertisements. A large quantity
of data was collected using crowdsourcing. First, by
recruiting participants via the Internet, we collected 4,108
facial responses when viewing video advertisements. The
distribution of participants was not biased with respect to
age, gender, occupation, job, household composition, or
household income, and self-selection bias could be reduced.
Along with the face reaction, affective responses to video
advertisements and products were collected by
questionnaire as labeling in machine learning. Next, facial
expression, heart rate, and gaze were measured from the
collected facial video. For the facial expression
measurement, we calculated the AU, which is an index of
facial muscle movement as well as translation and rotation.
For the heart rate measurement, the features were calculated
by analysis in the time domain and nonlinear methods. The
heart rate signals were measured using ICA. For gaze
measurement, we analyzed the temporal changes in gaze of
the left and right eyes and made it a feature. Then, we
combined features calculated from each mode and
estimated the ad liking and purchase intent. As a result, we
show that combining features acquired from multiple modes
leads to higher accuracy for both ad effects than then
features obtained from only a single mode are used.
1382

Future tasks are to elucidate the relationship between the
acquired features and the content of the video advertisement.
The goal of measuring advertisement effectiveness is to
improve sales by improving the quality of the advertisement.
Hence, it is very important to analyze the temporal changes
in the content of the video advertisements and the viewer's
emotional reaction. In addition, we estimated effects for
short video advertisements in this study. However, if the
measurement time is longer, the frequency and duration of
the facial reactions may differ from the results of this study.
References
[1] T. Teixeira, M. Wedel, and R. Pieters. Emotion-induced
engagement in Internet video ads. Journal of Marketing
Research, 49(2):1–51, 2010.
[2] A. Lang. Involuntary attention and physiological arousal
evoked by structural features and emotional content in TV
commercials. Communication Research, 17(3):275–299,
1990.
[3] V. Venkatraman, A. Dimoka, P. A. Pavlou, K. Vo, W.
Hampton, B. Bollinger, H. E. Hershfield, M. Ishihara, and R.
S. Winer. (2015) Predicting advertising success beyond
traditional measures: New insights from neurophysiological
methods and market response modeling. Journal of
Marketing Research, 52(4):436–452, 2015.
[4] P. Pham and J. Wang. Understanding emotional responses to
mobile video advertisements via physiological signal sensing
and facial expression analysis. IUI '17 Proceedings of the
22nd International Conference on Intelligent User Interfaces,
67–78, 2017.
[5] J. M. Girard and D. McDuff. Historical heterogeneity
predicts smiling: evidence from large-scale observational
analyses. 12th IEEE International Conference on Automatic
Face and Gesture Recognition, Washington, DC, 2017, pp.
719–726.
[6] C. Darwin, M. M. Cummings, and G.-B. Duchenne. The
expression of the emotions in man and animals. London:
John Murray, 1872.
[7] S. Silvan and R. McCarter. What and where are the primary
affects? Some evidence for a theory. Perceptual and Motor
Skills, 18(1):119–158, 1964.
[8] P. Ekman and W. Friesen. Constants across cultures in the
face and emotion. Journal of Personality and Social
Psychology, 17(2):124, 1971.
[9] P. Ekman. Facial expression and emotion. American
Psychologist, 48(4):384, 1993.
[10] R. Larsen and B. Fredrickson. Measurement issues in
emotion research. Well-being: The Foundations of Hedonic
Psychology, 40–60, 1999.
[11] W. V. Friesen. Cultural differences in facial expressions in a
social situation: An experimental test on the concept of
display rules. Unpublished doctoral dissertation, University
of California, San Francisco, 1973.
[12] P. Ekman, W. V. Friesen, and P. Ellsworth, Emotion in the
human face: Guidelines for research and an integration of
findings. New York, NY: Pergamon Press, 1972.
[13] O. Alaoui-Ismaili, O. Robin, H. Rada, A. Dittmar, and E.
Vernet-Maury. Basic emotions evoked by odorants:
Comparison between autonomic responses and
self-evaluation. Physiology and Behavior, 62:713–720,
1997.
[14] M. Z. Poh, D. J. McDuff, and R. W. Picard. Advancements in
noncontact, multiparameter physiological measurements
using a webcam. IEEE Transactions on Biomedical
Engineering, 58(1):7–11, 2011.
[15] D. McDuff, S. Gontarek, and R. Picard. Remote
measurement of cognitive stress via heart rate variability.
36th Annual International Conference of the IEEE
Engineering in Medicine and Biology Society, Chicago, IL,
2014, pp. 2957–2960.
[16] G. Okada, T. Yonezawa, K. Kurita, and N. Tsumura.
Monitoring emotion by remote measurement of
physiological signals using an RGB camera. ITE
Transactions on Media Technology and Applications,
6(1):131–137, 2018.
[17] T. Yonezawa, S. Yamamoto, H. Doi, K. Shinohara, and N.
Tsumura. Biological responsiveness in observing sexual
attractiveness of woman. 2017 IEEE Third International
Conference on Multimedia Big Data (BigMM), Laguna Hills,
CA, 2017, pp. 226–231.
[18] S. Martinez-Conde, S. L. Macknik, X.G. Troncoso, and D.H.
Hubel. Microsaccades: A neurophysiological analysis.
Trends in Neuroscience, 32(9):463–475, 2009.
[19] A. Kapoor, W. Burleson, and R. W. Picard. Automatic
prediction of frustration. International Journal of
Human–Computer Studies, 65(8):724–736, 2007.
[20] M. Mansoorizadeh and N. M. Charkari. Hybrid feature and
decision level fusion of face and speech information for
bimodal emotion recognition. 14th International CSI
Computer Conference, Tehran, 2009, pp. 652–657.
[21] H. Monkaresi, N. Bosch, R. A. Calvo, and S. K. D'Mello.
Automated detection of engagement using video-based
estimation of facial expressions and heart rate. IEEE
Transactions on Affective Computing, 8(1):15–28, 2017.
[22] M. Burzo, D. McDuff, R. Mihalcea, L.-P. Morency, A.
Narvaez, V. Perez-Rosas, "Towards sensing the influence of
visual narratives on human affect". Proceedings of the 14th
ACM international conference on Multimodal interaction,
pp. 153-160, 2012.
[23] T. Teixeira, R. El Kaliouby, and R. W. Picard. Why, when,
and how much to entertain consumers in advertisements? A
web-based facial tracking field study. Marketing Science,
2014.
[24] D. McDuff, R. E. Kaliouby, J. F. Cohn, and R. W. Picard,
Predicting ad liking and purchase intent: Large-Scale
analysis of facial responses to ads. IEEE Transactions on
Affective Computing, 6(3):223–235, 2015.
[25] V. Kazemi and J. Sullivan. One millisecond face alignment
with an ensemble of regression trees. 2014 IEEE Conference
on Computer Vision and Pattern Recognition, Columbus,
OH, 2014, pp. 1867–1874.
[26] M. P. Tarvainen, P. O. Ranta-aho, and P. A. Karjalainen. An
advanced detrending method with application to HRV
analysis. IEEE Transactions on Biomedical EngineerinG,
49(2):172–175, 2002.
1383

[27] J.-F. Cardoso. High-order contrasts for independent
component analysis. Neural Computing, 11:157–192, 1999.
[28] Task force of the European Society of Cardiology and the
North American Society of Pacing and Electrophysiology.
Heart rate variability—Standards of measurement,
physiological interpretation, and clinical use. Circulation,
93(5):1043–1065, 1996.
[29] N. V. Chawla, K. W. Bowyer, L. O. Hall, and W. P.
Kegelmeyer. SMOTE: Synthetic minority over-sampling
technique. Journal of Artificial Intelligence Research,
16:321–357, 2002.
[30] M. Robnik-Sikonja and I. Kononenko. Theoretical and
empirical analysis of ReliefF and RReliefF. Machine
Learning, 53:23–69, 2003.
1384