advertising media and the green environmental aspect
TRANSCRIPT

1
Advertising Media and the Green Environmental Aspect Consumers’ attitudes versus marketing managers’ beliefs about consumers
Claudia A. Rademaker
Stockholm School of Economics, Center for Media and Economic Psychology,
Box 6501, SE-113 83, Stockholm, SWEDEN,
E-mail: [email protected]
ABSTRACT Previous research has shown that consumer trust in advertising is low and continues to diminish. Researchers
have also found that a big share of advertising investments is placed in less favorable media which can
contribute to consumers’ increasing disbelief towards advertising. The results of the present study add to these
previous findings by showing that the consumers’ trust levels in advertising vary among the 11 different media
studied and that the marketing managers’ beliefs about consumers are not consistent with the consumers’
attitudes toward and usage of advertising media. Ignoring this phenomenon may have consequences for
companies investing in less favorable media and thereby adding to consumers’ increasing disbelief towards
advertising.
The greatest discrepancy was found for ads on TV. The marketing managers seem to believe incorrectly that ads
on TV are not only more trusted but also more used by consumers than the consumers claim. The consumers
were found to have more negative attitudes toward TV advertising than what the marketing managers believe
about consumers. TV is also perceived by the consumers as more harmful for the green environment than the
marketing managers believe about consumers.
The results show that the consumers have more positive attitudes toward direct mail than the marketing
managers believe about them. The consumers perceive direct mail as better, less irritating and less harmful for
the environment compared to the marketing managers’ beliefs about them. In addition, the consumers claim to
make more use of ads in many of the paper-based media than TV advertising when they want to buy different
products. This was found to be not consistent with the marketing managers’ beliefs about consumers. The
consumers were found to have more negative attitudes toward advertising through the mobile phone than the
marketing managers believe about consumers. Advertising through the mobile phone is considered by the
consumers as one of the worst, most irritating and least trusted medium among the 11 advertising media studied.
Moreover, the consumers consider the mobile phone to be more harmful for the green environment compared to
the marketing managers’ beliefs about consumers.
The results also show that the marketing managers feel more personal responsible towards caring for the green
environment than the consumers. In addition, both the marketing managers and the consumers were found to
have equally high demands and expectations of organizations to act responsibly toward the green environment.
This contradicts previous findings that showed that the green environmental aspect is among the factors that are
the least considered when marketing managers work with marketing communication in general and advertising
media selection in particular. Furthermore, this study found that green environmental responsibility attitude
(GERA) is weakly related to the perception on the green environmental aspect of advertising media. Thus, the
discrepancies found in this study between the consumers and marketing managers regarding their green
environmental perceptions on the 11 different advertising media should be explained by other factors.
Keywords: Advertising Media, Attitudes, Consumers, Marketing Managers, Green Environmental
Responsibility Attitude (GERA)
SSE/EFI Working Paper Series in Business Administration No 2011: 8
December, 2011

Rademaker, Advertising Media and the Green Environmental Aspect
2
Acknowledgments
Financial support from the Swedish Governmental Agency for Innovation Systems
(VINNOVA) is gratefully acknowledged. Assistance and support from The Center for Media
and Economic Psychology at Stockholm School of Economics (SSE), Stockholm Institute of
Communication Science (STICS), the Association of Swedish Advertisers and its members
are also greatly appreciated. Special thanks to Professor Richard Wahlund at the Stockholm
School of Economics (SSE).

Rademaker, Advertising Media and the Green Environmental Aspect
3
Table of Contents
1. INTRODUCTION ............................................................................................................................. 5
1.1 Attitudes toward Advertising Media ............................................................................................. 7
1.2 Green Environmental Responsibility Attitude .............................................................................. 9
1.3 Frequently used Abbreviations .................................................................................................... 10
2. METHOD ......................................................................................................................................... 11
2.1 The Consumer Survey ................................................................................................................. 11
2.1.1 Target sample ....................................................................................................................... 11
2.1.2 Data collection ...................................................................................................................... 11
2.2 The Marketing Manager Survey .................................................................................................. 12
2.2.1 Target sample ....................................................................................................................... 12
2.2.2 Data collection ...................................................................................................................... 12
2.3 Measures ...................................................................................................................................... 14
2.3.1 The advertising media to be studied ..................................................................................... 14
2.3.2 Attitudes toward advertising media ...................................................................................... 15
2.3.3 Advertising media usage ...................................................................................................... 16
2.3.4 Green environmental responsibility attitude......................................................................... 16
3. ANALYSIS AND RESULTS .......................................................................................................... 18
3.1 Attitudes toward Advertising Media ........................................................................................... 18
3.1.1 Advertising medium – bad/good .......................................................................................... 19
3.1.2 Advertising medium – irritating ........................................................................................... 21
3.1.3 Advertising medium - trust ................................................................................................... 24
3.1.4 Advertising medium – harmful for the environment ............................................................ 26
3.3 Advertising Media Usage ............................................................................................................ 29
3.3.1 Groceries .............................................................................................................................. 30
3.3.2 Home electronics .................................................................................................................. 32
3.4 Green Environmental Responsibility Attitude (GERA) .............................................................. 35
3.4.1 Personal GERA .................................................................................................................... 37
3.4.2 Organizational GERA .......................................................................................................... 37
4. CONCLUSIONS .............................................................................................................................. 40
Advertising media attitudes and usage .............................................................................................. 40
Green environmental responsibility attitude (GERA) ....................................................................... 42
5. FUTURE RESEARCH ................................................................................................................... 44
References ............................................................................................................................................ 45
Tables
Table 1: Sample characteristics of the consumer survey………………………………………………12
Table 2: Sample characteristics of the marketer survey……………………………………………….13
Table 3: Attitudes toward advertising in general………………………………………………………18
Table 4: Advertising media – bad/good………………………………………………………………..20
Table 5: Advertising media – irritating………………………………………………...........................23
Table 6: Advertising media – trust…………………………………………………………………….25
Table 7: Advertising media – harmful for the environment…………………………………………...28

Rademaker, Advertising Media and the Green Environmental Aspect
4
Table 8: Summary of attitudes toward advertising media……………………………………………..29
Table 9: Advertising media usage – groceries…………………………………………………………31
Table 10: Advertising media usage – home electronics……………………………………………….34
Table 11: Green environmental responsibility attitude (GERA)………………………………………39
Figures
Figure 1: Advertising media – bad/good………………………………………………………………21
Figure 2: Advertising media – irritating……………………………………………………………….23
Figure 3: Advertising media – trust……………………………………………………………………26
Figure 4: Advertising media – harmful for the environment…………………………………………..29
Figure 5: Advertising media usage for buying groceries………………………....................................32
Figure 6: Advertising media usage for buying home electronics……………………………………...35

Rademaker, Advertising Media and the Green Environmental Aspect
5
1. INTRODUCTION Advertising media selection is becoming increasingly intricate as continuous technological
developments has led to more media options being available and thereby changing habits of
media consumption (Percy and Elliot, 2005; Rademaker, 2011b; Turk and Katz, 1992).
Marketing managers are further challenged by a highly competitive communication
environment where message competition exists in marketing communication (Rosengren,
2008).
Because of our changing lifestyles, demographics and family life-cycle stages, postulations
about how effective each advertising medium and media mix respectively is, can be
challenged. According to Callius (2008) twenty two percent of Swedes actively avoid
advertising in all traditional media. This does not mean that advertising has no effect.
However it requires higher demands of marketing managers. A big share of advertising is
placed in less favorable media. This could be seen as a waste of marketing resources as well
as a contribution to consumers’ increasing skepticism towards advertising. (Callius, 2008)
Edelman (2009) states that with consumers becoming less trustful of all sources of
information about companies, trust in business has never been as low and continues to
diminish, including trust in advertising. This is in line with prior research that showed that in
general, consumers tend not to pay much attention to ads (Dahlén and Edenius, 2007; Pham
and Johar, 1997).
According to Creamer and Klaassen (2007), consumers can be exposed between a range of
254 and 5 000 advertising messages per day. At the same time as advertising can bring
pleasure and enjoyment previous research have found that it can also evoke opposing feelings
such as irritation (Coulter et al., 2001; Shavitt et al., 1998; Calfee and Ringold, 1994; Pollay
and Mittal, 1993). Other studies have found that irritation among consumers can be caused
also by being exposed to many different types of advertising messages (e.g. Dunér and
Jönsson, 2007; Ha, 1996). The level of irritation has been found to be higher when media

Rademaker, Advertising Media and the Green Environmental Aspect
6
consumption is disrupted by advertising. For example, studies have shown that Swedes are
more positive towards advertising in newspapers as opposed to advertising on TV whereas
many as 18 ads could be included during one commercial break (Grusell, 2006; 2008).
Researchers have also found that consumers perceive advertising as something “bad”, and
that they often tend to associate advertising with negative aspects rather than positive ones
(Nordström, 2000; Sternvik, 2003; Larsson, 2004; Larsson, 2005). One reason given for this
negativity is that advertising is a communication form that is usually perceived as aiming to
influence consumers. As a consequence, advertising is viewed upon with skepticism.
Furthermore, it has been found that advertising is perceived differently depending on which
medium is used. Considering the many different advertising media that are available and used
today, it could be inferred that consumers’ association to advertising is multifaceted (Grusell,
2007).
Since consumers’ attitudes toward different media may impact the effects on the target
audience, it is important for marketing managers to have updated knowledge of consumer
media attitudes. Building on and extending prior research, the objective of the present study is
to investigate whether marketing managers’ beliefs about consumers are consistent with
consumers’ attitudes toward advertising media. A special focus of this study is to investigate
to what extent different advertising media are perceived to be harmful for the green
environment and to what extent marketing managers’ beliefs about consumers are consistent
with these perceptions.
Furthermore, the present study aims to explore to what extent consumers make use of
different advertising media when they want to buy products, and to compare this to marketing
managers’ beliefs about consumers. Investigating attitudes toward green environmental
responsibility may aid in further explaining the findings of the study. The results of this study
may contribute to a deeper understanding of consumers’ advertising media perceptions and

Rademaker, Advertising Media and the Green Environmental Aspect
7
usage. Possible discrepancies found will aid marketing managers to select advertising media
more effectively, i.e. more consistent with consumers’ perceptions and usage of advertising
media.
1.1 Attitudes toward Advertising Media
It has been found that different advertising media can generate different communication
effects. This is the case even when the same advertisements are used towards the same target
audience (Nilsson, 2006; Nowland et al, 1962; Politz, 1962).
McLuhan (1964, p. 203) introduced the well known phrase “the medium is the message”
by which he meant that the form of a medium embeds itself in the message. This in turn
creates a symbiotic relationship whereby the medium impacts how the message is perceived.
In order to reach out to its target market(s) companies are thus challenged to be on the
forefront of consumer media habits. The time has passed when consumers could be easily
identified based on merely segmentation variables such as values, opinions, motivation and
attitudes. Nor can merely using traditional advertising media be used in order to reach and
influence consumers (Bezjian-Avery et al., 1998).
The tendency to avoid ads in a medium is related to beliefs and perceptions about them
(Speck and Elliot, 1997). Consumers’ negative attitudes toward advertising can create major
challenges for marketing managers. Prior research has found that consumers with negative
attitudes toward advertising tend to make efforts and choices against ads. For example,
Grusell (2006) showed that 16 percent of Swedish households have a “No Advertising Please”
sign on their mailboxes while another 16 percent were considering such a sign (Grusell,
2006).
A later study by YouGov (2009) concerning consumers’ attitudes toward advertising
media found that about 25 percent of Swedish households have a “No Advertising Please”

Rademaker, Advertising Media and the Green Environmental Aspect
8
sign on their mail boxes. A major reason for this behavior given by the respondents was
increased environmental concerns.
Another similar example that has received much attention in the press is the findings of a
survey showing that 39 percent of Copenhagen’s households have a sign on their doors stating
“Advertising, no thank you”. This has led to an environmental movement urging the
remaining 61 percent of Copenhagen’s households to stop consuming direct mail in paper
form and instead to increase the use of ads through the Internet, for the sake of preserving the
green environment (Andersson, 2011). These findings indicate that the green environmental
aspect affects consumer media usage by showing that paper-based media (for example direct
mail) tend to be regarded by consumers as media that are less eco-friendly than electronic
media (for example media using the Internet). With this in mind, consumers’ perceptions on
how harmful for the environment different advertising media are could be further questioned.
In contrast, recent studies have indicated that green environmental issues are among the
factors that are considered the least by Swedish marketing managers when they select media
for marketing communication purposes (Rademaker, 2011a; 2011b). When taking into
account the changing media behavior of consumers because of continuous media
developments as well as consumers’ increasing awareness of environmental issues1, it should
be important for managers to have knowledge of consumers’ attitudes toward advertising
media to aid them in selecting media more effectively.
Marketing managers often cooperate with market research agencies (Rademaker, 2011a) to
provide statistics on advertising media distribution, i.e. reach and frequency. While these
statistics could be helpful for the marketing manager to obtain an overall impression of the
number of prospects that should be exposed to the company’s message at least once (reach)
1 Since the 1970’s consumers’ awareness of environmental issues has increased (Alwitt and Pitts, 1996; Loureiro
et al, 2001) which has led to the green revolution with the aim to put a stop to further damage to the environment
(Vaccaro, 2009). Consequently, consumers today are increasingly behaving environmentally responsible and are
thereby more and more opting for eco-friendly products (Dubey, 2008; D’Souza, 2004; Loureiro et al, 2001).
Rademaker, Advertising Media and the Green Environmental Aspect
9
and the number of times that the prospects are exposed to the message in a specified period
(frequency), they do not give information about consumers’ attitudes on advertising media.
Thus, the first research question is:
RQ1: To what extent are marketing managers’ beliefs about consumers consistent with
consumers’ attitudes toward advertising media?
Statistics on reach and frequency do not provide information about to what extent
consumers make use of different advertising media when they want to buy products. It should
therefore also be of importance to marketing managers to have updated knowledge about the
extent to which consumers make use of advertising media. Consequently, the second research
question is:
RQ2: To what extent are marketing managers’ beliefs about consumers consistent with
consumers’ (claimed) usage of advertising media?
1.2 Green Environmental Responsibility Attitude
As previously mentioned, advertising media that are perceived to be harmful for the green
environment may increase the tendency of consumers to avoid ads in such media. Consumers’
attitude and use of advertising media may be affected by their attitude toward green
environmental responsibility, on both a personal and organizational level. In other words,
avoiding certain types of advertising media could be seen as consumers taking personal
responsibility to care for the environment. By doing so, consumers are in a way punishing the
organization for acting irresponsible towards the environment by boycotting its advertising
message that is carried by a medium that consumers perceive to be harmful for the
environment. Thus, assessing both consumers’ and marketing managers’ attitudes toward
green environmental responsibility ought to be measured.
When searching the literature, it was found that green environmental responsibility attitude
seems to be closely linked to theory on socially responsible consumption behavior. Socially

Rademaker, Advertising Media and the Green Environmental Aspect
10
responsible consumption is defined as “those consumer behaviors and purchase decisions
which are related to environmental and resource-related problems and are motivated not only
by a desire to satisfy personal needs, but also by a concern for the welfare of society in
general (Antil, 1984, p. 35; Antil and Bennett, 1979, pp. 64-65).
By exploring beliefs about green environmental responsibility both consumers’ and
marketing managers’ attitudes toward personal and organizational responsibility for caring for
the green environment, will be assessed. The third research question is:
RQ3: To what extent is the green environmental responsibility attitude (GERA) of the
marketing manager consistent with that of the consumer and how does GERA relate to the
perception on how harmful for the green environment a specific advertising medium is?
1.3 Frequently used Abbreviations
The following abbreviations are used throughout the paper:
GERA Green environmentally responsible attitude
n.r. Non response
n.s. Non significant
M Mean
SD Standard Deviation
p Probability value2
t t-value
df Degrees of freedom
η2
Eta squared3
2 Based on two-tailed t-tests.
3 The values of the effect size are interpreted as proposed by Cohen 1988, pp. 284-287.

Rademaker, Advertising Media and the Green Environmental Aspect
11
2. METHOD
Two online surveys are designed: one directed to consumers and another to marketing
managers. The marketing manager survey comprises questions that are parallel to those in the
consumer survey. To maximize validity, the surveys were pre-tested and adjustments were
made in regards to certain formulations and re-wording of the questions.
2.1 The Consumer Survey
2.1.1 Target sample
The total sample (N = 2411) consists of consumers corresponding to the Swedish
population as to gender, age (20 – 64 years) and geographic location, randomly selected from
an Internet panel4.
2.1.2 Data collection
The consumer survey was conducted during July 2 – 6 2010. An invitation to the survey
was sent by e-mail to the sample. Of the total sample 80 percent (n = 1928) completed the
questionnaire. The non-response rate was 20 percent (n = 483). The sample comprised 49.25
percent female and 50.75 percent male. The sample corresponds well to the Swedish
population as to gender, age and geographic location (see Table 1 below).
4 The Internet panel was supplied by YouGov Sweden.

Rademaker, Advertising Media and the Green Environmental Aspect
12
Table 1: Sample characteristics of the consumer survey
Total N=1928 100%
Gender
Female 949 49.25%
Male 979 50.75%
Age
20-29 years 391 20.28%
30-39 years 443 22.99%
40-49 years 446 23.14%
50-54 years 648 33.59%
Region
North of Sweden 239 12.42%
North Central Sweden 345 17.88%
Stockholm 424 22.00%
South Central Sweden 579 30.01%
Skåne, Halland and Blekinge 341 17.68%
2.2 The Marketing Manager Survey
2.2.1 Target sample
The sample comprises all 499 members of the Association for Swedish Advertisers
(ASA)5. A main reason behind opting for the sample is that Swedish largest media buyers can
be found among these members. Consequently, their behavior has thus great consequences for
the Swedish media industry. A broad diversity of companies with various types of annual
media investments can also be found among the members of the ASA.
2.2.2 Data collection
A web survey among all the 499 members of the ASA was conducted using the software
Qualtrics during October 4 - 18, 2010. One week prior to the launch of the survey an
announcement was sent per email informing ASA’s members of the upcoming survey. On the
date of the survey launch, a link to the web survey was included in a message sent by e-mail
to all members of the ASA. Reminder e-mails were sent to non-respondents. The response
5 The members of ASA are most often marketing managers or managers with similar titles.

Rademaker, Advertising Media and the Green Environmental Aspect
13
rate was 39 percent (Table 2).
Table 2: Sample characteristics of the marketer survey
Sample Completed Partially Completed
N=193 (100%) 105 (54.4%) 88 (45.6%)
Gender
Female 54 (51%) n. r.
Male 51 (49%) n. r.
Age
20 – 29 years 2 (1.9%) n. r.
30 – 39 years 30 (28.6%) n. r.
40 – 49 years 45 (42.9%) n. r.
50 – 59 years 22 (21%) n. r.
60 – 65 years 6 (5.7%) n. r.
Business type
100% B2C 15 (14.2%) n. r.
10-30% B2C/70-90% B2B 29 (27.6%) n. r.
40-60% B2C/40-60% B2B 19 (18.1%) n. r.
70-90% B2C/10-30% B2B 16 (15.2%) n. r.
100% B2B 26 (24.8%) n. r.
Experience with media selection
2 – 3 years 8 (7.6%) n. r.
4 – 6 years 19 (18.1%) n. r.
7 – 9 years 6 (5.7%) n. r.
10 years and up 72 (68.6%) n. r.
Annual media investments
< 2 million SEK 23 (21.9%) n. r.
< 5 million SEK 12 (11.4%) n. r.
< 10 million SEK 19 (18.1%) n. r.
< 15 million SEK 10 (9.5%) n. r.
< 20 million SEK 8 (7.6%) n. r.
< 40 million SEK 14 (13.3%) n. r.
< 70 million SEK 7 (6.7%) n. r.
> 70 million SEK 12 (11.4%) n. r.
Employees
< 10 7 (6.7%) n. r.
11 – 50 15 (14.3%) n. r.
51 – 500 35 (33.3%) n. r.
501 – 1000 12 (11.4%) n. r.
1001 – 5000 15 (14.3%) n. r.
5001 – 10 000 5 (4.8%) n. r.
> 10 000 16 (15.2%) n. r.
Environmental Policy
Yes 85 (79.4%) n. r.
No 18 (16.8%) n. r.
Do not know 4 (3.7%) n. r.

Rademaker, Advertising Media and the Green Environmental Aspect
14
The partially completed surveys (88 respondents) were included in the study. The majority
of the respondents are professionals with more than ten years of experience of media
selection.
2.3 Measures
To measure consumers’ and marketing managers’ attitudes a sliding scale with the extreme
points 0 and 10 were used.
2.3.1 The advertising media to be studied
The selection of advertising media was based on previous studies such as Grusell’s (2007)
with the exception of three media types that were added for the present study namely, city
buses, catalogues and brochures, and in-store ads (posters). These three media in particular
were added because of its’ green environmental related characteristics, i.e. paper-based
(catalogues, brochures and in-store ads) and engine-driven vehicles (city buses). Thus, for this
study, the following 11 advertising media were selected to measure attitudes of advertising in
different media:
1. Newspapers and magazines
2. Mobile phones (SMS and MMS)
3. Outdoor
4. Radio
5. Direct mail (delivered through home postal box)
6. TV
7. Catalogues and brochures
8. City buses (the exterior of city buses)
9. Cinema advertising
10. Internet (media using the Internet)
11. In-store (posters)

Rademaker, Advertising Media and the Green Environmental Aspect
15
In the following, the dependent variables with the respective measures used are discussed.
2.3.2 Attitudes toward advertising media
To first assess consumers’ overall attitude towards advertising, consumers’ attitude
towards advertising in general were to be measured. Thereafter, consumers’ attitudes toward
advertising in the 11 different media were measured.
Consumers’ attitudes toward advertising in general were measured by the questions: “To
what extent do you think it is good or bad with advertising in general?” (adapted from Shavitt
et al., 1998) and “To what extent do you think it is good or bad with advertising that is
adjusted to your previous purchases?” (Scale: 0 = very bad, 10 = very good).
Marketing managers’ beliefs of consumers’ attitudes toward advertising in general were
measured by the questions: “In your opinion, to what extent do consumers think it is good or
bad with advertising in general?” and “In your opinion, how good or bad do consumers think
of ads that are adjusted to their previous purchases?” (Scale: 0 = very bad, 10 = very good).
Consumers’ attitudes toward advertising media were measured by the following questions:
“To what extent do you think it is good or bad with advertising in the following media?”
(Scale: 0 = very bad, 5 = neither bad/good, 10 = very good), “To what extent do you think it is
irritating with advertising in the following media?” (Scale: 0 = not at all irritating, 10 = to a
very great extent irritating), “To what extent do you trust advertising in the following media?”
(Scale: 0 = do not trust at all, 10 = trust to a very great extent), and “To what extent do you
think that the following media are harmful for the environment?” (Scale: 0 = not at all
harmful, 10 = to a very great extent harmful).
Marketing managers’ beliefs of consumers’ attitudes toward advertising media were
measured by the following questions: “In your opinion, to what extent do consumers perceive
it is good or bad with advertising in the following media?” (Scale: 0 = very bad, 5 = neither
bad/good, 10 = very good), “In your opinion, to what extent do consumers perceive it is

Rademaker, Advertising Media and the Green Environmental Aspect
16
irritating with advertising in the following media?” (Scale: 0 = not at all irritating, 10 = to a
very great extent irritating), “In your opinion, to what extent do consumers trust advertising in
the following media?” (Scale: 0 = do not trust at all, 10 = trust to a very great extent) and, “In
your opinion, to what extent do consumers perceive the following media to be harmful for the
environment?” (Scale: 0 = not at all harmful, 10 = to a very great extent harmful).
2.3.3 Advertising media usage
Consumers’ use of advertising media was measured for two different types of products,
namely for groceries and household electronics such as a printer.
Consumers’ use of advertising media was measured using the following questions: “To
what extent do you make use of ads in the following media when you want to buy groceries?”
and “To what extent do you make use of ads in the following media when you want to buy
electronics such as a printer?” (Scale: 0 = never/not at all, 10 = to a very great extent).
Marketing managers’ beliefs of consumers’ use of advertising media for the two different
product types mentioned above, was measured using the following questions: “In your
opinion, to what extent do consumers make use of ads in the following media when they want
to buy groceries?” and “In your opinion, to what extent do consumers make use of ads in the
following media when they want to buy electronics such as a printer?” (Scale: 0 = never/not at
all, 10 = to a very great extent).
2.3.4 Green environmental responsibility attitude
Consumers’ and marketing managers’ attitudes toward green environmental responsibility
were measured using the following items, inspired by Antil et al. (1979) and Antil (1984): “I
am very concerned about the environmental situation of today”, “I do everything I can in my
everyday life in order not to contribute to harm the environment”, “In order to preserve the
environment I print out paper as little as possible”, “I will stop buying products from
companies that are guilty of harming the environment even if it would create discomfort for

Rademaker, Advertising Media and the Green Environmental Aspect
17
me”, “I am very precise with paper being sorted and recycled”, “I don’t think that there are
any serious environmental problems today”, “Companies have a big responsibility not to harm
the environment”, Companies should do everything they can not to harm the environment”,
“To care for the environment is the responsibility of the government and the parliament” and
“The parliament should impose stricter laws for harming the environment” (Scale: 0 =
completely disagree, 10 = completely agree).

Rademaker, Advertising Media and the Green Environmental Aspect
18
3. ANALYSIS AND RESULTS
Independent samples t-tests (two-tailed) were conducted to compare scores of the
consumers’ attitudes and the marketing managers’ beliefs about consumers.
3.1 Attitudes toward Advertising Media
The first research question was:
RQ1: To what extent are marketing managers’ beliefs about consumers consistent with
consumers’ attitudes toward advertising media?
First, consumers’ attitudes toward advertising in general were measured between the two
groups. The results show significant differences (p < 0.05) between the consumers’ attitudes
toward advertising in general and marketing managers’ beliefs about consumers (Table 3).
Compared to the marketing managers’ beliefs about consumers, the consumers were found to
have more negative attitudes toward advertising in general as well as towards ads that are
adjusted to their previous purchases.
The results show that the consumers view advertising in general as slightly more bad than
good (M = 4.62, SD = 2.36) while the marketing managers believe that consumers view
advertising in general to be more good (M = 5.54, SD = 1.74; t = -5.70, p < .001, small η2
=
.02). The results also indicate that the consumers (M = 5.02, SD = 2.70) do not view
advertising that are adjusted to their previous purchases as good as what the marketing
managers believe about consumers (M = 6.78, SD = 1.83; t = -9.33, p < .001, small η2
= .04).
Table 3: Attitudes toward advertising in general – bad/good
Ads in general
Consumers Managers n=1928 n=132
M M (SD) (SD)
t
(df)
P
η
2
Ads adjusted to previous purchases Consumers Managers
n=1928 n=107 M M (SD) (SD)
t
(df)
P
η
2
4.62 (2.36)
5.54*** (1.74)
-5.70 (166)
<.001 .02 5.02 (2.70)
6.78*** (1.83)
-9.33 (133)
<.001 .04
Note: ***: p < 0.001

Rademaker, Advertising Media and the Green Environmental Aspect
19
Significant differences were also found between the consumers’ attitudes toward
advertising media and marketing managers’ beliefs about consumers. These are discussed
hereafter.
3.1.1 Advertising medium – bad/good
In relation to the bad/good variable, the consumers do not seem to perceive advertising in
the following media as good as what the marketing managers believe about consumers:
- Newspapers and magazines (consumers: M = 6.05, SD = 2.18 vs. managers: M = 6.86, SD =
1.56; t = -5.54, p < .001, small η2 = .02)
- Mobile phones (consumers: M = 1.77, SD = 2.16 vs. managers: M = 3.39, SD = 2.41; t =
-7.40, p < .001, small η2 = .03)
- Outdoor (consumers: M = 5.82, SD = 2.23 vs. managers: 6.42, SD = 1.84; t = -3.54, p <
.001, small η2 = .01)
- Radio (consumers: M = 3.48, SD = 2.44 vs. managers: M = 4.86, SD = 2.27; t = -6.23, p <
.001, small η2 = .02)
- TV (consumers: M = 3.43, SD = 2.55 vs. managers: M = 5.16, SD = 2.01; t = -9.23, p <
.001, small η2 = .04)
- Cinema (consumers: M = 5.70, SD = 2.46 vs. managers: M = 7.07, SD = 1.95; t = -7.57, p <
.001, small η2 = .03)
- Internet (consumers: M = 4.50, SD = 2.42 vs. managers: M = 5.64, SD = 2.07; t = -5.98, p <
.001, small η2 = .02)
These results thus indicate that the marketing managers believe incorrectly that consumers
view advertising in these media to be better than consumers actually do.
Worth mentioning, at a significance level of p < .10, the consumers seem to view
advertising through direct mail to some extent better compared to what the marketing
managers believe about consumers (consumers: M = 4.76, SD = 3.04 vs. managers: M = 4.34,

Rademaker, Advertising Media and the Green Environmental Aspect
20
SD = 2.38; t = 1.91, p = .058, small η2 = .002).
No significant difference between the two groups was found on attitudes toward
advertising in catalogues and brochures, and in-store. This finding indicates that the
marketing managers’ beliefs about consumers are consistent with the consumers’ attitudes
toward advertising in these media. Table 4 below presents the results of these findings.
Table 4: Attitudes on advertising media – bad/good
Medium
Bad/Good Consumers Managers n=1928 n=128 M M (SD) (SD)
t (df)
P
η2
Newspapers and magazines 6.05 (2.18)
6.86*** (1.56)
-5.54 (162)
<.001 .02
Mobile phones 1.77 (2.16)
3.39*** (2.41)
-7.40 (141)
<.001 .03
Outdoor 5.82 (2.23)
6.42*** (1.84)
-3.54 (153)
.001 .01
Radio 3.48 (2.44)
4.86*** (2.27)
-6.23 (2054)
<.001 .02
Direct mail 4.76 (3.04)
4.34* (2.38)
1.91 (156)
.058 <.01
TV 3.43 (2.55)
5.16*** (2.01)
-9.23 (155)
<.001 .04
Catalogues and brochures 6.09 (2.28)
6.07 (1.99)
n.s.
City buses 6.19 (2.37)
5.97 (1.75)
n.s.
Cinema 5.70 (2.46)
7.07*** (1.95)
-7.57 (155)
<.001 .03
Internet 4.50 (2.42)
5.64*** (2.07)
-5.98 (151)
<.001 .02
In-store 6.70 (2.15)
6.57 (2.31)
n.s.
Note: ***: p < 0.001; *: p < 0.10

Rademaker, Advertising Media and the Green Environmental Aspect
21
From Table 4 and Figure 1 it can be further observed that cinema scored the highest among
marketing managers (M = 7.07, SD = 1.95) which is not consistent with the consumers’
attitudes (M = 5.70, SD = 2.46). This thus indicate that the marketing managers believe that
cinema advertising is perceived by consumers to be the best among the 11 media studied here
while the consumers perceive advertising in this medium not to be as good.
Advertising through the mobile phone scored the lowest among both groups and thus
seems to be the worst medium as perceived by both the consumers (M = 1.77, SD = 2.16) and
marketing managers’ beliefs about consumers (M = 3.39, SD = 2.41). Figure 1 provides an
illustration of the findings on the bad/good variable.
Figure 1: Advertising media – bad/good
3.1.2 Advertising medium – irritating
Significant differences (p < .05) were found between consumers’ attitudes and marketing
managers’ beliefs about consumers on the irritating variable (see Table 5). The results
indicate that consumers view advertising in the following media to be more irritating
compared to marketing managers’ beliefs about consumers:
- Newspapers and magazines (consumers: M = 3.52, SD = 2.33 vs. marketers: M = 3.00, SD =
1.74; t = 3.18, p = .002, small η2 = .01)
0123456789
10
In-s
tore
City b
use
s
Cata
log
ue
sB
roch
ure
s
Ne
wspa
pers
Ma
ga
zin
es
Ou
tdoo
r
Cin
em
a
DM
Inte
rnet
Rad
io
TV
Mo
bile
pho
ne
s
Consumers
Managers

Rademaker, Advertising Media and the Green Environmental Aspect
22
- Mobile phones (consumers: M = 8.04, SD = 2.69 vs. managers: M = 7.36, SD = 2.30; t =
2.77, p = .006, small η2 = .004)
- Outdoor (consumers: M = 3.13, SD = 2.43 vs. managers: M = 2.78, SD = 1.81; t = 2.09, p =
.038, small η2 = .002)
- Radio (consumers: M = 6.74, SD = 2.71 vs. managers: M = 5.60, SD = 2.05; t = 5.92, p <
.001, small η2 = .02)
- TV (consumers: M = 7.40, SD = 2.54 vs. managers: M = 6.30, SD = 2.28; t = 5.21, p < .001,
small η2 = .01)
- Cinema (consumers: M = 3.77, SD = 2.74 vs. managers: M = 2.84, SD = 2.31; t = 3.71, p <
.001, small η2 = .01)
- Internet (consumers: M = 5.65, SD = 2.69 vs. managers: M = 5.08, SD = 2.13; t = 2.85, p =
.005, small η2 = .004).
The findings also indicate that consumers view direct mail less irritating (M = 4.78, SD =
3.23) compared to marketing managers’ beliefs about consumers (M = 5.80, SD = 2.15; t = -
4.97, p < .001, small η2 = .01).
Table 5 and Figure 2 below give an illustration of these findings. It can be observed that
advertising through the mobile phone scored the highest on the irritating variable among both
groups. This thus indicates that marketing managers’ beliefs about consumers are consistent
with the view that advertising through mobile phones are most irritating among the 11 media
studied here. However, marketing managers’ beliefs do not seem to be consistent with the
extent to which consumers view these two media as irritating. Among the media where
significant differences were found between the two groups, outdoor scored the lowest and
thus seems to be among the media that are perceived to be least irritating.

Rademaker, Advertising Media and the Green Environmental Aspect
23
Table 5: Advertising media – irritating
Irritating
Medium
Consumers n=1928
M (SD)
Managers n=126
M (SD)
t
(df)
P
η
2
Newspapers and magazines 3.52 (2.33)
3.00*** (1.74)
3.18 (156)
.002 .01
Mobile phones
8.04 (2.69)
7.36*** (2.30)
2.77 (2052)
.006 <.01
Outdoor 3.13 (2.43)
2.78*** (1.81)
2.09 (156)
.039 <.01
Radio 6.74 (2.71)
5.60*** (2.05)
5.92 (155)
<.001 .02
Direct mail 4.78 (3.23)
5.80*** (2.15)
-4.97 (164)
<.001 .01
TV 7.40 (2.54)
6.30*** (2.28)
5.21 (146)
<.001 .01
Catalogues and brochures 3.20 (2.30)
3.27 (1.99)
n.s.
City buses 2.56 (2.42)
2.82 (2.01)
n.s.
Cinema 3.77 (2.74)
2.84*** (2.31)
3.71 (2052)
<.001 .01
Internet 5.65 (2.69)
5.08*** (2.13)
2.85 (152)
.005 <.01
In-store 2.58 (2.25)
2.69 (2.17)
n.s.
Note: ***: p < 0.001
Figure 2: Advertising media – irritating
0123456789
10
Mo
bile
pho
ne
s
TV
Rad
io
Inte
rnet
DM
Cin
em
a
New
spa
pers
Ma
ga
zin
es
Ca
talo
gue
sB
roch
ure
s
Ou
tdoo
r
In-s
tore
City b
use
s
Consumers
Managers

Rademaker, Advertising Media and the Green Environmental Aspect
24
3.1.3 Advertising medium - trust
The findings show significant differences (p < .05) between consumers’ attitudes and
marketing managers’ beliefs about consumers on the trust variable for all 11 advertising
media. Regardless of the medium used, consumers do not trust advertising as much as
marketing managers believe about consumers. The following differences between consumers’
attitudes and marketing managers’ beliefs about consumers on the trust variable were found:
- Newspapers and magazines (consumers: M = 4.22, SD = 2.44 vs. managers: M = 6.22, SD =
1.80; t = -11.31, p < .001, moderate η2 = .06)
- Mobile phones (consumers: M = 2.35; SD = 2.31 vs. managers: 3.63, SD = 2.10; t = -6.32, p
< .001, small η2 = .02)
- Outdoor (consumers: M = 3.87, SD = 2.33 vs. managers: M = 5.37, SD = 1.56 (m); t = -9.70,
p < .001, small η2 = .04)
- Radio (consumers: M = 3.27, SD = 2.35 vs. managers: M = 4.54, SD = 1.67; t = -7.73, p <
.001, small η2 = .03)
- Direct mail (consumers: M = 4.49, SD = 2.75 vs. managers: M = 5.13, SD = 2.10; t =
-3.14, p = .002, small η2 = .01)
- TV (consumers: M = 3.50, SD = 2.38 vs. managers: M = 5.57, SD = 1.85; t = -11.43, p <
.001, moderate η2 = .06)
- Catalogues and brochures (consumers: M = 4.18, SD = 2.39 vs. managers: M = 5.97, SD =
1.82; t = -10.04, p < .001, small η2 = .05)
- City buses (consumers: M = 3.89, SD = 2.37 vs. managers: M = 5.11, SD = 1.60; t = -7.73, p
< .001, small η2 = .03)
- Cinema (consumers: M = 3.80, SD = 2.35 vs. managers: M = 5.62, SD = 1.64; t = -11.25, p
< .001, moderate η2 = .06)
- Internet (consumers: M = 2.91, SD = 2.28 vs. managers: M = 4.93, SD = 1.95; t = -10.69, p
< .001, small η2 = .05)

Rademaker, Advertising Media and the Green Environmental Aspect
25
- In-store advertising (consumers: M = 4.82, SD = 2.68 vs. managers: M = 6.53, SD = 1.99; t
= -8.79, p < .001, small η2 = .04). Table 6 and Figure 3 below present the results of these
findings.
Table 6: Advertising media – trust
Medium
Trust Consumers Managers N=1928 N=115 M M (SD) (SD)
t (df)
P
η2
Newspapers and magazines 4.22 (2.44)
6.22*** (1.80)
-11.31 (140)
<.001 .06
Mobile phones
2.35 (2.31)
3.63*** (2.10)
-6.32 (131)
<.001 .02
Outdoor 3.87 (2.33)
5.37*** (1.56)
-9.70 (146)
<.001 .04
Radio 3.27 (2.35)
4.54*** (1.67)
-7.73 (142)
<.001 .03
Direct mail 4.49 (2.75)
5.13*** (2.10)
-3.14 (138)
.002 .01
TV 3.50 (2.38)
5.57*** (1.85)
-11.43 (138)
<.001 .06
Catalogues and brochures 4.18 (2.39)
5.97*** (1.82)
-10.04 (138)
<.001 .05
City buses 3.89 (2.37)
5.11*** (1.60)
-7.73 (146)
<.001 .03
Cinema 3.80 (2.35)
5.62*** (1.64)
-11.25 (144)
<.001 .06
Internet 2.91 (2.28)
4.93*** (1.95)
-10.69 (133)
<.001 .05
In-store 4.82 (2.68)
6.53*** (1.99)
-8.79 (140)
<.001 .04
Note: ***: p < 0.001
From Figure 3 it can be observed that in-store advertising scored the highest on the trust
variable among both the consumers’ attitudes and the marketing managers’ beliefs about
consumers. Another medium that scored among the highest by consumers is direct mail which

Rademaker, Advertising Media and the Green Environmental Aspect
26
was not found to be consistent with marketing managers’ beliefs about consumers.
Furthermore, the mobile phone scored the lowest on this variable among both groups and thus
seems to be the least trusted advertising medium among the 11 media studied.
Figure 3: Advertising media – trust
3.1.4 Advertising medium – harmful for the environment
Significant differences (p < .05) on the harmful for the environment variable between the
two groups were found (Table 7). Compared to marketing managers’ beliefs about consumers,
consumers view advertising in the following media to be more harmful for the environment:
- Newspapers and magazines (consumers: M = 5.68, SD = 2.62 vs. managers: M = 4.97, SD =
2.38; t = 2.86, p = .004, small η2= .004)
- Mobile phones (consumers: M = 2.49, SD = 2.66 vs. managers: M = 1.46, SD = 1.76 (m); t
= 5.92, p < .001, small η2 = .02)
- Outdoor (consumers: M = 4.68, SD = 2.60 vs. managers: M = 4.26, SD = 2.16; t = 2.03, p =
.045, small η2 = .002)
- Radio (consumers: M = 2.04, SD = 2.26 vs. managers: M = 1.53, SD = 1.91; t = 2.79, p =
.006, small η2 = .004)
- TV (consumers: M = 2.58, SD = 2.47 vs. managers: M = 2.17, SD = 2.09; t = 2.01, p = .046,
small η2 = .002)
0123456789
10
In-s
tore
DM
Ne
wspa
pers
Ma
ga
zin
es
Ca
talo
gue
sB
roch
ure
s
City b
use
s
Ou
tdoo
r
Cin
em
a
TV
Ra
dio
Inte
rnet
Mo
bile
pho
ne
s
Consumers
Managers

Rademaker, Advertising Media and the Green Environmental Aspect
27
- Cinema (consumers: M = 2.14, SD = 2.18 vs. managers: M = 1.71, SD = 1.88; t = 2.07, p =
.038, small η2 = .002)
- Internet (consumers: M = 2.08, SD = 2.24 vs. managers: M = 1.54, SD = 1.95, t = 2.55, p =
.011, small η2 = .003)
On the other hand, when comparing to marketing managers’ beliefs about consumers,
consumers perceive advertising in the following media to be less harmful for the environment:
- Direct mail (consumers: M = 7.28, SD = 2.63 vs. managers: M = 7.99, SD = 1.91; t =
-3.81, p < .001, small η2 = .01)
- Catalogues and brochures (consumers: M = 6.31, SD = 2.62 vs. managers: M = 6.91, SD =
2.07; t = -2.97, p = .004, small η2 = .004)
- In-store posters (consumers: M = 4.18, SD = 2.55 vs. managers: M = 4.81, SD = 2.27; t =
-2.92, p = .004, small η2 = .004)
These last mentioned media can be categorized as paper-based advertising media as this
was clarified to respondents in the surveys. Consumers seem to consider these media to be
less harmful for the environment compared to marketing managers’ beliefs about consumers.
From Figure 4 it can be observed that direct mail and, catalogues and brochures scored
among the highest on this variable among the consumers, which is consistent with the
marketing managers’ beliefs about consumers. Furthermore, radio obtained the lowest score
on this variable among the consumers which does not seem to be consistent with marketing
managers’ beliefs about consumers.

Rademaker, Advertising Media and the Green Environmental Aspect
28
Table 7: Advertising media - harmful for the environment
Medium
Harmful for the environment consumers managers n=1928 n=117 M M (SD) (SD)
t (df)
p
η2
Newspapers and magazines 5.68 (2.62)
4.97*** (2.38)
2.86 (2043)
.004 <.01
Mobile phones 2.49 (2.66)
1.46*** (1.76)
5.92 (150)
<.001 .02
Outdoor 4.68 (2.60)
4.26*** (2.16)
2.03 (137)
.045 <.01
Radio 2.04 (2.26)
1.53*** (1.91)
2.79 (136)
.006 <.01
Direct mail 7.28 (2.63)
7.99*** (1.91)
-3.81 (144)
<.001 .01
TV 2.58 (2.47)
2.17*** (2.09)
2.01 (137)
.046 <.01
Catalogues and brochures 6.31 (2.62)
6.91*** (2.07)
-2.97 (140)
.004 <.01
City buses 4.02 (2.71)
3.62* (2.33)
1.79 (136)
.074 <.01
Cinema 2.14 (2.18)
1.71*** (1.88)
2.07 (2043)
.038 <.01
Internet 2.08 (2.24)
1.54*** (1.95)
2.55 (2043)
.011 <.01
In-store 4.18 (2.55)
4.81*** (2.27)
-2.92 (134)
.004 <.01
Note: ***: p < 0.01; *: p < 0.10
Figure 4: Advertising media – harmful for the environment
0123456789
10
DM
Cata
logues
Bro
chure
s
New
spaper
sM
agazin
es
Outd
oor
In-s
tore
City b
uses
TV
Mo
bile
phones
Cin
em
a
Inte
rnet
Radio
Consumers
Managers

Rademaker, Advertising Media and the Green Environmental Aspect
29
In Table 8 below, a summary of the consistencies and inconsistencies found between
consumers’ attitudes and marketing managers’ beliefs about consumers on the 11 advertising
media is given.
Table 8: Summary of attitudes toward advertising media
Bad/Good
Irritating
Trust
Harmful for environment
Medium consumers managers consumers managers consumers managers consumers managers
Newspapers Magazines
- + + - - + + -
Mobile phones
- + + - - + + -
Outdoor - + + - - + + -
Radio - + + - - + + -
Direct mail + - - + - + - +
TV - + + - - + + -
Catalogues Brochures
= = = = - + + -
City buses = = = = - + + -
Cinema - + + - - + + -
Internet - + + - - + + -
In-store = = = = - + + -
Note: +) more, -) less, =) no significant difference in perception
3.3 Advertising Media Usage
The second research question was:
RQ2: To what extent are marketing managers’ beliefs about consumers consistent with
consumers’ (claimed) usage of advertising media?
For different product categories, i.e. groceries and home electronics such as a computer
printer, independent samples t-tests showed significant differences between marketing
managers’ beliefs about consumers and consumers’ reported use of advertising media.

Rademaker, Advertising Media and the Green Environmental Aspect
30
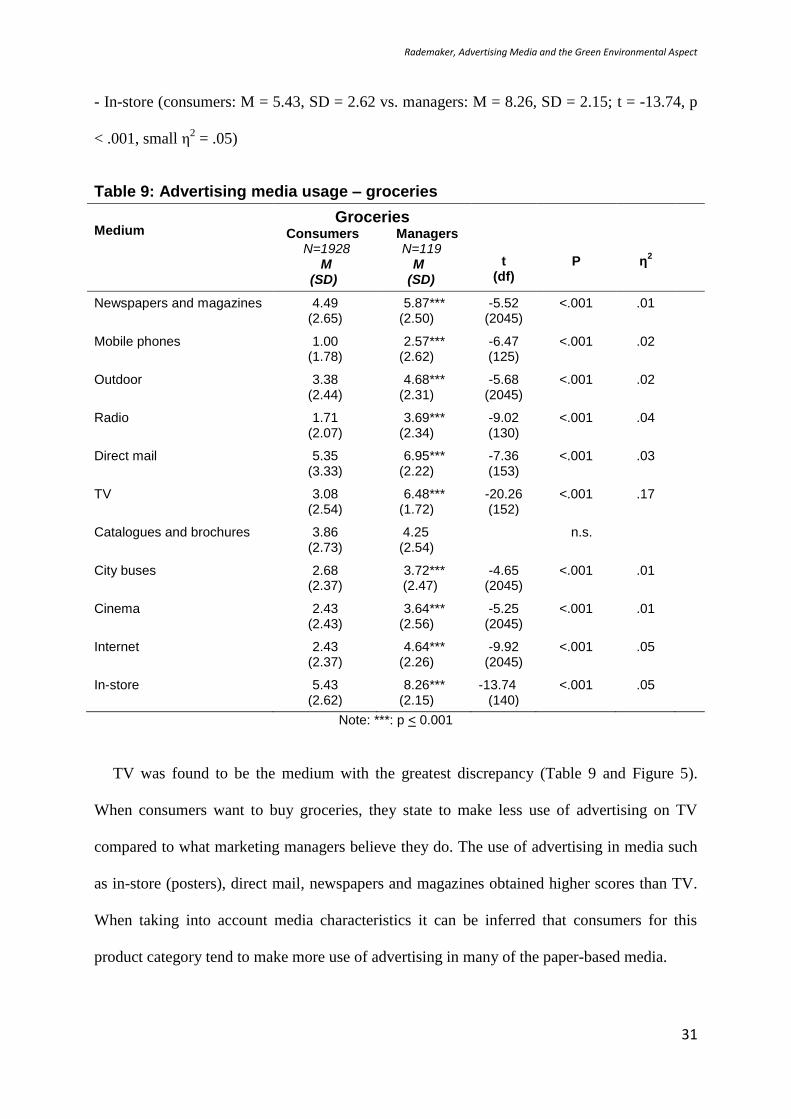
3.3.1 Groceries
Significant differences were found on advertising media usage for buying groceries
between the consumers and the marketing managers’ beliefs about consumers (Table 9). With
the exception of catalogues and brochures where no significant difference was found between
the two groups, the results indicate that the marketing managers believe consumers to make
significantly (p < .01) more use of all other media than what the consumers claim, namely:
- Newspapers and magazines (consumers: M= 4.49, SD = 2.65 vs. managers: M = 5.87, SD =
2.50; t = -5.52, p < .001, small η2 = .015)
- Mobile phones (consumers: M = 1.00, SD = 1.78 vs. managers: M = 2.57, SD = 2.62; t = -
6.47, p < 001, small η2 = .02)
- Outdoor (consumers: M = 3.38, SD = 2.44 vs. managers: M = 4.68, SD 2.31; t = -5.68, p <
.001, small η2= .02)
- Radio (consumers: M = 1.71, SD = 2.07 vs. managers: M = 3.69, SD = 2.34; t = -9.02, p <
.001, small η2 = .04)
- Direct mail (consumers: M = 5.35, SD = 3.33 vs. managers: M = 6.95, SD = 2.22; t = -7.36,
p < .001, small η2 = .03)
- TV (consumers: M = 3.08, SD = 2.54 vs. managers: M = 6.48, SD = 1.72; t = -20.26, p <
.001, large η2 = .17)
- City buses (consumers: M = 2.68, SD = 2.37 vs. managers: M = 3.72, SD = 2.47; t = -4.65, p
< .001, small η2 = .01)
- Cinema (consumers: M = 2.43, SD = 2.43 vs. managers: M = 3.64, SD = 2.56; t = -5.25, p <
.001, small η2 = .013)
- Internet (consumers: M = 2.43, SD = 2.37 vs. managers: M = 4.64, SD = 2.26; t = -9.92, p <
.001, small η2 = .05)
Rademaker, Advertising Media and the Green Environmental Aspect
31
- In-store (consumers: M = 5.43, SD = 2.62 vs. managers: M = 8.26, SD = 2.15; t = -13.74, p
< .001, small η2 = .05)
Table 9: Advertising media usage – groceries
Medium
Groceries Consumers Managers
N=1928 N=119 M M
(SD) (SD)
t
(df)
P
η
2
Newspapers and magazines 4.49 (2.65)
5.87*** (2.50)
-5.52 (2045)
<.001 .01
Mobile phones 1.00 (1.78)
2.57*** (2.62)
-6.47 (125)
<.001 .02
Outdoor 3.38 (2.44)
4.68*** (2.31)
-5.68 (2045)
<.001 .02
Radio 1.71 (2.07)
3.69*** (2.34)
-9.02 (130)
<.001 .04
Direct mail 5.35 (3.33)
6.95*** (2.22)
-7.36 (153)
<.001 .03
TV 3.08 (2.54)
6.48*** (1.72)
-20.26 (152)
<.001 .17
Catalogues and brochures 3.86 (2.73)
4.25 (2.54)
n.s.
City buses 2.68 (2.37)
3.72*** (2.47)
-4.65 (2045)
<.001 .01
Cinema 2.43 (2.43)
3.64*** (2.56)
-5.25 (2045)
<.001 .01
Internet 2.43 (2.37)
4.64*** (2.26)
-9.92 (2045)
<.001 .05
In-store 5.43 (2.62)
8.26*** (2.15)
-13.74 (140)
<.001 .05
Note: ***: p < 0.001
TV was found to be the medium with the greatest discrepancy (Table 9 and Figure 5).
When consumers want to buy groceries, they state to make less use of advertising on TV
compared to what marketing managers believe they do. The use of advertising in media such
as in-store (posters), direct mail, newspapers and magazines obtained higher scores than TV.
When taking into account media characteristics it can be inferred that consumers for this
product category tend to make more use of advertising in many of the paper-based media.

Rademaker, Advertising Media and the Green Environmental Aspect
32
From Figure 5 below it can be observed that in-store (posters) and direct mail obtained the
highest scores among the consumers, which seems to be in consistency with marketing
managers’ beliefs about consumers. However, the marketing managers believe that the extents
by which consumers make use of these media are significantly higher than what the
consumers claim. The advertising medium with the lowest score among the consumers is the
mobile phone which indicates that it is the least used advertising medium when the consumers
want to buy groceries. This seems to be consistent with marketing managers’ beliefs about
consumers. Figure 5 below gives an illustration of these findings.
Figure 5: Advertising media usage for buying groceries
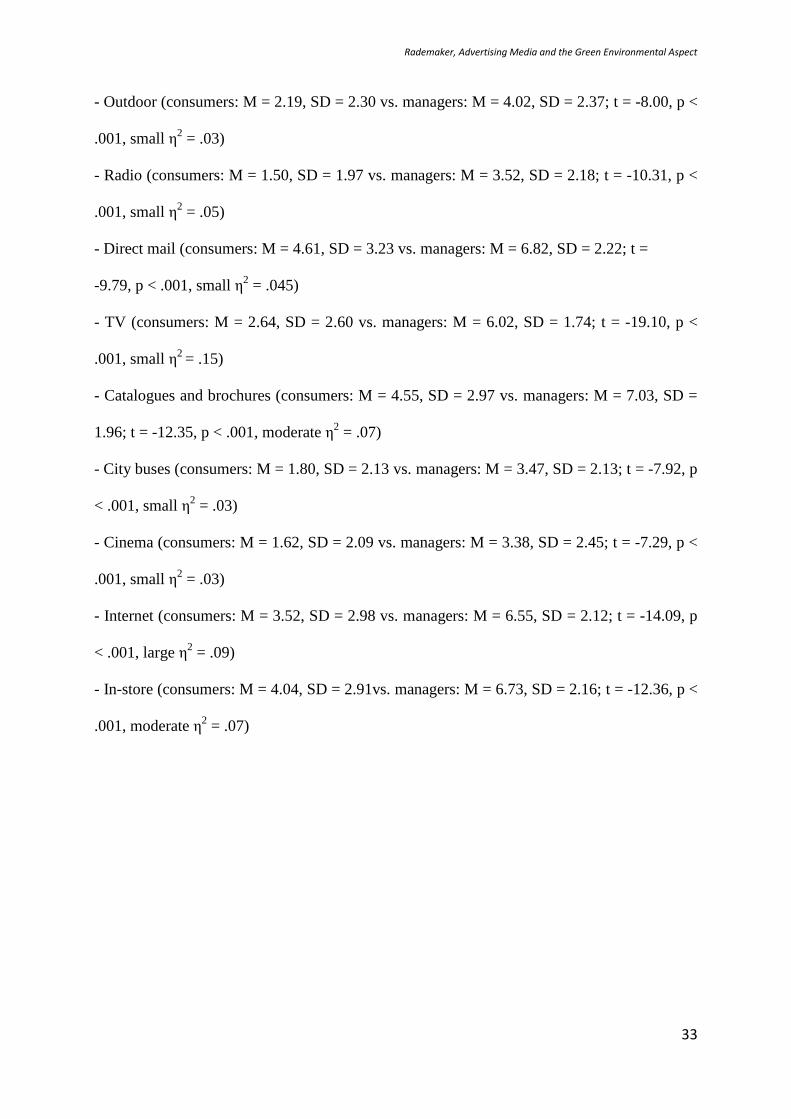
3.3.2 Home electronics
Significant differences were found on advertising media usage for buying home electronics
between the consumers and the marketing managers’ beliefs about consumers (Table 10). For
home electronics, the marketing managers believe that consumers make more use of all 11
advertising media studied here than consumers claim they do namely:
- Newspapers and magazine (consumers: M = 4.32, SD = 2.94 vs. managers: M = 6.78, SD =
1.84; t = -12.97, p < .001, moderate η2
= .08)
- Mobile phones (consumers: M = 1.00, SD = 1.73 vs. managers: M = 2.20, SD = 2.23; t =
-5.53, p < .001, small η2 = .015)
0123456789
10
In-s
tore
DM
New
spa
pers
Ma
ga
zin
es
Cata
log
ue
sB
roch
ure
s
Ou
tdoo
r
TV
City b
use
s
Inte
rnet
Cin
em
a
Rad
io
Mo
bile
ph
on
es
Consumers
Managers
Rademaker, Advertising Media and the Green Environmental Aspect
33
- Outdoor (consumers: M = 2.19, SD = 2.30 vs. managers: M = 4.02, SD = 2.37; t = -8.00, p <
.001, small η2 = .03)
- Radio (consumers: M = 1.50, SD = 1.97 vs. managers: M = 3.52, SD = 2.18; t = -10.31, p <
.001, small η2 = .05)
- Direct mail (consumers: M = 4.61, SD = 3.23 vs. managers: M = 6.82, SD = 2.22; t =
-9.79, p < .001, small η2 = .045)
- TV (consumers: M = 2.64, SD = 2.60 vs. managers: M = 6.02, SD = 1.74; t = -19.10, p <
.001, small η2
= .15)
- Catalogues and brochures (consumers: M = 4.55, SD = 2.97 vs. managers: M = 7.03, SD =
1.96; t = -12.35, p < .001, moderate η2 = .07)
- City buses (consumers: M = 1.80, SD = 2.13 vs. managers: M = 3.47, SD = 2.13; t = -7.92, p
< .001, small η2 = .03)
- Cinema (consumers: M = 1.62, SD = 2.09 vs. managers: M = 3.38, SD = 2.45; t = -7.29, p <
.001, small η2 = .03)
- Internet (consumers: M = 3.52, SD = 2.98 vs. managers: M = 6.55, SD = 2.12; t = -14.09, p
< .001, large η2 = .09)
- In-store (consumers: M = 4.04, SD = 2.91vs. managers: M = 6.73, SD = 2.16; t = -12.36, p <
.001, moderate η2 = .07)

Rademaker, Advertising Media and the Green Environmental Aspect
34
Table 10: Advertising media usage for buying home electronics
Medium
Electronics Consumers Managers n=1928 n=108-119
M M (SD) (SD)
t
(df)
p
η
2
Newspapers and magazines 4.32 (2.94)
6.78*** (1.84)
-12.97 (139)
<.001 .08
Mobile phones 1.00 (1.73)
2.20*** (2.23)
-5.53 (114)
<.001 .01
Outdoor 2.19 (2.30)
4.02*** (2.37)
-8.00 (2034)
<.001 .03
Radio 1.50 (1.97)
3.52*** (2.18)
-10.31 (2034)
<.001 .05
Direct mail 4.61 (3.23)
6.82*** (2.22)
-9.79 (134)
<.001 .04
TV 2.64 (2.60)
6.02*** (1.74)
-19.10 (135)
<.001 .15
Catalogues and brochures 4.55 (2.97)
7.03*** (1.96)
-12.35 (136)
<.001 .07
City buses 1.80 (2.13)
3.47*** (2.13)
-7.92 (2034)
<.001 .03
Cinema 1.62 (2.09)
3.38*** (2.45)
-7.29 (116)
<.001 .03
Internet 3.52 (2.98)
6.55*** (2.12)
-14.09 (132)
<.001 .09
In-store 4.04 (2.91)
6.73*** (2.16)
-12.36 (130)
<.001 .07
Note: ***: p < 0.001
TV was found to be the medium with the greatest discrepancy (Table 10 and Figure 6).
When consumers want to buy home electronics such as a computer printer, the findings
indicate that they make significantly less use of advertising on TV than what marketing
managers believe about them. Consumers’ claimed use of advertising in media such as direct
mail, catalogues and brochures, newspapers and magazines, in-store and the Internet obtained
higher scores than TV. With the exception of advertising using the Internet, these latter
mentioned media can be categorized as paper-based media. Hence, for this product category
the findings show that consumers make more use of paper-based media than what marketing
managers believe about consumers.

Rademaker, Advertising Media and the Green Environmental Aspect
35
From Figure 6 below it can be observed that the above mentioned paper-based media
obtained the highest scores among the consumers, which is consistent with marketing
managers’ beliefs about consumers. The advertising medium with the lowest score is the
mobile phone which thereby is the least used advertising medium by consumers when they
want to buy home electronics. This is also consistent with marketing managers’ beliefs about
consumers. However, the marketing managers believe the extents by which consumers make
use of these media to be much higher than consumers claim they do. Figure 6 gives an
illustration of the findings.
Figure 6: Advertising media usage for buying home electronics
3.4 Green Environmental Responsibility Attitude (GERA)
The third research question was:
RQ3: To what extent is the green environmental responsibility attitude (GERA) of the
marketing manager consistent with that of the consumer and how does GERA relate to the
perception on how harmful for the green environment a specific advertising medium is?
In the attempt to find possible explanations for the discrepancies found especially in
relation to the ‘harmful for the environment’ variable, a closer look at consumers’ and
marketing managers’ green environmental responsibility attitude (GERA) will be taken next.
Some significant differences were found between the consumers and marketing managers.
0123456789
10
DM
Cata
log
ue
sB
roch
ure
s
New
spa
pers
Ma
ga
zin
es
In-s
tore
Inte
rnet
TV
Ou
tdoo
r
City b
use
s
Mo
vie
the
atr
e
Rad
io
Mo
bile
ph
on
es
Consumers
Managers

Rademaker, Advertising Media and the Green Environmental Aspect
36
When comparing the scores of each item between consumers and marketing managers, the
results show that the two items with a significant difference whereby consumers much more
agreed to are: “To care for the environment is the responsibility of the government and the
parliament” and “I don’t think that there are any serious environmental problems today”.
The findings indicate that the consumers put a greater demand on the government and the
parliament for taking responsibility to care for the green environment than the marketing
managers. In addition, the results indicate that marketing managers believe that today’s
environmental problems are more serious than what the consumers believe.
The marketing managers also agree to a greater extent than consumers with the following
items: “I am very concerned about the environmental situation of today”, “I will stop buying
products from companies that are guilty of harming the environment even if it would create
discomfort for me”, I am very precise with paper being sorted and recycled” and
“Companies have a big responsibility not to harm the environment”.
Thus, these results indicate that compared to the consumers, the marketing managers are
more concerned about the environmental situation today, they are more precise with paper
being sorted and recycled and that they consider caring for the green environment to be more
of an individual’s/organization’s responsibility rather than that of the government.
These latter findings have led to conducting further analysis by differentiating between two
types of responsibilities in relation to caring for the green environment namely, personal and
organizational responsibility. Two indexes were composed from the ten items measuring
green environmental responsibility attitude (GERA), i.e. personal green environmental
responsibility attitude (Personal GERA) and organizational green environmental
responsibility attitude (Organizational GERA).
Rademaker, Advertising Media and the Green Environmental Aspect
37
3.4.1 Personal GERA
The items used for the personal green environmental responsibility attitude (Personal
GERA) are: “I am very concerned about the environmental situation of today”, “I do
everything I can in my everyday life in order not to contribute to harm the environment”, “In
order to sustain the environment I print out paper as little as possible”, “I will stop buying
products from companies that are guilty of harming the environment even if it would create
discomfort for me”, “I am very precise with paper being sorted and recycled”, “I don’t think
there are any serious environmental problems today”.
These six items were first subjected to principal component analysis (PCA) to check
whether one or more indexes should be formed. Prior to performing the PCA, the suitability
of data for factor analysis was assessed. Inspection of the correlation matrix revealed the
presence of many coefficients of .3 and above. The Kaiser-Meyer-Olkin value was .83,
exceeding the recommended value of .6 (Kaiser, 1970, 1974) and Bartlett’s Test of Sphericity
(Bartlett, 1954) reached statistical significance, supporting the factorability of the correlation
matrix. Principal component analysis revealed the presence of one component for both
samples.
To improve the Cronbach alpha coefficient, reliability analysis among the six statements
suggested one item to be deleted: “I don’t think that there are any serious environmental
problems today”. The personal green environmental responsibility attitude was then measured
with the five remaining items. Responses were averaged to form an additive index: Personal
GERA. The Cronbach alpha coefficient was .808 (see Table 11).
3.4.2 Organizational GERA
The four items used for the organizational green environmental responsibility attitude
(Organizational GERA) are: “Companies have a big responsibility not to harm the
environment”, “Companies should do everything they can to not harm the environment”,

Rademaker, Advertising Media and the Green Environmental Aspect
38
“The parliament should impose stricter laws for harming the environment”, “To care for the
environment is the responsibility of the government and the parliament”.
To improve the Cronbach alpha coefficient, reliability analysis suggested one item to be
deleted namely, “To care for the environment is the responsibility of the government and the
parliament”. Organizational green environmental responsibility attitude was then measured
with the three remaining items. Responses were averaged to form an index: Organizational
GERA. The Cronbach alpha coefficient was .771.
An independent samples t-test was conducted to compare the additive scores of the two
indexes among the marketing managers and the consumers. The results show a significant
difference for the Personal GERA between the marketing managers (M = 7.18, SD = 1.62)
and the consumers (M = 6.47, SD = 1.95; t = -4.40, p < .001, small η2 = .01). This indicates
that the marketing managers feel more personal responsible towards the green environment
than the consumers. No significant difference was found for the Organizational GERA
between the marketing managers (M = 8.02, SD = 1.55, n = 106) and the consumers (M =
7.80, SD = 1.83, n = 1928). It can be observed that the means of both groups on this index are
high. This indicates that consumers and managers alike consider organizations to have a high
responsibility to not harm the green environment.
The relationship between green environmental responsibility attitudes and green
environmental perceptions of different advertising media was assessed next. Correlation
analysis6 between the Personal GERA and the ‘harmful for the environment’-variable for each
of the 11 advertising media showed weak correlations among both the consumers (r = -.022 to
.026, n = 1906, p > .10) and the marketing managers (r = -.105 to .051, n = 117, p > .10).
There were also weak correlations between the Organizational GERA and the ‘harmful for the
environment’-variable of the 11 advertising media among both the consumers (r = -.017 to
6 Pearson correlation analysis. Preliminary analyses were performed to ensure no violation of the assumptions of
normality, linearity and homoscedasticity.

Rademaker, Advertising Media and the Green Environmental Aspect
39
.035, n = 1906, p > .10) and the marketing managers (r = -.091 to .035, n = 117, p > .10).
These findings indicate that attitudes toward green environmental responsibility are weakly
related to the perception on how harmful for the green environment a specific advertising
medium is.
Table 11: Green environmental responsibility attitude (GERA) Items
Consumers n = 1928
M (SD)
Managers n = 106
M (SD)
t
(df)
P
η
2
Index
Cronbach Alpha
I am very concerned about the
environmental situation of
today
6.23
(2.58)
7.07***
(2.30)
-3.60
(120)
<.001 <.01 Personal
GERA
.808
I do everything I can in my
everyday life in order not to
contribute to harm the
environment
6.22
(2.44)
6.53
(2.11)
n.s.
In order to sustain the
environment I print out paper
as little as possible
6.34
(2.76)
6.70
(2.56)
n.s.
I will stop buying products
from companies that are guilty
of harming the environment
even if it would create
discomfort for me.
5.51
(2.77)
6.90***
(2.32)
-5.92
(122)
<.001 .02
I am very precise with paper
being sorted and recycled
8.03
(2.37)
8.74***
(1.86)
-3.74
(124)
<.001 <.01
Personal GERA 6.47
(1.95)
7.18
(1.62)
-4.40
(122)
<.001 .01
Companies have a big
responsibility not to harm the
environment
8.16
(1.97)
8.48*
(1.77)
-1.66
(2032)
.098 <.01 Organi-
zational
GERA
.771
Companies should do
everything they can not to
harm the environment
8.18
(2.10)
8.35
(1.77)
n.s.
The parliament should impose
stricter laws for harming the
environment.
7.06
(2.52)
7.23
(2.13)
n.s.
Organizational GERA 7.80
(1.83)
8.02
(1.55)
n.s.
I don’t think that there are any
serious environmental
problems today
1.97
(2.33)
.95***
(1.95)
5.18
(122)
<.001 .01 Item
deleted
To care for the environment is
the responsibility of the
government and the
parliament.
5.12
(2.59)
4.24***
(2.65)
3.42
(2032)
.001 <.01 Item
deleted
Note: ***: p < 0.001; *: p < 0.10

Rademaker, Advertising Media and the Green Environmental Aspect
40
4. CONCLUSIONS
Advertising media attitudes and usage
Previous research has shown that consumer trust in advertising is low and continues to
diminish (Edelman, 2009). Researchers have also found that a big share of advertising
investments is placed in less favorable media which can add to consumers’ disbelief towards
advertising (Callius, 2008). The results of the present study add to these previous findings by
indicating that marketing managers’ beliefs about consumers are not consistent with
consumers’ attitudes toward and usage of advertising in different media. The results of this
study also indicate that consumers’ attitudes toward advertising in general and toward
advertising that is adjusted to previous purchases are not as positive as what marketing
managers believe about consumers. Ignoring this phenomenon may have consequences for
companies investing in less favorable media and thereby adding to consumers’ increasing
disbelief towards advertising.
This study found that the consumers’ trust level in advertising in all the 11 media studied is
significantly lower than what the marketing managers believe about consumers. In addition,
the consumers’ trust-levels in advertising were found to vary among the different media.
When marketing managers are not aware of these discrepancies and not considering that “the
medium is the message” (McLuhan, 1964, p. 203), consumer trust in the company’s
advertising message may be lower than expected. In addition, the results indicate that the
consumers’ use of advertising media is not consistent with the marketing managers’ beliefs
about consumers. Among the 11 advertising media studied here, there are some media found
to stand out.
Paper-based media and TV
One of the advertising media that was found to stand out is direct mail. The marketing
managers seem to believe incorrectly that consumers consider direct mail to be worse, more
Rademaker, Advertising Media and the Green Environmental Aspect
41
irritating and more harmful for the green environment than the consumers claim. In addition,
among the 11 media studied direct mail was found to be the second most trusted medium by
the consumers, after in-store (posters), which is not consistent with what the marketing
managers believe about consumers. The consumers thus have a more positive attitude towards
direct mail than what the marketing managers believe about consumers. This may imply that
the marketing managers may miss out on selecting such a favorable advertising medium for
marketing communication purposes that could impact the company’s brand(s) positively.
The results further indicate that consumers make most use of ads in many of the paper-
based media when they want to buy groceries (direct mail, newspapers and magazines, in-
store posters) and home electronics (direct mail, catalogues and brochures, newspapers and
magazines, in-store posters and Internet advertising), which is not consistent with the
marketing managers’ beliefs about consumers.
The greatest discrepancy was found to be related to ads on TV. The marketing managers
seem to believe incorrectly that ads on TV are not only more trusted but also more used by
consumers than the consumers claim. For both product categories (groceries and home
electronics) the consumers seem to make significantly less use of ads on TV compared to
marketing managers’ beliefs about consumers. In addition, TV seem to be considered by the
consumers as a medium that is not as good, more irritating, less trustful and more harmful for
the green environment than the marketing managers believe about consumers.
Considering the high costs that are involved with TV advertising, these findings suggest
that when marketing managers distribute the media budget towards mainly TV the risk exists
that advertising effects will not be most favorable since consumers will avoid/not make use of
the advertising messages. Marketing managers should therefore consider carefully other
media options, such as many of the paper-based media that the consumers claim to use more
than ads on TV, before deciding to invest in mainly expensive TV advertising.

Rademaker, Advertising Media and the Green Environmental Aspect
42
Mobile phones
The results show that consumers have a more negative attitude towards advertising through
mobile phones compared to marketing managers’ beliefs about consumers. The consumers
further seem to consider the mobile phone to be more harmful for the green environment than
the marketing managers believe about consumers. While the mobile phone is found to be the
least used advertising medium by the consumers which is in accordance to the marketing
managers’ beliefs about consumers, the extent to which marketing managers believe that
consumers use this advertising medium is greater compared to what the consumers claim they
do. Advertising through the mobile phone is considered by the consumers as one of the worst,
most irritating and least trusted among the 11 advertising media studied here. This study
investigated only mobile phone services such as SMS and MMS, thus not all the possible
ways in which ads can reach consumers today through mobile phones.
Green environmental responsibility attitude (GERA)
With the exception of direct mail, the consumers perceive all other advertising media in
this study to be more harmful for the green environment compared to what the marketing
managers believe about consumers.
When comparing the consumers’ and marketing managers’ attitudes toward green
environmental responsibility (GERA), the results indicate that compared to the consumers, the
marketing managers are more concerned about the environmental situation today, they are
more precise with paper being sorted and recycled and that they consider caring for the green
environment to be more of an individual’s/organization’s responsibility rather than that of the
government.
Further analysis on green environmental responsibility attitudes showed that marketing
managers have a stronger personal green environmental responsibility attitude (Personal

Rademaker, Advertising Media and the Green Environmental Aspect
43
GERA) than the consumers. This indicates that the marketing managers feel more personal
responsible towards caring for the green environment than the consumers.
It was also found that the consumers and marketing managers alike consider organizations
to have a high responsibility toward the green environment (Organizational GERA). It could
thus be inferred that the marketing managers as well as the consumers seem to have equally
high demands and expectations of organizations to act responsible toward the green
environment. However, this contradicts previous findings that showed that the green
environmental aspect is among the factors that are the least considered when marketing
managers work with marketing communication in general and advertising media selection in
particular (Rademaker, 2011a; 2011b). On the other hand, the results of this study indicate
that green environmental responsibility attitude is weakly related to the perception on the
green environmental aspect of advertising media. Thus, explanations for the discrepancies
found in this study between the two groups regarding green environmental perceptions on the
11 different advertising media should be explained by factors other than green environmental
responsibility attitude (GERA).
The discrepancies found in this study could perhaps be due to the consumers’ and
marketing managers’ exposure and/or use of different sources of information regarding how
harmful for the green environment each medium in fact is. For example, how harmful is it
exactly to use paper-based media when paper is being recycled? Or, how harmful is it exactly
when selecting city buses as advertising media when biogas is used? It could be speculated
that the lack of proper information or knowledge on how harmful for the environment a
specific advertising medium in fact is, could be a main reason for possible differences in
green environmental perceptions among both the marketing managers and consumers.

Rademaker, Advertising Media and the Green Environmental Aspect
44
5. FUTURE RESEARCH
This study has identified discrepancies between consumers’ perceptions on advertising media
and marketing managers’ beliefs about consumers. In particular, discrepancies were found in
relation to eco-friendly media characteristics. In respect to future research there is a need to
further explore environmental aspects of media. Future research should investigate whether a
perceived (non-) eco-friendly medium as well as varying ecological information about a
specific medium will impact advertising effectiveness.

Rademaker, Advertising Media and the Green Environmental Aspect
45
References
Allport, G. W. (1935), “Attitudes. A Handbook of Social Psychology”, Worcester, MA, US:
Clark University Press.
Antil, J. A. and Bennett, P. D. (1979),” Construction and Validation of a Scale to Measure
Socially Responsible Consumption Behavior”, in The Conserver Society, Karl H. Henion II
and Thomas C. Kinnear (eds.), Chicago: The American Marketing Association, pp. 51-68.
Antil, J. A. (1984), “Socially Responsible Consumers: Profile and Implications for Public
Policy”, Journal of Macromarketing, Fall, pp. 18-39.
Callius, P. (2008), “Reklamundvikande i Sverige 2008”, SIFO Research International.
Cappo, J. (2003), “The Future of Advertising: New Media, New Clients, New Consumers in
the Post-Television era”, McGraw-Hill Contemporary.
Creamer, M. and Klaassen, A. (2007), “Caught in the Clutter Crossfire: Your Brand”,
Advertising Age, Vol. 78, No. 14.
Dahlén, M. and Edenius, M. (2007), “When is Advertising Advertising? Comparing
Responses to Non-Traditional and Traditional Advertising Media”, Journal of Current Issues
and Research in Advertising, Vol. 29, Spring, pp. 22-42.
Davison, W. P. (1983), “The third person effect in communication”, Public Opinion
Quarterly, Vol. 47, No. 1, pp. 1-15.
Duck, J. M., Hogg, M. A. and Terry D. L. (2000), “The perceived Impact of persuasive
messages on ‘us’ and ‘them’”, in “Attitudes, Behavior, and Social Context: The Role of
Norms and Group Membership”, Terry, D. L. and Hogg, M. A. (eds.) Mahwah, NJ: Erlbaum.
Dunér, H. and Jönsson, M. (2007), ”Reklamtider”, E.24 Näringsliv, 2007-11-18,
http://www.e24.se/business/reklam-och-media/reklamtider_98811.e24.
Edelman (2009), ”2009 Trust Barometer”, www.edelman.com/TRUST/2009.
Grier, S. A. and Brumbaugh, A. M. (2007), “Compared to whom? The impact of status on
third person effects in advertising persuasion in a South African context”, Journal of
Consumer Behavior, Vol. 6, Jan.-Feb., pp. 5-18.
Grusell, M. (2007), ”Advertising? Yes Please, But Only When It’s My Choice”, Journal of
Media Business Studies, Vol. 4, No. 3 (Fall), pp. 87-101.
Grusell, M. (2008), “Reklam – en objuden gäst?”, Göteborg: JMG, Institutionen för
journalistik och masskommunikation.
GuntherA. C. and Thorson, E. (1992), “Perceived persuasive effects of product commercials
and public service announcements: third person effects in new domains”, Communication
Research, Vol. 19, No. 5, pp. 574-596.

Rademaker, Advertising Media and the Green Environmental Aspect
46
Ha, L. (1996), ”Observations: Advertising Clutter in Consumer Magazines: Dimensions and
Effects”, Journal of Advertising Research, Vol. 36, No. 4, pp. 76-84.
Hoorens, V. Nuttin, J. M. (1993), ”Overvaluation of own attributes: mere ownership or
subjective frequency?”, Social Cognition, Vol. 11, No. 2, pp. 177-200.
Jenkinson (2006), “Planning and evaluating communications in an integrated organization”,
Journal of Targeting, Measurement & Analysis for Marketing, Vol. 15, No. 1, pp. 47-64.
Larsson, L-Å. (2004), “Synen på PR- och reklamkonsulenter”, In Holmberg, S. and Weibull,
L. (red.), ”Ju mer vi är tillsammans”, Gothenburg: SOM Institute, Gothenburg University.
Larsson, L-Å. (2005), ”Upplysning och propaganda: utveckling av svensk PR och
information”, Lund: Studentlitteratur.
McLuhan, M. (1964), “Understanding Media: The Extensions of Man”, 1st Ed. McGraw Hill,
NY.
Miller, D. T. and Ross, M. (1975), “Self-serving biases in the attribution of causality: fact or
fiction?”, Psychological Bulletin, Vol. 82, No. 2, pp. 213-225.
Nilsson, C. P. (2006), “Attention to Advertising”, Studies in Business Administration, Umeå
School of Business, B series, No. 60.
Nordström, B. (2001), “Public Service-Televisionens starka och svaga sidor”, In Holmberg S.
and Weibull L. (red.), ”Land, Du välsignade?”, Gothenburg: SOM Institute, Gothenburg
University.
Nowland et al., (1962), “The effects of Media Context on Advertising: A study conducted for
Life”, New York, NY: Nowland and Company.
Paek, H-J., Pan, Z., Sun, Y., Abisaid, J. and Houden, D. (2005), “The third-person perception
as social judgment”, Communication Research, Vol. 32, No. 2, pp. 143-170.
Percy, L. and Elliot, R. (2005), “Strategic Advertising Management”, 2nd
edition: Oxford
University Press.
Perloff, R. M. (1993), “Third person effect research 1983 – 1992: a review and synthesis”,
International Journal of Public Opinion Research, Vol. 5, No. 2, pp. 167-184.
Pham, M. T. and Johar, G. V. (1997), “Contingent Processes of Source Identification”,
Journal of Consumer Research, Vol. 24, No. 3, pp. 249-265.
Politz, A. (1962), “A Measure of Advertising Effectiveness: The Influence of Audience Selectivity
and Editorial Environment”, New York, NY: Alfred Politz Research, Inc.
Rademaker, C. A. (2011a), “Media Selection for Marketing Communication”, SSE/EFI
Working Paper Series in Business Administration, No. 2011:4.

Rademaker, Advertising Media and the Green Environmental Aspect
47
-- (2011b), “Hinders for Eco-friendly Media Selection”, SSE/EFI Working Paper Series in
Business Administration, No. 2011: 7.
Rosengren, S. (2008), “Facing Clutter: On Message Competition in Marketing
Communication”, EFI, The Economic Research Institute, Stockholm School of Economics
ISBN 978-91-7258-769-4.
Rossiter, J. R. and Danaher, P. J. (1998), “Advanced Media Planning”, Kluwer Academic
Publ.
Shavitt, S., Lowrey, P. and Haefner, J. (1998), “Public Attitudes toward Advertising: More
favorable than you might think”, Journal of Advertising Research, Vol. 38, Vol. 4, pp. 7-22.
Sissors, J. Z. and Baron, R. B. (2002), “Advertising Media Planning”, Sixth ed.,
Crawfordsville: McGraw-Hill.
Soberman, D. A. (2005), “The Complexity of Media Planning Today”, Journal of Brand
Management, Vol. 12, No. 6, pp. 420-429.
Speck, P. S. and Elliot, M. T. (1997), “Predictors of Advertising Avoidance in Print and
Broadcast Media”, Journal of Advertising, Vol. 26, No. 3, pp. 61-76.
Sternvik, J. (2003), “Attityder till reklam och annonser I olika medier”, Dagspresskollegiet,
No. 50, Gothenburg: The Institute for journalism and Mass Communication, Gothenburg
University.
Stiff, J. B. and Mongeau, P. A. (2003), “Persuasive communication”, 2nd
edition, The
Guilford Press, A division of Guilford Publications, Inc., New York.
Taylor, J. (2005), “Space race: An Inside View of the Future of Communications Planning”,
Wiley.
YouGov (2009), ”Nordisk mediemätning – attityden till reklam i olika mediekanaler hos
konsumenter i Sverige, Norge, Danmark och Finland”.