advice for the wise - june 2015
TRANSCRIPT

Advice for the Wise June 2015

Contents
From the desk of the CIO
Did you know?
Domestic Equity
Outlook
Global Equity Outlook
Domestic Debt Outlook
Domestic Debt Strategy
Global Debt Outlook
Global Economy Update
Foreign Exchange
Commodities
Real Estate Outlook
What’s Trending?
From the desk of the CIO
Dear Investors,
Last four months has seen subdued retail inflation and a contracting wholesale inflation. This state of disinflation has a positive factor to it. The central bank is now expected to factor these conditions so as to boost the economy. With the new base, the Indian economy growth seems to have jumped leaps and bounds. However, statistically the economy has not revived as much as it seems to have. What will be interesting to see going forward is how the government will synergize these growth and inflation numbers to continue the revival of the economy. The latest rate cut by the RBI of 25 basis points has been in line with expectations, which the market had already factored. However the dovish commentaries from the RBI Governor led the market to take a plunge.
The concern is of a below-par monsoon predicted by the IMD. We expect that due to this, the food and fuel inflation might rise. We have already seen a rise in the price of essential commodities and this will continue if the monsoon remains deficient. This will increase concerns about the fiscal deficit that seems to be in control as of now.
On the global front Greece concerns have receded but kept all the markets on the edge. The worry of a Grexit has been over-played and the effect of this has been fairly discounted. However, the markets might see a knee-jerk effect if this were to happen but the effect would not sustain. Recent disappointment of US growth rates has increased the uncertainty of a US rate hike and thus it looks unlikely in 2015. This is positive news for the Indian and other emerging economies. Another market concern is that of a rise in crude oil prices. This will prove to be negative for the Indian economy since it will directly affect inflation and imports adversely in an economy that is already seeing a fall in the growth of exports.
These three triggers, activities in Europe, US Fed rate hike concerns and a below-par monsoon can put the rate cut cycle on hold for the next few months. In the midst of all this, the Indian market valuations have been reasonable and the market still remains favorable form a medium to long term view.
Did You Know?
#Source: Huffington Post, Pintrest, Investopedia
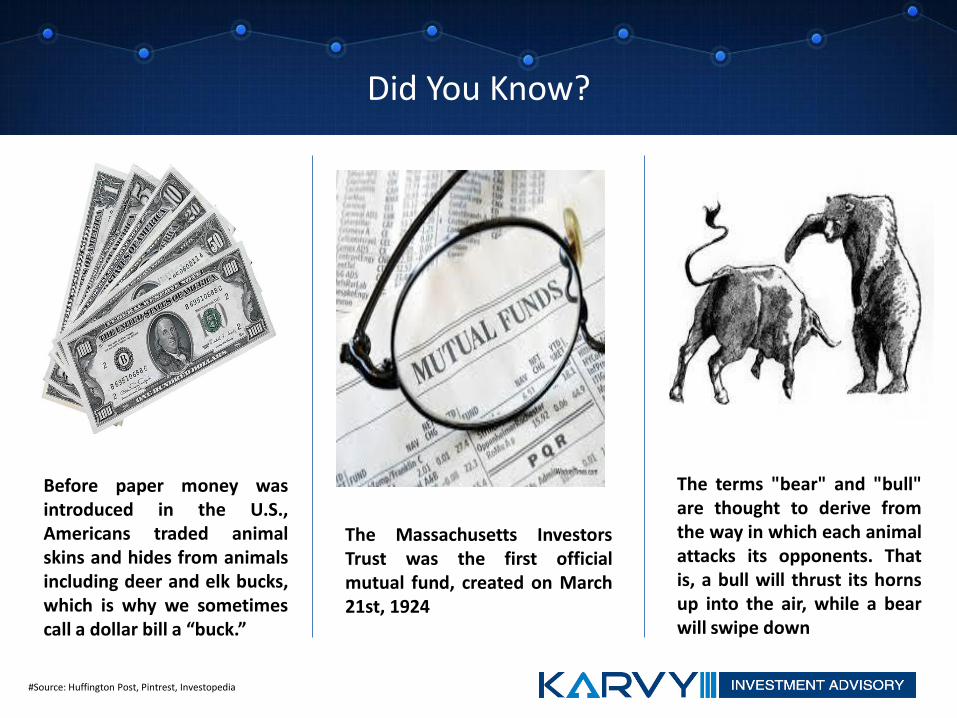
The Massachusetts Investors Trust was the first official mutual fund, created on March 21st, 1924
Before paper money was introduced in the U.S., Americans traded animal skins and hides from animals including deer and elk bucks, which is why we sometimes call a dollar bill a “buck.”
The terms "bear" and "bull" are thought to derive from the way in which each animal attacks its opponents. That is, a bull will thrust its horns up into the air, while a bear will swipe down

Domestic Equity Outlook
Indian Equities have been in correction mode since early March. With markets becoming oversold, value buying emerged at lower levels and thus pushed benchmark indices into positive territory. The month continued to give a mix macro picture. CPI below 5% and contraction in Wholesale inflation encouraged the market participants. However, exports continued to be sluggish and IIP numbers remained subdued. Positives include stable currency and having twin deficits under control. However, fears of delay in monsoons continue to worry the markets. Sectors like Technology and Healthcare faced adverse cross-currency movements. Capitalintensive sectors continued to under-perform awaiting macro recovery; whereas select stocks in Automobiles, Banking and FMCG continued to outperform rest of the markets
As on 25th May 2015
1 month change
1 year change
Equity Markets
BSE Sensex 27643 0.80% 11.80%
CNX Nifty 8370 0.80% 13.70%
BSE Midcap 10611 1.70% 22.40%
BSE Smallcap 11183 1.60% 22.50% 85
90
95
100
105
110
115
120
125
130
135 S & P BSE Sensex CNX Nifty
BSE Midcap BSE Smallcap

Domestic Equity Outlook
Indian wholesale prices index retreated further into the negative territory, where it had been languishing since November 2014, with a 2.65% year-on-year decline in April of 2015, following a 2.33 % drop in the previous month.
Food prices rose 5.73 %, slowing from a 6.31 % increase in March, while petrol prices fell 18.44 %, following a 17.70 % drop in the previous month.
The consumer price index-based inflation (CPI) slowed for the second consecutive month to 4.87 % in April of 2015 from an upwardly revised 5.25 % in March, dragged down by lower food prices
Cost of food and beverages rose 5.36 % in April, down from 6.2 % in the previous month, while the food alone index rose 5.11 % (6.14 % in march).
Wholesale Price Index Consumer Price Index
#Source: Trading Economics, Business Standard
-4.00%
-2.00%
0.00%
2.00%
4.00%
6.00%
8.00%
10.00% WPI CPI

Domestic Equity Outlook
Industrial growth slowed down to 2.1% in March, against a 4.87 % growth in the previous month.
Among the different components, manufacturing output which constitutes over 75% to the index recorded the highest increase with 2.2%. Electricity sector grew by 2.0% while mining edged up 0.9% in March.
While as many as nine out of the 22 manufacturing subsectors shrank, the capital goods segment, which represents the investment demand in the economy, grew by 7.6%, marking a fifth successive month of growth of investment activity.
The Indian economy expanded 7.3% in the year ended March, in line with the initial forecast and marginally higher than 6.9% recorded in the previous year
Financial services reported 11.5% growth while trade and hotels segment was up 10.7%. Manufacturing growth picked up further in the January-March period, rising to 8.4%, but construction slowed to 1.4% and agriculture contracted 1.4% because of the damage caused by unseasonal rains in March.
-6.0% -4.0% -2.0% 0.0% 2.0% 4.0% 6.0% 8.0%
IIP
4.0
5.0
6.0
7.0
8.0
GDP
Sector Outlook
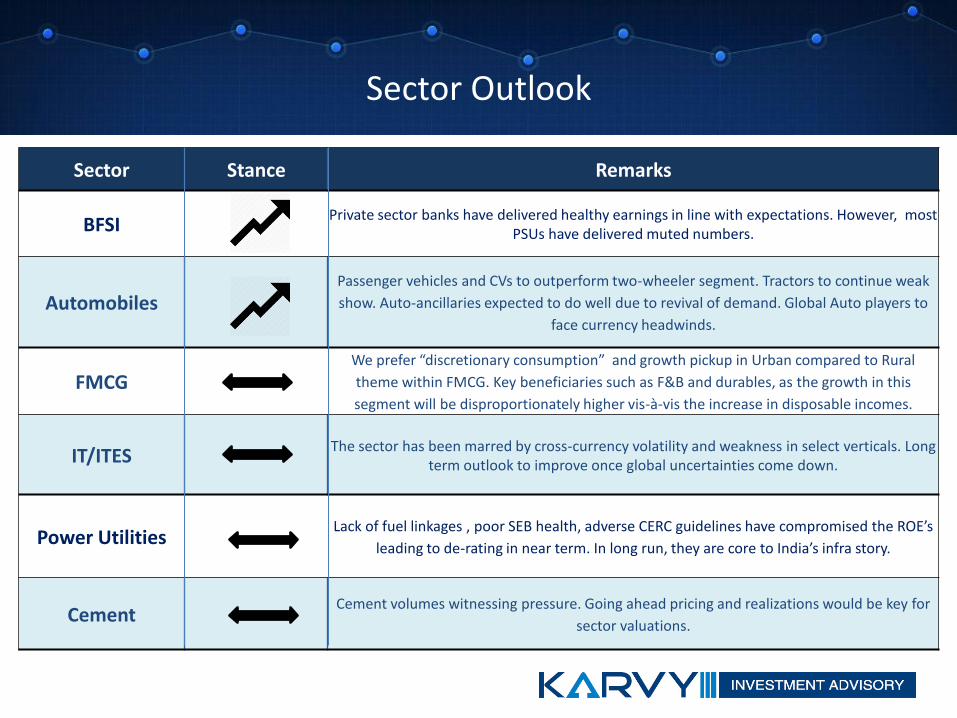
Sector Stance Remarks
BFSI Private sector banks have delivered healthy earnings in line with expectations. However, most
PSUs have delivered muted numbers.
Automobiles Passenger vehicles and CVs to outperform two-wheeler segment. Tractors to continue weak
show. Auto-ancillaries expected to do well due to revival of demand. Global Auto players to
face currency headwinds.
FMCG We prefer “discretionary consumption” and growth pickup in Urban compared to Rural
theme within FMCG. Key beneficiaries such as F&B and durables, as the growth in this
segment will be disproportionately higher vis-à-vis the increase in disposable incomes.
IT/ITES The sector has been marred by cross-currency volatility and weakness in select verticals. Long
term outlook to improve once global uncertainties come down.
Power Utilities Lack of fuel linkages , poor SEB health, adverse CERC guidelines have compromised the ROE’s
leading to de-rating in near term. In long run, they are core to India’s infra story.
Cement Cement volumes witnessing pressure. Going ahead pricing and realizations would be key for
sector valuations.

Sector Outlook
Sector Stance Remarks
Healthcare Huge global opportunity as a generic and bulk drug supplier. Better placed against peers in terms
of technology and labor cost arbitrage. Strong earnings growth support rich valuations.
E&C Order inflows expected to improve as spending and capital expenditure likely to move up on
economic recovery.
Energy With the price deregulation of diesel, we believe the total subsidy burden on Oil PSU’s will come
down significantly this year. Govt. has decided to pay full subsidy to OMC’s .
Telecom Regulatory uncertainties have come down. However, aggressive bids for spectrum has revived
fears of sub-optimal returns on capital. Pressure in Voice offset by data revenues.
Metals Lower global growth and Chinese slowdown has kept the growth subdued. Absence of US
monetary stimulus will lead to further downward pressure on prices.

Global Equity Outlook
Globally, investors need to monitor the developments in Greece and timing of rate hike by US Fed. The earnings season is about to get over and overall results have been more or less in line with expectations. US data remained mixed with improvement in some quarters. However, GDP showed a seasonal slowdown and was below expectations. Fears of Chinese IPOs squeezing global liquidity kept pressure on the markets. On the domestic front, monthly inflation numbers continued to show improvement.
As on 25th May 2015
1 month change
1 year change
Equity Markets
MSCI World 1803 0.22% 5.91%
Hang Seng 27992 -0.24% 21.90%
S&P 500 2126 0.62% 11.87%
Nikkie 20413 1.97% 39.80% 95
105
115
125
135
145 MSCI World Hang Seng S&P 500 Nikkie

Global Economy Update
United States
• Consumer prices in the United States declined 0.2 % year-on-year in April, following a 0.1 % drop in March due to falling energy cost, although the core inflation remained at 1.8 %.
• The United States in the month of April managed a budget surplus of $157 billion, a 47 % jump from the same period last year.
Emerging Economies
• Foreign direct investment into India had risen by 40 % in the 2014/15 fiscal year from a year ago, according to the finance ministry.
• China's annual inflation rate was recorded at 1.5% in April of 2015, edging up from 1.4 % increase in the previous month while the Producer Prices fell by 4.6%, continuing its downward trajectory since March 2012.
Japan
• Japanese economy expanded by 0.6 % on the back of increased private demand and personal consumption, in the first quarter of 2015 following a downwardly revised 0.3 % rise in the last three months of 2014.
• Consumer prices in Japan rose 0.6 % year on year in April, as the effects of last year's decline in oil prices deteriorates.
Europe
• Industrial production in the Eurozone increased 1.8 % year-on-year in March, slightly down from a revised 1.9 % growth in February, although it fell by a surprising 0.7% on a monthly basis.
• The Eurozone trade surplus increased to € 23.4 billion in March of 2015 from a € 16.1 billion surplus a year earlier, as exports of goods were up 11 % and imports grew at a slower 7 %.
#Source: Reuters, Economic times , Huffington Post

Domestic Debt Outlook
•Government bond prices ended up as the RBI’s decision to auction a new 10-year paper maturing in 2025 in the current week’s bond sale aided gains. •Liquidity support was provided by the RBI via two overnight repo auctions for a total notified amount of Rs 25,000 crore. In addition, the apex bank also conducted two 14-day term repo auctions, injecting liquidity worth Rs 31,000 crore •Easing concerns about global bond market volatility, and expectation of an interest rate reduction from the RBI in the upcoming June policy announcement further contributed to the rise in prices. Among global cues, government bonds received fillip from the US Federal Open Market Committee’s (FOMC) intra-week policy meeting. According to the minutes, most policymakers felt increasing US interest rates in June would be premature.
As on 25th May 2015
1 month change
1 year change
Debt Markets
10-Yr G-Sec Yield 7.68% 90bps (75bps)
Call Markets *as on 20th March 2015
8.55% 0bp 37bps
Fixed Deposit 8.00% (25bps) (100bps)
Corporate Bond Spreads
0
50
100
150
200
250
300
350
AAA AA+ AA AA- A+ A A- BBB+
5 Years 10 Years 15 Years
7.40
7.60
7.80
8.00
8.20
8.40
8.60
8.80
9.00
9.20
9.40
G-Sec
10 YR Gsec Yield 5 YR Gsec Yield
15 YR Gsec Yield

Domestic Debt Strategy
Our recommendations regarding short term debt is that investors with the time horizon of 1 year to 2 years can look for short term debt funds. Even though, most of the short term fund’s YTMs have fallen to sub-9%, our recommended short term debt funds still
have high YTMs (8.38%-10.58%) providing interesting investment opportunities.
The corporate bond market segment continues to be attractive over the medium term, specially with expectations of an improvement in corporate profitability and an improved
economic outlook. The corporate bond funds are better placed as they focuses on securities with higher accrual by investing in the steadily developing corporate bond
market which offers attractive risk reward opportunity.
As dynamic bond funds have the flexibility to change its investments from short term to long term and from long term to short term, these are likely to outperform in the uncertain interest rate
scenario. However, as we expect RBI to lower policy rates during the course of next 12-18 months, dynamic bond funds may deliver better returns in the due course. Hence one could look
at these funds having medium term of investment horizon.
Long Term Debt funds may be less attractive now as the longer holding period (more than three years) will neutralise any capital gains in the near term because of lower accrual income. Hence our recommendations regarding long term debt is that investors could look to book profits by
reducing long term debt funds / Gilt funds in their portfolio.
Short Term Debt
Corporate Bond Funds
Dynamic Bond Funds
Long Term Debt Funds

Global Debt Outlook
Ratings Country 10 Yr G-Sec Yield
1 month change
AAA
Germany 0.48% 12bps
Hong Kong 1.61% 7bps
Sweden 0.66% 27bps
Switzerland (0.06%) (7bps)
AA+ USA 2.09% (2bps)
AA-
China 3.59% 18bps
Japan 0.39% 3bps
•China owned $1.261 trillion worth of U.S. government securities at the end of March, compared to $1.2269 trillion for Japan. •The European Central Bank purchased just over €63 billion ($68.75 billion) in public and private debt securities last month under its three-month-old quantitative easing program •Argentina’s primary deficit, which excludes debt payments, jumped to 17.4 billion pesos ($1.93 billion) in March, compared with a 3.6 billion peso surplus just one year earlier. The last time Argentina posted a shortfall for March was in 2002, three months after reneging on a record $95 billion of debt. •Japan’s debt stood at a record-high ¥1.053 quadrillion ($8.78 trillion) at the end of March, increasing pressure on the government to take further austerity measures.
#Source: Japan Times, Bloomberg, CNN Money, WSJ

Commodities
Gold continues to be range-bound; with international prices languishing in the range of $1150-$1250 over past few months. Improving US economy and global flows moving towards riskier assets should keep gold prices subdued over medium term. The caveat is that any geo-political crisis or events like Greece exiting Euro can push up the gold prices.
As on 25th May, 2015 : `27066 per 10gm 1 month change : 1.07% 1 year change : (2.22%)
Crude oil saw a rise of 2.50% since last month. India's exports contracted by about 14% to US $22 billion due to a sharp dip in petroleum, gems and jewellery shipments
As on 25th May, 2015 : $64.52 per bbl 1 month change : 2.50% 1 year change : (41.40%)
*RICI: Rogers International Commodity Index – Tracks 38 commodity futures from 13 international exchanges.
2,000
2,500
3,000
3,500
4,000
RICI*
24000 25000 26000 27000 28000 29000
Gold
0
50
100
150
Crude
Foreign Exchange
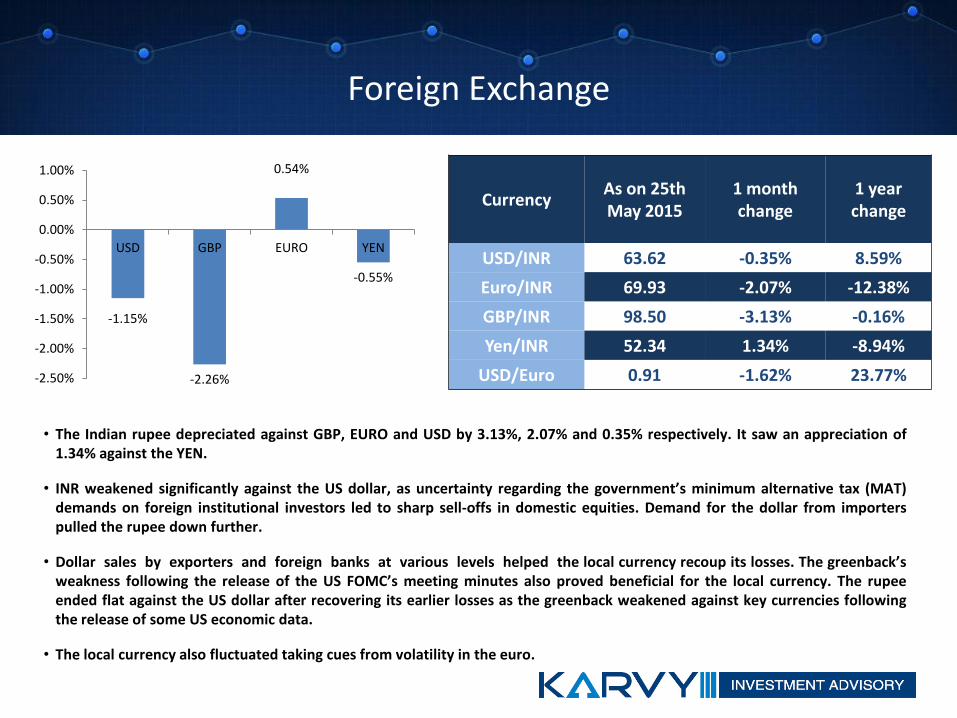
• The Indian rupee depreciated against GBP, EURO and USD by 3.13%, 2.07% and 0.35% respectively. It saw an appreciation of 1.34% against the YEN.
• INR weakened significantly against the US dollar, as uncertainty regarding the government’s minimum alternative tax (MAT) demands on foreign institutional investors led to sharp sell-offs in domestic equities. Demand for the dollar from importers pulled the rupee down further.
• Dollar sales by exporters and foreign banks at various levels helped the local currency recoup its losses. The greenback’s weakness following the release of the US FOMC’s meeting minutes also proved beneficial for the local currency. The rupee ended flat against the US dollar after recovering its earlier losses as the greenback weakened against key currencies following the release of some US economic data.
• The local currency also fluctuated taking cues from volatility in the euro.
Currency As on 25th May 2015
1 month change
1 year change
USD/INR 63.62 -0.35% 8.59%
Euro/INR 69.93 -2.07% -12.38%
GBP/INR 98.50 -3.13% -0.16%
Yen/INR 52.34 1.34% -8.94%
USD/Euro 0.91 -1.62% 23.77%
-1.15%
-2.26%
0.54%
-0.55%
-2.50%
-2.00%
-1.50%
-1.00%
-0.50%
0.00%
0.50%
1.00%
USD GBP EURO YEN

Real Estate Outlook
Tier I
The Reserve Bank of India reduced repo rates by 25 basis points
in January and March and again in June 2015. Some of the banks
have correspondingly reduced the base rates and passed on the
corresponding benefit on home loans. With the reduction in EMIs,
potential homebuyers who have been sitting on the fence may
take a buy decision.
Tier II
Enquiries have started from companies across industries such as
IT, consultancy and e-commerce for leasing and buying office
space in expectations of an economic revival. The change in the
uptake of commercial asset class is slower than residential and it
could take a couple of quarters before commercial asset class
absorption starts increasing.
Rentals are expected to largely remain stable in 2015–16 as
supply pipeline is still strong.
Lease rentals as well as capital values continue to be stable at
their current levels in the commercial asset class. Low unit
sizes have played an important role in maintaining the
absorption levels in these markets.
Demand in Tier II cities is largely driven by the trend towards
nuclear families, increasing disposable income, rising
aspiration to own quality products and the growth in
infrastructure facilities in these cities. Price appreciation is
more concentrated to specific micro-markets in these cities.
Cities like Chandigarh, Jaipur, Lucknow, Ahmedabad, Bhopal,
Nagpur, Patna and Cochin are expected to perform well.
Residential
Commercial

Tier I Tier II
Tier II cities see a preference of hi-street retail as compared to
mall space in Tier I cities. While not much data on these
rentals gets reported, these are expected to have been
stagnant.
Capital values as well as lease rentals continue to be stagnant.
Developers continue to defer the construction costs as absorption
continues to be low unsold inventory levels high.
Land in Tier II and III cities along upcoming / established
growth corridors have seen good percentage appreciation due
to low investment base in such areas.
Agricultural / non-agricultural lands with connectivity to Tier I
cities and in proximity to upcoming industrial and other
infrastructure developments present good investment
opportunities. Caution should however be exercised due to the
complexities typically involved in land investments.
Retail
Land
Real Estate Outlook

Gold Monetisation Scheme Gold Monetisation Scheme, proposed in this year’s budget, which would enable depositors, such as households and jewellers to open metal deposits with banks, place their gold holdings in them, earn interests on the gold deposits and if needed, borrow money from it. The scheme will reduce India’s dependence on imported gold which accounts for about 97% of its annual gold demand. The scheme also intends to circulate the stashed unproductive gold in the economy, estimated at around 20,000 tons, by pulling it out of domestic safes and lending it out. The draft scheme, which proposes a tax exemption, put out by the Finance ministry suggests a minimum lock-in of one year for gold deposits with a rollover of over one year, similar to bank FDs.
What’s Trending?

Karvy Investment Advisory Services Limited [KIASL] is a SEBI registered Investment Advisor and provides advisory services. The information in this newsletter has been prepared by KIASL based on information obtained from public sources and sources believed to be reliable, but no independent verification has been made nor is its accuracy or completeness guaranteed and the same are subject to change without any notice. This newsletter and information herein is solely for informational purpose and may not be used or considered as an offer document or solicitation of offer to buy or sell or subscribe to the securities mentioned. The securities discussed and opinions expressed in this newsletter may not be taken in substitution for the exercise of independent judgment by any recipient as the same may not be suitable for all investors, who must make their own investment decisions, based on their own investment objectives, financial positions and needs of specific recipient. The information given in this document is for guidance only. Final investment decisions have to be made by the recipients themselves after independent evaluation of the investment risk. Recipients are advised to consult their respective tax advisers to understand the specific tax incidence applicable to them. Affiliates of KIASL may from time to time, be engaged in any other transaction involving such securities/commodities and earn brokerage or other compensation or act as a market maker in the securities/commodities discussed herein or have other potential conflict of interest with respect to any recommendation and related information and opinions. Wherever products offered by the Karvy Group entities may be recommended, it is to be noted that KIASL does not provide execution services and further KIASL does not receive any monetary or non monetary benefit as regards such recommendations made.This newsletter and information contained herein is strictly confidential and meant solely for the selected recipient and may not be altered in any way, transmitted to, copied or distributed, in part or in whole, to any other person or to the media or reproduced in any form, without prior written consent of KIASL. Past performance is not necessarily a guide to future performance. KIASL and its Group companies or any person connected with it accepts no liability whatsoever for the content of this newsletter, or for the consequences of any actions taken on the basis of the information provided therein or for any loss or damage of any kind arising out of the use of this newsletter. Nothing in this newsletter constitutes investment, legal, accounting and tax advice or a representation that any of the investment mentioned is suitable or appropriate to your specific circumstances. The information given in this document on tax is for guidance only, and should not be construed as tax advice. Investors are advised to consult their respective tax advisers to understand the specific tax incidence applicable to them. While we would endeavor to update the information herein on reasonable basis, KIASL , its associated companies, their directors and employees (“Karvy Group”) are under no obligation to update or keep the information current. Also, there may be regulatory, compliance or other reasons that may prevent KIASL from doing so. KIASL will not treat recipients as customers by virtue of their receiving this newsletter. The value and return of investment may vary because of changes in interest rates or any other reason. Karvy Group may have issued other reports that are inconsistent with and reach different conclusion from the information presented in this newsletter.Recipients are advised to see the offer documents provided by the Issuers/ Product Providers to understand the risks associated before making investments in the products mentioned. Recipients are cautioned that any forward-looking statements are not predictions and may be subject to change without notice.KIASL operates from within India and is subject to Indian regulations. This newsletter is not directed or intended for distribution to, or use by, any person or entity who is a citizen or resident of or located in any locality, state, country or other jurisdiction, where such distribution, publication, availability or use would be contrary to law, regulation or which would subject KIASL and affiliates to any registration or licensing requirement within such jurisdiction. Certain category of investors in certain jurisdictions may or may not be eligible to invest in securities mentioned in the newsletter. Persons in whose possession this document may come are required to inform themselves of and to observe such restriction.Entities of the Karvy Group provide execution services in the capacity of being stock broker, depository participant, portfolio managers and the like. Recipients may choose to execute their transactions through entities of the Karvy group and pay applicable charge for the same. Registered office Address:Karvy Investment Advisory Services Limited, ‘Karvy House’, 46, Avenue 4, Street No. 1, Banjara Hills, Hyderabad - 500034 SEBI Registration No: INA200001959
Disclaimer