advices for intraday weekly commodity market
DESCRIPTION
Trifid Research is a Stock Market advisory company which provides you good suggestion for stock tips you will be capable of, how to deal with Stock Market to earn more profitable. Response and final target achievement very quicklyTRANSCRIPT
18 AUGUST – 22 AUGUST 2014
W E E K L Y
R
E
P
O
R
T
Blow by Blow
On
Bullions,
Base metals,
Energy…
WWW.TRIFIDRESEARCH.COM
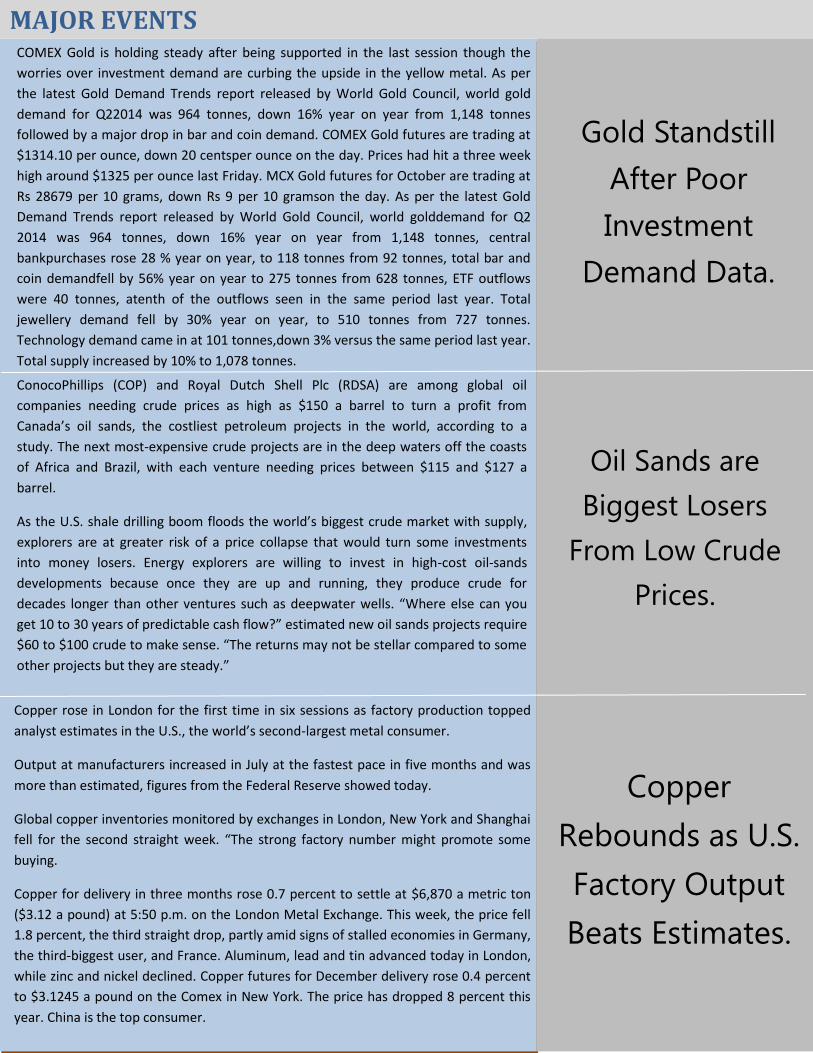
MAJOR EVENTS COMEX Gold is holding steady after being supported in the last session though the
worries over investment demand are curbing the upside in the yellow metal. As per
the latest Gold Demand Trends report released by World Gold Council, world gold
demand for Q22014 was 964 tonnes, down 16% year on year from 1,148 tonnes
followed by a major drop in bar and coin demand. COMEX Gold futures are trading at
$1314.10 per ounce, down 20 centsper ounce on the day. Prices had hit a three week
high around $1325 per ounce last Friday. MCX Gold futures for October are trading at
Rs 28679 per 10 grams, down Rs 9 per 10 gramson the day. As per the latest Gold
Demand Trends report released by World Gold Council, world golddemand for Q2
2014 was 964 tonnes, down 16% year on year from 1,148 tonnes, central
bankpurchases rose 28 % year on year, to 118 tonnes from 92 tonnes, total bar and
coin demandfell by 56% year on year to 275 tonnes from 628 tonnes, ETF outflows
were 40 tonnes, atenth of the outflows seen in the same period last year. Total
jewellery demand fell by 30% year on year, to 510 tonnes from 727 tonnes.
Technology demand came in at 101 tonnes,down 3% versus the same period last year.
Total supply increased by 10% to 1,078 tonnes.
ConocoPhillips (COP) and Royal Dutch Shell Plc (RDSA) are among global oil
companies needing crude prices as high as $150 a barrel to turn a profit from
Canada’s oil sands, the costliest petroleum projects in the world, according to a
study. The next most-expensive crude projects are in the deep waters off the coasts
of Africa and Brazil, with each venture needing prices between $115 and $127 a
barrel.
As the U.S. shale drilling boom floods the world’s biggest crude market with supply,
explorers are at greater risk of a price collapse that would turn some investments
into money losers. Energy explorers are willing to invest in high-cost oil-sands
developments because once they are up and running, they produce crude for
decades longer than other ventures such as deepwater wells. “Where else can you
get 10 to 30 years of predictable cash flow?” estimated new oil sands projects require
$60 to $100 crude to make sense. “The returns may not be stellar compared to some
other projects but they are steady.”
Oil Sands are
Biggest Losers
From Low Crude
Prices.
Copper
Rebounds as U.S.
Factory Output
Beats Estimates.
Copper rose in London for the first time in six sessions as factory production topped
analyst estimates in the U.S., the world’s second-largest metal consumer.
Output at manufacturers increased in July at the fastest pace in five months and was
more than estimated, figures from the Federal Reserve showed today.
Global copper inventories monitored by exchanges in London, New York and Shanghai
fell for the second straight week. “The strong factory number might promote some
buying.
Copper for delivery in three months rose 0.7 percent to settle at $6,870 a metric ton
($3.12 a pound) at 5:50 p.m. on the London Metal Exchange. This week, the price fell
1.8 percent, the third straight drop, partly amid signs of stalled economies in Germany,
the third-biggest user, and France. Aluminum, lead and tin advanced today in London,
while zinc and nickel declined. Copper futures for December delivery rose 0.4 percent
to $3.1245 a pound on the Comex in New York. The price has dropped 8 percent this
year. China is the top consumer.
Gold Standstill
After Poor
Investment
Demand Data.
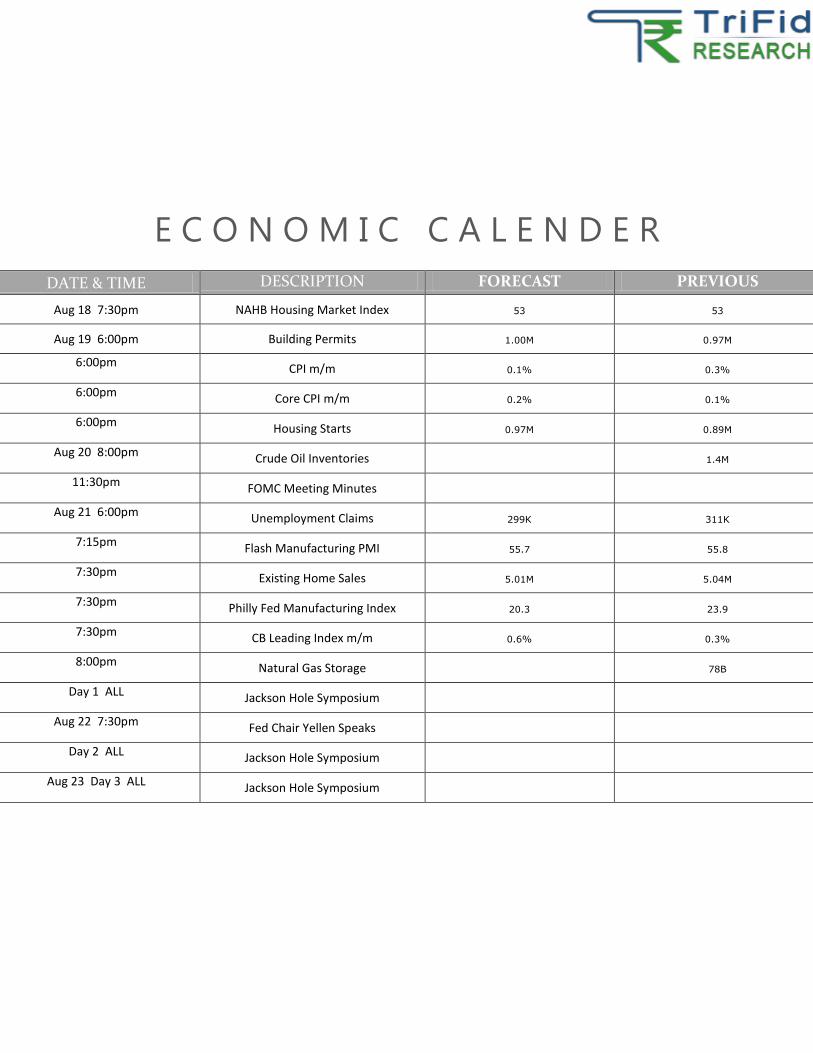
E C O N O M I C C A L E N D E R
DATE & TIME DESCRIPTION FORECAST PREVIOUS
Aug 18 7:30pm NAHB Housing Market Index 53 53
Aug 19 6:00pm Building Permits 1.00M 0.97M
6:00pm CPI m/m 0.1% 0.3%
6:00pm Core CPI m/m 0.2% 0.1%
6:00pm Housing Starts 0.97M 0.89M
Aug 20 8:00pm Crude Oil Inventories 1.4M
11:30pm FOMC Meeting Minutes
Aug 21 6:00pm Unemployment Claims 299K 311K
7:15pm Flash Manufacturing PMI 55.7 55.8
7:30pm Existing Home Sales 5.01M 5.04M
7:30pm Philly Fed Manufacturing Index 20.3 23.9
7:30pm CB Leading Index m/m 0.6% 0.3%
8:00pm Natural Gas Storage 78B
Day 1 ALL Jackson Hole Symposium
Aug 22 7:30pm Fed Chair Yellen Speaks
Day 2 ALL Jackson Hole Symposium
Aug 23 Day 3 ALL Jackson Hole Symposium
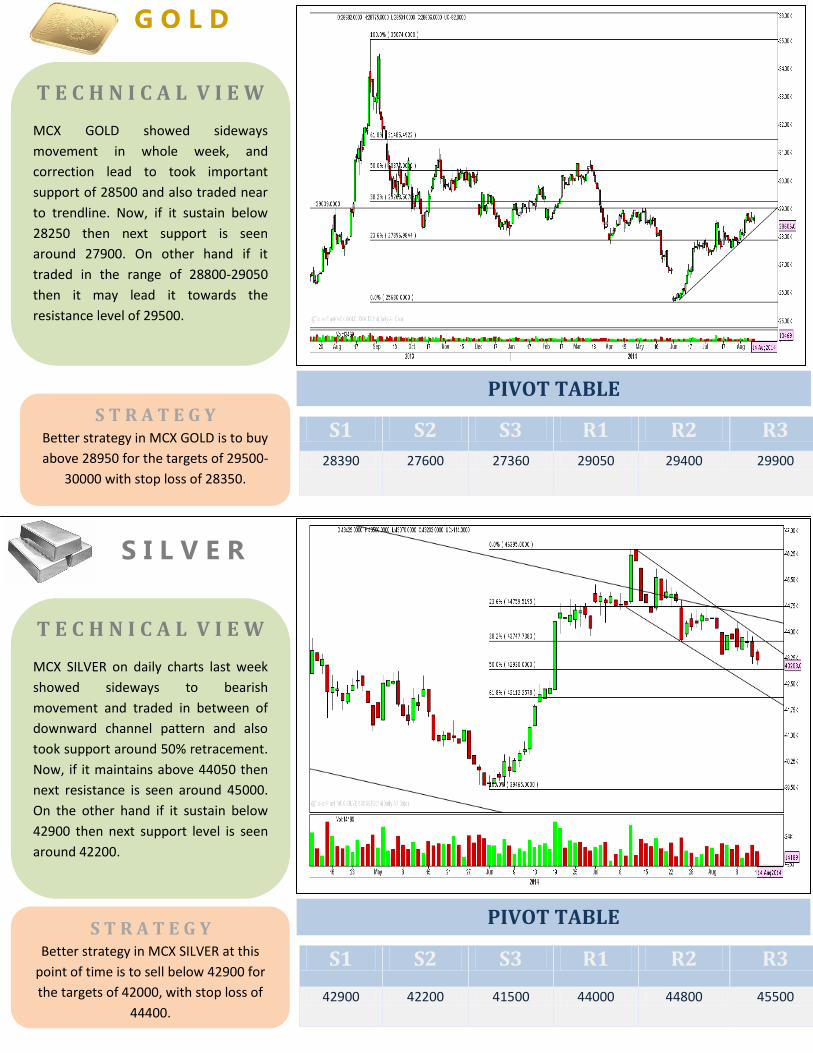
S1 S2 S3 R1 R2 R3
28390 27600 27360 29050 29400 29900
S1 S2 S3 R1 R2 R3
42900 42200 41500 44000 44800 45500
T E C H N I C A L V I E W
MCX GOLD showed sideways
movement in whole week, and
correction lead to took important
support of 28500 and also traded near
to trendline. Now, if it sustain below
28250 then next support is seen
around 27900. On other hand if it
traded in the range of 28800-29050
then it may lead it towards the
resistance level of 29500.
S T R A T E G Y Better strategy in MCX GOLD is to buy
above 28950 for the targets of 29500-
30000 with stop loss of 28350.
PIVOT TABLE
G O L D
PIVOT TABLE
S I L V E R
T E C H N I C A L V I E W
MCX SILVER on daily charts last week
showed sideways to bearish
movement and traded in between of
downward channel pattern and also
took support around 50% retracement.
Now, if it maintains above 44050 then
next resistance is seen around 45000.
On the other hand if it sustain below
42900 then next support level is seen
around 42200.
S T R A T E G Y Better strategy in MCX SILVER at this
point of time is to sell below 42900 for
the targets of 42000, with stop loss of
44400.
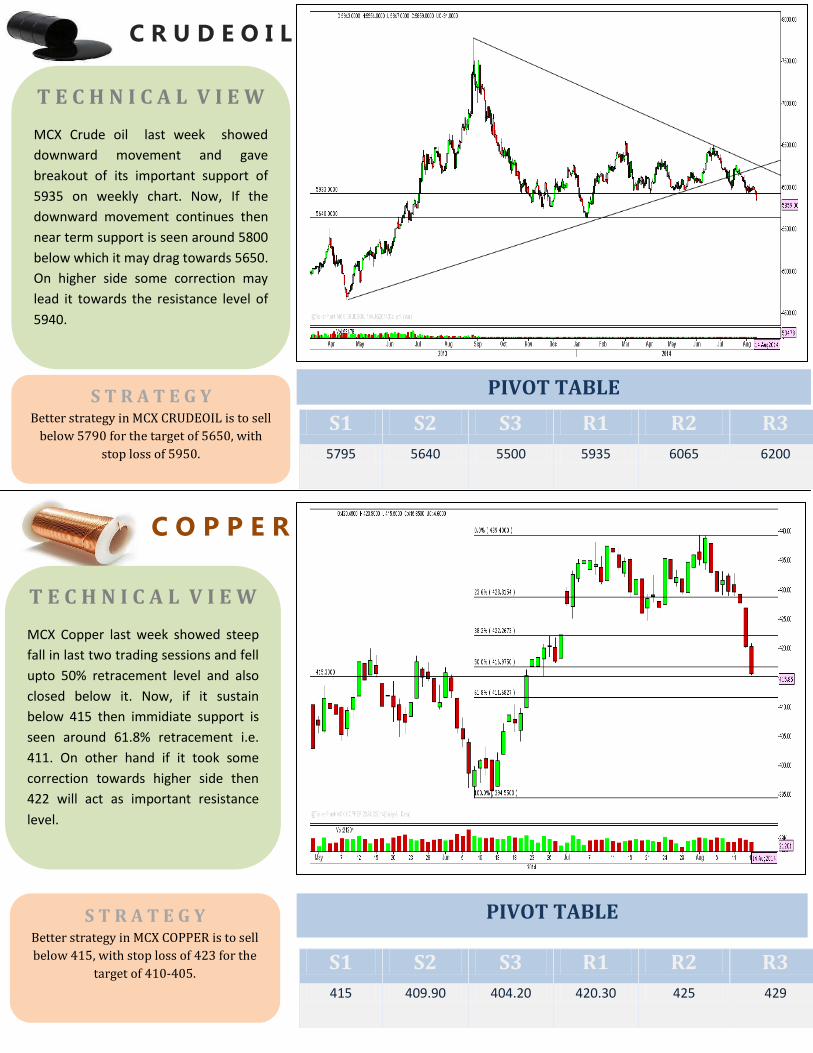
C R U D E O I L
C O P P E R
S1 S2 S3 R1 R2 R3
5795 5640 5500 5935 6065 6200
S1 S2 S3 R1 R2 R3
415 409.90 404.20 420.30 425 429
T E C H N I C A L V I E W
MCX Copper last week showed steep
fall in last two trading sessions and fell
upto 50% retracement level and also
closed below it. Now, if it sustain
below 415 then immidiate support is
seen around 61.8% retracement i.e.
411. On other hand if it took some
correction towards higher side then
422 will act as important resistance
level.
S T R A T E G Y Better strategy in MCX CRUDEOIL is to sell
below 5790 for the target of 5650, with
stop loss of 5950.
PIVOT TABLE
T E C H N I C A L V I E W
MCX Crude oil last week showed
downward movement and gave
breakout of its important support of
5935 on weekly chart. Now, If the
downward movement continues then
near term support is seen around 5800
below which it may drag towards 5650.
On higher side some correction may
lead it towards the resistance level of
5940.
S T R A T E G Y Better strategy in MCX COPPER is to sell
below 415, with stop loss of 423 for the
target of 410-405.
PIVOT TABLE

WWW.TRIFIDRESEARCH.COM
DISCLAIMER