advisory)board)presentation -...
TRANSCRIPT

Advisory Board Presentation
AIM XL April 27, 2015
AIM XL Analysts
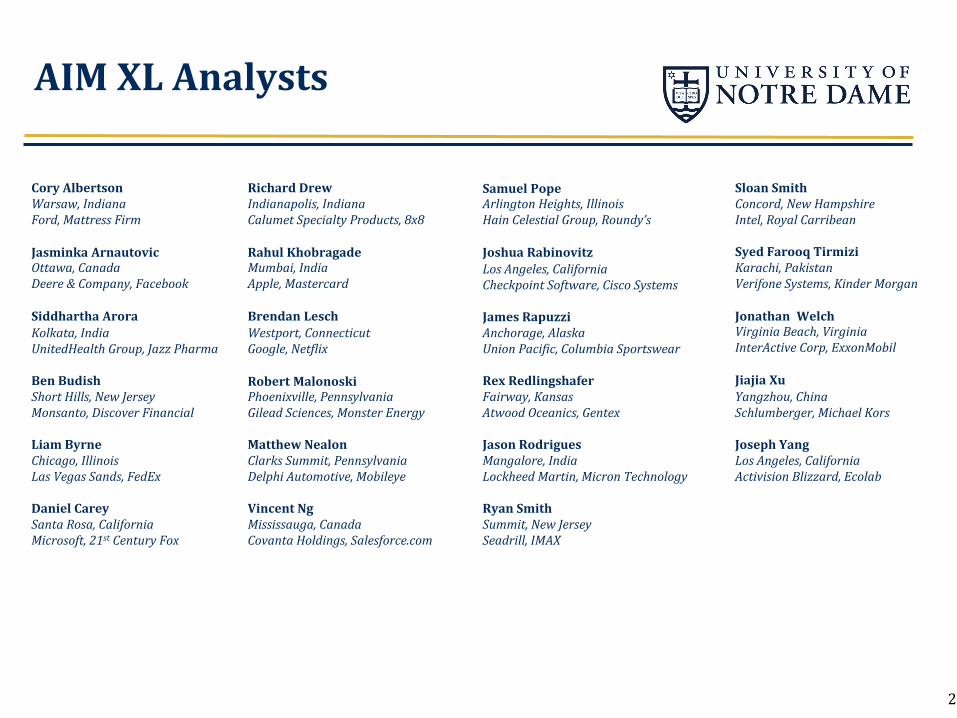
Cory Albertson Warsaw, Indiana Ford, Mattress Firm Jasminka Arnautovic Ottawa, Canada Deere & Company, Facebook Siddhartha Arora Kolkata, India UnitedHealth Group, Jazz Pharma Ben Budish Short Hills, New Jersey Monsanto, Discover Financial Liam Byrne Chicago, Illinois Las Vegas Sands, FedEx Daniel Carey Santa Rosa, California Microsoft, 21st Century Fox
Richard Drew Indianapolis, Indiana Calumet Specialty Products, 8x8 Rahul Khobragade Mumbai, India Apple, Mastercard Brendan Lesch Westport, Connecticut Google, NetSlix Robert Malonoski Phoenixville, Pennsylvania Gilead Sciences, Monster Energy Matthew Nealon Clarks Summit, Pennsylvania Delphi Automotive, Mobileye Vincent Ng Mississauga, Canada Covanta Holdings, Salesforce.com
Samuel Pope Arlington Heights, Illinois Hain Celestial Group, Roundy’s Joshua Rabinovitz Los Angeles, California Checkpoint Software, Cisco Systems James Rapuzzi Anchorage, Alaska Union PaciSic, Columbia Sportswear Rex Redlingshafer Fairway, Kansas Atwood Oceanics, Gentex Jason Rodrigues Mangalore, India Lockheed Martin, Micron Technology Ryan Smith Summit, New Jersey Seadrill, IMAX
Sloan Smith Concord, New Hampshire Intel, Royal Carribean Syed Farooq Tirmizi Karachi, Pakistan Verifone Systems, Kinder Morgan Jonathan Welch Virginia Beach, Virginia InterActive Corp, ExxonMobil Jiajia Xu Yangzhou, China Schlumberger, Michael Kors Joseph Yang Los Angeles, California Activision Blizzard, Ecolab
2

Agenda
Investment Objectives and Guidelines Economic Overview Security Analysis Portfolio Performance AIM XL Highlights Closing
3

Objectives and Guidelines
AIM Overview Analyst Responsibilities Stock Selection Process Investment Policies Market Capitalization ProNile Ethics Policies
4
Objectives and Guidelines AIM Overview
Course Objectives
§ Provide students with exposure to the process of portfolio management, from asset allocation decisions through individual stock evaluation
§ Combines academic theory with hands-‐on experience
Analyst Selection
§ Selection based on academic record and professional experience § Analysts assume responsibilities for all portfolio management decisions
5
Objectives and Guidelines Analyst Responsibilities
§ Each analyst covers two companies: § First round: assigned stock from current portfolio § Second round: selected stock of interest
§ For each stock, analysts produce and present a series of reports: § Company Overview § Fundamental Analysis § Industry Report § EPS Forecast § Technical Analysis § Valuation and Final Recommendation
6
Objectives and Guidelines Group Responsibilities
Economic Outlook Portfolio Performance
Newsletter Trading
§ Analyze recent developments and trends of economic factors
§ Assess portfolio impact
§ Analyze risk-‐adjusted performance and portfolio attribution
§ Report on recent and long-‐term performance compared to benchmarks
§ Manage trading activities for portfolio
§ Maintain communication with Investment OfNice
§ Produce quarterly newsletters to alumni and advisory board
§ Provide economic and performance summaries, as well as alumni updates.
7
8
§ Analysts discuss inputs, drivers, and potential upside/downside risk
§ Analysts provide buy, hold, or sell recommendations based on an intrinsic valuation
§ Final portfolio positions require a majority vote of all analysts
§ AIM XL allowed to take long and short positions using sector ETFs in industries that exhibit positive and negative trends
Objectives and Guidelines Stock Selection Process
9
§ Long-‐term objective is to outperform the returns of the S&P 500 by identifying undervalued stocks
§ Additional benchmarks § Russell 2000 § Hank Blended Index (HBI) (65% S&P 500, 35% Russell 2000)
§ Bottom-‐up approach, accompanied by top-‐down consideration § Determine intrinsic value of stock while maintaining macroeconomic and speciNic industry outlook
§ Risk is not actively managed since portfolio diversiNication naturally limits risk
Objectives and Guidelines Investment Philosophy
10
§ Liquidity § Stocks should have high liquidity
§ Time Horizon § Long-‐term (3-‐5 years)
§ Laws & Regulation § Fund abides by “Prudent Person Rule”
§ Tax Considerations § Not a constraint for the fund given its tax-‐exempt status
Objectives and Guidelines Investment Constraints
11
§ Common equities traded on major US exchanges
§ Sector Allocation should be roughly that of the S&P 500
§ Portfolio Target Allocation § 35% in Small & Mid-‐Cap stocks § 65% in Large-‐Cap stocks § +/-‐ 10% boundary
§ Any one stock should not exceed 10% of the portfolio
§ Goal is to be fully invested
Objectives and Guidelines Investment Guidelines
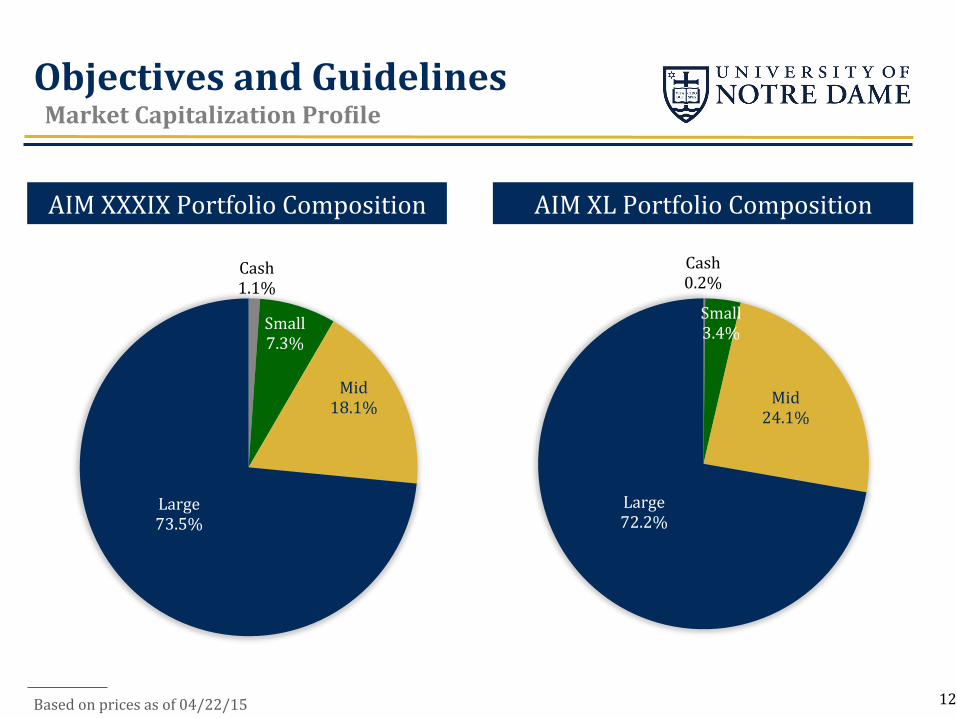
Objectives and Guidelines Market Capitalization ProQile
AIM XXXIX Portfolio Composition AIM XL Portfolio Composition
Based on prices as of 04/22/15
Cash 0.2%
Small 3.4%
Mid 24.1%
Large 72.2%
Cash 1.1%
Small 7.3%
Mid 18.1%
Large 73.5%
12
13
Avoid companies “whose values are not consistent with those of the University” § Including (but not limited to):
§ Abortifacients § Birth Control § Tobacco
Objectives and Guidelines Ethics Policies

Economic Overview Summary & Thesis GDP Projections Employment InNlation & Interest Rates Fuel Prices Currencies Global Events Economic Impact Analysis
14
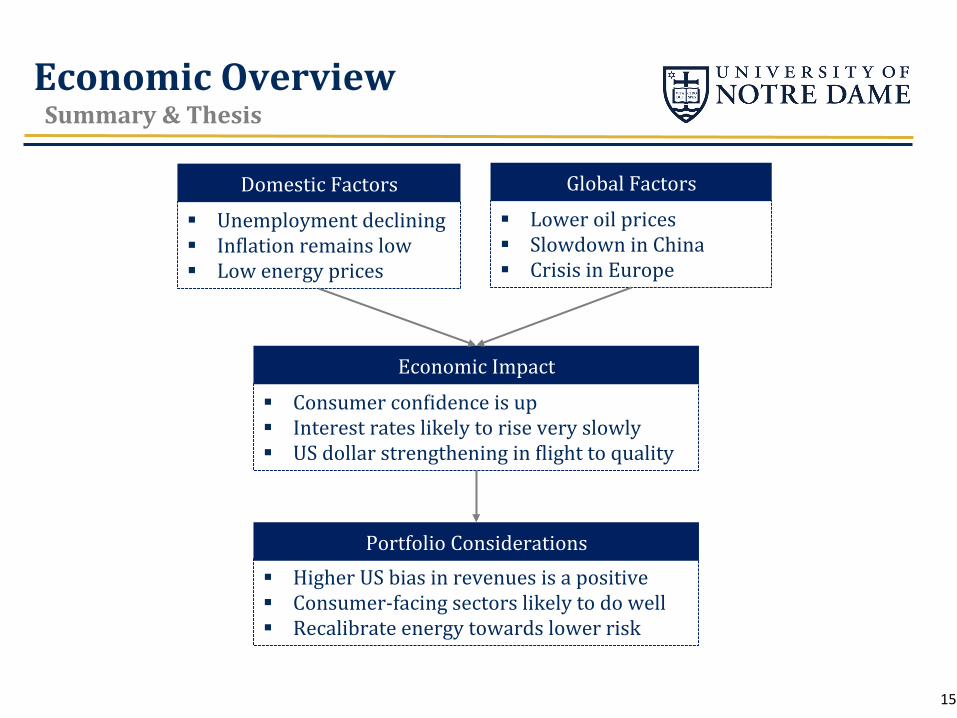
§ Unemployment declining § InNlation remains low § Low energy prices
Domestic Factors § Lower oil prices § Slowdown in China § Crisis in Europe
Global Factors
§ Consumer conNidence is up § Interest rates likely to rise very slowly § US dollar strengthening in Nlight to quality
Economic Impact
§ Higher US bias in revenues is a positive § Consumer-‐facing sectors likely to do well § Recalibrate energy towards lower risk
Portfolio Considerations
15
Economic Overview Summary & Thesis
Source: U.S. Bureau of Economic Analysis, IMF
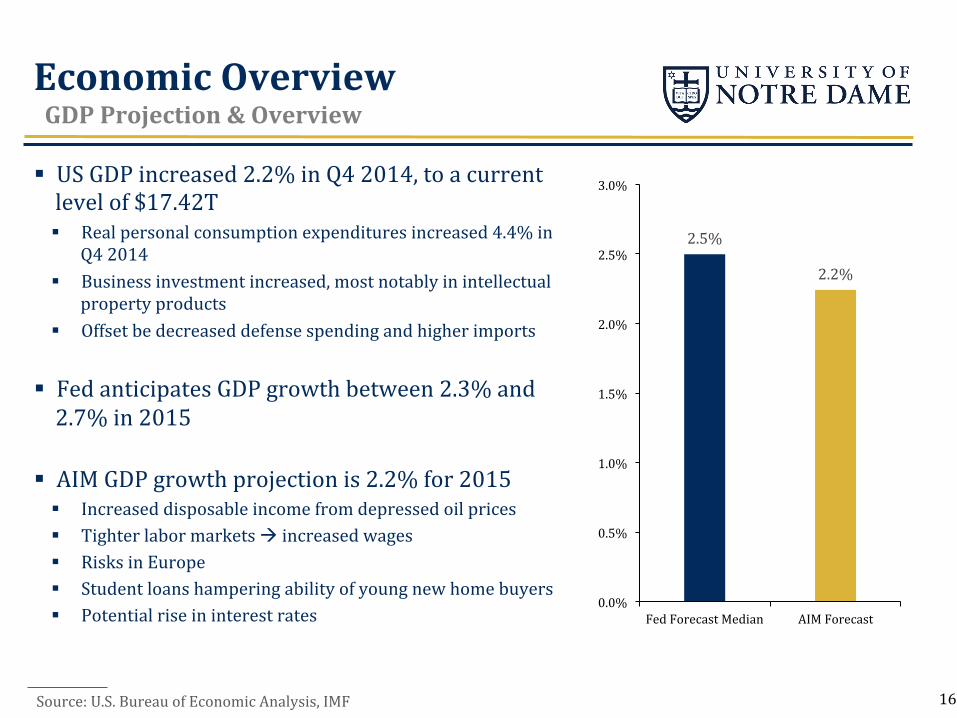
Economic Overview GDP Projection & Overview
16
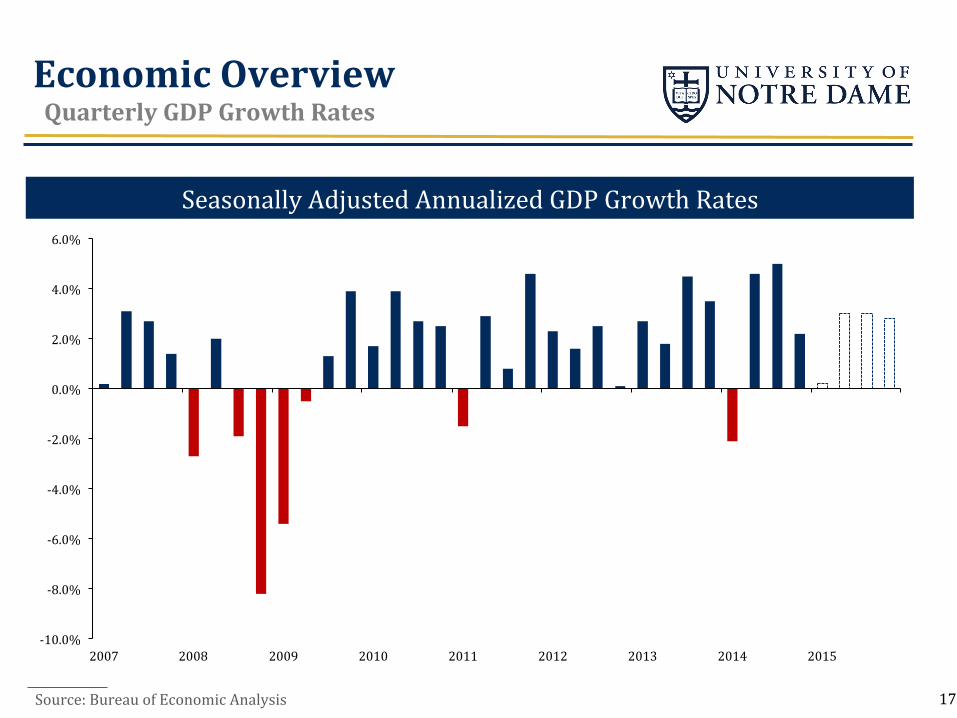
§ US GDP increased 2.2% in Q4 2014, to a current level of $17.42T § Real personal consumption expenditures increased 4.4% in
Q4 2014 § Business investment increased, most notably in intellectual
property products § Offset be decreased defense spending and higher imports
§ Fed anticipates GDP growth between 2.3% and 2.7% in 2015
§ AIM GDP growth projection is 2.2% for 2015 § Increased disposable income from depressed oil prices § Tighter labor markets à increased wages § Risks in Europe § Student loans hampering ability of young new home buyers § Potential rise in interest rates
2.5%
2.2%
0.0%
0.5%
1.0%
1.5%
2.0%
2.5%
3.0%
Fed Forecast Median AIM Forecast
17
-‐10.0%
-‐8.0%
-‐6.0%
-‐4.0%
-‐2.0%
0.0%
2.0%
4.0%
6.0%
2007 2008 2009 2010 2011 2012 2013 2014 2015
Seasonally Adjusted Annualized GDP Growth Rates
Source: Bureau of Economic Analysis
Economic Overview Quarterly GDP Growth Rates
18
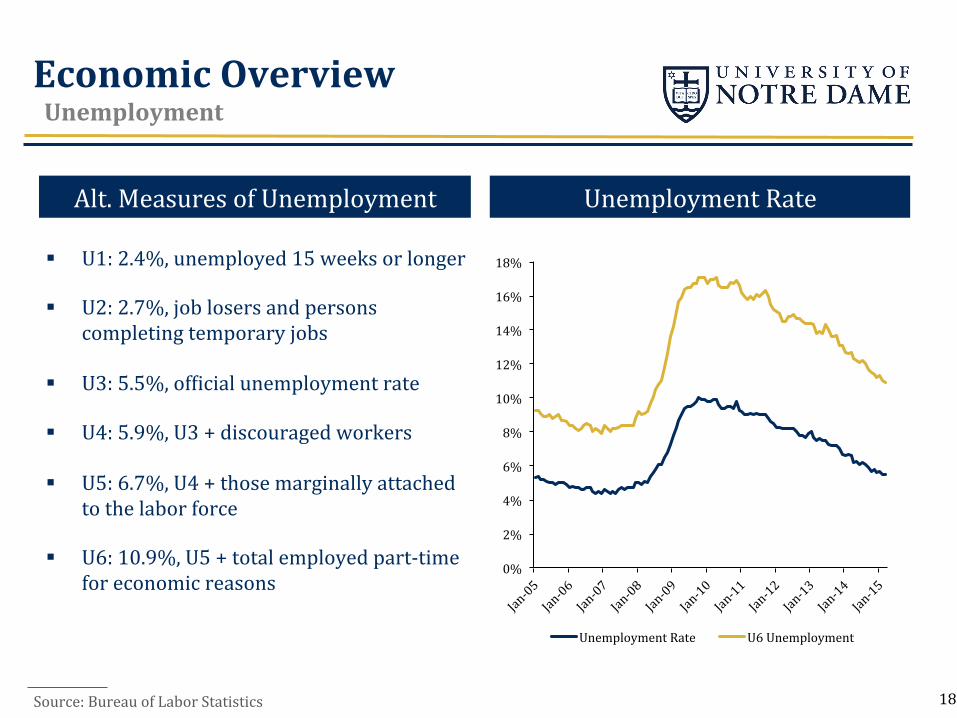
0%
2%
4%
6%
8%
10%
12%
14%
16%
18%
Unemployment Rate U6 Unemployment
Unemployment Rate Alt. Measures of Unemployment
Economic Overview Unemployment
Source: Bureau of Labor Statistics
§ U1: 2.4%, unemployed 15 weeks or longer
§ U2: 2.7%, job losers and persons completing temporary jobs
§ U3: 5.5%, ofNicial unemployment rate
§ U4: 5.9%, U3 + discouraged workers
§ U5: 6.7%, U4 + those marginally attached to the labor force
§ U6: 10.9%, U5 + total employed part-‐time for economic reasons
19
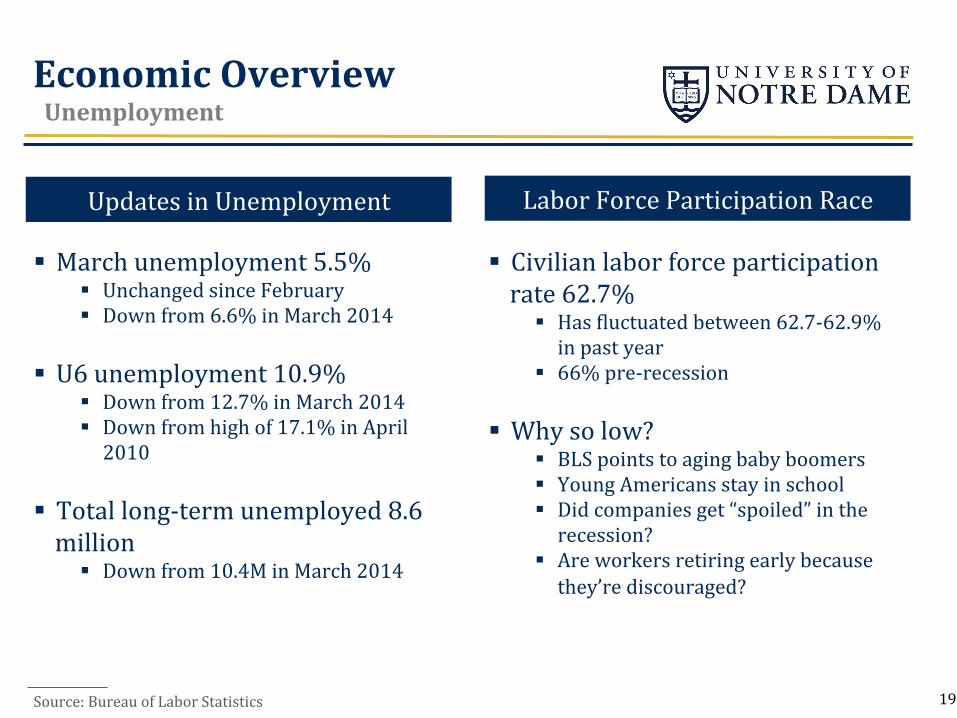
Updates in Unemployment Labor Force Participation Race
Source: Bureau of Labor Statistics
Economic Overview Unemployment
§ Civilian labor force participation rate 62.7%
§ Has Nluctuated between 62.7-‐62.9% in past year
§ 66% pre-‐recession
§ Why so low? § BLS points to aging baby boomers § Young Americans stay in school § Did companies get “spoiled” in the recession?
§ Are workers retiring early because they’re discouraged?
§ March unemployment 5.5% § Unchanged since February § Down from 6.6% in March 2014
§ U6 unemployment 10.9% § Down from 12.7% in March 2014 § Down from high of 17.1% in April 2010
§ Total long-‐term unemployed 8.6 million
§ Down from 10.4M in March 2014
0.0%
0.5%
1.0%
1.5%
2.0%
2.5%
3.0%
3.5%
4.0%
20
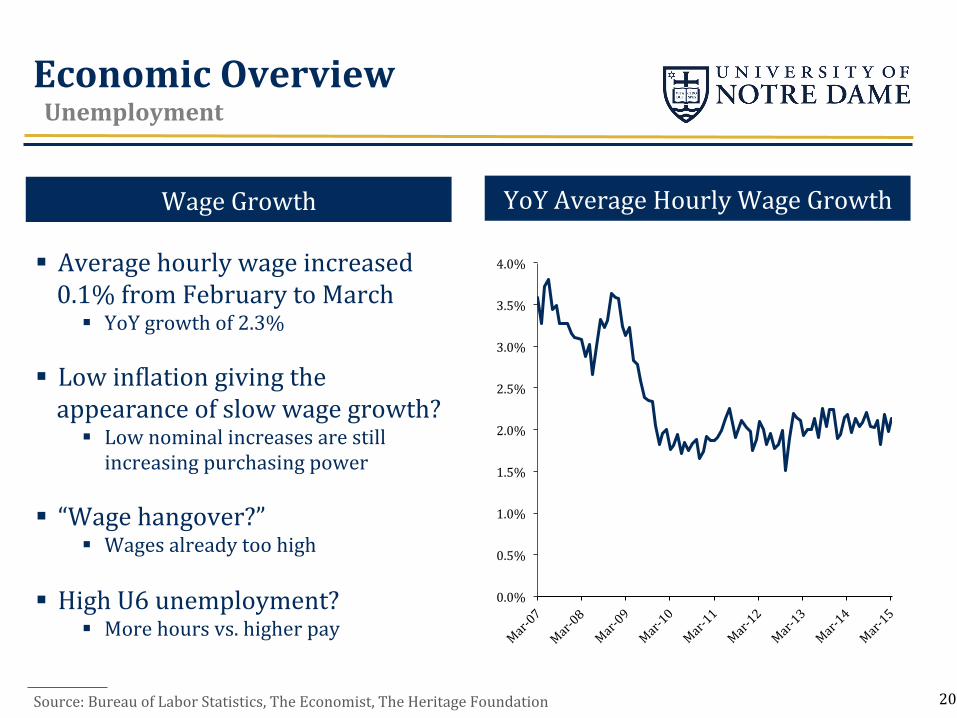
Wage Growth YoY Average Hourly Wage Growth
Source: Bureau of Labor Statistics, The Economist, The Heritage Foundation
Economic Overview Unemployment
§ Average hourly wage increased 0.1% from February to March
§ YoY growth of 2.3%
§ Low inNlation giving the appearance of slow wage growth?
§ Low nominal increases are still increasing purchasing power
§ “Wage hangover?”
§ Wages already too high
§ High U6 unemployment? § More hours vs. higher pay
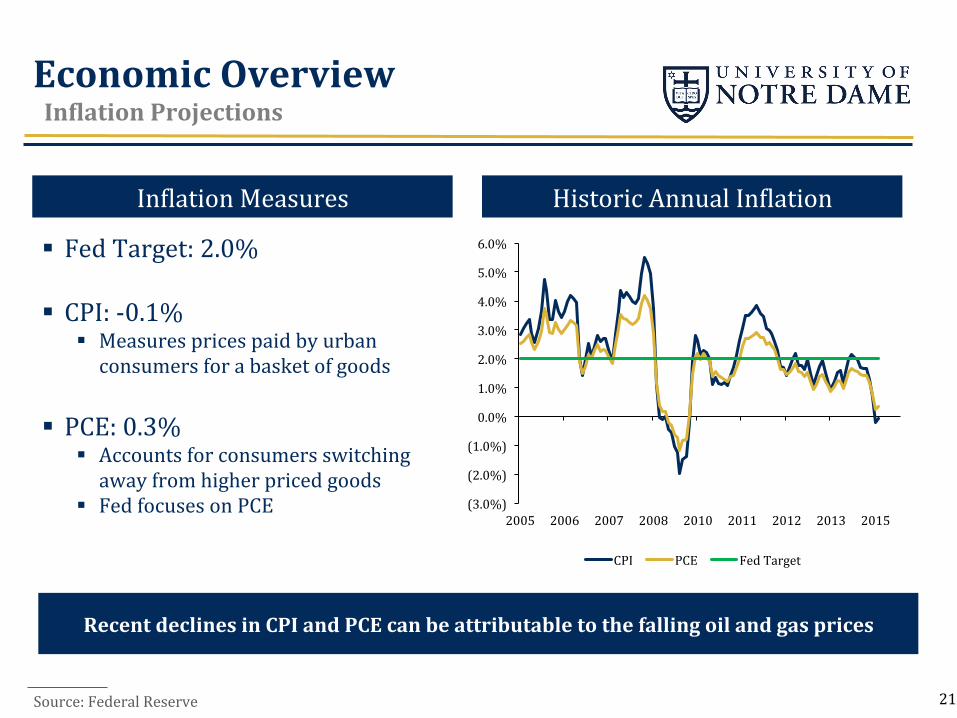
Economic Overview InQlation Projections
InNlation Measures Historic Annual InNlation
§ Fed Target: 2.0% § CPI: -‐0.1%
§ Measures prices paid by urban consumers for a basket of goods
§ PCE: 0.3%
§ Accounts for consumers switching away from higher priced goods
§ Fed focuses on PCE
Recent declines in CPI and PCE can be attributable to the falling oil and gas prices
21
(3.0%)
(2.0%)
(1.0%)
0.0%
1.0%
2.0%
3.0%
4.0%
5.0%
6.0%
2005 2006 2007 2008 2010 2011 2012 2013 2015
CPI PCE Fed Target
Source: Federal Reserve
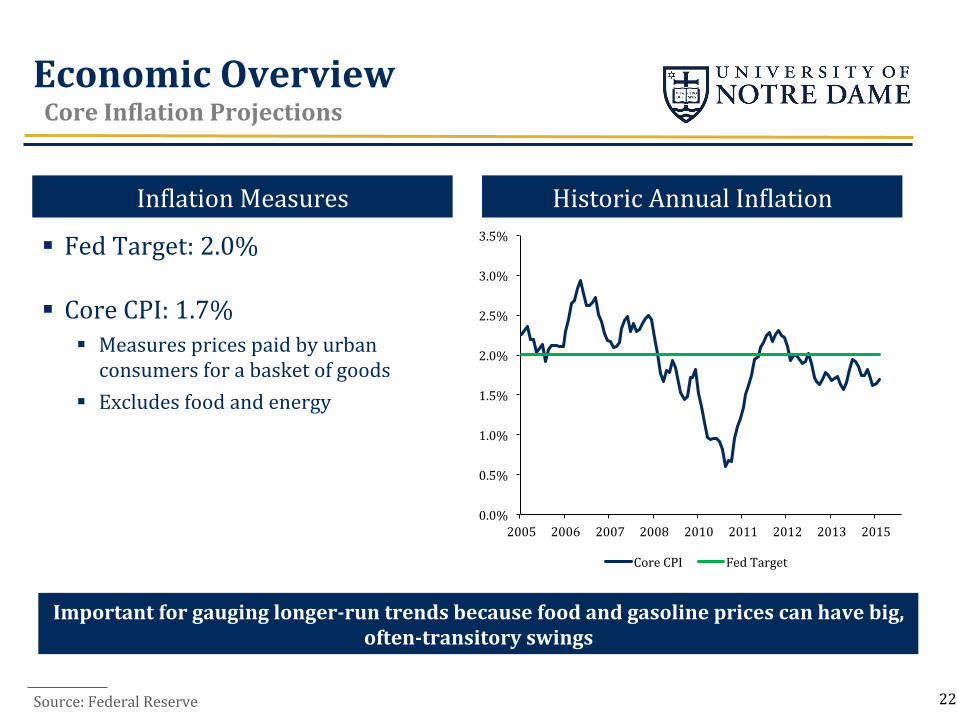
InNlation Measures Historic Annual InNlation
§ Fed Target: 2.0%
§ Core CPI: 1.7% § Measures prices paid by urban consumers for a basket of goods
§ Excludes food and energy
22
0.0%
0.5%
1.0%
1.5%
2.0%
2.5%
3.0%
3.5%
2005 2006 2007 2008 2010 2011 2012 2013 2015
Core CPI Fed Target
Important for gauging longer-‐run trends because food and gasoline prices can have big, often-‐transitory swings
Economic Overview Core InQlation Projections
Source: Federal Reserve
$1.0
$1.5
$2.0
$2.5
$3.0
$3.5
$4.0
$4.5
2011 2012 2013 2014 2015
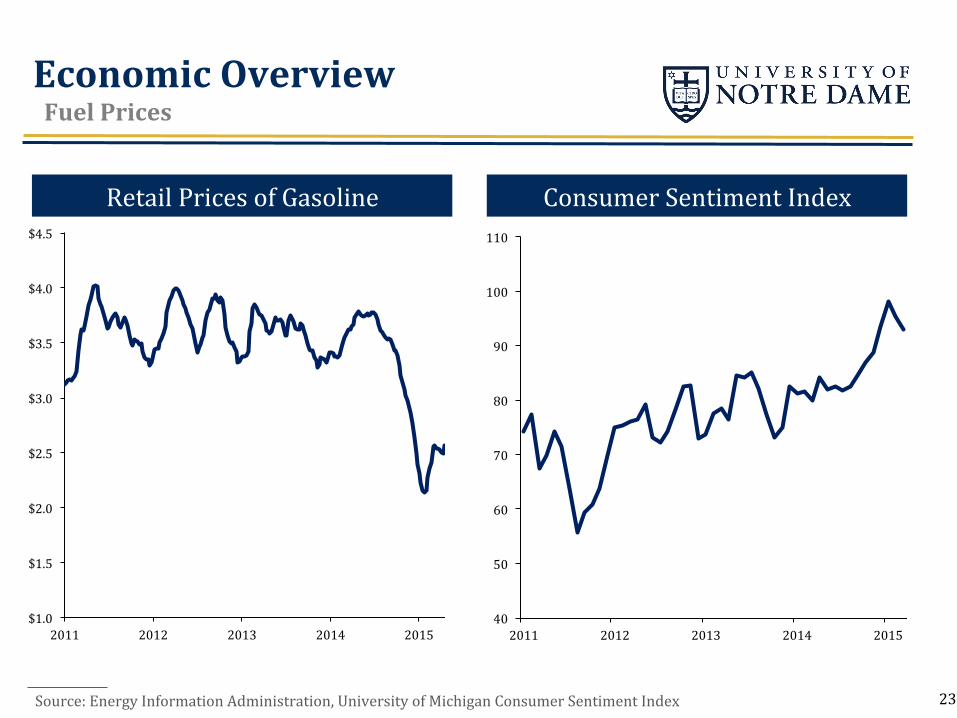
Retail Prices of Gasoline
Source: Energy Information Administration, University of Michigan Consumer Sentiment Index
Consumer Sentiment Index
40
50
60
70
80
90
100
110
2011 2012 2013 2014 2015
23
Economic Overview Fuel Prices
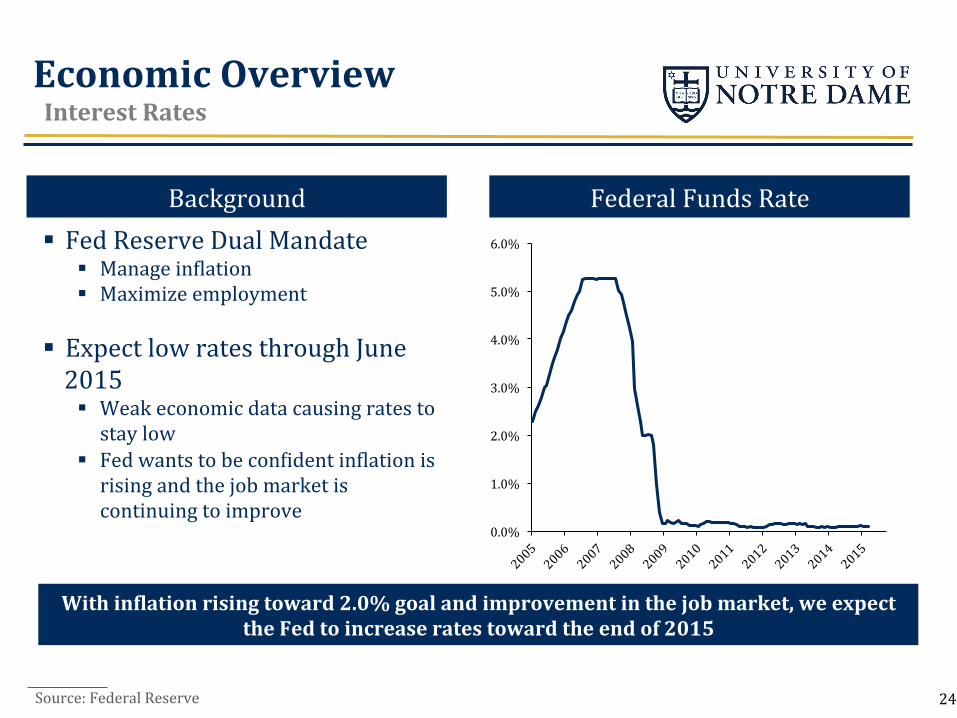
Background Federal Funds Rate § Fed Reserve Dual Mandate
§ Manage inNlation § Maximize employment
§ Expect low rates through June 2015 § Weak economic data causing rates to stay low
§ Fed wants to be conNident inNlation is rising and the job market is continuing to improve
Source: Federal Reserve 24
0.0%
1.0%
2.0%
3.0%
4.0%
5.0%
6.0%
With inQlation rising toward 2.0% goal and improvement in the job market, we expect the Fed to increase rates toward the end of 2015
Economic Overview Interest Rates
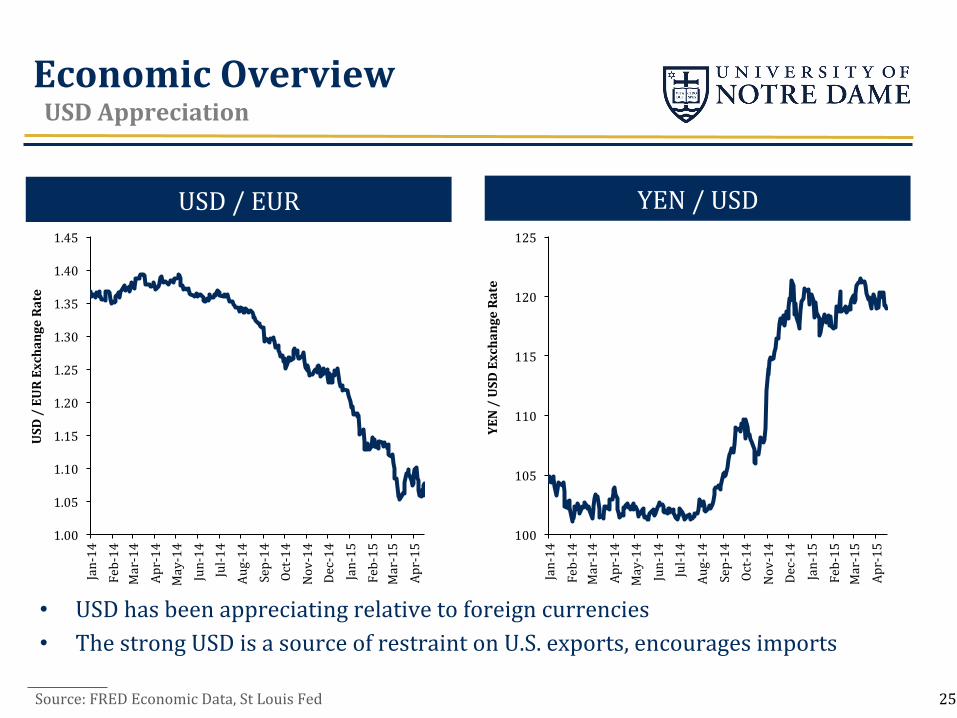
USD / EUR YEN / USD
Source: FRED Economic Data, St Louis Fed
• USD has been appreciating relative to foreign currencies • The strong USD is a source of restraint on U.S. exports, encourages imports
25
1.00
1.05
1.10
1.15
1.20
1.25
1.30
1.35
1.40
1.45
Jan-‐14
Feb-‐14
Mar-‐14
Apr-‐14
May-‐14
Jun-‐14
Jul-‐14
Aug-‐14
Sep-‐14
Oct-‐14
Nov-‐14
Dec-‐14
Jan-‐15
Feb-‐15
Mar-‐15
Apr-‐15
USD / EUR Exchange Rate
100
105
110
115
120
125
Jan-‐14
Feb-‐14
Mar-‐14
Apr-‐14
May-‐14
Jun-‐14
Jul-‐14
Aug-‐14
Sep-‐14
Oct-‐14
Nov-‐14
Dec-‐14
Jan-‐15
Feb-‐15
Mar-‐15
Apr-‐15
YEN / USD Exchange Rate
Economic Overview USD Appreciation
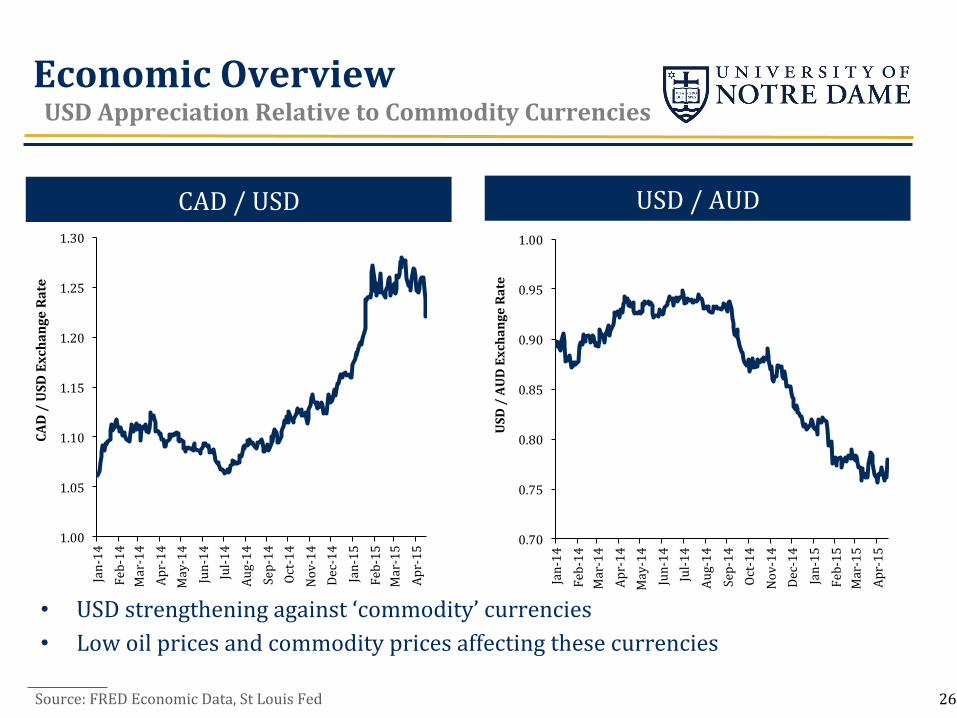
CAD / USD USD / AUD
Source: FRED Economic Data, St Louis Fed
• USD strengthening against ‘commodity’ currencies • Low oil prices and commodity prices affecting these currencies
26
1.00
1.05
1.10
1.15
1.20
1.25
1.30
Jan-‐14
Feb-‐14
Mar-‐14
Apr-‐14
May-‐14
Jun-‐14
Jul-‐14
Aug-‐14
Sep-‐14
Oct-‐14
Nov-‐14
Dec-‐14
Jan-‐15
Feb-‐15
Mar-‐15
Apr-‐15
CAD / USD Exchange Rate
0.70
0.75
0.80
0.85
0.90
0.95
1.00
Jan-‐14
Feb-‐14
Mar-‐14
Apr-‐14
May-‐14
Jun-‐14
Jul-‐14
Aug-‐14
Sep-‐14
Oct-‐14
Nov-‐14
Dec-‐14
Jan-‐15
Feb-‐15
Mar-‐15
Apr-‐15
USD / AUD Exchange Rate
Economic Overview USD Appreciation Relative to Commodity Currencies
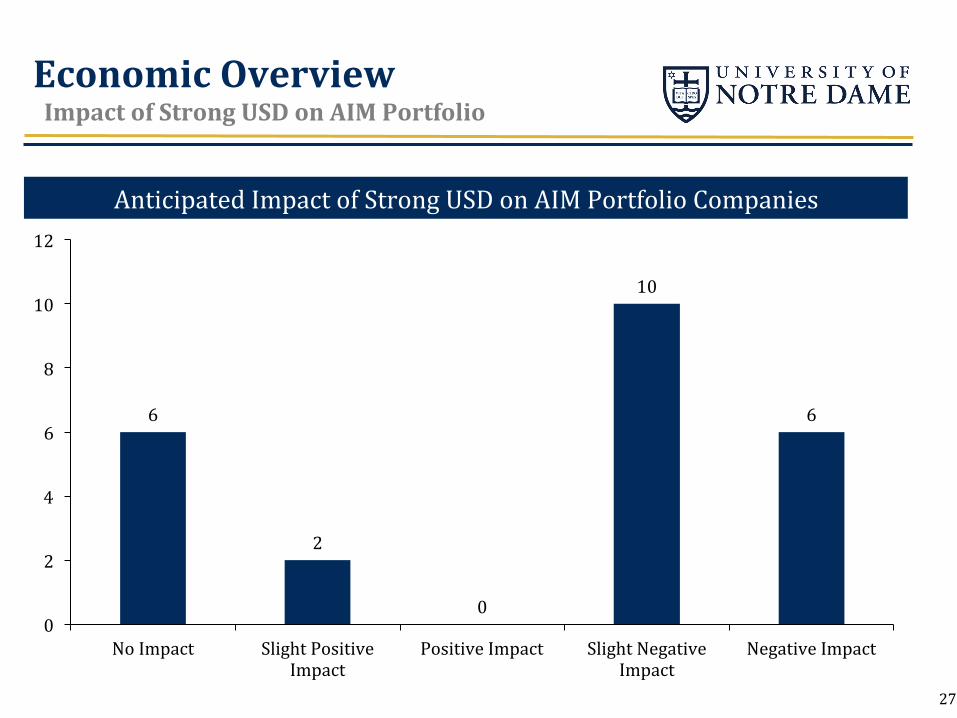
Anticipated Impact of Strong USD on AIM Portfolio Companies
6
2
0
10
6
0
2
4
6
8
10
12
No Impact Slight Positive Impact
Positive Impact Slight Negative Impact
Negative Impact
27
Economic Overview Impact of Strong USD on AIM Portfolio
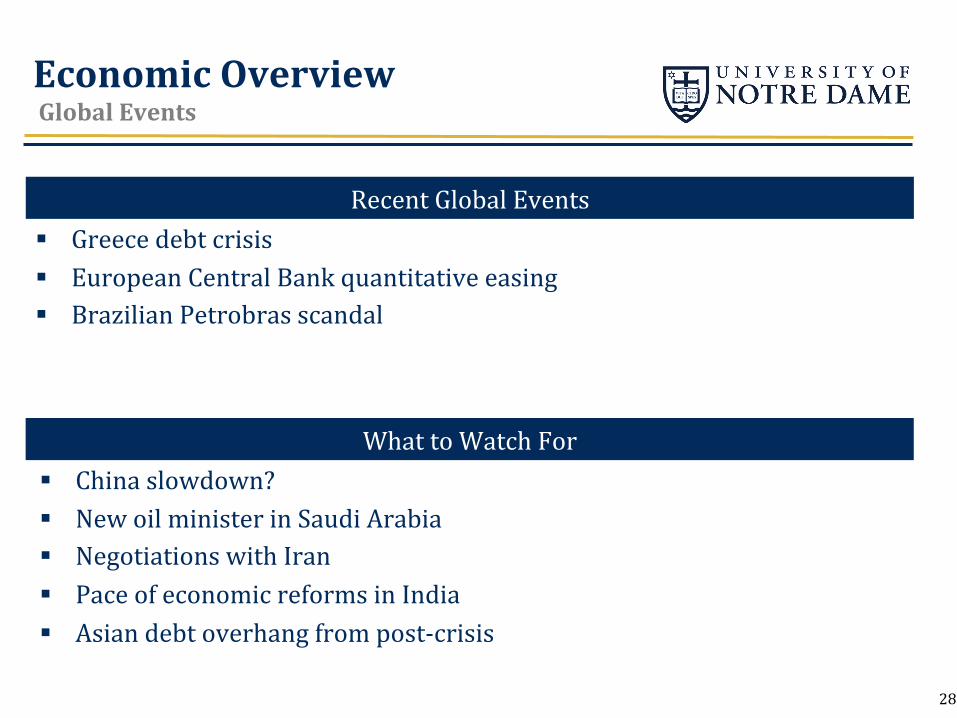
Recent Global Events
What to Watch For
§ Greece debt crisis § European Central Bank quantitative easing § Brazilian Petrobras scandal
§ China slowdown? § New oil minister in Saudi Arabia § Negotiations with Iran § Pace of economic reforms in India § Asian debt overhang from post-‐crisis
28
Economic Overview Global Events
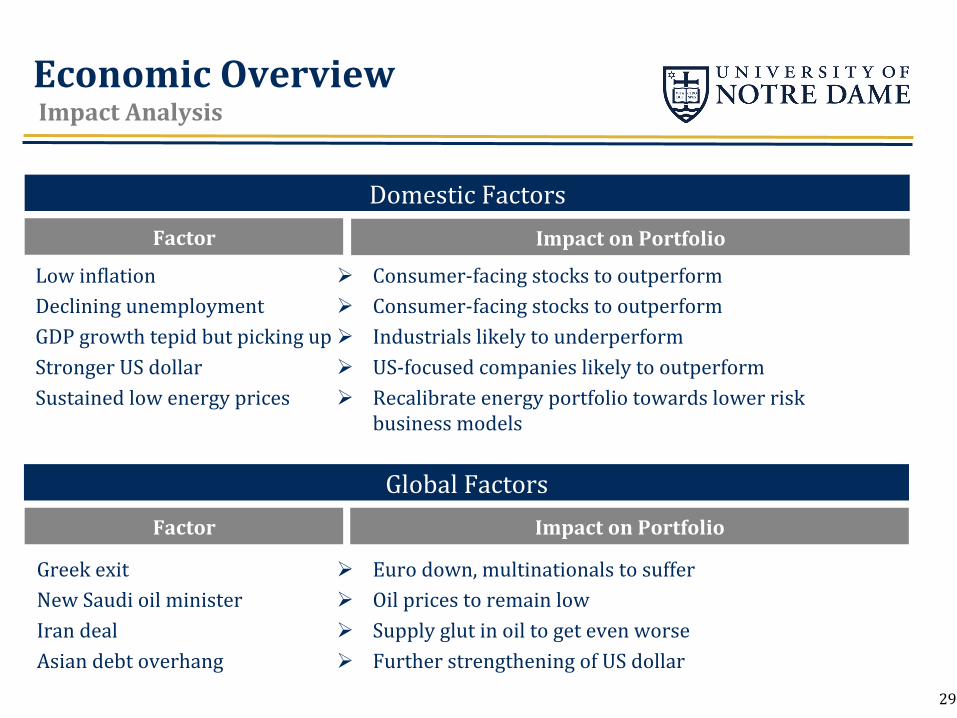
Low inNlation Declining unemployment GDP growth tepid but picking up Stronger US dollar Sustained low energy prices
Ø Consumer-‐facing stocks to outperform Ø Consumer-‐facing stocks to outperform Ø Industrials likely to underperform Ø US-‐focused companies likely to outperform Ø Recalibrate energy portfolio towards lower risk
business models
Factor Impact on Portfolio
Domestic Factors
Global Factors
Greek exit New Saudi oil minister Iran deal Asian debt overhang
Ø Euro down, multinationals to suffer Ø Oil prices to remain low Ø Supply glut in oil to get even worse Ø Further strengthening of US dollar
29
Factor Impact on Portfolio
Economic Overview Impact Analysis
Security Analysis Overview Growth Dynamics Discovery Fundamental Analysis Technical Analysis Management Team Industry Dynamics EPS and Valuation
30
Security Analysis Overview
31
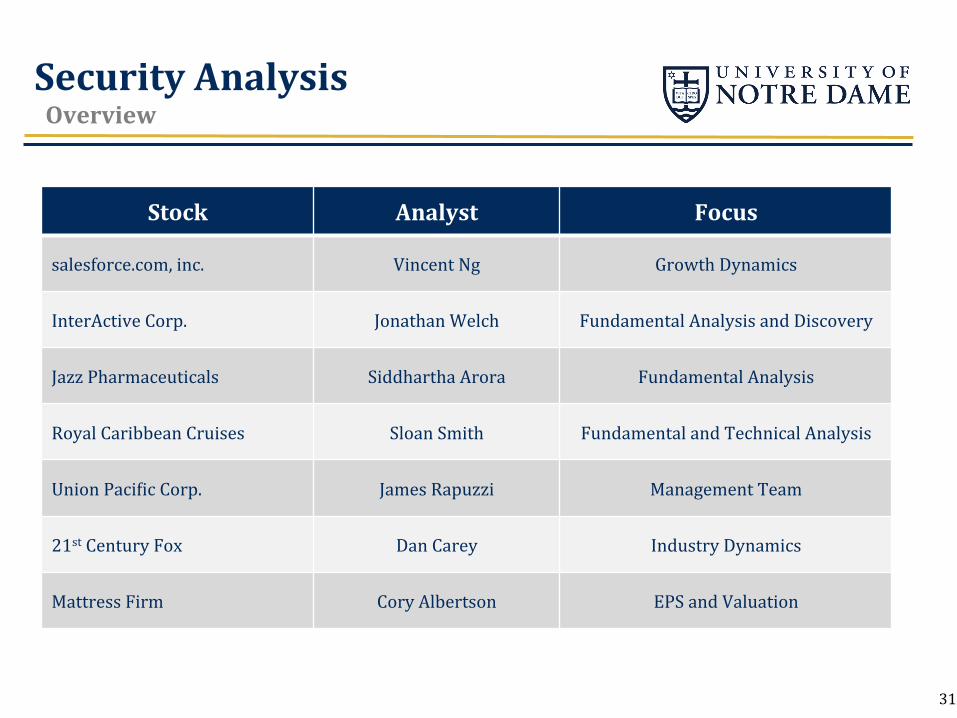
Stock Analyst Focus
salesforce.com, inc. Vincent Ng Growth Dynamics
InterActive Corp. Jonathan Welch Fundamental Analysis and Discovery
Jazz Pharmaceuticals Siddhartha Arora Fundamental Analysis
Royal Caribbean Cruises Sloan Smith Fundamental and Technical Analysis
Union PaciNic Corp. James Rapuzzi Management Team
21st Century Fox Dan Carey Industry Dynamics
Mattress Firm Cory Albertson EPS and Valuation
Security Analysis Overview
32
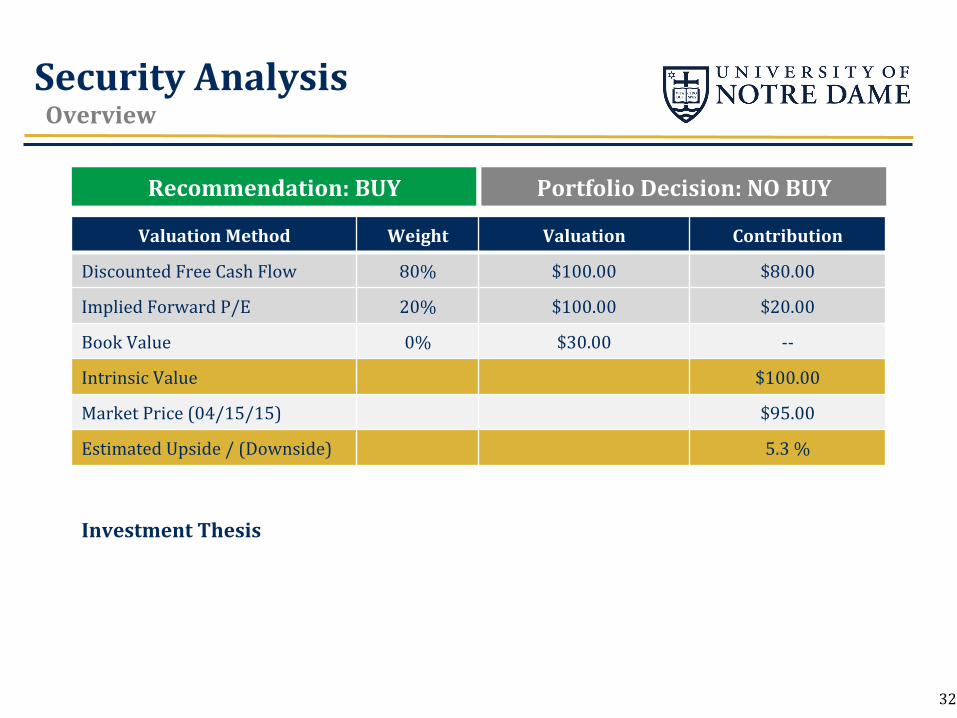
Investment Thesis
Recommendation: BUY
Valuation Method Weight Valuation Contribution
Discounted Free Cash Flow 80% $100.00 $80.00
Implied Forward P/E 20% $100.00 $20.00
Book Value 0% $30.00 -‐-‐
Intrinsic Value $100.00
Market Price (04/15/15) $95.00
Estimated Upside / (Downside) 5.3 %
Portfolio Decision: NO BUY
$30
$40
$50
$60
$70
$80
$90
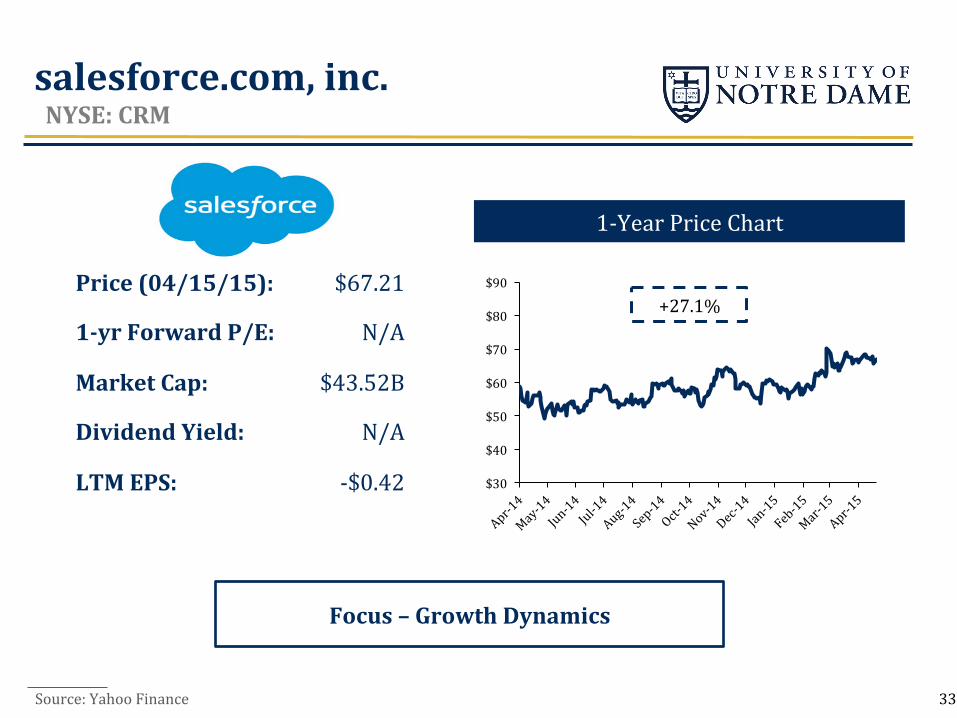
salesforce.com, inc. NYSE: CRM
Source: Yahoo Finance
1-‐Year Price Chart
Focus – Growth Dynamics
+27.1% Price (04/15/15):
1-‐yr Forward P/E:
Market Cap:
Dividend Yield:
LTM EPS:
$67.21
N/A
$43.52B
N/A
-‐$0.42
33
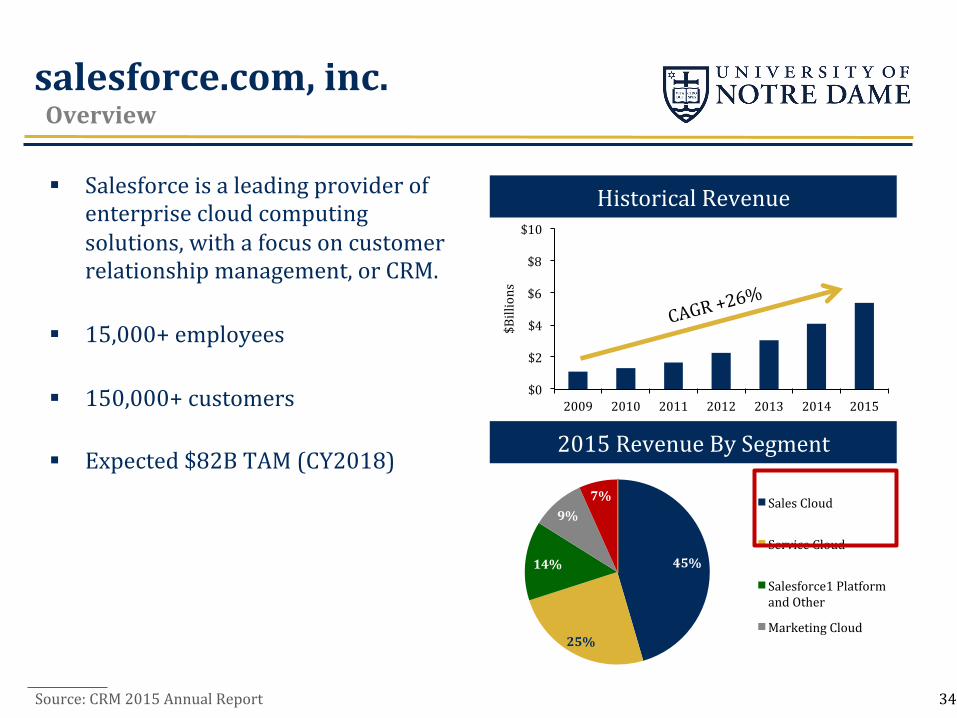
salesforce.com, inc. Overview
Source: CRM 2015 Annual Report
Historical Revenue
2015 Revenue By Segment
$0
$2
$4
$6
$8
$10
2009 2010 2011 2012 2013 2014 2015
$Billions
CAGR +26%
45%
25%
14%
9% 7% Sales Cloud
Service Cloud
Salesforce1 Platform and Other
Marketing Cloud
§ Salesforce is a leading provider of enterprise cloud computing solutions, with a focus on customer relationship management, or CRM.
§ 15,000+ employees
§ 150,000+ customers
§ Expected $82B TAM (CY2018)
34
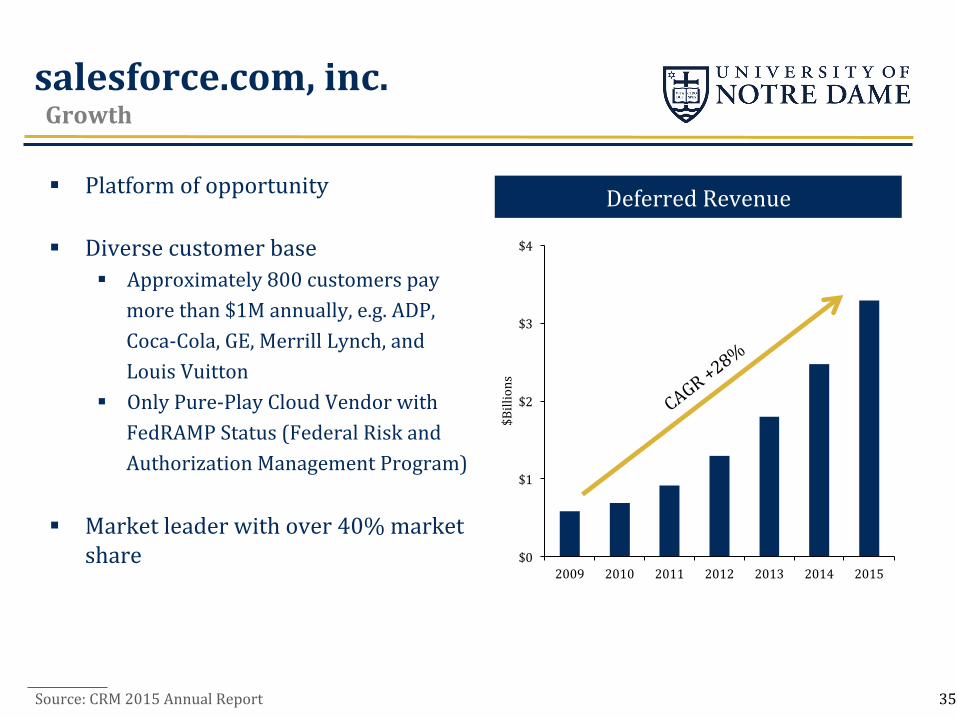
salesforce.com, inc. Growth
Source: CRM 2015 Annual Report
Deferred Revenue
$0
$1
$2
$3
$4
2009 2010 2011 2012 2013 2014 2015
$Billions
§ Platform of opportunity
§ Diverse customer base § Approximately 800 customers pay
more than $1M annually, e.g. ADP, Coca-‐Cola, GE, Merrill Lynch, and Louis Vuitton
§ Only Pure-‐Play Cloud Vendor with FedRAMP Status (Federal Risk and Authorization Management Program)
§ Market leader with over 40% market share
35
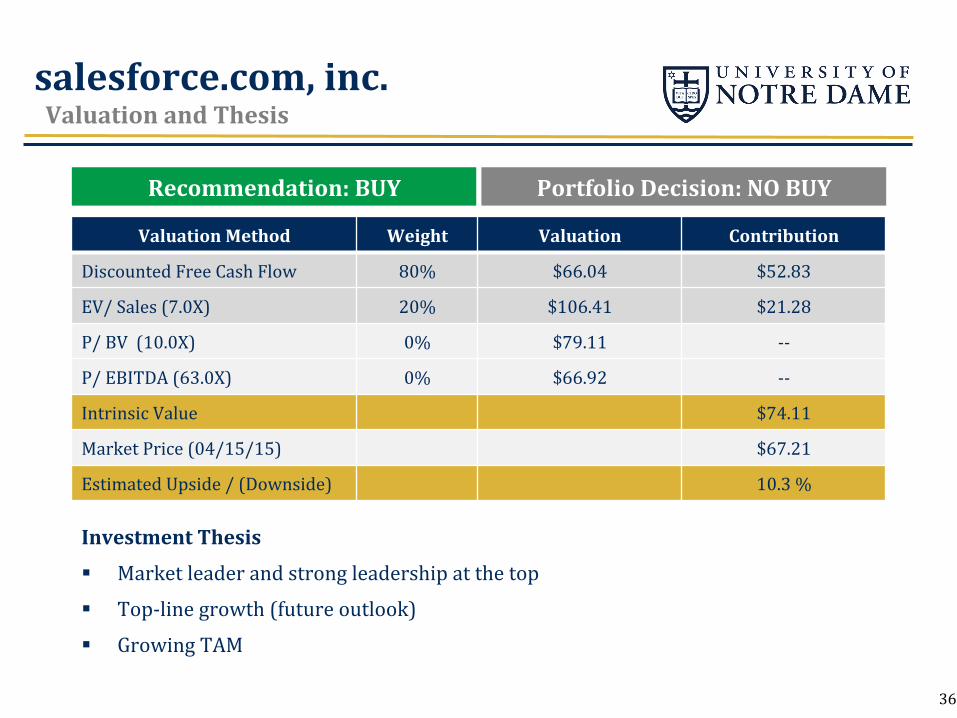
salesforce.com, inc. Valuation and Thesis
Valuation Method Weight Valuation Contribution
Discounted Free Cash Flow 80% $66.04 $52.83
EV/ Sales (7.0X) 20% $106.41 $21.28
P/ BV (10.0X) 0% $79.11 -‐-‐
P/ EBITDA (63.0X) 0% $66.92 -‐-‐
Intrinsic Value $74.11
Market Price (04/15/15) $67.21
Estimated Upside / (Downside) 10.3 %
Recommendation: BUY Portfolio Decision: NO BUY
Investment Thesis
§ Market leader and strong leadership at the top
§ Top-‐line growth (future outlook)
§ Growing TAM
36
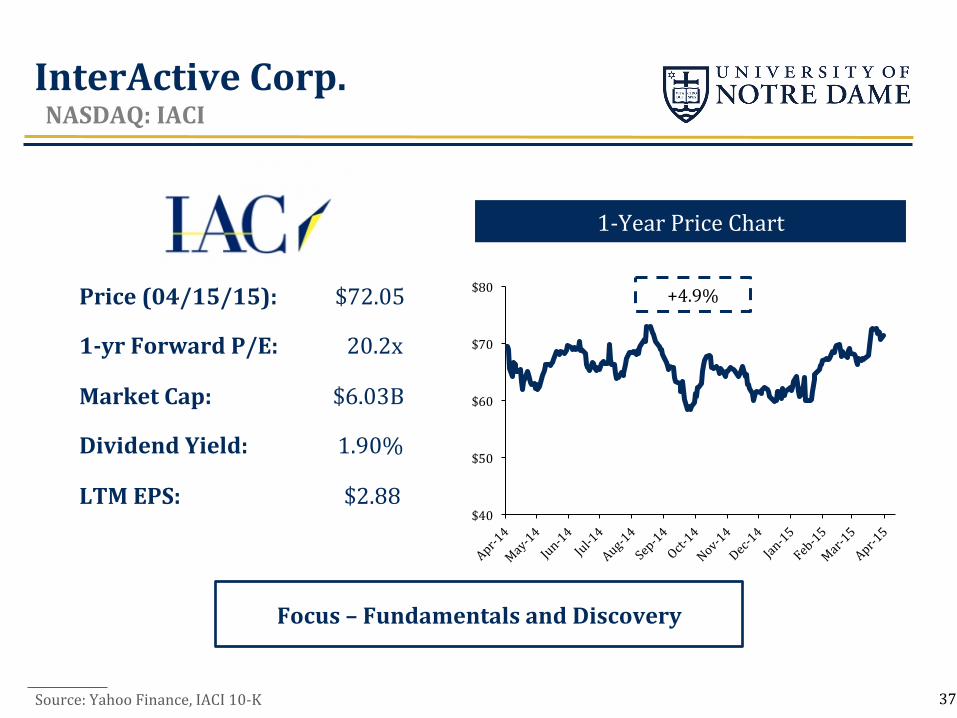
InterActive Corp. NASDAQ: IACI
1-‐Year Price Chart
Focus – Fundamentals and Discovery
$40
$50
$60
$70
$80 +4.9%
Source: Yahoo Finance, IACI 10-‐K
Price (04/15/15): $72.05
1-‐yr Forward P/E: 20.2x
Market Cap: $6.03B
Dividend Yield: 1.90%
LTM EPS: $2.88
37
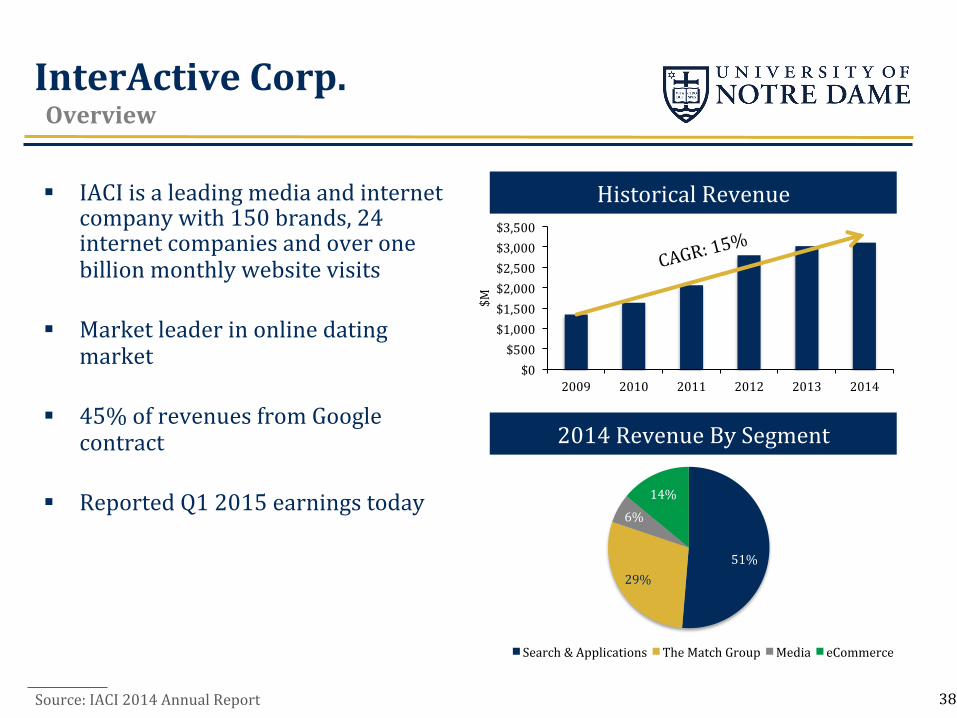
InterActive Corp. Overview
Historical Revenue
2014 Revenue By Segment
51% 29%
6%
14%
Search & Applications The Match Group Media eCommerce
$0 $500
$1,000 $1,500 $2,000 $2,500 $3,000 $3,500
2009 2010 2011 2012 2013 2014
$M
CAGR: 15%
§ IACI is a leading media and internet company with 150 brands, 24 internet companies and over one billion monthly website visits
§ Market leader in online dating market
§ 45% of revenues from Google contract
§ Reported Q1 2015 earnings today
38 Source: IACI 2014 Annual Report
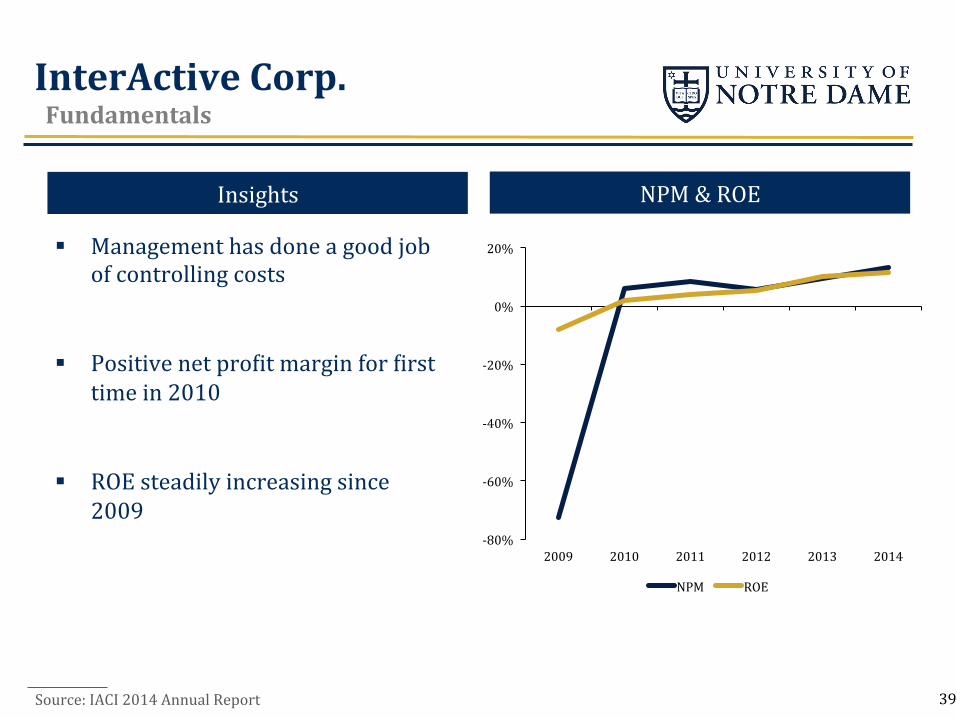
InterActive Corp. Fundamentals
NPM & ROE Insights
-‐80%
-‐60%
-‐40%
-‐20%
0%
20%
2009 2010 2011 2012 2013 2014
NPM ROE
§ Management has done a good job of controlling costs
§ Positive net proNit margin for Nirst time in 2010
§ ROE steadily increasing since 2009
39 Source: IACI 2014 Annual Report
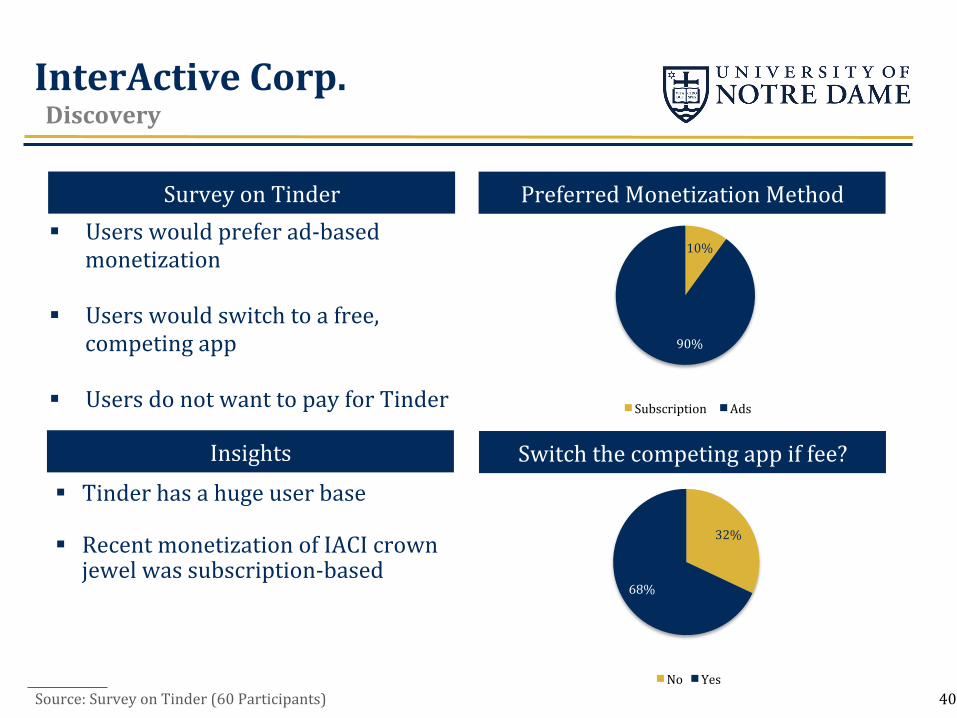
InterActive Corp. Discovery
Survey on Tinder
Insights § Tinder has a huge user base
§ Recent monetization of IACI crown jewel was subscription-‐based
10%
90%
Subscription Ads
Preferred Monetization Method
Switch the competing app if fee?
32%
68%
No Yes Source: Survey on Tinder (60 Participants)
§ Users would prefer ad-‐based monetization
§ Users would switch to a free, competing app
§ Users do not want to pay for Tinder
40
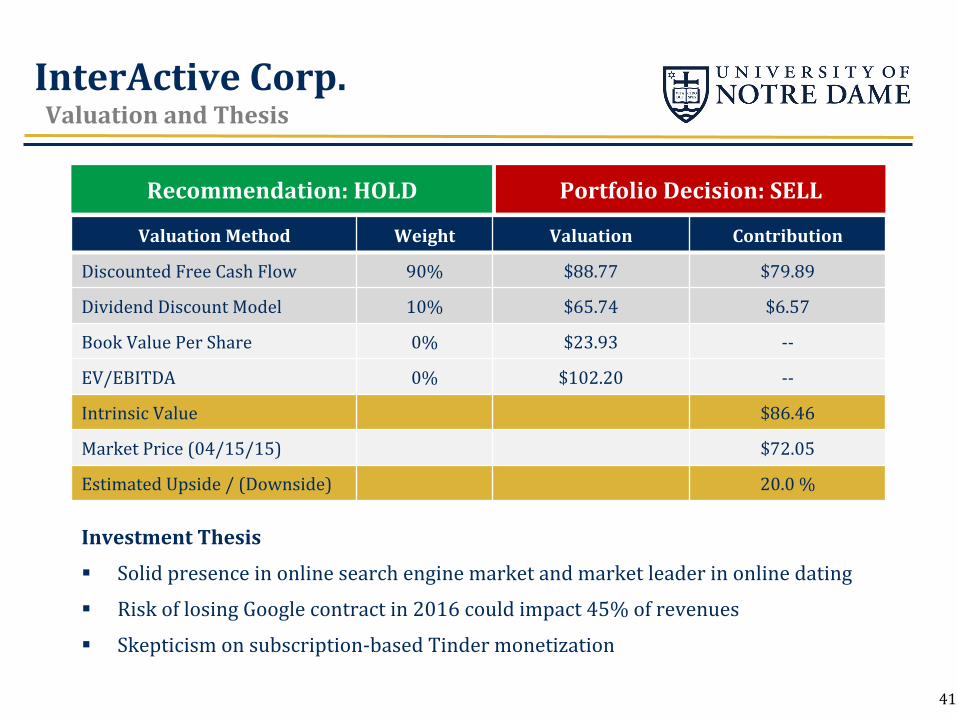
InterActive Corp. Valuation and Thesis
Valuation Method Weight Valuation Contribution
Discounted Free Cash Flow 90% $88.77 $79.89
Dividend Discount Model 10% $65.74 $6.57
Book Value Per Share 0% $23.93 -‐-‐
EV/EBITDA 0% $102.20 -‐-‐
Intrinsic Value $86.46
Market Price (04/15/15) $72.05
Estimated Upside / (Downside) 20.0 %
Recommendation: HOLD Portfolio Decision: SELL
Investment Thesis
§ Solid presence in online search engine market and market leader in online dating
§ Risk of losing Google contract in 2016 could impact 45% of revenues
§ Skepticism on subscription-‐based Tinder monetization
41
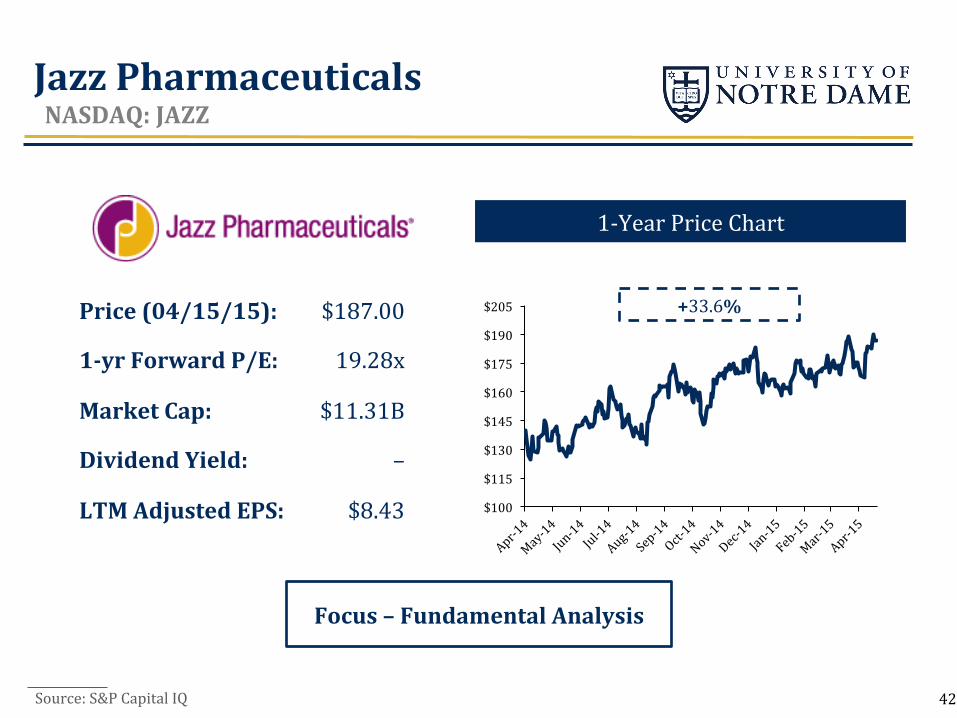
Jazz Pharmaceuticals NASDAQ: JAZZ
Source: S&P Capital IQ
Price (04/15/15):
1-‐yr Forward P/E:
Market Cap:
Dividend Yield:
LTM Adjusted EPS:
$187.00
19.28x
$11.31B
–
$8.43
1-‐Year Price Chart
Focus – Fundamental Analysis
$100
$115
$130
$145
$160
$175
$190
$205 +33.6%
42
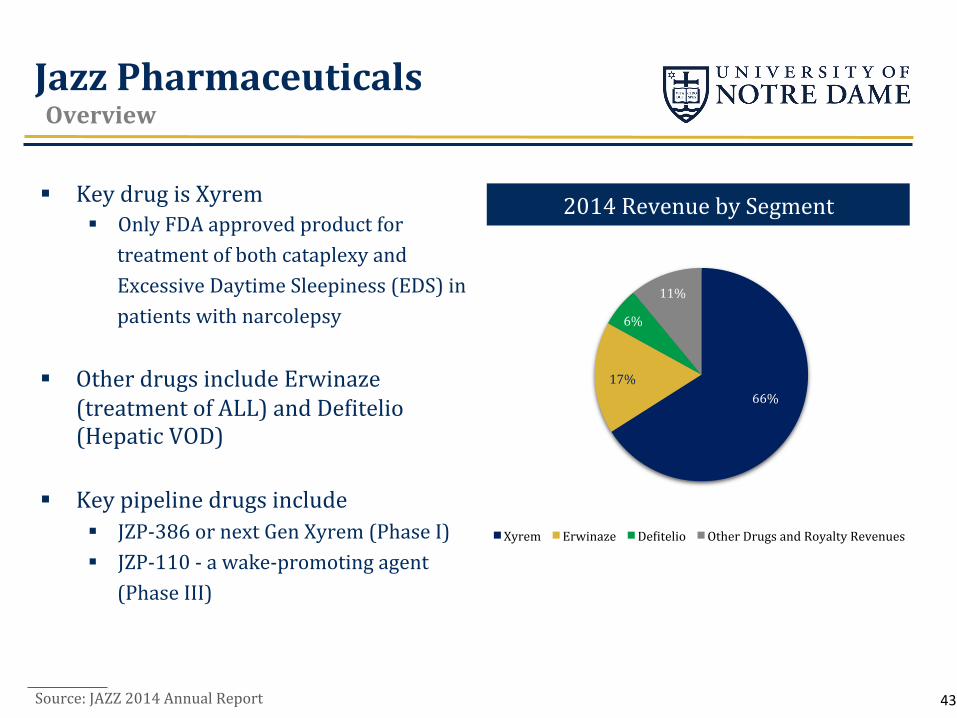
66% 17%
6%
11%
Xyrem Erwinaze DeNitelio Other Drugs and Royalty Revenues
Jazz Pharmaceuticals Overview
2014 Revenue by Segment § Key drug is Xyrem § Only FDA approved product for
treatment of both cataplexy and Excessive Daytime Sleepiness (EDS) in patients with narcolepsy
§ Other drugs include Erwinaze (treatment of ALL) and DeNitelio (Hepatic VOD)
§ Key pipeline drugs include § JZP-‐386 or next Gen Xyrem (Phase I) § JZP-‐110 -‐ a wake-‐promoting agent
(Phase III)
Source: JAZZ 2014 Annual Report 43
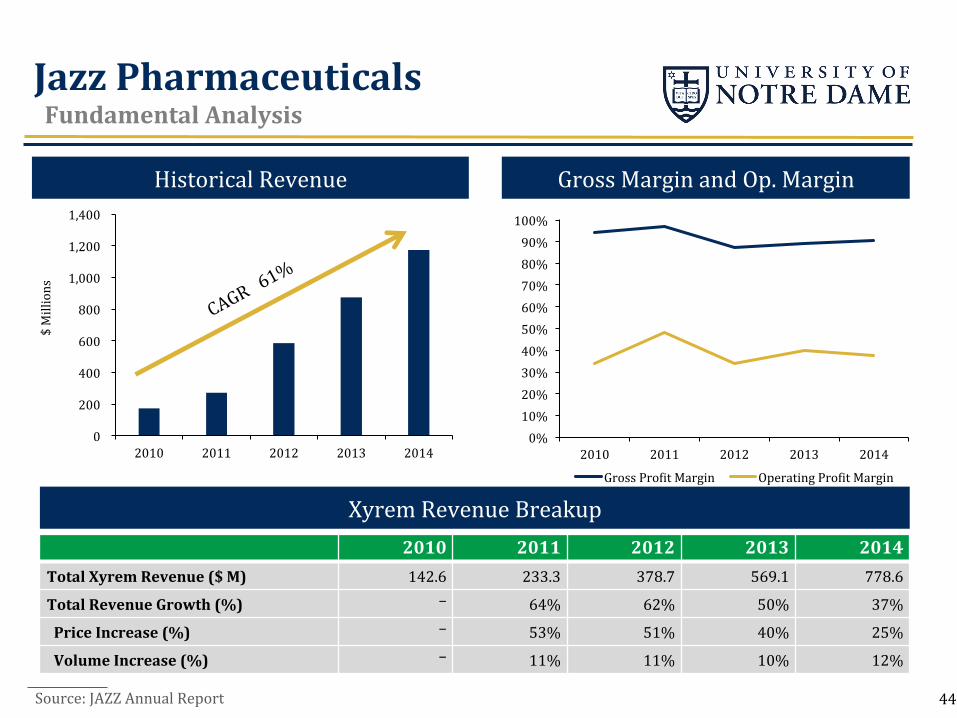
0% 10% 20% 30% 40% 50% 60% 70% 80% 90% 100%
2010 2011 2012 2013 2014
Gross ProNit Margin Operating ProNit Margin
0
200
400
600
800
1,000
1,200
1,400
2010 2011 2012 2013 2014
$ Millions
Gross Margin and Op. Margin Historical Revenue
Jazz Pharmaceuticals Fundamental Analysis
2010 2011 2012 2013 2014 Total Xyrem Revenue ($ M) 142.6 233.3 378.7 569.1 778.6
Total Revenue Growth (%) – 64% 62% 50% 37%
Price Increase (%) – 53% 51% 40% 25%
Volume Increase (%) – 11% 11% 10% 12%
Xyrem Revenue Breakup
44 Source: JAZZ Annual Report
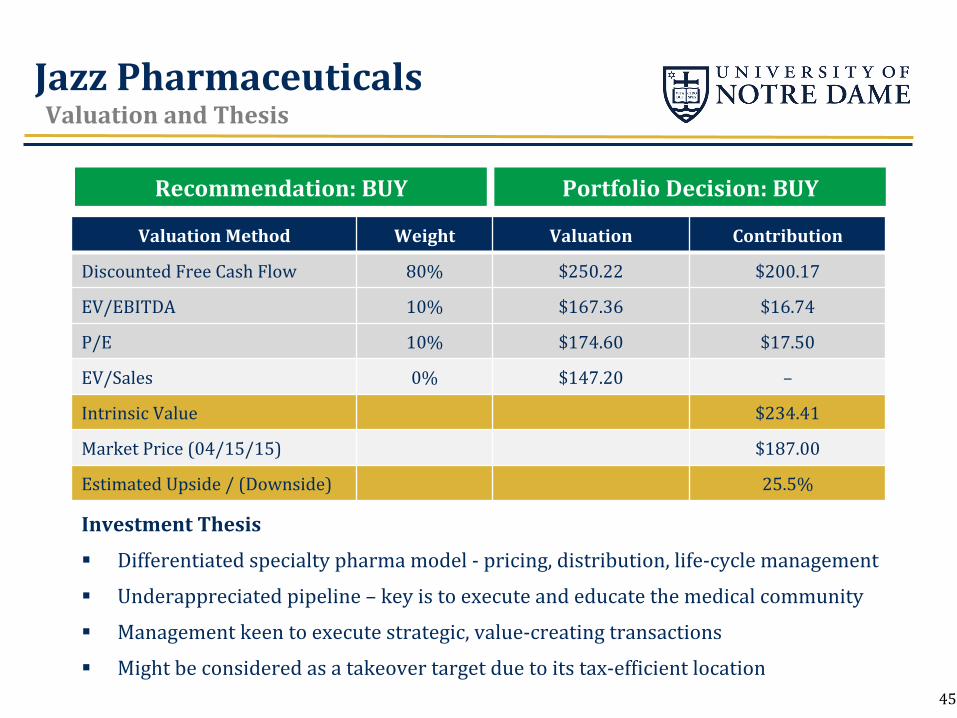
Jazz Pharmaceuticals Valuation and Thesis
Investment Thesis
§ Differentiated specialty pharma model -‐ pricing, distribution, life-‐cycle management
§ Underappreciated pipeline – key is to execute and educate the medical community
§ Management keen to execute strategic, value-‐creating transactions
§ Might be considered as a takeover target due to its tax-‐efNicient location
Valuation Method Weight Valuation Contribution
Discounted Free Cash Flow 80% $250.22 $200.17
EV/EBITDA 10% $167.36 $16.74
P/E 10% $174.60 $17.50
EV/Sales 0% $147.20 –
Intrinsic Value $234.41
Market Price (04/15/15) $187.00
Estimated Upside / (Downside) 25.5%
Recommendation: BUY Portfolio Decision: BUY
45
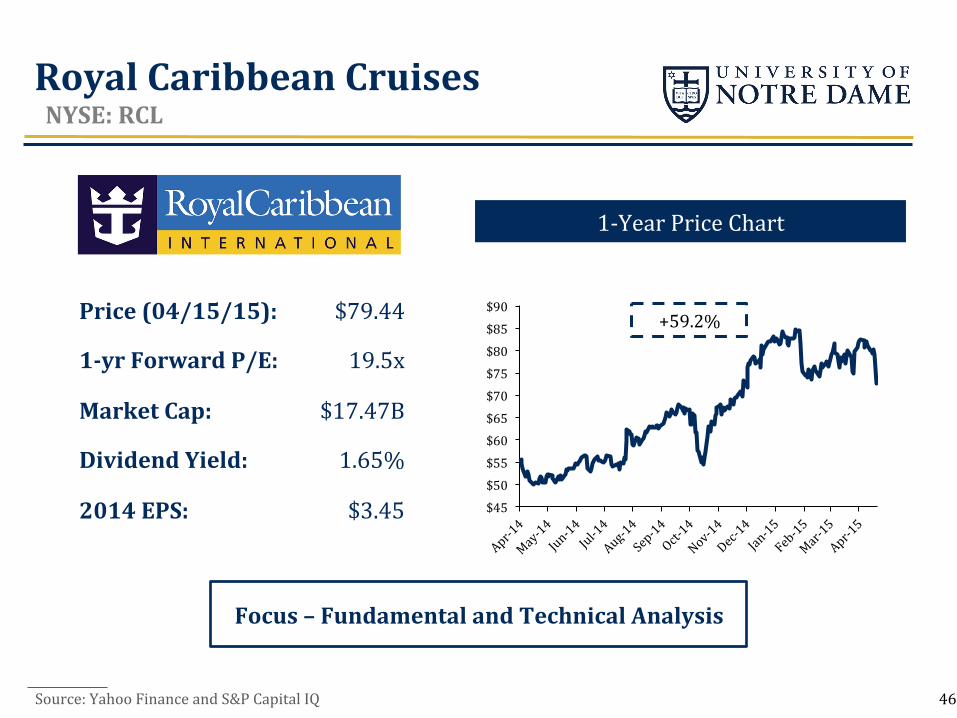
Royal Caribbean Cruises NYSE: RCL
Source: Yahoo Finance and S&P Capital IQ
1-‐Year Price Chart
Focus – Fundamental and Technical Analysis
$45
$50
$55
$60
$65
$70
$75
$80
$85
$90 +59.2% Price (04/15/15):
1-‐yr Forward P/E:
Market Cap:
Dividend Yield:
2014 EPS:
$79.44
19.5x
$17.47B
1.65%
$3.45
46
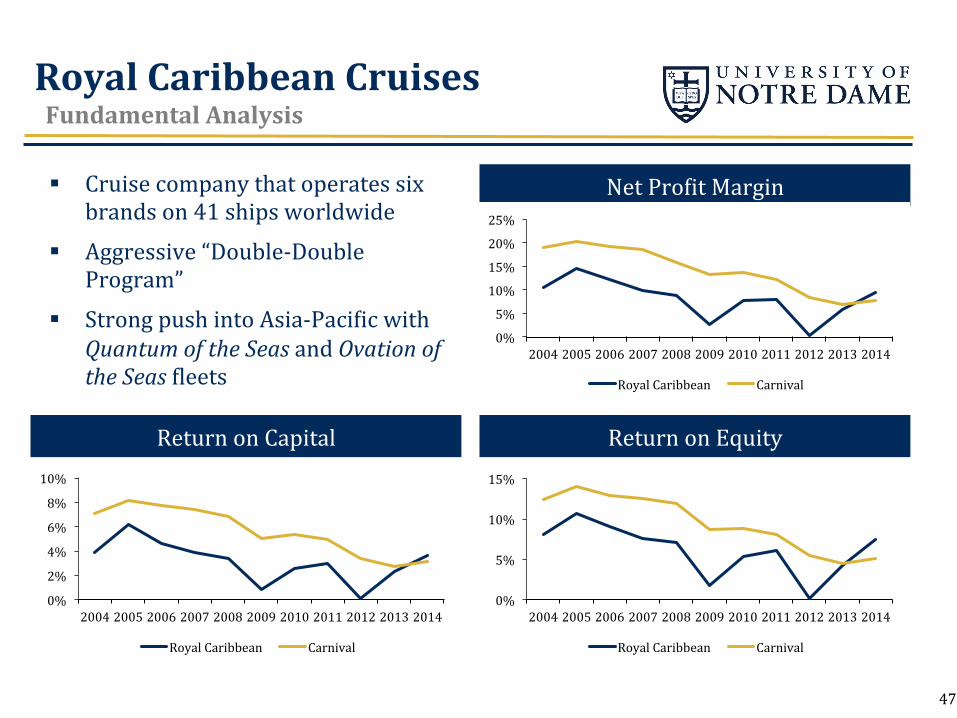
Royal Caribbean Cruises Fundamental Analysis
Return on Equity
Net ProNit Margin
Return on Capital
0%
5%
10%
15%
20%
25%
2004 2005 2006 2007 2008 2009 2010 2011 2012 2013 2014
Royal Caribbean Carnival
0%
2%
4%
6%
8%
10%
2004 2005 2006 2007 2008 2009 2010 2011 2012 2013 2014
Royal Caribbean Carnival
0%
5%
10%
15%
2004 2005 2006 2007 2008 2009 2010 2011 2012 2013 2014
Royal Caribbean Carnival
§ Cruise company that operates six brands on 41 ships worldwide
§ Aggressive “Double-‐Double Program”
§ Strong push into Asia-‐PaciNic with Quantum of the Seas and Ovation of the Seas Nleets
47
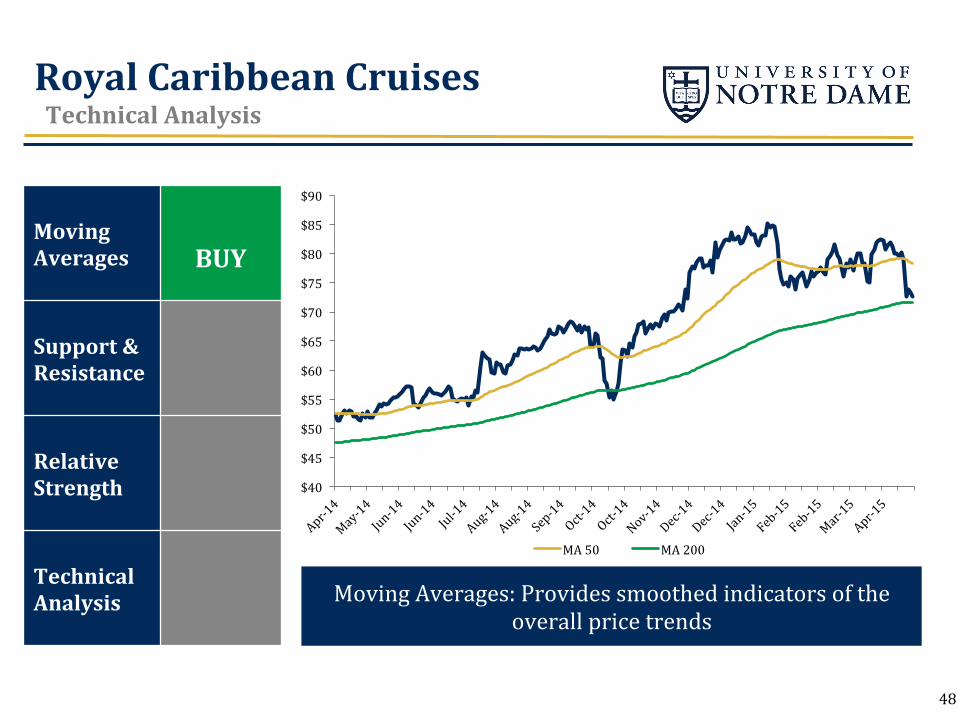
Royal Caribbean Cruises Technical Analysis
Moving Averages: Provides smoothed indicators of the overall price trends
$40
$45
$50
$55
$60
$65
$70
$75
$80
$85
$90
MA 50 MA 200
Moving Averages BUY
Support & Resistance
Relative Strength
Technical Analysis
48
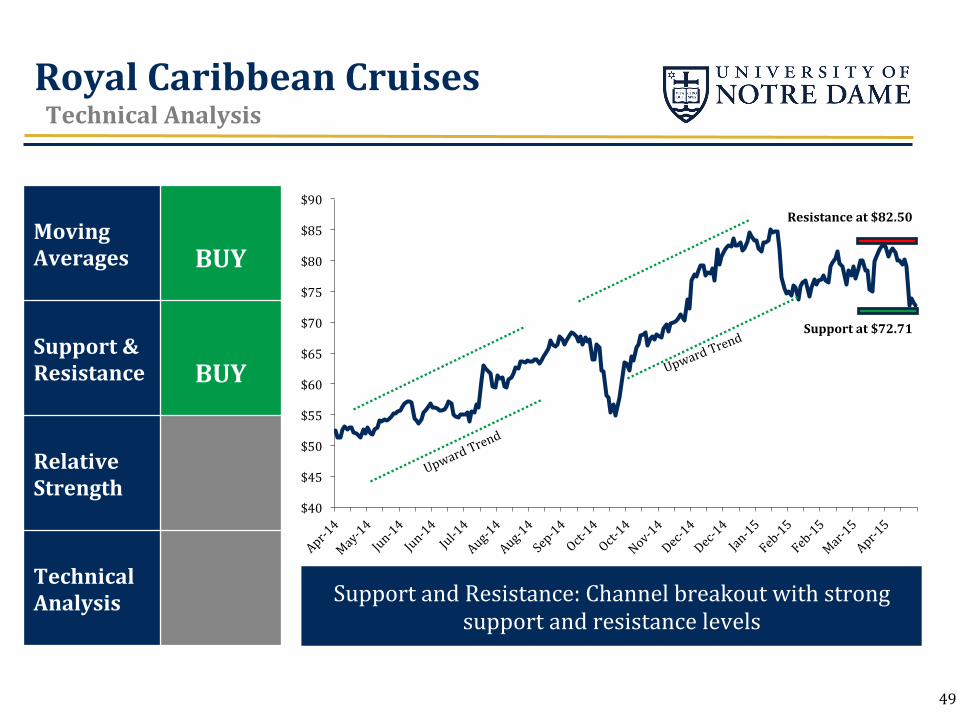
$40
$45
$50
$55
$60
$65
$70
$75
$80
$85
$90 Resistance at $82.50
Support at $72.71
Royal Caribbean Cruises Technical Analysis
Support and Resistance: Channel breakout with strong support and resistance levels
Moving Averages BUY
Support & Resistance BUY
Relative Strength
Technical Analysis
49
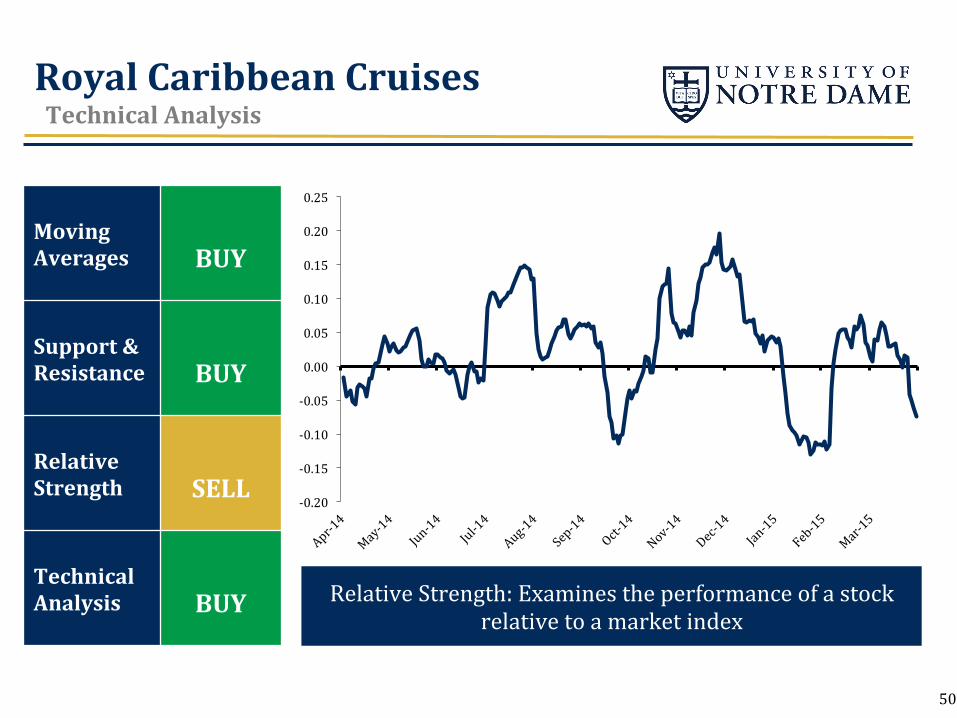
Royal Caribbean Cruises Technical Analysis
Relative Strength: Examines the performance of a stock relative to a market index
-‐0.20
-‐0.15
-‐0.10
-‐0.05
0.00
0.05
0.10
0.15
0.20
0.25
Moving Averages BUY
Support & Resistance BUY
Relative Strength SELL
Technical Analysis BUY
50
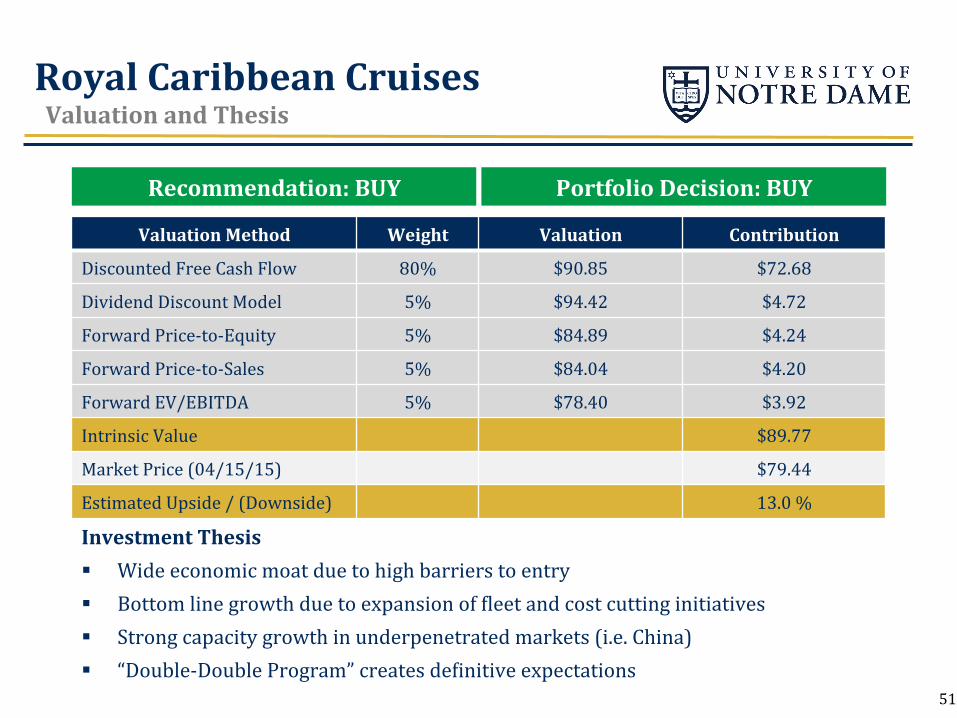
Royal Caribbean Cruises Valuation and Thesis
Valuation Method Weight Valuation Contribution
Discounted Free Cash Flow 80% $90.85 $72.68
Dividend Discount Model 5% $94.42 $4.72
Forward Price-‐to-‐Equity 5% $84.89 $4.24
Forward Price-‐to-‐Sales 5% $84.04 $4.20
Forward EV/EBITDA 5% $78.40 $3.92
Intrinsic Value $89.77
Market Price (04/15/15) $79.44
Estimated Upside / (Downside) 13.0 %
Recommendation: BUY Portfolio Decision: BUY
Investment Thesis § Wide economic moat due to high barriers to entry § Bottom line growth due to expansion of Nleet and cost cutting initiatives § Strong capacity growth in underpenetrated markets (i.e. China) § “Double-‐Double Program” creates deNinitive expectations
51
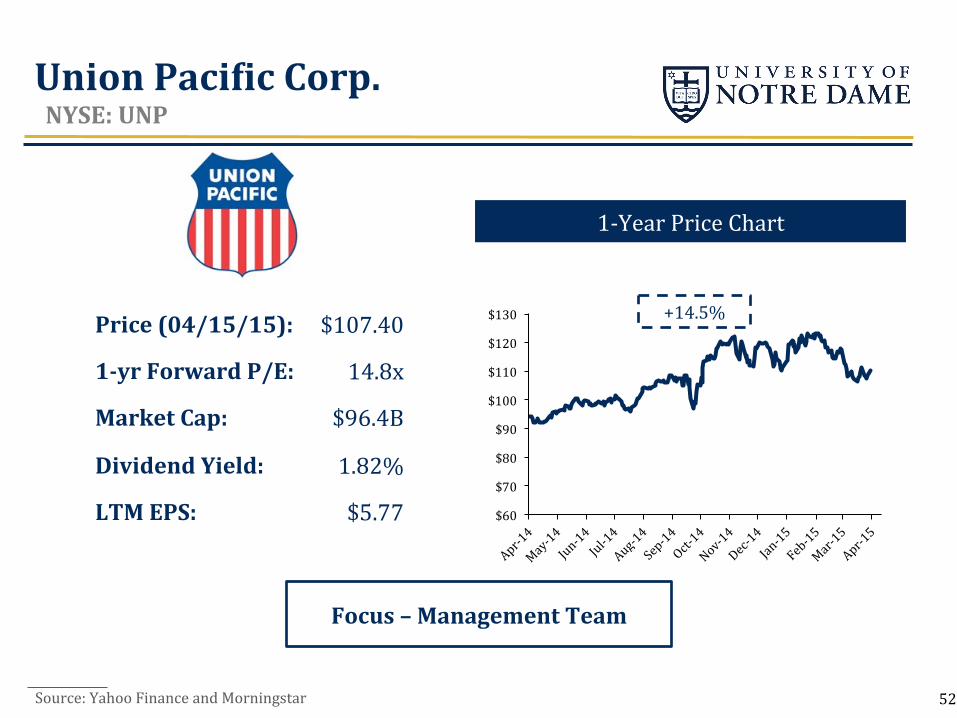
Union PaciQic Corp. NYSE: UNP
Source: Yahoo Finance and Morningstar
1-‐Year Price Chart
Focus – Management Team
$60
$70
$80
$90
$100
$110
$120
$130 +14.5% Price (04/15/15):
1-‐yr Forward P/E:
Market Cap:
Dividend Yield:
LTM EPS:
$107.40
14.8x
$96.4B
1.82%
$5.77
52
[CATEGORY NAME] [VALUE]
[CATEGORY NAME] [VALUE]
[CATEGORY NAME] [VALUE]
Auto [VALUE]
[CATEGORY NAME] [VALUE]
[CATEGORY NAME] [VALUE]
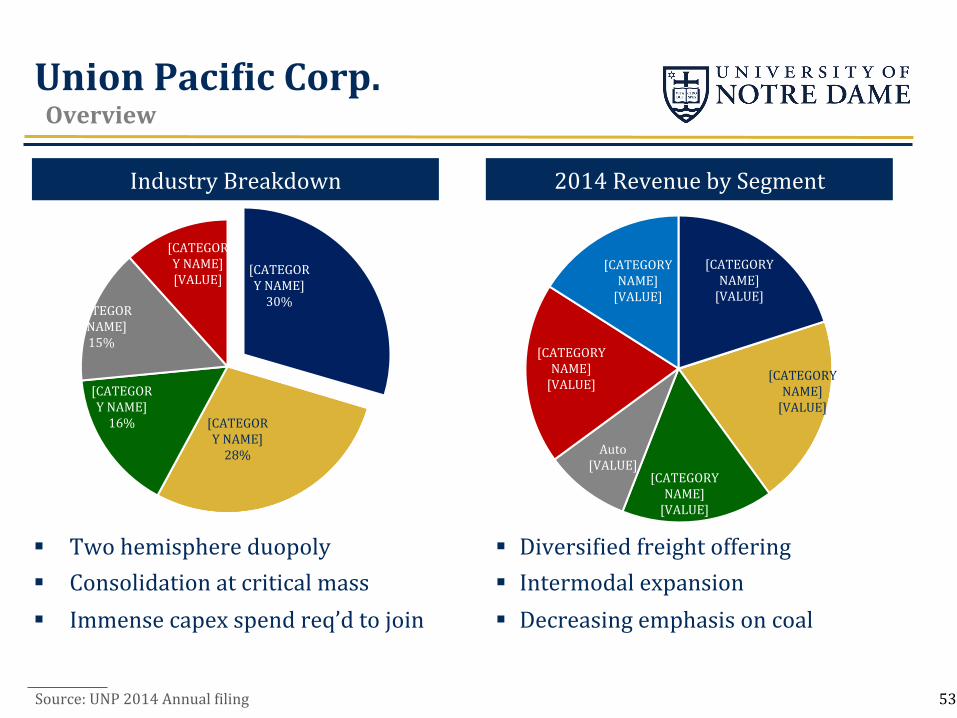
Union PaciQic Corp. Overview
Source: UNP 2014 Annual Niling
Industry Breakdown 2014 Revenue by Segment
[CATEGORY NAME] 30%
[CATEGORY NAME] 28%
[CATEGORY NAME] 16%
[CATEGORY NAME] 15%
[CATEGORY NAME] [VALUE]
§ DiversiNied freight offering § Intermodal expansion § Decreasing emphasis on coal
§ Two hemisphere duopoly § Consolidation at critical mass § Immense capex spend req’d to join
53
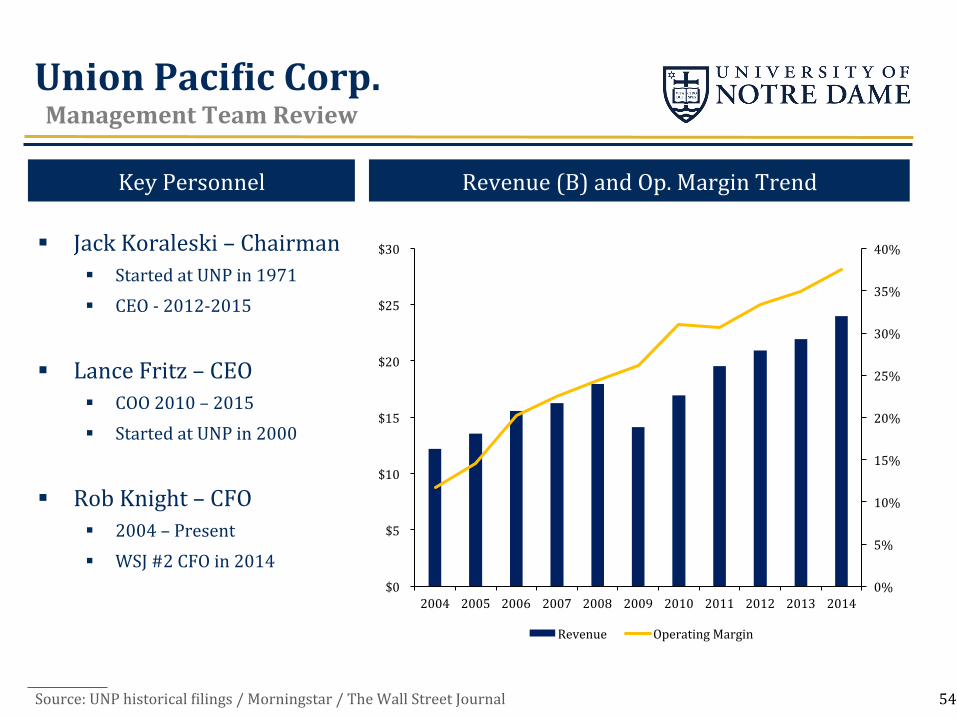
Union PaciQic Corp. Management Team Review
Source: UNP historical Nilings / Morningstar / The Wall Street Journal
Revenue (B) and Op. Margin Trend Key Personnel
0%
5%
10%
15%
20%
25%
30%
35%
40%
$0
$5
$10
$15
$20
$25
$30
2004 2005 2006 2007 2008 2009 2010 2011 2012 2013 2014
Revenue Operating Margin
§ Jack Koraleski – Chairman § Started at UNP in 1971 § CEO -‐ 2012-‐2015
§ Lance Fritz – CEO § COO 2010 – 2015 § Started at UNP in 2000
§ Rob Knight – CFO § 2004 – Present § WSJ #2 CFO in 2014
54
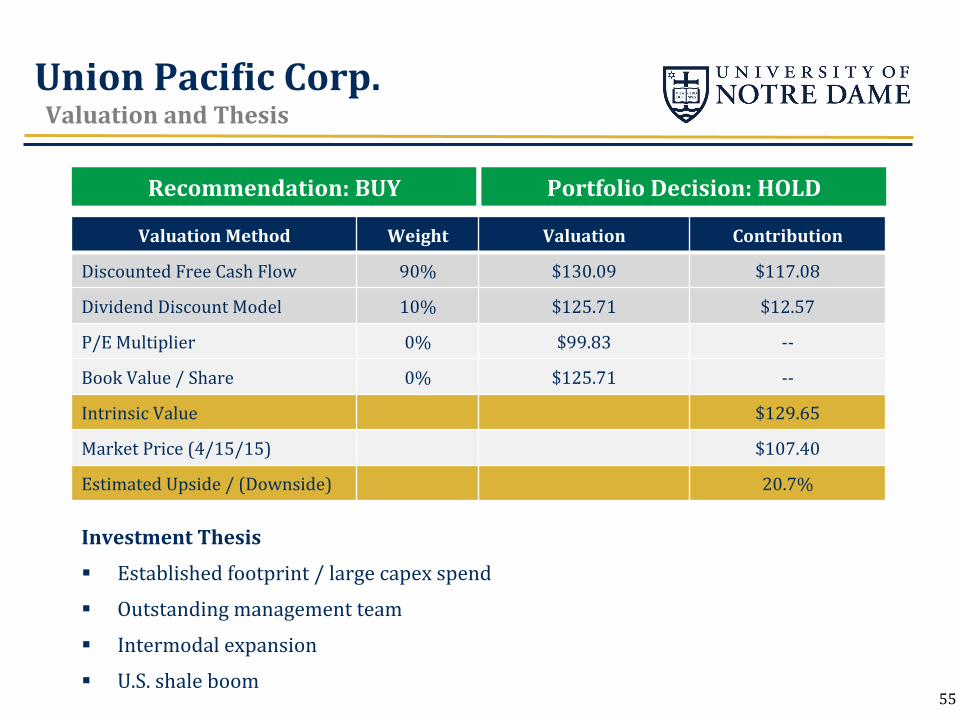
Union PaciQic Corp. Valuation and Thesis
Valuation Method Weight Valuation Contribution
Discounted Free Cash Flow 90% $130.09 $117.08
Dividend Discount Model 10% $125.71 $12.57
P/E Multiplier 0% $99.83 -‐-‐
Book Value / Share 0% $125.71 -‐-‐
Intrinsic Value $129.65
Market Price (4/15/15) $107.40
Estimated Upside / (Downside) 20.7%
Investment Thesis
§ Established footprint / large capex spend
§ Outstanding management team
§ Intermodal expansion
§ U.S. shale boom
Recommendation: BUY Portfolio Decision: HOLD
55
$20
$25
$30
$35
$40
$45
$50
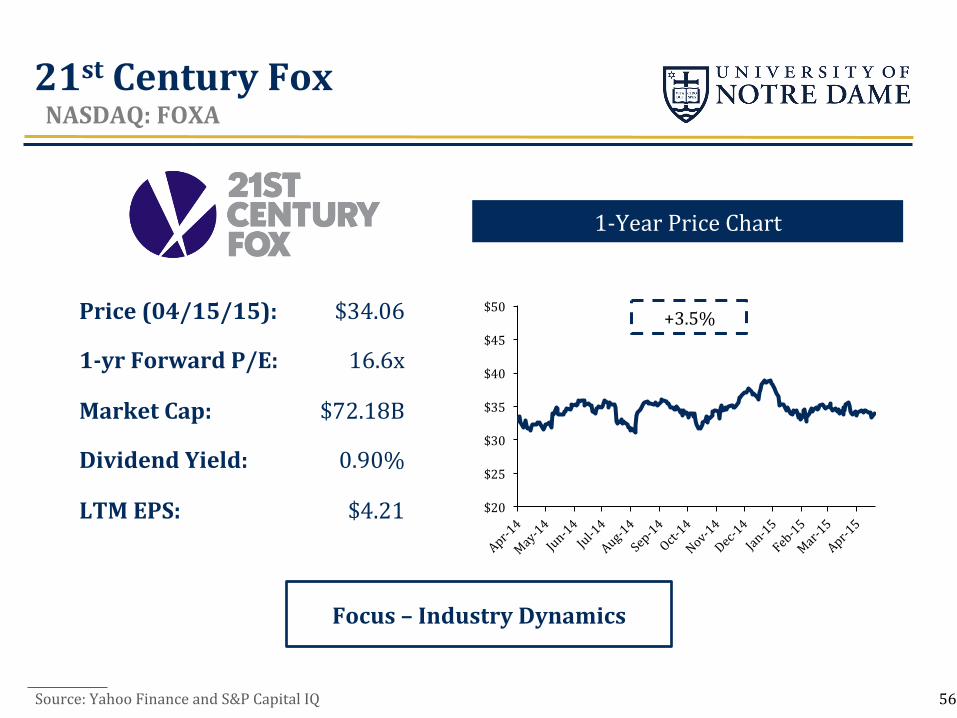
21st Century Fox NASDAQ: FOXA
Source: Yahoo Finance and S&P Capital IQ
1-‐Year Price Chart
Focus – Industry Dynamics
+3.5% Price (04/15/15):
1-‐yr Forward P/E:
Market Cap:
Dividend Yield:
LTM EPS:
$34.06
16.6x
$72.18B
0.90%
$4.21
56
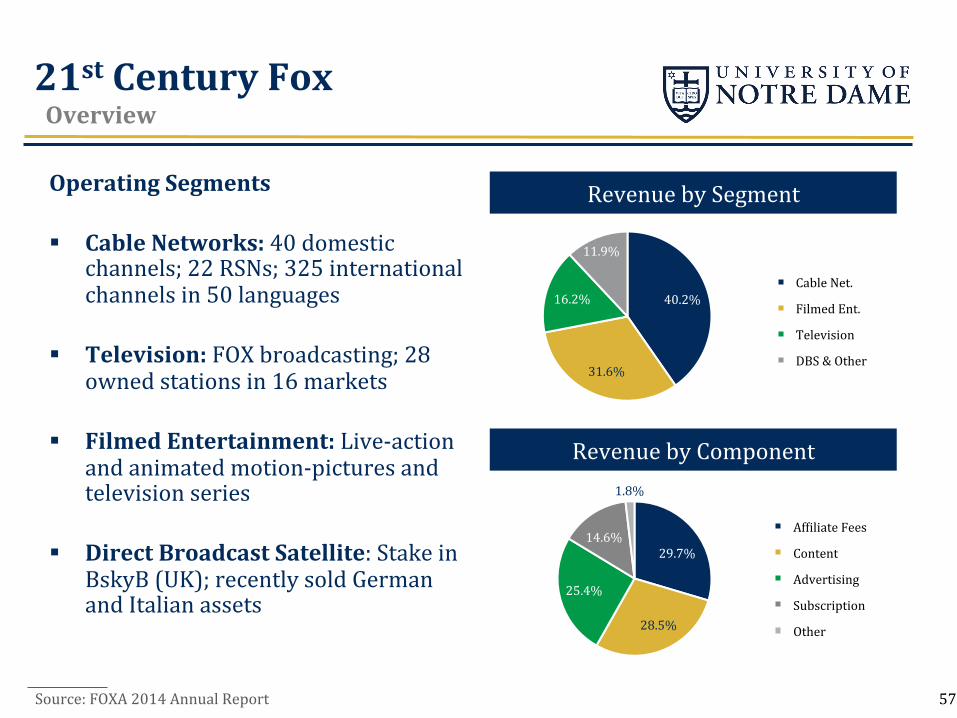
21st Century Fox Overview
Source: FOXA 2014 Annual Report
29.7%
28.5%
25.4%
14.6%
1.8%
AfNiliate Fees
Content
Advertising
Subscription
Other
40.2%
31.6%
16.2%
11.9%
Cable Net.
Filmed Ent.
Television
DBS & Other
Revenue by Segment
Revenue by Component
Operating Segments
§ Cable Networks: 40 domestic channels; 22 RSNs; 325 international channels in 50 languages
§ Television: FOX broadcasting; 28 owned stations in 16 markets
§ Filmed Entertainment: Live-‐action and animated motion-‐pictures and television series
§ Direct Broadcast Satellite: Stake in BskyB (UK); recently sold German and Italian assets
57
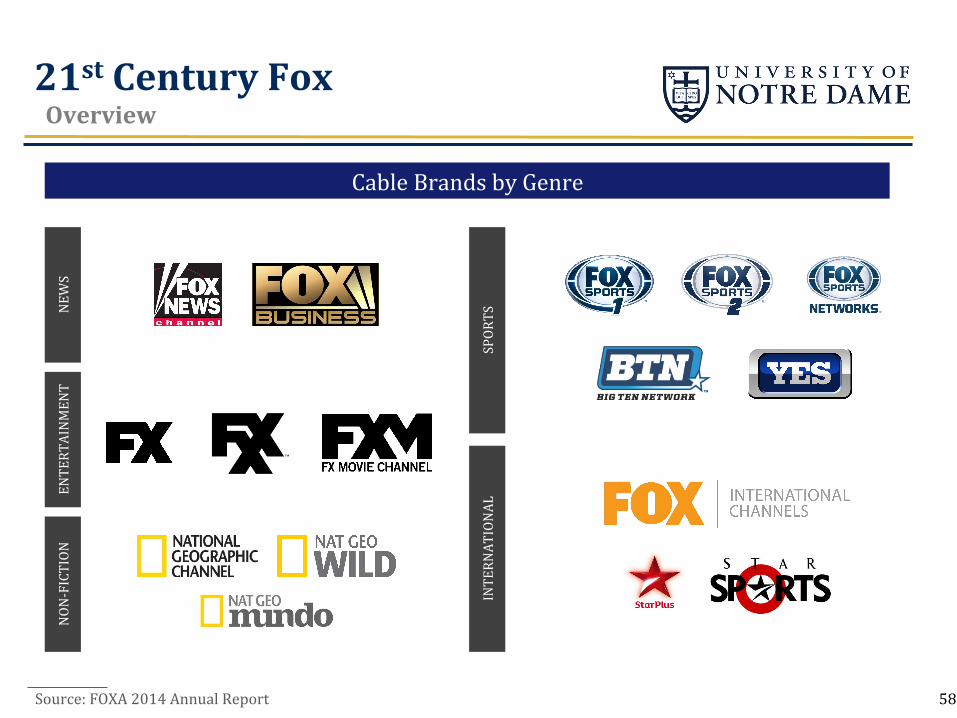
21st Century Fox Overview
Source: FOXA 2014 Annual Report 58
Cable Brands by Genre
NEW
S ENTERTAINMENT
NON
-‐FICTION
SPORTS
INTERNATIONAL
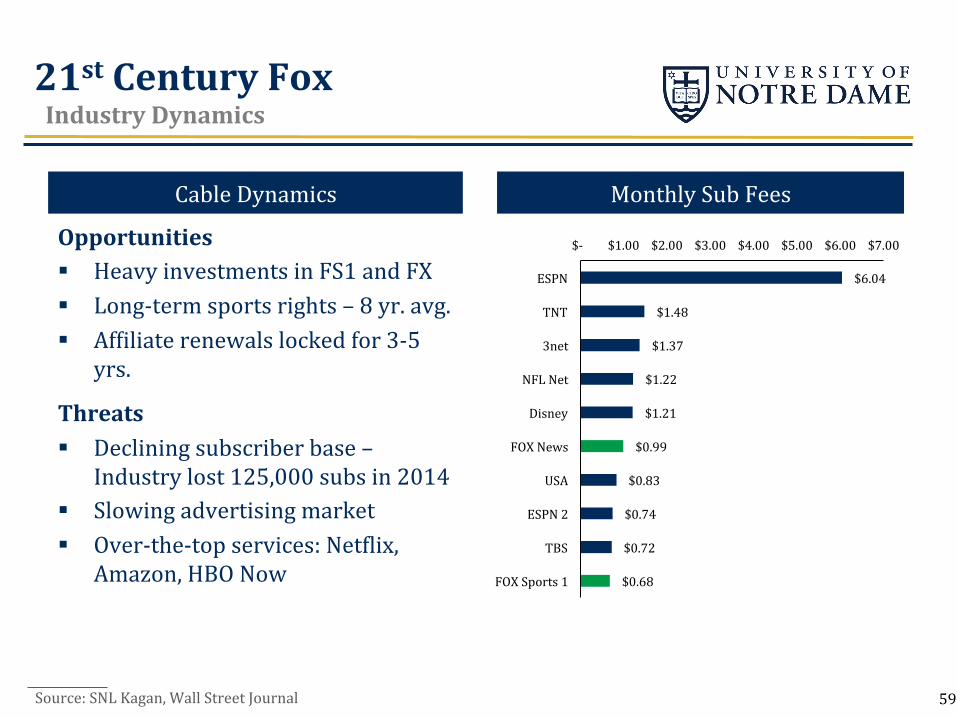
21st Century Fox Industry Dynamics
Source: SNL Kagan, Wall Street Journal
Monthly Sub Fees Cable Dynamics
Insert Chart
$6.04
$1.48
$1.37
$1.22
$1.21
$0.99
$0.83
$0.74
$0.72
$0.68
$-‐ $1.00 $2.00 $3.00 $4.00 $5.00 $6.00 $7.00
ESPN
TNT
3net
NFL Net
Disney
FOX News
USA
ESPN 2
TBS
FOX Sports 1
Opportunities § Heavy investments in FS1 and FX § Long-‐term sports rights – 8 yr. avg. § AfNiliate renewals locked for 3-‐5
yrs.
Threats § Declining subscriber base –
Industry lost 125,000 subs in 2014 § Slowing advertising market § Over-‐the-‐top services: NetNlix,
Amazon, HBO Now
59
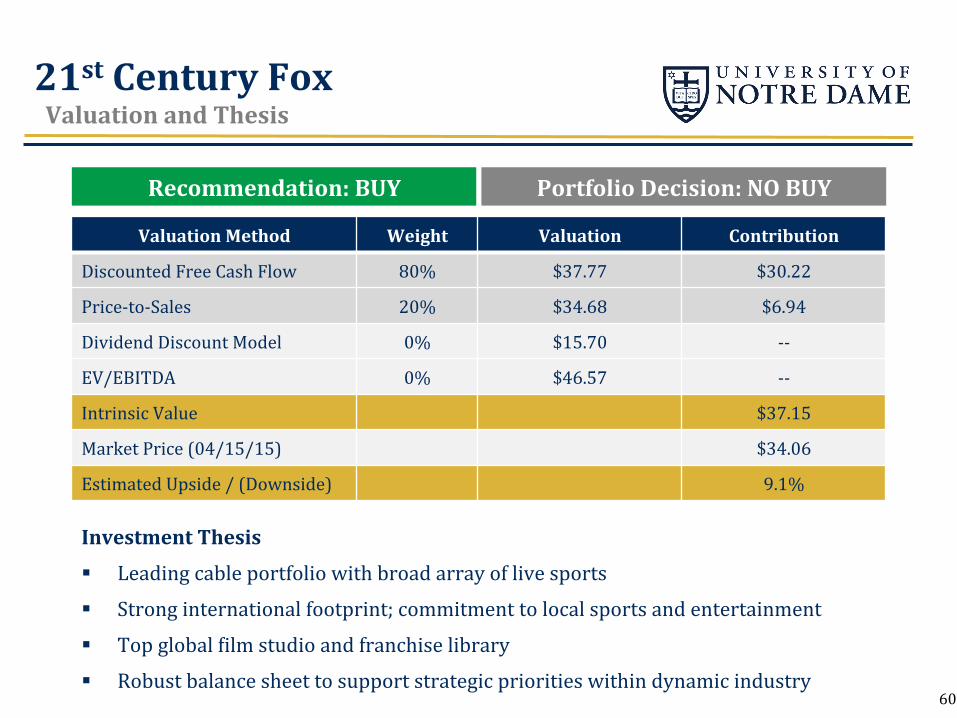
21st Century Fox Valuation and Thesis
Valuation Method Weight Valuation Contribution
Discounted Free Cash Flow 80% $37.77 $30.22
Price-‐to-‐Sales 20% $34.68 $6.94
Dividend Discount Model 0% $15.70 -‐-‐
EV/EBITDA 0% $46.57 -‐-‐
Intrinsic Value $37.15
Market Price (04/15/15) $34.06
Estimated Upside / (Downside) 9.1%
Recommendation: BUY Portfolio Decision: NO BUY
Investment Thesis
§ Leading cable portfolio with broad array of live sports
§ Strong international footprint; commitment to local sports and entertainment
§ Top global Nilm studio and franchise library
§ Robust balance sheet to support strategic priorities within dynamic industry 60
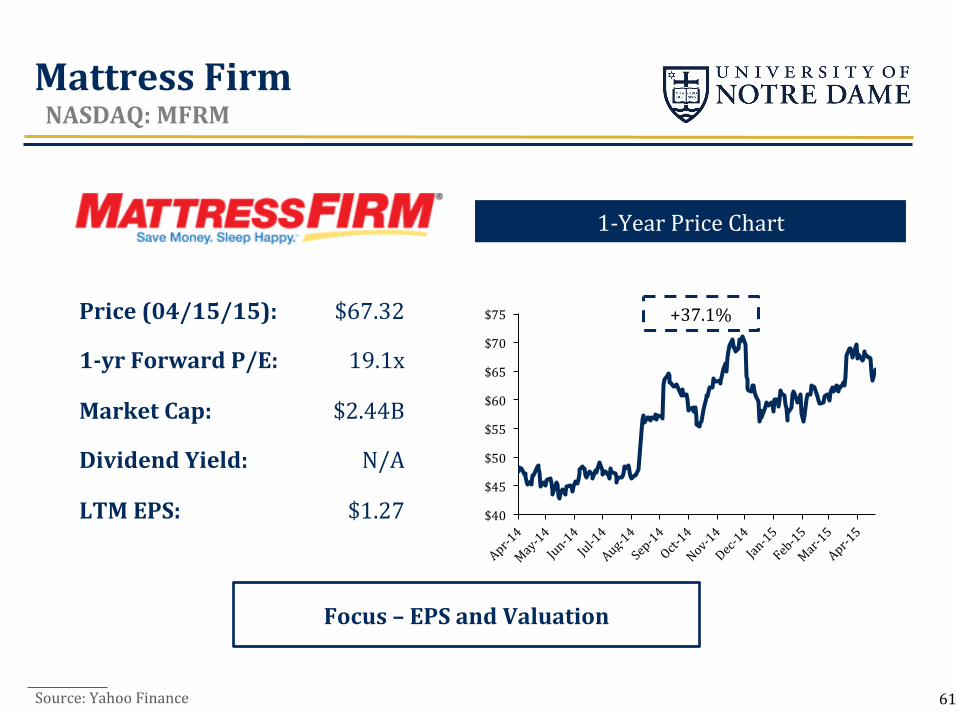
Mattress Firm NASDAQ: MFRM
Source: Yahoo Finance
1-‐Year Price Chart
Focus – EPS and Valuation
$40
$45
$50
$55
$60
$65
$70
$75 +37.1% Price (04/15/15):
1-‐yr Forward P/E:
Market Cap:
Dividend Yield:
LTM EPS:
$67.32
19.1x
$2.44B
N/A
$1.27
61
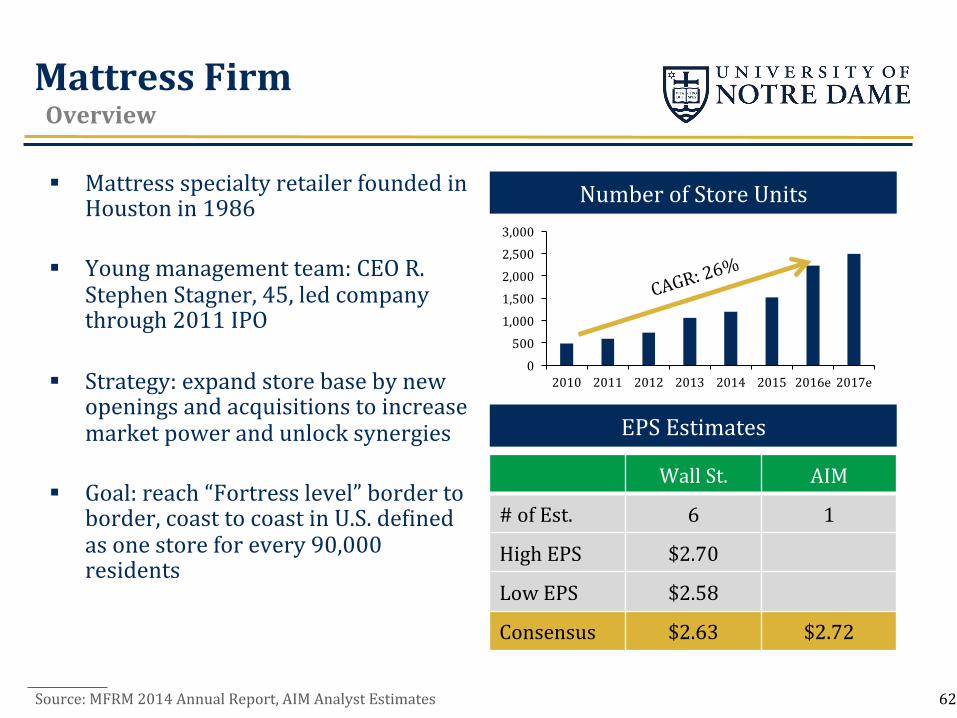
Mattress Firm Overview
Source: MFRM 2014 Annual Report, AIM Analyst Estimates
Number of Store Units
EPS Estimates
0
500
1,000
1,500
2,000
2,500
3,000
2010 2011 2012 2013 2014 2015 2016e 2017e
Wall St. AIM
# of Est. 6 1
High EPS $2.70
Low EPS $2.58
Consensus $2.63 $2.72
CAGR: 26%
§ Mattress specialty retailer founded in Houston in 1986
§ Young management team: CEO R. Stephen Stagner, 45, led company through 2011 IPO
§ Strategy: expand store base by new openings and acquisitions to increase market power and unlock synergies
§ Goal: reach “Fortress level” border to border, coast to coast in U.S. deNined as one store for every 90,000 residents
62
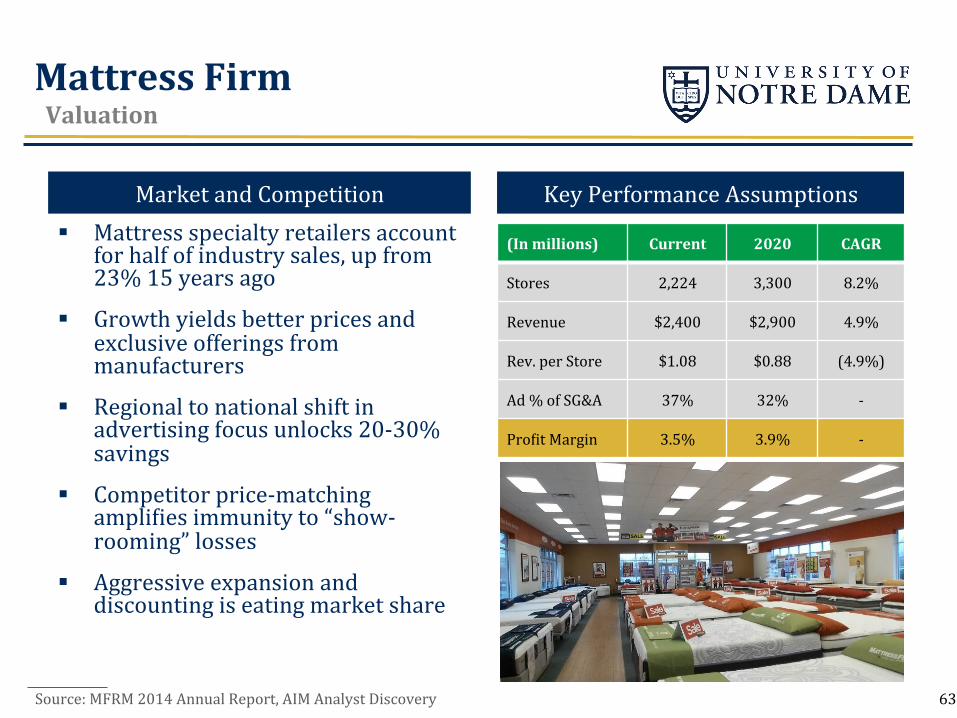
Mattress Firm Valuation
Source: MFRM 2014 Annual Report, AIM Analyst Discovery
Key Performance Assumptions Market and Competition
(In millions) Current 2020 CAGR
Stores 2,224 3,300 8.2%
Revenue $2,400 $2,900 4.9%
Rev. per Store $1.08 $0.88 (4.9%)
Ad % of SG&A 37% 32% -‐
ProNit Margin 3.5% 3.9% -‐
§ Mattress specialty retailers account for half of industry sales, up from 23% 15 years ago
§ Growth yields better prices and exclusive offerings from manufacturers
§ Regional to national shift in advertising focus unlocks 20-‐30% savings
§ Competitor price-‐matching ampliNies immunity to “show-‐rooming” losses
§ Aggressive expansion and discounting is eating market share
63
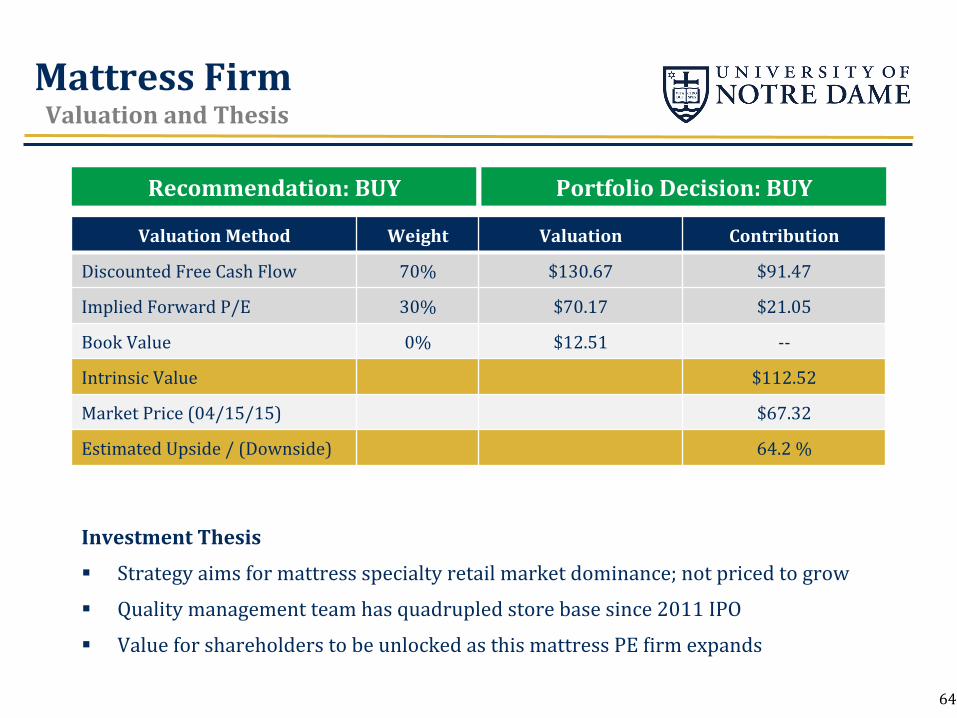
Mattress Firm Valuation and Thesis
Recommendation: BUY
Valuation Method Weight Valuation Contribution
Discounted Free Cash Flow 70% $130.67 $91.47
Implied Forward P/E 30% $70.17 $21.05
Book Value 0% $12.51 -‐-‐
Intrinsic Value $112.52
Market Price (04/15/15) $67.32
Estimated Upside / (Downside) 64.2 %
Portfolio Decision: BUY
Investment Thesis
§ Strategy aims for mattress specialty retail market dominance; not priced to grow
§ Quality management team has quadrupled store base since 2011 IPO
§ Value for shareholders to be unlocked as this mattress PE Nirm expands
64
Portfolio Performance Historical Returns vs. Benchmarks Sector Allocation Attribution Analysis Best & Worst Performers Risk-‐Adjusted Performance Active Share Portfolio Additions & Deletions
65
$0.00
$1.00
$2.00
$3.00
$4.00
$5.00
$6.00
$7.00
$8.00
$9.00
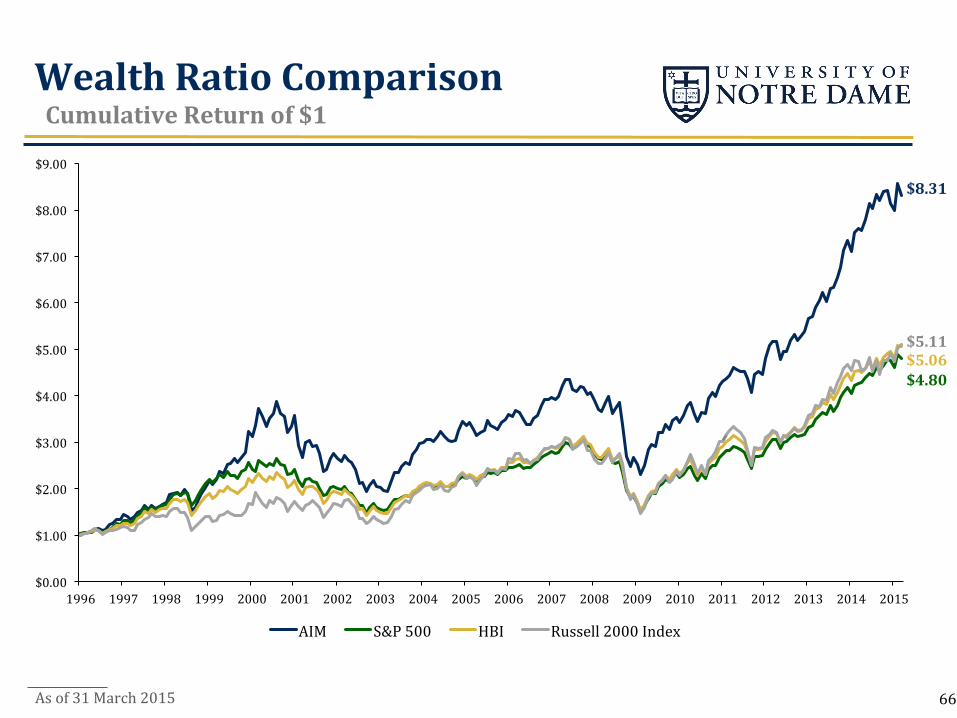
1996 1997 1998 1999 2000 2001 2002 2003 2004 2005 2006 2007 2008 2009 2010 2011 2012 2013 2014 2015
AIM S&P 500 HBI Russell 2000 Index
Wealth Ratio Comparison Cumulative Return of $1
As of 31 March 2015
$8.31 $5.11 $5.06 $4.80
66
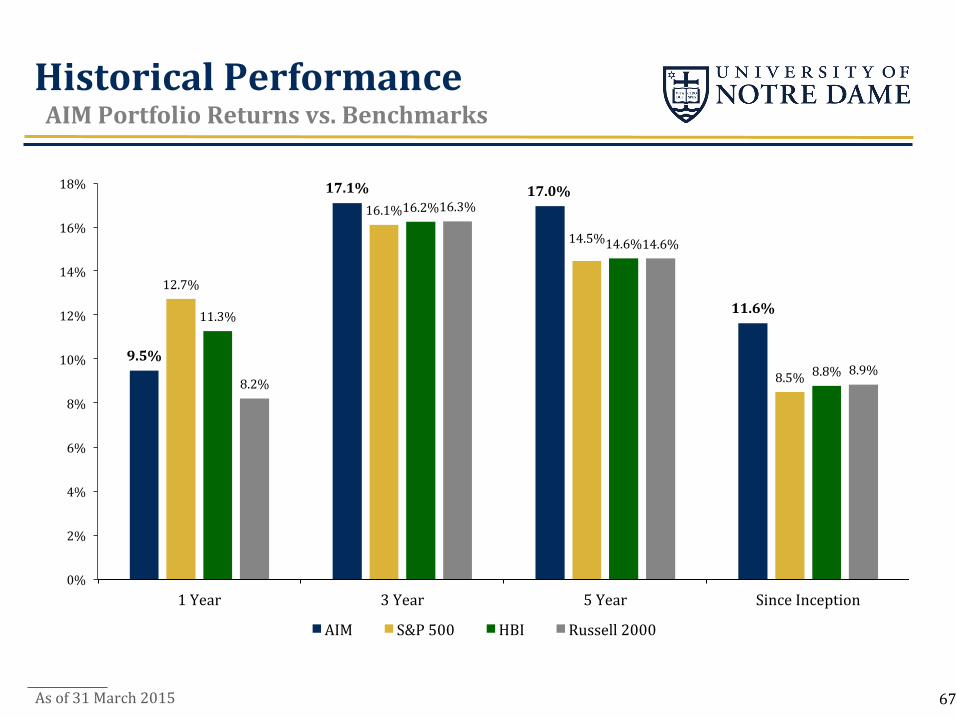
9.5%
17.1% 17.0%
11.6% 12.7%
16.1%
14.5%
8.5%
11.3%
16.2%
14.6%
8.8% 8.2%
16.3%
14.6%
8.9%
0%
2%
4%
6%
8%
10%
12%
14%
16%
18%
1 Year 3 Year 5 Year Since Inception
AIM S&P 500 HBI Russell 2000
Historical Performance AIM Portfolio Returns vs. Benchmarks
As of 31 March 2015 67
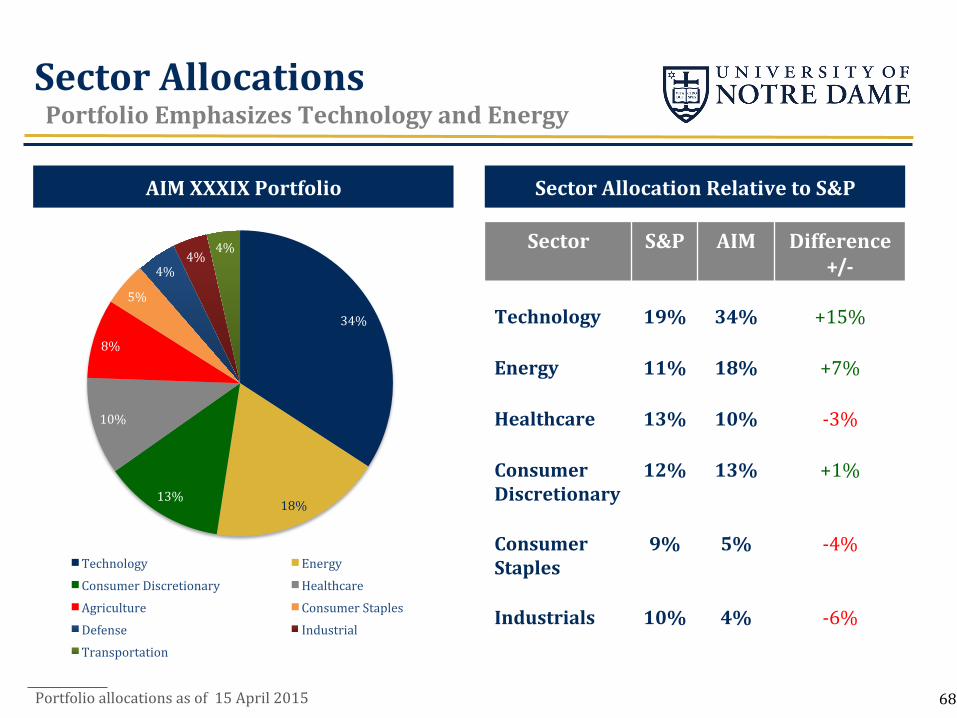
Sector Allocations Portfolio Emphasizes Technology and Energy
AIM XXXIX Portfolio Sector Allocation Relative to S&P
Sector S&P AIM Difference +/-‐
Technology 19% 34% +15%
Energy 11% 18% +7%
Healthcare 13% 10% -‐3%
Consumer Discretionary
12% 13% +1%
Consumer Staples
9% 5% -‐4%
Industrials 10% 4% -‐6%
34%
18% 13%
10%
8%
5%
4% 4%
4%
Technology Energy Consumer Discretionary Healthcare Agriculture Consumer Staples Defense Industrial Transportation
68 Portfolio allocations as of 15 April 2015
Performance Attribution Analysis
§ Allocation: Ability to effectively allocate assets to various sectors
§ Selection: Ability to select securities within a sector relative to a benchmark
§ Net Management Effect = Allocation + Selection
69
-‐3.5%
-‐3.0%
-‐2.5%
-‐2.0%
-‐1.5%
-‐1.0%
-‐0.5%
0.0%
0.5%
1.0%
1.5%
2.0%
Financials Health Care Utilities Consumer Discretionary
Consumer Staples
Energy Information Technology
Materials Telecomm Services
Industrials Other
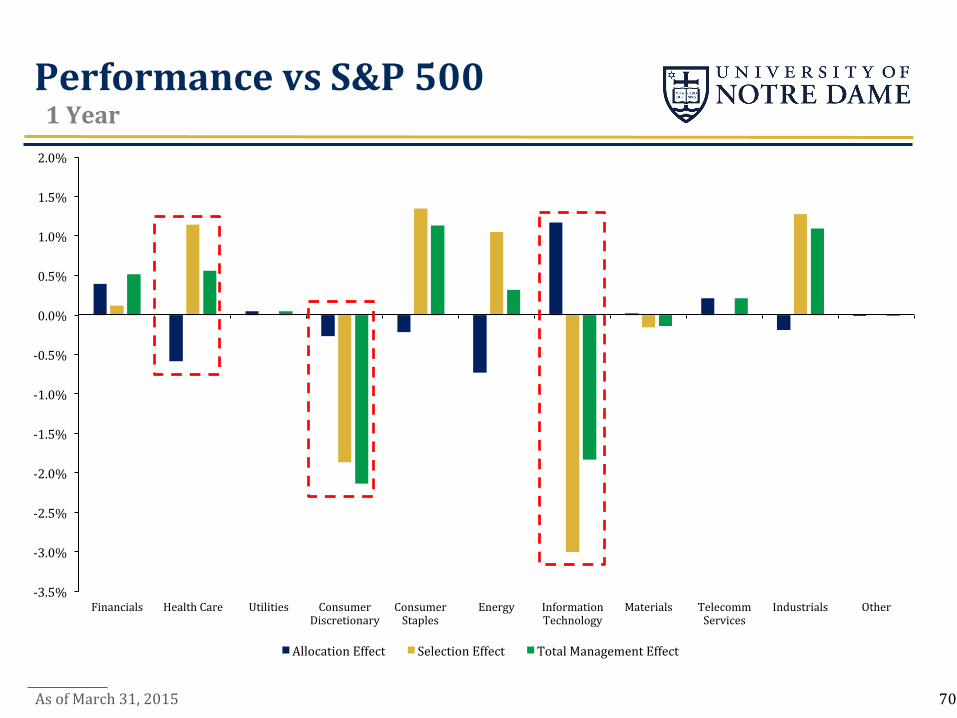
Allocation Effect Selection Effect Total Management Effect
Performance vs S&P 500 1 Year
As of March 31, 2015 70
-‐1.5%
-‐1.0%
-‐0.5%
0.0%
0.5%
1.0%
1.5%
2.0%
Financials Health Care Utilities Consumer Discretionary
Consumer Staples
Energy Information Technology
Materials Telecomm Services
Industrials Other
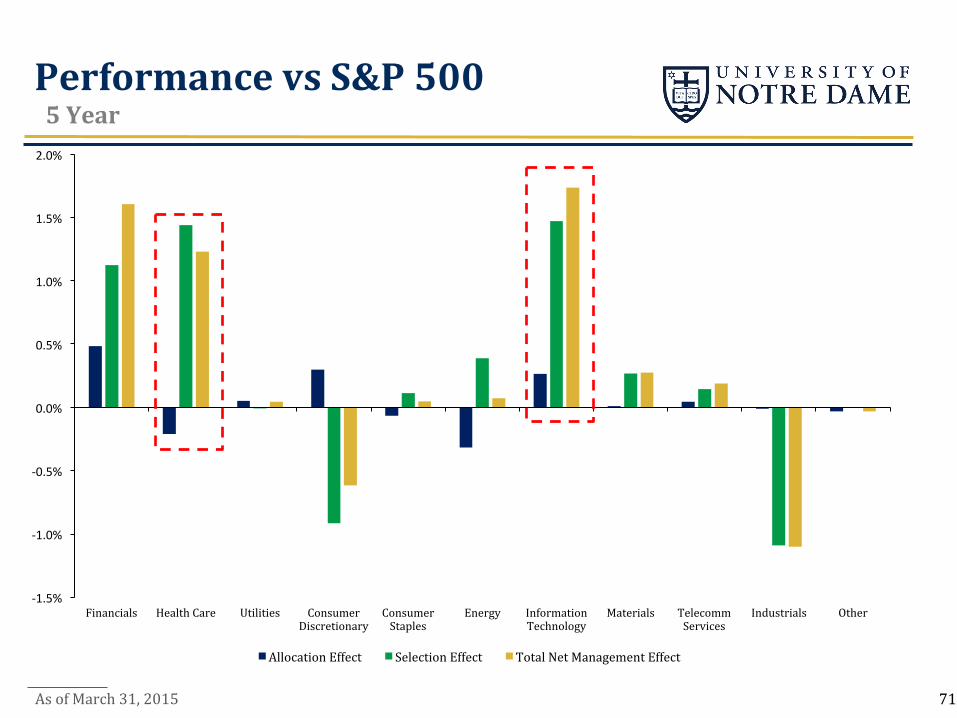
Allocation Effect Selection Effect Total Net Management Effect
Performance vs S&P 500 5 Year
As of March 31, 2015 71
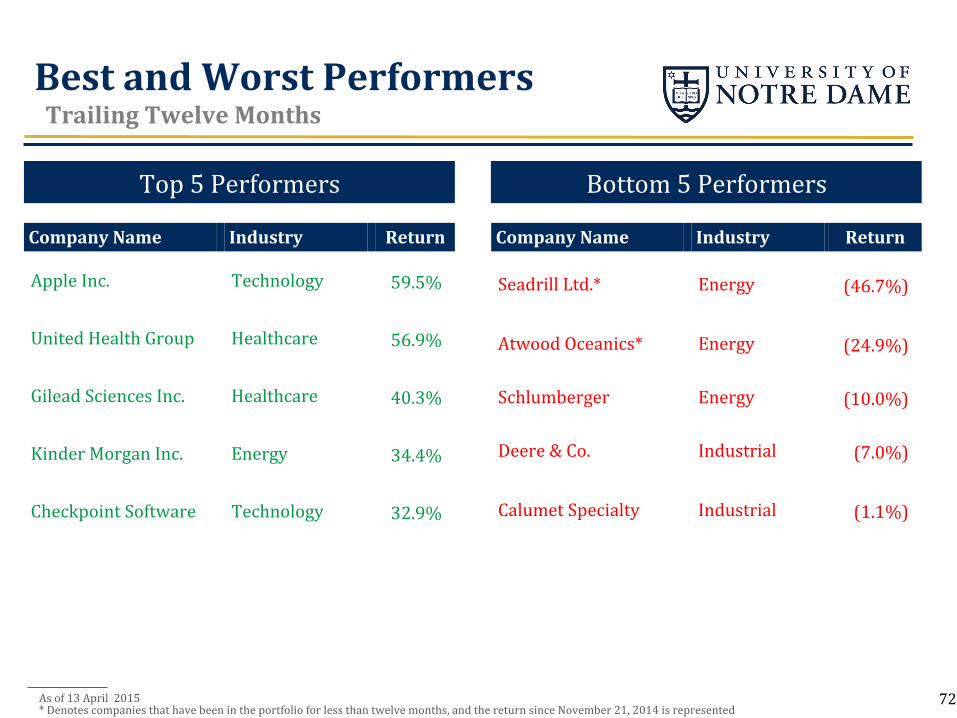
Best and Worst Performers Trailing Twelve Months
Top 5 Performers Bottom 5 Performers
Company Name Industry Return
Apple Inc. Technology 59.5%
United Health Group Healthcare 56.9%
Gilead Sciences Inc. Healthcare 40.3%
Kinder Morgan Inc. Energy 34.4%
Checkpoint Software Technology 32.9%
Company Name Industry Return
Seadrill Ltd.* Energy (46.7%)
Atwood Oceanics* Energy (24.9%)
Schlumberger Energy (10.0%)
Deere & Co. Industrial (7.0%)
Calumet Specialty Industrial (1.1%)
As of 13 April 2015 * Denotes companies that have been in the portfolio for less than twelve months, and the return since November 21, 2014 is represented
72
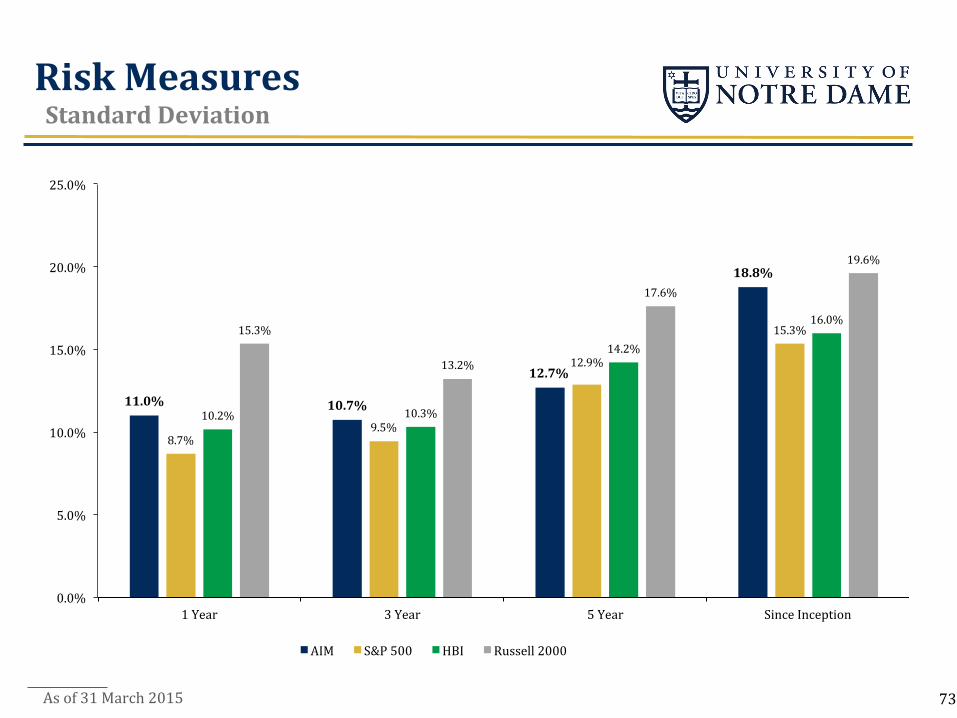
11.0% 10.7%
12.7%
18.8%
8.7% 9.5%
12.9%
15.3%
10.2% 10.3%
14.2%
16.0% 15.3%
13.2%
17.6%
19.6%
0.0%
5.0%
10.0%
15.0%
20.0%
25.0%
1 Year 3 Year 5 Year Since Inception
AIM S&P 500 HBI Russell 2000
Risk Measures Standard Deviation
As of 31 March 2015 73
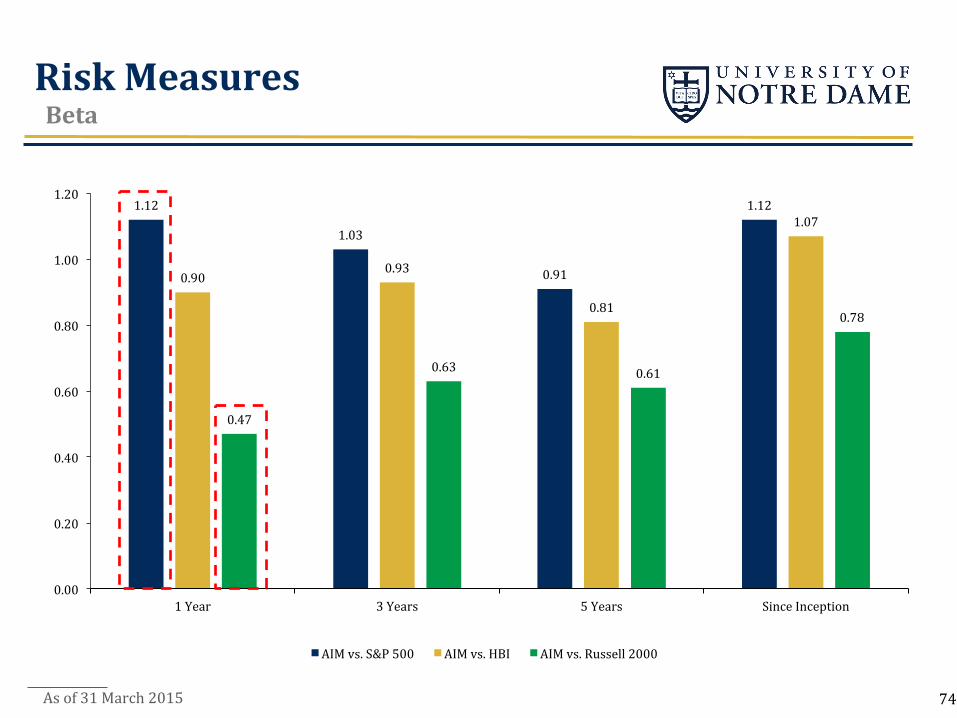
1.12
1.03
0.91
1.12
0.90 0.93
0.81
1.07
0.47
0.63 0.61
0.78
0.00
0.20
0.40
0.60
0.80
1.00
1.20
1 Year 3 Years 5 Years Since Inception
AIM vs. S&P 500 AIM vs. HBI AIM vs. Russell 2000
Risk Measures Beta
74 As of 31 March 2015
Risk-‐adjusted Performance Other Measures
§ Jensen’s Alpha: rp,t -‐ [rf,t +βp x (rm,t – rf,t)] § Shows average portfolio return beyond that predicted by CAPM § Positive alpha indicates excess (abnormal) returns to market risk
§ Sharpe Ratio: (rp -‐ rf) / σp § Measures the reward to total risk § Shows whether portfolio returns are due to increased risk or smart
investment decisions
75
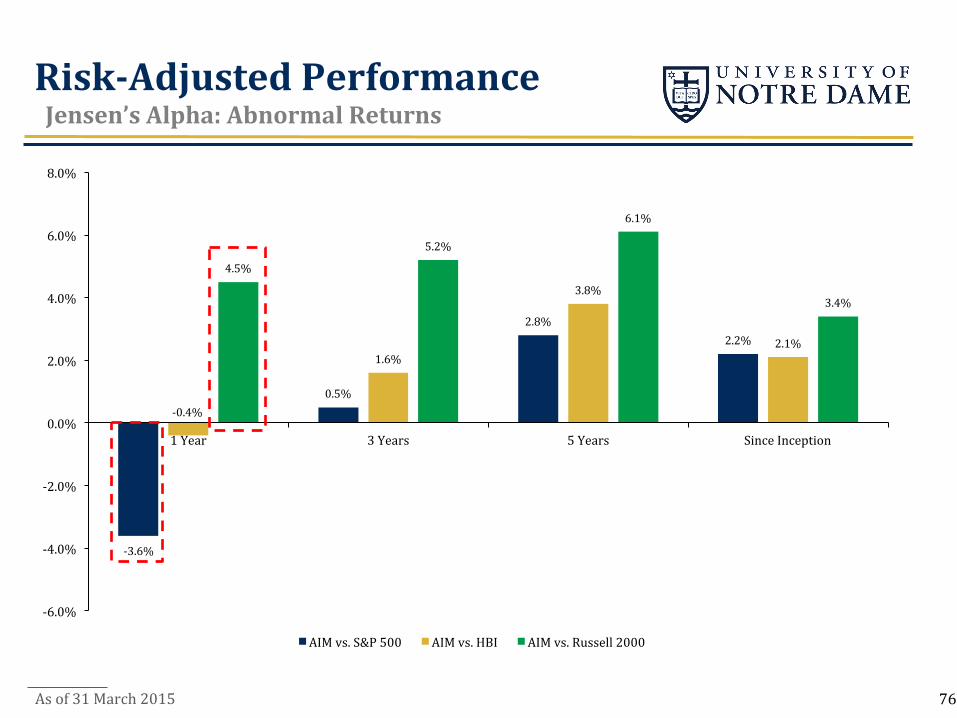
Risk-‐Adjusted Performance Jensen’s Alpha: Abnormal Returns
As of 31 March 2015
-‐3.6%
0.5%
2.8% 2.2%
-‐0.4%
1.6%
3.8%
2.1%
4.5%
5.2%
6.1%
3.4%
-‐6.0%
-‐4.0%
-‐2.0%
0.0%
2.0%
4.0%
6.0%
8.0%
1 Year 3 Years 5 Years Since Inception
AIM vs. S&P 500 AIM vs. HBI AIM vs. Russell 2000
76
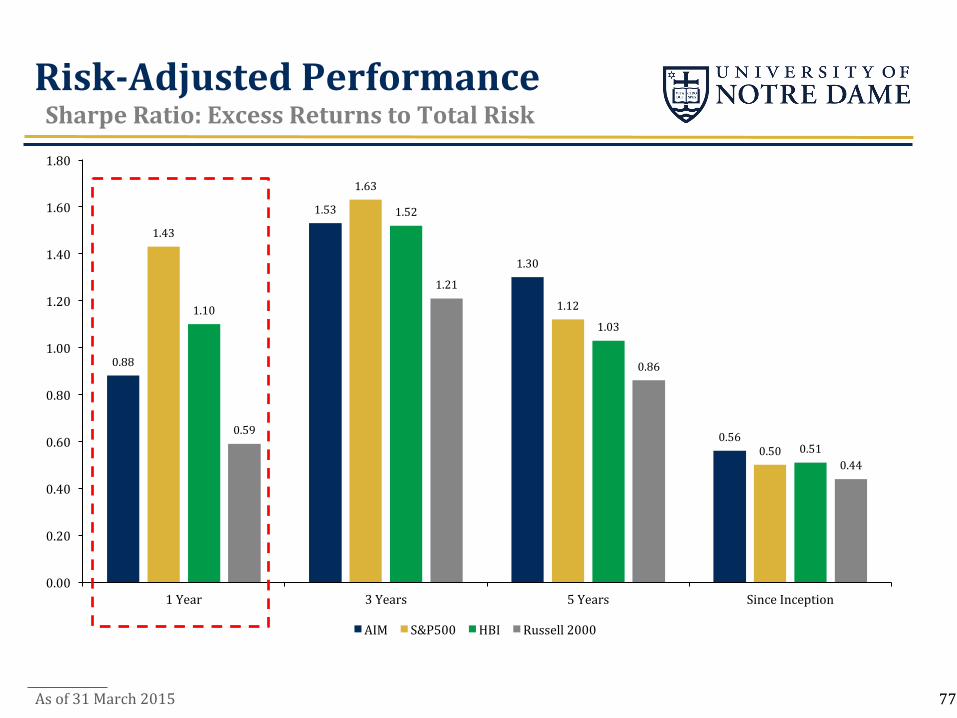
Risk-‐Adjusted Performance Sharpe Ratio: Excess Returns to Total Risk
0.88
1.53
1.30
0.56
1.43
1.63
1.12
0.50
1.10
1.52
1.03
0.51 0.59
1.21
0.86
0.44
0.00
0.20
0.40
0.60
0.80
1.00
1.20
1.40
1.60
1.80
1 Year 3 Years 5 Years Since Inception
AIM S&P500 HBI Russell 2000
77 As of 31 March 2015
Active Share Introduction
% of Portfolio -‐ % of Market = Active Share Contribution
§ Developed by Professor Martijn Cremers from ND Finance Department and has become widely used in the Ninancial industry
§ Measure of differentiation between a portfolio and the market
§ A method used to detect closet indexing
§ Higher percentage indicates more active management
§ Historically, funds with Active Share above 90% outperformed their benchmarks by 1.13% after fees
78
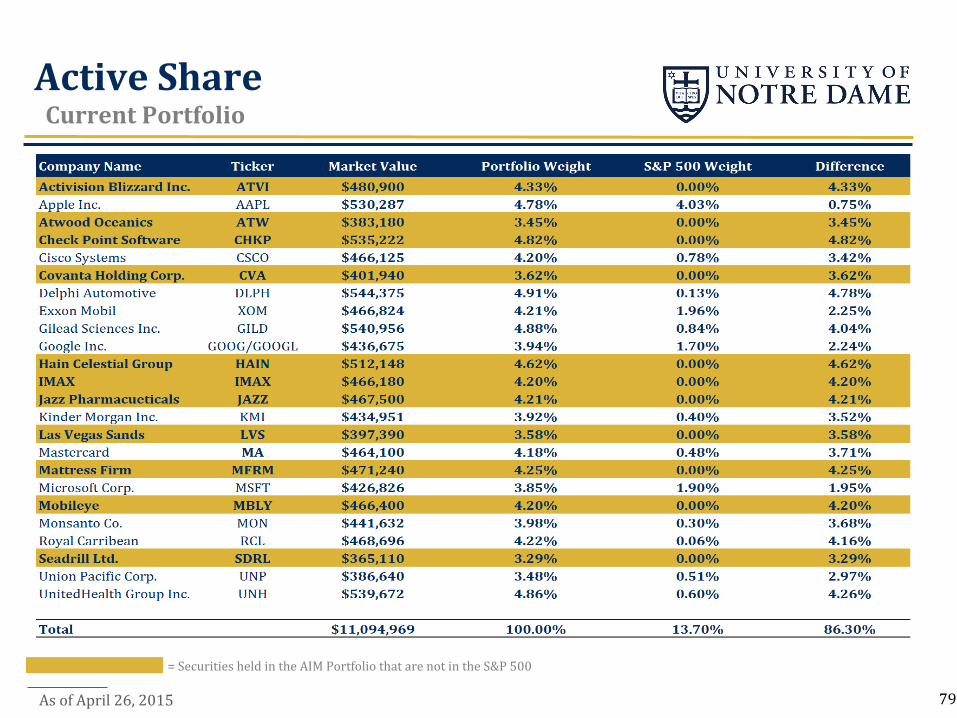
Active Share Current Portfolio
= Securities held in the AIM Portfolio that are not in the S&P 500
79 As of April 26, 2015
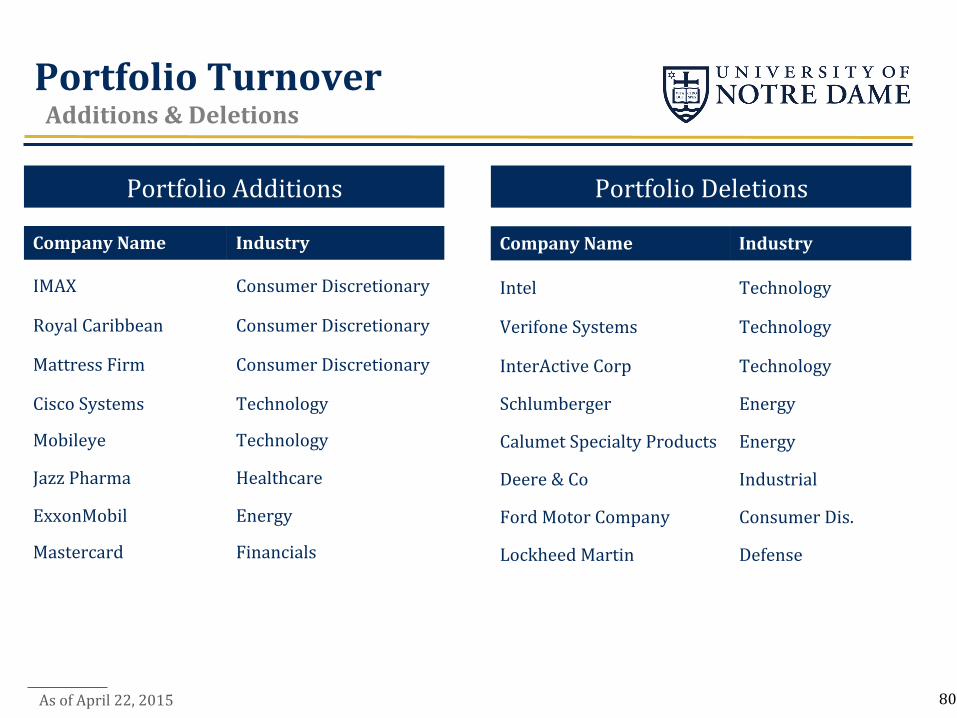
Portfolio Turnover Additions & Deletions
Portfolio Deletions Portfolio Additions
As of April 22, 2015
Company Name Industry
Intel Technology
Verifone Systems Technology
InterActive Corp Technology
Schlumberger Energy
Calumet Specialty Products Energy
Deere & Co Industrial
Ford Motor Company Consumer Dis.
Lockheed Martin Defense
Company Name Industry
IMAX Consumer Discretionary
Royal Caribbean Consumer Discretionary
Mattress Firm Consumer Discretionary
Cisco Systems Technology
Mobileye Technology
Jazz Pharma Healthcare
ExxonMobil Energy
Mastercard Financials
80
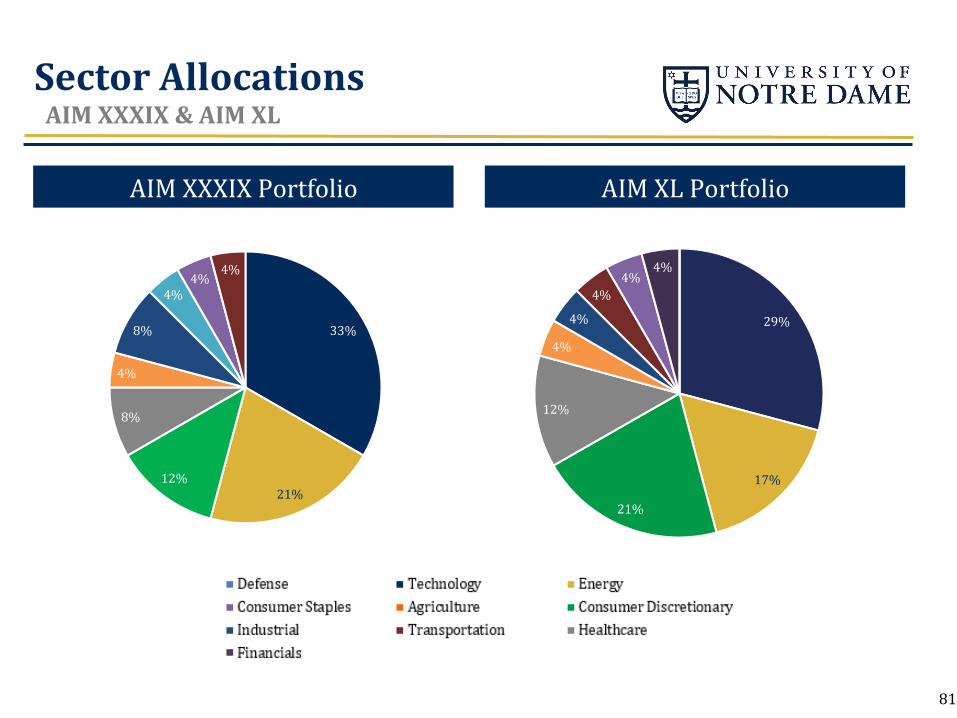
29%
17%
21%
12%
4%
4%
4% 4%
4%
Sector Allocations AIM XXXIX & AIM XL
AIM XXXIX Portfolio AIM XL Portfolio
81
33%
21% 12%
8%
4%
8%
4% 4%
4%
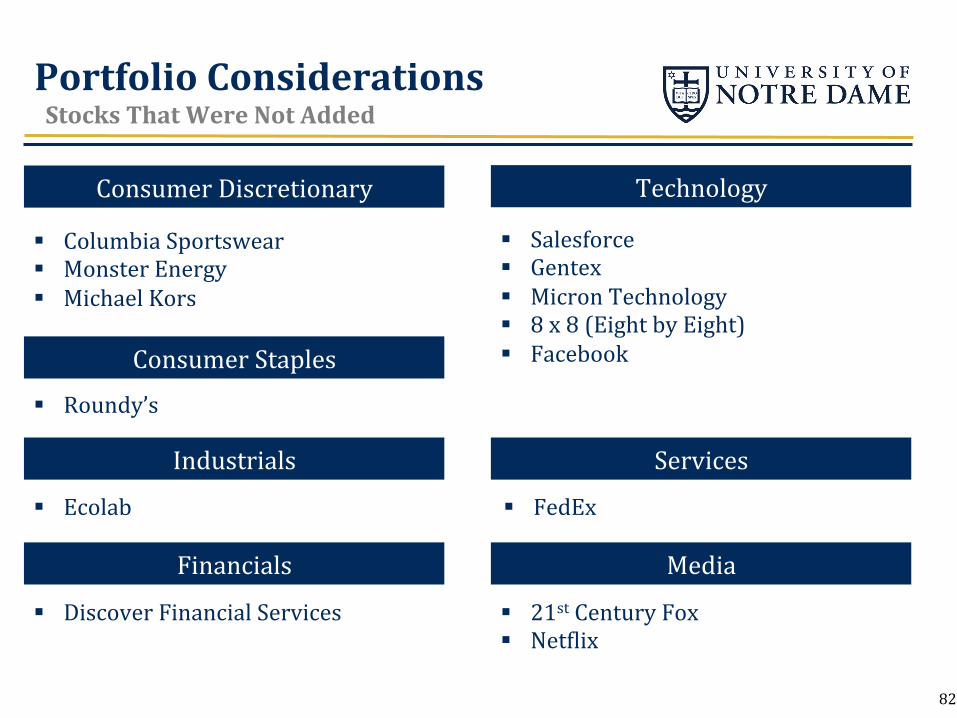
Portfolio Considerations Stocks That Were Not Added
§ Columbia Sportswear § Monster Energy § Michael Kors
Consumer Discretionary Technology
§ Salesforce § Gentex § Micron Technology § 8 x 8 (Eight by Eight) § Facebook
Industrials
§ FedEx
Services
§ Ecolab
Financials
§ Discover Financial Services § 21st Century Fox § NetNlix
Media
Consumer Staples
§ Roundy’s
82

AIM XL Highlights Guest Speakers Chicago Trip March Madness Newsletter Website
83

Guest Speakers
Ed Trubac Gianna Bern
Professor Emeritus, Finance Associate Professor, Finance Academic Director, Master of Science in Finance
Scott Malpass
Vice President Chief Investment OfNicer
University of Notre Dame University of Notre Dame University of Notre Dame
84

Chicago Trip
85

Chicago Trip
Troy Hanikoff – Managing Director Kelly Cornelis (’96, AIM I) -‐ Partner
86

Chicago Trip
Kimberly Flynn (’99, AIM) -‐ SVP Ann Kritzmire (’84) – Managing Director
87

Chicago Trip
Adam Fleck (’06, AIM) -‐ Director Jeremy Stampien (’05, AIM) -‐ Director
88
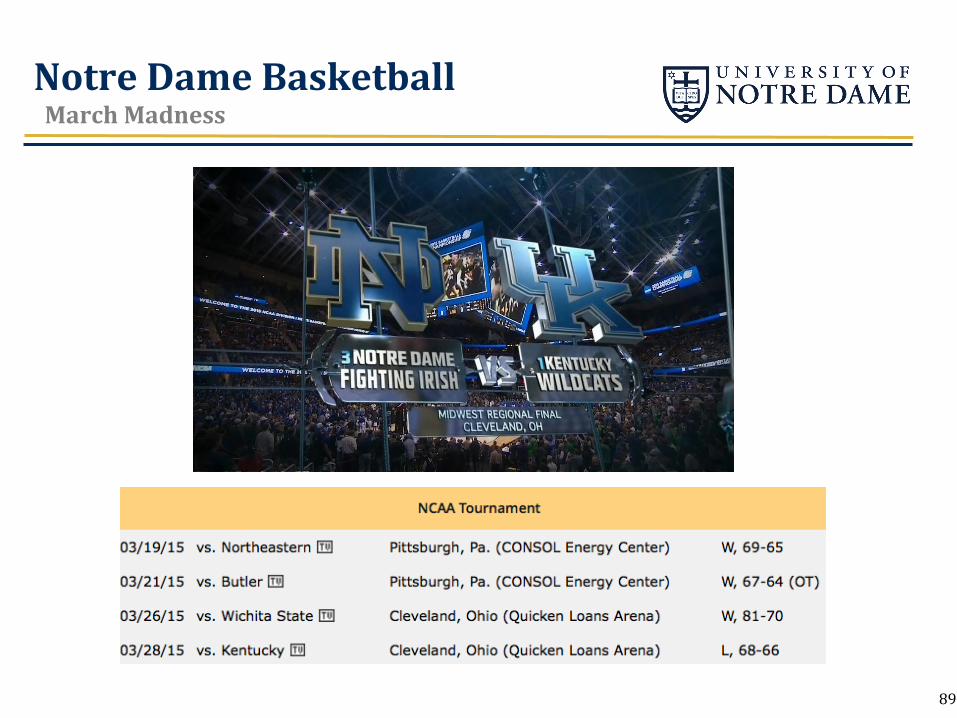
89
Notre Dame Basketball March Madness

AIM Newsletter
Newsletter Contents § State of the Economy
§ Portfolio Performance
§ Sector Updates
§ Company Developments
§ Portfolio Composition
§ Alumni Updates
§ Trips
§ Current Class ProNile
90
91
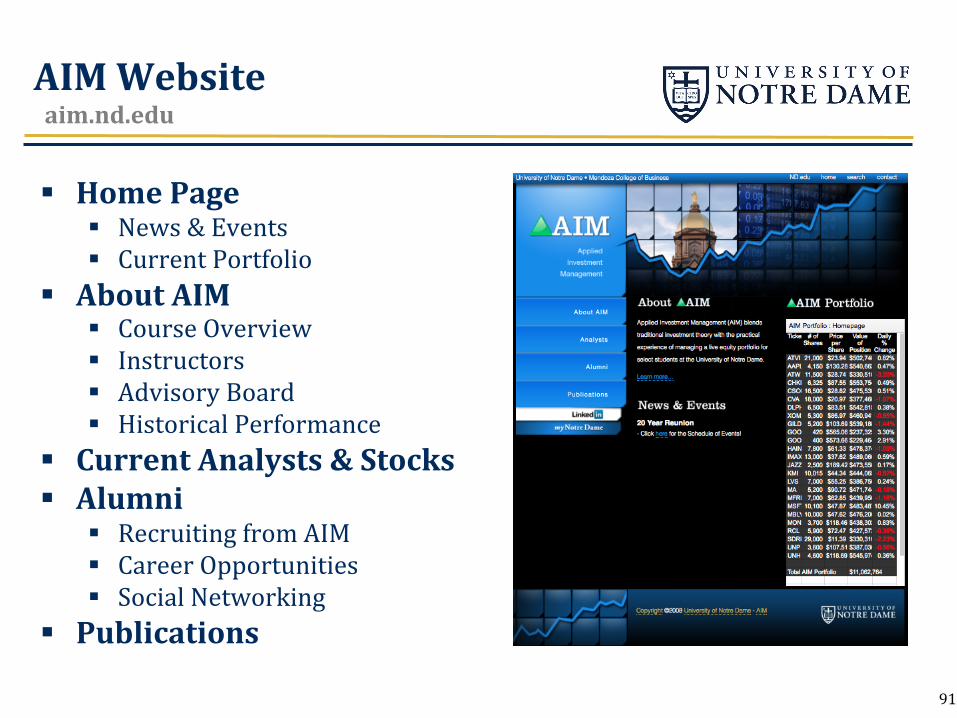
§ Home Page § News & Events § Current Portfolio
§ About AIM § Course Overview § Instructors § Advisory Board § Historical Performance
§ Current Analysts & Stocks § Alumni
§ Recruiting from AIM § Career Opportunities § Social Networking
§ Publications
AIM Website aim.nd.edu
Closing
92
§ AIM XL would like to thank: § The Advisory Board § Scott Malpass and the Notre Dame Investment OfNice § Advisors Langley, McDonald, Reilly, and Trubac § Rachel Karnafel
§ Post-‐Presentation Agenda: § Short break § Advisory Board panel discussion

AIM XL