aeci limited presentation to investors and media 26 and 27 july 2005
TRANSCRIPT

AECI LimitedAECI Limited
Presentation to Investors and Media
26 and 27 July 2005

SummarySummary
Pleasing performance from portfolio with all operations posting increased trading profits
Progress with key strategic initiatives of margin and cost control, growth through acquisitions and innovation
7
8
9
1 0
'0 1 '0 2 '0 3 '0 4 '0 5 H 1
Trading margin: per
cent

SummarySummary
Headline earnings per share up 23 per cent
Revenue R4 billion
Balance sheet ratios sound; working capital increased from historic lows
Continue to manage volatile external factors (currency and input costs)

Pleasing performancePleasing performance
Maintained earnings growth in spite of continued currency strength, volatile input costs, sluggish growth in manufacturing sector and pressure on gold mining
0
50
100
150
200
250
300
350
400
'00 '01 '02 '03 '04 '05
EPS in cents

Business environmentBusiness environment
Much of the same
Low inflation, low interest rates, and positive consumer confidence continued
Mining, particularly gold, and manufacturing still under pressure from relatively strong rand
Demand stable
Oil price higher, some raw materials scarce but improving, prices volatile
Rand on weaker trend?

Results for 200Results for 2005 H15 H1 HEPS +23%
Volumes marginally lower– Plant shutdown, Zim, gold
TP margin increased by 1.5 percentage points– CSL solid, others improved
Revenue +3% – Domestic revenue unchanged
Foreign sales +19% in rand but +28% in dollars
Headline earnings per share: cents
140
160
180
200
2004 H1 2005 H1
FinancialFinancial
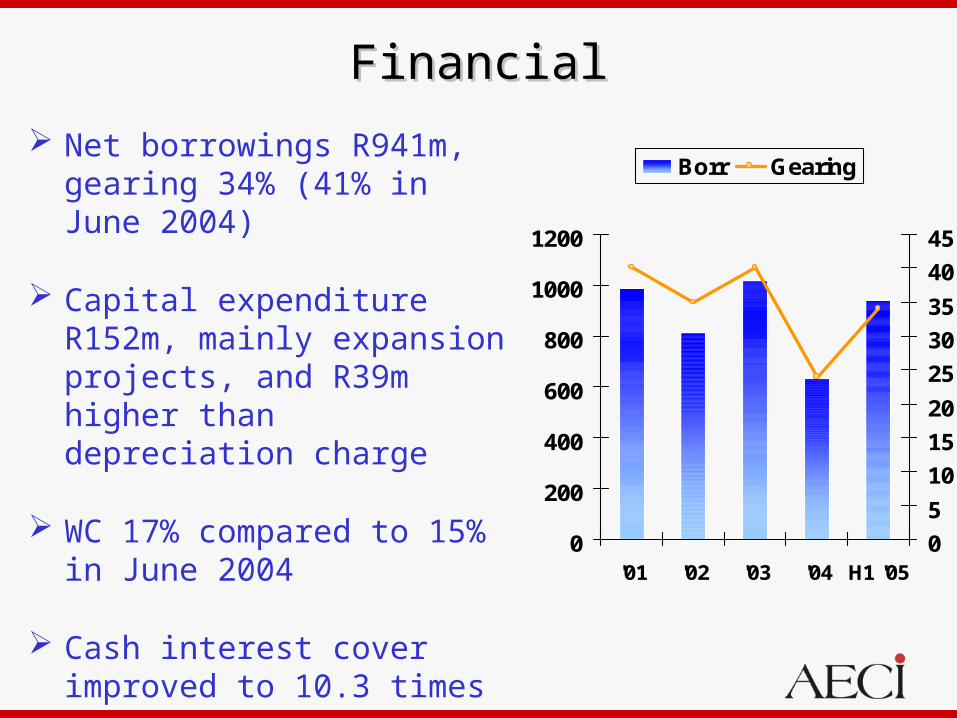
Net borrowings R941m, gearing 34% (41% in June 2004)
Capital expenditure R152m, mainly expansion projects, and R39m higher than depreciation charge
WC 17% compared to 15% in June 2004
Cash interest cover improved to 10.3 times
0
200
400
600
800
1000
1200
'01 '02 '03 '04 H1 '050
5
10
15
20
25
30
35
40
45
Borr Gearing

Segmental trading profit (Rm)Segmental trading profit (Rm)
-50
0
50
100
150
200
Min Sol Sp Chem Sp Fibres D&P Coat Property Corp
2004 H1 2005 H1

Group EVAGroup EVA®® (Rm) (Rm)
-250
-200
-150
-100
-50
0
50
100
'98 '99 '00 '01 '02 '03 '04 '05
Calculated at WACC of 15% for ’97 to ’03 and 14% for ’04 and
’05
Calculated at WACC of 15% for ’97 to ’03 and 14% for ’04 and
’05

EVAEVA®® by business (Rm) by business (Rm)
-125
-100
-75
-50
-25
0
25
50
75
Min Sol Sp Chem Sp Fibres D&P Coat Other
2004 2005 H1
Includes goodwill at cost
Includes goodwill at cost

Mining solutionsMining solutions
Revenue R1 089m (+4%); TP R116m (+15%)
Margin up 1.0% to 10.7%
Volumes flat in South Africa; growth in other sectors and territories offset decline in local gold mining
Pleasing performance from rest of Africa, good growth in west Africa, Botswana and Zambia
Satisfactory progress on restructuring of business. Footprint reduction at Modderfontein well advanced; new bulk emulsion and Anfex plants commissioned


Mining solutionsMining solutions Cost reduction exercise of 2004 completed
successfully. Resulted in better fixed cost to sales ratio
Imports of state-subsidised initiators from China continued but well contained through a range of actions
However, Chinese imports and extreme cost pressures in gold mining resulted in gross margins declining
Investigation into alleged dumping of Shocktube detonators by China announced by ITAC
Exports of ammonium nitrate to Australia underway, and expected to continue in 2006

Mining solutionsMining solutions DetNet progress
– Joint venture operating well; not expected to be affected by the proposed sale of Dyno Nobel
– Product development slightly behind initial estimates, but first international product (HotShot) now being shipped to 4 continents for simultaneous market introduction
– Production being ramped up to satisfy global demand; regional assembly under consideration to overcome logistical delays

Mining solutionsMining solutions Strategy
Development, manufacture and supply of value-adding services, initiating systems and explosives to the mining, quarrying and allied industries
Modernisation of initiating systems manufacturing at Modderfontein to create world-class base for growth
Investigating opportunities to lessen dependence on South African gold mining industry by taking business model to other regions through an acquisition strategy
Rapid growth and international expansion of electronic detonators

Specialty chemicalsSpecialty chemicals
Revenue R1 670m (+3%); TP R174m (+3%)
Trading margin maintained in narrow range, supported by robust value-add service model
Solid result despite adverse trading conditions as customers in mining and manufacturing wrestled with effects of the strong currency
Volumes down with plant shutdown at CI and exports to Zimbabwe, otherwise stable
Input costs variable with currency, global demand and oil price, but gross margins maintained

Specialty chemicalsSpecialty chemicals Costs remain high on agenda; Isithebe site
almost vacated and closure of alum plant in Springs announced
AECI Coatings returns improved significantly; alternative broad supplier technology strategy implemented, sales to OEM automotive sector increasing
Acquisitions; UAP (distributor of specialty agro-chemicals) in January 2005 and Chemiphos (producer of food-grade phosphates) in May; Orlik (metal treatment) with regulatory authorities
Chemiphos plant
Specialty chemicalsSpecialty chemicals
Negotiations well-advanced regarding sale of 25.1% equity interest in ImproChem (water treatment) to the Tiso Group
Other sectors being investigated for BEE opportunities

Specialty chemicalsSpecialty chemicals
Strategy Managing a portfolio of companies built on
chemistry and strong service element Strength is sound business management, service
models, appetite for growth, successful acquisition history, attraction to global alliances, and regional knowledge
Seeks to expand out of sub-Saharan region, with technology unrestricted by licences; strong focus on mining chemicals
Presentation 18 October

Specialty fibresSpecialty fibres Revenue R828m (+2%); TP R19m
In dollar terms revenue and contribution margin (+9%) increased
Progress towards positive EVA® on track– Cost optimisation– Product development
USA JV now profitable, good volume growth
Apparel market continues to suffer
LDI nylon growth in Europe, US, India and China
Commissioned enviro-friendly steam project
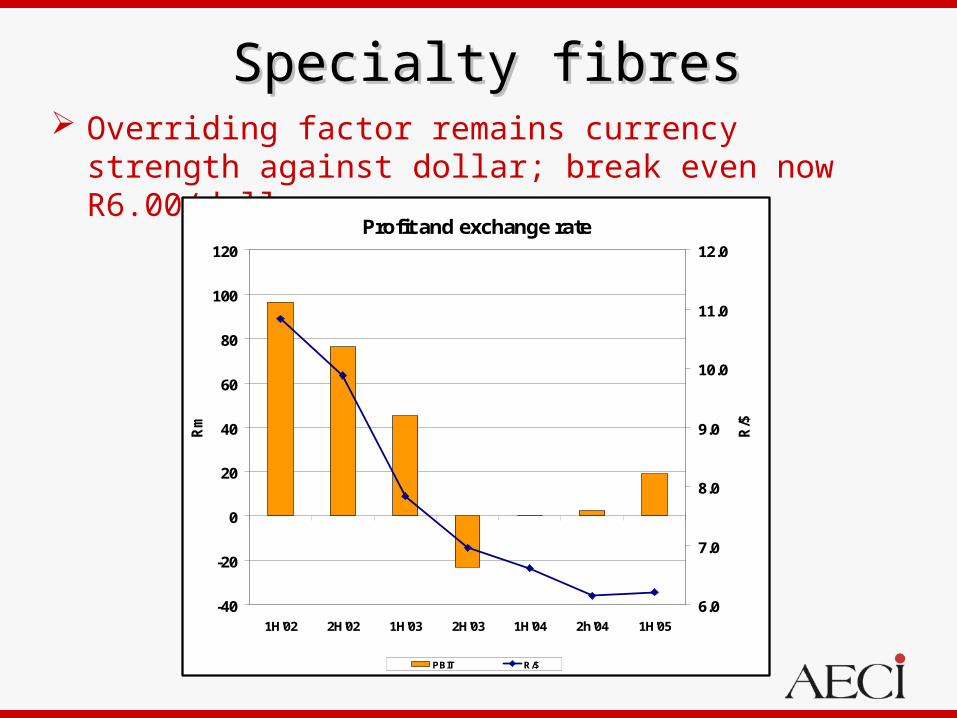
Specialty fibresSpecialty fibres Overriding factor remains currency strength
against dollar; break even now R6.00/dollar
Profit and exchange rate
-40
-20
0
20
40
60
80
100
120
1H'02 2H'02 1H'03 2H'03 1H'04 2h'04 1H'05
Rm
6.0
7.0
8.0
9.0
10.0
11.0
12.0
R/$
PBIT R/$

Specialty fibresSpecialty fibres Strategy
– Product development to fill LDI yarn plants
– HDI polyester yarn margin focus in selected markets
– Cost, efficiencies, yields
– Plant restoration and improvement
Progress
– Product development strategy on track, particularly airbag and weaving yarns
– Good HDI polyester & LDI nylon performance
– Approved limited investments to increase LDI nylon drawing and PET capacity
Decorative & packaging coatingsDecorative & packaging coatings
Revenue R293m (-3%); TP R15m (+25%)
Seasonal business
Satisfactory performance in South Africa continues, Botswana disappointing and closed Mozambique operations
New agreement with ICI allows further expansion in Africa and Indian Ocean islands for use of Dulux trade name

Decorative & packaging coatingsDecorative & packaging coatings
Strategy
Build on brand image to be first choice for customers in chosen market segments
Increase distribution outlets; “Partner of choice in channel of choice”
Develop ICI relationship and opportunities
PropertyProperty
Revenue R174m (+4%); TP R68m (+84%)
Healthy demand continued, particularly in Modderfontein, for commercial, residential and retail sectors
Gautrain project slow, and final route required to facilitate future plans
Will start Somerset West legacy remediation in summer dry season

PropertyProperty
Strategy
Manage the realisation of land and related assets that have become surplus to the Group’s requirements in a responsible and controlled way

Share priceShare price
AECI share pricerelative to JSE Ind index
0
100
200
300
400
500
Relative rating to industrials improved since year-end 2004
R an d per sh are
0
10
20
30
40
50
Graph adjusted for R6 special dividend (November 1999)

OutlookOutlook
Positive
Progressive benefits of prior actions to continue
Weaker rand is helpful
Business model of margin management offsets input (raw material) volatility
Acquisitions in Chemserve
Management targets real increase in headline earnings