aegean air
DESCRIPTION
eapTRANSCRIPT
Aegean Airlines Outperform (from Outperform) Mkt. Price: € 6.5
Travel & Leisure High Risk (from High Risk) Target Price: € 8.5
FTSE MI: 462.61
Equity Research | Update
Changes
Target price
of which DPSPrevious € 9.50Total stock return 31.2%
Valuation 2014a 2015e 2016e 2017e
P/E 5.8x 8.2x 6.4x 5.6x
P/BV 2.1x 2.0x 1.8x 1.6x
EV/Sales 0.3x 0.3x 0.2x 0.2x
EV/EBITDA 2.7x 3.3x 2.1x 1.6x
EV/EBIT 3.0x 3.9x 2.4x 1.8x
Dividend yield 11.2% 7.9% 10.1% 11.6%
FCF yield 19% 25% 35% 41%
Per share
EPS 1.12 0.79 1.01 1.16
EPS old 1.12 1.12 1.22 1.18
DPS 0.73 0.52 0.66 0.76
BS data (€m)
Sh. Equity 216 236 262 291
Net debt -149 -181 -220 -252
P&L data (€m)
Revenues 912 948 999 1,055
EBITDA 119 86 117 132
EBIT 106 73 104 119
Net income 80 57 72 83
Trading data 1m 3m 6m 12m
Rel. Performance 8.5% 12.2% 11.3% 8.5%
Abs. Performance 5.7% -10.3% -13.3% 5.7%
H | L 52w € 8.1 € 5.0
Market cap. (mn) € 464.2
Shares outstanding (m): 71.4
Free float (%, mn) 39% € 181.5
Avg. vol. Traded (52w): 97.45k
Index constituent & weight:
ASE (1.9%), FTSE LC (1.32%), FTSE MI (1.26%)
Antonis Diapoulis, Analyst
T +30 210 367 7532, +30 210 367 7513
Please refer to important disclosures in the Disclosure Appendix
Aegean Airlines is a Greek commercial full service aircraft carrier that operates scheduled and charter routes to Greek
(domestic) and international destinations.
Alpha Finance does and seeks to do business with companies covered in its research reports. Consequently, investors should be aware that the firm may have
a conflict of interest that could affect the objectivity of this report. Investors should consider this report as only a single factor in making their investment
decision.
September 4, 2015
RIC: AGNr.AT, BBG: AEGEAN GA
Rating - TP EPS
€ 8.5
€ 0.66
Evasive maneuvers successful! Re-iterate ‘Outperform’ Aegean lived the drama of the sharp downturn in the Greek economy after the capital controls were imposed on June 26th. The impact in terms of yields is expected to be severe (AFe FY 15e -9% y-o-y) but should be partly counterbalanced by strong traffic (July passengers up 19% y-o-y - AFe FY 15e +13.2% y-o-y). During the first three weeks the capital controls were imposed, Aegean planes were flying with good load factors as more of the tickets were pre sold. Thus, the lack of pre-booking caused by the adverse conditions in the local banking system did not have an initial effect. In order to reboot the demand in the market Aegean was forced to put additional pressure on pricing especially in domestic destinations. Additionally, demand from international travelers resumed normal levels quite fast in July as the risk was contained when Greece agreed on a new bailout. The company also exploited the inability of its biggest competitor (Ryanair) to accept Greek customers’ credit cards during the high demand period of July due to the capital controls situation. Overall, tourism showed a significant resilience with the overall effect being moderate for Aegean. Therefore, we believe that if a pro-bailout coalition government is formed in upcoming September 20th national elections, economic stability will gradually return and tourism is set for a very strong 2016. Aegean will find itself at a pole position against completion ready to absorb increased demand. Target price @ €8.4/share We have adopted a positive scenario for the economy as our base case, but potential investors should be cautious as the outlook for Greece is still weak.Our new target price is achieved by lower WACC (11.8% vs. 13.2% previously) but also downgrading our midterm estimates. Our EPS downgrade stands at -29% for 2015 and -14.7% for 2016 on the back of lower passenger yields. Trades at discount It comes as no surprise that Aegean currently trades at a huge discount of 66% in 15’ EV/EBITDA terms compared to its EU peers. Investors discount negatively the Greek economic outlook and the uncertainty generated by the upcoming snap elections. New Assumptions In a snap, a) we increased 2015 fleet to 58 from 57 but kept our long term estimate to 58 planes, b) adjusted 2015 on the back of recent events by setting passenger yields down 9% (vs. AFe old -5%) and passengers to 11.4mn vs. AFe old 11.69mn, c) revisited our cost assumptions adjusting oil estimates (2016 hedge at $60-20/barrel vs. $ 75-77 in 2105 -- l/t EBITDAR margin 16-17% vs. AFe old 17% and
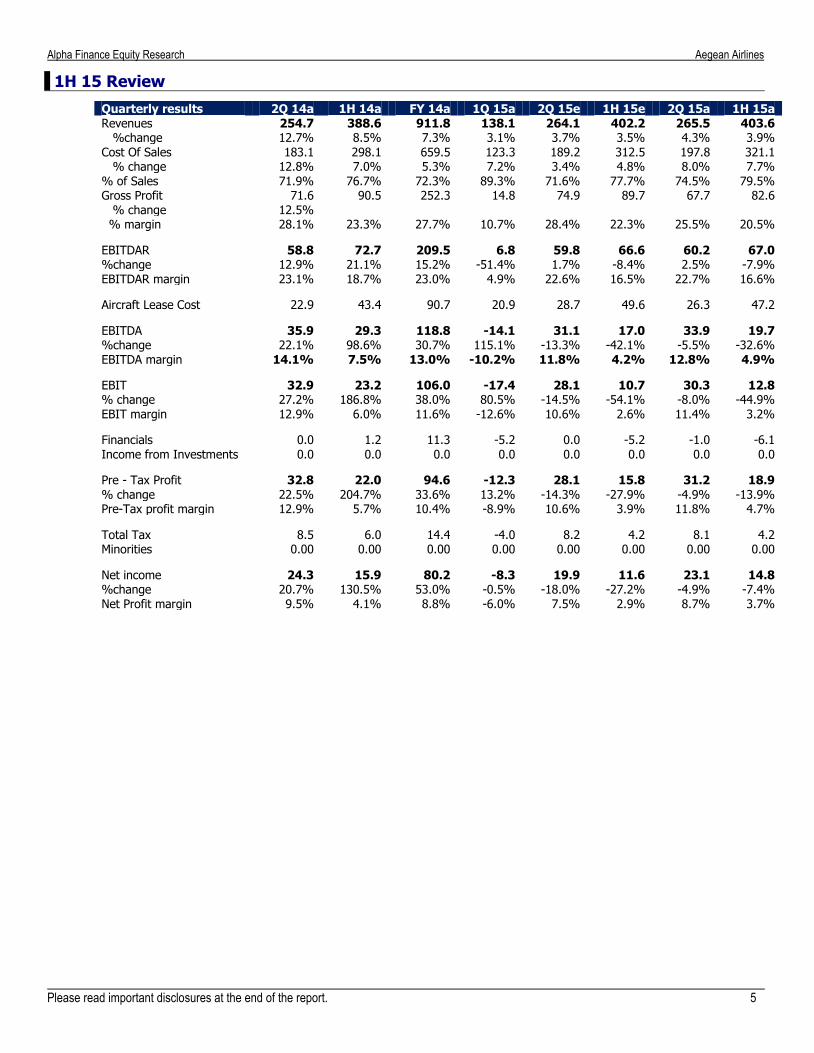
CASK CAGR 14/17e -3.9% vs. AFe old 1.2%). 1H 15 snapshot Revenues, EBITDAR, EBITDA and net income came at €403.6mn (+6% y-o-y, AFe €402.2mn), €67mn (+-8.4% y-o-y, AFe €66.6mn), €19.7mn (-33% y-o-y) and €14.8mn (-8% y-o-y AFe €11.6mn) respectively. Yields retreated by 8% y-o-y and load factors were down 2.7% annually to 73.4% (RPK/ASK). Traffic was up 15% y-o-y to 4.9mn (2.5mn domestic +10% y-o-y - 2.4mn international +20% y-o-y). FCF was positive by €130.8mn vs. €113.9mn in 1H 14.
5.0
5.5
6.0
6.5
7.0
7.5
8.0
8.5
0
100
200
300
400
N-14 J-15 F-15 A-15 M-15 J-15 M-15
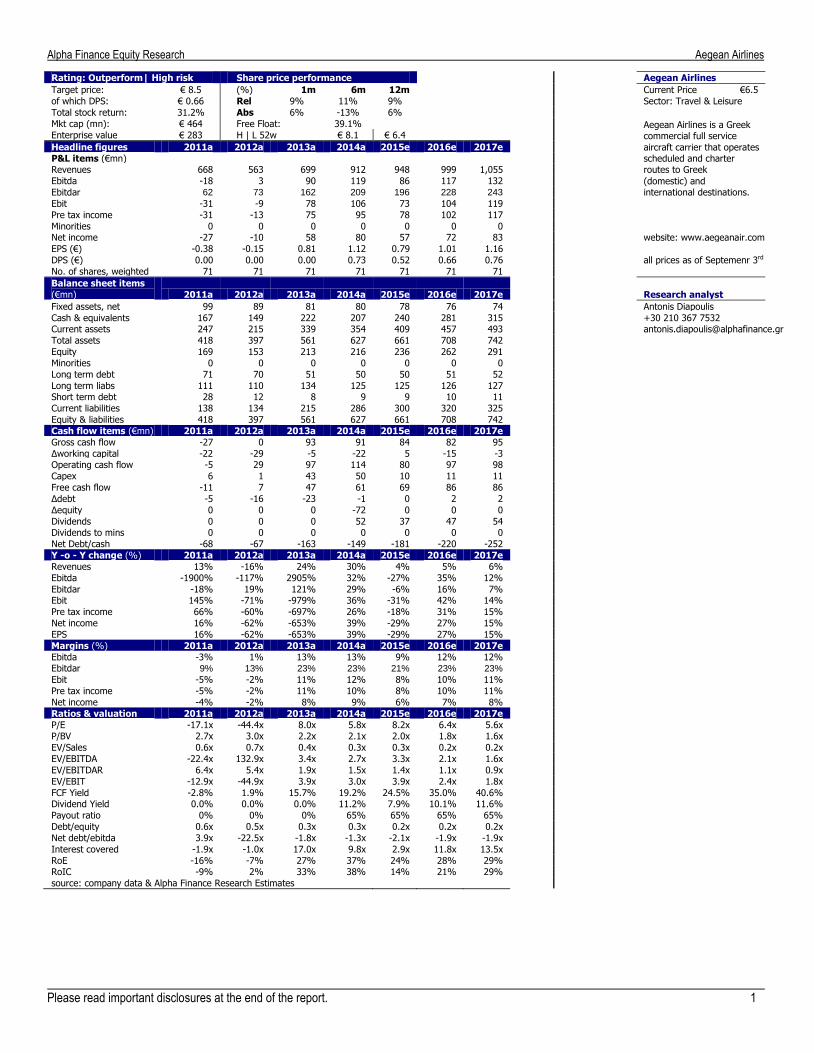
52w performance
Vol traded (,000s shares) LH scale Adjusted price
Alpha Finance Equity Research Aegean Airlines
Please read important disclosures at the end of the report. 1
Rating: Outperform| High risk Share price performance Aegean Airlines
Target price: € 8.5 (%) 1m 6m 12m Current Price €6.5
of which DPS: € 0.66 Rel 9% 11% 9% Sector: Travel & Leisure
Total stock return: 31.2% Abs 6% -13% 6%
Mkt cap (mn): € 464 Free Float: 39.1% Aegean Airlines is a Greek commercial full service
aircraft carrier that operates scheduled and charter routes to Greek
Enterprise value € 283 H | L 52w € 8.1 € 6.4
Headline figures 2011a 2012a 2013a 2014a 2015e 2016e 2017e
P&L items (€mn) Revenues 668 563 699 912 948 999 1,055
Ebitda -18 3 90 119 86 117 132 (domestic) and international destinations.
Ebitdar 62 73 162 209 196 228 243
Ebit -31 -9 78 106 73 104 119
Pre tax income -31 -13 75 95 78 102 117
Minorities 0 0 0 0 0 0 0 Net income -27 -10 58 80 57 72 83 website: www.aegeanair.com
EPS (€) -0.38 -0.15 0.81 1.12 0.79 1.01 1.16
DPS (€) 0.00 0.00 0.00 0.73 0.52 0.66 0.76 all prices as of Septemenr 3rd
No. of shares, weighted 71 71 71 71 71 71 71
Balance sheet items
(€mn) 2011a 2012a 2013a 2014a 2015e 2016e 2017e Research analyst
Fixed assets, net 99 89 81 80 78 76 74 Antonis Diapoulis
Cash & equivalents 167 149 222 207 240 281 315 +30 210 367 7532 Current assets 247 215 339 354 409 457 493 [email protected]
Total assets 418 397 561 627 661 708 742
Equity 169 153 213 216 236 262 291
Minorities 0 0 0 0 0 0 0
Long term debt 71 70 51 50 50 51 52
Long term liabs 111 110 134 125 125 126 127 Short term debt 28 12 8 9 9 10 11
Current liabilities 138 134 215 286 300 320 325
Equity & liabilities 418 397 561 627 661 708 742
Cash flow items (€mn) 2011a 2012a 2013a 2014a 2015e 2016e 2017e
Gross cash flow -27 0 93 91 84 82 95
Δworking capital -22 -29 -5 -22 5 -15 -3 Operating cash flow -5 29 97 114 80 97 98
Capex 6 1 43 50 10 11 11
Free cash flow -11 7 47 61 69 86 86
Δdebt -5 -16 -23 -1 0 2 2
Δequity 0 0 0 -72 0 0 0
Dividends 0 0 0 52 37 47 54 Dividends to mins 0 0 0 0 0 0 0
Net Debt/cash -68 -67 -163 -149 -181 -220 -252
Y -o - Y change (%) 2011a 2012a 2013a 2014a 2015e 2016e 2017e
Revenues 13% -16% 24% 30% 4% 5% 6%
Ebitda -1900% -117% 2905% 32% -27% 35% 12%
Ebitdar -18% 19% 121% 29% -6% 16% 7% Ebit 145% -71% -979% 36% -31% 42% 14%
Pre tax income 66% -60% -697% 26% -18% 31% 15%
Net income 16% -62% -653% 39% -29% 27% 15%
EPS 16% -62% -653% 39% -29% 27% 15%
Margins (%) 2011a 2012a 2013a 2014a 2015e 2016e 2017e
Ebitda -3% 1% 13% 13% 9% 12% 12% Ebitdar 9% 13% 23% 23% 21% 23% 23%
Ebit -5% -2% 11% 12% 8% 10% 11%
Pre tax income -5% -2% 11% 10% 8% 10% 11%
Net income -4% -2% 8% 9% 6% 7% 8%
Ratios & valuation 2011a 2012a 2013a 2014a 2015e 2016e 2017e
P/E -17.1x -44.4x 8.0x 5.8x 8.2x 6.4x 5.6x P/BV 2.7x 3.0x 2.2x 2.1x 2.0x 1.8x 1.6x
EV/Sales 0.6x 0.7x 0.4x 0.3x 0.3x 0.2x 0.2x
EV/EBITDA -22.4x 132.9x 3.4x 2.7x 3.3x 2.1x 1.6x
EV/EBITDAR 6.4x 5.4x 1.9x 1.5x 1.4x 1.1x 0.9x
EV/EBIT -12.9x -44.9x 3.9x 3.0x 3.9x 2.4x 1.8x
FCF Yield -2.8% 1.9% 15.7% 19.2% 24.5% 35.0% 40.6% Dividend Yield 0.0% 0.0% 0.0% 11.2% 7.9% 10.1% 11.6%
Payout ratio 0% 0% 0% 65% 65% 65% 65%
Debt/equity 0.6x 0.5x 0.3x 0.3x 0.2x 0.2x 0.2x
Net debt/ebitda 3.9x -22.5x -1.8x -1.3x -2.1x -1.9x -1.9x
Interest covered -1.9x -1.0x 17.0x 9.8x 2.9x 11.8x 13.5x
RoE -16% -7% 27% 37% 24% 28% 29% RoIC -9% 2% 33% 38% 14% 21% 29%
source: company data & Alpha Finance Research Estimates
Alpha Finance Equity Research Aegean Airlines
Please read important disclosures at the end of the report. 2
Valuation – Sensitivity
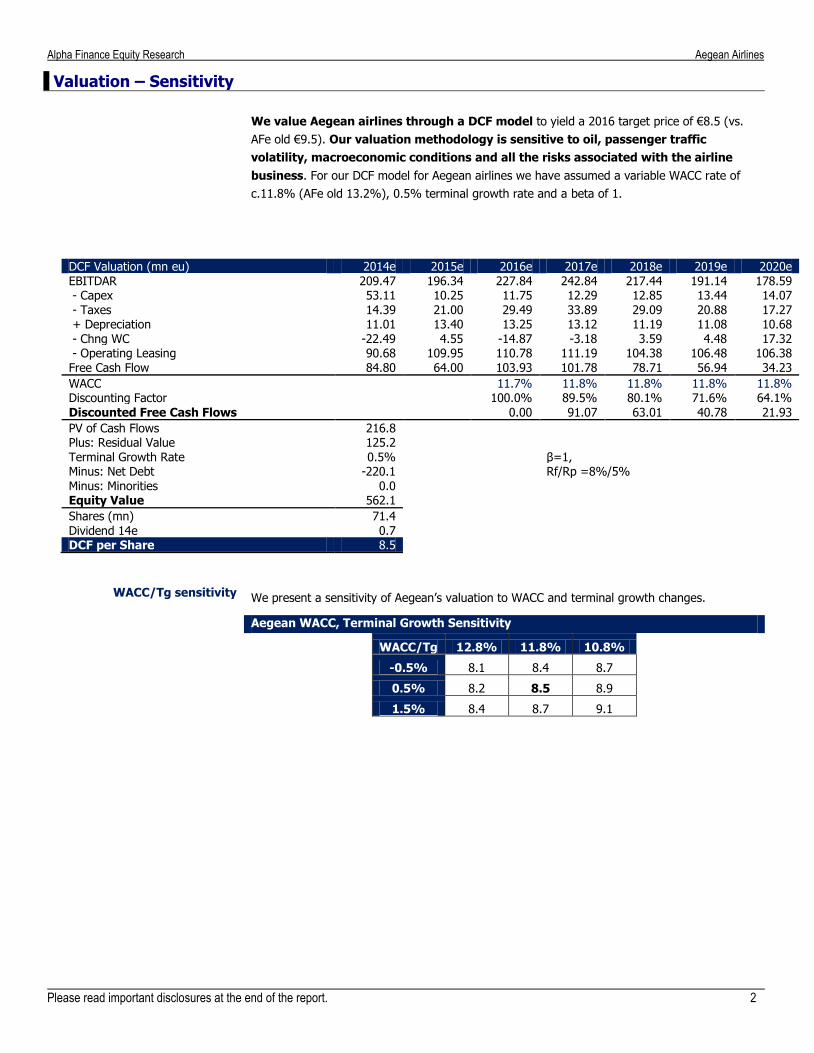
We value Aegean airlines through a DCF model to yield a 2016 target price of €8.5 (vs.
AFe old €9.5). Our valuation methodology is sensitive to oil, passenger traffic
volatility, macroeconomic conditions and all the risks associated with the airline
business. For our DCF model for Aegean airlines we have assumed a variable WACC rate of
c.11.8% (AFe old 13.2%), 0.5% terminal growth rate and a beta of 1.
DCF Valuation (mn eu) 2014e 2015e 2016e 2017e 2018e 2019e 2020e EBITDAR 209.47 196.34 227.84 242.84 217.44 191.14 178.59 - Capex 53.11 10.25 11.75 12.29 12.85 13.44 14.07 - Taxes 14.39 21.00 29.49 33.89 29.09 20.88 17.27 + Depreciation 11.01 13.40 13.25 13.12 11.19 11.08 10.68 - Chng WC -22.49 4.55 -14.87 -3.18 3.59 4.48 17.32 - Operating Leasing 90.68 109.95 110.78 111.19 104.38 106.48 106.38 Free Cash Flow 84.80 64.00 103.93 101.78 78.71 56.94 34.23
WACC
11.7% 11.8% 11.8% 11.8% 11.8% Discounting Factor
100.0% 89.5% 80.1% 71.6% 64.1%
Discounted Free Cash Flows 0.00 91.07 63.01 40.78 21.93
PV of Cash Flows 216.8 Plus: Residual Value 125.2 Terminal Growth Rate 0.5%
β=1, Minus: Net Debt -220.1
Rf/Rp =8%/5%
Minus: Minorities 0.0 Equity Value 562.1 Shares (mn) 71.4
Dividend 14e 0.7 DCF per Share 8.5
WACC/Tg sensitivity We present a sensitivity of Aegean’s valuation to WACC and terminal growth changes.
Aegean WACC, Terminal Growth Sensitivity
WACC/Tg 12.8% 11.8% 10.8%
-0.5% 8.1 8.4 8.7
0.5% 8.2 8.5 8.9
1.5% 8.4 8.7 9.1
Alpha Finance Equity Research Aegean Airlines
Please read important disclosures at the end of the report. 3
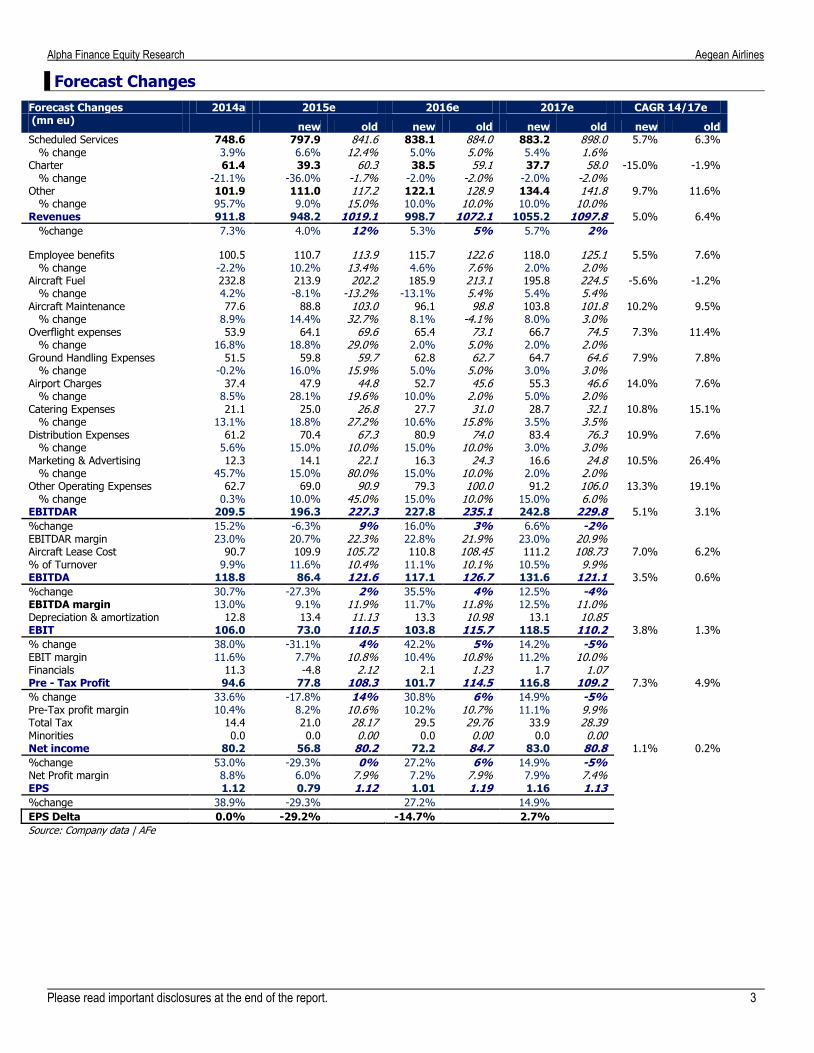
Forecast Changes
Forecast Changes 2014a 2015e 2016e 2017e CAGR 14/17e (mn eu)
new old new old new old new old
Scheduled Services 748.6 797.9 841.6 838.1 884.0 883.2 898.0 5.7% 6.3% % change 3.9% 6.6% 12.4% 5.0% 5.0% 5.4% 1.6%
Charter 61.4 39.3 60.3 38.5 59.1 37.7 58.0 -15.0% -1.9% % change -21.1% -36.0% -1.7% -2.0% -2.0% -2.0% -2.0%
Other 101.9 111.0 117.2 122.1 128.9 134.4 141.8 9.7% 11.6% % change 95.7% 9.0% 15.0% 10.0% 10.0% 10.0% 10.0%
Revenues 911.8 948.2 1019.1 998.7 1072.1 1055.2 1097.8 5.0% 6.4%
%change 7.3% 4.0% 12% 5.3% 5% 5.7% 2%
Employee benefits 100.5 110.7 113.9 115.7 122.6 118.0 125.1 5.5% 7.6% % change -2.2% 10.2% 13.4% 4.6% 7.6% 2.0% 2.0%
Aircraft Fuel 232.8 213.9 202.2 185.9 213.1 195.8 224.5 -5.6% -1.2% % change 4.2% -8.1% -13.2% -13.1% 5.4% 5.4% 5.4%
Aircraft Maintenance 77.6 88.8 103.0 96.1 98.8 103.8 101.8 10.2% 9.5% % change 8.9% 14.4% 32.7% 8.1% -4.1% 8.0% 3.0%
Overflight expenses 53.9 64.1 69.6 65.4 73.1 66.7 74.5 7.3% 11.4% % change 16.8% 18.8% 29.0% 2.0% 5.0% 2.0% 2.0%
Ground Handling Expenses 51.5 59.8 59.7 62.8 62.7 64.7 64.6 7.9% 7.8% % change -0.2% 16.0% 15.9% 5.0% 5.0% 3.0% 3.0%
Airport Charges 37.4 47.9 44.8 52.7 45.6 55.3 46.6 14.0% 7.6% % change 8.5% 28.1% 19.6% 10.0% 2.0% 5.0% 2.0%
Catering Expenses 21.1 25.0 26.8 27.7 31.0 28.7 32.1 10.8% 15.1% % change 13.1% 18.8% 27.2% 10.6% 15.8% 3.5% 3.5%
Distribution Expenses 61.2 70.4 67.3 80.9 74.0 83.4 76.3 10.9% 7.6% % change 5.6% 15.0% 10.0% 15.0% 10.0% 3.0% 3.0%
Marketing & Advertising 12.3 14.1 22.1 16.3 24.3 16.6 24.8 10.5% 26.4% % change 45.7% 15.0% 80.0% 15.0% 10.0% 2.0% 2.0%
Other Operating Expenses 62.7 69.0 90.9 79.3 100.0 91.2 106.0 13.3% 19.1% % change 0.3% 10.0% 45.0% 15.0% 10.0% 15.0% 6.0%
EBITDAR 209.5 196.3 227.3 227.8 235.1 242.8 229.8 5.1% 3.1%
%change 15.2% -6.3% 9% 16.0% 3% 6.6% -2% EBITDAR margin 23.0% 20.7% 22.3% 22.8% 21.9% 23.0% 20.9% Aircraft Lease Cost 90.7 109.9 105.72 110.8 108.45 111.2 108.73 7.0% 6.2%
% of Turnover 9.9% 11.6% 10.4% 11.1% 10.1% 10.5% 9.9% EBITDA 118.8 86.4 121.6 117.1 126.7 131.6 121.1 3.5% 0.6%
%change 30.7% -27.3% 2% 35.5% 4% 12.5% -4% EBITDA margin 13.0% 9.1% 11.9% 11.7% 11.8% 12.5% 11.0% Depreciation & amortization 12.8 13.4 11.13 13.3 10.98 13.1 10.85 EBIT 106.0 73.0 110.5 103.8 115.7 118.5 110.2 3.8% 1.3%
% change 38.0% -31.1% 4% 42.2% 5% 14.2% -5% EBIT margin 11.6% 7.7% 10.8% 10.4% 10.8% 11.2% 10.0% Financials 11.3 -4.8 2.12 2.1 1.23 1.7 1.07 Pre - Tax Profit 94.6 77.8 108.3 101.7 114.5 116.8 109.2 7.3% 4.9%
% change 33.6% -17.8% 14% 30.8% 6% 14.9% -5% Pre-Tax profit margin 10.4% 8.2% 10.6% 10.2% 10.7% 11.1% 9.9% Total Tax 14.4 21.0 28.17 29.5 29.76 33.9 28.39 Minorities 0.0 0.0 0.00 0.0 0.00 0.0 0.00 Net income 80.2 56.8 80.2 72.2 84.7 83.0 80.8 1.1% 0.2%
%change 53.0% -29.3% 0% 27.2% 6% 14.9% -5% Net Profit margin 8.8% 6.0% 7.9% 7.2% 7.9% 7.9% 7.4% EPS 1.12 0.79 1.12 1.01 1.19 1.16 1.13 %change 38.9% -29.3%
27.2%
14.9%
EPS Delta 0.0% -29.2% -14.7% 2.7% Source: Company data | AFe
Alpha Finance Equity Research Aegean Airlines
Please read important disclosures at the end of the report. 4
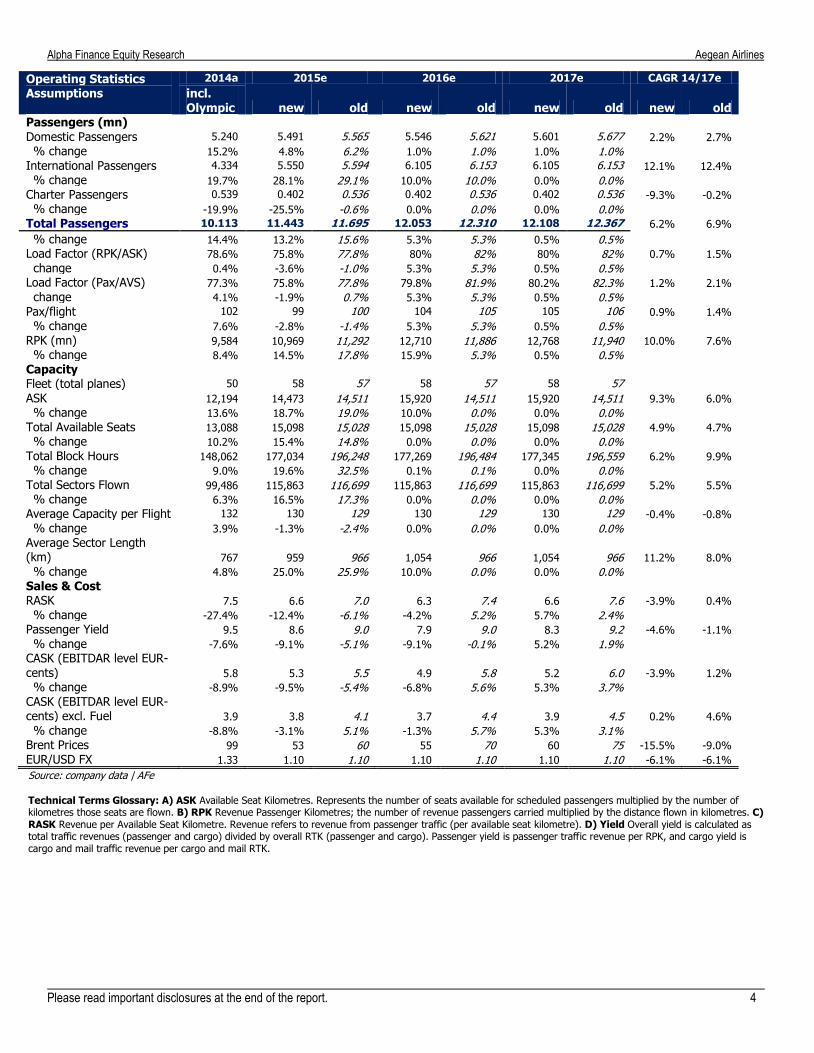
Operating Statistics Assumptions
2014a 2015e 2016e 2017e CAGR 14/17e
incl.
Olympic new old new old new old new old Passengers (mn)
Domestic Passengers 5.240 5.491 5.565 5.546 5.621 5.601 5.677 2.2% 2.7%
% change 15.2% 4.8% 6.2% 1.0% 1.0% 1.0% 1.0% International Passengers 4.334 5.550 5.594 6.105 6.153 6.105 6.153 12.1% 12.4%
% change 19.7% 28.1% 29.1% 10.0% 10.0% 0.0% 0.0% Charter Passengers 0.539 0.402 0.536 0.402 0.536 0.402 0.536 -9.3% -0.2%
% change -19.9% -25.5% -0.6% 0.0% 0.0% 0.0% 0.0% Total Passengers 10.113 11.443 11.695 12.053 12.310 12.108 12.367 6.2% 6.9%
% change 14.4% 13.2% 15.6% 5.3% 5.3% 0.5% 0.5% Load Factor (RPK/ASK) 78.6% 75.8% 77.8% 80% 82% 80% 82% 0.7% 1.5%
change 0.4% -3.6% -1.0% 5.3% 5.3% 0.5% 0.5% Load Factor (Pax/AVS) 77.3% 75.8% 77.8% 79.8% 81.9% 80.2% 82.3% 1.2% 2.1%
change 4.1% -1.9% 0.7% 5.3% 5.3% 0.5% 0.5% Pax/flight 102 99 100 104 105 105 106 0.9% 1.4%
% change 7.6% -2.8% -1.4% 5.3% 5.3% 0.5% 0.5% RPK (mn) 9,584 10,969 11,292 12,710 11,886 12,768 11,940 10.0% 7.6%
% change 8.4% 14.5% 17.8% 15.9% 5.3% 0.5% 0.5% Capacity
Fleet (total planes) 50 58 57 58 57 58 57
ASK 12,194 14,473 14,511 15,920 14,511 15,920 14,511 9.3% 6.0%
% change 13.6% 18.7% 19.0% 10.0% 0.0% 0.0% 0.0% Total Available Seats 13,088 15,098 15,028 15,098 15,028 15,098 15,028 4.9% 4.7%
% change 10.2% 15.4% 14.8% 0.0% 0.0% 0.0% 0.0% Total Block Hours 148,062 177,034 196,248 177,269 196,484 177,345 196,559 6.2% 9.9%
% change 9.0% 19.6% 32.5% 0.1% 0.1% 0.0% 0.0% Total Sectors Flown 99,486 115,863 116,699 115,863 116,699 115,863 116,699 5.2% 5.5%
% change 6.3% 16.5% 17.3% 0.0% 0.0% 0.0% 0.0% Average Capacity per Flight 132 130 129 130 129 130 129 -0.4% -0.8%
% change 3.9% -1.3% -2.4% 0.0% 0.0% 0.0% 0.0% Average Sector Length
(km) 767 959 966 1,054 966 1,054 966 11.2% 8.0%
% change 4.8% 25.0% 25.9% 10.0% 0.0% 0.0% 0.0% Sales & Cost
RASK 7.5 6.6 7.0 6.3 7.4 6.6 7.6 -3.9% 0.4%
% change -27.4% -12.4% -6.1% -4.2% 5.2% 5.7% 2.4% Passenger Yield 9.5 8.6 9.0 7.9 9.0 8.3 9.2 -4.6% -1.1%
% change -7.6% -9.1% -5.1% -9.1% -0.1% 5.2% 1.9% CASK (EBITDAR level EUR-
cents) 5.8 5.3 5.5 4.9 5.8 5.2 6.0 -3.9% 1.2%
% change -8.9% -9.5% -5.4% -6.8% 5.6% 5.3% 3.7% CASK (EBITDAR level EUR-
cents) excl. Fuel 3.9 3.8 4.1 3.7 4.4 3.9 4.5 0.2% 4.6%
% change -8.8% -3.1% 5.1% -1.3% 5.7% 5.3% 3.1% Brent Prices 99 53 60 55 70 60 75 -15.5% -9.0%
EUR/USD FX 1.33 1.10 1.10 1.10 1.10 1.10 1.10 -6.1% -6.1%
Source: company data | AFe
Technical Terms Glossary: A) ASK Available Seat Kilometres. Represents the number of seats available for scheduled passengers multiplied by the number of kilometres those seats are flown. B) RPK Revenue Passenger Kilometres; the number of revenue passengers carried multiplied by the distance flown in kilometres. C) RASK Revenue per Available Seat Kilometre. Revenue refers to revenue from passenger traffic (per available seat kilometre). D) Yield Overall yield is calculated as total traffic revenues (passenger and cargo) divided by overall RTK (passenger and cargo). Passenger yield is passenger traffic revenue per RPK, and cargo yield is cargo and mail traffic revenue per cargo and mail RTK.
Alpha Finance Equity Research Aegean Airlines
Please read important disclosures at the end of the report. 5
1H 15 Review
Quarterly results 2Q 14a 1H 14a FY 14a 1Q 15a 2Q 15e 1H 15e 2Q 15a 1H 15a Revenues 254.7 388.6 911.8 138.1 264.1 402.2 265.5 403.6 %change 12.7% 8.5% 7.3% 3.1% 3.7% 3.5% 4.3% 3.9% Cost Of Sales 183.1 298.1 659.5 123.3 189.2 312.5 197.8 321.1 % change 12.8% 7.0% 5.3% 7.2% 3.4% 4.8% 8.0% 7.7% % of Sales 71.9% 76.7% 72.3% 89.3% 71.6% 77.7% 74.5% 79.5% Gross Profit 71.6 90.5 252.3 14.8 74.9 89.7 67.7 82.6 % change 12.5%
% margin 28.1% 23.3% 27.7% 10.7% 28.4% 22.3% 25.5% 20.5%
EBITDAR 58.8 72.7 209.5 6.8 59.8 66.6 60.2 67.0 %change 12.9% 21.1% 15.2% -51.4% 1.7% -8.4% 2.5% -7.9% EBITDAR margin 23.1% 18.7% 23.0% 4.9% 22.6% 16.5% 22.7% 16.6%
Aircraft Lease Cost 22.9 43.4 90.7 20.9 28.7 49.6 26.3 47.2
EBITDA 35.9 29.3 118.8 -14.1 31.1 17.0 33.9 19.7 %change 22.1% 98.6% 30.7% 115.1% -13.3% -42.1% -5.5% -32.6% EBITDA margin 14.1% 7.5% 13.0% -10.2% 11.8% 4.2% 12.8% 4.9%
EBIT 32.9 23.2 106.0 -17.4 28.1 10.7 30.3 12.8 % change 27.2% 186.8% 38.0% 80.5% -14.5% -54.1% -8.0% -44.9% EBIT margin 12.9% 6.0% 11.6% -12.6% 10.6% 2.6% 11.4% 3.2%
Financials 0.0 1.2 11.3 -5.2 0.0 -5.2 -1.0 -6.1 Income from Investments 0.0 0.0 0.0 0.0 0.0 0.0 0.0 0.0
Pre - Tax Profit 32.8 22.0 94.6 -12.3 28.1 15.8 31.2 18.9 % change 22.5% 204.7% 33.6% 13.2% -14.3% -27.9% -4.9% -13.9% Pre-Tax profit margin 12.9% 5.7% 10.4% -8.9% 10.6% 3.9% 11.8% 4.7%
Total Tax 8.5 6.0 14.4 -4.0 8.2 4.2 8.1 4.2 Minorities 0.00 0.00 0.00 0.00 0.00 0.00 0.00 0.00
Net income 24.3 15.9 80.2 -8.3 19.9 11.6 23.1 14.8 %change 20.7% 130.5% 53.0% -0.5% -18.0% -27.2% -4.9% -7.4% Net Profit margin 9.5% 4.1% 8.8% -6.0% 7.5% 2.9% 8.7% 3.7%
Alpha Finance Equity Research Aegean Airlines
Please read important disclosures at the end of the report. 6
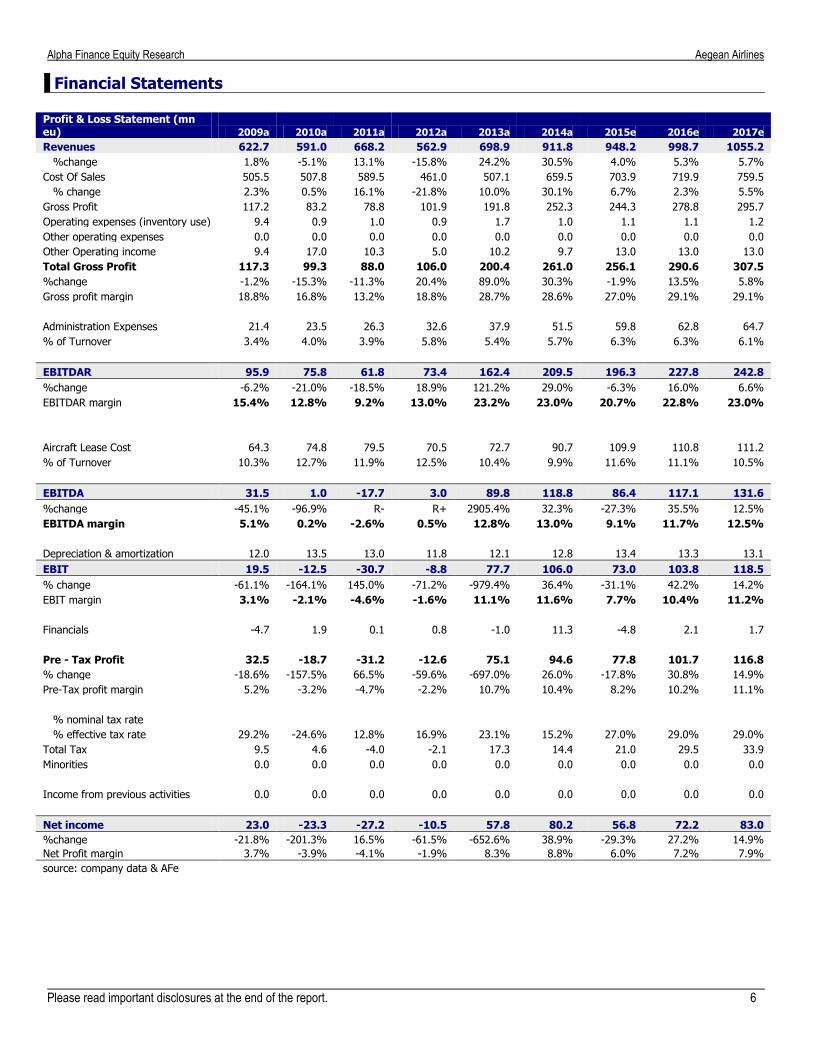
Financial Statements
Profit & Loss Statement (mn eu) 2009a 2010a 2011a 2012a 2013a 2014a 2015e 2016e 2017e
Revenues 622.7 591.0 668.2 562.9 698.9 911.8 948.2 998.7 1055.2
%change 1.8% -5.1% 13.1% -15.8% 24.2% 30.5% 4.0% 5.3% 5.7%
Cost Of Sales 505.5 507.8 589.5 461.0 507.1 659.5 703.9 719.9 759.5
% change 2.3% 0.5% 16.1% -21.8% 10.0% 30.1% 6.7% 2.3% 5.5%
Gross Profit 117.2 83.2 78.8 101.9 191.8 252.3 244.3 278.8 295.7
Operating expenses (inventory use) 9.4 0.9 1.0 0.9 1.7 1.0 1.1 1.1 1.2
Other operating expenses 0.0 0.0 0.0 0.0 0.0 0.0 0.0 0.0 0.0
Other Operating income 9.4 17.0 10.3 5.0 10.2 9.7 13.0 13.0 13.0
Total Gross Profit 117.3 99.3 88.0 106.0 200.4 261.0 256.1 290.6 307.5
%change -1.2% -15.3% -11.3% 20.4% 89.0% 30.3% -1.9% 13.5% 5.8%
Gross profit margin 18.8% 16.8% 13.2% 18.8% 28.7% 28.6% 27.0% 29.1% 29.1%
Administration Expenses 21.4 23.5 26.3 32.6 37.9 51.5 59.8 62.8 64.7
% of Turnover 3.4% 4.0% 3.9% 5.8% 5.4% 5.7% 6.3% 6.3% 6.1%
EBITDAR 95.9 75.8 61.8 73.4 162.4 209.5 196.3 227.8 242.8
%change -6.2% -21.0% -18.5% 18.9% 121.2% 29.0% -6.3% 16.0% 6.6%
EBITDAR margin 15.4% 12.8% 9.2% 13.0% 23.2% 23.0% 20.7% 22.8% 23.0%
Aircraft Lease Cost 64.3 74.8 79.5 70.5 72.7 90.7 109.9 110.8 111.2
% of Turnover 10.3% 12.7% 11.9% 12.5% 10.4% 9.9% 11.6% 11.1% 10.5%
EBITDA 31.5 1.0 -17.7 3.0 89.8 118.8 86.4 117.1 131.6
%change -45.1% -96.9% R- R+ 2905.4% 32.3% -27.3% 35.5% 12.5%
EBITDA margin 5.1% 0.2% -2.6% 0.5% 12.8% 13.0% 9.1% 11.7% 12.5%
Depreciation & amortization 12.0 13.5 13.0 11.8 12.1 12.8 13.4 13.3 13.1
EBIT 19.5 -12.5 -30.7 -8.8 77.7 106.0 73.0 103.8 118.5
% change -61.1% -164.1% 145.0% -71.2% -979.4% 36.4% -31.1% 42.2% 14.2%
EBIT margin 3.1% -2.1% -4.6% -1.6% 11.1% 11.6% 7.7% 10.4% 11.2%
Financials -4.7 1.9 0.1 0.8 -1.0 11.3 -4.8 2.1 1.7
Pre - Tax Profit 32.5 -18.7 -31.2 -12.6 75.1 94.6 77.8 101.7 116.8
% change -18.6% -157.5% 66.5% -59.6% -697.0% 26.0% -17.8% 30.8% 14.9%
Pre-Tax profit margin 5.2% -3.2% -4.7% -2.2% 10.7% 10.4% 8.2% 10.2% 11.1%
% nominal tax rate
% effective tax rate 29.2% -24.6% 12.8% 16.9% 23.1% 15.2% 27.0% 29.0% 29.0%
Total Tax 9.5 4.6 -4.0 -2.1 17.3 14.4 21.0 29.5 33.9
Minorities 0.0 0.0 0.0 0.0 0.0 0.0 0.0 0.0 0.0
Income from previous activities 0.0 0.0 0.0 0.0 0.0 0.0 0.0 0.0 0.0
Net income 23.0 -23.3 -27.2 -10.5 57.8 80.2 56.8 72.2 83.0
%change -21.8% -201.3% 16.5% -61.5% -652.6% 38.9% -29.3% 27.2% 14.9%
Net Profit margin 3.7% -3.9% -4.1% -1.9% 8.3% 8.8% 6.0% 7.2% 7.9%
source: company data & AFe
Alpha Finance Equity Research Aegean Airlines
Please read important disclosures at the end of the report. 7
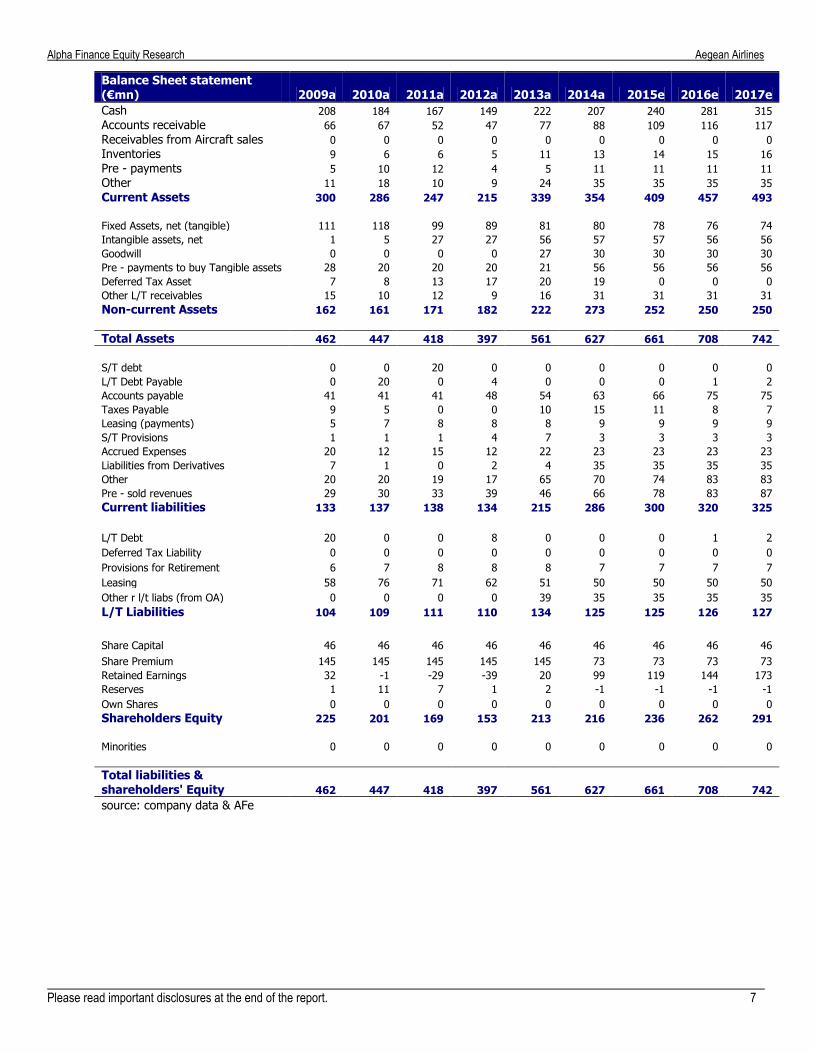
Balance Sheet statement (€mn) 2009a 2010a 2011a 2012a 2013a 2014a 2015e 2016e 2017e
Cash 208 184 167 149 222 207 240 281 315
Accounts receivable 66 67 52 47 77 88 109 116 117
Receivables from Aircraft sales 0 0 0 0 0 0 0 0 0
Inventories 9 6 6 5 11 13 14 15 16
Pre - payments 5 10 12 4 5 11 11 11 11
Other 11 18 10 9 24 35 35 35 35
Current Assets 300 286 247 215 339 354 409 457 493
Fixed Assets, net (tangible) 111 118 99 89 81 80 78 76 74
Intangible assets, net 1 5 27 27 56 57 57 56 56
Goodwill 0 0 0 0 27 30 30 30 30
Pre - payments to buy Tangible assets 28 20 20 20 21 56 56 56 56
Deferred Tax Asset 7 8 13 17 20 19 0 0 0
Other L/T receivables 15 10 12 9 16 31 31 31 31
Non-current Assets 162 161 171 182 222 273 252 250 250
Total Assets 462 447 418 397 561 627 661 708 742
S/T debt 0 0 20 0 0 0 0 0 0
L/T Debt Payable 0 20 0 4 0 0 0 1 2
Accounts payable 41 41 41 48 54 63 66 75 75
Taxes Payable 9 5 0 0 10 15 11 8 7
Leasing (payments) 5 7 8 8 8 9 9 9 9
S/T Provisions 1 1 1 4 7 3 3 3 3
Accrued Expenses 20 12 15 12 22 23 23 23 23
Liabilities from Derivatives 7 1 0 2 4 35 35 35 35
Other 20 20 19 17 65 70 74 83 83
Pre - sold revenues 29 30 33 39 46 66 78 83 87
Current liabilities 133 137 138 134 215 286 300 320 325
L/T Debt 20 0 0 8 0 0 0 1 2
Deferred Tax Liability 0 0 0 0 0 0 0 0 0
Provisions for Retirement 6 7 8 8 8 7 7 7 7
Leasing 58 76 71 62 51 50 50 50 50
Other r l/t liabs (from OA) 0 0 0 0 39 35 35 35 35
L/T Liabilities 104 109 111 110 134 125 125 126 127
Share Capital 46 46 46 46 46 46 46 46 46
Share Premium 145 145 145 145 145 73 73 73 73
Retained Earnings 32 -1 -29 -39 20 99 119 144 173
Reserves 1 11 7 1 2 -1 -1 -1 -1
Own Shares 0 0 0 0 0 0 0 0 0
Shareholders Equity 225 201 169 153 213 216 236 262 291
Minorities 0 0 0 0 0 0 0 0 0
Total liabilities & shareholders' Equity 462 447 418 397 561 627 661 708 742
source: company data & AFe
Alpha Finance Equity Research Aegean Airlines
Please read important disclosures at the end of the report. 8
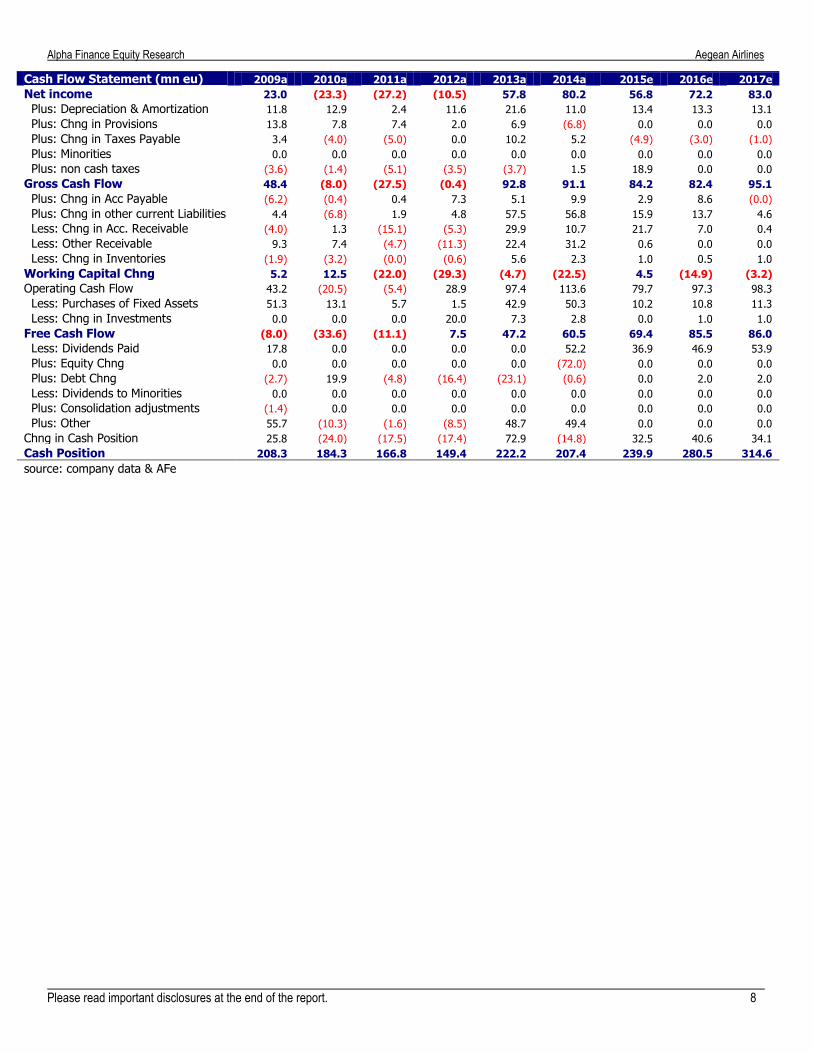
Cash Flow Statement (mn eu) 2009a 2010a 2011a 2012a 2013a 2014a 2015e 2016e 2017e
Net income 23.0 (23.3) (27.2) (10.5) 57.8 80.2 56.8 72.2 83.0
Plus: Depreciation & Amortization 11.8 12.9 2.4 11.6 21.6 11.0 13.4 13.3 13.1
Plus: Chng in Provisions 13.8 7.8 7.4 2.0 6.9 (6.8) 0.0 0.0 0.0
Plus: Chng in Taxes Payable 3.4 (4.0) (5.0) 0.0 10.2 5.2 (4.9) (3.0) (1.0)
Plus: Minorities 0.0 0.0 0.0 0.0 0.0 0.0 0.0 0.0 0.0
Plus: non cash taxes (3.6) (1.4) (5.1) (3.5) (3.7) 1.5 18.9 0.0 0.0
Gross Cash Flow 48.4 (8.0) (27.5) (0.4) 92.8 91.1 84.2 82.4 95.1
Plus: Chng in Acc Payable (6.2) (0.4) 0.4 7.3 5.1 9.9 2.9 8.6 (0.0)
Plus: Chng in other current Liabilities 4.4 (6.8) 1.9 4.8 57.5 56.8 15.9 13.7 4.6
Less: Chng in Acc. Receivable (4.0) 1.3 (15.1) (5.3) 29.9 10.7 21.7 7.0 0.4
Less: Other Receivable 9.3 7.4 (4.7) (11.3) 22.4 31.2 0.6 0.0 0.0
Less: Chng in Inventories (1.9) (3.2) (0.0) (0.6) 5.6 2.3 1.0 0.5 1.0
Working Capital Chng 5.2 12.5 (22.0) (29.3) (4.7) (22.5) 4.5 (14.9) (3.2)
Operating Cash Flow 43.2 (20.5) (5.4) 28.9 97.4 113.6 79.7 97.3 98.3
Less: Purchases of Fixed Assets 51.3 13.1 5.7 1.5 42.9 50.3 10.2 10.8 11.3
Less: Chng in Investments 0.0 0.0 0.0 20.0 7.3 2.8 0.0 1.0 1.0
Free Cash Flow (8.0) (33.6) (11.1) 7.5 47.2 60.5 69.4 85.5 86.0
Less: Dividends Paid 17.8 0.0 0.0 0.0 0.0 52.2 36.9 46.9 53.9
Plus: Equity Chng 0.0 0.0 0.0 0.0 0.0 (72.0) 0.0 0.0 0.0
Plus: Debt Chng (2.7) 19.9 (4.8) (16.4) (23.1) (0.6) 0.0 2.0 2.0
Less: Dividends to Minorities 0.0 0.0 0.0 0.0 0.0 0.0 0.0 0.0 0.0
Plus: Consolidation adjustments (1.4) 0.0 0.0 0.0 0.0 0.0 0.0 0.0 0.0
Plus: Other 55.7 (10.3) (1.6) (8.5) 48.7 49.4 0.0 0.0 0.0
Chng in Cash Position 25.8 (24.0) (17.5) (17.4) 72.9 (14.8) 32.5 40.6 34.1
Cash Position 208.3 184.3 166.8 149.4 222.2 207.4 239.9 280.5 314.6
source: company data & AFe
Alpha Finance Equity Research Aegean Airlines
DISCLOSURE APPENDIX
ALPHA FINANCE INVESTMENT SERVICES S.A. (‘Alpha Finance’) Headquarters: 5, Merlin Street, GR – 106 71 Athens, www.alphafinance.gr T +30-210-367 7400, F +30-210-331 1193, [email protected] Ministry of Development, S.A. Registration Number: 19420/06/B/89/01, G.E.MI.1176701000 Regulated by the Hellenic Capital Market Commission, License No. 42/13.04.1989
Analyst Certification The research analyst(s) undersigned and responsible for the preparation of this report certify (-ies) that a) the views expressed in this report accurately
reflect their (his/her) personal views about any and all of the securities or issuers mentioned in this report and b) no part of the analyst’s compensation
was, is, or will be, directly or indirectly related to the specific recommendations or views expressed in this research report. Analysts receive compensation
based upon various factors, including the quality and accuracy of research, productivity, experience, individual reputation, competitive factors and feedback
from clients.
Company specific regulatory disclosures
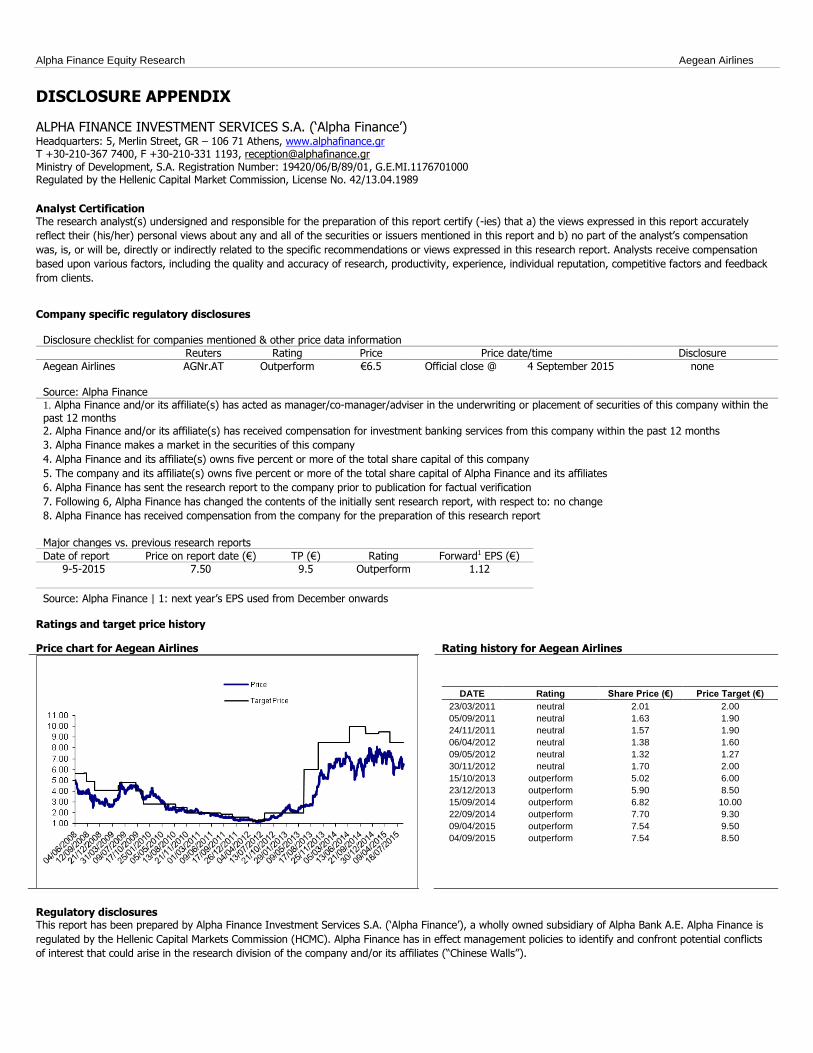
Disclosure checklist for companies mentioned & other price data information
Reuters Rating Price Price date/time Disclosure
Aegean Airlines AGNr.AT Outperform €6.5 Official close @ 4 September 2015 none Source: Alpha Finance 1. Alpha Finance and/or its affiliate(s) has acted as manager/co-manager/adviser in the underwriting or placement of securities of this company within the
past 12 months 2. Alpha Finance and/or its affiliate(s) has received compensation for investment banking services from this company within the past 12 months
3. Alpha Finance makes a market in the securities of this company
4. Alpha Finance and its affiliate(s) owns five percent or more of the total share capital of this company
5. The company and its affiliate(s) owns five percent or more of the total share capital of Alpha Finance and its affiliates
6. Alpha Finance has sent the research report to the company prior to publication for factual verification
7. Following 6, Alpha Finance has changed the contents of the initially sent research report, with respect to: no change
8. Alpha Finance has received compensation from the company for the preparation of this research report
Major changes vs. previous research reports
Date of report Price on report date (€) TP (€) Rating Forward1 EPS (€)
9-5-2015 7.50 9.5 Outperform 1.12
Source: Alpha Finance | 1: next year’s EPS used from December onwards Ratings and target price history
Price chart for Aegean Airlines Rating history for Aegean Airlines
DATE Rating Share Price (€) Price Target (€)
23/03/2011 neutral 2.01 2.00
05/09/2011 neutral 1.63 1.90
24/11/2011 neutral 1.57 1.90
06/04/2012 neutral 1.38 1.60
09/05/2012 neutral 1.32 1.27
30/11/2012 neutral 1.70 2.00
15/10/2013 outperform 5.02 6.00
23/12/2013 outperform 5.90 8.50
15/09/2014 outperform 6.82 10.00
22/09/2014 outperform 7.70 9.30
09/04/2015 outperform 7.54 9.50
04/09/2015 outperform 7.54 8.50
Regulatory disclosures This report has been prepared by Alpha Finance Investment Services S.A. (‘Alpha Finance’), a wholly owned subsidiary of Alpha Bank A.E. Alpha Finance is
regulated by the Hellenic Capital Markets Commission (HCMC). Alpha Finance has in effect management policies to identify and confront potential conflicts
of interest that could arise in the research division of the company and/or its affiliates (“Chinese Walls”).
Alpha Finance Equity Research Aegean Airlines
Valuation method We value Aegean airlines through a DCF models to yield a 2015 target price of €8.5. Our valuation methodology is sensitive to oil, passenger traffic
volatility, macroeconomic conditions and all the risks associated with the airline business. For our DCF model for Aegean airlines we have assumed a
variable WACC rate of c.11.8%, a terminal value of 0.5% and a beta of 1.
Risk rating We rate Aegean as high risk based on the qualitative/quantitative assessment of risk we apply on the company (see definitions of risk below). We consider the following the biggest investment risks for the shares Airline Industry Related: a) Geopolitical concerns, b) seasonality, c) terrorist events, d) sensitivity to tourist traffic, e) any obstacles in the merge with Olympic, f) LCCs intensifying domestic competition, g) domestic competition from non – air transportation, h) airport slot availability. Business Model related: a) Fleet restructure execution risk, b) international expansion to increase fuel usage and maintenance costs, c) progression of load factors in new routes, d) possible overcapacity in international routes, d) EU regulation on greenhouse gas emissions could pose additional costs in the future and e) climate change could negatively affect tourist traffic to Mediterranean destinations. Macroeconomic related: a) Foreign exchange risk, b) increasing oil prices, c) the current economic environment in Greece.
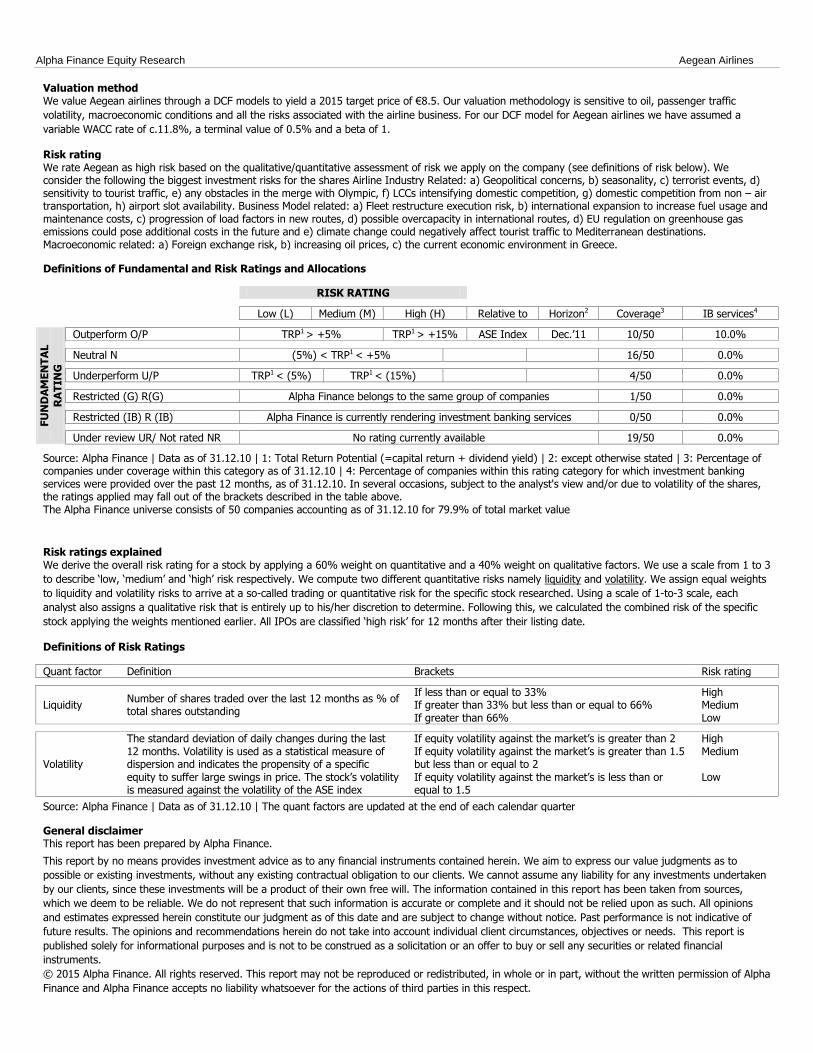
Definitions of Fundamental and Risk Ratings and Allocations
RISK RATING Low (L) Medium (M) High (H) Relative to Horizon2 Coverage3 IB services4
FU
ND
AM
EN
TA
L
RA
TIN
G
Outperform O/P TRP1 > +5% TRP1 > +15% ASE Index Dec.’11 10/50 10.0%
Neutral N (5%) < TRP1 < +5% 16/50 0.0%
Underperform U/P TRP1 < (5%) TRP1 < (15%) 4/50 0.0%
Restricted (G) R(G) Alpha Finance belongs to the same group of companies 1/50 0.0%
Restricted (IB) R (IB) Alpha Finance is currently rendering investment banking services 0/50 0.0%
Under review UR/ Not rated NR No rating currently available 19/50 0.0%
Source: Alpha Finance | Data as of 31.12.10 | 1: Total Return Potential (=capital return + dividend yield) | 2: except otherwise stated | 3: Percentage of companies under coverage within this category as of 31.12.10 | 4: Percentage of companies within this rating category for which investment banking services were provided over the past 12 months, as of 31.12.10. In several occasions, subject to the analyst's view and/or due to volatility of the shares, the ratings applied may fall out of the brackets described in the table above. The Alpha Finance universe consists of 50 companies accounting as of 31.12.10 for 79.9% of total market value
Risk ratings explained We derive the overall risk rating for a stock by applying a 60% weight on quantitative and a 40% weight on qualitative factors. We use a scale from 1 to 3
to describe ‘low, ‘medium’ and ‘high’ risk respectively. We compute two different quantitative risks namely liquidity and volatility. We assign equal weights
to liquidity and volatility risks to arrive at a so-called trading or quantitative risk for the specific stock researched. Using a scale of 1-to-3 scale, each
analyst also assigns a qualitative risk that is entirely up to his/her discretion to determine. Following this, we calculated the combined risk of the specific
stock applying the weights mentioned earlier. All IPOs are classified ‘high risk’ for 12 months after their listing date.
Definitions of Risk Ratings
Quant factor Definition Brackets Risk rating
Liquidity Number of shares traded over the last 12 months as % of total shares outstanding
If less than or equal to 33% High If greater than 33% but less than or equal to 66% Medium If greater than 66% Low
Volatility
The standard deviation of daily changes during the last 12 months. Volatility is used as a statistical measure of dispersion and indicates the propensity of a specific equity to suffer large swings in price. The stock’s volatility is measured against the volatility of the ASE index
If equity volatility against the market’s is greater than 2 High If equity volatility against the market’s is greater than 1.5 but less than or equal to 2
Medium
If equity volatility against the market’s is less than or equal to 1.5
Low
Source: Alpha Finance | Data as of 31.12.10 | The quant factors are updated at the end of each calendar quarter
General disclaimer This report has been prepared by Alpha Finance.
This report by no means provides investment advice as to any financial instruments contained herein. We aim to express our value judgments as to
possible or existing investments, without any existing contractual obligation to our clients. We cannot assume any liability for any investments undertaken
by our clients, since these investments will be a product of their own free will. The information contained in this report has been taken from sources,
which we deem to be reliable. We do not represent that such information is accurate or complete and it should not be relied upon as such. All opinions
and estimates expressed herein constitute our judgment as of this date and are subject to change without notice. Past performance is not indicative of
future results. The opinions and recommendations herein do not take into account individual client circumstances, objectives or needs. This report is
published solely for informational purposes and is not to be construed as a solicitation or an offer to buy or sell any securities or related financial
instruments.
© 2015 Alpha Finance. All rights reserved. This report may not be reproduced or redistributed, in whole or in part, without the written permission of Alpha
Finance and Alpha Finance accepts no liability whatsoever for the actions of third parties in this respect.
Alpha Finance Equity Research Aegean Airlines
Alpha Finance Investment Services S.A.
Member of the AE, CSE 5 Merlin street, 106 71 Athens Greece
T +30-210-367 7400 F +30-210-331 1193 [email protected] www.alphafinance.gr
Equities Research Manousos Stathoudakis, Director Antonis Diapoulis Angelos Chorafas Nikos Katsenos Katia Zahari [email protected] T +30-210-367 7545
Sales & Trading Spyros Malavazos, Director Equities Sales | Foreign Institutions Natasa Martseki, Director Vassilis Galleos Ioannis Batistakis Equities Sales & Trading | Institutions Kostas Tzimos Maria Vryoni Giota Kouli Chris Xikis Derivatives Sales & Trading Lefteris Syrrakos, Director Andreas Markogiannis Angelos Kostis Stavros Tsimpos Equities Trading | Retail Andreas Tzevelekos, Head Maria Saranti
Market Making | Equities & Derivatives Andreas Papanayotopoulos, Director Stelios Tzaras International Markets | Sales & Trading Andreas Papanayotopoulos, Director Giannis Giouremos George Sarris Sofia Giannakou
Equities Sales | Retail Pantelis Tsitos, Director Kostantinos Kostoulas, Deputy Director Leonidas Kyriakopoulos Stavroula Galani Lazaros Koutromanos Kleanthis Schinas