aei.pitt.eduaei.pitt.edu/90332/1/1980-2000_statistics_on... · statistics on audiovisual services,...
TRANSCRIPT
4E U R O P E A NC O M M I S S I O N
THEME 4Industry,tradeand services
Statis
tic
s o
n a
ud
iovis
ual s
ervic
es —
Data 1
980-2
000
eurostat
9 789289 437028
OFFICE FOR OFFICIAL PUBLICATIONS
OF THE EUROPEAN COMMUNITIES
L-2985 Luxembourg
Price (excluding VAT) in Luxembourg: EUR 17.50
17
KS
-BT-0
2-0
01-E
N-C
EN
Statistics
on audiovisual
services
20
02
E
DIT
IO
N
ISBN 92-894-3702-2
Data 1980-2000

EUROPEAN
COMMISSION
Eurostat, Unit D5
DG Education and Culture, Unit C1
ACTHEME 4Indus t r y, t r ade andse rv i ces
Statistics on
Audiovisual services
Data 1980 - 2000
2002EDITION

Statistics on audiovisual services,
1980 - 2000
Cinema, radio and television are entering a new era.Digital technology is reshaping broadcasting, pro-gramming, production, delivery and payment systemsand has an impact on cultural issues worldwide.
The EU is playing a leading role in addressing theseissues and promoting the European audiovisual sector,with the primary aims of:
� Pursuing key public interest objectives in such areasas cultural and linguistic diversity, pluralism, the freecirculation of audio-visual services, protection of copy-right, the protection of minors, publicity and the rightof reply.
� Encouraging the distribution of European works, thecapacity for innovation and the competitiveness of theindustry as a whole.
This is done through regulatory measures, in particu-lar the Television without Frontiers directive and therecommendation on the protection of minors, orthrough funding, in particular with the Media Plus pro-gramme.
The audiovisual sector directly employs about half amillion people in the European Union. In addition toits economic importance, it also plays a key social andcultural role: television is the most important source ofinformation and entertainment in European societies,with 97% of homes having a television, and the aver-age European watching 204 minutes television perday.
Comprehensive statistical data are needed in order tomonitor developments in this complex and rapidlychanging sector. To meet the needs for statistical data,a Council Decision (1999/297/EC) on audiovisualstatistics was adopted on 26 April 1999 aiming toestablish a Community statistical information infras-tructure relating to the industry and markets of theaudio-visual and related sectors.
Over the past few years, Eurostat, the Statistical Officeof the European Communities, has been developing astatistical information system on Audiovisual Services,called AUVIS (i.e. AUdioVisual Information System).
A I
Preface
The system is based on the AUVIS overall method-ological manual currently developed in co-operationwith the EU and EFTA Member States, and is used forcollecting and disseminating existing statistics. TheAUVIS system aims to include quantitative and quali-tative information on 13 AUVIS market segments suchas Audiovisual Services (business statistics), audiovisu-al production, audiovisual distribution, cinema exhibi-tion, video, television, sound recordings, video games,radio, cable and satellite and radio- and TV-signaltransmission.
Developing statistics on the Audiovisual sector requiresexpertise in several fields and takes considerable time.In 2000 and 2001, AUVIS data collection was extend-ed and an AUVIS section has been progressively inte-grated into Eurostat’s reference database "NewCronos" covering 10 of the 13 of the AUVISmarket/sections and 22 countries.
This new publication " Statistics on audiovisual
services, 1980 - 2000 ", is based on the datacollected via the AUVIS questionnaire from MemberStates (the results of the 2001 enquiry have been takeninto consideration) and is divided into 9 main parts,which cover the following aspects:
� audiovisual services and advertising, � audiovisual production and distribution, � cinema exhibition, � video and DVD, � television, � cable and satellite, � sound recordings, � radio and� video games,
It also includes general information on other domains(including basic indicators and information technolo-gies). The publication covers 20 countries (i.e. 15 EUcountries, Iceland, Norway, Switzerland, United Statesand Japan). The aim of this publication is to provide astatistical overview of the audiovisual sector based onthe statistical work carried out at Eurostat in co-oper-ation with 15 EU and 3 EFTA countries and some sec-toral organisations.

AII
This publication was prepared underthe responsibility of:
Douglas Koszerek,
Acting Head of Unit D5 “Information Society andTourism Statistics” - Eurostat
Publication Editors:
Richard Deiss, Eurostat
Andreas Dollt, Eurostat
Consultants:
Peter Lindmark, Anite
Roland Erixon, Anite
Zuzana Fabianova, Anite
For further information please contact Eurostat:
Andreas Dollt, Eurostat
Tel: (352) 4301 - 33286
Fax (352) 4301 - 34359
Peter Lindmark, Anite
Tel: (352) 091 15 63 88
The opinions expressed are those of the individualauthors alone and do not necessarily reflect theposition of the European Commission.

TABLE OF CONTENTS
A III


A 3
Thanks are due to these organisations and sources thatprovided or published information on various topics:
The OECD, Unesco, the European AudiovisualObservatory, Media Salles, the European BroadcastingUnion, the International Video Federation, ScreenDigest, the International Federation of thePhonographic Industry, the Motion Picture Associationof America, the US Bureau of Labour Statistics, theMotion Picture Producers Association of Japan,McCann Erickson, Dentsu Inc., International RecordingMedia Association, Adams Media Research, NielsenMedia Research, Video Software Dealers Association,International Trade Administration of US, JapaneseRegional Broadcasting Division at the Ministry, JapanBroadcasting Corporation, SES/ASTRA, EconomistIntelligence Unit, Trade Administration of the USDepartment of Commerce, McGraw-Hill Companies,International Telecommunication Union, Oliver &Ohlbaum, the European Leisure Software PublishersAssociation (ELSPA), Deutsche Bank, Interactive DigitalSoftware Association (IDSA), NPDFunworld, VUD/GfK,Gartner Dataquest and the following Internet based ser-vices: boxofficemojo.com, surfmusic.de, real.com, web-radio.fm and ituner.com.
The EU as a whole, the euro-zone, the EU MemberStates, three EFTA countries, the United States andJapan are covered in nine main chapters.
Throughout the publication, data with monetary valuesare expressed in euro.
The data presented cover the following aspects: enter-prise-related economic data, structural information onmarkets, international trade, supply side data, prices,service quality, demand structure, technical infrastruc-ture and basic information from other domains.
Methodological work to harmonise statistics is currentlyundertaken by Eurostat in co-operation with NationalStatistical Institutes. Nevertheless in view of the fact thatthe methods and concepts used by primary sources tocollect the data are different, care should be takenwhen attempting to make comparisons. The informationpresented, especially methodological footnotes, helpsto show discrepancies in data availability and compa-rability among Member States.
Introduction
Introduction
Following the general structure of previous publications,and taking into account the development of the AUVISmethodological framework and also improvements ofdata collection coverage and reporting, this new editionof statistical tables on the audiovisual sector aims togive a coherent coverage of the statistical informationavailable in the EU and EFTA countries and also for theUnited States and Japan.
In this publication, the tables and graphs show data inthe audiovisual field during the last two decades: from1980 to 2000 and, in some cases, the year 2001. Newthis year is a chapter on video games.
The basis of this publication is the annual data collec-tion of Eurostat, the AUVIS questionnaire, where nation-al statistical offices are asked to fill in their nationaldata.
The principal statistics are loaded into New Cronos,from where the main portion of data in this publicationare extracted. Where there are no footnotes, data comefrom New Cronos.
The following main markets are covered:
1. Audiovisual services and advertising
2. Cinema production and distribution market
3. Cinema exhibition market
4. Video and DVD market
5. Television market
6. Cable operating market and satellite market
7. Sound recordings market
8. Radio market
9. Video games market
Eurostat gratefully acknowledges the valuable contribu-tions of all national institutes and other professionalbodies. This comprehensive reference document onaudiovisual services for the EU and EFTA MemberStates, United States and Japan would not have beenpossible without their data collection and analysis, andcontinuous advice.
A special effort was made to fill in data gaps by usingother sources. These sources are published next to thetable or graph. Eurostat gave priority to national officialsources (mainly National Statistical Institutes and min-istries or governmental bodies, often in close co-opera-tion with other public bodies).


Overview


A 7
82.4
73.3
66.2
57.0
55.9
54.7
52.5
49.0
44.3
41.9
39.8
34.0
31.2
29.8
25.4
22.3
9.4
0 20 40 60 80 100
Video games
TV market
Sound recording sales
TV broadcasting
Audiovisual services
Video sales
Cinema gross box office
Radio market (commercial + public)
TV advertising
Films
Video sales and rental
DVD sales
Subscription of cable & satellite
DVD sales and rental
Video rental
Commercial radio turnover
DVD rental
[%]
88.5
137.5
96.1
173.1
020406080
100120140160180200
EU-15 US
1999 2000[bn EUR]
Growth: 8.6%
Growth: 25.8% (in EUR)8.9% (in USD)
Turnover fromaudiovisual sector
Americans spend more thanEuropeans on audiovisual services
In 2000, EU citizens spent 96.1 billion euroor 255 euro per capita on audiovisual ser-vices, which include: films, TV and radiobroadcasting, music and video games. Thisis a growth of 8.6% compared to 1999.
Excluding radio broadcasting and videogames, the UK spends most in the EU onfilms, TV broadcasting and music: 21.6 bil-lion euro or 362 euro per capita. Germanyand France follow with a turnover of 16.9and 12.0 billion euro respectively. Theirturnover per capita (205 and 202 euro) isclose to the EU average (210 euro).Denmark spends a relatively high amount percapita: 305 euro, followed by Ireland (247euro) and Austria (225 euro). On the otherend of the scale are Portugal and Greecewith 78 and 87 euro per capita respectively.
The US, however, spent more on audiovisualservices: 173.1 billion euro or 632 euro percapita. Measured in USD, this is a growth of8.9% compared to 1999.
There is only one sector where the EU marketis larger than the US: Public TV, mainlybecause of the low public funding of TVbroadcasting in the US. All other sectors aresmaller in the EU. The video games market inthe EU is closest to that of the US: 82% of theUS turnover. The TV market, including adver-tising and public TV follows next with 73%and the music market with 66%. The largestdifference between the EU and the US isfound in the DVD rental market, where theEU turnover only amounts to 9% of USturnover. Commercial radio (22%) and videorental (25%) are also relatively small in theEU.
TV broadcasting is the audiovisual mediumthat takes the largest portion of the turnover:60% in the EU and 58% in the US.
The tables on the next page show data inmore detail.
Overview: Turnover from audiovisual sector
0% 20% 40% 60% 80% 100%
US
EU
Films TV broadcasting Radio Music Video games
Source: see table on page 8

A8
Overview: Turnover from audiovisual sector
Turnover from audiovisual services in the EU-15 and the
United States, million EUR
1999 2000 Growth (%)Share of AV
services in 2000 (%)
Audiovisual services 88 483.6 96 064.3 8.6 100
Films 10 338.0 12 284.9 18.8 12.8Cinema gross box office 4 270.8 4 420.0 3.5 4.6Video 5 677.2 6 475.1 14.1 6.7
Video sales 3 741.9 4 376.2 17.0 4.6Video rental 1 935.2 2 098.9 8.5 2.2
DVD 390.1 1 389.8 256.2 1.4DVD sales 376.6 1 313.7 248.9 1.4DVD rental 13.5 76.1 461.5 0.1
TV broadcasting 53 035.8 57 294.7 8.0 59.6TV market 41 954.6 45 159.3 7.6 47.0
TV advertising 23 720.5 26 763.5 12.8 27.9Public TV 18 234.1 18 395.8 0.9 19.1 TV licence fees 14 351.0 15 249.8 6.3 15.9
Subscription of cable & satellite 11 081.1 12 135.4 9.5 12.6Radio market 8 927.1 9 800.0 9.8 10.2
Public radio turnover 5 031.8 5 347.0 6.3 5.6Commercial radio turnover 3 895.3 4 453.0 14.3 4.6
Sound recording sales 9 732.7 10 084.7 3.6 10.5Video games 6 450.0 6 600.0 2.3 6.9
Consoles 1 350.0 1 400.0 3.7 1.5Software 5 100.0 5 200.0 2.0 5.4
EU-15
Audiovisual services equals the sum of films, TV broadcasting, radio, sound recording and video games.Films equals the sum of cinema gross box office, video sales, video rental, DVD sales and DVD rental.TV Broadcasting equals TV market and subscription of cable and satellite.TV market equals TV advertising, TV licence fees, TV subsidies.Public TV equals the sum of TV licence fees and TV subsidies.Video games equals the sum of sales of consoles, video game software (CD/DVD) and cartridges.Data published in basic tables later in this publication with indication of other sources.
Source: Eurostat, AUVIS domain, for more details please look into each relevant chapter of this publication
1999 2000 Growth (%)Share of AV
services in 2000 (%)
Audiovisual services 137 518.4 173 131.1 25.9 100
Films 23 692.0 29 352.0 23.9 17.0Cinema gross box office 6 988.3 8 412.5 20.4 4.9Video 15 020.9 16 270.1 8.3 9.4
Video sales 7 252.9 8 004.9 10.4 4.6Video rental 7 768.0 8 265.2 6.4 4.8
DVD 1 682.8 4 669.4 177.5 2.7DVD sales 1 579.6 3 859.2 144.3 2.2DVD rental 103.2 810.3 685.0 0.5
TV broadcasting 77 523.5 100 556.7 29.7 58.1TV market 48 906.0 61 616.9 26.0 35.6
TV advertising 47 705.0 60 394.6 26.6 34.9Public TV 1 201.0 1 222.3 1.8 0.7 TV licence fees na na na na
Subscription of cable & satellite 28 617.5 38 939.8 36.1 22.5Radio market 15 885.1 19 979.7 25.8 11.5
Public radio turnover na na na naCommercial radio turnover 15 885.1 19 979.7 25.8 11.5
Sound recording sales 13 371.8 15 230.9 13.9 8.8Video games 7 046.0 8 011.8 13.7 4.6
Consoles 1 322.5 1 503.8 13.7 0.9Software 5 723.5 6 508.0 13.7 3.8
USA

A 9
Overview: Turnover from audiovisual sector
Film exhibition is a relatively important audio-visual sector in the EU, accounting for 12.8%of the audiovisual turnover and growing 19%from 1999. Turnover from cinema gross boxoffice accounts for 36% of the total film exhi-bition turnover. Video sales is also an impor-tant source of film revenues with 35% of theturnover. Video rental takes another 17%.DVD sales, the technology still being in itsintroduction phase, account for 11% in 2000compared to 4% in 1999. Finally, DVD rentaltakes up just 0.6% of the film exhibitionturnover. The DVD share is expected toincrease in the future.
DVD sales accounted for 13% of the film exhi-bition market in 2000 in United States, main-ly due to its earlier breakthrough into this mar-ket.
The TV broadcasting market is the largestaudiovisual sector, growing 8% during 2000in the EU. The most important component ofTV broadcasting turnover is the income fromTV advertising, which is also the most impor-tant component for growth. TV advertisinggrew 13% in the EU during 2000. The publicTV market in the EU amounts to 18.4 billioneuro, of which 15.2 billion euro stems fromlicence fees. Public funding is an importantrevenue source in the EU, especially in theScandinavian countries and Austria. The EUaverage of public funding as a revenue sourcewas 30%. The amount from licence feesincreased by 6.3% compared to 1999, whilethe public TV market as a whole just grew0.9% in 2000. Subscription fees from cableand satellite grew 9.5% in 2000, accountingfor 21% of the TV broadcasting market.
Advertising is also the most important compo-nent in the US, accounting for 61% of the TVbroadcasting market and growing 27% during2000. Nearly 40% of the American TV broad-casting turnover came from cable and satellitein 2000.
The connection of TV households to cable net-works and satellites kept increasing during thenineties. In 1990, 18% of the TV householdsin the EU watched cable TV. In 2000 the sharehad increased to 31%. In 2000, about 19% ofthe TV households in the EU were watchingsatellite TV, compared to 14% in 1995. Half ofTV households in the EU have to rely on theterrestrial TV signals.
0% 20% 40% 60% 80% 100%
US
EU
Satellite Cable Terrestrial
0% 20% 40% 60% 80% 100%
US
EU
Advertising Public funding Cable & satellite
0% 20% 40% 60% 80% 100%
US
EU
Cinema Video sales Video rental DVD sales DVD rental
Source: see table on page 8

A10
Overview: Use of audiovisual media
Average time spent per day onentertainment in 2000, minutes
TV Radio Cinemaviewing listening going
EU-15 204 162 a) 0.74 e)
B 193 0.76 e)
DK 151 192 0.66 e)D 203 209 0.61 e)
EL 236 0.42 e)
E 210 95 1.13 e)F 196 161 a) 0.92 e)
IRL 181 290 d) 1.30 e)
I 239 169 b) 0.59 e)L 124 a) 1.03 e)
NL 156 176 0.45 e)
A 144 184 d) 0.66 e)P 202 a) 192 0.62 e)
FIN 171 201 0.45 e)
S 150 174 0.63 e)UK 221 177 a) 0.79 e)
IS 147 204 1.85 e)N 138 144 c) 0.85 e)
CH : 164 b) 0.72 e)
US 455 1.70 e)JP 214 c) 0.35 e)
a) 1999 b) 1998 c) 1997 d) 1996e) Cinema estimated by the assumption of 120 minutes average length peradmission
Source: Eurostat, AUVIS domain, for more details please look into each rele-vant chapter of this publication
Use of audiovisualmediaAverage daily time spent on entertainment is not reg-ularly measured in the EU. Several countriesannounce that they soon will publish data on timeuse.
EU citizens spend about 204 minutes per day watch-ing TV and 162 minutes listening to the radio. TheAmericans spend longer time in front of their TV: 455minutes. The average Japanese spends slightly moretime than the European: 215 minutes.
Among the EU countries, Italian and Greeks staylongest in front of their TV: 239 and 236 minutes.The Irish spend 109 more minutes listening to theradio. Other countries where radio listening is morepopular than watching TV: Iceland, Denmark,Austria, Finland, Sweden and the Netherlands.
27% of the French (population over 15 years old) listento the music (CDs, MCs) every day and 40% at least treeor four times a week.
According to a Japanese survey on Time Use and LeisureActivities, (1996, age over 15), the average Japanesespends 6 hours and 9 minutes on leisure and 7 hoursand 44 minutes sleeping. Rest and relaxation accountsfor 1 hour and 15 minutes. Watching TV, listening toradio, reading newspaper or magazines account for 2hours and 34 minutes. Hobbies and amusement: 35minutes. Finally, sports: 11 minutes.
The two graphs below show that, for the average person,TV viewing is a daily reality, while cinema-going is a rareevent happening once or twice per year.
239 236 221 210 203 202 196 193 181 171
156 151 150 147 144 138 124
204
455
214
0
50
100
150
200
250
300
350
400
450
500
I EL UK E D P
99
F B IRL FIN NL DK S IS A N L
99
EU-
15
US JP
97
675
473
412 375
336 310
287 276 261 241 241 230 226 223 215
165 163 154
269
622
129
0
100
200
300
400
500
600
700
IS IRL E L F N UK B CH A DK S P D I FIN NL EL EU-
15
US JP

A 11
Cinema Sound
EU-15 2.2 0.8 2.6 2.0 6.7 0.1 8.0 0.1 4.2 2.7 2.0 7.5EUR-12 2.2 0.6 2.1 1.7 6.3 0.1 6.8 0.1 3.6 2.2 1.7 6.3B 2.3 0.6 2.0 2.3 7.4 0.2 13.5 0.2 9.9 3.5 2.7 9.4DK 2.0 1.2 2.7 3.8 8.3 0.2 12.9 0.1 6.4 3.8 3.5 9.1D 1.9 0.4 1.4 1.9 b) 6.6 b) 0.1 7.5 0.1 4.7 3.2 2.3 6.6EL 1.3 0.0 a) : a) 0.9 a) 6.6 a) : : 0.0 : 0.9 0.7 12.1E 3.4 0.4 1.5 2.3 9.9 0.1 8.3 : : 1.8 1.5 9.3F 2.8 0.9 3.1 1.1 3.8 0.2 10.5 0.0 2.0 2.5 1.8 5.4IRL 3.9 0.7 a) : a) 7.4 a) 31.9 a) : : 0.1 : 2.9 2.1 6.1I 1.8 0.7 a) : a) 0.8 3.3 0.1 9.9 : : 0.8 0.6 3.7L 3.1 : : 1.3 b) 5.0 b) : : : : : : :NL 1.4 0.6 1.8 2.3 7.1 0.1 9.0 0.2 14.2 2.5 2.1 5.4A 2.0 0.5 a) : a) 1.1 a) 3.6 a) : : 0.1 : 2.9 2.4 9.4P 1.9 0.8 : 0.7 a) 3.6 b) 0.1 : 0.0 : 1.7 1.2 6.1FIN 1.4 0.7 2.2 1.7 5.4 0.1 11.1 0.1 5.8 2.5 2.3 11.6S 1.9 0.7 1.9 2.0 5.2 0.1 10.7 0.1 5.9 3.3 2.6 8.3UK 2.4 1.6 4.4 3.1 8.5 0.3 12.3 0.1 5.9 4.7 3.4 13.1IS 5.6 0.7 2.2 10.5 a) 35.1 a) 0.2 7.7 0.2 5.8 2.9 2.8 10.8N 2.6 0.7 1.9 4.0 11.3 0.1 7.8 0.1 3.7 3.5 3.2 12.1EEA 2.2 0.8 2.6 2.0 6.8 0.1 8.0 0.1 4.2 2.7 2.0 7.5CH 2.2 0.5 a) 2.2 a) 0.9 a) 3.4 b) : : : : 3.6 3.0 14.5US 5.2 2.6 8.0 12.1 37.7 0.6 11.1 0.8 15.7 3.9 3.4 10.0JP 1.1 0.3 b) 1.3 b) 6.7 b) 25.3 c) : : : : 3.3 2.2 10.6
CDsDVD discsVideos
0 5 10 15 20 25 30
JP
US
EU-15
IS
IRL
UK
DK
N
B
S
EEA
E
F
D
CH
NL
A
FIN
P
L
I
ELCinemaadmissions
Videos sold
Videos rented
DVDs sold
DVDs rented
CDs bought
Other soundrecordings bought
The average EU citizen goes to the cinema abouttwice per year. This is much less than the averageAmerican, who goes to the cinema more than 5times per year. The average Japanese only watch-es films at cinema once per year.
The average EU citizen owning a VCR buys 2.6video films per year and rents videos 6.7 times peryear. This varies of course, country by country. InIreland the average VCR household rents a film 32times per year, while in Italy just 3 times per year.
The average American VCR owner buys 8 filmsand rents a film on video 41 times per year. Theaverage Japanese bought less than one film onvideo per year. While video films were rented 25times per year per VCR household in Japan.
The few households that so far have bought aDVD player (4.4% of the households in the EU)bought on average 8 DVD discs and rented 4.2DVD discs in 2000. The average American DVDplayer household (13.7% of all households)bought 11 DVD discs and rented 16.
Sound recording sales in the EU and Japanamounted to 3 units per capita in 2000 comparedto 4 units in the US. The average CD playerhousehold bought 7.5 CDs in the EU and 10 CDsin the US.
Overview: use of audiovisual media
Use of audiovisual media, 2000, number of times per year
Source: Eurostat, AUVIS domain, for more details please look into each relevant chapter of this publication a) 1999 b) 1998 c) 1997 d) 1996
L: Data only for cinema admission and video rental available


1. Audiovisual services and advertising


A 15
Overview on structural data for
audiovisual services
In Structural Business Statistics (SBS) audiovi-sual services covered by the NACE Division 92do not include some audiovisual market activ-ities such as, video retail sales and rentalactivities, sound recording retailing activities,cable and satellite transmission of TV andradio signals activities. Concerning audiovisu-al services, data are only available on a 3-digit NACE level. Motion picture and videoproduction, distribution and exhibition activi-ties are grouped together under the NACEgroup 92.1. Radio and television activities areincluded in the NACE group 92.2.
Data on the number of enterprises, on per-sons employed and on the turnover are cur-rently not available for all EU countries. Dueto incomplete data at national level, figuresfor EU 15 can only be estimated. The follow-ing estimates relate to the year 1999 andshould be seen as orders of magnitude.
In 1999, there were about 51 500 enterprisesin the sector, of which about 40 000 in NACE92.1 (Motion picture and video activities) and11 500 in NACE 92.2 (Radio and televisionactivities). About 490 000 persons wereemployed, of which 200 000 in motion pic-ture and video activities and 290 000 in radioand television activities. There were on aver-age about 10 persons employed per enter-prise. In 1999 turnover amounted to about88.5 billion euro, of which for NACE 92.136.5 billion euro and for NACE 92.2 52 bil-lion euro, or 180 000 euro per personemployed.
Motion picture and video services turnover(NACE 92.1) was highest in Germany with 9.5billion euro in 1999, followed by France with7.8 billion euro (1999) and Italy with 6.8 bil-lion ECU (1998).
Radio and television has the largest turnovershare of NACE 92 in the UK (77%), Finland(75%) and Spain (63%).
UK had the highest employment in the motionpicture and video services sector with 47 800in 1998, which fell to 41 800 in 1999, fol-lowed by France with 45 100 in 1998 andGermany with 35 000 in 2000.
45.1 41.8
35.0
6.0 4.7 4.1 3.1 2.1 2.0 0.3
19.3 20.6
0.0 5.0
10.0 15.0 20.0 25.0 30.0 35.0 40.0 45.0 50.0
F98
UK99
D00
I 98
E 97
S 99
DK99
P 99
B 00
EL95
FIN99
L 98
[thousand]
1. Audiovisual services and advertising
75 75 63 60 56
47 45 43 35
6 3 8 9
11
7 8
12
7 12 14 12 11
14 15 19
12 10 14 19 22 32
49 35 33
3 4
0
10
20
30
40
50
60
70
80
90
100
FIN99
UK98
E97
S98
B00
F99
I98
D99
DK99
Motion picture andvideo production(NACE 92.11)
Motion picture andvideo distribution(NACE 92.12)
Motion pictureprojection (NACE 92.13)
Radio and television(NACE 92.2)[%]
9.5
7.86.8
5.3
2.0
0.8 0.7 0.4 0.4 0.2 0.1 0.10123456789
10
D 99
F 99
I 98
UK99
E 97
S 98
B 00
DK99
P 99
FIN99
EL95
L 96
[bn ECU/EUR]
Source: see tables on the following pages

Overview on advertising
Advertising is an important part of moderneconomies. For most mass media, advertising isa major source of income. Since 1990 adver-tising expenditure in the EU has increased by116%. In 2000, 98 billion euro, 260 euro percapita, or 1.1% of GDP, was spent on advertis-ing in the EU.
The advertising market is, however, much larg-er in the United States: 253 billion euro in2000 (an increase of 148% since 1990). Theexceptional growth in advertising in the UnitedStates during 2000 was influenced by the elec-tions, the Olympics, the census, special millen-nium-year events and heavy introductory adver-tising in traditional media by many newdot.com marketers. However, in 2001, with aeconomic slowdown in the third quarter and the‘11th of September 2001’ events, the USadvertising suffered its worst advertising spend-ing decline (-4.1% in USD, -1.1% in euro) sinceWorld War II.
According to the McCann Erickson 2000 reporton American advertising expenditure, 24% wasspent on TV, 21% on newspapers, 5% on mag-azines, 19% on direct mail, 8% on radio, theInternet 1.4% and 21% on other media. Theshare of advertising expenditure on Internetincreased from 0.3% in 1997 to 1.4% in 2000.
In Japan, 61 billion euro was spent on adver-tising in 2000. According to the Dentsu 2000report on advertising expenditure in Japan,34% was spent on TV, 3.4% on radio, 5.8% oncinema, 1.0% on the Internet and 55.8% onother media.
Worldwide advertising in 2001 is estimated to alevel of 509 billion euro, according to McCannErickson, an increase of 1.4% in euro, but adecrease of 1.7% if measured in USD.
In 2000 in the EU 27.3% was spent on TV,4.5% on radio, 0.7% on cinema and 67.4% onother media. In the EU, the highest advertisingoutlays were spent in the United Kingdom with27.9 billion euro in 2000, of which 7.6 billioneuro TV advertising. Second was Germany with23.3 billion euro in 2000, of which 4.7 billioneuro TV advertising. Third was France with 12billion euro in 2000, of which 3.8 billion euroTV advertising.
A16
1. Audiovisual services and advertising
7062 62 62 68 68 67
55 5 5
4 4 5
2532 32 33 27 27 27
0
10
20
30
40
50
60
70
80
90
100
90 95 96 97 98 99 00
TV
Radio
Cinema
Othermedia
[%]
23.3
12.0
8.5
5.0 4.7 4.32.7 1.8 1.5 1.2 1.1 0.7 0.6
27.9
0
5
10
15
20
25
30
UK00
D 00
F 00
I 00
E99
NL99
S 99
DK00
B 00
EL99
A97
FIN00
P 00
IRL99
[bn ECU/EUR]
165180
202
253
38
138
125102
12498
8782645654
45 6147394442440
50
100
150
200
250
300
80 85 90 95 96 97 98 99 00
USEU-15JP
[bn ECU/EUR]
Source: see tables on the following pages

Source: Eurostat, AUVIS domaina) Eurostat estimateb) Registered enterprises paying VAT by end-of-yearc) Source : Survey on Audiovisual Services 1997. INEd) Source: ISTAT
e) Source: Statistics Finland, Business registerf) Source: Statistics Sweden, Business registerg) Source: ONS Annual business Inquiry.h) Registered enterprises by end-of-year. Source: SI
A
a)a)
b) : : : : : 2 174 2 245 2 285 2 327: : : 966 : 1 101 1 143 1 226 : : : : : 7 117 7 151 7 370 7 439 :
: : : 316 : : : : :: : : : : 3 427 c) : : :: : 3 166 5 011 5 404 5 505 5 888 6 464 :: : : : : : : : :: : : 3 447 3 559 3 489 3 872 d) : :: 19 55 : 108 124 125 133 121: : : : : : : : :: : : : : : : : :: : 532 657 : : 720 681 :: : : 489 498 537 e) 572 e) 548 e) :
559 1 031 1 731 1 538 1 689 1 899 f) 2 001 f) 2 029 f) :: : : : : 3 650 g) 4 408 g) 5 171 4 490: : : : 154 111 h) 216 h) 195 h) 206: : : : : : : : :
: : : 591 : : : : :: : : : : : : : :: : : : : : : : :
1. Audiovisual services and advertising
1.1 Number of motion picture and video services enterprises (NACE 92.1)
h)h)
a) 1 774 1 893 1 936 1 995 223 182 181 171 177 170 168 161 883 943 1 033 : 73 59 59 : 145 143 134 : 4 066 4 405 4 626 : 2 017 1 876 1 737 : 1 068 1 089 1 076 : : : : : : : : : : : : :b) 2 096 : : : 573 : : : 759 : : : 4 192 4 500 4 965 : 694 706 753 : 619 682 746 : : : : : : : : : : : : :c) 2 196 2 510 : : 361 362 : : 932 1 000 : : 105 108 116 102 11 10 9 11 8 7 8 8 : : : : : : : : : : : : : : : : : : : : : : : : : : : : : : : : : : : :d) 435 460 444 : 22 28 23 : 80 84 81 :e) 1 614 1 706 1 742 : 110 121 118 : 175 174 169 :f) 3 056 3 790 3 460 3 900 409 429 380 425 185 189 165 165g) 90 196 177 187 7 6 7 8 14 14 11 11
: : : : : : : : : : : :: : : : : : : : : : : :: : : : : : : : : : : :: : : : : : : : : : : :: : : : : : : : : : : :
1.2 Number of motion picture and video services enterprises
Source: Eurostat, AUVIS domaina) Registered enterprises paying VAT by end-of-yearb) Source : Survey on Audiovisual Services 1997. INEc) Source: ISTAT
d) Source: Statistics Finland, Business registere) Source: Statistics Sweden, Business registerf) Source: ONS Annual business Inquiry.g) Registered enterprises by end-of-year. Source: SI h) Eurostat estimate
17

Source: Eurostat, AUVIS domain a) Eurostat estimate b) Number of employees, mid-year, Source: Social Security Office c) Source : Survey on AudiovisualServices 1997. INE d) Source: ISTAT e) Source: Statistics Finland, Business register f) Source Statistics Sweden, Business register g) Source : Labourforce Survey, March each year. Includes those who work in the industries in their main job, and those who work in the industries in their second job if their main job isnot in the relevant industry. h) No. of employees /no. of man-years. Source: NEI i) Source: the Motion Picture Association of America, Bureau of LabourStatistics, US Motion picture industry employment, excluding video tape rental (NACE 71.40) and unspecified “other”.
Source: Eurostat, AUVIS domaina) Eurostat estimateb) Registered enterprises paying VAT by end-of-yearc) Source : Survey on Audiovisual Services 1997. INEd) Source: ISTAT
e) Source: Statistics Finland, Business registerf) Source: Statistics Sweden, Business registerg) Source: ONS Annual business Inquiry.h) Registered enterprises by end-of-year. Source: SI
a)a)
: : : : : 373 b) 598 b) 613 b) 618 b)
: : : 189 : 218 244 257 : : : : : 522 569 646 676 :
: : : 604 : : : : :: : : : : 1 108 c) : : :: : 789 : : 732 734 : :: : : : : : : : :: : : 2 630 2 857 2 621 2 566 d) : :: 5 17 : 24 34 35 38 38: : : : : : : : :: : : : : : : : :
3 3 316 330 330 330 312 417 :: : : 132 135 146 e) 163 e) 167 e) :
17 17 54 296 362 435 f) 475 f) 508 f) :: : : : : 2 303 g) 2 715 g) 2 700 g) 3 055: : : : 23 26 h) 38 h) 29 h) 30: : : : : : : : :
: : : 86 : : : : :: : : : : : : : :
149 173 197 249 292 : : : :
1. Audiovisual services and advertising
1.3 Radio and television services enterprises (NACE 92.2)
18
a)a)
b) : : : : : 3 3 3 3: : : 4 : 4 9 5 : : : : : : 23 32 30 35
: : : 2 : : : : :: : : : : 19 c) : : :: : 28 37 40 42 45 : :: : : : : : : : :: : : 14 15 15 21 d) : :: : : : 0 0 0 : :: : : : : : : : :: : : : : : : : :: : 3 3 : : 4 4 :: : : 1 1 2 e) 2 e) 2 e) :
2 3 5 5 5 5 f) 6 f) 6 f) :: : : : : 44 g) 48 g) 42 g) :
0 0 0 0 0 0 h) : : :: : : : : : : : :
: : : 3 : : : : :i) : : 260 319 346 370 393 417 428
: : : : : : : : :
1.4 Motion picture and video services employment (NACE 92.1), thousand
A

Source: Eurostat, AUVIS domaina) EU-15: Eurostat estimate b) Number of employees, mid-year, Source: Social Security Office c) Source : Survey on Audiovisual Services 1997. INE d) Radio employment is not included e) Source: ISTAT f) Source: Statistics Finland, Business register g) Source: Statistics Sweden, Business registerh) Source : Labour force Survey, March each year. Includes those who work in the industries in their main job, and in their second job if their main job is not in the rele-vant industry. i) No. of employees /no. of man-years. Source: NEI
Source: Eurostat, AUVIS domaina) Number of employees, mid-year, Source: Social Security Office b) Source : Survey on Audiovisual Services 1997. INE c) Source: ISTAT d) Source: StatisticsFinland, Business register e) Source: Statistics Sweden, Business register f) Source : Labour force Survey, March each year. Includes those who work in the indus-tries in their main job, and in their second job if their main job is not in the relevant industry. g) Source: the Motion Picture Association of America, Bureau of LabourStatistics, US Motion picture industry employment. NACE 92.11 include “production and services” h) Eurostat estimate
A 19
EU-15 h) 120 150 105 : 20 20 10 : 50 60 85 :EUR-12 h) 86 114 78 : 15 14 7 : 35 41 63 :B a) 1 1 2 2 0 0 0 0 1 1 1 1DK 2 3 3 : 0 0 0 : 2 2 2 :D : : : : : : : : : : : :EL : : : : : : : : :E b) 10 : : : 2 : : : 7 : : :F 31 : : 4 : : 10 : :IRL : : : : : : : : : : : :I c) 11 15 : : 1 1 : : 4 4 : :L : : : : : : : : : : : :NL : : : : : : : : : : : :A : : : : : : : : : : : :P : : : : : : : : : : : :FIN d) 1 1 1 : 0 0 0 : 1 1 1 :S e) 4 4 4 : 0 1 1 : 1 2 1 :UK f) 28 29 20 20 4 5 1 6 12 16 19 11IS : : : : : : : : : : : :N : : : : : : : : : : : :EEA : : : : : : : : : : : :CH : : : : : : : : : : : :US g) 237 255 278 296 : : : : 133 137 138 132JP : : : : : : : : : : : :
Motion picture and video production Motion picture and video distribution Motion picture projectionNACE 92.11 NACE 92.12 NACE 92.13
1. Audiovisual services and advertising
1.5 Motion picture and video services employment, thousand
a)a)
b) : : : : : 7.5 7.2 7.5 8.9: : : 1.2 : 1.7 1.8 2.0 : : : : : : 51.5 62.0 72.0 83.0
: : : 8.2 : : : : :: : : : : 29.6 c) : :: : 33.1 : : 16.7 d) 17.5 d) : :: : : : : : : : :: : : 24.8 24.4 23.7 24.7 e) : :: : : : : : : : :: : : : : : : : :: : : 3.0 2.9 2.8 : : :
4.5 4.4 4.3 3.8 3.7 4.4 6.6 6.4 :: : : 6.3 6.3 6.4 7.2 f) 6.2 f) :
9.6 7.1 6.2 7.8 8.1 8.2 g) 8.4 g) 8.4 g) :: : : : : 73.1 h) 87.6 h) 72.7 h) 86.9
0.3 0.6 0.7 0.6 0.7 1.6 i) : : :: : : : : : : : :
: : : 1.0 : : : : :: : : : : : : : :: : : : : : : : :
1.6 Radio and television services employment (NACE 92.2), thousand

Source: Eurostat, AUVIS domaina) Eurostat estimateb) Source: VAT Office, Current prices; Enterprises are grouped in branches according totheir main activity; the amounts represent the totals.c) Source : Survey on Audiovisual Services 1997. INE
d) Source: ISTATe) Source: Statistics Finland, Business registerf) Source: Statistics Sweden, Business statistics. Current prices.g) Source: ONS Annual Business Inquiry.
a)a)
109 161 383 683 699 756 b) 664 b) 732 b) 722 b)
: : : 357 : 408 434 447 : : : : : 6 693 6 700 9 309 9 489 :
: : : 122 : : : : :: : : : : 1 977 c) : : :: : 2 828 5 003 5 598 7 056 7 475 7 804 :: : : : : : : : :: : : 2 114 2 585 2 771 6 824 d) : :: 8 32 : 75 : : : :: : : : : : : : :: : : : : : : : :: : : : : : 353 402 :: : : 129 145 197 e) 219 e) 237 e) :
73 190 426 505 605 660 f) 793 f) : :g) : : : : : 5 008 4 898 5 312 :
: : : : 23 28 36 44 57: : : : : : : : :
: : : : : : : : :: : 27 466 39 298 : : : : :: : : : : : : : :
1. Audiovisual services and advertising
1.7 Motion picture and video services turnover (NACE 92.1), million ECU/EUR
A
EU-15 g) 15 800 23 100 21 900 : 7 000 7 600 9 500 : 4 200 4 300 5 100 :EUR-12 g) 12 900 20 400 19 300 : 4 800 4 800 6 100 : 3 200 3 300 4 000 :B a) 331 301 349 363 273 193 219 186 152 170 164 173DK 202 222 229 : 132 129 133 : 74 82 84 :D 4 503 6 773 5 760 : 1 117 1 270 2 439 : 1 080 1 266 1 290 :EL : : : : : : : : : : : :E b) 765 : : : 772 : : : 441 : : :F 4 342 4 451 4 733 : 1 815 1 993 2 007 : 899 1 031 1 064 :IRL : : : : : : : : : : : :I c) 2 013 6 034 : : 451 445 : : 307 346 : :L : : : : : : : : : : : :NL : : : : : : : : : : : :A : : : : : : : : : : : :P : : : : : : : : : : : :FIN d) 122 108 116 : 25 54 63 : 50 56 58 :S e) 327 380 : : 140 236 : : 193 177 : :UK f) 2 328 2 139 : : 1 918 2 396 : : 761 717 : :IS 10 16 21 29 3 4 5 7 15 16 18 21N : : : : : : : : : : : :EEA : : : : : : : : : : : :CH : : : : : : : : : : : :US : : : : : : : : : : : :JP : : : : : : : : : : : :
Motion picture and video production Motion picture and video distribution Motion picture projectionNACE 92.11 NACE 92.12 NACE 92.13
1.8 Motion picture and video services turnover, million ECU/EUR
Source: Eurostat, AUVIS domaina) Source: VAT Office, Current prices; Enterprises are grouped in branches according totheir main activity; the amounts represent the totals.b) Source : Survey on Audiovisual Services 1997. INEc) Source: ISTAT
d) Source: Statistics Finland, Business registere) Source: Statistics Sweden, Business statistics. Current prices.f) Source: ONS Annual business Inquiry.g) Eurostat estimate
20

a)
30 131 335 551 537 588 b) 622 b) 713 b) 902 b)
: : : : : 139 176 239 : : : : : 5 547 6 738 6 869 7 126 :
: : : 329 : : : : :: : : : : 3 411 c) : : :: : 3 022 6 196 6 600 6 468 6 963 : :: : : : : : : : :: : : 4 189 4 497 5 025 5 549 d) : :: 244 316 : : : : : :: : : : : : : : :: : : : : : : : :
30 91 208 291 355 344 506 605 :: : : 580 594 594 e) 674 e) 718 e) :
251 326 474 991 1 074 1 133 f) 1 206 f) : :g) : : : : : 14 767 15 506 17 669 :
: : : : 54 66 73 86 99: : : : : : : : :
: : : : : : : : :: : 39 407 49 925 : : : : :: : : : : : : : :
1. Audiovisual services and advertising
1.9 Radio and television services turnover (NACE 92.2), million ECU/EUR
Source: Eurostat, AUVIS domain a) EU-15: Eurostat estimate b) Source: VAT Office, Current prices; Enterprises are grouped in branches according to their mainactivity; the amounts represent the totals. c) Source : Survey on Audiovisual Services 1997. INE d) Source: ISTAT e) Source: Statistics Finland, Business regis-ter f) Source: Statistics Sweden, Business statistics. Current prices. g) Source: ONS Annual Business Inquiry.
a) a)
: 412 751 1 170 1 202 1 295 : 1 626 1 785: : 859 1 097 1 138 2 901 3 078 2 648 2 726
4 386 6 623 9 884 14 516 14 347 14 299 20 650 21 816 23 290 73 152 385 1 501 1 062 1 156 b) 1 248 b) 1 549 b) :
833 1 858 : : : 3 885 c) 4 346 c) 5 003 c) :2 013 3 965 7 331 8 278 8 487 9 971 10 485 10 930 12 022
92 132 228 : : : : 569 :1 044 2 749 5 301 4 332 5 052 5 987 d) 6 579 d) 7 466 d) 8 479
: : : : : : : : :: : 1 650 : : : 4 368 e) 4 710 e) :: 443 772 1 208 1 239 1 219 : : :
33 73 327 735 882 1 053 1 220 614 f) 680
405 990 988 802 807 884 1 000 g) 1 031 g) 1 105 g)
569 924 1 437 1 404 1 550 1 655 h) 3 902 h) 4 319 : 4 785 8 578 12 503 13 249 14 738 16 896 i) 21 310 i) 23 396 i) 27 903 i)
: : : 36 41 54 j) 65 j) 92 j) 118 j)
: : : : : : : : :
747 1 236 1 680 2 026 1 944 1 850 : : :k) 38 497 124 232 101 765 124 563 138 004 165 364 179 820 201 945 252 762l) : : : 44 112 41 785 43 699 39 338 46 981 61 425
1.10 Total advertising expenditure, million ECU/EUR
Source: Eurostat, AUVIS domain a) Eurostat estimate, missing values calculated by using the development of D, F, I, P, FIN and UK b) Source Media Services S.A.c) Source: Infoadex d) Source: Utenti Pubblicità Associati (UPA) e) of which, newspapers, free local -/free papers, general-interest magazines, specialist journals,management journals, cable tv information services, outdoor, TV, radio, cinema, direct advertising, directories, fairs/exhibitions, internet. f) Corresponds only to adspending with advertising agencies, excluding direct purchases by advertisers to the media. These are values excluding discounts and including agencies' commissionsg) Source: MDC Helsinki Group h) Official source Statistics Sweden, Business Statistics. Current prices. Includes costs for Public Relations (PR). i) Source: Advertising Association. Total excludes direct mail. j) Rate card figures, information not exhaustive. Source: IM Gallup. k) Source: McCann Erickson, asone of the world's leading integrated brand communications organisations l) Source: Dentsu Inc (Japan’s biggest advertising agency)
A 21

a)
: : : 411 432 494 599 643 707: : 129 206 232 249 268 242 245
443 656 1 369 3 853 4 034 4 198 4 014 4 317 4 705 36 75 174 1 048 599 513 b) 527 b) 641 b) :
274 578 : : : 1 478 c) 1 757 c) 2 072 c) : 362 681 1 822 2 679 2 789 2 939 3 091 3 354 3 815 27 53 65 : : : : 173
268 1 338 2 539 2 366 2 767 3 345 d) 3 514 d) 3 837 d) 4 314: : : : : : : :: : 278 : : : 572 632 726: 122 208 282 285 320 : : :
18 41 143 406 513 614 706 310 e) 322
53 122 135 168 169 192 203 f) 205 f) 213 f)
: : 31 260 291 329 357 : :1 156 2 333 3 257 3 771 4 096 5 350 5 956 g) 6 558 g) 7 623 g)
: : : 7 8 16 h) 17 h) 26 h) 39 h)
: : : : : : : : :
60 81 125 206 201 208 : : :i) : : 22 830 28 920 33 459 38 914 42 346 47 705 60 395j) : : : : : : 13 322 15 761 20 903
1. Audiovisual services and advertising
1.11 TV advertising expenditure, million ECU/EUR
22
a)a)
: : : 105 108 121 133 157 174: : : 23 23 23 24 25 29
158 237 504 707 694 664 601 691 733 5 10 28 83 72 72 57 72 :
101 217 : : : 378 b) 409 b) 466 b) : 418 365 484 713 703 618 651 729 809
9 16 : : : : : 49 : 70 99 193 169 203 263 c) 370 c) 431 c) 499
: : : : : : : : :: : : : : : 170 201 :: 50 94 142 132 125 : : :
5 13 26 53 67 96 97 41 d) 47
- 2 44 29 28 31 34 e) 34 e) 38 e)
: : : 25 36 48 58 : : 90 139 228 357 423 568 680 f) 783 f) 976 f)
: : : 6 7 7 : : :: : : : : : : : :
: 14 33 78 85 82 : : :g) : : 6 852 8 668 9 663 11 896 13 445 15 885 19 980h) : : : : : : 1 470 1 684 2 082
1.12 Radio advertising expenditure, million ECU/EUR
Source: Eurostat, AUVIS domain a) Eurostat estimate, missing values calculated by using the development of D, F, I, P, FIN and UK b) source. Encuesta Continuade Presupuestos Familiares. INE c) Source: Utenti Pubblicità Associati (UPA) d) Corresponds only to ad spending with advertising agencies, excluding direct pur-chases by advertisers to the media. These are values excluding discounts and including agencies' commissions e) Source: MDC Helsinki Group f) Source:Advertising Association. Total excludes direct mail. g) Source: Radio Advertising Bureau h) Source: Dentsu Inc (Japan’s biggest advertising agency)
A
Source: Eurostat, AUVIS domain a) Eurostat estimate, missing values calculated by using the development of D, F, I, P, FIN and UK b) Source Media Services S.A.c) Source: Infoadex d) Utenti Pubblicità Associati (UPA) e) Corresponds only to ad spending with advertising agencies, excluding direct purchases by advertisers tothe media. These are values excluding discounts and including agencies' commissions f) Source: MDC Helsinki Group g) Source: Advertising Association. Totalexcludes direct mail. h) Rate card figures, information not exhaustive. Source: IM Gallup. i) Source: Television Bureau of Advertising j) Source: Dentsu Inc(Japan’s biggest advertising agency)

A 23
a)a)
: : : 18 18 21 22 25 25: : : 8 9 9 8 6 6
40 53 105 180 175 172 165 172 175: : : : : : : : :
14 22 : : : 32 b) 35 b) 42 b) : 37 70 59 63 70 77 84 109 129
: : : : : : : 5 : 19 6 16 15 17 19 c) 36 c) 48 c) 54
: : : : : : : : :: : 6 : : : 11 12 :: : : : : 3 : : :
0 1 : : : : 4 6 d) 6 1 1 1 1 1 1 2 e) 2 e) 2 e)
4 5 9 9 11 10 8 : : 30 31 55 83 90 127 143 f) 187 f) 210 f)
: : : : 1 1 1 g) 1 g) 1 g)
: : : : : : : : :
7 10 17 22 24 24 : : :: : : : : : : : :
h) : : : : : : 2 262 2 728 3 554
1. Audiovisual services and advertising
1.13 Cinema advertising expenditure, million ECU/EUR
Source: Eurostat, AUVIS domaina) Eurostat estimate, missing values calculated by using the development of D, F, I, FIN and UKb) source. Encuesta Continua de Presupuestos Familiares. INEc) Source: Utenti Pubblicità Associati (UPA)d) Corresponds only to ad spending with advertising agencies, excluding direct purchases by advertisers to the media. These are values excluding discounts and includingagencies' commissionse) Source: MDC Helsinki Groupf) Source: Advertising Association. Total excludes direct mail.g) Rate card figures, information not exhaustive. Source: IM Gallup.h) Source: Dentsu Inc (Japan’s biggest advertising agency)


2. Cinema production and distribution market


A 27
2. Cinema production and distribution market
10398
90
75
3831
23 23 23 18 16 12 10 10 8 6 3
171
0
20
40
60
80
100
120
140
160
180
F I E UK D S CH DK NL A EL NO B P FIN L IS IRL
Full-length films produced
National films
739 762
661 677
715 676 697
477
356
222
604
600 560 555
569
443 270 278
249 278
289 239
319
320
0
100
200
300
400
500
600
700
800
80 85 90 95 96 97 98 99 00 01
USEU-15JP
Cinema production in the EU
In the period 1995 and 2000 the volume of featurefilm production in the EU saw an increase of 36%.The increase was especially pronouncedbetween1995 and 1996 (28%). Between 1996 and2000 total film production in the EU countriesremained relatively stable (+8%).
The growth in the number of feature films producedin the period 1995 to 2000 was the highest inLuxembourg (+167%), Spain (+66%) and Sweden(+58%), whereas in Ireland (-67%) and Greece(-31%) full-length film production decreased.
A total of 604 films were produced in 2000 in theEU-15, 4 films more than in 1999.
French film production decreased slightly to 171films in 2000, although the production investmentsincreased from 692 million euro in 1999 to 803million euro in 2000. The average film cost was4.7 million euro in 2000. In 2001, 204 films wereproduced, a significant increase of 33 films com-pared to 2000. Production investment increased to905 million euro in 2001. Canal+ andStudioCanal are important film producers; theymade 122 films in 2001 for a total investment costof 153 million euro or 1.25 million euro per film.The most expensive film from StudioCanal was ‘LePacte des Loups’, which cost 23 million euro to pro-duce. The most expensive French film in 2000 was‘Astérix et Obélix: mission Cléopatre’ at a cost of50 million euro.
Italy was the Member State with the second highestnumber of cinematographic long length films pro-duced: 103 in 2001, the same number as in 2000.The production of national films decreased from 92in 1999 to 86 in 2000. Spain was third with 98films produced, of which 64 were 100% nationalproduction.
There is no equivalent in Europe of the "studio"structure of the American industry. Producers arenot organised in any commercial structure whichcould properly be called a studio. The majority ofEuropean productions are made by small produc-ers in a highly fragmented industry where 80% ofcompanies produce no more than one film a year.Even though the structure is different there areindeed some important film studios in the EU, likethe Cinecittà near Rome, Pinewood Studios nearLondon, Bavaria Film Studios in Geiselgasteig,near Munich, Studio Babelsberg in Potsdam, nearBerlin and Studios de Boulogne in Paris.
Impuls Studio Ardmore StudiosFilmbyen Concorde AnoisArri Studios CinecittàBavaria Film Studios Carousel Picture CompanyMagic Media Company DeLux StudiosStudio Babelsberg Amsterdam StudiosStudio Hamburg CinemateDaylight Studios Svensk film industryEstudios Barajas Elstree StudiosEstudios Los Angeles Leavesden StudiosDuboi Studio Pinewood StudiosÉclair Studios Shepperton StudiosLa Victorine Three Mills Island StudiosSFP Studios Norsk FilmstudioStudios D'Arpajon Ealing StudiosStudios de Boulogne Warner Bros Studios
Source: see tables on the following pages
A, NO and CH in 1999

A28
2. Cinema production and distribution market
Rank American film studio
Turnover (million EUR)
Market share (%)
Warner Bros. 1 371 15Universal 1 067 12
Paramount 996 11Disney 989 11
20th Century Fox 955 11Sony 814 9
Miramax 680 8New Line 640 7
MGM/UA 501 6DreamWorks 447 5
USA 157 2Sony Classics 156 2
Market share for American film studios in2001, source: Boxofficemojo.com
Cinema production in the UnitedStates
Measured in number of full-length films pro-duced the EU output is smaller than the film pro-duction of the United States (739 films in 2001).The average cost for an American film in 1999was 12 million euro.
An analysis of cinema production during the lasttwo decades reveals that the number of filmsproduced in the United States has increasedsteadily. However, between 1995 and 2000,growth in the EU-15 was higher than in the US:36% compared to 9%
US domestic film production has accounted forbetween 94% and 98.5% of total US productionin the late 1990s. The US industry, especially thebig film studios, is highly international and oper-ates in the global market, but co-productionsoccur rarely.
The largest volume from an American film stu-dio in 2001 came from Warner Bros, whichgrossed 1 371 million euro. Second wasUniversal, followed by Paramount. In total,American film studios grossed 9 billion euro,13% higher than in 2000. The three largest stu-dios together had a share of 38% in 2001,compared to 42% in 2000. Disney accountedfor the highest market share in 2000 with 15%or 1 191 million euro in turnover from cinemaexhibition, Disney released 19 films, of whichthree grossed over 100 million USD. Universalfollowed closely as runner up, also with a shareof 15% and 1 158 million euro in turnover. With13 releases, four films grossed over 100 millionUSD, of which ‘The Grinch’ starring Jim Carreytopped the box-office charts grossing 274 mil-lion euro.
The need to reduce the costs of film productionand distribution may be contributing to anothertrend that affects the US film industry: the move-ment of film and TV production from the UnitedStates to foreign countries, especially Canada,but also Prague. The Czech Republic is nowwidely compared to Canada, where Torontoand Montreal have become popular Hollywoodstand-ins for American cities. Prague has anadvantage of being two to six times less expen-sive than other European capitals and oftenreplaces Paris or London. European countriesoften use Morocco as a place to shoot films(especially bible related historical films).
Rank American film studio
Turnover (million EUR)
Market share (%)
Films released
Disney 1 191 15 19Universal 1 158 15 13
Warner Bros. 965 12 21Paramount 851 11 12
DreamWorks 833 10 1020th Century Fox 789 10 13
Sony 720 9 18Miramax 514 6 24New Line 405 5 14
MGM/UA 112 1 6USA 97 1 14
Artisan 79 1 8
Market share for American film studios in2000, source: Boxofficemojo.com
American film studio
Rank Film title Turnover (million EUR)
Market share (%)
1 Dinosaur 149 1.92 Remember the Titans 123 1.53 Gone in 60 Seconds 110 1.41 How the Grinch… 274 3.42 Meet the Parents 175 2.23 Erin Brockovich 136 1.74 Nutty Professor II 134 1.71 The Perfect Storm 198 2.51 Mission: Impossible 2 233 2.92 What Women Want 125 1.61 Gladiator 202 2.52 What Lies Beneath 168 2.13 Chicken Run 116 1.41 X-Men 170 2.12 Big Momma's House 127 1.63 Cast Away 119 1.51 Charlie's Angels 133 1.72 The Patriot 123 1.51 Scary Movie 170 2.1
Films released in 2000 that grossed morethan 100 million USD, by film studio, source: Boxofficemojo.com
A 29
Cinema production in Japan
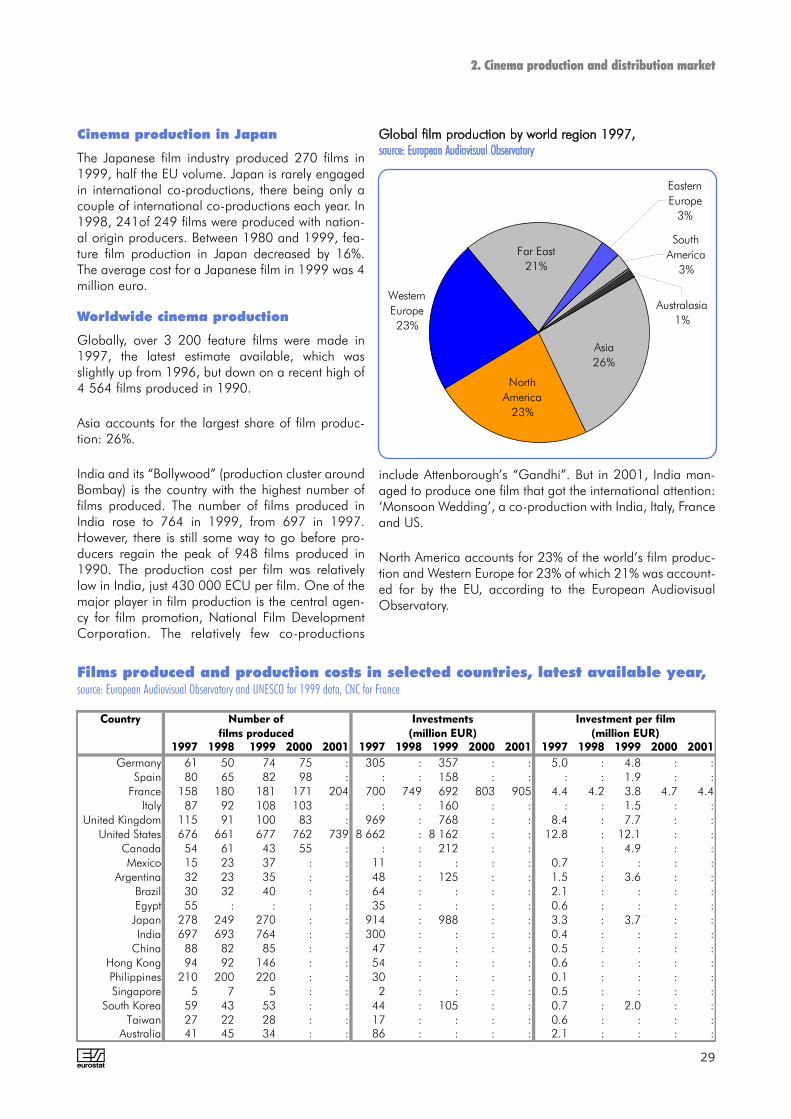
The Japanese film industry produced 270 films in1999, half the EU volume. Japan is rarely engagedin international co-productions, there being only acouple of international co-productions each year. In1998, 241of 249 films were produced with nation-al origin producers. Between 1980 and 1999, fea-ture film production in Japan decreased by 16%.The average cost for a Japanese film in 1999 was 4million euro.
Worldwide cinema production
Globally, over 3 200 feature films were made in1997, the latest estimate available, which wasslightly up from 1996, but down on a recent high of4 564 films produced in 1990.
Asia accounts for the largest share of film produc-tion: 26%.
India and its “Bollywood” (production cluster aroundBombay) is the country with the highest number offilms produced. The number of films produced inIndia rose to 764 in 1999, from 697 in 1997.However, there is still some way to go before pro-ducers regain the peak of 948 films produced in1990. The production cost per film was relativelylow in India, just 430 000 ECU per film. One of themajor player in film production is the central agen-cy for film promotion, National Film DevelopmentCorporation. The relatively few co-productions
2. Cinema production and distribution market
Western Europe23%
Eastern Europe
3%
South America
3%
Australasia1%
Asia26%
North America
23%
Far East21%
Films produced and production costs in selected countries, latest available year,source: European Audiovisual Observatory and UNESCO for 1999 data, CNC for France
Country
1997 1998 1999 2000 2001 1997 1998 1999 2000 2001 1997 1998 1999 2000 2001
Germany 61 50 74 75 : 305 : 357 : : 5.0 : 4.8 : :Spain 80 65 82 98 : : : 158 : : : : 1.9 : :
France 158 180 181 171 204 700 749 692 803 905 4.4 4.2 3.8 4.7 4.4Italy 87 92 108 103 : : : 160 : : : : 1.5 : :
United Kingdom 115 91 100 83 : 969 : 768 : : 8.4 : 7.7 : :United States 676 661 677 762 739 8 662 : 8 162 : : 12.8 : 12.1 : :
Canada 54 61 43 55 : : : 212 : : : 4.9 : :Mexico 15 23 37 : : 11 : : : : 0.7 : : : :
Argentina 32 23 35 : : 48 : 125 : : 1.5 : 3.6 : :Brazil 30 32 40 : : 64 : : : : 2.1 : : : :Egypt 55 : : : : 35 : : : : 0.6 : : : :Japan 278 249 270 : : 914 : 988 : : 3.3 : 3.7 : :India 697 693 764 : : 300 : : : : 0.4 : : : :
China 88 82 85 : : 47 : : : : 0.5 : : : :Hong Kong 94 92 146 : : 54 : : : : 0.6 : : : :Philippines 210 200 220 : : 30 : : : : 0.1 : : : :Singapore 5 7 5 : : 2 : : : : 0.5 : : : :
South Korea 59 43 53 : : 44 : 105 : : 0.7 : 2.0 : :Taiwan 27 22 28 : : 17 : : : : 0.6 : : : :
Australia 41 45 34 : : 86 : : : : 2.1 : : : :
Investment per film
(million EUR)
Number of
films produced
Investments
(million EUR)
include Attenborough’s “Gandhi”. But in 2001, India man-aged to produce one film that got the international attention:‘Monsoon Wedding’, a co-production with India, Italy, Franceand US.
North America accounts for 23% of the world’s film produc-tion and Western Europe for 23% of which 21% was account-ed for by the EU, according to the European AudiovisualObservatory.

A30
2. Cinema production and distribution market
Production of national full-length films
The share of films in the EU that are made as 100%national production has fallen since 1980. Over theperiod 1980 to 1995 the volume of films producedcompletely by domestic enterprises (national films),decreased from 510 films (excluding Luxembourg) to325 films (-36%).
A recovery started in 1996 with a sharp rise in thenumber of national films produced, i.e. 85 films morethan the previous year. EU national full-length filmproduction increased between 1995 and 1998 to atotal of 413 films (+27%). The growth in the period1995 to 2000 was strongest in France (76%) and Italy(43%). In Austria national film production grew con-siderably between 1980 and 1995 (+233%), but fellfrom 20 full-length films produced in 1995 to 7 in1998.
International co-productions
National and supra-national subsidy incentives aimedat advancing film production have contributed to theincrease in co-production activity.
EU initiatives in development of Europeanfilms
Several European Union incentives started around1990 (e.g. Eurimages in 1989 and Media I in 1990followed by Media II in 1996) have helped to stimu-late the development of European co-productions.The new MEDIA Programme (2001-2005) enteredinto force in January 2001 and aims at strengtheningthe competitiveness of the European audiovisualindustry. The MEDIA programme supports the distribu-tion and broadcasting of audiovisual works (fiction,documentary, animation, interactive programmes) andof European films in film theatres, on video, on digitaldisc and on television. In addition, it facilitates the pro-motion and access to the market of European worksby supporting independent producers and distributorson audio-visual markets and in festivals. The other keyareas are training and development of potentially suc-cessful works.
Diversification of the film distribution sys-tem
During the 80s and 90s the diversification of film dis-tribution systems was also important for feature filmproduction. The growth in the number of televisionchannels (e.g. commercial terrestrial channels and
cable and satellite channels) increased the broadcast-ing volume dedicated to feature films, as many chan-nels made cinematographic films one of the centralparts of their programme schedule. Some of the newpay-TV theme channels concentrated entirely or almostentirely on films. Broadcasters also became moreinterested in financing feature films. Furthermore, acompletely new distribution channel for films emergedat the beginning of the 1980s when renting films onvideocassettes started. In the 1990s, selling films onvideocassette took off and it quickly became a majorfilm distribution channel. For production enterprises,these changes meant more potential resources or rev-enues from their films and increased the value of filmrights.
Computer generated (CG) animationfilms: A different production process fromconventional film increases its presence
Whether it is to create alien-like water creatures, walk-ing and talking toys, or 16-ton dinosaurs, computergenerated (CG) animation has been used inHollywood movies for close to 30 years, honedthroughout the last part of the 20th century. Today, CGanimation plays at least a minor part in mostHollywood films. In 1980, 'Tron' was released includ-ing a daunting 30 minutes of computer animation.Other historical milestones were 'Terminator 2:Judgement Day' (1991) and 'Jurassic Park' (1993),containing CG animations by Industrial Light andMagic (ILM). By 1995, the creative minds at Pixar wereready to try their hand at something that had neverbefore been done in the film industry: A completelyCG-created movie. Started years earlier, the result was'Toy Story'. Other successful Pixar/Walt Disney filmsare: 'A Bug's Life' (1998), 'Toy Story 2' (1999) and'Monsters, Inc' (2001). 'Shrek' (2001) by DreamWorksSKG was as successful as 'Toy Story 2' in terms of boxoffice sales. 'Final Fantasy: The Movie' was the firstcompletely 3-D animated movie with realistic charac-ters that looked and moved like real people. The char-acters were realised by a combination of motion cap-ture (actions by actors hooked up to a computer arerecorded and used to create realistic-looking motion)and 3-D facial scanning (where an actor's face isscanned into a computer, seamlessly applied to theCGI model). The film was in development for severalyears and was released in June 2001 to mixed reviewsand poor box office sales.

Source: Eurostat, AUVIS domaina) Source: Greek Film Center (films that have been subsidised by the Greek Film Center)b) Source: Instituto de la Cinematografía y las Artes Audiovisuales( ICAA)c) Source: Ministero dei Beni Culturali- Dipartimento dello Spettacolo/ANICAd) Source: ICe) Source Finnish Board of Film Classification
f) Refer to Swedish films with premiere 1999. Source: SFI (Swedish FilmInstitute).g) Screen Finance/X25/British Film Instituteh) Source: EAO
A 31
1980 1985 1990 1995 1996 1997 1998 1999 2000 2001EU-15 e) : : : 443 569 560 555 600 604 :EUR-12 : : : : : : : : : :B : 7 12 8 8 6 7 : 12 f) :DK : 11 15 12 23 19 23 25 23 :D 49 64 48 63 64 61 50 74 75 :EL : 33 13 26 27 20 17 a) 19 a) 18 f) :E b) 118 77 47 59 91 80 65 82 98 :F 189 151 143 129 131 158 h) 180 h) 181 h) 171 h) 204IRL f) 0 2 3 9 12 8 5 4 3 :I 163 89 119 75 99 87 92 108 103 103L : 1 1 3 5 5 10 8 8 f) :NL 6 13 17 18 18 15 f) 18 f) 22 f) 23 f) :A 10 10 20 30 13 15 f) 12 f) 23 f) : :P d) 9 3 8 14 8 10 14 11 12 :FIN 10 13 13 8 10 10 c) 9 14 10 :S 20 20 16 24 27 30 20 23 38 :UK 31 47 47 76 111 115 91 100 : :IS 3 3 2 7 2 4 4 3 6 :N : : 10 22 15 17 f) 14 f) 16 f) : :EEA : : : : : : : : : :CH : 44 32 38 41 29 f) 41 f) 31 f) : :US g) 222 356 477 697 715 676 661 677 762 739JP 320 319 239 289 278 278 249 270 : :
2. Cinema production and distribution market
2.1 Cinematographic full-length films produced (2.2 + 2.3)(national films + international co-productions of full-length films with national origin producers)
Source: Eurostat, AUVIS domain a) Source: Greek Film Center (films that have been subsidised by the Greek Film Center) b) Source:Instituto de la Cinematografíay las Artes Audiovisuales( ICAA) c) Source: Finnish Films Foundation and Statistics Finland d) Source: ICAM e) EU figure doesn't represent sum of nationalresults. Co-productions can appear in the results of several countries however EU estimate doesn't double count films. Source: European Audiovisual Observatory. f)Source: European Audiovisual Observatory g) Source: the Motion Picture Association of America h) Source: CNC
5 5 3 0 2 1 1 : 8 h)
13 8 15 9 15 11 15 15 1937 46 38 37 42 47 39 44 4727 32 12 19 21 16 12 a) 13 a) 14 a)
82 65 37 37 66 55 b) 45 b) 44 b) 64 b) 144 106 81 63 74 86 102 115 111
0 2 2 5 1 2 3 h) 1 h) 0 h)
130 81 98 60 77 71 c) 79 c) 92 c) 86 c) : 1 1 0 0 0 0 0 06 10 13 11 13 8 13 : :6 5 15 20 12 12 7 : :8 2 5 2 2 4 12 9 d) 2 h)
7 11 10 7 8 8 e) 4 e) 11 e) 9 e)
17 17 10 15 18 19 13 13 f) 20 f) 28 41 39 40 59 74 g) 65 g) 71 g) :3 3 0 0 0 0 0 : 1
10 10 9 16 10 8 9 11 h) :
: 24 22 22 19 16 19 19 h) :: : : 660 672 663 652 : :
316 318 239 286 275 275 241 : :
2.2 National films (Cinematographic full-length films produced with 100% national origin producers)

Source: Eurostat, AUVIS domain a) Source: Greek Film Center (Films that have been subsidised by the Greek Film Center) b) Source: Instituto de laCinematografía y las Artes Audiovisuales( ICAA) c) Source: Ministero dei Beni Culturali- Dipartimento dello Spettacolo/ANICA d) Source: ICAM e) SourceFinnish Board of Film Classification f) Refer to Swedish films with premiere 1999. Source: SFI (Swedish Film Institute). g) Screen Finance/X25/British FilmInstitute h) Released full-length feature films only. Sources: Icelandic Film Fund (IFF)/SI
: 2 9 8 6 5 6 : :: 3 0 3 8 8 8 10 4
12 18 10 26 22 14 11 30 28: 1 1 7 6 4 5 a) 6 a) :
b) 36 12 10 22 25 25 20 38 3445 45 62 66 57 77 81 66 600 0 1 : : : : : 6
33 8 21 15 22 16 c) 13 c) 16 c) 17 c) : 0 0 3 5 5 10 8
0 3 4 7 5 7 5 : :4 5 5 10 1 3 5 : :1 1 3 12 6 6 2 2 2 d)
3 2 3 1 2 2 e) 5 e) 3 e) 1 e)
3 3 6 9 9 11 7 10 f) 18 f) 3 6 8 36 52 41 g) 26 g) 29 g) :0 0 2 7 2 4 h) 4 h) 3 h) 5: : 1 6 5 9 5 : :
: 20 10 16 22 13 22 : :: : : 37 43 13 9 : :4 1 : 3 3 3 8 : :
2. Cinema production and distribution market
2.3 International co-productions of cinematographic full-length films with nation-al origin producers
A32
: 2 4 3 1 2 4 : :: 1 0 2 4 5 3 5 2
12 18 10 26 22 14 11 30 f) 28 f)
: 1 1 7 6 4 2 a) 3 a) 2 a)
b) 24 7 5 19 10 12 9 12 1016 25 25 34 30 39 46 35 34
: : : 3 5 2 2 3 333 8 21 15 22 16 13 16 17
: 0 0 0 0 : 2 0 :: : : : : : : : :: : 1 10 1 : : : :: 0 2 6 2 : 0 0 0 c)
3 2 3 1 2 2 d) 4 d) 1 d) 1 d)
: : : : : 9 14 10 15: : : 11 18 20 e) 8 e) 6 e) 6 e)
0 0 2 7 2 4 2 2 5: : : 6 3 4 : : :
: 11 3 3 : : : : :: : : : : : : : :: : : : : : : : :
2.4 Majority international co-productions (international co-productions of cinematograph-
ic full-length films with national origin producers as majority producers)
Source: Eurostat, AUVIS domaina) Source : Greek Film Center (Films that have been subsidised by the Greek FilmCenter)b) Source:Instituto de la Cinematografía y las Artes Audiovisuales( ICAA)
c) Source: ICAMd) Source: Finnish Board of Film Classificatione) Screen Finance/X25/British Film Institutef) Source: EAO
A 33
: 7 7 3 3 3 5 : :: 9 15 11 19 16 18 20 21
49 64 48 63 64 61 50 74 75: 33 13 26 27 20 14 16 16
106 72 42 56 76 67 54 56 74160 131 106 97 104 125 148 150 145
: : : 8 6 4 5 4 3163 89 119 75 99 87 92 108 103
: 1 1 0 0 : 2 0 :: : : : : : : : :: : 16 30 13 : : : :: 2 7 8 4 : 12 9 2
10 13 13 8 10 10 8 12 10: : : : : 28 27 23 35: : : 51 77 94 73 77 503 3 2 7 2 4 2 : 6: : : 22 13 12 : : :
: 35 25 25 : : : : :: : : : : : : : :: : : : : : : : :
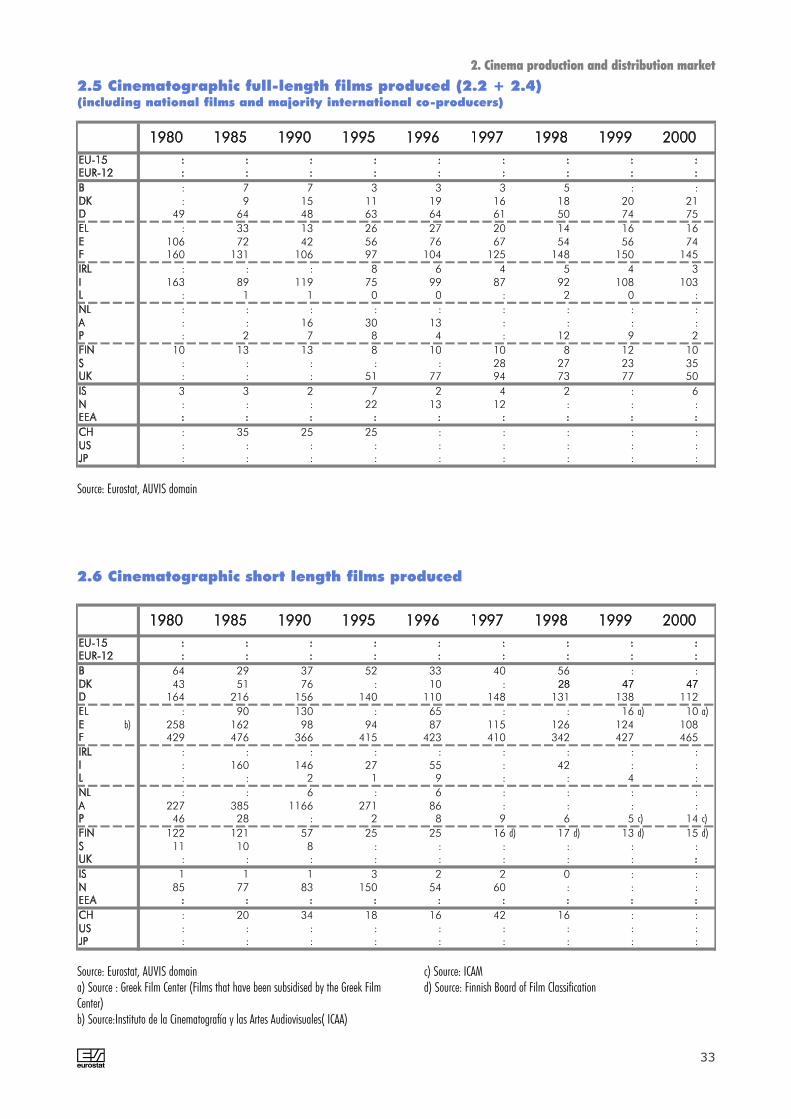
2. Cinema production and distribution market
2.5 Cinematographic full-length films produced (2.2 + 2.4)(including national films and majority international co-producers)
Source: Eurostat, AUVIS domain
64 29 37 52 33 40 56 : :43 51 76 : 10 : 28 47 47
164 216 156 140 110 148 131 138 112: 90 130 : 65 : : 16 a) 10 a)
b) 258 162 98 94 87 115 126 124 108429 476 366 415 423 410 342 427 465
: : : : : : : : :: 160 146 27 55 : 42 : :: : 2 1 9 : : 4 :: : 6 : 6 : : : :
227 385 1166 271 86 : : : :46 28 : 2 8 9 6 5 c) 14 c)
122 121 57 25 25 16 d) 17 d) 13 d) 15 d)
11 10 8 : : : : : :: : : : : : : :1 1 1 3 2 2 0 : :
85 77 83 150 54 60 : : :
: 20 34 18 16 42 16 : :: : : : : : : : :: : : : : : : : :
2.6 Cinematographic short length films produced
Source: Eurostat, AUVIS domaina) Source : Greek Film Center (Films that have been subsidised by the Greek FilmCenter)b) Source:Instituto de la Cinematografía y las Artes Audiovisuales( ICAA)
c) Source: ICAMd) Source: Finnish Board of Film Classification
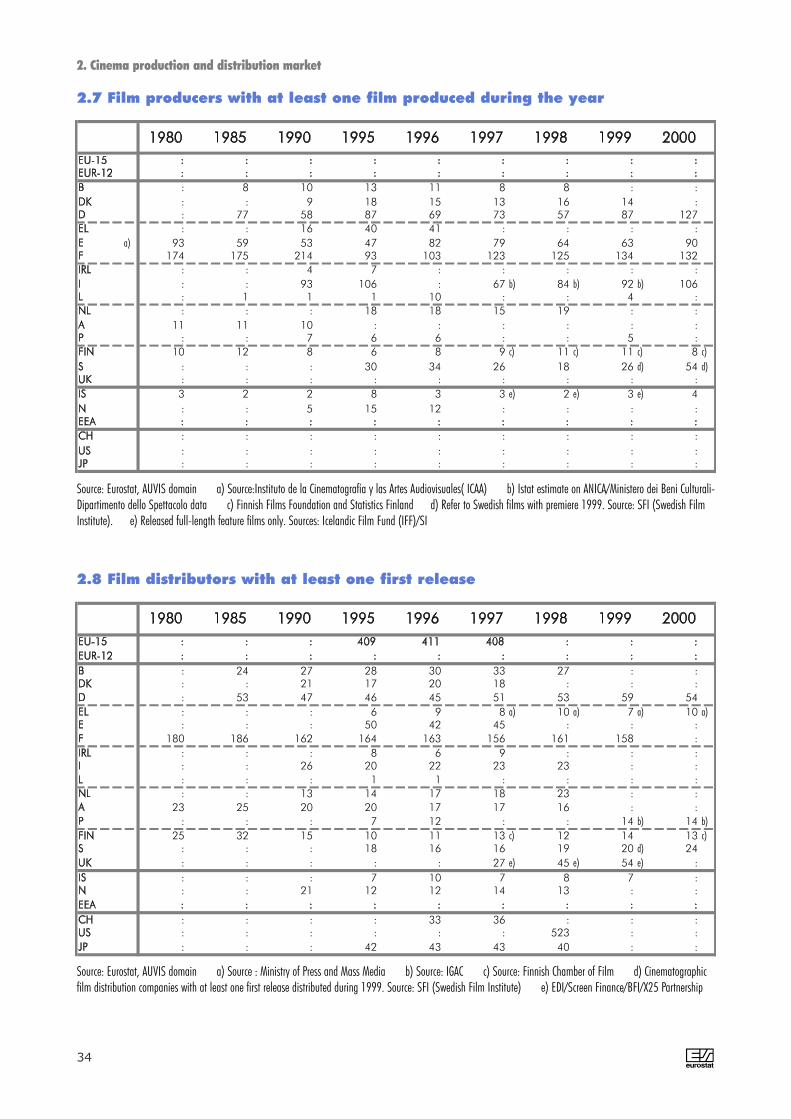
Source: Eurostat, AUVIS domain a) Source : Ministry of Press and Mass Media b) Source: IGAC c) Source: Finnish Chamber of Film d) Cinematographicfilm distribution companies with at least one first release distributed during 1999. Source: SFI (Swedish Film Institute) e) EDI/Screen Finance/BFI/X25 Partnership
Source: Eurostat, AUVIS domain a) Source:Instituto de la Cinematografía y las Artes Audiovisuales( ICAA) b) Istat estimate on ANICA/Ministero dei Beni Culturali-Dipartimento dello Spettacolo data c) Finnish Films Foundation and Statistics Finland d) Refer to Swedish films with premiere 1999. Source: SFI (Swedish FilmInstitute). e) Released full-length feature films only. Sources: Icelandic Film Fund (IFF)/SI
: 8 10 13 11 8 8 : :: : 9 18 15 13 16 14 :: 77 58 87 69 73 57 87 127: : 16 40 41 : : : :
a) 93 59 53 47 82 79 64 63 90174 175 214 93 103 123 125 134 132
: : 4 7 : : : : :: : 93 106 : 67 b) 84 b) 92 b) 106: 1 1 1 10 : : 4 :: : : 18 18 15 19 : :
11 11 10 : : : : : :: : 7 6 6 : : 5 :
10 12 8 6 8 9 c) 11 c) 11 c) 8 c)
: : : 30 34 26 18 26 d) 54 d): : : : : : : : :3 2 2 8 3 3 e) 2 e) 3 e) 4: : 5 15 12 : : : :
: : : : : : : : :: : : : : : : : :: : : : : : : : :
2. Cinema production and distribution market
2.7 Film producers with at least one film produced during the year
A34
: 24 27 28 30 33 27 : :: : 21 17 20 18 : : :: 53 47 46 45 51 53 59 54: : : 6 9 8 a) 10 a) 7 a) 10 a) : : : 50 42 45 : : :
180 186 162 164 163 156 161 158 :: : : 8 6 9 : : :: : 26 20 22 23 23 : :: : : 1 1 : : : :: : 13 14 17 18 23 : :
23 25 20 20 17 17 16 : :: : : 7 12 : : 14 b) 14 b)
25 32 15 10 11 13 c) 12 14 13 c) : : : 18 16 16 19 20 d) 24: : : : : 27 e) 45 e) 54 e) :: : : 7 10 7 8 7 :: : 21 12 12 14 13 : :
: : : : 33 36 : : :: : : : : : 523 : :: : : 42 43 43 40 : :
2.8 Film distributors with at least one first release

3. Cinema exhibition market


A 37
EU Cinema admissions in 2001: Highestattendance since 1980
After a constant decline in cinema admissions sincethe 1950s, Europe registered a recovery of cinemaexhibition in the nineties, reinforced by the construc-tion of modern multiplex cinemas. From 1990 to2000, cinema admissions in the EU increased by47%. Growth rates have been especially robustsince 1995 (6-10% per year). The latest results con-firm this trend: the EU-15 audiences continued togrow after 1998 (despite the absence of the 'Titanic'effect of 1998) to 845 million in 2000, a growth of3.7% compared to 1998.
According to data from seven EU countries (repre-senting over 60% of admissions in the EU), admis-sions continued to grow in 2001. Eurostat estimatesthat 945 million tickets were sold in EU MemberStates in 2001 (+12%). Admissions in EU-15 areback to the level of 1980, when just over a billioncinema visits were recorded, but still far from therecord in the mid-fifties when cinema admissionexceeded 4 billion.
In Germany, the admissions increased by 17% in2001, in Denmark by 12% and in France by 11%. Inthe Netherlands and in the UK, the growth of admis-sions was 10% and 9% compared to 2000. InIreland and in Sweden the increase was 7% and inNorway the increase was 6% for the first 10 monthsof 2001.
2001 was a successful year for the European films.The market share of national movies in Franceincreased from 28.5% in 2000 to 41% in 2001. USmovies in France accounted for 50% as against 62%in 2000. In Sweden, national movies accounted for24% of admissions. Also in Germany, nationalmovies increased their share in admissions to 18%.
Over two decades, cinema attendance in the UnitedStates has grown steadily: admissions increasedbetween 1990 and 1998 from 1 022 million to 1481 million tickets sold (45%). Between 1998 and2000 cinema admissions decreased slowly (-4.1%)to 1 421 million tickets sold (-3% compared to1999), but recovered in 2001 with 1 487 million tickets sold (+5%).
Cinema admissions in 2000: Increase inall EU countries, except Denmark
The number of spectators in 2000 increased in allMember States, except in Denmark. As mentionedabove, a strong recovery was recorded for Denmarkin 2001, mainly due to several successful national
3. Cinema exhibition market
166.0152.5
142.5135.4
108.6
23.5 21.5 17.0 16.3 14.9 13.5 10.71.4
7.118.9
0
20
40
60
80
100
120
140
160
180
F D UK E I B NL P S A IRL EL DK FIN L
1999 2000[million]
1.49
1.421.48
1.47
1.34
1.39
1.261.19
1.06
1.02
0.950.840.82
0.810.76
0.70
0.64
0.580.71
1.04
0.14
0.15
0.140.14
0.12
0.130.150.160.17
0.0
0.5
1.0
1.5
80 85 90 95 96 97 98 99 00 01
USEU-15JP
[bn]
Source: see tables on the following pages
World admissions in 1999, source: Unesco, Eurostat
Admissions Share
in 1999 of world
(million) (%)
Western Europe 843 12.6EU-15 812 12.1
Central & Eastern Europe 126 1.9North America 1 587 23.7
United States 1 465 21.8Cental America & Caribbean 131 2.0
South America 216 3.2Africa 67 1.0
Middle East 13 0.2South & Central Asia 3 272 48.8
Japan 145 2.2Far East 369 5.5
Australasia & Oceania 96 1.4World 6 708 100.0

films like ‘Italian for beginners’. In 2000, themost talked about Danish film, ‘Dancer in thedark’, only managed to attract 1.8% of theDanish spectators. The growth in admissions, onthe other hand, was most significant in Irelandand the Netherlands, reaching 20% and 16%respectively, followed by Austria (9%), France(8%) and Belgium (8%).
According to UNESCO, world admissionsreached 6 708 million in 1999, of which the EUaccounted for 12% and the US for 22%.
According to the European AudiovisualObservatory, the market share for Europeanfilms in the EU in 2000 was estimated at 22.5%(-6.7% from 1999). France is the EU countrywith the highest share of admissions of EU pro-duced films. About 74% of EU admissions wereto American films (+4% from 1999).
An analysis of the 20 most seen films in the EU-15 in 2000 reveals that American films domi-nate the list. Not until rank 10 is the first UK/USco-production film listed: 'Chicken Run', with atotal of 12.8 million spectators. At rank 14 is thesecond European film, produced in France: 'Taxi2' with 11.4 million spectators.
Only 8% of European films attract more than 1million spectators, compared to 61% of USfilms. More than half of the US films are seen bymore than 2 million spectators in Europe.
With 166 million spectators in 2000, Franceconfirmed its position as the most importantmarket in the EU. Other significant MemberStates were Germany (153 million spectators)and the UK (143 million). The positions amongthe three of them were the same as in 2001.
3. Cinema exhibition market
A38
F7.6%
US73.8%
UK6.8%
D2.4%
I1.8%
Other EU3.8%
Rest of world3.8%
source: EAO
1 Gladiator US R Scott 27.52 Toy Story II US J Lasseter / A Brannon 24.63 American Beauty US S Mendes 23.24 Mission: Impossible II US J Woo 21.95 Sixth Sense, The US M N Shyamalan 20.86 Dinosaur US E Leighton / R Zondag 14.97 Scary Movie US K I Wayans 14.98 Stuart Little US R Minkoff 13.69 Erin Brockovich US S Soderbergh 13.1
10 Chicken Run UK/US N Park / P Lord 12.811 Pokémon: The First Movie JP/US M Haigney / K Yuyama 11.712 X-Men US B Singer 11.713 What Lies Beneath US R Zemeckis 11.714 Taxi 2 F G Krawczyk 11.415 Gone In Sixty Seconds US D Sena 11.116 Hollow Man US P Verhoeven 10.017 Sleepy Hollow US T Burton 9.918 Charlie's Angels US J McGinty Nichol 9.819 American Pie US P Weiltz 9.720 Beach, The US D Boyle 9.7
Rank Title Origin Director Admission
(million)
Top 20 of film admissions in the EU in 2000,source: European Audiovisual Observatory
American Beauty: 0.32 million admissions in 1999The Sixth Sense: 14.1 million admissions in 1999American Pie: 8.1 million admissions in 1999
1 Chicken Run UK/US N Park / P Lord 12.82 Taxi 2 F G Krawczyk 11.43 The World is not enough UK/US M Apted 7.44 Billy Elliot UK S Daldry 5.15 Les rivières pourpres F M Kassovitz 4.66 Le goût des autres F A Jaouli 4.27 Snatch UK/US G Ritchie 4.28 Chiedimi se sono felice I A, G e Giacomo 3.19 Angela's Ashes IRL/US A Parker 3.1
10 Dancer in the Dark DK/F/D/NL L von Trier 2.811 Kevin and Perry Go Large UK E Bye 2.512 Hi Fidelity UK/US S Frears 2.413 Himalaya - l'enfance d'un chef FR/CH/UK/NP E Valli 2.414 Anatomie D S Ruzowitzky 2.315 Harry, un ami qui vous veut… F D Moll 2.116 Jet Set F F Onteniente 2.017 Harte Jungs D M Rothemund 1.718 Crazy D H-C Schmid 1.519 Saving Grace UK N Cole 1.520 The End of the Affair UK/US N Jordan 1.4
Rank Title Origin Director Admission
(million)
Top 20 of admissions to European films in theEU in 2000, source: European Audiovisual Observatory
The World Is Not Enough: 18.8 million admissions in 1999Himalaya - l'enfance d'un chef: 1.1 million admissions in 1999

3. Cinema exhibition market
On average, EU citizens go 2.2 times per year tothe cinema, as against 5.2 times for US citizens.Iceland is the only country where the annual fre-quency per capita was higher than in the US. TheEU Member State with the highest frequency wasSpain, with 3.4 admissions per capita and year, fol-lowed by Ireland (3.3). In Japan, Finland, Greeceand the Netherlands, people go to the cinemabetween 1.1 and 1.4 times per year.
53% of new films released in the EU in2000 were of US origin
There is a great disparity in the number of filmsshown in each Member State.
In 1998, over 4 800 films were shown in Italy,which represented more than tenfold the number ofnew releases. 383 new films were shown in 1998(8% of all films). Nearly 28% of all films shown wereItalian and 41% came from the United States.
France is in second place in the number of cinemafilms shown, with more than 4 000. France released504 new films in 1999. 39% of all films shown wereFrench and one third came from the United States.
Spain also showed a relatively high number of films,with over 1 700 in 2000, of which 523 werereleased for the first time.
In Iceland, Luxembourg, Portugal and Norway lessthan 300 films were shown per country in 2000.The new releases stayed relatively low in thesecountries.
On average, 307 new films were shown in 2000per EU country. The highest number of new releas-es that year was recorded in France, with 540 films(36 films more than in 1999).
As average per EU Member State, 16% of the newreleases were of national origin, while 53% camefrom the United States. In the United States, 85% ofthe new releases were domestic productions.France, Italy and UK were the Member States withhighest shares of films with national origin.
In the United States, 461 new releases were shownin 2000, slightly more than in 1999. Japan boaststhe highest number with 568 new films released in1999.
The cinema audience profiles differ by countries. InThe Netherlands, 62% of the cinema audience wereolder than 35 and just 20% were between 15 and24 years old. On the other hand, in Ireland nearlyhalf of the audience were in the 15-24 age group.
A 39
289
191164
307
461
644
396
364
156170223192
231241
242
540523
428
373 350
272
0
100
200
300
400
500
600
700
F E I B D UK CH L NL A P N S DK EL FIN IS IRL EU-
15
US JP
IRL, N and CH 1998; B and A 1999
1 Chicken Run UK/US N Park / P Lord 19.42 Hi Fidelity UK/US S Frears 5.03 La neuvième porte F/E R Polanski 3.44 Billy Elliot UK S Daldry 3.15 Eye of the Beholder UK/CA S Elliott 3.06 Get Carter UK M Hodges 2.77 Angela's Ashes IRL/US A Parker 2.38 Saving Grace UK N Cole 2.29 The End of the Affair UK/US N Jordan 1.7
10 The World is not enough UK/US M Apted 1.611 Croupier F/D/UK/IRL M Hodges 1.112 Todo sobre mi madre E/F P Almodóvar 1.113 Topsy-Turvy UK/CZ M Leigh 1.114 A napfény íze HU/D/A/CA I Szabó 0.915 East is East UK D O'Donell 0.816 Dancer in the Dark DK/F/D/NL L von Trier 0.817 Mansfield Park UK P Rozema 0.418 La fille sur le pont F P Leconte 0.319 What's Cooking? UK/US G Chadha 0.220 The Eyes of Tammy Faye UK/US F Bailey/R Barbato 0.2
Rank Title Origin Director Admission
(million)
Top 20 of admissions to European films inthe US in 2000, source: European Audiovisual Observatory
The World Is Not Enough: 18.8 million admissions in 1999Himalaya - l'enfance d'un chef: 1.1 million admissions in 1999
15-24 25-34 35+
F 2000 34 21 45
IRL 2001 49 27 24
NL 2000 20 18 62
USA 2001 30 22 48
Age Groups
Cinema audience profile, %source: Eurostat estimate based on : F: CNC , IRL: Medialive.ie, NL: NFC , US: MPAA
Note that people younger than 15 are not included.

A40
The gross box office receipts in the EU-15 in 2001is estimated at 5.1 billion euro, compared to 4.4billion euro in 2000. Looking at box-office perhead of population, it can be seen that EU-15 cit-izens spend on average 11.8 euro per year oncinema (or ca. 0.1% of their income) in 2000,while the average American spends nearly threetimes (30.3 euro) this amount.
The highest spending within the EU-15 wasrecorded in Luxembourg with 17.4 euro per capi-ta, closely followed by UK with 15.9 euro. InIceland, the expenditure per capita was higher(with 49 euro) than in any of the EU MemberStates and even higher than in the US.
In the UK, France and Sweden, national films playa relatively important role, accounting forbetween 25% and 33% of box office receipts. InItaly, the share of national production in box officereceipts decreased from 24.7% in 1998 to 17.5%in 2000.
In 2000 there were less European films in the top3 box-office admissions than in 1998. Numberone in box office receipts for France in 2000 wasa national production "Taxi 2" with 10.3 millionspectators. Only in France and Italy, domesticfilms were first-runner-up. In the UK, one domes-tic film was third. In all the other Member StatesUS films dominated. The American dominancewas most evident in Iceland and Spain, wheremore than 80% of receipts came from Americanfilms.
The average ticket prices in the EU-15were lower than in the United States:5.2 euro versus 5.8 euro.
In Japan, the average ticket price was highest,12.6 euro, mainly due to the strong yen/euroexchange rate development. Measured in yen, theJapanese ticket price increased by 6% during thenineties, compared to 25% in the EU and 28% inUS. Measured in euro, the ticket price in Japanincreased 96% and in US by 76% during thenineties. Also in Iceland and Switzerland the aver-age ticket price was higher than in any EU coun-try: 8.7 euro and 8.6 euro respectively.
There is a large disparity in pricing tickets betweenMember States, but also between regions andcities within states. The highest average ticketprice was recorded in Sweden 8.0 euro peradmission, followed by Denmark, at 7.0 euro.Only in Portugal, Italy and Spain were ticket priceslower than the EU-15 average. Adjusted forPurchasing Power Parity, differences between aver-age ticket prices would be lower.
3. Cinema exhibition market
2118 17 15 13 10 10 8 7 6 5 5 4 2
32
93
2 0.2
2529
0102030405060708090
100
F
00
S
00
UK
00
I
00
DK
00
FIN
00
D
00
E
00
IRL
98
P
99
A
98
N
00
NL
00
EL
98
CH
00
IS
99
B
00
L
99
US
00
JP
00
[%]
893
536
416
147 136 126 96 83 74 70 61 47 8
9871037
0
200
400
600
800
1000
1200
UK 01
D01
F 00
E00
I 00
NL 01
S 00
B 00
A 99
IRL01
DK00
EL00
P 99
FIN00
L 00
[million EUR]
9.4
8.3
6.27.0
4.7
5.6
4.23.9
4.9
2.0
5.1
4.4
3.8
4.3
3.6
3.4
3.02.4
2.2
2.01.8
1.3 1.5
1.3
1.1
1.3
0.91.00.5 1.7
0
1
2
3
4
5
6
7
8
9
10
80 85 90 95 96 97 98 99 00 01
USEU-15JP
[bn ECU/EUR]
Source: see tables on the following pages

A 41
Ten thousand cinema theatres in the EU
Cinema exhibition started already more than 100years ago. The Lumière brothers opened the firstcinema in Paris in 1895. First cinemas in Berlin andTurin were established in 1896, followed byBrussels and Madrid in 1897. The number of cine-ma theatres reached its maximum in Europe in the1920s and started to decline thereafter. In the 90sthe decline came to a halt and with the growth ofmultiplex cinemas the number of screens evenincreased considerably. Today, there are over tenthousand cinema theatres in the EU-15, 3 000more than in the United States. Looking at thenumber of cinema sites (theatres) per 100 000inhabitants, there is nearly the same density in theUnited States as in the EU: 2.7 and 2.8 per 100000 inhabitants. Sweden and Iceland recorded thehighest density with over 9 theatres per 100 000inhabitants, while in the UK, the Netherlands andBelgium the density was between 1.2 and 1.3.Including the ‘municipal cinemas’, Norway has thehighest density, but excluding these kind of cine-mas, the density is about 6.0.
Factors for future growth in cinemaattendance in EU
There is no clear relationship between the numberof cinemas and admissions relative to the popula-tion between countries. However, if one divides thecountries into three groups, some tendencies canbe indicated. There is first a group of countries,Norway, Sweden, Finland and Greece, where thecinema density seems not to boost cinema atten-dance to the same degree as the second group, theUS, Ireland, Luxembourg, UK, Belgium and theNetherlands, where admissions per capita arehigher in relation to the cinema density. Looking atthe cinema density only for the second group, anexpansion of number of screens in countries stillwith a relatively low admission per capita, as inBelgium, UK and Luxembourg, could increaseadmissions per capita in those countries. Howeverthere are factors like GDP per capita and geo-graphical population density as well as the filmsthemselves that will influence future admissions.Another factor is the number of screens in relationto admissions. The admissions per screen is moreor less the same in the EU as in the United States:33 000 against 38 000. In the EU-15 there was anaverage of 2.4 screens per cinema, more than 25thousand screens in total in 2000, while in theUnited States there were 5.0 screens per cinema,with a total of 37 thousand screens. The increasein number of screens seems to be a key factor forfuture growth in cinema attendance in the EU.
3. Cinema exhibition market
8.0
6.65.9 5.7 5.4 5.4 5.8
12.6
4.0
5.2
3.24.0
5.35.45.65.76.67.0
5.2
8.68.7
0
2
4
6
8
10
12
14
IS CH S DK UK FIN NL N A L D F B IRL EL E I P EU-
15
US JP
[EUR]
9082 81 80 80 79 77 76 75 75 73 71 70 67 65 65 63
74
93
53
0102030405060708090
100
IRL
95
E
00
L
00
IS
00
EL
98
D
99
NL
00
CH
00
UK
00
FIN
00
DK
00
B
00
I
00
S
00
N
96
P
99
F
00
EU-
15
00
US
zz
00
JP
zz
97
[%]
Source: see tables on the following pages
Cinema density:
cinemas per 100,000
inhabitants0
1
2
3
4
5
6
0 5 10 15
Admissions per capita
N
ISUS
SNL
FINEL
IRL
L
UKB

A42
3. Cinema exhibition market
The EU-15 has fewer screens per headthan the United States
In the nineties, there was a tendency for tradi-tional cinemas to close down, whilst multiplexsites (cinemas with more than 8 screens) contin-ue to mushroom. In 2000, both in the UnitedStates and the EU the strong growth in the netnumber of screens came to a halt, despite theinvestments in multiplexes. Old cinema screensseem to be phased out at the same rate as newscreens. As an example, AMC, owning about 3 000 screens in the US, built up 6 new cinemasin 2000 with 115 screens (most cinemas weremegaplexes: 19 screens per cinema on average)and 37 cinemas with 250 screens were disposedof (7 screens/ cinema). The number of screens inthe United States increased only by 0.6% from1999 to 2000. In the EU-15 the growth was 2%.
In the US, over 10 000 new film screens wereconstructed in the 1995-2000 period. In 2000,25% of the cinemas in the US were multiplexes,of which 5% were ‘megaplexes’ (cinemas withmore than 16 screens).
In the UK, half of the screens are located in mul-tiplexes. In Luxembourg and Belgium multiplexesaccount for over 40% of the screens. In SpainIreland and Austria, nearly one third of thescreens are located in multiplexes. In Greece andItaly single-screen cinemas have the lion's shareof the market (84% and 70%, respectively).
The EU-15 has fewer screens per head than theUnited States. In 2000, there was one cinemascreen for every 14 800 EU citizens, as againstone for every 7 300 Americans. Expressed inscreens per 100 000 inhabitants, this wouldmean 6.8 for the EU-15, against 13.6 in theUnited States. Only Iceland had a higher density,with 16.7 screens per 100 000 inhabitants.There were at least 5.8 million seats in EU cine-mas in 2000, (excluding Italy and Greece, whereno data were available), 500 000 more than in1998, but few less than in 1999. The averagenumber of seats per screen varies from 143 inAustria to 351 in Spain.
There is also a great disparity between MemberStates' average admissions per seat per year. SixMember States had over 200 admissions perseat per year. Luxembourg with 304 and Irelandwith 234 recorded the highest numbers againstonly 89 in Sweden.
3.43.1
2.8 2.7 2.62.3 2.1 2.1 2.1 1.9
5.0
1.5 1.5 1.4 1.4
2.4
1.2
0.2
3.94.3
0.0
1.0
2.0
3.0
4.0
5.0
6.0
UK
00
IRL
99
B
99
NL
00
D
00
E
00
L
99
F
99
A
99
DK
00
I
98
IS
00
FIN
00
P
00
CH
99
S
00
EL
99
N
00
EU-
15
00
US
zz
00
25.424.922.7
21.420.719.719.118.718.818.918.8
37.437.2
34.2
31.629.7
27.826.625.725.124.623.7
15
20
25
30
35
40
1990 1991 1992 1993 1994 1995 1996 1997 1998 1999 2000
EU-15USA
[thousand]
4.6
3.5
3.0
1.1
0.6 0.6 0.5 0.5 0.4 0.4 0.3 0.30.02
4.85.0
0.0
1.0
2.0
3.0
4.0
5.0
6.0
F D I E UK S NL P A B EL DK FIN IRL L
[thousand]
I 1998, EL, F, IRL, L and A 1999

A 43
3. Cinema exhibition market
1 Titanic 1997 Fox/P.2 Harry Potter 2001 WB3 The Phantom Menace 1999 Fox4 Jurassic Park 1993 Uni.5 Independence Day 1996 Fox6 The Lord of the Rings 2001 NL7 Star Wars 1977 Fox8 The Lion King 1994 Dis.9 E.T.: The Extra-Terrestrial 1982 Uni.10 Forrest Gump 1994 Par.11 The Sixth Sense 1999 Dis.12 The Lost World: Jurassic Park 1997 Uni.13 Men in Black 1997 Sony14 Mission: Impossible 2 2000 Par.15 Armageddon 1998 Dis.16 The Empire Strikes Back 1980 Fox17 Home Alone 1990 Fox18 Ghost 1990 Par.19 Terminator 2: Judgment Day 1991 Sony20 Aladdin 1992 Dis.21 Twister 1996 WB22 Indiana Jones & the Last Crusade 1989 Par.23 Toy Story 2 1999 Dis.24 Shrek 2001 DW25 Saving Private Ryan 1998 P/DW26 Jaws 1975 Uni.27 Return of the Jedi 1983 Fox28 Monsters, Inc. 2001 Dis.29 Mission: Impossible 1996 Par.30 Pretty Woman 1990 Dis.31 Gladiator 2000 U/Dw32 The Matrix 1999 WB33 Pearl Harbor 2001 Dis.34 Tarzan 1999 Dis.35 Mrs. Doubtfire 1993 Fox36 The Mummy Returns 2001 Uni.37 Cast Away 2000 Fox38 Dances with Wolves 1990 Orion39 Ocean's Eleven 2001 WB40 The Mummy 1999 Uni.41 Batman 1989 WB42 Rain Man 1988 MGM43 The Bodyguard 1992 WB44 The Exorcist 1973 WB45 Robin Hood: Prince of Thieves 1991 WB46 Raiders of the Lost Ark 1981 Par.47 Grease 1978 Par.48 Godzilla 1998 Sony49 Beauty and the Beast 1991 Dis.50 What Women Want 2000 Par.
source: http://www.boxofficemojo.com/alltime/world/
Majority of the top grossing films werereleased by the end of the Nineties
An analysis of the top grossing films in the cinemahistory reveals that three quarters of the most suc-cessful films ever produced were made since thenineties. In the top 20, there is only one from theSeventies (Star Wars), two films from the earlyeighties and the others from 1989 and later. Thereare no films from the forties, fifties or sixties in thetop 50 ranking. The American films totally domi-nate the list. There are seven 2001 films on the list,of which two are placed in the top 10. The re-release of ‘E.T: The Extra-Terrestrial’ from 1982with probably improve its ranking during 2002.
The film ‘Titanic’ was the biggest box office successin cinema history with worldwide receipts of 2,080million euro by the end of March 2002 (nearly 100million admissions and over 500 million euro boxoffice receipts in the EU in 1998). One month afterthe first release of ‘Harry Potter and the Sorcerer’sstone’, the total gross box office worldwide exceed-ed 420 million euro by mid December 2001. Fewmonths later the film achieved already the secondposition after ‘Titanic’, with a total gross box officeof 1081 million euro. The first ‘Lord of the Rings’film and ‘Monsters, Inc’ are still in cinema exhibi-tion.
The leading film studio in the top 50 list is 20thCentury Fox, followed by Warner Bros. A closeranalysis of the film studios and their market shareare found on page 28.
This ranking would look different if constant priceswere applied.
Films in shaded background are still in exhibition.
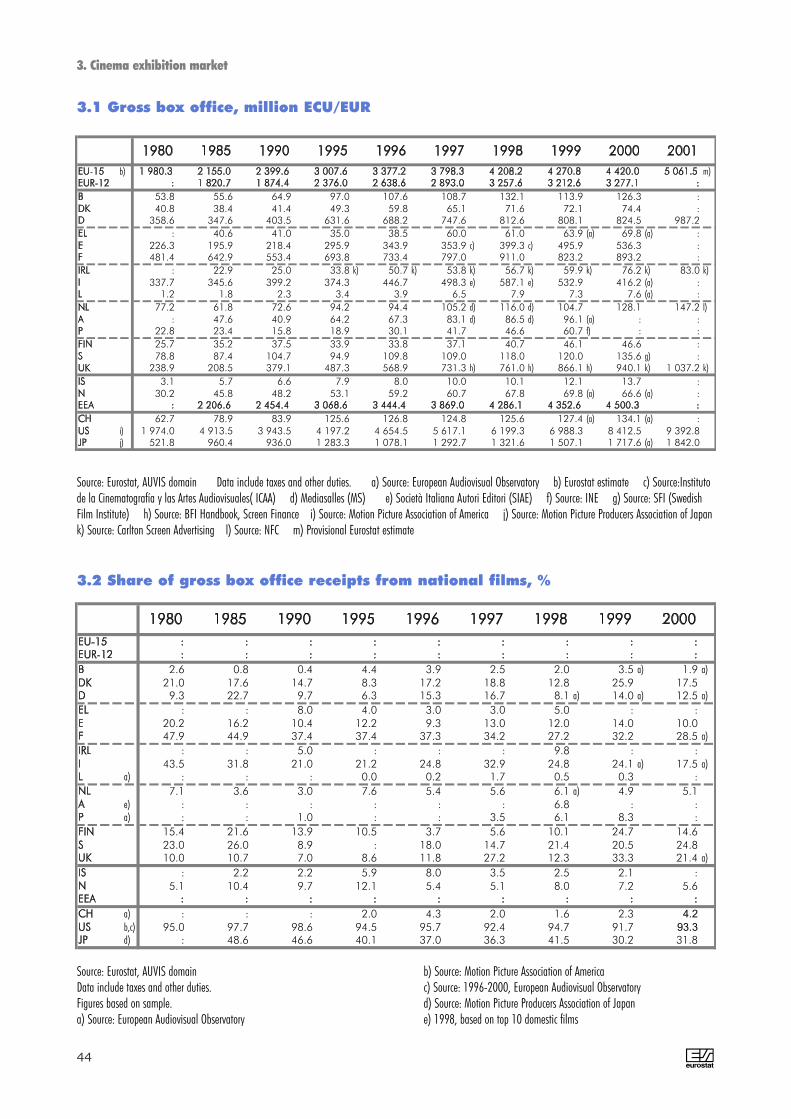
3. Cinema exhibition market
A44
1980 1985 1990 1995 1996 1997 1998 1999 2000 2001EU-15 b) 1 980.3 2 155.0 2 399.6 3 007.6 3 377.2 3 798.3 4 208.2 4 270.8 4 420.0 5 061.5 m)EUR-12 : 1 820.7 1 874.4 2 376.0 2 638.6 2 893.0 3 257.6 3 212.6 3 277.1 :B 53.8 55.6 64.9 97.0 107.6 108.7 132.1 113.9 126.3 :DK 40.8 38.4 41.4 49.3 59.8 65.1 71.6 72.1 74.4 :D 358.6 347.6 403.5 631.6 688.2 747.6 812.6 808.1 824.5 987.2EL : 40.6 41.0 35.0 38.5 60.0 61.0 63.9 (a) 69.8 (a) :E 226.3 195.9 218.4 295.9 343.9 353.9 c) 399.3 c) 495.9 536.3 :F 481.4 642.9 553.4 693.8 733.4 797.0 911.0 823.2 893.2 :IRL : 22.9 25.0 33.8 k) 50.7 k) 53.8 k) 56.7 k) 59.9 k) 76.2 k) 83.0 k)
I 337.7 345.6 399.2 374.3 446.7 498.3 e) 587.1 e) 532.9 416.2 (a) :L 1.2 1.8 2.3 3.4 3.9 6.5 7.9 7.3 7.6 (a) :NL 77.2 61.8 72.6 94.2 94.4 105.2 d) 116.0 d) 104.7 128.1 147.2 l)
A : 47.6 40.9 64.2 67.3 83.1 d) 86.5 d) 96.1 (a) : :P 22.8 23.4 15.8 18.9 30.1 41.7 46.6 60.7 f) : :FIN 25.7 35.2 37.5 33.9 33.8 37.1 40.7 46.1 46.6 :S 78.8 87.4 104.7 94.9 109.8 109.0 118.0 120.0 135.6 g) :UK 238.9 208.5 379.1 487.3 568.9 731.3 h) 761.0 h) 866.1 h) 940.1 k) 1 037.2 k)
IS 3.1 5.7 6.6 7.9 8.0 10.0 10.1 12.1 13.7 :N 30.2 45.8 48.2 53.1 59.2 60.7 67.8 69.8 (a) 66.6 (a) :EEA : 2 206.6 2 454.4 3 068.6 3 444.4 3 869.0 4 286.1 4 352.6 4 500.3 :CH 62.7 78.9 83.9 125.6 126.8 124.8 125.6 127.4 (a) 134.1 (a) :US i) 1 974.0 4 913.5 3 943.5 4 197.2 4 654.5 5 617.1 6 199.3 6 988.3 8 412.5 9 392.8JP j) 521.8 960.4 936.0 1 283.3 1 078.1 1 292.7 1 321.6 1 507.1 1 717.6 (a) 1 842.0
3.1 Gross box office, million ECU/EUR
Source: Eurostat, AUVIS domain Data include taxes and other duties. a) Source: European Audiovisual Observatory b) Eurostat estimate c) Source:Institutode la Cinematografía y las Artes Audiovisuales( ICAA) d) Mediasalles (MS) e) Società Italiana Autori Editori (SIAE) f) Source: INE g) Source: SFI (SwedishFilm Institute) h) Source: BFI Handbook, Screen Finance i) Source: Motion Picture Association of America j) Source: Motion Picture Producers Association of Japank) Source: Carlton Screen Advertising l) Source: NFC m) Provisional Eurostat estimate
2.6 0.8 0.4 4.4 3.9 2.5 2.0 3.5 a) 1.9 a)
21.0 17.6 14.7 8.3 17.2 18.8 12.8 25.9 17.59.3 22.7 9.7 6.3 15.3 16.7 8.1 a) 14.0 a) 12.5 a)
: : 8.0 4.0 3.0 3.0 5.0 : :20.2 16.2 10.4 12.2 9.3 13.0 12.0 14.0 10.047.9 44.9 37.4 37.4 37.3 34.2 27.2 32.2 28.5 a)
: : 5.0 : : : 9.8 : :43.5 31.8 21.0 21.2 24.8 32.9 24.8 24.1 a) 17.5 a)
a) : : : 0.0 0.2 1.7 0.5 0.3 :7.1 3.6 3.0 7.6 5.4 5.6 6.1 a) 4.9 5.1
e) : : : : : : 6.8 : :a) : : 1.0 : : 3.5 6.1 8.3 :
15.4 21.6 13.9 10.5 3.7 5.6 10.1 24.7 14.623.0 26.0 8.9 : 18.0 14.7 21.4 20.5 24.810.0 10.7 7.0 8.6 11.8 27.2 12.3 33.3 21.4 a)
: 2.2 2.2 5.9 8.0 3.5 2.5 2.1 :5.1 10.4 9.7 12.1 5.4 5.1 8.0 7.2 5.6
a) : : : 2.0 4.3 2.0 1.6 2.3 4.2
b,c) 95.0 97.7 98.6 94.5 95.7 92.4 94.7 91.7 93.3
d) : 48.6 46.6 40.1 37.0 36.3 41.5 30.2 31.8
3.2 Share of gross box office receipts from national films, %
Source: Eurostat, AUVIS domainData include taxes and other duties.Figures based on sample.a) Source: European Audiovisual Observatory
b) Source: Motion Picture Association of Americac) Source: 1996-2000, European Audiovisual Observatoryd) Source: Motion Picture Producers Association of Japane) 1998, based on top 10 domestic films

A 45
3. Cinema exhibition market
c)
46.6 61.4 68.4 72.4 69.8 73.7 72.4 69.5 a) 70.6 a)
46.5 58.8 77.0 70.9 67.1 66.5 77.6 58.7 73.154.9 58.6 83.9 87.1 75.1 70.5 85.4 78.6 :
: : 87.0 73.0 80.0 80.0 80.0 : :42.9 58.5 72.4 71.9 78.3 68.3 78.5 64.2 81.636.8 39.4 56.6 57.4 54.7 52.8 64.0 54.1 62.9 a)
: : 87.0 90.0 : : : : :33.7 48.6 70.0 63.2 59.7 46.7 63.7 53.1 a) 69.6 a)
: : 80.0 82.4 78.5 68.4 80.7 71.0 a) 80.6 a)
49.2 74.3 85.8 82.0 86.4 83.9 89.8 75.8 77.0: : : : : : : : :
a) : : 85.0 : : 64.0 65.1 65.2 :: : 70.0 77.0 72.1 72.9 80.0 63.2 74.6: : : : 67.5 66.7 76.1 68.2 66.5
88.0 84.0 88.0 83.7 81.7 68.6 83.9 80.5 a) 75.3 a)
: : : : 85.2 82.0 91.9 : 80.2: : 70.7 87.4 65.3 : : : :
: : : : : 73.6 72.3 75.6 75.8 a)
d) 95.0 97.7 98.6 94.5 95.7 92.4 94.7 91.7 93.3
: : : 59.8 60.5 53.4 : : :
3.3 Share of gross box office receipts from US films, %
Source: Eurostat, AUVIS domainData include taxes and other duties.Figures based on sample.a) Source: European Audiovisual Observatory
b) Source: MPAAc) Eurostat estimate based on European Audiovisual Observatoryd) Source: 1996-2000, European Audiovisual Observatory
a)
: : : : : : 1.8 6.0 a) 3.1 a)
: 11.8 2.2 3.3 8.3 6.4 6.3 8.9 3.36.9 9.1 2.9 2.2 7.0 8.0 2.3 2.8 :
: : : : : : : : :9.4 9.4 4.3 7.3 5.8 12.8 5.8 10.8 3.7
: : : : : 9.2 4.2 8.8 :: : : : : : : : :
3.2 5.9 1.6 6.4 5.9 10.8 7.4 13.8 a) 3.3 a): : : : : : : 11.6 a) 4.6 a)
9.3 14.8 2.8 5.7 2.1 : : 7.5 1.5: : : : : : : : :
a) : : : : : 8.0 5.2 3.3 :: : : : : : 6.6 4.8 4.2: : : : : : : 5.4 2.9
10.0 10.7 7.0 8.6 11.8 27.2 12.3 34.0 21.4 a)
: : : : 3.0 11.0 2.8 : 2.6: : : : : : : : :
a) : : : 6.0 6.0 5.0 2.3 5.5 5.6a) : : : 0.7 1.7 4.5 3.5 4.7 3.2
: : : : : : : : :
3.4 Share of gross box office receipts from British films, %
Source: Eurostat, AUVIS domainData include taxes and other duties.Figures based on sample.a) Source: European Audiovisual Observatory
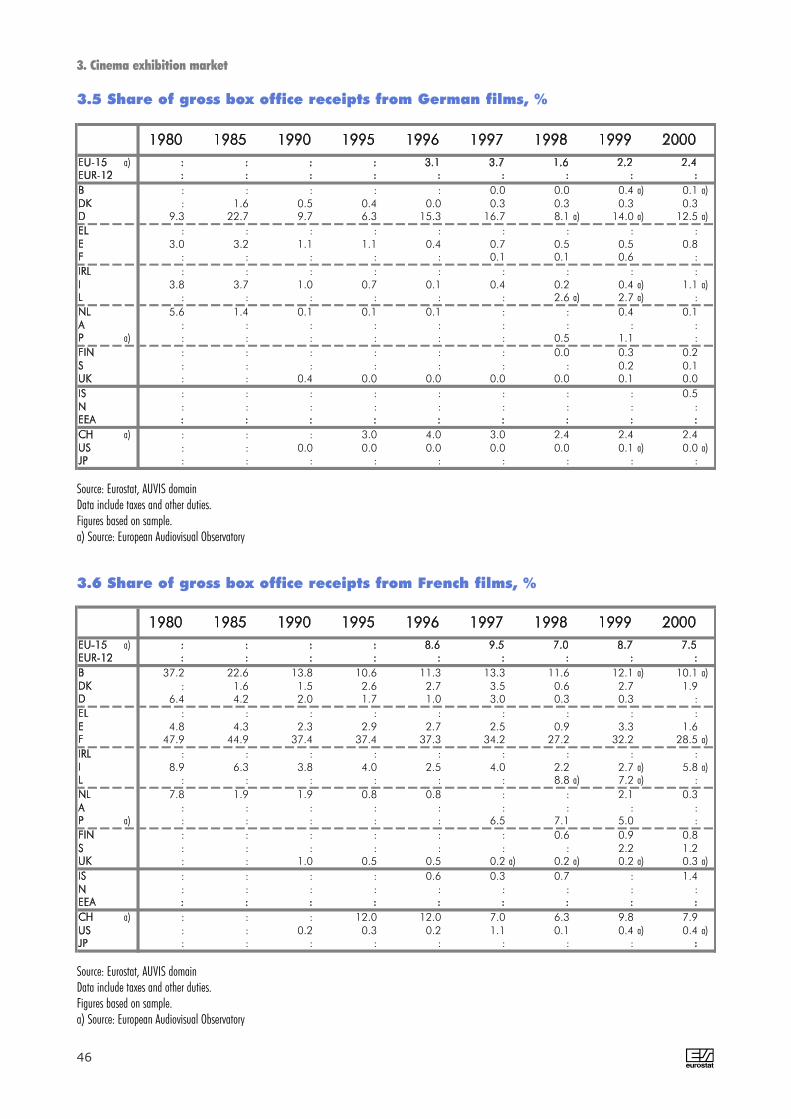
3. Cinema exhibition market
A46
a)
: : : : : 0.0 0.0 0.4 a) 0.1 a)
: 1.6 0.5 0.4 0.0 0.3 0.3 0.3 0.39.3 22.7 9.7 6.3 15.3 16.7 8.1 a) 14.0 a) 12.5 a)
: : : : : : : : :3.0 3.2 1.1 1.1 0.4 0.7 0.5 0.5 0.8
: : : : : 0.1 0.1 0.6 :: : : : : : : : :
3.8 3.7 1.0 0.7 0.1 0.4 0.2 0.4 a) 1.1 a): : : : : : 2.6 a) 2.7 a) :
5.6 1.4 0.1 0.1 0.1 : : 0.4 0.1: : : : : : : : :
a) : : : : : : 0.5 1.1 :: : : : : : 0.0 0.3 0.2: : : : : : : 0.2 0.1: : 0.4 0.0 0.0 0.0 0.0 0.1 0.0: : : : : : : : 0.5: : : : : : : : :
a) : : : 3.0 4.0 3.0 2.4 2.4 2.4: : 0.0 0.0 0.0 0.0 0.0 0.1 a) 0.0 a): : : : : : : : :
3.5 Share of gross box office receipts from German films, %
Source: Eurostat, AUVIS domainData include taxes and other duties.Figures based on sample.a) Source: European Audiovisual Observatory
a)
37.2 22.6 13.8 10.6 11.3 13.3 11.6 12.1 a) 10.1 a)
: 1.6 1.5 2.6 2.7 3.5 0.6 2.7 1.96.4 4.2 2.0 1.7 1.0 3.0 0.3 0.3 :
: : : : : : : : :4.8 4.3 2.3 2.9 2.7 2.5 0.9 3.3 1.6
47.9 44.9 37.4 37.4 37.3 34.2 27.2 32.2 28.5 a)
: : : : : : : : :8.9 6.3 3.8 4.0 2.5 4.0 2.2 2.7 a) 5.8 a)
: : : : : : 8.8 a) 7.2 a) :7.8 1.9 1.9 0.8 0.8 : : 2.1 0.3
: : : : : : : : :a) : : : : : 6.5 7.1 5.0 :
: : : : : : 0.6 0.9 0.8: : : : : : : 2.2 1.2: : 1.0 0.5 0.5 0.2 a) 0.2 a) 0.2 a) 0.3 a)
: : : : 0.6 0.3 0.7 : 1.4: : : : : : : : :
a) : : : 12.0 12.0 7.0 6.3 9.8 7.9: : 0.2 0.3 0.2 1.1 0.1 0.4 a) 0.4 a): : : : : : : :
3.6 Share of gross box office receipts from French films, %
Source: Eurostat, AUVIS domainData include taxes and other duties.Figures based on sample.a) Source: European Audiovisual Observatory

A 47
3. Cinema exhibition market
a)
: : : : : : 1.4 1.6 a) 0.3 a)
: 1.6 0.4 0.2 1.4 0.2 0.0 1.3 0.113.8 1.3 0.3 0.1 0.1 0.1 0.1 0.4 :
: : : : : : : : :13.0 3.1 2.1 0.6 1.6 0.4 0.3 3.5 0.2
: : : : : 0.1 2.1 0.8 :: : : : : : : : :
43.5 31.8 21.0 21.2 24.8 32.9 24.8 24.1 17.5a) : : : : : : 0.5 1.5 :
14.6 3.2 0.2 0.5 0.9 : : 1.9 0.1: : : : : : : : :
a) : : : : : 8.0 5.2 3.3 :: : : : : : 0.1 0.7 0.0: : : : : : : 0.8 0.1: : 0.5 0.2 0.2 : : : :: : : : 1.1 0.0 0.0 : 0.0: : : : : : : : :
a) : : : 2.0 6.0 2.0 3.2 2.4 2.1: : 0.3 1.7 0.3 0.0 0.2 0.9 a) 0.0 a): : : : : : : : :
3.7 Share of gross box office receipts from Italian films, %
Source: Eurostat, AUVIS domainData include taxes and other duties.Figures based on sample.a) Source: European Audiovisual Observatory
: : : : : : 0.3 : :: : : : : 0.1 0.3 0.5 0.5: : : : : : : : :: : : : : : : : :
20.2 16.2 10.4 12.2 9.3 13.0 12.0 14.0 10.0: : : : : 0.1 0.1 0.1 :: : : : : : : : :
0.6 0.5 0.9 : 0.9 0.6 0.1 : :: : : : : : : : :: : : : : : : 0.2 0.1: : : : : : : : :: : : : : : : : :: : : : : : 0.2 0.2 1.1: : : : : : : 0.6 1.0: : 0.3 : : : : : :: : : : : : : : 0.0: : : : : : : : :
: : : : : : : : :: : 0.1 : : : : : :: : : : : : : : :
3.8 Share of gross box office receipts from Spanish films, %
Source: Eurostat, AUVIS domainData include taxes and other duties.Figures based on sample.

3. Cinema exhibition market
A48
1980 1985 1990 1995 1996 1997 1998 1999 2000 2001EU-15 b) 1 037.6 705.9 576.7 641.5 702.2 759.7 819.5 812.0 844.5 945.5 p)EUR-12 897.6 605.2 472.8 520.6 558.3 594.3 657.2 645.4 674.3 :B 20.6 17.9 17.1 19.2 21.2 20.2 25.4 21.9 23.5 :DK 15.9 11.3 9.6 8.8 9.9 10.8 11.0 10.9 10.7 12.0D 143.8 104.2 102.5 124.5 132.9 143.1 148.9 149.0 152.5 177.9EL 43.0 23.0 13.0 8.2 9.0 11.6 12.4 13.0 (a) 13.5 (a) :E c) 176.0 101.1 78.5 94.6 104.3 105.0 112.1 131.3 135.4 :F 175.4 175.1 121.9 130.2 136.7 149.0 170.6 153.6 166.0 184.4 n)
IRL 9.5 4.5 7.4 9.8 m) 11.5 m) 11.5 m) 12.4 m) 12.5 m) 14.9 m) 15.9 m)
I 241.9 123.1 90.7 90.7 96.5 100.4 e) 117.4 e) 103.5 e) 103.4 a) :L 0.7 0.7 0.5 0.7 0.8 1.2 1.4 1.3 1.4 f) :NL 28.4 15.8 15.2 17.9 17.7 18.9 d) 20.1 d) 18.6 21.5 23.6 o)
A 17.5 13.1 10.1 11.9 11.8 13.7 d) 15.2 d) 15.0 (a) 16.3 (a) :P 30.8 20.0 9.6 7.4 10.4 13.7 14.8 18.6 g) 18.9 :FIN 9.9 6.7 6.2 5.3 5.5 5.9 h) 6.4 h) 7.0 h) 7.1 h) :S 23.1 17.5 15.7 15.2 15.4 15.2 15.8 16.0 i) 17.0 i) 18.1UK 101.0 72.0 78.6 96.9 118.7 139.3 j) 135.5 j) 139.8 j) 142.5 j) 155.9 m)
IS 1.8 1.4 1.2 1.2 1.3 1.5 1.5 1.5 1.6 :N 17.5 12.9 11.4 10.9 11.5 10.9 11.5 11.4 11.6 :EEA 1 056.9 720.3 589.3 653.7 715.0 772.1 832.5 824.9 857.7 :CH 21.0 16.5 14.3 14.9 15.1 15.6 15.9 15.4 (a) 15.6 (a) :US k) 1 021.5 1 056.1 1 188.6 1 262.6 1 338.6 1 387.7 1 480.7 1 465.2 1 420.8 1 487.3JP l) 165.9 155.1 145.5 127.0 119.6 140.7 153.1 144.8 135.3 :
3.9 Number of admissions, million
Source: Eurostat, AUVIS domaina) Source: European Audiovisual Observatory b) Eurostat estimate c) Source:Instituto de la Cinematografía y las Artes Audiovisuales( ICAA) d) Mediasalles (MS)e) Società Italiana Autori Editori (SIAE) f) Source: CNA g) Source: INE h) Source: Finnish Chamber of Film i) Source: SFI (Swedish Film Institute).j) Source: BFI Handbook, Screen Finance k) Source: Motion Picture Association of America l) Source: Motion Picture Producers Association of Japan m) Source: Carlton Screen Advertising n) Source: CNC o) Source: NFC p) Provisional Eurostat estimate, based on approximately 60% of EU admissions
a)
: : : 140 141 : 137 135 : 329 241 180 163 166 164 166 167 164
: : 1 721 1 921 1 917 1 817 b) 1 768 b) 1 730 1 722: : : : 322 : 319 322 :: : : 1 269 1 217 1 226 c) 1 329 c) 1 334 c) 1 298
3 053 2 842 2 300 2 218 2 150 2 159 2 152 2 163 :: : : 63 63 62 d) 64 d) 66 :: : : 2 086 2 050 2 157 e) 2 159 e) 2 259 e) 2 216: : 9 9 8 9 8 8 :: : : 163 160 154 d) 154 d) 183 181: : 264 237 234 237 d) 222 d) 234 :: : : 203 217 : : 338 f) 373 f)
317 305 264 242 236 234 233 237 228: : 920 854 845 847 839 815 813
942 663 737 743 735 747 759 692 686 12 8 6 31 31 30 25 25 25
406 429 330 275 274 262 d) 604 h) 605 h) 594 h)
: : : : 327 328 323 329g) : : : 7 744 7 798 7 480 7 418 7 551 7 421
: : : : : : : : :
3.10 Number of cinemas
Source: Eurostat, AUVIS domaina) Eurostat estimateb) the old data includes only Western Germany, the new data is for whole Dc) Source:Instituto de la Cinematografía y las Artes Audiovisuales( ICAA)d) Source: Media Salles (MS)
e) Società Italiana Autori Editori (SIAE)f) Source: IGACg) Source: Motion Picture Producers Association of Japanh) Includes municipal cinemas

A 49
3. Cinema exhibition market
Source: Eurostat, AUVIS domaina) Eurostat estimate, based on screens multiplied by the seats per screenb) Source: Media Salles (MS)c) Source: IGAC
d) Source: Finnish Chamber of Filme) Source: SFI (Swedish Film Institute).f) IS data 1980-1996: only include Reykjavik
1980 1985 1990 1995 1996 1997 1998 1999 2000 2001EU-15 a) : 22 421 18 771 19 669 20 691 21 413 22 665 24 907 25 421 :EUR-12 : 19 565 15 933 16 568 17 466 18 095 19 296 20 672 20 986 :B 500 440 411 423 440 438 463 463 465 :DK 475 429 347 313 322 320 328 345 350 :D 3 354 3 442 3 773 3 836 4 057 4 128 4 244 4 438 4 783 4 792 l)
EL : 600 500 350 340 340 360 380 : :E b) 4 096 3 109 1 773 2 090 2 354 2 565 3 025 3 354 3 500 :F 4 500 5 153 4 518 4 378 4 529 4 661 4 773 4 979 : :IRL 163 135 171 191 215 228 c) 261 c) 280 : :I 8 753 4 885 3 293 3 816 4 004 4 206 j) 4 603 j) : : :L 12 17 17 17 16 26 21 21 : :NL 563 511 471 484 493 444 c) 461 c) 523 562 :A 481 516 390 412 423 424 424 503 : :P 423 379 276 241 270 313 330 528 d) 558 d) :FIN 352 378 340 330 325 322 e) 331 e) 362 e) 343 e) :S 1 249 1 116 1 160 1 168 1 165 1 164 1 167 1 132 f) 1 131 f) :UK 1 576 1 311 1 331 1 620 1 738 2 383 g) 2 564 g) 2 758 g) 2 954 g) 3 428 k)
IS 15 21 22 23 26 50 45 46 47 :N c) 445 448 399 394 395 402 392 398 391 :EEA : 22 890 19 192 20 086 21 112 22 414 23 792 25 351 25 859 :CH 483 437 398 439 445 460 518 471 : :US h) 17 590 21 147 23 689 27 805 29 690 31 640 34 186 37 185 37 396 :JP i) 2 364 2 137 1 836 1 776 1 828 1 884 1 993 2 221 : :
3.11 Number of screens
Source: Eurostat, AUVIS domaina) Eurostat estimate b) Source:Instituto de la Cinematografía y las Artes Audiovisuales( ICAA) c) Source: Media Salles (MS)d) Source: IGAC e) Source: Finnish Chamber of Film f) Source: SFI (Swedish Film Institute). g) Source: BFI Handbook, Screen Financeh) Source: Motion Picture Association of America i) Source: Motion Picture Producers Association of Japan j) Società Italiana Autori Editori (SIAE) k) Source: Carlton Screen Advertising l) Source: FFA (German Federal Film Board)
a)
174 116 98 101 103 104 108 107 107
112 76 57 50 50 51 51 52 55 910 723 781 730 760 773 801 835 874
: : : : : : : : :
: 2 370 886 900 900 1 000 b) 1 150 b) 1 230 b) : 1 409 1 276 1 007 922 954 975 991 1 025 :
: 53 : 38 49 44 b) 50 b) 53 b) :
: : : : : : : : :: 4 4 3 3 5 4 4 :
159 122 102 94 96 89 b) 93 b) 98 105
146 129 77 73 70 75 76 72 : 237 185 111 71 77 82 : 162 c) 170 c)
94 88 66 58 57 56 d) 58 d) 63 d) 59 d)
: 240 223 207 203 199 199 193 e) 190 e) : : 472 552 567 603 b) 639 b) 710 b) :
f) 6 6 5 6 6 10 9 10 10
137 125 101 92 92 90 88 89 :
164 128 101 100 101 101 100 102 :: : : : : : : : :: : : : : : : : :
3.12 Number of seats, thousand

3. Cinema exhibition market
A50
: : : 3.0 3.1 : 3.4 3.4 :1.4 1.8 1.9 1.9 1.9 2.0 2.0 2.1 2.1
: : 2.2 2.0 2.1 2.3 2.4 2.6 2.8: : : : 1.1 : 1.1 1.2 :: : : 1.6 1.9 2.1 2.3 2.5 2.7
1.5 1.8 2.0 2.0 2.1 2.2 2.2 2.3 :: : : 3.0 3.4 3.7 4.1 3.9 :: : : 1.8 2.0 1.9 2.1 : :: : 1.9 1.9 2.0 2.9 2.6 2.6 :: : : 3.0 3.1 2.9 3.0 : 3.1: : 1.5 1.7 1.8 1.8 1.9 2.1 :: : : 1.2 1.2 : : 1.6 1.5
1.1 1.2 1.3 1.4 1.4 1.4 1.4 1.6 1.5: : 1.3 1.4 1.4 1.4 1.4 1.4 1.4
1.7 2.0 1.8 2.2 2.4 3.2 3.4 4.0 4.31.3 2.6 3.7 : : 1.7 1.8 1.8 1.91.1 1.0 1.2 1.4 1.4 1.5 0.6 0.7 0.7
: : : : 1.4 1.4 1.6 1.4 :: : : 3.6 3.8 4.2 4.6 4.9 5.0: : : : : : : : :
3.13 Screens per cinema
Source: Eurostat, AUVIS domain
: : : 1.4 1.4 : 1.3 1.3 :: : 3.5 3.1 3.2 3.1 3.1 3.1 3.1: : 2.2 2.4 2.3 2.2 2.2 2.1 2.1: : : : 3.1 : 3.0 3.1 :: : : 3.2 3.1 3.1 3.4 3.4 3.3: : 4.1 3.8 3.7 3.7 3.7 3.7 :: : : 1.8 1.7 1.7 1.7 1.9 :: : : 3.6 3.6 3.8 3.8 3.9 3.8: : 2.4 2.2 1.9 2.2 1.9 1.9 :: : : 1.1 1.0 1.0 1.0 1.2 1.1: : 3.4 2.9 2.9 2.9 2.7 2.9 :: : : 2.0 2.2 : : 3.4 3.7: : 5.3 4.7 4.6 4.6 4.5 4.5 4.4: : 10.8 9.7 9.6 9.6 9.5 9.2 9.2: : 1.3 1.3 1.3 1.3 1.3 1.2 1.2: : 2.4 11.6 11.6 11.1 9.2 9.1 9.0: : 7.8 6.3 5.9 6.0 13.7 a) 13.6 a) 13.3 a)
: : : : 4.6 4.6 4.6 4.6 :: : : 3.0 3.0 2.8 2.8 2.8 2.7: : : : : : : : :
3.14 Cinemas per 100 000 inhabitants
Source: Eurostat, AUVIS domain
a) Includes municipal cinemas

A 51
3. Cinema exhibition market
: : 4.1 4.2 4.3 4.3 4.5 4.5 4.5: : 6.8 6.0 6.1 6.1 6.2 6.5 6.6: : 4.8 4.7 5.0 5.0 5.2 5.4 5.8: : 4.9 3.4 3.2 3.2 3.4 3.6 :: : 4.6 5.3 6.0 6.5 7.7 8.5 8.9: : 8.0 7.5 7.8 8.0 8.1 8.4 :: : 4.9 5.3 5.9 6.2 7.1 7.5 :: : 5.8 6.7 7.0 7.3 8.0 : :: : 4.5 4.2 3.9 6.2 5.0 4.9 :: : 3.2 3.1 3.2 2.9 2.9 : 3.5: : 5.1 5.1 5.3 5.3 5.3 6.2 :: : 2.8 2.4 2.7 3.2 3.3 5.3 5.6: : 6.8 6.5 6.4 6.3 6.4 7.1 6.6: : 13.6 13.2 13.2 13.2 13.2 12.8 12.8: : 2.3 2.8 3.0 4.0 4.3 4.7 5.0: : 8.7 8.6 9.7 18.5 16.5 16.7 16.8: : 9.4 9.1 9.0 9.2 8.9 9.0 8.7
: : 6.0 6.3 6.3 6.5 7.3 6.6 :: : 9.5 10.6 11.2 11.9 12.7 13.7 13.6: : 1.5 1.4 1.5 1.5 1.6 1.8 :
3.15 Screens per 100 000 inhabitants
Source: Eurostat, AUVIS domain
41 41 42 45 48 46 55 47 5134 26 28 28 31 34 34 32 3143 30 27 32 33 35 35 34 32
: 38 26 23 26 34 34 34 :43 33 44 45 44 41 37 39 3939 34 27 30 30 32 36 31 :58 33 43 52 53 50 47 44 :28 25 28 24 24 24 26 : :54 39 32 40 47 46 67 63 :51 31 32 37 36 43 44 : 3836 25 26 29 28 32 36 30 :73 53 35 31 39 44 45 35 3428 18 18 16 17 18 19 19 2118 16 14 13 13 13 14 14 1564 55 59 60 68 58 53 51 48
: : : : : 30 34 33 3339 29 29 28 29 27 29 29 30
43 38 36 34 34 34 31 33 :58 50 50 45 45 44 43 39 3870 73 79 72 65 75 77 65 :
3.16 Admissions per screen, thousand
Source: Eurostat, AUVIS domain

3. Cinema exhibition market
A52
119 154 174 191 205 195 236 205 221142 149 168 177 198 214 218 212 194158 144 131 171 175 185 186 178 175
: : : : : : : : :: 43 89 105 116 105 98 107 :
125 137 121 141 143 153 172 150 :: 86 : 257 235 261 250 230 :: : : : : : : : :: 150 156 217 251 224 316 294 :
179 130 149 190 184 213 217 191 205120 102 132 164 168 182 202 208 :130 108 86 104 136 168 : 115 111106 76 93 91 96 107 111 112 120
: 73 70 73 76 77 80 83 89: : 167 176 209 231 212 197 :
290 243 226 207 200 141 166 159 161127 104 113 119 125 121 131 128 :
128 129 141 148 150 154 158 151 :: : : : : : : : :: : : : : : : : :
3.17 Admissions per seat
Source: Eurostat, AUVIS domain
347 264 239 238 235 237 233 231 229236 177 165 159 155 158 154 149 157271 210 207 190 187 187 189 188 183
: : : : : : : : :: 762 500 431 382 390 380 367 :
313 248 223 211 211 209 208 206 :: 389 : 200 227 193 190 189 :: : : : : : : : :: 259 207 182 188 204 213 213 :
282 238 217 195 194 201 201 : 187304 250 197 176 166 178 178 143 :561 489 403 295 284 261 : 306 304266 233 195 177 176 172 173 172 172
: 215 192 177 174 171 170 171 168: : 355 341 326 253 249 257 :: : : : : 209 203 209 208
309 278 253 234 234 224 224 224 :
339 293 254 229 226 219 194 216 :: : : : : : : : :: : : : : : : : :
3.18 Seats per screen
Source: Eurostat, AUVIS domain

A 53
3. Cinema exhibition market
: : 1.7 1.9 2.1 2.0 2.5 2.1 2.3: : 1.9 1.7 1.9 2.1 2.1 2.1 2.0: : 1.3 1.5 1.6 1.7 1.8 1.8 1.9: : 1.3 0.8 0.9 1.1 1.2 1.2 1.3: : 2.0 2.4 2.7 2.7 2.9 3.3 3.4: : 2.2 2.2 2.3 2.5 2.9 2.6 2.8: : 2.1 2.7 3.2 3.1 3.4 3.3 3.9: : 1.6 1.6 1.7 1.7 2.0 1.8 1.8: : 1.4 1.7 1.8 2.8 3.3 3.1 3.1: : 1.0 1.2 1.1 1.2 1.3 1.2 1.4: : 1.3 1.5 1.5 1.7 1.9 1.9 2.0: : 1.0 0.7 1.1 1.4 1.5 1.9 1.9: : 1.2 1.0 1.1 1.2 1.2 1.4 1.4: : 1.8 1.7 1.7 1.7 1.8 1.8 1.9: : 1.4 1.7 2.0 2.4 2.3 2.4 2.4: : 4.9 4.5 4.8 5.5 5.6 5.6 5.6: : 2.7 2.5 2.6 2.5 2.6 2.6 2.6
: : 2.1 2.1 2.1 2.2 2.2 2.2 2.2: : 4.8 4.8 5.1 5.2 5.5 5.4 5.2: : 1.2 1.0 1.0 1.1 1.2 1.1 1.1
3.19 Admissions per inhabitant
Source: Eurostat, AUVIS domain
2.6 3.1 3.8 5.0 5.1 5.4 5.2 5.2 5.42.6 3.4 4.3 5.6 6.0 6.0 6.5 6.6 7.02.5 3.3 3.9 5.1 5.2 5.2 5.5 5.4 5.4
: 1.8 3.2 4.3 4.3 5.2 4.9 : 5.21.3 1.9 2.8 3.1 3.3 3.4 3.6 3.8 4.02.7 3.7 4.5 5.3 5.4 5.3 5.3 5.4 5.4
: 5.1 3.4 3.5 3.5 3.4 3.7 : 4.41.4 2.8 4.4 4.1 4.6 5.0 5.0 5.1 3.81.8 2.7 4.3 5.1 5.2 5.5 5.6 5.6 5.62.7 3.9 4.8 5.2 5.3 5.6 5.8 5.6 5.9
: 3.6 4.0 5.4 5.7 6.0 5.7 5.8 5.70.7 1.2 1.6 2.6 2.9 3.0 3.1 3.3 3.22.6 5.2 6.1 6.4 6.2 6.2 6.4 6.5 6.63.4 5.0 6.7 6.2 7.1 7.1 7.4 7.5 8.02.4 2.9 4.8 5.0 4.8 5.2 5.6 6.2 6.61.8 4.1 5.3 6.5 6.2 6.7 6.7 7.9 8.71.7 3.5 4.2 4.9 5.2 5.6 5.9 6.1 5.7
3.0 4.8 5.9 8.4 8.4 8.0 7.9 : 8.61.9 4.7 3.3 3.3 3.5 4.0 4.2 4.8 5.83.1 6.2 6.4 10.1 9.0 9.2 8.6 10.4 12.6
3.20 Average ticket price, ECU/EUR
Source: Eurostat, AUVIS domain
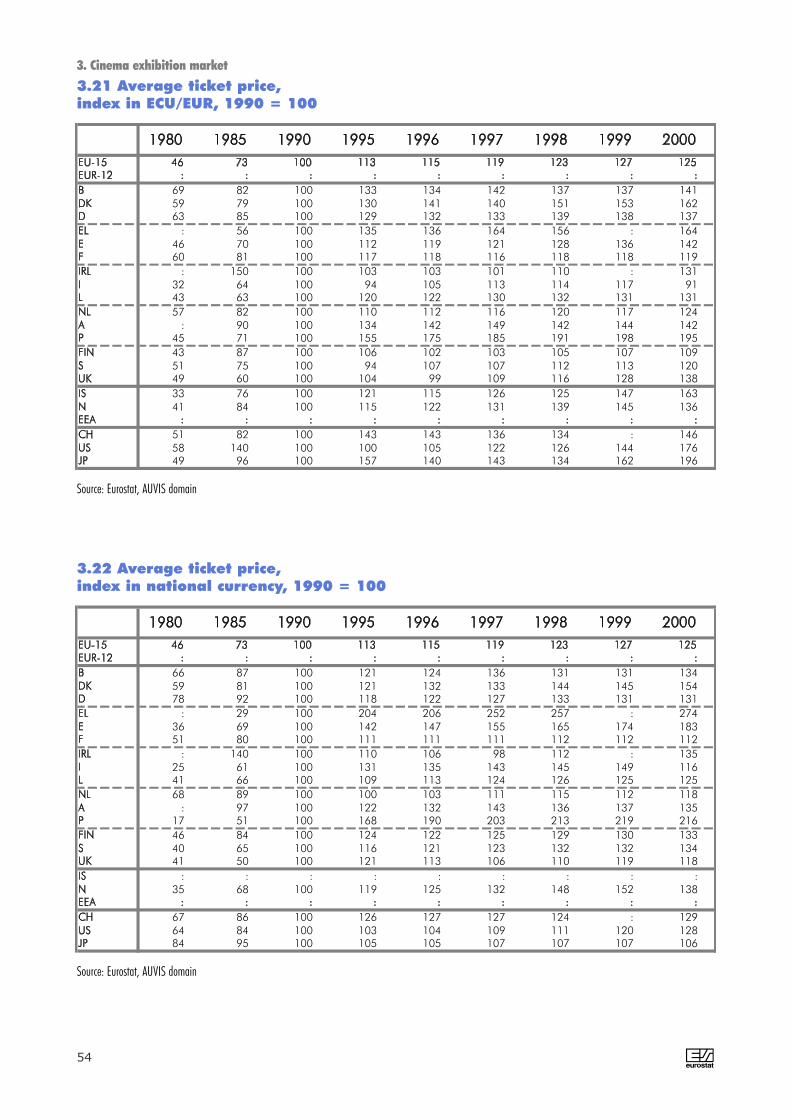
3. Cinema exhibition market
A54
69 82 100 133 134 142 137 137 14159 79 100 130 141 140 151 153 16263 85 100 129 132 133 139 138 137
: 56 100 135 136 164 156 : 16446 70 100 112 119 121 128 136 14260 81 100 117 118 116 118 118 119
: 150 100 103 103 101 110 : 13132 64 100 94 105 113 114 117 9143 63 100 120 122 130 132 131 13157 82 100 110 112 116 120 117 124
: 90 100 134 142 149 142 144 14245 71 100 155 175 185 191 198 19543 87 100 106 102 103 105 107 10951 75 100 94 107 107 112 113 12049 60 100 104 99 109 116 128 13833 76 100 121 115 126 125 147 16341 84 100 115 122 131 139 145 136
51 82 100 143 143 136 134 : 14658 140 100 100 105 122 126 144 17649 96 100 157 140 143 134 162 196
3.21 Average ticket price, index in ECU/EUR, 1990 = 100
Source: Eurostat, AUVIS domain
66 87 100 121 124 136 131 131 13459 81 100 121 132 133 144 145 15478 92 100 118 122 127 133 131 131
: 29 100 204 206 252 257 : 27436 69 100 142 147 155 165 174 18351 80 100 111 111 111 112 112 112
: 140 100 110 106 98 112 : 13525 61 100 131 135 143 145 149 11641 66 100 109 113 124 126 125 12568 89 100 100 103 111 115 112 118
: 97 100 122 132 143 136 137 13517 51 100 168 190 203 213 219 21646 84 100 124 122 125 129 130 13340 65 100 116 121 123 132 132 13441 50 100 121 113 106 110 119 118
: : : : : : : : :35 68 100 119 125 132 148 152 138
67 86 100 126 127 127 124 : 12964 84 100 103 104 109 111 120 12884 95 100 105 105 107 107 107 106
3.22 Average ticket price, index in national currency, 1990 = 100
Source: Eurostat, AUVIS domain

A 55
3. Cinema exhibition market
1980 1985 1990 1995 1996 1997 1998 1999 2000 2001EU-15 a) 367 325 260 259 275 277 280 291 307 :EUR-12 386 343 271 271 288 291 293 305 335 :B 135 385 343 518 477 573 480 396 : :DK 263 227 172 151 183 170 176 176 192 :D 334 309 303 260 287 286 287 327 373 :EL : 304 145 183 168 135 b) 169 b) 154 b) 191 b) :E 500 456 328 417 524 481 c) 501 c) 479 c) 523 c) :F 694 456 370 405 410 417 470 504 540 :IRL : : 145 168 184 166 156 b) : : :I 541 354 461 342 390 380 d) 383 e) 420 e) 415 c) :L : 266 220 144 140 231 218 221 289 b) :NL 336 295 187 254 256 227 232 f) 247 272 :A 304 384 292 241 254 249 f) 260 f) 242 : :P 395 : 289 185 207 200 212 b) 181 241 g :FIN 236 218 172 138 162 145 148 188 170 h) :S 302 247 212 204 203 201 186 210 i) 223 i) :UK : : : 280 j) 284 j) 292 j) 324 j) 333 j) 349 j) 369 j)
IS 216 233 179 189 198 188 157 193 164 :N 261 268 181 205 202 218 229 : : :EEA 347 314 250 252 266 268 270 : : :CH : 346 343 : 332 329 350 b) : : :US k) 191 389 385 370 420 461 490 442 461 462JP l) 528 583 704 610 598 611 555 568 644 :
3.23 New feature films released for the first time
Source: Eurostat, AUVIS domain a) Eurostat estimate; Reflects average per country b) Source: European Audiovisual Observatory c) Source:Instituto de laCinematografía y las Artes Audiovisuales( ICAA) d) Società Italiana Autori Editori (SIAE) e) ANICA (trade organisation of film producers) f) Source: MediaSalles (MS) g) Source: IGAC h) Source: Finnish Chamber of Film i) Source: SFI (Swedish Film Institute) j) Source: BFI Handbook, BFI/EDI. Filmsreleased during the year, including re-releases of old films. k) Source: Motion Picture Association of America l) Source: Motion Picture Producers Association ofJapan
a)
2 3 7 24 31 31 30 : :
14 10 13 13 22 17 23 22 21 49 64 48 63 64 61 50 74 75
27 33 6 17 10 2 b) 4 b) 5 b) 12 b)
: 65 33 59 93 80 c) 65 c) 82 c) 98 c) 238 158 129 149 161 170 176 183 :
0 2 : 8 5 4 9 : :
160 89 119 75 109 87 d) 92 e) 108 e) 103 e): 2 1 3 2 2 3 1 :
7 16 14 38 36 32 f) 20 28
8 18 19 22 15 30 f) 24 f) : : 9 : 4 13 6 7 : : 14 g)
10 13 14 8 10 9 8 16 9 h)
24 20 16 24 27 30 20 23 i) 38 i) : : : 49 38 82 j) 75 j) 99 j) :
3 3 2 7 2 4 2 2 6
10 10 10 18 13 18 14 : :
: : 25 : : : 28 : :k) : 257 287 : : 394 : : :l) 320 319 239 289 278 278 249 270 282
3.24 New feature films of national origin released for the first time
Source: Eurostat, AUVIS domain a) Eurostat estimate; Reflects average per country b) Source: Ministry of Press and Mass Media c) Source:Instituto de laCinematografía y las Artes Audiovisuales( ICAA) d) Società Italiana Autori Editori (SIAE) e) ANICA (trade organisation of film producers) f) Source: MediaSalles (MS g) Source: IGAC h) Source: Finnish Chamber of Film i) Source: SFI (Swedish Film Institute) j) Source: BFI Handbook, BFI/EDI. Filmsreleased during the year, including re-releases of old films. k) Source: Motion Picture Association of America l) Source: Motion Picture Producers Association ofJapan

3. Cinema exhibition market
A56
Source: Eurostat, AUVIS domain a) Eurostat estimate; Reflects average per country b) Source : Ministry of Press and Mass Media c) Source:Instituto de laCinematografía y las Artes Audiovisuales( ICAA) d) Società Italiana Autori Editori (SIAE) e) ANICA (trade organisation of film producers) f) Source: MediaSalles (MS) g) Source: IGAC h) Source: Finnish Chamber of Film i) Source: SFI (Swedish Film Institute) j) Source: BFI Handbook, BFI/EDI. Filmsreleased during the year, including re-releases of old films. k) Source: Motion Picture Producers Association of Japan
a)
70 : 129 182 192 218 200 : :
84 64 31 46 65 69 62 : : 152 152 121 104 121 120 109 156 162
: 112 24 : : 28 b) 58 b) 30 b) 50 b)
: : : : : 243 c) 225 c) 244 c) 239 c) 337 213 160 204 205 228 255 264 :
: : : 38 38 45 39 : :
344 175 202 133 182 166 d) 178 e) 212 e) 190 e): 116 : 38 39 80 79 : :
143 96 40 : : : : 85 114
158 166 106 88 92 98 f) : f) : : : : 76 : 49 : : : 93 g)
80 51 45 33 42 35 27 67 42 h)
: : : 78 81 73 58 80 i) 88 i) : : : 78 79 107 j) 125 j) 174 j)
63 35 18 32 32 30 19 : 29
: : : : : : : : :
: : : : : : : : :: : : : : : : : :
k) : : : : : 95 102
3.25 New feature films of EU origin released for the first time
a)
63 : 177 263 204 265 217 : :
144 139 120 91 110 89 101 95 108 109 146 155 135 150 135 146 132 165
: 178 116 114 107 100 b) 103 b) 120 b) 134 b)
: 179 173 191 207 212 c) 240 c) 216 c) 257 c) 135 121 138 139 141 144 173 180 :
: : : 112 133 115 114 : :
141 152 227 179 189 182 d) 183 e) 178 e) : : 118 110 90 91 130 120 112 :
141 192 118 121 138 130 120 f) 119 116
107 192 154 129 142 121 f) 132 f) : : 131 : 187 89 138 133 : : 136 g)
111 125 110 86 87 88 82 100 105 h)
145 141 112 95 104 108 106 108 i) 120 i) : : : 153 170 153 j) 159 j) 148 j)
135 189 158 140 159 149 133 158 132
131 150 115 107 114 121 126 : :
: 171 196 : : : : : :: 257 287 : : 394 : : :
k) 141 180 248 176 175 169 152 158 :
3.26 New feature films of US origin released for the first time
Source: Eurostat, AUVIS domain a) Eurostat estimate; Reflects average per country b) Source : Ministry of Press and Mass Media c) Source:Instituto de laCinematografía y las Artes Audiovisuales( ICAA) d) Società Italiana Autori Editori (SIAE) e) ANICA (trade organisation of film producers) f) Source: MediaSalles (MS) g) Source: IGAC h) Source: Finnish Chamber of Film i) Source: SFI (Swedish Film Institute) j) Source: BFI Handbook, BFI/EDI. Filmsreleased during the year, including re-releases of old films. k) Source: Motion Picture Producers Association of Japan

A 57
3. Cinema exhibition market
52 : 38 35 40 38 42 : :32 28 18 30 36 41 35 : :46 49 40 40 42 42 38 48 43
: 37 17 : : 21 34 19 26: : : : : 51 45 51 46
49 47 43 50 50 55 54 52 :: : : 23 21 27 25 : :
64 49 44 39 47 44 46 50 :: 44 : 26 28 35 36 : :
43 33 21 : : : : 34 4252 43 36 37 36 39 : :
: : 26 : 24 : : : 3934 23 26 24 26 24 18 36 25
: : : 38 40 36 31 38 39: : : 31 30 37 39 52 :
29 15 10 17 16 16 12 : 18: : : : : : : : :
: : : : : : : : :: : : : : : : : :
a) : : : : : 16 18 : :
3.27 New feature films of EU origin released for the first time, share of total in %
Source: Eurostat, AUVIS domain
a) Source: Motion Picture Producers Association of Japan
47 : 52 51 43 46 45 : :55 61 70 60 60 52 57 54 5633 47 51 52 52 47 51 40 44
: 59 80 62 64 74 61 78 70: 39 53 46 40 44 48 45 49
19 27 37 34 34 35 37 36: : : 67 72 69 73 : :
26 43 49 52 48 48 48 42 :: 44 50 63 65 56 55 51 :
42 65 63 48 54 57 52 48 4335 50 53 54 56 49 51 : :33 : 65 48 67 67 : : 5647 57 64 62 54 61 55 53 6248 57 53 47 51 54 57 51 54
: : : 60 65 52 49 44 :63 81 88 74 80 79 85 82 8050 56 64 52 56 56 55 : :
: 49 57 : : : : : :: : : : : : : : :
a) 27 31 35 29 29 28 27 28 :
3.28 New feature films of US origin released for the first time,share of total in %
Source: Eurostat, AUVIS domain
a) Source: Motion Picture Producers Association of Japan


4. Video and DVD market

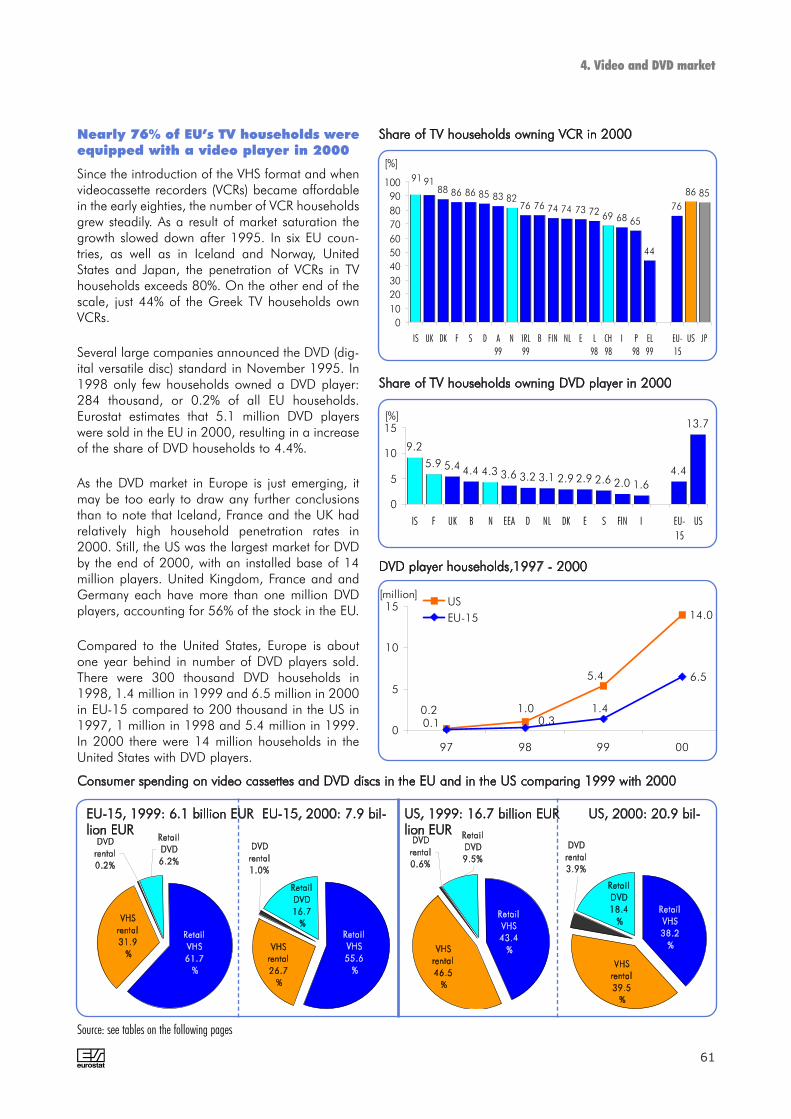
A 61
Nearly 76% of EU’s TV households wereequipped with a video player in 2000
Since the introduction of the VHS format and whenvideocassette recorders (VCRs) became affordablein the early eighties, the number of VCR householdsgrew steadily. As a result of market saturation thegrowth slowed down after 1995. In six EU coun-tries, as well as in Iceland and Norway, UnitedStates and Japan, the penetration of VCRs in TVhouseholds exceeds 80%. On the other end of thescale, just 44% of the Greek TV households ownVCRs.
Several large companies announced the DVD (dig-ital versatile disc) standard in November 1995. In1998 only few households owned a DVD player:284 thousand, or 0.2% of all EU households.Eurostat estimates that 5.1 million DVD playerswere sold in the EU in 2000, resulting in a increaseof the share of DVD households to 4.4%.
As the DVD market in Europe is just emerging, itmay be too early to draw any further conclusionsthan to note that Iceland, France and the UK hadrelatively high household penetration rates in2000. Still, the US was the largest market for DVDby the end of 2000, with an installed base of 14million players. United Kingdom, France and andGermany each have more than one million DVDplayers, accounting for 56% of the stock in the EU.
Compared to the United States, Europe is aboutone year behind in number of DVD players sold.There were 300 thousand DVD households in1998, 1.4 million in 1999 and 6.5 million in 2000in EU-15 compared to 200 thousand in the US in1997, 1 million in 1998 and 5.4 million in 1999.In 2000 there were 14 million households in theUnited States with DVD players.
4. Video and DVD market
14.0
6.55.4
1.00.2 1.40.30.1
0
5
10
15
97 98 99 00
USEU-15
[million]
88 86 86 85 83 8276 76 74 74 73 72 69 68 65
44
76
86 859191
0102030405060708090
100
IS UK DK F S D A
99
N IRL
99
B FIN NL E L
98
CH
98
I P
98
EL
99
EU-
15
US JP
[%]
Source: see tables on the following pages
9.2
5.9 5.4 4.4 4.3 3.6 3.2 3.1 2.9 2.9 2.6 2.0 1.64.4
13.7
0
5
10
15
IS F UK B N EEA D NL DK E S FIN I EU-
15
US
[%]
Retail DVD9.5%
Retail VHS43.4
%
DVD rental0.6%
VHS rental46.5
%

A62
The total video and DVD marketincreased by 30% in 2000
The total video and DVD market in the EUincreased by 1.8 billion EUR (+30%) reaching 7.9billion euro in 2000. The US market increased25%, totalling 21 billion euro. Sales of pre-recorded videocassettes still account for themajority of sales in the EU (55%), but the formatlost 6 percentage points compared to 1999. Thiswas mainly due to the gain of market share forretail DVD sales, which increased 0.9 billion euro(17% of the market). Including sales and rental,the DVD format accounts for 18% of the turnoverin the EU and 22% in the US. A large differencebetween the US and the EU is the VHS rental mar-ket: 40% in the US against 27% in the EU.
Decrease in rental outlets and increasein sales outlets
There has been a decline of 35% in the number ofrental outlets in the Nineties: from 40 thousand in1990 to 26 thousand in 1999. During the sametime, the number of outlets selling videos hasincreased in most countries.
While there were more outlets renting than sellingvideos in 1990, in 1995 there were nearly twiceas many outlets selling as renting videos in most ofthe countries with available data. Between 1995and 1999 the growth was more moderate, withthe number of outlets selling videos in Europeincreasing from 40 to 43 thousand.
One exception was Iceland with more than 6times as many rental stores than selling stores,which is reflected in the spend on rentals per capi-ta.
Big differences in outlet densityamong EU Member States
Sweden has the highest number of outlets sellingvideos per 100 000 inhabitants (56.5), followedby Ireland (44.7) and Denmark (29.4). The aver-age in the EU-15 is 11.3, lower than in the UnitedStates (19.1) and Japan (14.7). On the other endof the scale was Greece with just 1.4 shops per100 000 inhabitants, followed by Italy (6.1) andPortugal (7.7).
Iceland had the highest density of stores rentingvideos (72.5 outlets per 100 000 inhabitants). Inthe EU-15, Denmark is highest (39.9), followed byIreland (26.8) and Finland (19.4). France is lowestwith just 1.5 outlets per 100 000 inhabitants rent-ing videos.
4. Video and DVD market
56
44 43
29 29
2016 16
13 129 9 9 8 8 6
1
11
0
10
20
30
40
50
60
S IRL N DK FIN CH B NL IS D A F UK E P I EL EU-
15
40 247
42 53043 49342 80039 500
26 60327 100 27 77824 08424 521
0
10 000
20 000
30 000
40 000
50 000
90 95 96 97 98 99
outlets selling videos
outlets renting videos
73
40
27
19
13 117 7 7 7 6 6 5 5 4 4 4 2
7
0
10
20
30
40
50
60
70
80
IS DK IRL FIN E N NL B S UK D I P EL A CH L F EU-
15
Source: see tables on the following pages

a) Eurostat estimate
A 63
EU-15 citizens spend more per capita onbuying than renting videocassettes
The value of the video market (sales + rentals ofpre-recorded video cassettes) of the EU-15 in 2000was 6.5 billion euro, which is only 40% of the sizeof the US market: 16.3 billion euro. The value ofthe Japanese video market in 1998 was 4 billioneuro.
In 1990, rental of videocassettes dominated in theEU-15 (63%), the United States (71%) and Japan(79%). Since the mid nineties, the sales dominatedin the EU with two thirds of the turnover. In the US,the sales increased threefold during the nineties,while the rentals increased marginally, resulting inequally large market shares. In Japan, the sales ofvideo-cassettes also increased threefold, but rentalsstill dominated with two thirds of the total videomarket in 1998.
Two thirds of the total turnover in the EU-15 camefrom three Member States: United Kingdom (1.8billion euro from sales and 0.7 billion euro fromrentals), France (0.8 billion euro and 0.2 billioneuro) and Germany (0.4 billion euro and 0.3 billioneuro).
If comparing the turnover per capita, the disparitiesare significant. Sales of video cassettes per capitareached 11.6 euro in the EU-15, which was onethird of the sales per capita in the United States, butat the same level as Japan. Among the EU MemberStates, only the UK (30.4 EUR per head) reaches theUnited States' spend on buying videocassettes.Second was Denmark with 16 euro followed byFrance with 14 euro per head. The lowest spend onvideo sales was recorded in Greece, Portugal andSpain (0.6 euro, 3.2 euro and 4.2 euro per head).
EU-15 citizens spend half as much (5.6 euro percapita) on renting videocassettes as on buying. Theaverage American spends similar amounts on rent-ing and buying (30 EUR and 29 EUR per headrespectively). No other country in this comparisonspends more on video rentals per capita thanIceland (37 euro), which also can explain the rela-tively high number of outlets renting videos.
DVD equipment: 1.6 billion euro spendon DVD players in the EU in 2000
According to EAO, the French invested 327 millioneuro on DVD players. The British spent slightly less:287 million euro, followed by the Germans (252million euro). Eurostat estimates the average DVDplayer purchase amounted to 320 euro in 2000.
4. Video and DVD market
0.750.57
0.340.210.15 0.14 0.08 0.04
0.020.070.110.15
0.004
1.03
2.54
0.0
0.5
1.0
1.5
2.0
2.5
3.0
UK F99
D I 99 E NL DK99
S B IRL99
A99
FIN P99
EL99
L97
[bn EUR]
49 48
51 51 48 45
29
66 67 66 66 68 67
37
34 31 30
26 21
0
10
20
30
40
50
60
70
90 95 96 97 98 99 00
USEU-15JP
[%]
Source: see tables on the following pages
EU-15 a) : : 1,640
B 2 11 20DK : : :D 29 117 252EL : : :E 7 35 87F 3 177 327IRL : : :I 7 33 74L : : :NL 4 29 58A 2 7 19P : : :FIN : : :S : : 36UK 16 125 287IS : : :N : : :CH 7 25 46
Household expenditure on DVD players,1000 EUR, Source: European Audiovisual Observatory

A64
4. Video and DVD market
The two Member States with the highest number ofoutlets renting videos also had the highest spendon renting video cassettes per capita: Ireland (19.8euro) and Denmark (13.2 euro). Greeks andPortuguese spend only little on video rentals.
Sales of video cassettes soaring
Nearly 288 million videocassettes were sold in theEU-15 in 2000, of which 97 million (34% of theEU-15) in the UK. Despite a relatively large shareof the EU-15 sales, the British video sales per VCRhousehold were almost half as high as theAmericans': 4.4 cassettes against 8.0. In the EU-15, the average purchases were just 2.6 cassettesper VCR household.
The market for selling videocassettes in the EU-15has increased threefold since 1990, while therentals of videocassettes have decreased 20% dur-ing the same period. The situation is similar in theUnited States. Sales increased threefold in theUnited States, whilst rentals decreased 19%. InJapan, sales doubled during the same period, butJapanese VCR owners only buy one videocassetteper year, on average. In Japan, rentals still play adominant role, as the number of videocassettesrented increased to 849 million (+15%) from1990 to 1998, i.e. the average Japanese VCRhousehold rented videos 25 times per year.
The average EU-15 VCR household rents video-cassettes 6.7 times per year. Video cassette rentalis nearly five times as popular in the American VCRhouseholds: 37.7 times per year. Among the EUMember States, only Ireland shows high levels ofvideo rentals: 31.9 rentals per video householdand year. Spain was second with 9.9 rentals perVCR household per year. It was popular to rentvideos in Iceland, Canada and Australia (35.1,26.1 and 26.0 rentals per year per VCR householdrespectively).
Cheaper to rent and buy a video cas-sette in the United States than in EU-15
The average price per videocassette sold in the EUwas 15.2 euro in 2000. The average sales pricewas much higher in Japan, 32.4 ECU (data for1997), which may explain the relatively low salesfigures. The average sales price in the UnitedStates was 25% lower than the average EU-15price: 11.4 euro.
Also the average rental price for a videocassette inthe EU-15 was 12% higher than in the UnitedStates (2.8 euro versus 2.5 euro).
2.8 2.8 2.6 2.5
3.13.3
1.8
2.3
3.5
2.8
1.2
2.0
2.52.72.82.9
3.33.53.73.9
4.7
0
1
2
3
4
5
S UK CH
99
IS
99
DK N F B NL FIN A
99
IRL
99
D L I E P
99
EL
99
EU-
15
US JP
98
[EUR]
13.6 13.5 12.7 12.0 11.9 10.9 10.1
32.4
24.6
18.716.9
14.3 13.5 13.1 12.5 11.9 11.8 10.511.4
15.2
0
5
10
15
20
25
30
35
IS
99
UK CH
99
F
99
P
97
N EL
99
A
99
DK FIN IRL
99
B E D NL S I
99
EU-
15
US JP
97
[EUR]
4.4 4.3
3.1 3.1 2.9 2.72.2 2.2 2.2 2.0 1.9 1.9 1.8
1.6 1.5 1.4
2.6
8.0
1.3
0.32
0
1
2
3
4
5
6
7
8
9
UK P
98
IRL
99
F I
99
DK IS CH
98
FIN B N S NL A
99
E D EL
99
EU-
15
US JP
97
Source: see tables on the following pages

A 65
52.2 million DVD discs sold in 2000 in theEU
The DVD market is expected to expand strongly in thenear future: The DVD drives will be considered asstandard equipment on PCs. The European launch ofPlayStation2 in 2000 and Xbox in 2002 (game con-soles including DVD) will most likely encourage thedevelopment of the DVD market. Increased competi-tion from new manufacturers entering the Europeanmarket has led to decreasing retail prices on playersand boosts sales in the lower market segments. Asseen in DVD-Video, highly competitive pricing at theretail level helped boost the market to some 194 mil-lion units sold in 1999 worldwide, with a 474 millionforecast for 2000 according to the InternationalRecording Media Association.
Since its 1997 introduction, DVD technology hasgained on VHS and VCRs. DVD players use CD-sizedisks to play full-length films with sharp video imagesand dynamic sound.
In 2000, 6.5 million EU-15 households owned a DVDplayer.
EU households bought 52.2 million discs in 2000generating a total turnover of 1.4 billion euro.Compared to 1999, the revenues increased 256%,confirming the potential for growth of this new tech-nology. Three quarter of the sales turnover came fromthree countries: United Kingdom, France andGermany. According to British Video Association,37.7 million DVD discs were sold in the UK in 2001,compared with 16.6 million in 2000. DVDs populari-ty increased also because of the extras they contain:director’s cuts and commentaries, outtakes, interviewsand behind-the-scenes footage.
DVD households seem to be more active in buyingDVD discs (8 per DVD household) than VCR house-holds buying video cassettes (with only 2.6 video cas-settes sold per VCR household), even though the aver-age DVD disc is nearly twice as expensive as the aver-age video cassette (26 euro against 15 euro).
Among rentals, VHS still dominates. In 2000, 752 mil-lion VHS videos were rented at EU video stores. ButDVD film rentals increased in 2000 to 27 million, upfrom 5 million in 1999.
Video and DVD revenues are very important to filmstudios because they often represent more than half ofa film's overall revenue. Film exhibition (cinema +VHS + DVD) in 2000 amounted to 10.5 billion euro,of which 54% was spend on VHS, 42% on cinema
4. Video and DVD market
0 50
100 150 200 250 300 350 400 450 500
1999 2000
US rentedEU-15 rentedUS soldEU-15 sold
[million]
0.1 0.50.50.70.91.21.9
2.63.03.2
8.2
12.5
16.6
8.0
0.30.20.40.7
3.0
1.9
5.2
2.4
0.3 0
2
4
6
8
10
12
14
16
18
IRL EL A UK F D I E B NL S DK P FIN
Sold Rented
[million]
Source: see tables on the following pages
25.826.0
24.824.3
3.53.3
3.7
0
5
10
15
20
25
30
98 99
EU-15 averageDVD consumerprice
US average DVDconsumer price
EU-15 averageovernight DVDrental charge
US averageovernight DVDrental charge
[EUR]

66
4. Video and DVD market
exhibition and 4% on DVD.
Among the EU Member States, Belgians, Danes andBritish buy most DVD discs per DVD player house-hold (13.5, 12.9 and 12.3 respectively). The aver-age number of titles released on DVD per EU coun-try was rather small in 1999 compared to the videocassette releases: More than 1 500 titles on video,against 597 on DVD.
On average, 597 different titles for sale werereleased in 1999 per EU country. In the Germanand English speaking countries the number of titleson DVD reached 1 000 different titles.
New DVD film sales made up about half of overallsales and have kept pace with older films released inDVD format.
The average price per DVD disc in the EU-15 was26 euro in 2000. The average sales price in theUnited States was 4% lower than the average EU-15price: 25 euro.
The average rental price for a DVD disc in the EU-15 was 3.5 euro, slightly cheaper than in the US(3.7 euro).
24.5 24.3 22.1 21.0
24.0 26.3 26.7 28.1
29.7
4.64.02.8 2.54.7
3.03.3
0
5
10
15
20
25
30
35
F NL DK UK B S E I D
Average DVD consumer price
Average overnight DVD rental charge
[EUR]
Source: see tables on the following pages
1980 1985 1990 1995 1996 1997 1998 1999 2000EU-15 a) : : 58.56 89.32 95.74 100.23 103.47 106.65 111.93EUR-12 a) : : 41.76 66.49 71.68 75.11 77.61 81.75 84.17B 0.04 0.52 1.51 2.27 2.79 2.92 b) 3.01 b) 3.09 e) 3.20 e)DK 0.04 0.35 0.84 1.63 1.71 1.92 c) 1.99 c) 2.01 c) 2.43D : 5.45 13.32 21.80 22.82 23.71 24.13 24.90 25.70EL : : 0.85 1.17 1.25 1.31 d) : d) 1.47 d) :E 0.04 1.60 4.75 6.30 6.45 : : : 9.10 e)F 0.23 2.75 9.39 15.59 : 16.00 17.00 17.50 18.00IRL : : 0.51 0.74 0.77 0.81 e) 0.84 e) 0.88 e) :I : 0.79 5.47 9.43 11.15 13.14 13.15 13.65 13.85L : : 0.06 0.10 0.10 0.11 0.12 f) : :NL 0.15 1.26 3.00 4.43 4.66 4.85 : 5.17 5.22A 0.04 0.25 1.04 1.98 2.10 2.23 2.34 2.57 :P : : 0.88 1.34 : : 1.97 : :FIN 0.00 0.30 0.97 1.36 1.44 1.64 g) 1.65 g) 1.70 g) 1.67S 0.14 0.84 2.24 3.08 3.33 3.31 3.42 3.29 h) 3.33UK 0.58 8.44 13.73 18.14 19.02 19.89 : 19.60 e) 22.00 e)IS : 0.02 0.06 0.08 0.08 0.08 i) 0.08 i) 0.08 i) 0.09N 0.02 0.34 0.79 1.14 1.27 1.39 1.50 1.51 e) 1.60 e)EEA a) : : 59.41 90.54 97.09 101.70 105.05 108.24 113.62CH : : 1.08 1.82 1.92 1.99 2.04 : :US j) 1.85 23.50 65.36 75.80 78.80 80.36 84.10 85.80 88.12JP 1.98 15.15 28.29 34.97 36.04 37.42 : 39.60 40.00 e)
4.1 VCR households, million
Source: Eurostat, AUVIS domain a) Eurostat estimate based on extrapolation of Screen Digest/IVF data where Eurostat data are not available b) Source: Householdbudget survey (EBM) 96-97 and 97-98, beginning of the year c) Source= AVL (BFE) d) Source : Hellenic Audiovisual Institute (IOM) e) Source: ScreenDigest/IVF f) SOURCE:Enquête "budget des ménages 1998" : 75% g) Finnpanel, TV-household surveys h) Source: Dagspresskollegiet at Göteborg University(Newspaper research programme at Göteborg University). i) Estimates from different sources: Screen Digest (SD) and Social Science Research Institute at theUniversity of Iceland (Consumer Surveys) (SSRI)/SI j) Source Nielsen Media Research
A
DVD households in EU-15 rented an average of 4.2 DVDfilms in 1999 while VCR owners rented about 6.7 VHSfilms.
European market shows different consumption prefer-ences: French buy the DVDs while the Dutch rent.

A 67
EU-15 a) : : : : : 81.8 283.6 1 351.9 6 490.4EUR-12 a) : : : : : 75.7 245.7 1 078.0 4 959.0B : : : : : 0.6 6.6 54.6 189.2 d)
DK : : : : : 1.1 8.0 b) 20.0 b) 69.6 d) D : : : : : 1.5 39.5 320.0 1 100.0EL : : : : : 0.4 3.4 15.4 :E : : : : : 0.0 40.0 125.0 362.5 d)F : : : : : 70.0 118.0 359.0 1 188.0IRL : : : : : 0.1 0.7 7.7 :I : : : : : 1.5 18.0 z) 83.0 z) 324.8 d)L : : : : : 0.0 0.2 1.5 :NL : : : : : 0.9 9.9 68.9 210.8 d)
A : : : : : 0.3 2.3 17.3 :P : : : : : 0.0 4.0 12.5 :FIN : : : : : 0.4 3.1 13.1 45.0 c)
S : : : : : 1.0 5.9 30.9 111.8 d)UK : : : : : 4.0 24.0 f) 223.0 f) 1 350.0 d)
IS : : : : : 0.0 0.5 e) 1.7 e) 9.0N : : : : : 0.5 2.7 22.7 86.0 d)EEA a) : : : : : 82.3 286.8 1 376.3 6 585.4CH : : : : : 0.0 5.7 50.7 :US g) : : : : : 175.0 1 000.0 5 400.0 14 000.0JP : : : : : : : : :
4. Video and DVD market
4.2 DVD player households, thousand
a) Eurostat estimate based on extrapolation of Screen Digest/IVF data where Eurostat data are not available b) Source= AVL (BFE) c) Source: Finnpaneld) Source: Screen Digest/IVF e) Estimates from different sources, among others Screen Digest (SD) and Social Science Research Institute at the University of Iceland(Consumer Surveys) (SSRI)/SI f) British Video Association; This figure is for sales of DVD players rather than households with DVDs - it is likely that this will provide agood proxy figure. g) Source: Motion Picture Association of America, Adams Media Research, by installed consumer base per year
1980 1985 1990 1995 1996 1997 1998 1999 2000EU-15 a) : : : : 39 500 42 800 43 493 42 530 :EUR-12 : : : : : 31 500 31 943 30 766 :B : : : 2 000 1 900 1 900 1 900 1 650 :DK : : : 1 500 1 500 1 800 1 800 1 564 :D : : 5 350 10 000 10 000 10 000 10 000 10 000 :EL : : : 120 130 150 150 150 :E : : : 720 720 3 050 3 050 3 100 :F : : 1 955 5 000 5 000 5 000 5 000 5 200 :IRL : : : 1 650 1 650 1 650 1 650 1 650 :I : : 2 500 4 000 4 000 4 500 5 000 3 500 b) :L : : : : : : : : :NL : : 361 2 500 2 500 2 500 2 500 2 500 :A : : : 350 750 750 750 750 :P : : : : 588 : 443 766 c) 404 c)
FIN : : 700 1 450 1 500 1 500 d) 1 500 d) 1 500 d) 1 500 d)
S : : 1 400 5 000 5 000 5 000 5 000 5 000 :UK : : : : : 4 500 e) 4 750 e) 5 200 e) 5 000IS : : : 35 35 35 35 35 :N : : 560 1 500 1 500 1 750 1 750 1 900 :EEA : : : : 41 035 44 585 45 278 44 465 :CH : : 1 348 1 520 1 500 1 400 1 400 1 400 :US : : 42 250 50 000 : : : : :JP : : 18 000 18 500 : : : : :
4.3 Number of outlets selling videos
Source: Eurostat, AUVIS domaina) Eurostat estimate based on extrapolation of Screen Digest/IVF data where Eurostatdata are not availableb) Source= AVL (BFE); It is relevant to consider further 38000 newspaper kiosks andall the great retail distributive channels as point of sales for videos
c) Source: IGAC (Numero de empresas com registo para venda de video:(podem ter um ou mais video clubes)d) Source: Finnpanele) British Video Association

1980 1985 1990 1995 1996 1997 1998 1999 2000EU-15 : : : : : 2 342 2 379 2 508 :EUR-12 : : 2 385 : 2 657 :B : : : 1 136 1 469 1 537 1 584 1 870 :DK : : : 1 086 1 142 1 067 1 106 1 286 :D : : 2 489 2 180 2 282 2 371 2 413 2 490 :EL : : : 9 717 9 638 8 733 : 9 767 :E : : : 8 750 8 958 : : : :F : : 4 804 3 117 : 3 200 3 400 3 365 :IRL : : : 448 469 491 509 533 :I : : 2 190 2 357 2 788 2 919 2 630 3 901 :L : : : : : : : : :NL : : 8 310 1 772 1 863 1 938 : 2 069 :A : : : 5 646 2 805 2 973 3 120 3 427 :P : : : : : : 4 454 : :FIN : : 1 381 936 963 1 093 1 101 1 131 1 115S : : 1 599 615 666 662 684 659 :UK : : : : : 4 420 : 3 769 :IS : : : 2 143 2 200 2 178 2 340 2 394 :N : : 1 411 761 848 797 855 793 :EEA : : 2 281 2 320 2 434 :CH : : 799 1 199 1 281 1 419 1 455 : :US : : 1 547 1 516 : : : : :JP : : 1 572 1 890 : : : : :
4.5 VCR households per outlet selling videos
Source: Eurostat, AUVIS domain
4. Video and DVD market
A68
1980 1985 1990 1995 1996 1997 1998 1999 2000EU-15 : : : : 10.6 11.8 11.7 11.4 :EUR-12 : : : : : 10.5 10.6 10.2 :B : : : 19.7 18.7 19.1 18.7 16.2 :DK : : : 28.8 28.6 35.1 34.3 29.5 :D : : 6.8 12.3 12.2 12.6 12.2 12.2 :EL : : : 1.1 1.2 1.5 1.4 1.4 :E : : : 1.8 1.8 7.9 7.8 7.9 :F : : 3.5 8.6 8.6 8.8 8.6 8.9 :IRL : : : 45.9 45.6 47.0 45.6 44.7 :I : : 4.4 7.0 7.0 7.9 8.7 6.1 :L : : : : : : : : :NL : : 2.4 16.2 16.1 16.8 16.1 16.0 :A : : : 4.4 9.3 9.8 9.3 9.3 :P : : : : 5.9 : 4.5 7.7 4.0FIN : : 14.1 28.4 29.3 30.2 29.3 29.1 29.0S : : 16.4 56.7 56.6 58.6 56.6 56.5 :UK : : : : : 7.8 8.1 8.8 8.4IS : : : 13.1 13.1 13.8 13.1 12.8 :N : : 13.2 34.5 34.3 41.3 40.0 43.0 :EEA : : : : 10.9 11.8 11.9 11.7 :CH : : 20.2 21.7 21.2 21.0 19.8 19.7 :US : : 17.0 19.1 : : : : :JP : : 14.6 14.7 : : : : :
4.4 Number of outlets selling videos per 100 000 inhabitants
Source: Eurostat, AUVIS domain

A 69
1980 1985 1990 1995 1996 1997 1998 1999 2000EU-15 : : 11.1 6.6 6.5 7.4 7.5 7.1 :EUR-12 : : 10.0 5.7 5.6 6.8 6.9 6.6 :B : : 10.1 7.9 6.9 7.0 6.9 6.9 :DK : : 23.4 29.7 32.4 33.1 38.6 40.0 :D : : 12.0 6.7 6.7 7.0 6.8 6.1 5.6EL : : 11.9 6.7 5.0 5.2 4.8 5.0 :E : : 15.5 8.2 7.9 11.6 11.7 12.7 :F : : 3.5 1.4 1.4 1.6 1.7 2.0 :IRL : : 34.3 30.6 30.6 31.6 30.4 27.1 :I : : 7.1 3.8 3.8 7.9 7.0 6.1 :L : : 3.7 4.7 4.1 4.7 3.9 3.8 :NL : : 7.4 5.8 5.8 8.1 8.1 7.2 7.9A : : 7.0 4.4 4.3 4.6 4.3 4.3 :P : : 6.0 5.0 7.1 7.9 5.2 7.2FIN : : 39.6 20.6 19.5 20.1 19.5 19.4 19.3S : : 10.8 7.4 7.1 7.0 6.8 6.8 :UK : : 15.7 8.9 8.3 7.8 7.3 6.6 6.2IS : : 78.8 68.5 71.3 76.0 72.0 73.4 72.4N : : 23.6 11.5 11.0 11.3 10.8 10.6 :EEA : : 11.3 6.7 6.6 7.3 7.5 7.2 :CH : : 9.0 5.3 5.1 5.2 4.5 4.2 :US : : 12.5 10.7 : : : : :JP : : 9.7 6.4 8.0 : : : :
4. Video and DVD market
4.7 Number of outlets renting videos (video shops) per 100 000 inhabitants
Source: Eurostat, AUVIS domain
1980 1985 1990 1995 1996 1997 1998 1999 2000EU-15 a) : : 40 247 24 521 24 084 27 100 27 778 26 597 :EUR-12 : : 29 127 17 121 16 899 20 300 20 853 19 979 :B : : 1 000 800 700 700 700 700 :DK : : 1 200 1 550 1 700 1 700 2 025 2 118 :D : 4 000 9 500 5 500 5 500 5 500 5 550 5 044 4 591EL : : 1 200 700 525 525 500 530 :E : : 6 000 3 200 3 100 4 500 4 600 5 000 :F : : 2 000 800 800 900 1 000 1 200 :IRL : : 1 203 1 102 1 107 1 107 1 100 1 000 :I : : 4 000 2 200 2 200 4 500 b) 4 000 b) 3 500 b) :L : : 14 19 17 18 16 16 :NL : : 1 100 900 900 1 200 1 250 1 120 1 250A : : 540 350 350 350 350 350 :P : : 600 500 700 : 787 519 c) 718 c)
FIN : : 1 970 1 050 1 000 1 000 d) 1 000 d) 1 000 d) 1 000 d)
S : : 920 650 625 600 600 600 :UK : : 9 000 5 200 4 860 4 500 e) 4 300 e) 3 900 e) 3 700IS : : 200 183 191 193 f) 193 f) 200 f) 202N : : 1 000 500 480 480 470 470 :EEA : : 41 447 25 204 24 755 27 773 28 441 27 267 :CH : : 601 370 360 350 320 300 :US : : 31 000 27 944 : : : : :JP : : 12 000 8 000 10 000 : : : :
4.6 Number of outlets renting videos (video shops)
Source: Eurostat, AUVIS domaina) Eurostat estimate based on extrapolation of Screen Digest/IVF data where Eurostatdata are not availableb) Univideo
c) Source: IGAC d) Source: Finnish Film Distributors' Associatione) British Video Associationf) Estimated by Myndmark/SI

1980 1985 1990 1995 1996 1997 1998 1999 2000EU-15 : : 1 455 3 643 : 3 699 3 725 4 010 :EUR-12 : : 1 434 3 883 : 3 700 : 4 092 :B : : 1 509 2 839 3 987 4 171 4 298 4 407 :DK : : 700 1 051 1 008 1 129 983 949 :D : : 1 402 3 964 4 148 4 311 4 348 4 937 5 598EL : : 711 1 666 2 387 2 495 : 2 764 :E : : 792 1 969 2 081 : : : :F : : 4 696 19 481 : 17 778 17 000 14 583 :IRL : : 426 672 699 732 764 880 :I : : 1 369 4 285 5 070 2 919 3 287 3 901 :L : : 4 143 5 000 5 882 6 000 7 313 : :NL : : 2 727 4 923 5 174 4 038 : 4 618 4 178A : : 1 930 5 646 6 011 6 371 6 686 7 343 :P : : 1 472 2 676 : : 2 507 : :FIN : : 491 1 292 1 444 1 640 1 651 1 696 1 672S : : 2 433 4 731 5 330 5 517 5 700 5 488 :UK : : 1 525 3 488 3 913 4 420 : 5 026 :IS : : 300 410 403 395 424 419 441N : : 790 2 282 2 650 2 904 3 183 3 204 :EEA : : 1 433 3 592 : 3 662 3 694 3 970 :CH : : 1 792 4 927 5 336 5 677 6 366 : :US : : 2 108 2 713 : : : : :JP : : 2 358 4 371 3 604 : : : :
4. Video and DVD market
4.8 VCR households per outlet renting videos (video shop)
A70
Source: Eurostat, AUVIS domain
1980 1985 1990 1995 1996 1997 1998 1999 2000EU-15 b) : : 3 560 4 619 4 766 5 286 5 827 5 677 6 475EUR-12 b) : : 2 222 2 946 2 988 3 186 3 454 3 416 3 636B : : 80 178 152 154 169 160 143DK : : 89 151 160 161 176 154 :D : 270 702 950 958 826 856 816 751EL : : : 16 17 17 19 18 :E : : 339 266 272 287 310 321 344F 36 169 544 898 921 896 995 1 025 :IRL : : 72 94 101 113 114 108 :I : : 179 177 192 485 571 568 :L : : 3 4 4 4 : : :NL : : 97 195 187 205 215 201 209A : : 44 61 63 84 87 78 :P : : 65 52 56 51 45 44 :FIN : 40 63 55 63 65 67 71 a) 70 a)
S : : 139 146 162 167 162 149 149UK : : 1 109 1 376 1 456 1 772 2 036 1 958 2 539IS : : 7 9 9 10 13 14 :N : : 118 118 112 98 100 103 102EEA b) : : 3 684 4 746 4 887 5 394 5 941 5 794 6 593CH : : 79 97 108 85 89 81 :US : : 9 220 10 470 11 731 13 322 14 687 15 021 16 270JP : : 2 430 3 753 3 894 3 982 3 984 : :
4.9 Home video sales and rentals, million ECU/EUR
Source: Eurostat, AUVIS domaina) Source: Finnish Film Distributors Associationb) Eurostat estimates

A 71
1980 1985 1990 1995 1996 1997 1998 1999 2000EU-15 a) : : 1 298 3 095 3 143 3 491 3 909 3 742 4 376EUR-12 a) : : 745 1 981 1 983 2 075 2 333 2 247 2 414B : : 20 128 102 102 106 93 75 g)
DK : : 10 85 89 91 102 g) 84 g) 84 g)D : 0 146 555 550 470 532 478 423EL : : : 5 5 5 7 g) 6 g) :E : : 49 178 178 175 178 163 166 g)F 3 11 326 730 748 718 805 838 :IRL : : 13 32 33 37 37 g) 33 g) :I : : 122 127 138 327 c) 414 c) 403 c) :L : : 1 3 3 3 : : :NL : : 22 113 104 106 116 98 104A : : 17 38 41 53 57 g) 53 g) :P : : 14 33 36 37 33 g) 32 g) :FIN : 1 14 37 43 41 d) 45 d) 47 d) 45S : : 19 78 83 86 84 71 67 g)UK : : 524 952 987 1 239 e) 1 390 f) 1 339 f) 1 811IS : : 0 2 2 3 4 4 :N : : 6 38 44 45 47 g) 48 g) 42 g)EEA a) : : 1 304 3 135 3 189 3 538 3 960 3 794 4 423CH : : 23 65 73 55 63 57 :US h) : : 2 632 4 685 5 656 6 748 7 531 7 253 g) 8 005 g)JP : : 522 978 1 166 1 217 1 359 : :
4. Video and DVD market
4.10 Home video sales, million ECU/EUR
Source: Eurostat, AUVIS domaina) Eurostat estimatesb) includes figures for DVDs.c) Univideod) Film Distributors' Association
e) Source: British Video Associationf) Source: British Video Association; includes figures for DVDs.g) Source: Screen Digest/IVFh) Video Software Dealers Association and International Trade Administrationand Eurostat estimates
1980 1985 1990 1995 1996 1997 1998 1999 2000EU-15 a) : : 2 257 1 524 1 623 1 796 1 918 1 935 2 099EUR-12 a) : : 1 473 966 1 005 1 112 1 120 1 169 1 222B : 39 60 50 50 52 64 b) 67 b) 68 b)
DK : : 79 66 71 70 74 b) 70 b) :D : 270 556 395 408 356 324 338 328EL : : 31 11 11 12 12 b) 12 b) :E : : 290 87 93 112 132 b) 159 b) 178 b)F 33 158 217 169 173 178 189 187 b) 222 b)
IRL : : 59 61 68 75 77 b) 75 b) :I : : 56 49 53 158 157 b) 165 b) :L : : 2 1 1 1 : : :NL : : 75 82 83 99 99 103 105A : : 27 23 22 30 31 b) 25 b) :P : : 51 19 20 14 12 b) 12 b) :FIN 1 39 48 18 21 24 22 24 c) 25 c)
S : : 120 68 78 81 78 b) 78 b) 82UK : : 586 424 469 533 646 619 728IS : 2 6 7 7 7 9 10 :N : : 112 80 68 53 53 b) 55 b) 60EEA a) : : 2 375 1 611 1 698 1 856 1 981 2 000 2 170CH : : 57 32 35 30 26 24 :US b) : : : 5 784 6 074 6 574 7 156 7 768 8 265JP : : 1 908 2 774 2 728 2 765 2 625 : :
4.11 Home video rentals, million ECU/EUR
Source: Eurostat, AUVIS domaina) Eurostat estimatesb) Source: Screen Digest/IVFc) Finnish Film Distributors' Association
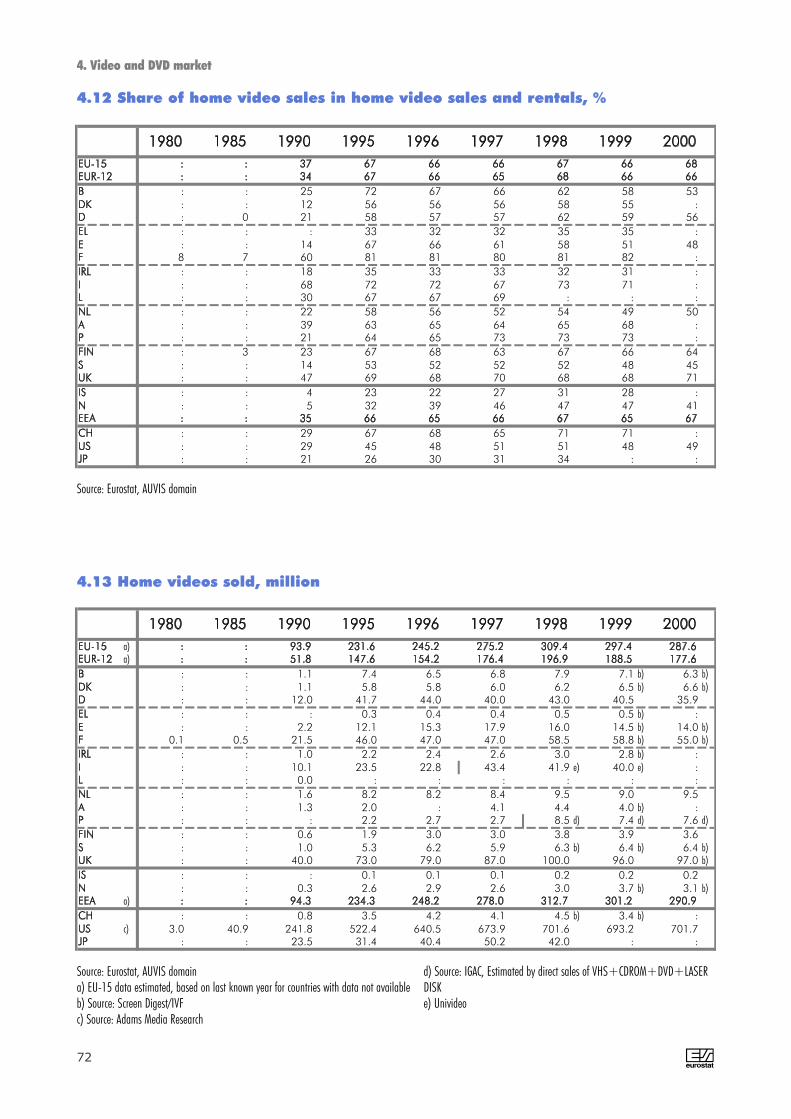
1980 1985 1990 1995 1996 1997 1998 1999 2000EU-15 : : 37 67 66 66 67 66 68EUR-12 : : 34 67 66 65 68 66 66B : : 25 72 67 66 62 58 53DK : : 12 56 56 56 58 55 :D : 0 21 58 57 57 62 59 56EL : : : 33 32 32 35 35 :E : : 14 67 66 61 58 51 48F 8 7 60 81 81 80 81 82 :IRL : : 18 35 33 33 32 31 :I : : 68 72 72 67 73 71 :L : : 30 67 67 69 : : :NL : : 22 58 56 52 54 49 50A : : 39 63 65 64 65 68 :P : : 21 64 65 73 73 73 :FIN : 3 23 67 68 63 67 66 64S : : 14 53 52 52 52 48 45UK : : 47 69 68 70 68 68 71IS : : 4 23 22 27 31 28 :N : : 5 32 39 46 47 47 41EEA : : 35 66 65 66 67 65 67CH : : 29 67 68 65 71 71 :US : : 29 45 48 51 51 48 49JP : : 21 26 30 31 34 : :
4. Video and DVD market
4.12 Share of home video sales in home video sales and rentals, %
A72
Source: Eurostat, AUVIS domain
1980 1985 1990 1995 1996 1997 1998 1999 2000EU-15 a) : : 93.9 231.6 245.2 275.2 309.4 297.4 287.6EUR-12 a) : : 51.8 147.6 154.2 176.4 196.9 188.5 177.6B : : 1.1 7.4 6.5 6.8 7.9 7.1 b) 6.3 b)
DK : : 1.1 5.8 5.8 6.0 6.2 6.5 b) 6.6 b)D : : 12.0 41.7 44.0 40.0 43.0 40.5 35.9EL : : : 0.3 0.4 0.4 0.5 0.5 b) :E : : 2.2 12.1 15.3 17.9 16.0 14.5 b) 14.0 b)F 0.1 0.5 21.5 46.0 47.0 47.0 58.5 58.8 b) 55.0 b)
IRL : : 1.0 2.2 2.4 2.6 3.0 2.8 b) :I : : 10.1 23.5 22.8 43.4 41.9 e) 40.0 e) :L : : 0.0 : : : : : :NL : : 1.6 8.2 8.2 8.4 9.5 9.0 9.5A : : 1.3 2.0 : 4.1 4.4 4.0 b) :P : : : 2.2 2.7 2.7 8.5 d) 7.4 d) 7.6 d)
FIN : : 0.6 1.9 3.0 3.0 3.8 3.9 3.6S : : 1.0 5.3 6.2 5.9 6.3 b) 6.4 b) 6.4 b)UK : : 40.0 73.0 79.0 87.0 100.0 96.0 97.0 b)
IS : : : 0.1 0.1 0.1 0.2 0.2 0.2N : : 0.3 2.6 2.9 2.6 3.0 3.7 b) 3.1 b)EEA a) : : 94.3 234.3 248.2 278.0 312.7 301.2 290.9CH : : 0.8 3.5 4.2 4.1 4.5 b) 3.4 b) :US c) 3.0 40.9 241.8 522.4 640.5 673.9 701.6 693.2 701.7JP : : 23.5 31.4 40.4 50.2 42.0 : :
4.13 Home videos sold, million
Source: Eurostat, AUVIS domaina) EU-15 data estimated, based on last known year for countries with data not availableb) Source: Screen Digest/IVFc) Source: Adams Media Research
d) Source: IGAC, Estimated by direct sales of VHS+CDROM+DVD+LASERDISKe) Univideo

A 73
1980 1985 1990 1995 1996 1997 1998 1999 2000EU-15 a) : : 1.6 2.6 2.6 2.7 3.0 2.8 2.6EUR-12 : : 1.2 2.2 2.2 2.3 2.5 2.3 2.1B : : 0.7 3.3 2.3 2.3 2.6 2.3 2.0DK : : 1.3 3.6 3.4 3.1 3.1 3.2 2.7D : : 0.9 1.9 1.9 1.7 1.8 1.6 1.4EL : : : 0.3 0.3 0.3 : 0.3 :E : : 0.5 1.9 2.4 : : : 1.5F 0.4 0.2 2.3 3.0 : 2.9 3.4 3.4 3.1IRL : : 1.9 3.0 3.1 3.3 3.5 3.1 :I : : 1.8 2.5 2.0 3.3 3.2 2.9 :L : : 0.7 : : : : : :NL : : 0.5 1.9 1.8 1.7 : 1.7 1.8A : : 1.2 1.0 : 1.8 1.9 1.6 :P : : : 1.6 : : 4.3 : :FIN : : 0.7 1.4 2.1 1.8 2.3 2.3 2.2S : : 0.5 1.7 1.9 1.8 1.8 1.9 1.9UK : : 2.9 4.0 4.2 4.4 : 4.9 4.4IS : : : 0.9 1.4 1.8 2.3 1.9 2.2N : : 0.4 2.2 2.3 1.9 2.0 2.4 1.9EEA : : 1.6 2.6 2.6 2.7 3.0 2.8 2.6CH : : 0.7 1.9 2.2 2.1 2.2 : :US 0.5 1.7 3.7 6.9 8.1 8.4 8.3 8.1 8.0JP : : 0.8 0.9 1.1 1.3 : : :
4. Video and DVD market
4.14 Home videos sold per VCR household
Source: Eurostat, AUVIS domain
1980 1985 1990 1995 1996 1997 1998 1999 2000EU-15 a) : : 940 622 657 657 725 730 752EUR-12 a) : : 616 419 443 456 496 503 528B : 12 22 18 20 20 24 b) 23 b) 24 b)
DK : : 25 19 20 20 22 b) 21 b) 20 b)D : : 220 163 173 153 159 :EL : : : 8 9 9 10 10E : : 125 45 49 60 73 83 90 b)F 8 62 74 63 66 70 57 57 68 b)
IRL : : 27 25 27 27 29 28I : : 69 41 b) 43 b) 43 b) 45 b) 44 b) 46 b)L : : 1 : 1 1 1 :NL : : 33 28 28 32 35 36 37A : : 13 10 10 11 11 9P : : : 11 11 8 7 7FIN : : 13 7 7 7 8 8 9S : : 23 17 19 20 21 18 18UK : : 277 167 175 161 186 189 b) 186IS : 0 1 2 2 2 3 3N : : 27 19 18 17 17 17 18 b)EEA a) : : 968 643 677 676 745 750 773CH : : 10 7 9 8 7 6US : : 4 130 3 598 3 646 3 519 b) 3 595 b) 3 598 b) 3 325 b)JP : : 739 844 942 948 849 :
4.15 Home video rental transactions, million
Source: Eurostat, AUVIS domaina) Eurostat estimatesb) Source IVF

1980 1985 1990 1995 1996 1997 1998 1999 2000EU-15 a) : : 16.1 7.0 6.9 6.6 7.0 6.8 6.7EUR-12 a) : : 14.7 6.3 6.2 6.1 6.4 6.2 6.3B : 22.2 14.6 8.1 7.0 6.9 7.8 7.6 7.4DK : : 29.5 11.9 11.7 10.5 11.1 10.3 8.3D : : 16.5 7.5 7.6 6.5 6.6 : :EL : : : 6.9 7.0 7.0 : 6.6 :E : : 26.3 7.1 7.6 : : : 9.9F 34.0 22.4 7.9 4.0 : 4.4 3.4 3.3 3.8IRL : : 53.3 33.8 34.9 33.8 34.4 31.9 :I : : 12.6 4.3 3.8 3.2 3.4 3.2 3.3L : : 12.1 : 5.5 5.1 5.0 : :NL : : 11.0 6.2 6.1 6.6 : 7.0 7.1A : : 12.5 5.1 4.8 5.1 4.8 3.6 :P : : : 7.9 : : 3.6 : :FIN : : 13.4 4.8 4.8 4.3 4.8 4.7 5.4S : : 10.1 5.4 5.6 5.9 6.0 5.5 5.2UK : : 20.2 9.2 9.2 8.1 : 9.6 8.5IS : 16.7 23.3 25.3 26.0 27.6 33.0 35.1 :N : : 33.8 16.7 14.2 12.2 11.4 11.3 11.3EEA a) : : 16.3 7.1 7.0 6.6 7.1 6.9 6.8CH : : 9.3 3.9 4.8 4.1 3.4 : :US : : 63.2 47.5 46.3 43.8 42.7 41.9 37.7JP : : 26.1 24.1 26.1 25.3 : : :
4. Video and DVD market
4.16 Home video rental transactions per VCR household
A74
Source: Eurostat, AUVIS domaina) Eurostat estimates
1980 1985 1990 1995 1996 1997 1998 1999 2000EU-15 a) : : 13.8 13.4 12.8 12.7 12.6 12.6 15.2EUR-12 : : 14.4 13.4 12.9 11.8 11.8 11.9 13.6B : : 17.8 17.3 15.8 14.9 13.4 13.1 11.9DK : : 9.4 14.7 15.4 15.2 16.5 13.1 12.7D : : 12.2 13.3 12.5 11.8 12.4 11.8 11.8EL : : : 15.2 13.8 13.6 13.3 13.5 :E : : 22.2 14.7 11.7 9.8 11.1 11.2 11.9F 27.3 23.0 15.2 15.9 15.9 15.3 13.8 14.3 :IRL : : 13.5 14.6 14.1 14.2 12.5 12.0 :I : : 12.1 5.4 6.1 7.5 9.9 10.1 :L : : 19.4 : : : : : :NL : : 13.5 13.8 12.7 12.6 12.2 10.9 10.9A : : 13.3 19.3 : 13.0 13.0 13.1 :P : : : 15.5 13.4 13.6 : : :FIN : : 22.3 19.4 14.3 13.6 11.8 12.1 12.5S : : 18.4 14.7 13.5 14.6 13.3 11.1 10.5UK : : 13.1 13.0 12.5 14.2 13.9 13.9 18.7IS : : : 27.8 17.7 18.6 20.6 24.6 :N : : 21.0 14.8 14.9 17.2 15.5 13.1 13.5EEA : : 13.8 13.4 12.8 12.7 12.7 12.6 15.2CH : : 29.3 18.5 17.5 13.5 14.0 16.9 :US : : 10.9 9.0 8.8 10.0 10.7 10.5 11.4JP : : 22.2 31.2 28.9 24.3 32.4 : :
4.17 Average home video consumer price, ECU/EUR
Source: Eurostat, AUVIS domaina) Eurostat estimate estimates, based on last known year for countries with data notavailable
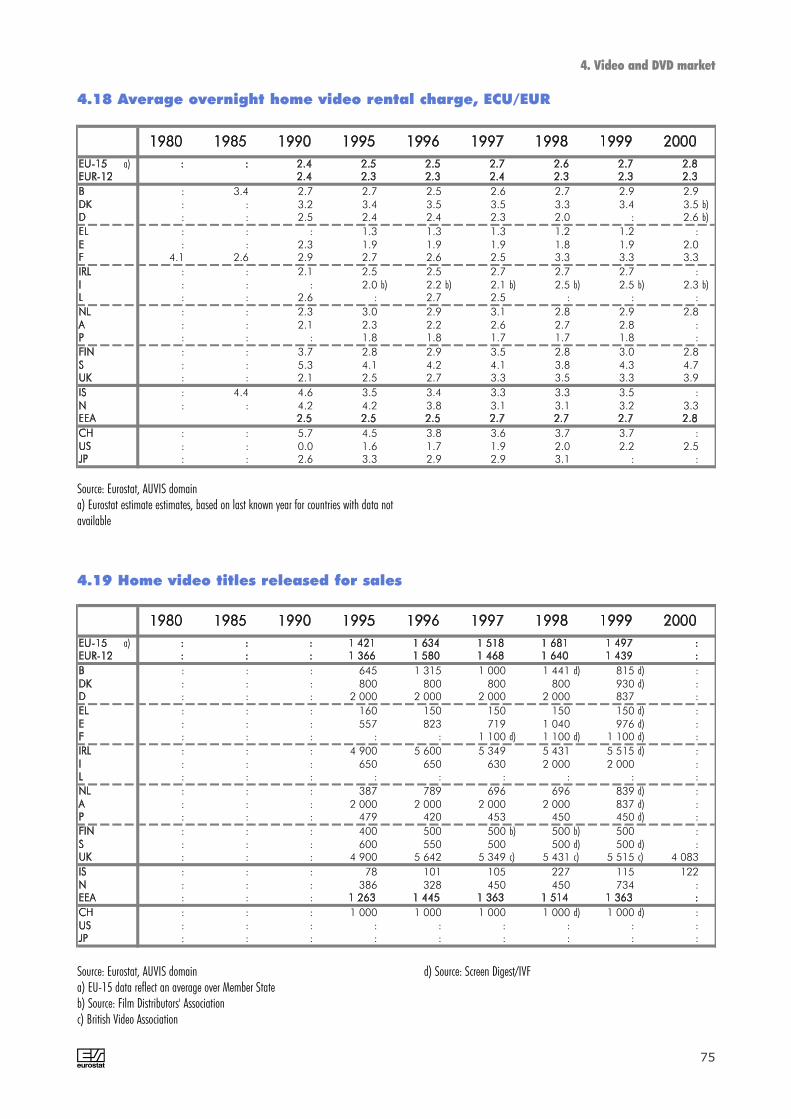
A 75
1980 1985 1990 1995 1996 1997 1998 1999 2000EU-15 a) : : 2.4 2.5 2.5 2.7 2.6 2.7 2.8EUR-12 2.4 2.3 2.3 2.4 2.3 2.3 2.3B : 3.4 2.7 2.7 2.5 2.6 2.7 2.9 2.9DK : : 3.2 3.4 3.5 3.5 3.3 3.4 3.5 b)D : : 2.5 2.4 2.4 2.3 2.0 : 2.6 b)
EL : : : 1.3 1.3 1.3 1.2 1.2 :E : : 2.3 1.9 1.9 1.9 1.8 1.9 2.0F 4.1 2.6 2.9 2.7 2.6 2.5 3.3 3.3 3.3IRL : : 2.1 2.5 2.5 2.7 2.7 2.7 :I : : : 2.0 b) 2.2 b) 2.1 b) 2.5 b) 2.5 b) 2.3 b)L : : 2.6 : 2.7 2.5 : : :NL : : 2.3 3.0 2.9 3.1 2.8 2.9 2.8A : : 2.1 2.3 2.2 2.6 2.7 2.8 :P : : : 1.8 1.8 1.7 1.7 1.8 :FIN : : 3.7 2.8 2.9 3.5 2.8 3.0 2.8S : : 5.3 4.1 4.2 4.1 3.8 4.3 4.7UK : : 2.1 2.5 2.7 3.3 3.5 3.3 3.9IS : 4.4 4.6 3.5 3.4 3.3 3.3 3.5 :N : : 4.2 4.2 3.8 3.1 3.1 3.2 3.3EEA 2.5 2.5 2.5 2.7 2.7 2.7 2.8CH : : 5.7 4.5 3.8 3.6 3.7 3.7 :US : : 0.0 1.6 1.7 1.9 2.0 2.2 2.5JP : : 2.6 3.3 2.9 2.9 3.1 : :
4. Video and DVD market
4.18 Average overnight home video rental charge, ECU/EUR
Source: Eurostat, AUVIS domaina) Eurostat estimate estimates, based on last known year for countries with data notavailable
1980 1985 1990 1995 1996 1997 1998 1999 2000EU-15 a) : : : 1 421 1 634 1 518 1 681 1 497 :EUR-12 : : : 1 366 1 580 1 468 1 640 1 439 :B : : : 645 1 315 1 000 1 441 d) 815 d) :DK : : : 800 800 800 800 930 d) :D : : : 2 000 2 000 2 000 2 000 837 :EL : : : 160 150 150 150 150 d) :E : : : 557 823 719 1 040 976 d) :F : : : : : 1 100 d) 1 100 d) 1 100 d) :IRL : : : 4 900 5 600 5 349 5 431 5 515 d) :I : : : 650 650 630 2 000 2 000 :L : : : : : : : : :NL : : : 387 789 696 696 839 d) :A : : : 2 000 2 000 2 000 2 000 837 d) :P : : : 479 420 453 450 450 d) :FIN : : : 400 500 500 b) 500 b) 500 :S : : : 600 550 500 500 d) 500 d) :UK : : : 4 900 5 642 5 349 c) 5 431 c) 5 515 c) 4 083IS : : : 78 101 105 227 115 122N : : : 386 328 450 450 734 :EEA : : : 1 263 1 445 1 363 1 514 1 363 :CH : : : 1 000 1 000 1 000 1 000 d) 1 000 d) :US : : : : : : : : :JP : : : : : : : : :
4.19 Home video titles released for sales
Source: Eurostat, AUVIS domaina) EU-15 data reflect an average over Member State b) Source: Film Distributors' Associationc) British Video Association
d) Source: Screen Digest/IVF

1980 1985 1990 1995 1996 1997 1998 1999 2000EU-15 a) : : : 516 532 543 549 569 :EUR-12 : : : 508 528 539 547 572 :B : 640 : 895 862 850 1 000 d) 1 089 d) :DK : : : 551 500 500 525 500 d) :D : 780 694 517 590 676 644 645 :EL : : : 560 634 600 600 600 d) :E : : : 292 334 354 334 486 d) :F : : : : : 500 d) 500 d) 500 d) :IRL : : : 460 495 492 438 540 d) :I : : : 320 320 340 400 400 :L : : : : : : : : :NL : : : 500 500 500 550 550 d) :A : : 694 517 590 676 644 502 d) :P : : : 480 435 432 432 432 d) :FIN : : : 400 450 500 b) 500 b) 500 :S 276 1 754 2 156 750 700 675 675 d) 675 d) :UK : : : 460 500 500 c) 440 c) 540 c) 510IS : : : 447 452 450 503 544 541N : : : 503 517 483 499 542 :EEA : : : 510 525 533 543 565 :CH : : : 300 300 300 300 d) 300 d) :US : : : : : : : : :JP : : : : : : : : :
4. Video and DVD market
4.20 Home video titles released for rental
A76
Source: Eurostat, AUVIS domaina) EU-15 data reflect an average over Member State b) Source: Film Distributors' Association
c) British Video Associationd) Source: Screen Digest/IVF
1 998 1 999 2 000 1 998 1 999 2 000 1 998 1 999 2 000 1 998 1 999 2 000
EU-15 48.5 390.1 1 389.8 47.7 376.6 1 313.7 0.8 13.5 76.1 98.4 96.5 94.5EUR-12 40.0 271.1 874.1 39.6 263.1 839.0 0.4 7.9 35.1 99.1 97.1 96.0B 1.8 19.7 68.2 1.8 17.9 62.6 0.0 1.7 5.6 99.4 91.2 91.8DK 2.0 5.4 25.7 2.0 4.9 24.0 0.0 0.5 1.8 98.5 90.1 93.1D 11.5 44.1 182.8 11.4 42.5 170.2 0.0 1.6 12.6 99.6 96.4 93.1EL 0.4 2.1 : 0.4 1.9 : 0.0 0.2 : 99.6 90.5 :E 3.9 27.5 : 3.9 26.4 72.0 0.0 1.1 : 98.8 96.0 :F 15.5 129.5 379.3 15.5 128.1 371.6 0.0 1.5 7.7 99.7 98.9 98.0IRL 0.1 : : 0.1 1.8 : 0.0 : : 100.0 : :I 3.5 : : 3.5 21.7 70.7 0.0 : : 99.7 : :L : : : : : : : : : : : :NL 1.7 17.3 61.3 1.7 14.5 53.1 0.0 2.8 8.2 100.0 84.0 86.7A 0.4 : : 0.4 2.9 : 0.0 : : 100.0 : :P 0.4 : : 0.4 1.5 : 0.0 : : 99.4 : :FIN a) 0.8 : : 0.5 3.9 10.4 0.3 : : 60.0 : :S 0.9 6.6 20.7 0.9 5.3 17.6 0.0 1.3 3.1 98.8 80.7 85.0UK 5.6 107.0 469.3 5.2 103.2 433.2 0.4 3.8 36.1 94.6 96.5 92.3IS 0.2 0.8 2.1 0.2 0.8 2.1 0.0 97.8 100.0 100.0N 1.5 4.5 16.7 1.5 4.4 14.9 0.0 0.1 1.8 100.0 97.9 89.4EEA 50.2 395.5 1 408.2 49.4 381.7 1 330.7 0.8 13.8 77.4 98.4 96.5 94.5CH 3.1 : : 3.1 22.5 : 0.0 : : 100.0 : :US c) : 1 682.8 4 669.4 390.7 1 579.6 3 859.2 : 103.2 810.3 : 93.9 82.6JP : : : : : : : : : : :
and rental
DVD discsales
DVD discsales
DVD discrental
and rental (%)
DVD disc salesin total sales
4.21 DVD disc sales and rentals, million ECU/EUR
a) Source: Finnish Film Distributors Associationb) European countries, source: Screen Digest/IVFc) Source: Adams Media Research

A 77
1 998 1 999 2 000 1 998 1 999 2 000 1 998 1 999 2 000 1 998 1 999 2 000
EU-15 1 801 14 702 52 180 6.4 10.9 8.0 280 5 239 27 042 1.0 3.9 4.2EUR-12 1 508 10 211 33 491 6.1 9.5 6.8 77 3 792 17 941 0.3 3.5 3.6B 67 689 2 553 10.2 12.6 13.5 4 538 1 871 0.6 9.9 9.9DK 60 183 898 7.5 9.2 12.9 9 138 442 1.1 6.9 6.4D 450 2 100 8 200 11.4 6.6 7.5 13 500 5 200 0.3 1.6 4.7EL 14 77 : 4.1 5.0 : 1 83 141 0.3 5.4 :E 162 1 100 3 000 4.1 8.8 8.3 27 : : 0.7 : :F 550 4 200 12 500 4.7 11.7 10.5 15 452 2 360 0.1 1.3 2.0IRL 5 77 : 7.1 10.0 : 2 96 289 2.9 12.5 :I a) 150 1 000 3 200 8.3 12.0 9.9 5 : : 0.3 : :L : : : : : : : : : : : :NL 60 500 1 900 6.1 7.3 9.0 6 970 3 000 0.6 14.1 14.2A 14 121 : 6.1 7.0 : 1 152 464 0.4 8.8 :P b) 16 187 662 4.0 15.0 : 1 63 165 0.3 5.0 :FIN c) 20 160 500 6.5 12.2 11.1 1 126 260 0.3 9.6 5.8S 38 308 1 191 6.4 10.0 10.7 0 294 659 0.0 9.5 5.9UK f) 195 4 000 16 600 8.1 17.9 12.3 194 1 015 8 000 8.1 4.6 5.9IS d) 5 24 69 10.0 14.1 7.7 1 25 52 2.0 14.7 5.8N 43 175 667 15.9 7.7 7.8 0 17 320 0.0 0.7 3.7EEA 1 849 14 901 52 916 6.4 10.8 8.0 281 5 256 27 362 1.0 3.8 4.2CH 103 737 : 18.1 14.5 : 1 : : 0.2 : :US e) 17 300 65 100 155 300 17.3 12.1 11.1 : 32 000 220 000 : 5.9 15.7JP : : : : : : : : : : : :
(1000)(1000) DVD householdDVD household
DVD discssold
DVD discsrented per
DVD discssold per
DVD discsrented
4. Video and DVD market
4.22 DVD discs sold and rented
a) Univideo b) Source: IGAC c) Source: Film Distributors' Association d) No. of DVD sold: No. of copies shipped from distributors to retail. Source: SIe) Source: Adams Media Research Other european countries, source: Screen Digest/IVF
1 998 1 999 2 000 1 998 1 999 2 000 1 998 1 999 2 000 1 998 1 999 2 000
27 26 26 3 3 4 163 597 : 152 550 : 26 26 26 2 3 3 : : 27 26 25 3 3 3 275 598 : 188 437 : 33 27 27 3 4 4 92 344 : 46 206 : 25 20 21 3 3 2 300 1 000 : 300 1 000 : 27 25 : 1 1 : 50 350 : 50 350 : 24 24 24 2 2 : 300 441 : 300 441 : 28 30 30 3 3 3 197 730 : 158 731 1 444 20 23 : 3 3 : 142 960 : 142 960 : 23 22 22 2 3 : 120 320 : 80 400 :
: : : : : : : : : : : : 29 29 28 3 3 3 125 400 : 125 400 : 26 24 : 3 3 : 300 1 000 : 300 1 000 : 26 24 : 2 2 : 50 350 : 50 350 : 25 24 : 3 3 : 95 400 : 206 206 : 27 25 24 4 4 5 96 500 : 46 255 346 27 26 26 3 4 5 142 960 : 142 960 : 29 25 : 3 4 : 83 310 331 0 205 166 34 25 22 5 5 6 96 500 : 46 206 : 27 26 26 3 3 4 : : : : : :
: : : 4 4 : 300 1 000 : 300 1 000 :a) 23 24 25 : : 4 1 500 5 000 : : : :
: : : : : : : : : : : :
4.23 Average prices and releases for DVD disc sales and rental
European countries, source: Screen Digest/IVF
a) Source: Adams Media Research


5. Television market


A 81
High saturation of TV households limitsgrowth in revenues from public funding
The television market (excluding cable and satellite)in the EU had a turnover of at least 45 billion euroin 2000, with an annual growth rate of 5% for pub-lic TV broadcasters and 14% for private TV broad-casters between 1995 and 2000. If including cableand satellite, the total broadcasting market amount-ed to 58 billion euro.
The television market continues to account for amajor portion of the total broadcasting market, witha share over 79% in the EU. The turnover of publicand private TV broadcasters in the UK was estimat-ed at 14.3 billion euro in 2000, followed byGermany with 11.0 billion euro and France with 6.9billion euro.
The main factors driving market growth in thebroadcasting sector are the increase of income fromTV advertising and sponsorship. Advertising revenueis a primary source of financing, which doubled inthe nineties to reach nearly 27 billion euro in 2000,even though the amount of advertising on every TVchannel is regulated (Television Without FrontiersDirective 89/552/EEC, amended in 1997). Abouttwo thirds of advertising expenditure in the EU isdirected towards the private broadcasters.
Public funding is the second source of income forthe broadcasting market (30% of the income for thebroadcasting market in the EU), after advertising(48%) and before subscription fees (22%). In gener-al, public funding consists of licence fees (28%) paidby private households or by subsidies (2%) frompublic bodies. While public funding only accountsfor 2% of the total market income in the UnitedStates, the ratio varies between 20% to 55% in manyEuropean countries: over 50% in Sweden, Finland,Denmark and Austria, but less than 20% in Portugal,Greece, Spain and Luxembourg. In Portugal, Spainand Luxembourg there are no licence fees for TV atall.
The number of public TV programme services in theEU has increased from an average 2 channels percountry in 1980 to nearly 4 channels per country in2000. The number of public channels in the EUamounted to 57 in 2000.
With a share of 96.8% of the private households inthe EU with TV sets in 2000, the penetration ratehas saturated. However the cable and satellite mar-kets still have the potential to grow.
57
31 31
57
5454
46 45
36
0
10
20
30
40
50
60
80 85 90 95 96 97 98 99 00
EU-15
5. Television market
90919293949596979899
100
P
98
E
00
N
99
EL
99
L
00
D
00
NL
00
IS
00
S
00
UK
99
DK
00
I
00
FIN
00
A
99
B
99
F
00
IRL
99
CH
98
EU-
15
99
US
zz
99
JP
zz
97
[%]
Source: see tables on the following pages
14
6 5
4 4 3 3 3 3 3
2 2 2 2 1
0
2
4
6
8
10
12
14
16
D I E F S DK EL IRL NL FIN B A P UK LNote that free national commercial TV channels are excluded (For example, inthe UK there are additional 3 free national commercial TV channels).
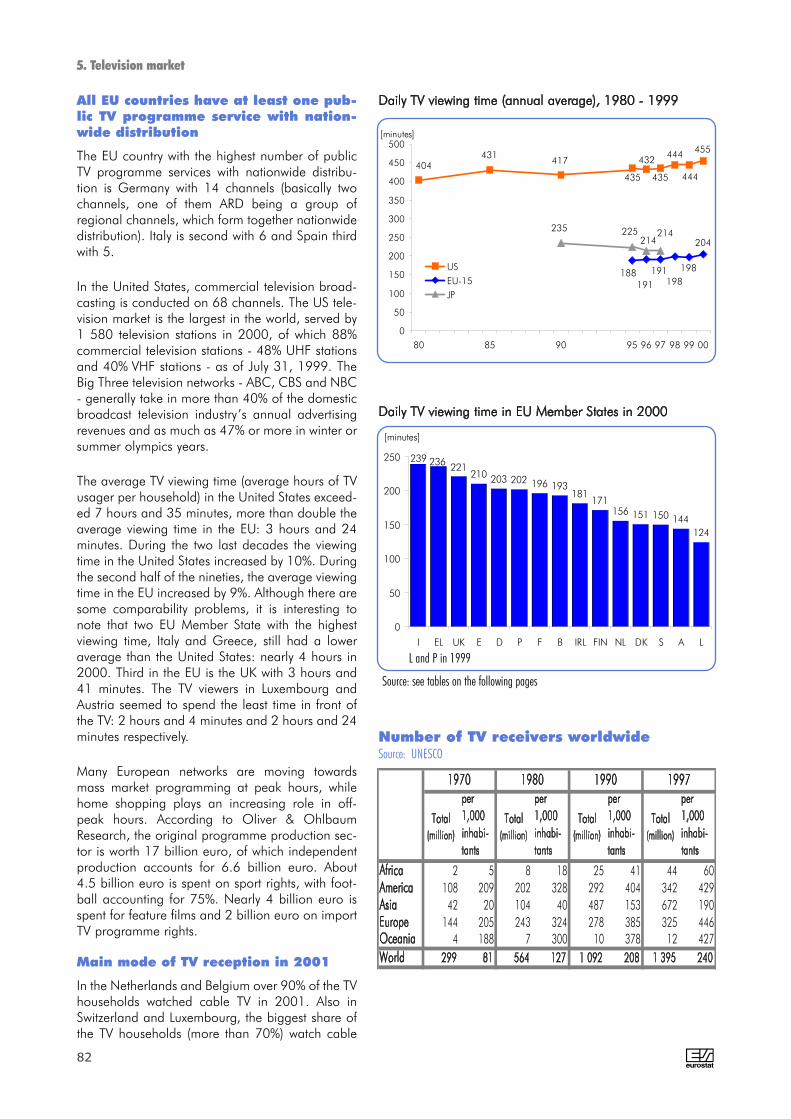
A82
5. Television market
All EU countries have at least one pub-lic TV programme service with nation-wide distribution
The EU country with the highest number of publicTV programme services with nationwide distribu-tion is Germany with 14 channels (basically twochannels, one of them ARD being a group ofregional channels, which form together nationwidedistribution). Italy is second with 6 and Spain thirdwith 5.
In the United States, commercial television broad-casting is conducted on 68 channels. The US tele-vision market is the largest in the world, served by1 580 television stations in 2000, of which 88%commercial television stations - 48% UHF stationsand 40% VHF stations - as of July 31, 1999. TheBig Three television networks - ABC, CBS and NBC- generally take in more than 40% of the domesticbroadcast television industry’s annual advertisingrevenues and as much as 47% or more in winter orsummer olympics years.
The average TV viewing time (average hours of TVusager per household) in the United States exceed-ed 7 hours and 35 minutes, more than double theaverage viewing time in the EU: 3 hours and 24minutes. During the two last decades the viewingtime in the United States increased by 10%. Duringthe second half of the nineties, the average viewingtime in the EU increased by 9%. Although there aresome comparability problems, it is interesting tonote that two EU Member State with the highestviewing time, Italy and Greece, still had a loweraverage than the United States: nearly 4 hours in2000. Third in the EU is the UK with 3 hours and41 minutes. The TV viewers in Luxembourg andAustria seemed to spend the least time in front ofthe TV: 2 hours and 4 minutes and 2 hours and 24minutes respectively.
Many European networks are moving towardsmass market programming at peak hours, whilehome shopping plays an increasing role in off-peak hours. According to Oliver & OhlbaumResearch, the original programme production sec-tor is worth 17 billion euro, of which independentproduction accounts for 6.6 billion euro. About4.5 billion euro is spent on sport rights, with foot-ball accounting for 75%. Nearly 4 billion euro isspent for feature films and 2 billion euro on importTV programme rights.
Main mode of TV reception in 2001
In the Netherlands and Belgium over 90% of the TVhouseholds watched cable TV in 2001. Also inSwitzerland and Luxembourg, the biggest share ofthe TV households (more than 70%) watch cable
210 203 202 196 193181
171156 151 150 144
124
239 236 221
0
50
100
150
200
250
I EL UK E D P F B IRL FIN NL DK S A L
[minutes]
455444
444
432
435 435
417 431
404
204
191198
198188191
214 214
225 235
0
50
100
150
200
250
300
350
400
450
500
80 85 90 95 96 97 98 99 00
US
EU-15
JP
[minutes]
Source: see tables on the following pages
L and P in 1999
Total (million)
per 1,000 inhabi-tants
Total (million)
per 1,000 inhabi-tants
Total (million)
per 1,000 inhabi-tants
Total (million)
per 1,000 inhabi-tants
Africa 2 5 8 18 25 41 44 60America 108 209 202 328 292 404 342 429Asia 42 20 104 40 487 153 672 190Europe 144 205 243 324 278 385 325 446Oceania 4 188 7 300 10 378 12 427World 299 81 564 127 1 092 208 1 395 240
19971970 1980 1990
Number of TV receivers worldwideSource: UNESCO

A 83
Source: SES-ASTRAIS, US and JP data from 1999
Main mode of TV reception among TV households in 2001
TV households Satellite Cable Terrestrial
(million) (%) (%) (%)
EU-15 145.3 18.6 30.9 50.5B 4.7 4.6 93.5 2.0DK 2.3 23.4 44.6 32.0D 36.2 35.9 57.0 7.1EL 3.0 2.5 0.3 97.2E 12.0 17.7 3.6 78.7F 21.4 20.4 12.8 66.8IRL 1.2 10.4 54.1 35.6I 20.7 11.7 0.4 87.8L 0.2 19.4 78.1 1.9NL 6.6 4.9 94.0 1.1A 3.2 45.2 35.3 19.6P 3.1 9.3 23.6 67.2FIN 2.3 10.2 32.0 57.9S 4.0 25.9 44.0 30.0UK 24.4 23.2 15.5 61.3IS 0.1 2.9 2.0 91.2N 2.0 27.0 42.7 30.3CH 3.0 19.9 73.0 7.1US 100.8 8.5 68.1 23.4JP 43.9 20.0 33.0 47.0
5. Television market
TV. Note that the figure reflects main mode of TVreception. A household may have one or severalmodes of reception. In the US, 68% of the TVhouseholds watch cable TV. Also in Germany andIreland over half of the TV households watch cableTV.
Austria and Germany are the Member States hav-ing the biggest share of their TV households watch-ing satellite TV (45% and 36% respectively). InNorway, Sweden, Denmark, the UK, France andJapan between one fourth and one fifth of the TVhouseholds watch satellite TV.
In Greece, Italy, Iceland and Spain, majority of theTV households have to rely principally on terrestrialTV (between 79% and 97%). The share of terrestri-al TV is also more than half in Portugal, France, theUK and Finland.
Equipment: Strong growth in 16:9 TVsets
The number of television receivers worldwide dou-bled each decade in the seventies and eighties.Main growth appeared in Asia, accounting for 48%of TV sets in 1997. World growth saturated duringthe nineties (+27% until 1997). Africa seems to bethe next continent for growth (+76% between 1990and 1997), but in absolute terms only 44 millionTV sets (6% of inhabitants) are installed in Africa.
The 16:9 format (widescreen) of TV sets becameincreasingly popular, with an average growth rateof 66% during the second half of the nineties.Video and DVD films are nowadays often adaptedfor this format.
0% 20% 40% 60% 80% 100%
JP
US
EU-15
EL
I
IS
E
F
UK
P
FIN
A
N
S
DK
IRL
D
CH
L
B
NL
Cable Satellite Terrestrial
1996 1997 1998 1999 2000
213 355 625 965 1 380: : : : 430: : : : 950
277 495 755 1 065 1 390 2 8 16 31 60
28 64 129 239 420 360 525 805 1 285 1 610 27 54 119 234 420 15 39 64 94 130 4 11 19 34 150
30 121 441 1 291 2 570 33 63 118 238 430
140 157 217 277 310
Number of households with 16:9 TVequipment 1996-2000, (thousandunits), Source: European Audiovisual Observatory

Data for this indicator should be interpreted carefully.
Source: Eurostat estimatesa) Source: ISTAT
: 3.21 3.59 3.74 3.98 3.98 4.04 a) 4.09 a) :1.90 2.12 2.17 2.28 2.30 2.34 2.36 2.35 2.35
: 24.27 26.46 35.60 36.10 36.97 36.97 37.27 37.36: : 2.88 3.41 3.52 3.59 3.66 3.35 a) :: : 10.59 11.80 : 11.93 c) 11.95 c) 12.18 c) 12.11
17.28 19.00 20.34 21.39 21.69 21.80 22.20 22.40 22.700.81 0.94 1.02 1.07 a) 1.09 a) 1.13 a) 1.18 a) 1.15 a) 1.19
: 18.61 19.93 19.41 19.51 20.21 20.39 20.66 d) 20.71 d): 0.13 0.14 0.15 0.16 0.16 0.16 e) 0.15 a) 0.16 h)
4.76 5.33 5.88 6.34 6.43 6.51 a) 6.56 a) 6.67 6.73: 2.67 2.79 2.95 2.98 3.00 a) 3.03 a) 3.11 h) 3.20 h): : 3.01 3.16 3.04 3.04 3.04 3.13 h) 3.12 h)
1.71 1.92 2.06 2.17 2.18 2.20 f) 2.23 f) 2.24 f) 2.263.36 3.52 3.70 3.94 4.03 3.93 3.99 4.00 4.05 g)
19.90 20.60 21.50 22.30 23.20 23.40 23.60 23.92 24.42 h)
: : 0.09 0.09 0.10 0.10 0.10 0.10 a) 0.10: : 1.66 1.81 1.82 1.85 a) 1.88 a) 1.92 h) 1.97 h)
1.98 2.19 2.44 2.62 2.65 2.92 a) 2.97 a) 2.98 h) 3.03 h)
b) : 86.10 93.10 95.40 95.90 98.00 99.40 100.80 102.20: : : : : 43.90 : : :
5. Television market
5.1 Television households, million
A84
Source: Eurostat, AUVIS domaina) Source: Screen Digest/IVFb) Source: Nielsen Media Researchc) Source: Estudio General de Medios (EGM)-AIMC 1999-2000d) Source: ISTAT
e) 98.7%f) Source: Finnpanel, TV-household surveysg) Source: MMS (Mediemätningar i Skandinavien AB).h) Source: SES/ASTRA
: : 94.4 91.1 96.5 96.3 97.0 96.7 :: : 96.0 96.7 96.9 97.9 97.9 97.0 96.8: : 92.1 96.4 96.8 98.7 98.5 98.6 98.0: : 82.2 90.0 93.5 99.0 99.0 99.1 :: : 92.4 97.5 : 99.5 99.5 99.5 99.5: : 94.0 93.6 94.0 93.1 93.6 93.5 93.6: : 96.5 93.3 94.4 93.1 95.5 92.8 95.7: : 100.5 96.8 97.1 95.4 96.1 96.4 a) 95.7 a): : 95.1 98.7 98.8 98.8 98.6 99.0 99.0: : 96.2 98.7 98.0 98.0 98.0 98.0 98.0: : 95.0 94.2 94.3 94.4 94.5 94.0 :: : 91.3 96.4 94.1 99.7 99.7 : :: : 95.1 96.0 95.0 95.0 96.0 95.0 95.5: : 97.5 96.0 98.0 : 97.0 99.0 97.0: : 94.9 93.5 96.4 96.4 96.4 97.0 98.7: : 98.7 97.0 97.0 97.6 97.6 : 97.7: : 94.8 97.8 98.1 98.0 98.3 99.2
: : 85.7 86.8 86.0 94.3 94.6 93.9 95.4b) : 92.8 99.8 96.5 96.3 97.0 96.9 97.0 97.6
: : : : : 94.0 : : :
5.2 Share of private households with TV set, %

A 85
EU-15 90.2 96.1 102.2 104.8 110.8 116.2 117.7 118.9 120.7EUR-12 66.6 72.2 77.2 78.4 84.0 88.7 89.9 90.4 91.6B 2.93 2.97 3.30 3.41 3.42 3.48 3.47 3.62 3.67DK 1.86 2.01 1.96 2.06 2.08 2.18 2.15 2.18 2.21D 20.76 22.43 24.14 32.31 32.63 33.06 34.05 34.72 35.13EL 2.97 3.23 3.50 : : 0 a) 0 a) 0 a) 0 a)E 0 0 0 0 0 0 0 0 0F 15.97 17.93 19.47 15.98 16.65 20.72 21.16 21.64 22.05IRL 0.64 0.72 0.81 : 0.89 0.87 0.91 0.95 0.96I 13.98 14.52 15.00 16.09 16.12 16.07 15.91 15.94 b) 16.02 b)L 0 0 0 0 0 0 0 0 0NL 4.18 4.57 4.88 6.09 6.03 6.19 6.30 9.14 9.27A 2.23 2.43 2.50 2.65 2.64 2.64 2.34 2.44 2.47P c) 1.38 1.61 1.70 0 0 0 0 0 0FIN 1.54 1.78 1.89 1.92 1.93 1.95 d) 1.97 d) 1.99 d) 2.00 e) S 3.21 3.27 3.30 3.37 3.37 3.36 3.35 3.35 f) 3.59UK 18.52 18.62 19.73 20.92 21.27 21.98 g) 22.40 g) 22.94 g) 23.28IS 0.06 0.07 0.08 0.09 0.09 0.09 h) 0.09 h) 0.09 h) 0.09N 1.20 1.37 1.50 1.58 1.64 3.37 3.37 : :EEA 91.43 97.52 103.75 106.47 112.50 119.69 121.21 : :CH 1.98 2.19 2.44 2.62 2.65 2.66 2.65 : :US 0 0 0 0 0 0 0 0 0JP 29.26 31.51 33.54 35.38 35.82 36.96 36.60 : :
5. Television market
5.3 Number of TV licence fee accounts, million
Source: Eurostat, AUVIS domaina) There is not a license fee in the basis of TV set ownership.b) Source: Raic) TV license fee was abolished in January 1991.d) Finnish Broadcasting company
e) Finnpanel, TV-household surveys.f) Source: RIKAB (Radiotjänst i Kiruna AB).g) Licences in force (excluding uplift)+ARC licences at April each year: sourceDCMS/BBC/Envision.h) Source: SI
j)j)
82 107 147 186 184 180 184 189 190102 144 161 222 226 230 237 247 25444 60 76 100 98 115 104 104 105
a) : : : 0 0 0 0 0 00 0 0 0 0 0 0 0 0
60 77 80 103 108 106 111 113 114: : : 76 78 94 89 89 89
66 64 82 74 82 84 86 89 b) 91 b)0 0 0 0 0 0 0 0 0: : : 90 90 94 96 67 76: : 169 212 211 211 i) 212 : :
c) 23 30 19 0 0 0 0 0 083 126 159 151 148 150 d) 147 d) 148 d) 165 e)97 124 155 154 173 178 176 183 f) 195
: : : 104 110 132 g) 144 g) 153 g) 171111 167 262 283 284 298 h) 301 h) 324 h) :
: : : 171 178 186 181 191 :j)
: : : 158 158 151 153 : :: : : : : : : : :: : : : : : : : :
5.4 Annual TV licence fee, ECU/EUR
Source: Eurostat, AUVIS domain a) There is not a license fee in the basis of TV set ownership. b) Source: Rai c) TV license fee was abolished in January1991. d) Finnish Broadcasting company e) Finnpanel, TV-household surveys. f) Source: RIKAB (Radiotjänst i Kiruna AB). g) Licences in force (excludinguplift)+ARC licences at April each year: source DCMS/BBC/Envision. h) Source: SI i) Source: Eurostat estimate based on average fee for 1996 and 1998. j) Average estimated (sum of fees divided by sum of accounts for respective area).

b)b)
: : 171 229 215 218 : : :: : 353 441 441 547 567 575 592: : : 4 024 4 241 : 4 523 : 4 669: : : : : : : : :: : : : : : : 1 699 1 945: : 1 114 1 803 1 951 2 026 2 047 2 170 :: : 158 186 182 215 218 239 251
698 1 262 2 323 1 999 2 266 2 156 a) 2 096 a) 2 286 a) 2 484: : : : : : : : :: : 579 : : : : 560 602
237 362 533 744 727 722 727 : : 30 58 153 110 156 195 173 202 162
118 248 328 344 349 339 333 318 332: : 256 355 405 386 392 397 404: : : 2 673 2 957 3 721 4 051 : :
6 13 16 16 17 19 20 22 23: : 241 291 345 327 338 : :
b)
: : 313 533 528 498 595 : :: : : : : : : : :: : : : : : : : :
5. Television market
5.5 Turnover of public TV broadcasters of national origin, million ECU/EUR
A86
Source: Eurostat, AUVIS domaina) Source: Autorità per le garanzie nelle telecomunicazioni (AUTCOM)
b) Eurostat estimate, excluding Greece and Luxembourg
c)c)
: : 66 134 143 143 : : :: : : : : : : : :: : : 3 554 4 120 : 4 450 : 6 363: : : : : : : : :: : : : : : : 2 080 2 362: : 1 752 2 603 2 756 3 179 3 487 3 984 :: : : : : : : : :: : : : : 1 744 a) 2 087 2 286 b) 2 484 b) : : 244 271 272 : : : :: : : : : : : : :: : : : : : : : :: : : 111 121 134 155 151 179
46 107 139 166 167 191 209 213 222: : 4 174 189 213 231 248 297: : : 4 425 5 117 6 837 : : :: : : : : 25 29 35 :: : 9 122 131 133 153 : :
c)
: : : : : : : : :d) : : 22 830 28 920 33 459 38 914 42 346 47 705 60 395
: : : : : : : : :
5.6 Turnover of private TV broadcasters of national origin, million ECU/EUR
Source: Eurostat, AUVIS domaina) Autorità per le garanzie nelle telecomunicazioni (AUTCOM) b) RAIc) Eurostat estimate, excluding Denmark, Greece, Ireland, Netherlands and Austria

A 87
1980 1985 1990 1995 1996 1997 1998 1999 2000EU-15 : : 3 793.9 3 832.0 3 952.0 : : : 4 940.8 g)EUR-12 : : : : : : : : 4 788.3 g)
B : : 30.8 44.0 42.3 42.0 : : 647.0 g)DK 0.0 0.0 46.6 69.7 66.0 : 149.1 137.7 147.5 g)D 443.3 646.8 703.7 345.3 339.3 313.6 550.8 : 531.9 g)
EL : : 75.1 19.3 9.0 23.2 36.8 : 160.0 g)E : 480.1 1 289.0 1 345.5 1 427.7 : : 908.1 a) 949.6 b)F 258.6 468.0 324.3 601.8 651.8 654.4 657.3 660.4 750.0 g)
IRL 21.1 36.8 55.9 94.8 86.4 96.8 99.3 : 86.0 g)I 124.5 420.6 731.3 626.7 771.8 808.7 c) 861.1 908.9 1 016.0 g)L : : : : : : : : :NL 72.8 121.9 202.4 232.0 133.2 126.2 155.0 : 182.0 g)A 86.2 132.6 232.4 326.1 306.3 315.4 307.1 : 350.0 g)P 11.8 28.2 102.4 74.0 67.7 63.6 71.8 75.3 d) 68.2 g)
FIN : : : 50.9 48.3 : : 46.8 e) 47.6 e)S : : : 1.6 2.2 1.5 2.5 : 5.0 g)UK : : : : : : : : 0.0 g)
IS : : : : : 4.7 5.9 f) 6.3 f) 6.9N : : : : : : : : :EEA : : : : : : : : :CH 45.2 73.8 116.8 181.0 176.5 158.3 159.6 : :US 51.7 224.1 205.7 224.8 229.2 : : : :JP : : : : : : : : :
5. Television market
5.7 Income from TV advertising and sponsorship, public broadcasters of nationalorigin, million EUR
Source: Eurostat, AUVIS domaina) Source: CMT, Telecommunications Market Comission of Spain. A47Annual Report 1999b) Source: CMT, Telecommunications Market Comission of Spain.c) Source: Autorità per le garanzie nelle telecomunicazioni (AUTCOM)
d) source: RTP, SIC, TVI.e) Receipts from TV and radio broadcasting.f) Source: SIg) Eurostat estimate based on total TV advertising
g)g)
: : : : : : : : 60.0 g): : : : : : : : 98.0 g): : : 3 071.9 3 393.5 : 3 724.0 : 4 100.0 g)
: : 98.9 1 000.6 567.0 564.3 585.4 : 481.0 g): : : : : : 900.8 a) 1 056.0 a,b) 1 197.2 a) : : 975.5 1 372.4 1 405.1 1 445.9 1 532.7 1 751.3 1 991.0 g)
: : : : : : : : 260.0 g): : : : : 1 412.8 c) 1 200.5 f) 1 311.1 f) : : 182.7 186.9 174.6 : : : 255.0 g)
: : : : : : : : 544.0 g): : : : : : : : :: : : 105.6 116.9 130.6 154.2 191.9 d) 165.7
42.9 98.0 : 161.7 161.1 184.0 192.9 : 200.0 g): : 4.0 165.0 179.8 201.0 217.0 231.9 e) 273.7: : : 2 764.3 3 022.9 3 876.9 : : 5 524.0 g)
: : : : : : : : :: : : : : : : : :
: : : : : : : : :: : : : : : : : :: : : : : : : : :
5.8 Income from TV advertising and sponsorship, private broadcasters of nation-al origin, million EUR
Source: Eurostat, AUVIS domaina) Source: CMT, Telecommunications Market Commission of Spain.b) Source: A47Annual Report 1999c) Autorità per le garanzie nelle telecomunicazioni (AUTCOM)
d) source: SIC, TVIe) Data refer to TV4 AB (source).f) Source: RAIg) Eurostat estimate based on total TV advertising
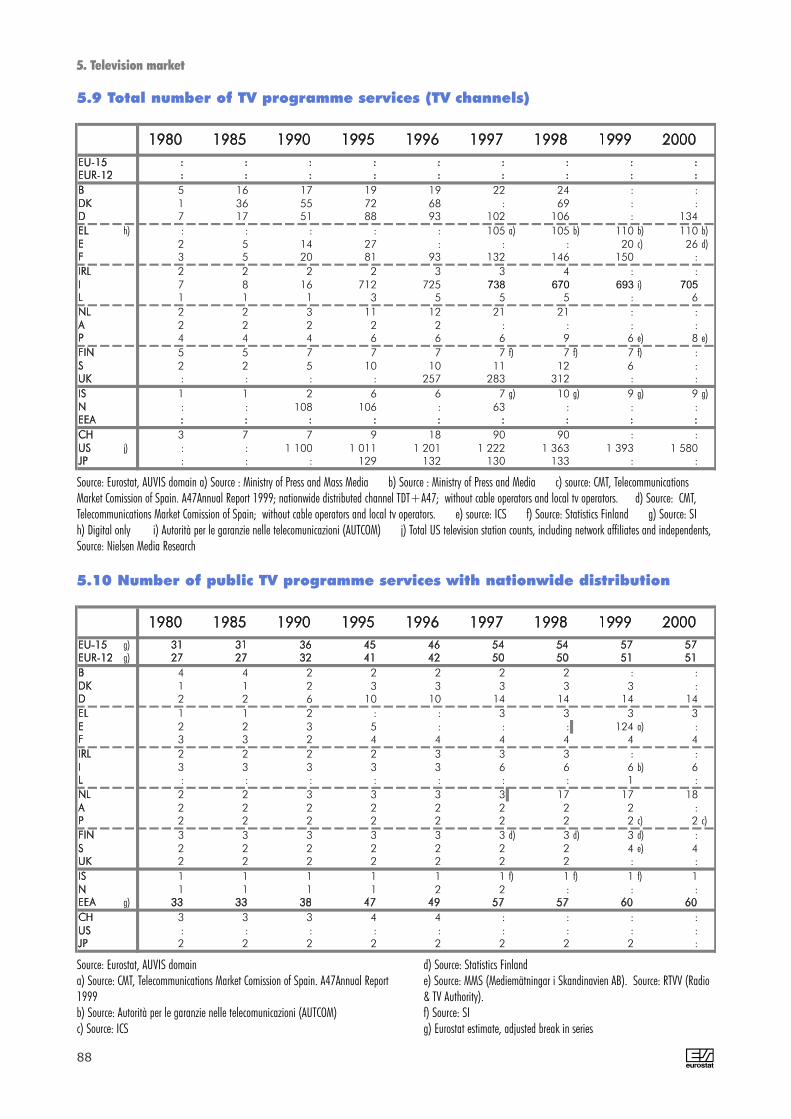
5 16 17 19 19 22 24 : :1 36 55 72 68 : 69 : :7 17 51 88 93 102 106 : 134
h) : : : : : 105 a) 105 b) 110 b) 110 b)2 5 14 27 : : : 20 c) 26 d)3 5 20 81 93 132 146 150 :2 2 2 2 3 3 4 : :7 8 16 712 725 738 670 693 i) 705
1 1 1 3 5 5 5 : 62 2 3 11 12 21 21 : :2 2 2 2 2 : : : :4 4 4 6 6 6 9 6 e) 8 e)
5 5 7 7 7 7 f) 7 f) 7 f) :2 2 5 10 10 11 12 6 :: : : : 257 283 312 : :1 1 2 6 6 7 g) 10 g) 9 g) 9 g): : 108 106 : 63 : : :
3 7 7 9 18 90 90 : :j) : : 1 100 1 011 1 201 1 222 1 363 1 393 1 580
: : : 129 132 130 133 : :
5. Television market
5.9 Total number of TV programme services (TV channels)
A88
Source: Eurostat, AUVIS domain a) Source : Ministry of Press and Mass Media b) Source : Ministry of Press and Media c) source: CMT, TelecommunicationsMarket Comission of Spain. A47Annual Report 1999; nationwide distributed channel TDT+A47; without cable operators and local tv operators. d) Source: CMT,Telecommunications Market Comission of Spain; without cable operators and local tv operators. e) source: ICS f) Source: Statistics Finland g) Source: SIh) Digital only i) Autorità per le garanzie nelle telecomunicazioni (AUTCOM) j) Total US television station counts, including network affiliates and independents,Source: Nielsen Media Research
g)g)
4 4 2 2 2 2 2 : :1 1 2 3 3 3 3 3 :2 2 6 10 10 14 14 14 141 1 2 : : 3 3 3 32 2 3 5 : : : 124 a) :3 3 2 4 4 4 4 4 42 2 2 2 3 3 3 : :3 3 3 3 3 6 6 6 b) 6: : : : : : : 1 :2 2 3 3 3 3 17 17 182 2 2 2 2 2 2 2 :2 2 2 2 2 2 2 2 c) 2 c)
3 3 3 3 3 3 d) 3 d) 3 d) :2 2 2 2 2 2 2 4 e) 42 2 2 2 2 2 2 : :1 1 1 1 1 1 f) 1 f) 1 f) 11 1 1 1 2 2 : : :
g)
3 3 3 4 4 : : : :: : : : : : : : :2 2 2 2 2 2 2 2 :
5.10 Number of public TV programme services with nationwide distribution
Source: Eurostat, AUVIS domaina) Source: CMT, Telecommunications Market Comission of Spain. A47Annual Report1999b) Source: Autorità per le garanzie nelle telecomunicazioni (AUTCOM)c) Source: ICS
d) Source: Statistics Finlande) Source: MMS (Mediemätningar i Skandinavien AB). Source: RTVV (Radio& TV Authority).f) Source: SIg) Eurostat estimate, adjusted break in series

A 89
1 1 2 3 3 4 5 : :0 0 0 0 0 1 2 1 :0 0 4 20 23 23 26 26 300 0 2 : : 9 9 11 130 0 3 12 : : : 4 :0 0 4 3 3 67 a) 78 a) 87 a) 89 a)
0 0 0 0 0 0 1 : :3 3 11 11 11 11 11 11 b) 111 1 1 1 1 1 1 2 3: : : 4 4 7 8 9 130 0 0 0 0 0 : : :0 0 0 2 2 2 5 2 c) 2 c)
1 1 2 1 1 2 2 2 :: : : 1 1 1 1 1 d) 14 a): : : : : : : : :: : 0 1 1 1 1 2 20 - 1 3 3 3 : : :
: : : : : : : : :: : : : : : : : :: : : : : 6 6 : :
5. Television market
5.11 Number of private TV programme services with nationwide distribution
Source: Eurostat, AUVIS domaina) Data includes private subscriptionb) Autorità per le garanzie nelle telecomunicazioni (AUTCOM)c) source: ICS
d) Source: MMS (Mediemätningar i Skandinavien AB). Source: RTVV (Radio& TV Authority).
f)
: 147 : 176 180 173 202 e) 189 e) 193 e): : : 164 166 155 162 159 151: : : 175 183 183 201 198 203: : 145 220 238 249 253 227 e) 236 e): : : : : 209 a) 210 a) 213 a) 210 b)
e) : : 184 180 180 180 : 189 196: : : 188 188 182 194 186 e) 181 e): : 191 213 215 212 221 225 e) 239 e): : : 156 144 136 : 124 e) :: : 116 151 157 155 165 105 156
e) : : : 139 141 : : 138 144: : : 169 165 165 157 202 c) :
103 111 104 140 149 149 149 161 171 e): : : 134 140 141 144 143 d) 150: 226 206 215 215 215 217 220 221 e)
: : : : : : 142 120 147: : : 143 150 119 119 141 138
: : : : : : : : :g) 404 431 417 435 432 435 444 444 455
: : 235 225 214 214 : : :
5.12 Daily TV viewing time, minutes
Annual average Source: Eurostat, AUVIS domain a) Source: CMT, Telecommunications Market Comission of Spain. A47Annual Report 1999; minutes per dayb) Source: CMT, Telecommunications Market Comission of Spain. c) Source: Marktest, Adults: 14 years old and more. d) Source: MMS (Mediemätningar iSkandinavien AB). e) Source: European Audiovisual Observatory f) EU-15 estimate based on average among countries with data available for both daily viewingtime and number of TV households g) US average time of TV usage per household, Source: Nielsen Media Research


6. Cable operating market and satellite market


A 93
Nearly 31% of TV households in theEU are connected to cable networks
Cable television is a delivery system that pro-vides from ten to several hundred channels ofvideo programming to subscribers through acoaxial cable or optic fibre network connectedto the subscriber’s television set. For a monthlyfee, subscribers receive basic cable service andmay have the option to subscribe to additionalchannels or other services such as high-speedInternet access, for extra monthly fees.
Unlike broadcast television stations, cable sys-tem operators derive most of their income frommonthly subscriber fees. According to Eurostatestimates, 12.1 billion euro of income wasreceived from subscription fees to cable net-works and satellite channels in 2000.
In addition to recurring subscriber program-ming revenues, cablers get income from instal-lation charges, sales of pay-per-view films andevents, set-top rentals, remote control sales andrentals, advertising, and carriage fees fromhome shopping channels.
During the nineties the number of cable TVconnections doubled in the EU: from 22 millionin 1990 to 45 million in 2000. The EU countrywith the highest number of households con-nected to operated cable networks wasGermany with 20.6 million households.Second was the Netherlands with 6.4 millioncable TV connections.
While nearly 70% of TV households are con-nected to operated cable networks in theUnited States, just 30% of the TV households inthe EU are. The level in Japan is similar to theEU average. But within the EU there is a cleardisparity: In Belgium and the Netherlands, thecable connection rate is over 90%. In Franceand the UK, only 13% to 15% of the TV house-holds are connected with cable TV. Italy,Greece, Iceland and Spain have a connectionrate below 4%.
7
31 33
0.4
6857
54
4544 43 42 35
30
15 13
4 0.5
94
7873
94
0
20
40
60
80
100
NL B L CH D IRL DK S N FIN A P UK F IS E EL
99
I EU-
15
US JP
97
[%]
6. Cable operating market and satellite market
67.5
68.167.3
66.7 46.2
69.4
68.0
65.7 59.0
30.3
26.2
27.7
17.1
28.9 30.627.7
33.0
0
10
20
30
40
50
60
70
80
90
100
85 90 95 96 97 98 99 00 01
USEU-15JP
[%]
6.44.4 3.6 3.0
1.8 1.1 1.1 1.0 0.9 0.7 0.5 0.1 0.1 0.01
20.6
0
5
10
15
20
25
D NL B UK F S A DK FIN P IRL E L I EL
[million]
Source: see tables on the following pages

A94
One of five TV households in the EU
watches satellite TV
The number of satellite households increased by60% from 1995 to 2000 in the EU. In 2000, 22% ofthe TV households in the EU watched satellite TV.
Austria is the country with the highest satellite house-hold density, 45%, followed by Germany (32%) andNorway (27%). On the other end of the scale areGreece, with 3%, Belgium (5%) and the Netherlands(5%). Germany has the highest absolute number ofsatellite households in the EU: 12 million in 2000. In1985, SAT-1 became Germany's first private satellitetelevision station. Other stations subsequently sprangup. The percentage of Germans watching publicchannels has dropped to less than half since the startof private broadcasting in 1987.
The United Kingdom has the second largest numberof satellite households in the EU with 4.2 millionhouseholds, closely followed by France with 3.8 mil-lion. One of the trends is the increase of digital chan-nels. Sky digital was launched in 1998 offering 140channels. It had more than 3 million digital sub-scribers in 2000. Another example is theScandinavian market, where Viasat shut down manyof its analogue signals on 1 May 2001. One of thereasons was to force the many non-paying viewers tostart subscribe for its digital package, since the oldD2-MAC encryption was too easy to by-pass.However, the digital packages are also affected bypirates.
In 2001, only 12% of the American TV householdswatch satellite TV. The number of subscriptions hashowever increased by 390% since 1995. The incomefrom subscription to cable networks and to encrypt-ed airwave and satellite channels was highest in theUnited States, 19.8 billion euro in 1997. The num-ber of subscribers has doubled in 2001, however, nodetailed data are available yet. Most of the USincome stems from basic cable subscription. The EUmarket was much smaller in value: 9.7 billion euroin 1997. However, the income growth is higher:25%. Germany, the UK and France had each a totalincome exceeding 2 billion euro in 1997.
Société Européenne des Satellites S.A. (SES) is theoperator of ASTRA. Its total revenues amounted to836 million euro in 2000. Via eleven satellites,ASTRA transmits 1 072 television and radio channelsin analogue and digital format as well as multimediaand Internet services In 2000 it reached 87.5 millionhomes in Europe, of which 30.9 million via direct-to-home reception. Paris-based EUTELSAT is also oneof the important satellite operators broadcasting over850 television channels into 84 million satellite andcable homes.
6. Cable operating market and satellite market
12.2
8.58.44.6
6.53.5
9.4
21.7
19.218.9
16.4
16.9
14.3
20.0
0
5
10
15
20
25
95 96 97 98 99 00 01
USEU-15JP
[%]
4.2 3.8
2.41.5 1.4 1.1 0.6 0.3 0.3 0.3 0.2
0.130.07
0.02
12.0
0
2
4
6
8
10
12
14
D UK F I A E S DK FIN NL P B IRL EL L
[million]
Source: see tables on the following pages
45
32
27 2623
2017 17 15
13 11 11 11 9 85 5
3
22
9
20
0
10
20
30
40
50
A D N S DK CH UK F FIN L E I IRL P IS NL B EL EU-
15
US JP
97
[%]

95
1980 1985 1990 1995 1996 1997 1998 1999 2000 2001
: : 3.73 3.75 3.80 3.80 h) 3.80 h) 3.90 h) 3.90 h) 3.90 h): : 1.52 1.50 1.60 1.60 1.65 1.67 h) 1.67 h) 1.70 h): : 15.96 24.19 24.92 24.90 h) 25.60 h) 26.00 h) 26.00 h) : h)
: : : : : : : 0.11 f) : :h) : : : : : 1.00 1.00 1.03 1.41 2.00 h)
: 0.14 2.28 6.53 6.88 6.99 7.37 7.74 8.39 :: : 0.50 0.51 0.60 0.52 0.59 0.60 h) 0.65 h) :: : : 0.60 : 1.03 b) 1.12 b) 0.84 b) : :: : : 0.15 : : : 0.12 f) : :: : 5.25 6.05 6.10 6.20 6.28 6.46 f) 6.46 h) :
h) : : : : : 1.69 1.70 1.70 1.70 :0.00 0.00 0.00 0.38 0.98 1.47 1.83 2.26 c) 2.60 c) :
h) : : : : : 1.20 1.20 1.30 1.35 1.39: : 1.60 2.10 2.20 2.40 2.40 2.60 h) 2.75 h) :: : 0.84 5.57 7.79 9.43 d) 11.37 d) 12.17 d) 12.65 h) 13.14 h)
: : : 0.01 0.02 0.02 e) 0.03 e) 0.03 e) 0.03 e) :: : 0.68 0.80 0.83 0.83 0.85 h) 0.90 h) 0.90 h) 1.10 h)
h) : : : : : 2.68 2.80 2.86 2.98 3.03g) : : : 92.70 93.70 94.20 95.10 95.60 96.10 :
: : : : 14.80 19.32 : : : :
6. Cable operating market and satellite market
6.1 Households passed by operated cable networks, million
Source: Eurostat, AUVIS domain a) Source: CMT, Telecommunications Market Comission of Spain. b) Telecom Italia (TI) c) Source: ICP d) source: ITCe) Estimation based upon various sources. SI f) Eurostat estimate, based on Inside Cable & Telecoms Europe online database, adjusted by households g) Dataestimated, based on the Motion Picture Association of America data h) Source: European Audiovisual Observatory
1980 1985 1990 1995 1996 1997 1998 1999 2000 2001
2.31 2.82 3.37 3.63 3.68 3.72 3.74 4.07 i) 4.43 i) :0.00 0.00 0.86 1.32 0.75 : : 0.74 i) 1.05 i) :
: 1.56 8.10 15.80 16.70 17.28 22.00 18.76 i) 20.62 i) :: : : 0.00 0.00 : : 0.02 f) 0.01 i) :: : 0.11 0.40 0.44 : 0.48 0.45 f) 0.47 a) :: : 0.52 1.89 2.11 2.35 2.59 2.84 3.04 :: : 0.39 0.46 0.47 : 0.54 0.59 i) 0.66 i) :: : : 0.32 : 0.84 b) 1.07 b) 1.10 b) 0.09 i) :: : 0.10 0.13 : : : 0.13 i) 0.12 i) :
1.06 2.75 4.98 5.77 5.64 5.92 6.06 6.19 f) 6.39 :: 0.28 0.63 1.08 1.08 1.11 1.17 1.09 i) 1.13 i) :
0.00 0.00 0.00 0.06 0.17 0.38 0.60 : 0.93 I) :0.07 0.21 0.67 0.82 0.85 0.88 d) 0.91 d) 0.93 d) 0.95 d) :
: : 1.48 1.54 1.65 1.57 1.72 1.77 i) 1.77 i) :: : 0.16 1.22 2.02 2.07 e) 2.47 e) 2.91 e) 3.55 e) :: : : : : 0.00 0.00 0.01 0.01 :: : 0.48 0.68 0.67 0.67 0.71 0.82 i) 0.84 i) :
0.85 1.28 1.87 2.40 2.46 2.52 2.54 : 2.21 i) :g) 17.63 39.78 54.93 62.68 63.97 65.95 67.10 68.60 69.50 73.20h) : : 6.77 11.00 12.63 14.48 15.82 17.65 18.71 :
6.2 Households connected to operated cable networks, million
Source: Eurostat, AUVIS domain a) Source: CMT, Telecommunications Market Comission of Spain. b) Telecom Italia (TI) c) Source: ICP d) Source:Ministry of transport and communications. e) Source: ITC; According to ITC, all homes in UK connected to cable TV have to pay a subscription fee. f) Eurostatestimate, based on Inside Cable & Telecoms Europe online database, adjusted by households g) Data estimated, based on the Motion Picture Association of Americadata h) Source: source: Regional Broadcasting Division, Information and Communications Policy Bureau, Ministry of Public Management, Home Affairs, Post andTelecommunications i) Source: SES/ASTRA
A
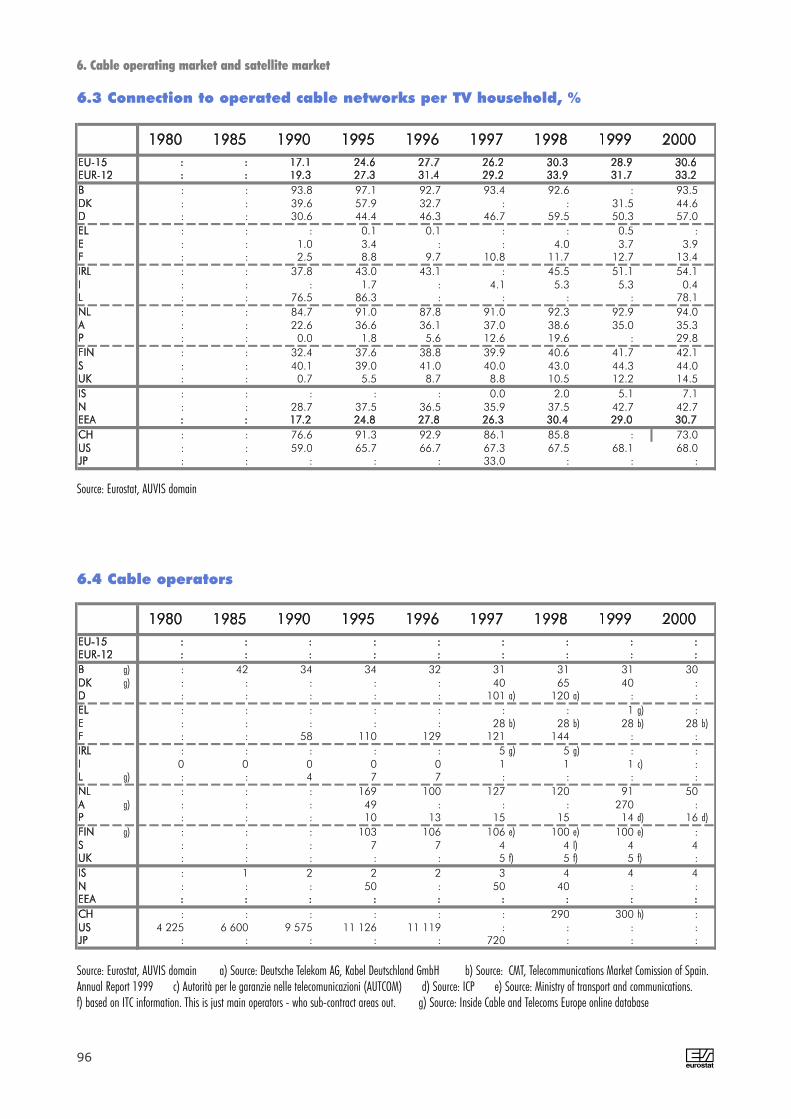
: : 93.8 97.1 92.7 93.4 92.6 : 93.5: : 39.6 57.9 32.7 : : 31.5 44.6: : 30.6 44.4 46.3 46.7 59.5 50.3 57.0: : : 0.1 0.1 : : 0.5 :: : 1.0 3.4 : : 4.0 3.7 3.9: : 2.5 8.8 9.7 10.8 11.7 12.7 13.4: : 37.8 43.0 43.1 : 45.5 51.1 54.1: : : 1.7 : 4.1 5.3 5.3 0.4: : 76.5 86.3 : : : : 78.1: : 84.7 91.0 87.8 91.0 92.3 92.9 94.0: : 22.6 36.6 36.1 37.0 38.6 35.0 35.3: : 0.0 1.8 5.6 12.6 19.6 : 29.8: : 32.4 37.6 38.8 39.9 40.6 41.7 42.1: : 40.1 39.0 41.0 40.0 43.0 44.3 44.0: : 0.7 5.5 8.7 8.8 10.5 12.2 14.5: : : : : 0.0 2.0 5.1 7.1: : 28.7 37.5 36.5 35.9 37.5 42.7 42.7
: : 76.6 91.3 92.9 86.1 85.8 : 73.0: : 59.0 65.7 66.7 67.3 67.5 68.1 68.0: : : : : 33.0 : : :
6. Cable operating market and satellite market
6.3 Connection to operated cable networks per TV household, %
A96
Source: Eurostat, AUVIS domain
g) : 42 34 34 32 31 31 31 30g) : : : : : 40 65 40 :
: : : : : 101 a) 120 a) : :: : : : : : : 1 g) :: : : : : 28 b) 28 b) 28 b) 28 b) : : 58 110 129 121 144 : :: : : : : 5 g) 5 g) : :0 0 0 0 0 1 1 1 c) :
g) : : 4 7 7 : : : :: : : 169 100 127 120 91 50
g) : : : 49 : : : 270 :: : : 10 13 15 15 14 d) 16 d)
g) : : : 103 106 106 e) 100 e) 100 e) :: : : 7 7 4 4 l) 4 4: : : : : 5 f) 5 f) 5 f) :: 1 2 2 2 3 4 4 4: : : 50 : 50 40 : :
: : : : : : 290 300 h) :4 225 6 600 9 575 11 126 11 119 : : : :
: : : : : 720 : : :
6.4 Cable operators
Source: Eurostat, AUVIS domain a) Source: Deutsche Telekom AG, Kabel Deutschland GmbH b) Source: CMT, Telecommunications Market Comission of Spain.Annual Report 1999 c) Autorità per le garanzie nelle telecomunicazioni (AUTCOM) d) Source: ICP e) Source: Ministry of transport and communications.f) based on ITC information. This is just main operators - who sub-contract areas out. g) Source: Inside Cable and Telecoms Europe online database
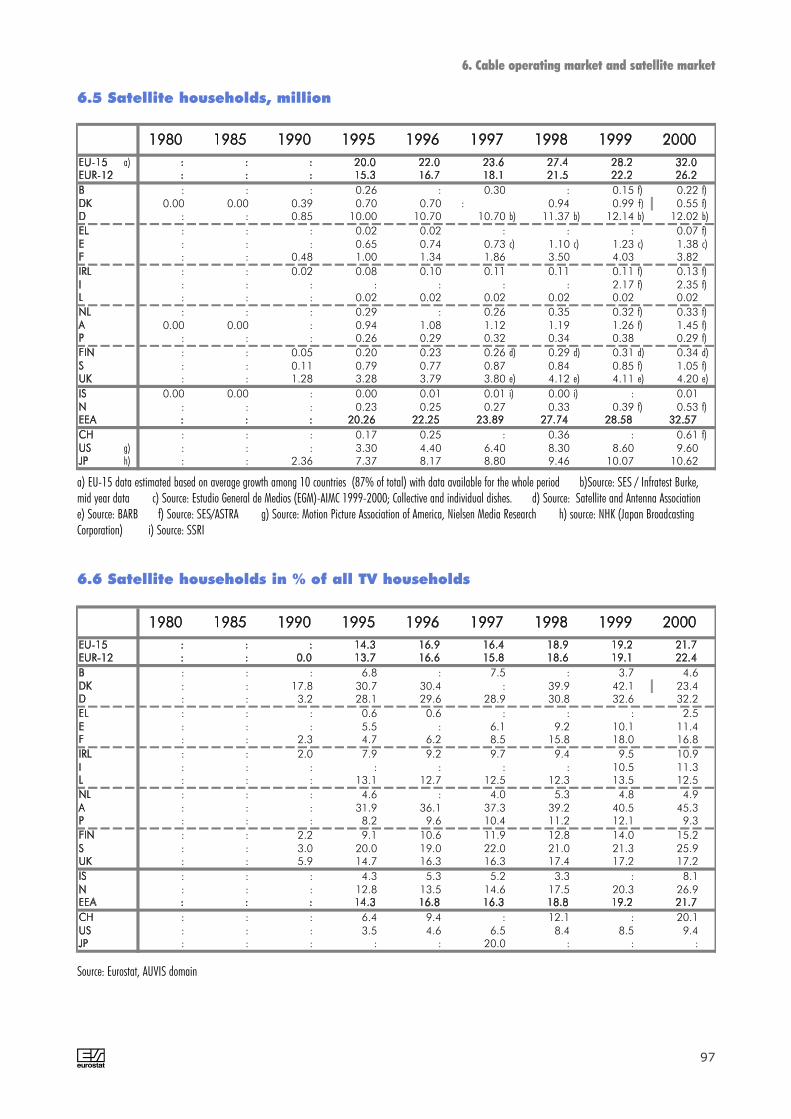
A 97
a)
: : : 0.26 : 0.30 : 0.15 f) 0.22 f)0.00 0.00 0.39 0.70 0.70 : 0.94 0.99 f) 0.55 f)
: : 0.85 10.00 10.70 10.70 b) 11.37 b) 12.14 b) 12.02 b)
: : : 0.02 0.02 : : : 0.07 f): : : 0.65 0.74 0.73 c) 1.10 c) 1.23 c) 1.38 c): : 0.48 1.00 1.34 1.86 3.50 4.03 3.82: : 0.02 0.08 0.10 0.11 0.11 0.11 f) 0.13 f): : : : : : : 2.17 f) 2.35 f): : : 0.02 0.02 0.02 0.02 0.02 0.02: : : 0.29 : 0.26 0.35 0.32 f) 0.33 f)
0.00 0.00 : 0.94 1.08 1.12 1.19 1.26 f) 1.45 f): : : 0.26 0.29 0.32 0.34 0.38 0.29 f)
: : 0.05 0.20 0.23 0.26 d) 0.29 d) 0.31 d) 0.34 d) : : 0.11 0.79 0.77 0.87 0.84 0.85 f) 1.05 f): : 1.28 3.28 3.79 3.80 e) 4.12 e) 4.11 e) 4.20 e)
0.00 0.00 : 0.00 0.01 0.01 i) 0.00 i) : 0.01: : : 0.23 0.25 0.27 0.33 0.39 f) 0.53 f)
: : : 0.17 0.25 : 0.36 : 0.61 f)g) : : : 3.30 4.40 6.40 8.30 8.60 9.60h) : : 2.36 7.37 8.17 8.80 9.46 10.07 10.62
6. Cable operating market and satellite market
6.5 Satellite households, million
a) EU-15 data estimated based on average growth among 10 countries (87% of total) with data available for the whole period b)Source: SES / Infratest Burke,mid year data c) Source: Estudio General de Medios (EGM)-AIMC 1999-2000; Collective and individual dishes. d) Source: Satellite and Antenna Associatione) Source: BARB f) Source: SES/ASTRA g) Source: Motion Picture Association of America, Nielsen Media Research h) source: NHK (Japan BroadcastingCorporation) i) Source: SSRI
: : : 6.8 : 7.5 : 3.7 4.6: : 17.8 30.7 30.4 : 39.9 42.1 23.4: : 3.2 28.1 29.6 28.9 30.8 32.6 32.2: : : 0.6 0.6 : : : 2.5: : : 5.5 : 6.1 9.2 10.1 11.4: : 2.3 4.7 6.2 8.5 15.8 18.0 16.8: : 2.0 7.9 9.2 9.7 9.4 9.5 10.9: : : : : : : 10.5 11.3: : : 13.1 12.7 12.5 12.3 13.5 12.5: : : 4.6 : 4.0 5.3 4.8 4.9: : : 31.9 36.1 37.3 39.2 40.5 45.3: : : 8.2 9.6 10.4 11.2 12.1 9.3: : 2.2 9.1 10.6 11.9 12.8 14.0 15.2: : 3.0 20.0 19.0 22.0 21.0 21.3 25.9: : 5.9 14.7 16.3 16.3 17.4 17.2 17.2: : : 4.3 5.3 5.2 3.3 : 8.1: : : 12.8 13.5 14.6 17.5 20.3 26.9
: : : 6.4 9.4 : 12.1 : 20.1: : : 3.5 4.6 6.5 8.4 8.5 9.4: : : : : 20.0 : : :
6.6 Satellite households in % of all TV households
Source: Eurostat, AUVIS domain
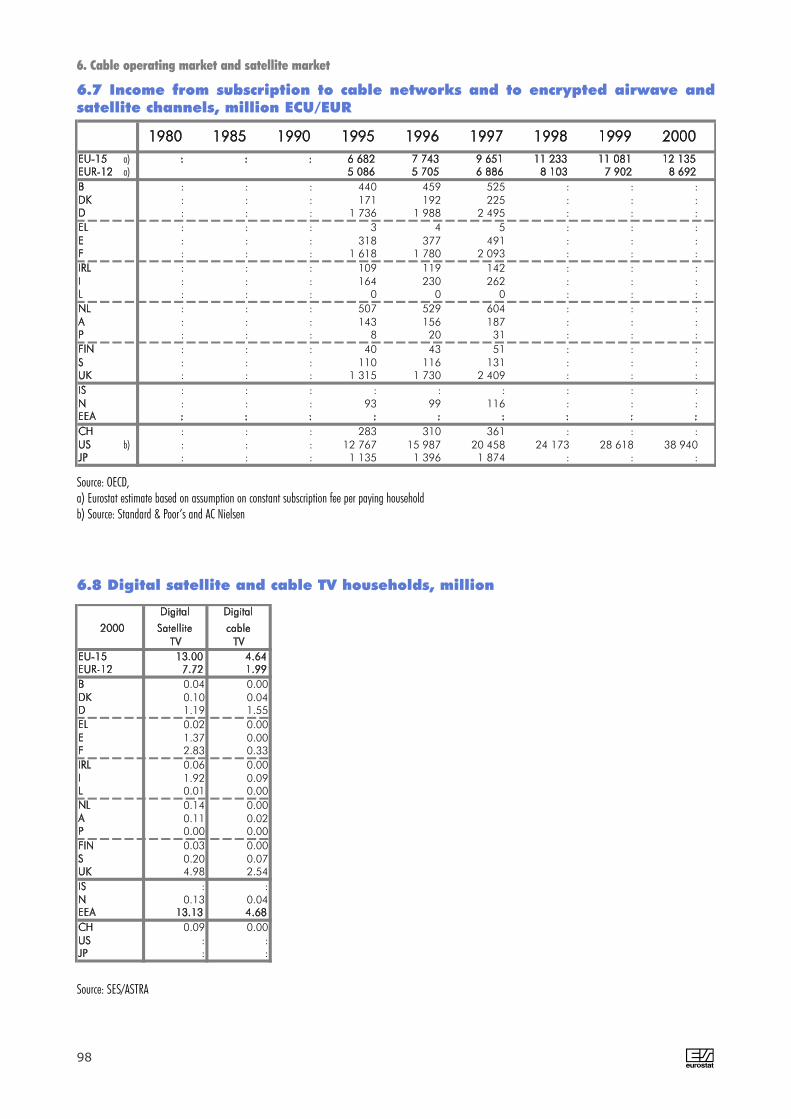
a)a)
: : : 440 459 525 : : :: : : 171 192 225 : : :: : : 1 736 1 988 2 495 : : :: : : 3 4 5 : : :: : : 318 377 491 : : :: : : 1 618 1 780 2 093 : : :: : : 109 119 142 : : :: : : 164 230 262 : : :: : : 0 0 0 : : :: : : 507 529 604 : : :: : : 143 156 187 : : :: : : 8 20 31 : : :: : : 40 43 51 : : :: : : 110 116 131 : : :: : : 1 315 1 730 2 409 : : :: : : : : : : : :: : : 93 99 116 : : :
: : : 283 310 361 : : :b) : : : 12 767 15 987 20 458 24 173 28 618 38 940
: : : 1 135 1 396 1 874 : : :
6. Cable operating market and satellite market
6.7 Income from subscription to cable networks and to encrypted airwave andsatellite channels, million ECU/EUR
A98
Source: OECD,a) Eurostat estimate based on assumption on constant subscription fee per paying householdb) Source: Standard & Poor’s and AC Nielsen
Digital Digital
2000 Satellite cableTV TV
EU-15 13.00 4.64EUR-12 7.72 1.99B 0.04 0.00DK 0.10 0.04D 1.19 1.55EL 0.02 0.00E 1.37 0.00F 2.83 0.33IRL 0.06 0.00I 1.92 0.09L 0.01 0.00NL 0.14 0.00A 0.11 0.02P 0.00 0.00FIN 0.03 0.00S 0.20 0.07UK 4.98 2.54IS : :N 0.13 0.04EEA 13.13 4.68CH 0.09 0.00US : :JP : :
Source: SES/ASTRA
6.8 Digital satellite and cable TV households, million

7. Sound recordings market


A 101
7. Sound recordings market
EU’s music market has grown steadilyover the past two decades
The music market in the EU has grown steadily overthe past two decades to 10.2 billion euro, which is25% of world music sales in 2000. The music mar-ket growth of 31% from 1990 to 1997 was largerthan the overall retail trade growth of 15% in the EUduring the same period. Turnover from soundrecordings sales grew 57% in the EU from 1990 to2000. The US music market growth was howevereven stronger during the second half of the nineties,reaching 15.2 billion euro, 38% of world sales in2000. The Japanese sales volume stayed at around6 billion euro during the second half of the ninetiesand reached 7.1 billion euro, 18% of world sales,in 2000. The global music market had a volume of40 billion euro in 2000, down by 4% in constant USdollar value compared to the year before.
Global recorded music sales down 5% infirst half 2001
World sales of recorded music fell by 5% in valueand 6.7% in units in the first half of 2001, withdecline in all major markets, except the UK andFrance. Music sales declined in varying degrees inevery region: down by 5% in North America, downless than 1% in Europe, down by 8% in Asia anddown 20% in Latin America. The falls are attributedto several factors, including economic slowdown, amassive proliferation of CD burning and increasingavailability of unauthorised Internet downloads. TheCD albums market dropped by 24% in Denmark,13% in Germany, 7% in Sweden and 5% in the US.
Surge in pirate music sales
According to IFPI, sales of pressed pirate CDs were475 million units and pirate CD-R sales were 165million units in 2000. Meanwhile, 1 200 millionpirate cassettes were sold. Estimating the pirateprices, the global music pirate business was worthabout 4 600 million euro in 2000. Price, cheaptechnologies for illegal commercial copies andinadequate enforcement by governments arebelieved to be the main reasons for the piracygrowth. In addition, the Internet, with the prolifera-tion of file-swapping techniques such as Kazaa andMorpheus, is virtually a 100% pirate medium. By itspeer-to-peer nature, it is difficult to measure thenumber of files being swapped. Sony started to sellCDs embedded with Key2Audio copy protection.Should the consumer try to play such a “CD” on aPC or Macintosh, the computer likely will crash.More than 10 million discs using Key2Audio CD-audio copy protection have been produced andsold, primarily in Europe. China, Russia, Mexicoand Brazil are the top four countries on the IFPI listof domestic piracy, while Eastern Europe, particu-larly Ukraine tops the list of manufacturers andexporters of pirate music.
755.1
63.0
4.80
100
200
300
400
500
600
700
800
1980 1985 1990 1995 1996 1997 1998 1999 2000
CDsMCsLPs
[million]
2.6
1.1
0.6 0.6 0.50.4 0.3 0.3 0.3 0.2 0.1 0.1 0.1
3.1
0.0
0.5
1.0
1.5
2.0
2.5
3.0
3.5
UK D F E I NL S B A DK P FIN IRL EL
[bn EUR]
15.2
10.511.8
13.4
2.8
9.99.4
5.9
5.7
10.2
3.73.1
9.99.8
9.58.88.56.5 7.1
2.41.71.0
6.05.4
6.05.3
5.9
0
2
4
6
8
10
12
14
16
80 85 90 95 96 97 98 99 00
USEU-15JP
[bn ECU/EUR][bn ECU/EUR]
Source: see tables on the following pages

A102
The music market in 2000
The UK and Germany are the two largest marketsin the EU with 3.1 billion and 2.6 billion euro ofsales value respectively, followed by France with1.1 billion euro. Together these countries accountfor two thirds of the sales value in the EU.
The British spend most per capita, about 51 europer inhabitant, followed by the Danes, with 47euro, and the Swedes with 40 euro per head.
While CD players were introduced in the earlyeighties, their sales volume took off in the secondhalf of the eighties. In 1988 world sales of CDwere already higher than vinyl LPs. The share ofCD units in total sound recording units increasedto 33% in 1990. Since 1995 it has grown steadi-ly from a share of 66% to 75% in 2000.
In 1995 the share of vinyl LPs had decreased to1%. However, the LPs are still for sale on the mar-ket and reached 4.8 million units in 2000 (0.5%of the sales).
While music cassettes are still predominant inAsia (except Japan) accounting for around 50%of the market in 2000, their share of soundrecordings has decreased in the EU during thenineties: from 33% in 1990 to 6.3% in 2000.
The share of singles has increased slightly duringthe nineties in the EU: from 17% (141 millionunits) in 1990 to 19% (188 million units) in 2000.
The sales of CDs increased nearlythreefold in volume in the EU over thenineties
The sales of CDs increased from 270 million unitsin 1990 to 755 million units in the EU in 2000.The sales volume increased even more in theUnited States, by 230% during the nineties, from287 million to 943 million units. In Japan thegrowth was smaller: sales just doubled in volume.In 1999, the number of CDs sold declined by 9%in Japan, however, the market recovered with anincrease of 5.1% in 2000.
The United Kingdom is the largest market in theEU with 202 million CDs (27% of the EU market)sold in 2000. Second is Germany with nearly 191million CDs sold (25% of the EU market).
Denmark is however the country where the aver-age citizen buys most CDs: 3.5 per capita. TheUnited Kingdom is second with 3.4 CDs per capi-
7. Sound recordings market
190.6
104.8
60.6
35.2 34.1 27.6 23.4 19.1 18.7 12.2 11.8 8.0 7.5
201.6
0
50
100
150
200
250
UK D F E I NL B S A DK P FIN IRL EL
[million]
0.930.85
0.750.78
0.29
0.72
0.94
0.71 0.720.70
0.64
0.27
0.60
0.76
0.29
0.26
0.29
0.270.26
0.14
0.28
0.0
0.1
0.2
0.3
0.4
0.5
0.6
0.7
0.8
0.9
1.0
85 90 95 96 97 98 99 00
USEU-15JP
[bn]
Source: see tables on the following pages
ta per year, third is Belgium with 2.7. On the other hand ofthe scale is Italy with 0.6 CDs per capita and Greece with 0.7CDs per capita.
In Japan, 95% of the households own CD players. TheJapanese households buy 67% of the sound recordings in theform of a CD. The Netherlands is the EU Member State withthe highest CD player saturation: 92% of the private house-holds own CD players. There are 1.6 CD players per capitain the Netherlands. CDs account for 86% of the total soundrecordings sold in the Netherlands. The shares of CD sales intotal would be higher if singles on CDs were included. Lowsaturation countries like Greece (28%), Portugal (35%) andItaly (45%) also show relatively low shares of CD sales in totalsound recordings.
But looking at the average number of CDs sold per CD play-er household, the UK takes the lead with 13 CDs per CD

A 103
Rank Market Turnover
(bn EUR)
1 USA 15.232 Japan 7.083 UK 3.064 Germany 2.625 France 1.126 Canada 0.897 Brazil 0.788 Mexico 0.729 Spain 0.61
10 Australia 0.6111 Italy 0.5812 Netherlands 0.4913 Sweden 0.3514 South Korea 0.3215 Austria 0.3116 Switzerland 0.2917 Taiwan 0.2618 India 0.2619 Denmark 0.2520 Norway 0.25
EU-15 10.09
7. Sound recordings market
player household, followed by Norway (12),Iceland (11) and the US (10). Italy is on the otherside of the scale with 4 CDs per CD playerhousehold, followed by France and theNetherlands with 5.
Domestic or international musicrepertoire: varies country by country
The nineteen most important countries in salesvalue account for over 90% of the world salesvolume. The United States is the largest market,followed by the EU and Japan. The largest EUcountry market is the UK. Another eight EUcountries are on the top list. Four countriesbelong to the Americas and four to Asia.
The importance of national repertoire
The International recording industry is producingmore national repertoire than ever before, withseven out of every ten records sold worldwidecarrying music by local artists. Recordings bydomestic artists have risen from 58% to 68% ofsales between 1991 and 2000.
Domestic music plays a significant role in theUnited States. Country music accounts for11% ofsales, Rhythm & Blues also 11% and Pop 10% in1999. Japan is another country where domesticmusic takes the lion’s share: 77% of sales.Greece is the EU country, where domestic musicplays the most significant role: 54%, followed byFrance with 45%. Switzerland, Belgium, theNetherlands and Norway are the Europeancountries with highest international repertoire:83%, 64% and 63% respectively.
Rap, Hip-Hop and other forms of urban musicare the fastest rising music genres in major mar-kets. In the US and UK, Rock and Heavy Metalaccounted for one in four records sales in 2000.But the share of Rap and Hip-Hop rose to 13%in the US and doubled to 4% in the UK.
Classical music plays a marginal role. In the USit stayed at 3% of market value during thenineties. In the Netherlands, Switzerland, Austriaand Finland it reached between 7% and 11% in2000.
Regional repertoire is identified in a few coun-tries. In Portugal it accounts for 8% of marketvalue, in Spain just for 1%.
Top 20 music sales ranking in 2000,source: Eurostat, see table 7.1 and the International Federation of the PhonographicIndustry for non-EU countries
3
4
6
6
6
7
4
6
4
3
11
2
5
3
4
7
9
8
0 20 40 60 80 100
US
JP
EL
F
IS
UK
E
FIN
I
D
DK
S
NL
IRL
P
N
B
A
CH
Domestic International Regional Classical Multi-artist
[%]
,
source: the International Federation of the Phonographic Industry
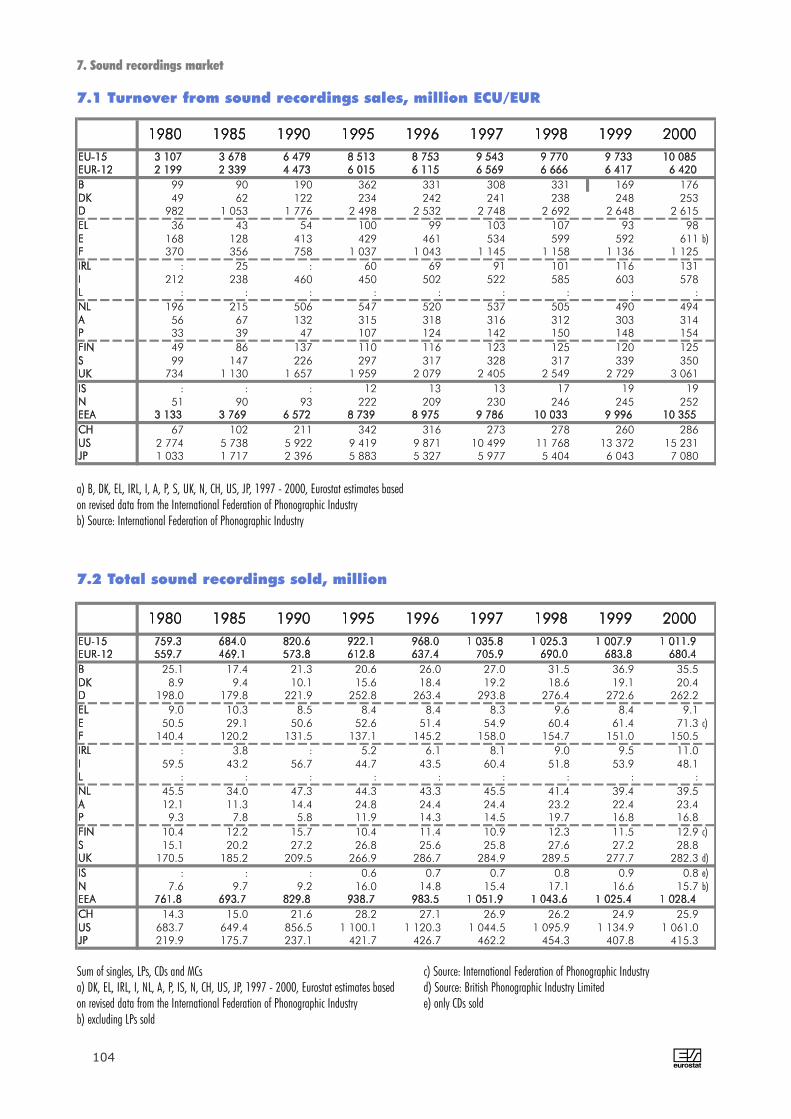
Sum of singles, LPs, CDs and MCsa) DK, EL, IRL, I, NL, A, P, IS, N, CH, US, JP, 1997 - 2000, Eurostat estimates basedon revised data from the International Federation of Phonographic Industryb) excluding LPs sold
c) Source: International Federation of Phonographic Industryd) Source: British Phonographic Industry Limitede) only CDs sold
1980 1985 1990 1995 1996 1997 1998 1999 2000
99 90 190 362 331 308 331 169 176 49 62 122 234 242 241 238 248 253
982 1 053 1 776 2 498 2 532 2 748 2 692 2 648 2 615 36 43 54 100 99 103 107 93 98
168 128 413 429 461 534 599 592 611 b) 370 356 758 1 037 1 043 1 145 1 158 1 136 1 125
: 25 : 60 69 91 101 116 131 212 238 460 450 502 522 585 603 578
: : : : : : : : : 196 215 506 547 520 537 505 490 494 56 67 132 315 318 316 312 303 314 33 39 47 107 124 142 150 148 154 49 86 137 110 116 123 125 120 125 99 147 226 297 317 328 317 339 350
734 1 130 1 657 1 959 2 079 2 405 2 549 2 729 3 061: : : 12 13 13 17 19 19
51 90 93 222 209 230 246 245 252
67 102 211 342 316 273 278 260 2862 774 5 738 5 922 9 419 9 871 10 499 11 768 13 372 15 2311 033 1 717 2 396 5 883 5 327 5 977 5 404 6 043 7 080
7. Sound recordings market
7.1 Turnover from sound recordings sales, million ECU/EUR
a) B, DK, EL, IRL, I, A, P, S, UK, N, CH, US, JP, 1997 - 2000, Eurostat estimates basedon revised data from the International Federation of Phonographic Industryb) Source: International Federation of Phonographic Industry
1980 1985 1990 1995 1996 1997 1998 1999 2000
25.1 17.4 21.3 20.6 26.0 27.0 31.5 36.9 35.5 8.9 9.4 10.1 15.6 18.4 19.2 18.6 19.1 20.4
198.0 179.8 221.9 252.8 263.4 293.8 276.4 272.6 262.2 9.0 10.3 8.5 8.4 8.4 8.3 9.6 8.4 9.1
50.5 29.1 50.6 52.6 51.4 54.9 60.4 61.4 71.3 c) 140.4 120.2 131.5 137.1 145.2 158.0 154.7 151.0 150.5
: 3.8 : 5.2 6.1 8.1 9.0 9.5 11.0 59.5 43.2 56.7 44.7 43.5 60.4 51.8 53.9 48.1
: : : : : : : : : 45.5 34.0 47.3 44.3 43.3 45.5 41.4 39.4 39.5 12.1 11.3 14.4 24.8 24.4 24.4 23.2 22.4 23.4 9.3 7.8 5.8 11.9 14.3 14.5 19.7 16.8 16.8
10.4 12.2 15.7 10.4 11.4 10.9 12.3 11.5 12.9 c) 15.1 20.2 27.2 26.8 25.6 25.8 27.6 27.2 28.8
170.5 185.2 209.5 266.9 286.7 284.9 289.5 277.7 282.3 d)
: : : 0.6 0.7 0.7 0.8 0.9 0.8 e) 7.6 9.7 9.2 16.0 14.8 15.4 17.1 16.6 15.7 b)
14.3 15.0 21.6 28.2 27.1 26.9 26.2 24.9 25.9 683.7 649.4 856.5 1 100.1 1 120.3 1 044.5 1 095.9 1 134.9 1 061.0 219.9 175.7 237.1 421.7 426.7 462.2 454.3 407.8 415.3
7.2 Total sound recordings sold, million
A104

Include Vinyl, CD and MC singlesa) DK, EL, IRL, NL, A, P, IS, N, CH, US, JP, 1997 - 2000, Eurostat estimates based onrevised data from the International Federation of Phonographic Industry
b) Source: International Federation of Phonographic Industryd) Source: 1998-2000; British Phonographic Industry Limited
A 105
1980 1985 1990 1995 1996 1997 1998 1999 2000
12.5 9.7 7.7 3.7 4.8 6.2 8.7 7.8 7.82.0 1.9 1.0 0.5 0.8 1.1 1.2 1.3 1.5
45.0 49.6 27.2 44.1 48.5 55.3 54.0 53.7 51.10.2 0.0 0.0 0.0 0.0 0.0 0.8 1.0 1.27.0 4.0 1.6 0.9 0.9 1.6 1.3 2.4 1.9 b)
54.3 65.1 28.0 21.7 30.4 42.7 36.5 36.4 36.8: 1.2 : 1.0 1.3 1.8 1.9 2.3 2.2
24.5 9.2 2.0 1.5 1.4 2.2 3.0 5.1 b) 4.0 b): : : : : : : : :
14.0 12.1 6.3 7.9 7.9 7.8 6.6 5.4 5.04.0 3.7 2.4 3.3 3.9 3.2 3.1 3.7 3.73.7 2.9 0.2 0.1 0.1 0.3 0.6 1.0 0.8
: : 0.4 0.3 0.4 0.4 0.5 0.5 0.6 b)2.0 5.0 4.9 2.8 2.9 3.5 4.4 5.4 5.1
c) 77.9 73.8 58.9 70.7 78.3 87.0 79.4 80.1 66.1: : : : : : : : :
0.6 1.4 0.6 1.8 1.8 2.0 1.9 1.7 1.1
3.0 4.2 1.4 2.5 2.8 4.8 3.4 3.3 3.3164.3 120.7 116.1 102.4 113.2 117.0 87.7 75.3 40.383.6 53.2 51.8 145.0 145.8 156.4 138.0 128.1 124.4
7. Sound recordings market
7.3 Singles sold, million
1980 1985 1990 1995 1996 1997 1998 1999 2000
49.8 56.0 36.0 17.9 18.5 23.0 27.7 21.1 21.922.4 19.8 9.9 3.2 4.3 5.7 6.5 6.8 7.422.7 27.6 12.3 17.4 18.4 18.8 19.5 19.7 19.52.2 0.0 0.0 0.0 0.0 0.0 8.3 11.9 13.2
13.9 13.6 3.2 1.7 1.8 2.9 2.1 3.9 2.738.7 54.1 21.3 15.9 20.9 27.0 23.6 24.1 24.5
: 30.9 : 19.9 20.9 22.2 21.1 24.2 19.941.2 21.3 3.5 3.4 3.2 3.6 5.8 9.5 8.3
: : : : : : : : :30.8 35.6 13.3 17.8 18.2 17.1 15.9 13.7 12.733.2 32.8 16.7 13.2 16.0 13.1 13.4 16.5 15.839.5 36.6 3.4 0.8 0.7 2.1 3.0 6.0 4.8
: : 2.5 2.9 3.5 3.7 4.1 4.3 4.713.0 24.9 18.0 10.4 11.4 13.6 15.9 19.8 17.745.7 39.8 28.1 26.5 27.3 30.5 27.4 28.8 23.4
: : : : : : : : :7.8 14.4 6.7 11.2 12.2 13.0 11.1 10.2 :
21.3 28.1 6.5 8.9 10.3 17.8 13.0 13.3 12.724.0 18.6 13.6 9.3 10.1 11.2 8.0 6.6 3.838.0 30.3 21.8 34.4 34.2 33.8 30.4 31.4 30.0
7.4 Share of singles sold (of total sound recordings sold), %

a) B, DK, EL, IRL, NL, A, P, IS, N, CH, US, JP, 1997 - 2000, Eurostat estimates basedon revised data from the International Federation of Phonographic Industryb) Source: International Federation of Phonographic Industryc) Source: 1998-2000; British Phonographic Industry Limited
A106
1980 1985 1990 1995 1996 1997 1998 1999 2000
2.3 1.6 2.9 0.8 0.6 0.4 0.3 0.2 0.12.5 2.0 1.8 1.0 0.7 0.5 0.2 0.2 0.2
43.5 49.4 74.6 31.4 30.0 28.6 25.3 20.3 19.72.5 5.2 2.9 1.1 0.6 0.5 0.5 0.5 0.4
27.1 13.4 23.5 17.9 15.1 13.8 12.4 10.6 8.8 b)21.7 20.7 42.0 22.2 17.3 14.9 13.8 11.4 8.4
: 1.4 : 1.7 1.7 1.7 1.5 1.1 0.816.0 16.1 25.1 15.1 14.3 16.3 14.1 12.9 b) 8.9 b)
: : : : : : : : :4.5 5.5 3.4 1.2 0.8 0.6 0.4 0.3 0.32.4 1.8 3.2 3.2 1.9 1.3 0.9 0.7 0.61.3 1.3 2.6 5.1 5.6 3.4 3.8 2.9 3.84.3 5.5 6.8 3.3 3.0 1.8 1.3 0.8 0.5 b)2.6 4.7 5.7 2.4 1.7 1.2 0.8 0.6 0.3 b)
c) 25.2 55.4 75.1 53.4 46.2 36.6 32.2 18.4 11.4: : : : : 0.0 0.0 0.0 :
3.2 4.2 4.1 1.6 0.8 0.5 0.3 0.3 0.1
3.4 3.3 6.0 2.8 2.1 1.5 1.5 0.9 0.7196.6 339.1 442.2 272.6 225.3 171.9 158.7 122.9 76.064.0 59.6 46.2 9.0 7.4 7.7 10.3 6.6 6.5
7. Sound recordings market
7.5 Music Cassettes sold, million
1980 1985 1990 1995 1996 1997 1998 1999 2000
9.1 9.4 13.8 3.9 2.3 1.5 1.0 0.5 0.328.6 21.6 17.8 6.4 3.8 2.6 1.1 1.0 1.022.0 27.5 33.6 12.4 11.4 9.7 9.2 7.4 7.527.5 50.5 34.3 13.1 7.1 6.0 5.2 5.9 4.453.6 46.1 46.5 33.9 29.3 25.1 20.6 17.2 12.315.5 17.2 31.9 16.2 11.9 9.4 8.9 7.5 5.6
: 36.0 : 33.2 27.3 20.9 16.6 11.6 7.326.9 37.2 44.3 33.8 32.9 27.0 27.1 23.9 18.5
: : : : : : : : :9.9 16.2 7.2 2.7 1.8 1.3 1.0 0.8 0.8
19.7 16.1 22.2 12.8 7.8 5.3 3.9 3.1 2.613.7 16.5 44.8 42.9 39.2 23.4 19.3 17.3 22.641.3 45.1 43.3 31.7 26.3 16.5 10.6 7.0 3.917.2 23.1 20.9 9.0 6.7 4.6 2.9 2.2 1.014.8 29.9 35.8 20.0 16.1 12.8 11.1 6.6 4.0
: : : : : 2.9 1.3 0.9 :42.8 43.3 44.5 10.0 5.4 3.2 1.8 1.8 :
24.1 21.8 27.8 9.9 7.7 5.6 5.7 3.6 2.728.8 52.2 51.6 24.8 20.1 16.5 14.5 10.8 7.229.1 33.9 19.5 2.1 1.7 1.7 2.3 1.6 1.6
7.6 Share of Music Cassettes sold (of total sound recordings sold), %

a) DK, EL, IRL, NL, A, P, IS, N, CH, US, JP, 1997 - 2000, Eurostat estimates based onrevised data from the International Federation of Phonographic Industryb) Source: International Federation of Phonographic Industryc) Source: 1998-2000; British Phonographic Industry Limited
A 107
1980 1985 1990 1995 1996 1997 1998 1999 2000
10.32 5.57 1.38 0.00 0.00 0.00 0.05 0.04 0.044.37 5.25 4.10 0.00 0.01 0.00 0.00 0.00 0.00
109.50 74.00 43.90 0.40 0.40 0.40 0.60 0.60 0.806.30 5.10 4.99 1.40 0.60 0.10 0.03 0.01 0.01
16.43 11.71 18.11 0.26 0.08 0.20 0.03 0.03 0.02 b)64.31 32.06 6.71 0.08 0.07 0.20 0.30 0.40 0.50
: 1.27 : 0.01 0.02 0.02 0.02 0.01 0.0319.00 16.93 14.20 0.10 0.10 0.10 0.10 0.10 b) 0.03 b)
: : : : : : : : :27.00 15.80 2.60 0.20 0.20 0.20 0.20 0.20 0.105.70 5.48 3.60 0.07 0.02 0.01 0.02 0.03 0.044.34 3.64 1.80 0.00 0.00 0.00 0.00 0.00 0.006.10 6.70 5.10 0.20 0.10 0.00 0.00 0.00 0.00
10.55 10.26 9.10 0.01 0.02 0.02 0.02 0.01 0.0467.40 52.90 24.72 3.62 2.45 2.50 2.20 2.30 3.20 d)
: : : 0.03 0.03 0.01 0.02 0.02 :3.73 3.80 1.90 0.00 0.00 0.00 0.00 0.00 :
7.80 6.11 1.20 0.10 0.10 0.10 0.10 0.10 0.10322.80 167.00 11.70 2.20 2.90 2.70 3.40 2.90 2.2072.40 46.45 0.59 8.50 7.60 8.80 14.10 8.20 5.90
7. Sound recordings market
7.7 LPs sold, million
1980 1985 1990 1995 1996 1997 1998 1999 2000
41.1 32.1 6.5 0.0 0.0 0.0 0.2 0.1 0.149.0 55.6 40.6 0.0 0.1 0.0 0.0 0.0 0.055.3 41.2 19.8 0.2 0.2 0.1 0.2 0.2 0.370.3 49.5 58.4 16.7 7.1 1.2 0.3 0.1 0.132.5 40.2 35.8 0.5 0.2 0.4 0.0 0.0 0.045.8 26.7 5.1 0.1 0.1 0.1 0.2 0.3 0.3
: 33.1 : 0.2 0.3 0.2 0.2 0.1 0.331.9 39.2 25.0 0.2 0.2 0.2 0.2 0.2 0.1
: : : : : : : : :59.3 46.5 5.5 0.5 0.5 0.4 0.5 0.5 0.347.1 48.7 25.0 0.3 0.1 0.0 0.1 0.1 0.246.8 46.7 31.0 0.0 0.0 0.0 0.0 0.0 0.058.7 54.9 32.5 1.9 0.9 0.0 0.0 0.0 0.069.7 50.7 33.4 0.0 0.1 0.1 0.1 0.0 0.139.5 28.6 11.8 1.4 0.9 0.9 0.8 0.8 1.1
: : : 5.0 4.4 1.4 2.5 2.2 :49.4 39.2 20.6 0.0 0.0 0.0 0.0 0.0 :
54.7 40.8 5.6 0.4 0.4 0.4 0.4 0.4 0.447.2 25.7 1.4 0.2 0.3 0.3 0.3 0.3 0.232.9 26.4 0.2 2.0 1.8 1.9 3.1 2.0 1.4
7.8 Share of LPs sold (of total sound recordings sold), %

a) DK, EL, IRL, NL, A, P, IS, N, CH, US, JP, 1997 - 2000, Eurostat estimates based onrevised data from the International Federation of Phonographic Industryb) Source: International Federation of Phonographic Industryc) Source: 1998-2000; British Phonographic Industry Limited
d) CD's in Luxembourg are bought in Belgium, France, Germany and Hollandaccording to International Federation of Phonographic Industry
A108
1980 1985 1990 1995 1996 1997 1998 1999 2000
0 0.4 9.3 16.1 20.6 20.4 22.4 28.9 27.60 0.3 3.2 14.1 16.9 17.6 17.2 17.6 18.70 6.8 76.2 176.9 184.5 209.5 196.5 198.0 190.60 0.0 0.6 5.9 7.2 7.7 8.3 6.9 7.50 0.0 7.4 33.6 35.4 39.3 46.7 48.4 60.6 b)0 2.4 54.8 93.1 97.4 100.2 104.1 102.8 104.80 0.0 : 2.4 3.1 4.6 5.6 6.1 8.00 1.0 15.4 28.0 27.7 41.8 34.2 35.8 b) 35.2 b)
d) 0 : : : : : : : :0 1.4 35.0 35.0 34.4 36.9 34.2 33.5 34.1
a) 0 0.3 5.2 18.3 18.6 19.9 19.2 18.0 19.10 0.0 1.2 6.7 8.6 10.8 15.3 12.9 12.20 0.0 3.4 6.6 7.9 8.7 10.5 10.2 11.80 0.3 7.5 21.6 20.9 21.1 22.4 21.2 23.4
c) 0 3.1 50.9 139.2 159.7 158.8 175.7 176.9 201.60 : : 0.6 0.7 0.7 0.8 0.9 0.80 0.3 2.6 12.6 12.2 12.9 14.9 14.6 14.5
0 1.4 13.0 22.8 22.1 20.5 21.2 20.6 21.80 22.6 286.5 722.9 778.9 752.9 846.1 933.8 942.50 16.5 138.6 259.2 265.9 289.3 291.9 264.9 278.5
7. Sound recordings market
7.9 CDs sold, million
1980 1985 1990 1995 1996 1997 1998 1999 2000
: : 36 59 61 60 63 65 69: : 20 67 70 74 77 80 89: : 17 68 71 72 75 77 81: : : 14 17 20 22 28 :: : 10 34 38 42 47 58 :: : : 57 61 65 68 71 82: : : 44 53 60 67 73 80: : : 23 30 38 42 45 :: : : : : : : : :: : 48 83 85 86 88 90 92: : : 40 45 47 48 50 60: : : 22 26 28 30 35 54: : 11 39 48 57 62 63 :: : 19 57 61 67 73 78 :: : 24 62 63 65 68 71 70: : 31 51 56 64 72 : :: : : 44 50 59 64 68 :
: : 17 71 72 74 75 80 :: : : 59 65 69 73 79 90: : : 80 85 90 93 95 :
7.10 Share of CDs sold (of total sound recordings sold), %
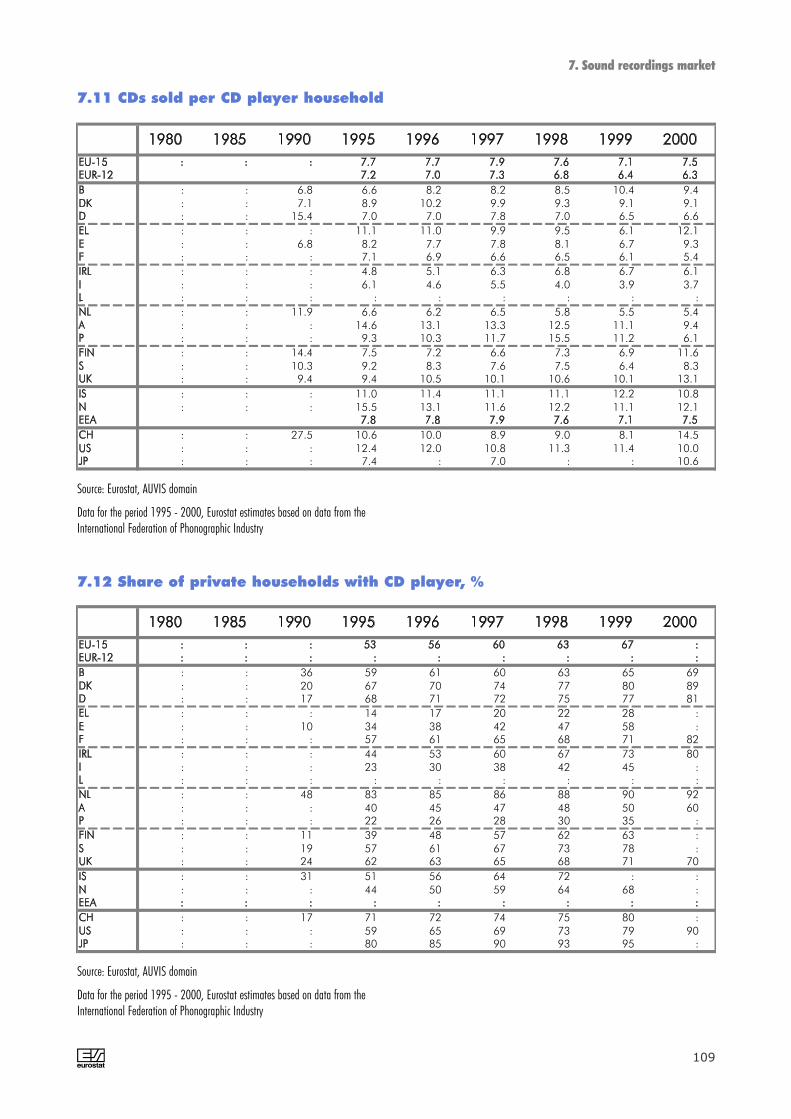
Source: Eurostat, AUVIS domain
Data for the period 1995 - 2000, Eurostat estimates based on data from theInternational Federation of Phonographic Industry
Source: Eurostat, AUVIS domain
Data for the period 1995 - 2000, Eurostat estimates based on data from theInternational Federation of Phonographic Industry
A 109
1980 1985 1990 1995 1996 1997 1998 1999 2000
: : 6.8 6.6 8.2 8.2 8.5 10.4 9.4: : 7.1 8.9 10.2 9.9 9.3 9.1 9.1: : 15.4 7.0 7.0 7.8 7.0 6.5 6.6: : : 11.1 11.0 9.9 9.5 6.1 12.1: : 6.8 8.2 7.7 7.8 8.1 6.7 9.3: : : 7.1 6.9 6.6 6.5 6.1 5.4: : : 4.8 5.1 6.3 6.8 6.7 6.1: : : 6.1 4.6 5.5 4.0 3.9 3.7: : : : : : : : :: : 11.9 6.6 6.2 6.5 5.8 5.5 5.4: : : 14.6 13.1 13.3 12.5 11.1 9.4: : : 9.3 10.3 11.7 15.5 11.2 6.1: : 14.4 7.5 7.2 6.6 7.3 6.9 11.6: : 10.3 9.2 8.3 7.6 7.5 6.4 8.3: : 9.4 9.4 10.5 10.1 10.6 10.1 13.1: : : 11.0 11.4 11.1 11.1 12.2 10.8: : : 15.5 13.1 11.6 12.2 11.1 12.1
: : 27.5 10.6 10.0 8.9 9.0 8.1 14.5: : : 12.4 12.0 10.8 11.3 11.4 10.0: : : 7.4 : 7.0 : : 10.6
7. Sound recordings market
7.11 CDs sold per CD player household
1980 1985 1990 1995 1996 1997 1998 1999 2000
: : 36 59 61 60 63 65 69: : 20 67 70 74 77 80 89: : 17 68 71 72 75 77 81: : : 14 17 20 22 28 :: : 10 34 38 42 47 58 :: : : 57 61 65 68 71 82: : : 44 53 60 67 73 80: : : 23 30 38 42 45 :: : : : : : : : :: : 48 83 85 86 88 90 92: : : 40 45 47 48 50 60: : : 22 26 28 30 35 :: : 11 39 48 57 62 63 :: : 19 57 61 67 73 78 :: : 24 62 63 65 68 71 70: : 31 51 56 64 72 : :: : : 44 50 59 64 68 :
: : 17 71 72 74 75 80 :: : : 59 65 69 73 79 90: : : 80 85 90 93 95 :
7.12 Share of private households with CD player, %
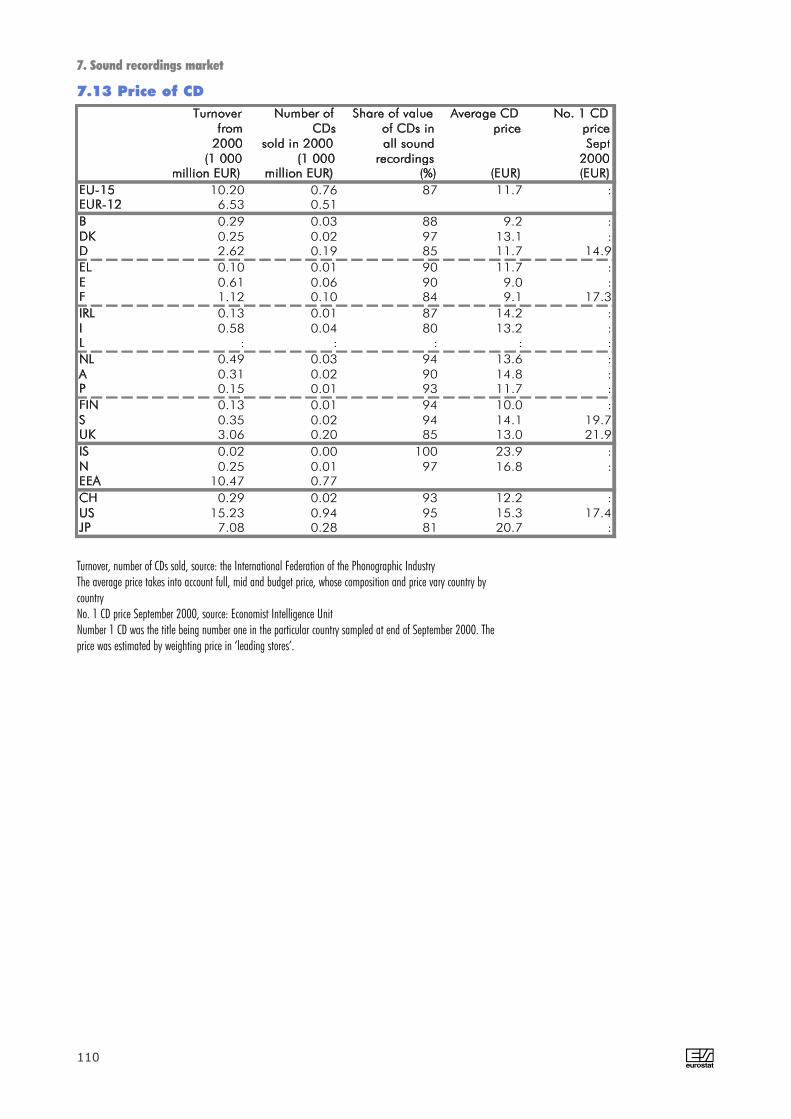
A110
10.20 0.76 87 11.7 :6.53 0.510.29 0.03 88 9.2 :0.25 0.02 97 13.1 :2.62 0.19 85 11.7 14.90.10 0.01 90 11.7 :0.61 0.06 90 9.0 :1.12 0.10 84 9.1 17.30.13 0.01 87 14.2 :0.58 0.04 80 13.2 :
: : : : :0.49 0.03 94 13.6 :0.31 0.02 90 14.8 :0.15 0.01 93 11.7 :0.13 0.01 94 10.0 :0.35 0.02 94 14.1 19.73.06 0.20 85 13.0 21.90.02 0.00 100 23.9 :0.25 0.01 97 16.8 :
10.47 0.770.29 0.02 93 12.2 :
15.23 0.94 95 15.3 17.47.08 0.28 81 20.7 :
7. Sound recordings market
7.13 Price of CD
Turnover, number of CDs sold, source: the International Federation of the Phonographic IndustryThe average price takes into account full, mid and budget price, whose composition and price vary country bycountryNo. 1 CD price September 2000, source: Economist Intelligence UnitNumber 1 CD was the title being number one in the particular country sampled at end of September 2000. Theprice was estimated by weighting price in ‘leading stores’.

8. Radio market


93% of the radio stations in the EU are private (commercial)
In Europe regular radio broadcasting startedalready at the beginning of the twenties. The dereg-ulation that commenced in the eighties resulted in arapid growth of private local and commercial radionetworks. The radio sector is much more fragment-ed than the TV sector. Alongside nation-wide gener-al-interest radio stations (e.g. music stations, etc.)there are local commercial stations that are part ofa franchise or subscribers to a national network aswell as a huge number of local independent com-mercial stations and non-commercial communityradio stations run by associations.
EU's 9.8 billion euro radio broadcasting sector isstill dominated by its 400 public service stations,which account for 55% of revenue and 38 per centof listening. EU's 5 100 commercial radio stationsshare just 4.4 billion euro in total revenue of about870 000 euro per station. 4 500 of them are partof affiliate networks, with the remainder often beingpart of multi-station owning groups.
In comparison, the US commercial radio marketwas worth 20 billion euro in 2000, or, 1.6 millioneuro per station.
EU's 400 public service radio stations in contrast stillenjoy many of the best analogue frequencies, sub-stantial licence fee funding, topped up in somecases by additional advertising revenue and anaverage of 13.5 million euro revenue per service.
Commercial station advertising yields per thousandlistening hours in EU are between 15 euro and 30euro, compared with almost 50 euro in the UnitedStates. This is in part due to the lack of reach andproper demographic segmentation within much ofEuropean commercial radio. Radio station choice inmajor European cities is generally just three-fifthsthe US level.
The move to digital broadcasting will see radiomove from a single distribution system to a multi-system medium utilising terrestrial, satellite, cable,Internet and even mobile and wireless LAN distribu-tion. Terrestrially delivered DAB is only likely to reach10 per cent of European households and accountfor 6 per cent of total listening by 2006, accordingto Oliver & Ohlbaum.
Between 1980 and 1994, the number of radio sta-tions soared in the European Union. Between 1994and 1999, however, the number of radio stationsdeclined from an estimated 7,600 stations to about5 500 stations, a decrease of about 28%. Spain isthe EU Member State with the highest number of
A 113
8. Radio market
0
20
40
60
80
100
A
96
NL
98
FIN
00
S
00
D
00
IS
00
UK
98
F
98
IRL
00
EL
00
CH
98
N
97
L
00
B
96
P
00
DK
00
I
00
EU-
15
US JP
Public Private[%]
0.0
0.5
1.0
1.5
2.0
I
00
E
99
F
98
NL
00
P
00
UK
98
EL
00
B
96
DK
00
D
00
S
00
FIN
00
IRL
00
L
00
A
96
PrivatePublic
[thousand]
209 204 201 192 192 184 177 176 174 169 164 161144
95
290
0
50
100
150
200
250
300
350
IRL96
D00
IS00
FIN00
DK00
P00
A96
UK99
NL00
S00
I98
CH98
F99
N97
E00
[minutes]
Source: see tables on the following pages

98
70 61
48 44 39 34
12 4
0
20
40
60
80
100
F DK S IS FIN D P I UK
[%]
8. Radio market
6660 56
48 45 42
30
114 2
0
20
40
60
80
100
P D FIN IS S N DK I UK F
[%]
5644 37 34 33 27 22 18 13 13 11
3
14
1114 26 23
1916
108 11 11
3045 49
39 4454 61
73 79 77 78
95
0
10
20
30
40
50
60
70
80
90
100
IS FIN S E DK N I F P UK D NL
otherstations
secondbiggeststation
biggeststation
[%]
A114
UK and F in 1999
99.0 6.380.7 1.686.2 1.877.7 1.280.0 1.326.8 0.4
Households equipped with at leastone radio in France in 1999Source: Francoscopie 2001
(million) (million) (million) (million)
33 93 61 116 158 216 361 698 566 711 811 1 017 171 81 318 748 900 255 327 465 420 474 531 729 15 779 20 26 31 1 071
Radio broadcasting receivers worldwide,Source: UNESCO
radio stations. Most of them are public. Italy issecond with mostly private stations. The countrywith the highest share of public radio stations isthe Netherlands where 95% are public. Austria issecond with 85% public radio stations. At theother end of the scale are Italy, Denmark,Portugal, Japan, Belgium and Luxembourg withover 96% private radio stations.
Between 1985 and 1999, the total number ofradio stations in the United States grew by 20% toaround 12 600 stations. The ten largest radiobroadcasters in the United States, which ownabout 14% of all domestic stations, accounted fornearly 41% of radio industry advertising income in1998. This marks an increased concentration ofownership in the United States. Two years earlier,in 1996, the 15 largest owners of radio stationscontrolled 6% of the stations and accounted for34% of advertising income.
The average listening time of adults in EU coun-tries varies from 290 minutes in Ireland to 150minutes in the United Kingdom. Radio listening isoften combined with other activities like car driv-ing.
The past two decades have been marked by adiversification of radio equipment. Radios com-bined with other music sources became morecommon. As a result most households had morethan one radio set and the number of householdswith several radio sets was much greater than thenumber of households with several TV sets. Insome EU countries, private households owned onaverage between three and six various radiodevices. There are at least 500 million radios inuse in the EU. The 1990s saw the development ofthe distribution of radio programmes also throughcable, satellite and the web and the appearanceof the Digital Audio Broadcasting (DAB).
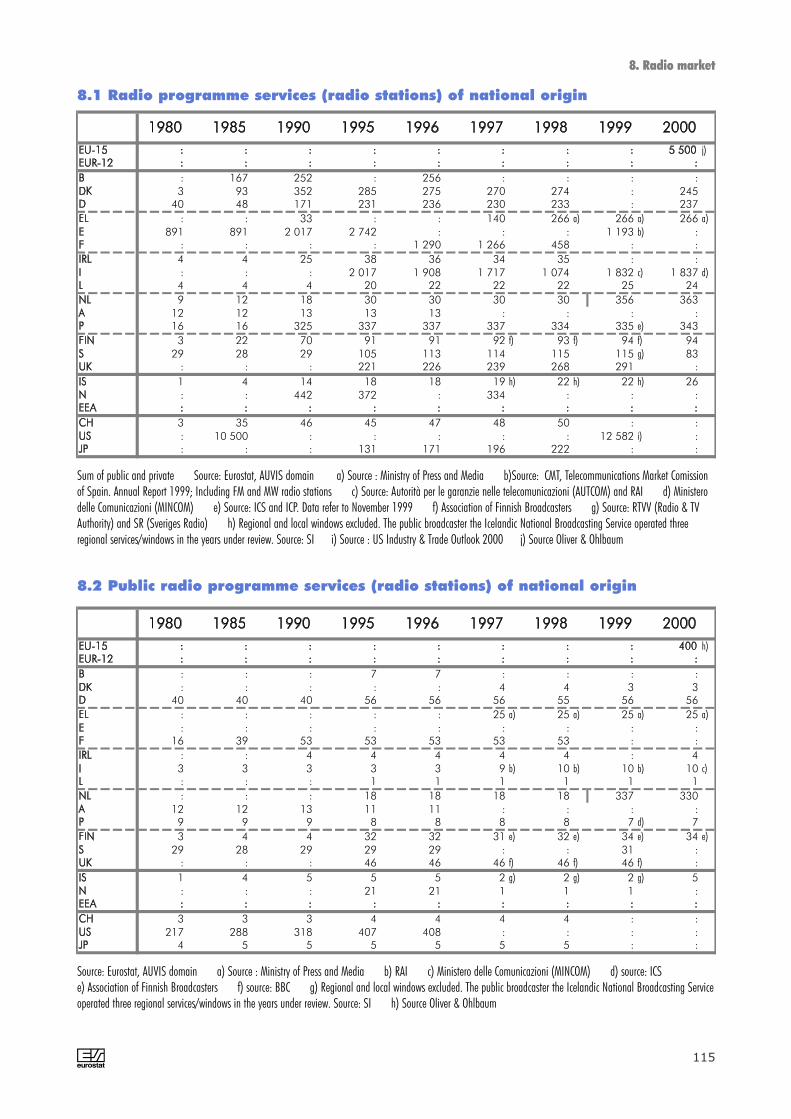
Source: Eurostat, AUVIS domain a) Source : Ministry of Press and Media b) RAI c) Ministero delle Comunicazioni (MINCOM) d) source: ICS e) Association of Finnish Broadcasters f) source: BBC g) Regional and local windows excluded. The public broadcaster the Icelandic National Broadcasting Serviceoperated three regional services/windows in the years under review. Source: SI h) Source Oliver & Ohlbaum
A
EU-15 : : : : : : : : 5 500 j)EUR-12 : : : : : : : : :B : 167 252 : 256 : : : :DK 3 93 352 285 275 270 274 : 245D 40 48 171 231 236 230 233 : 237EL : : 33 : : 140 266 a) 266 a) 266 a)E 891 891 2 017 2 742 : : : 1 193 b) :F : : : : 1 290 1 266 458 : :IRL 4 4 25 38 36 34 35 : :I : : : 2 017 1 908 1 717 1 074 1 832 c) 1 837 d)L 4 4 4 20 22 22 22 25 24NL 9 12 18 30 30 30 30 356 363A 12 12 13 13 13 : : : :P 16 16 325 337 337 337 334 335 e) 343FIN 3 22 70 91 91 92 f) 93 f) 94 f) 94S 29 28 29 105 113 114 115 115 g) 83UK : : : 221 226 239 268 291 :IS 1 4 14 18 18 19 h) 22 h) 22 h) 26N : : 442 372 : 334 : : :EEA : : : : : : : : :CH 3 35 46 45 47 48 50 : :US : 10 500 : : : : : 12 582 i) :JP : : : 131 171 196 222 : :
8. Radio market
8.1 Radio programme services (radio stations) of national origin
Sum of public and private Source: Eurostat, AUVIS domain a) Source : Ministry of Press and Media b)Source: CMT, Telecommunications Market Comissionof Spain. Annual Report 1999; Including FM and MW radio stations c) Source: Autorità per le garanzie nelle telecomunicazioni (AUTCOM) and RAI d) Ministerodelle Comunicazioni (MINCOM) e) Source: ICS and ICP. Data refer to November 1999 f) Association of Finnish Broadcasters g) Source: RTVV (Radio & TVAuthority) and SR (Sveriges Radio) h) Regional and local windows excluded. The public broadcaster the Icelandic National Broadcasting Service operated threeregional services/windows in the years under review. Source: SI i) Source : US Industry & Trade Outlook 2000 j) Source Oliver & Ohlbaum
EU-15 : : : : : : : : 400 h)EUR-12 : : : : : : : : :B : : : 7 7 : : : :DK : : : : : 4 4 3 3D 40 40 40 56 56 56 55 56 56EL : : : : : 25 a) 25 a) 25 a) 25 a) E : : : : : : : : :F 16 39 53 53 53 53 53 : :IRL : : 4 4 4 4 4 : 4I 3 3 3 3 3 9 b) 10 b) 10 b) 10 c) L : : : 1 1 1 1 1 1NL : : : 18 18 18 18 337 330A 12 12 13 11 11 : : : :P 9 9 9 8 8 8 8 7 d) 7FIN 3 4 4 32 32 31 e) 32 e) 34 e) 34 e)S 29 28 29 29 29 : : 31 :UK : : : 46 46 46 f) 46 f) 46 f) :IS 1 4 5 5 5 2 g) 2 g) 2 g) 5N : : : 21 21 1 1 1 :EEA : : : : : : : : :CH 3 3 3 4 4 4 4 : :US 217 288 318 407 408 : : : :JP 4 5 5 5 5 5 5 : :
8.2 Public radio programme services (radio stations) of national origin
115
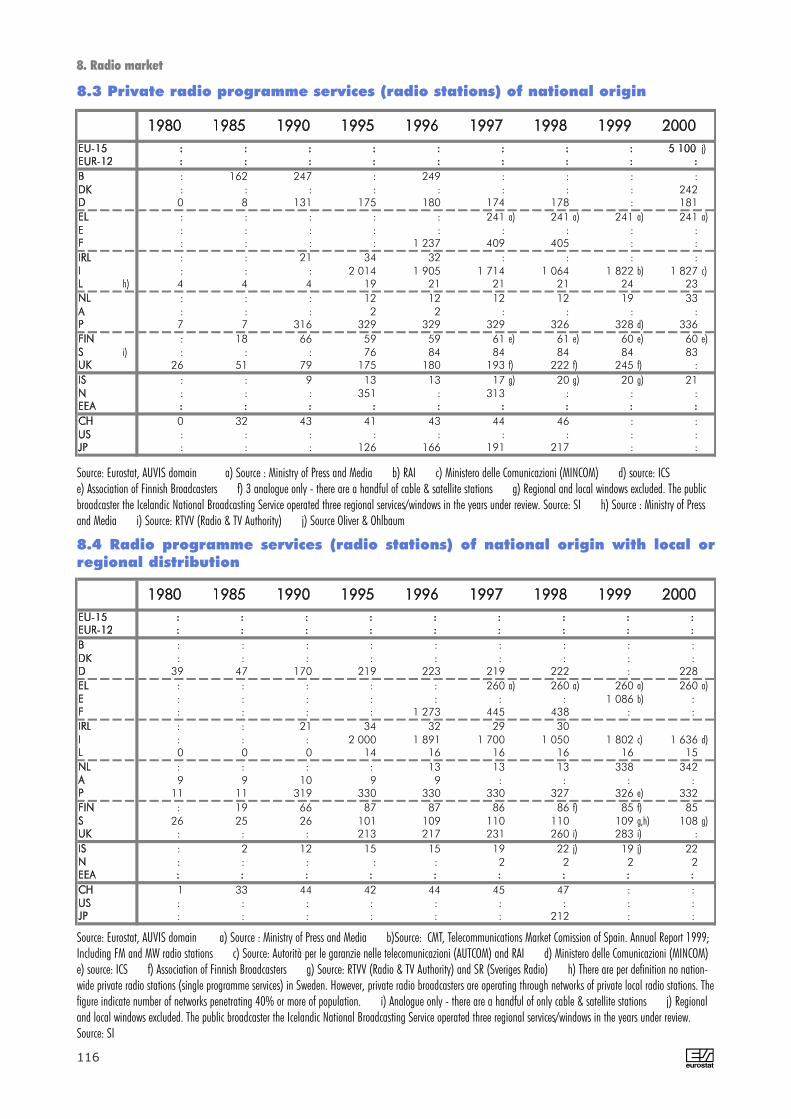
EU-15 : : : : : : : : 5 100 j)EUR-12 : : : : : : : : :B : 162 247 : 249 : : : :DK : : : : : : : : 242D 0 8 131 175 180 174 178 : 181EL : : : : : 241 a) 241 a) 241 a) 241 a) E : : : : : : : : :F : : : : 1 237 409 405 : :IRL : : 21 34 32 : : : :I : : : 2 014 1 905 1 714 1 064 1 822 b) 1 827 c) L h) 4 4 4 19 21 21 21 24 23
NL : : : 12 12 12 12 19 33A : : : 2 2 : : : :P 7 7 316 329 329 329 326 328 d) 336FIN : 18 66 59 59 61 e) 61 e) 60 e) 60 e)S i) : : : 76 84 84 84 84 83UK 26 51 79 175 180 193 f) 222 f) 245 f) :IS : : 9 13 13 17 g) 20 g) 20 g) 21N : : : 351 : 313 : : :EEA : : : : : : : : :CH 0 32 43 41 43 44 46 : :US : : : : : : : : :JP : : : 126 166 191 217 : :
8. Radio market
8.3 Private radio programme services (radio stations) of national origin
A116
Source: Eurostat, AUVIS domain a) Source : Ministry of Press and Media b) RAI c) Ministero delle Comunicazioni (MINCOM) d) source: ICSe) Association of Finnish Broadcasters f) 3 analogue only - there are a handful of cable & satellite stations g) Regional and local windows excluded. The publicbroadcaster the Icelandic National Broadcasting Service operated three regional services/windows in the years under review. Source: SI h) Source : Ministry of Pressand Media i) Source: RTVV (Radio & TV Authority) j) Source Oliver & Ohlbaum
EU-15 : : : : : : : : : EUR-12 : : : : : : : : : B : : : : : : : : : DK : : : : : : : : : D 39 47 170 219 223 219 222 : 228
EL : : : : : 260 a) 260 a) 260 a) 260 a) E : : : : : : : 1 086 b) : F : : : : 1 273 445 438 : :
IRL : : 21 34 32 29 30 I : : : 2 000 1 891 1 700 1 050 1 802 c) 1 636 d) L 0 0 0 14 16 16 16 16 15
NL : : : : 13 13 13 338 342 A 9 9 10 9 9 : : : : P 11 11 319 330 330 330 327 326 e) 332
FIN : 19 66 87 87 86 86 f) 85 f) 85 S 26 25 26 101 109 110 110 109 g,h) 108 g) UK : : : 213 217 231 260 i) 283 i) :
IS : 2 12 15 15 19 22 j) 19 j) 22 N : : : : : 2 2 2 2 EEA : : : : : : : : :
CH 1 33 44 42 44 45 47 : : US : : : : : : : : : JP : : : : : : 212 : :
8.4 Radio programme services (radio stations) of national origin with local orregional distribution
Source: Eurostat, AUVIS domain a) Source : Ministry of Press and Media b)Source: CMT, Telecommunications Market Comission of Spain. Annual Report 1999;Including FM and MW radio stations c) Source: Autorità per le garanzie nelle telecomunicazioni (AUTCOM) and RAI d) Ministero delle Comunicazioni (MINCOM)e) source: ICS f) Association of Finnish Broadcasters g) Source: RTVV (Radio & TV Authority) and SR (Sveriges Radio) h) There are per definition no nation-wide private radio stations (single programme services) in Sweden. However, private radio broadcasters are operating through networks of private local radio stations. Thefigure indicate number of networks penetrating 40% or more of population. i) Analogue only - there are a handful of only cable & satellite stations j) Regionaland local windows excluded. The public broadcaster the Icelandic National Broadcasting Service operated three regional services/windows in the years under review.Source: SI
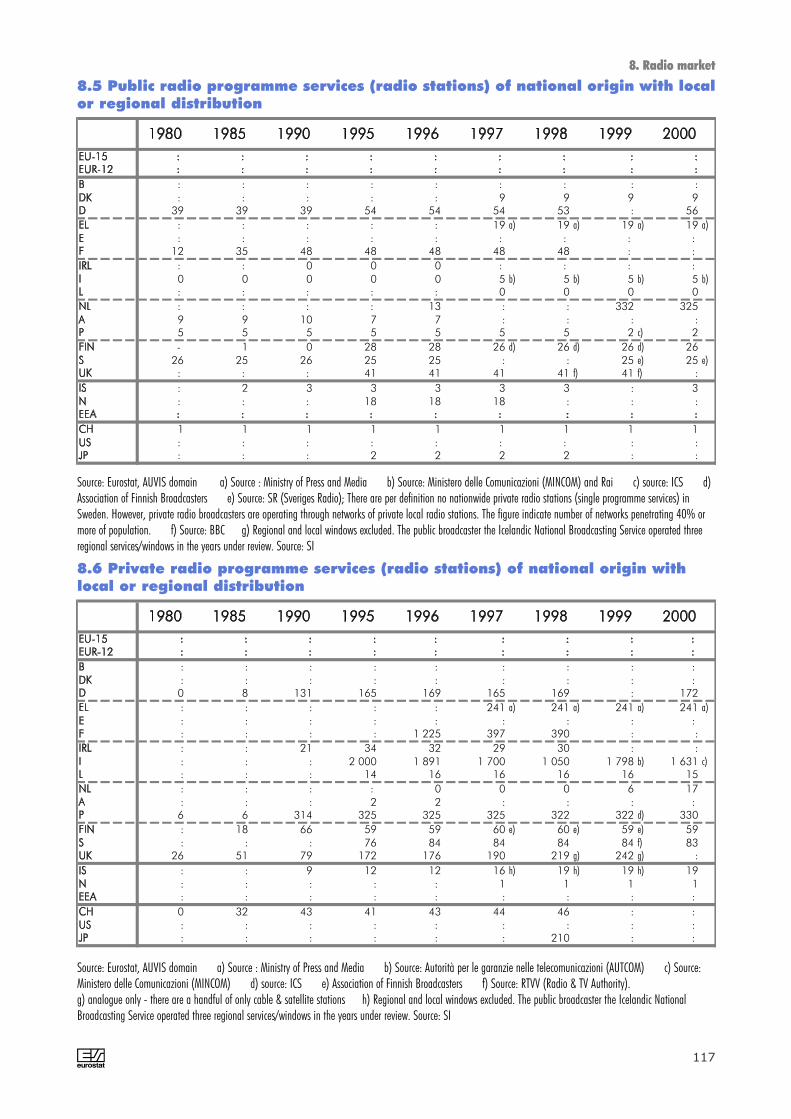
A 117
EU-15 : : : : : : : : :EUR-12 : : : : : : : : :B : : : : : : : : : DK : : : : : 9 9 9 9 D 39 39 39 54 54 54 53 : 56
EL : : : : : 19 a) 19 a) 19 a) 19 a) E : : : : : : : : : F 12 35 48 48 48 48 48 : :
IRL : : 0 0 0 : : : : I 0 0 0 0 0 5 b) 5 b) 5 b) 5 b) L : : : : : 0 0 0 0
NL : : : : 13 : : 332 325 A 9 9 10 7 7 : : : : P 5 5 5 5 5 5 5 2 c) 2
FIN - 1 0 28 28 26 d) 26 d) 26 d) 26 S 26 25 26 25 25 : : 25 e) 25 e) UK : : : 41 41 41 41 f) 41 f) :
IS : 2 3 3 3 3 3 : 3 N : : : 18 18 18 : : : EEA : : : : : : : : :
CH 1 1 1 1 1 1 1 1 1US : : : : : : : : :JP : : : 2 2 2 2 : :
8. Radio market
8.5 Public radio programme services (radio stations) of national origin with localor regional distribution
Source: Eurostat, AUVIS domain a) Source : Ministry of Press and Media b) Source: Ministero delle Comunicazioni (MINCOM) and Rai c) source: ICS d)Association of Finnish Broadcasters e) Source: SR (Sveriges Radio); There are per definition no nationwide private radio stations (single programme services) inSweden. However, private radio broadcasters are operating through networks of private local radio stations. The figure indicate number of networks penetrating 40% ormore of population. f) Source: BBC g) Regional and local windows excluded. The public broadcaster the Icelandic National Broadcasting Service operated threeregional services/windows in the years under review. Source: SI
EU-15 : : : : : : : : : EUR-12 : : : : : : : : : B : : : : : : : : : DK : : : : : : : : : D 0 8 131 165 169 165 169 : 172
EL : : : : : 241 a) 241 a) 241 a) 241 a) E : : : : : : : : : F : : : : 1 225 397 390 : :
IRL : : 21 34 32 29 30 : : I : : : 2 000 1 891 1 700 1 050 1 798 b) 1 631 c) L : : : 14 16 16 16 16 15
NL : : : : 0 0 0 6 17 A : : : 2 2 : : : : P 6 6 314 325 325 325 322 322 d) 330
FIN : 18 66 59 59 60 e) 60 e) 59 e) 59 S : : : 76 84 84 84 84 f) 83 UK 26 51 79 172 176 190 219 g) 242 g) :
IS : : 9 12 12 16 h) 19 h) 19 h) 19 N : : : : : 1 1 1 1 EEA : : : : : : : : :
CH 0 32 43 41 43 44 46 : : US : : : : : : : : : JP : : : : : : 210 : :
8.6 Private radio programme services (radio stations) of national origin withlocal or regional distribution
Source: Eurostat, AUVIS domain a) Source : Ministry of Press and Media b) Source: Autorità per le garanzie nelle telecomunicazioni (AUTCOM) c) Source:Ministero delle Comunicazioni (MINCOM) d) source: ICS e) Association of Finnish Broadcasters f) Source: RTVV (Radio & TV Authority).g) analogue only - there are a handful of only cable & satellite stations h) Regional and local windows excluded. The public broadcaster the Icelandic NationalBroadcasting Service operated three regional services/windows in the years under review. Source: SI
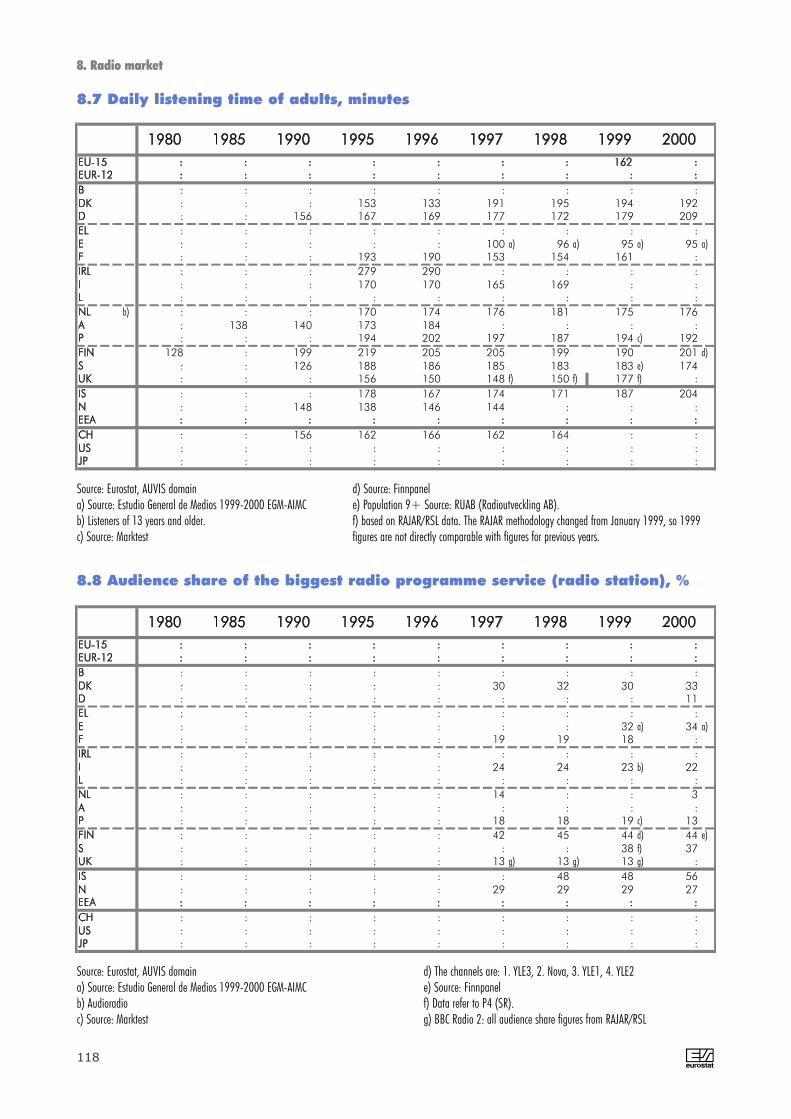
EU-15 : : : : : : : 162 :EUR-12 : : : : : : : : :B : : : : : : : : :DK : : : 153 133 191 195 194 192D : : 156 167 169 177 172 179 209EL : : : : : : : : :E : : : : : 100 a) 96 a) 95 a) 95 a) F : : : 193 190 153 154 161 :
IRL : : : 279 290 : : : :I : : : 170 170 165 169 : :L : : : : : : : : :NL b) : : : 170 174 176 181 175 176A : 138 140 173 184 : : : :P : : : 194 202 197 187 194 c) 192
FIN 128 : 199 219 205 205 199 190 201 d) S : : 126 188 186 185 183 183 e) 174 UK : : : 156 150 148 f) 150 f) 177 f) :IS : : : 178 167 174 171 187 204N : : 148 138 146 144 : : :EEA : : : : : : : : :CH : : 156 162 166 162 164 : :US : : : : : : : : :JP : : : : : : : : :
8. Radio market
8.7 Daily listening time of adults, minutes
A118
Source: Eurostat, AUVIS domaina) Source: Estudio General de Medios 1999-2000 EGM-AIMCb) Listeners of 13 years and older.c) Source: Marktest
d) Source: Finnpanele) Population 9+ Source: RUAB (Radioutveckling AB).f) based on RAJAR/RSL data. The RAJAR methodology changed from January 1999, so 1999figures are not directly comparable with figures for previous years.
EU-15 : : : : : : : : :EUR-12 : : : : : : : : :B : : : : : : : : : DK : : : : : 30 32 30 33 D : : : : : : : : 11
EL : : : : : : : : : E : : : : : : : 32 a) 34 a) F : : : : : 19 19 18 :
IRL : : : : : : : : : I : : : : : 24 24 23 b) 22 L : : : : : : : : :
NL : : : : : 14 : : 3 A : : : : : : : : : P : : : : : 18 18 19 c) 13
FIN : : : : : 42 45 44 d) 44 e) S : : : : : : : 38 f) 37 UK : : : : : 13 g) 13 g) 13 g) :
IS : : : : : : 48 48 56 N : : : : : 29 29 29 27 EEA : : : : : : : : :
CH : : : : : : : : :US : : : : : : : : :JP : : : : : : : : :
8.8 Audience share of the biggest radio programme service (radio station), %
Source: Eurostat, AUVIS domaina) Source: Estudio General de Medios 1999-2000 EGM-AIMCb) Audioradioc) Source: Marktest
d) The channels are: 1. YLE3, 2. Nova, 3. YLE1, 4. YLE2e) Source: Finnpanelf) Data refer to P4 (SR).g) BBC Radio 2: all audience share figures from RAJAR/RSL

A 119
EU-15 : : : : : : : : :EUR-12 : : : : : : : : :B : : : : : : : : : DK : : : : : 51 701 54 808 51 520 59 098 D : : : : : 456 850 480 298 530 588 :
EL : : : : : : : : : E : : : : : : : : : F : : : : : 477 037 477 714 476 927 :
IRL : : : : : : : : : I : : : : : 77 261 a) 81 905 a) 81 905 a) : L : : : : : : : : :
NL : : : : : : : 39 420 40 150 A : : : : : : : : : P : : : : : : : 33 272 b) 72 774
FIN : : : : : 81 857 c) 84 912 c) 102 426 c) 117 434 S : : : : : : : 122 097 d) 121 949 e) UK : : : : : 289 226 f) 288 627 f) 289 492 f) :
IS : : : : : 15 544 g) 15 656 g) 15 654 g) 15 612 g) N : : : : : : 7 426 7 426 7 458 EEA : : : : : : : : :
CH : : : : : : : : :US : : : : : : : : :JP : : : : : : : : :
8. Radio market
8.9 Hours of radio programmes broadcasted per year by public radio programservices of national origin
Source: Eurostat, AUVIS domaina) Source: RAI b) source: RDP c) Source: Finnish Broadcasting Company; Includes analogue and digital nationwide and regional radio programmes services.d) Source: SR (Sveriges Radio) and UR (Utbildningsradion). e) Source: UR (Utbildningsradion). f) Source: BBC nationwide and local radio.g) Regional and local windows excluded. The public broadcaster the Icelandic National Broadcasting Service operated three regional services/windows in the years underreview. Source: SI
EU-15 : : : : : : : : :EUR-12 : : : : : : : : :B : : : : : : : : : DK : : : : : 14 425 15 926 14 131 17 839 D : : : : : 296 745 314 180 317 110 :
EL : : : : : : : : : E : : : : : : : : : F : : : : : 10 358 11 667 11 603
IRL : : : : : : : : : I : : : : : : 7 783 a) 8 855 a) : L : : : : : : : : :
NL : : : : : : : : : A : : : : : : : : : P : : : : : : : 25 268 b) 48 259
FIN : : : : : 40 854 c) 42 760 c) 56 135 c) 65 226 S : : : : : : : 53 325 d) 54 718 d) UK : : : : : : 12 556 12 556 :
IS : : : : : 7 371 e) 7 237 e) 7 514 e) 7 431 e) N : : : : : : : 2 468 3 145 EEA : : : : : : : : :
CH : : : : : : : : :US : : : : : : : : :JP : : : : : : : : :
8.10 Hours of music programmes broadcasted by public radio program services ofnational origin
Source: Eurostat, AUVIS domaina) Source: RAIb) source: RDPc) Source: Finnish Broadcasting Company
d) Source: SR (Sveriges Radio) e) Regional and local windows excluded. The public broadcaster the Icelandic NationalBroadcasting Service operated three regional services/windows in the years under review.Source: SI

surfmusic.de realguide.real.com web-radio.fm ituner.com Total unique
EU-15 415 200 288 456 973EUR-12 344 149 236 350 767B 7 10 90 6 102DK 4 1 26 4 33D 127 42 8 63 174EL 32 5 3 34 53E 15 10 4 23 33F 23 23 23 59 83IRL 17 8 3 23 32I 41 17 17 52 86L 4 1 0 1 4NL 26 18 12 37 60A 29 8 47 20 74P 16 2 2 24 34FIN 7 5 27 8 32S 16 7 5 19 34UK 51 43 21 83 139
8. Radio market
8.11 Number of EU web radio stations listed on the Internet
A120
Source: Surfmusic.de, real.com, web-radio.fm and ituner.com
‘Total unique’ is a sum made by going through the individual web radio stations listed on the four web sites and by counting each station once. Hence, double countingis avoided. The main reasons why each list differs from another are that stations have to be proposed to be included in these lists by visitors on these pages. The sitesthemselves seem not to be skimming through the Internet for full coverage. Furthermore, each site seems to favour their local region from where the hosts are originating.There are also differences in coverage due to the type of streaming media. At real.com the focus is on station sending with read media streaming technology (ram for-mat). By using one of the following software live streaming radio can be listened to on-line: Media-Player, Real-Player, Winamp, Quicktime and Surfer Network.

9. Video games


9. Video games
Worldwide video games market
The video games market is one of the youngestmarkets to be measured by official statistics.ELSPA, the European Leisure Software PublishersAssociation measures console hardware sales,and leisure software sales, by type of console,from industry sources. Currently only few data areavailable from official statistics on a MemberStates level. This industry dates back to the seven-ties. However statistics on it still need considerabledevelopment. It is an important market with highgrowth in new consoles (like Sony PlayStation 2,Nintendo GameCube and MicroSoft X-Box) anddeclining sales of old consoles (Nintendo 64,Sony PlayStation (one), Sega Saturn andDreamcast). Magnavox began manufacturing theOdyssey in 1972 and during the same yearBushnell from Atari created Pong, the first videogame success. Arcade games such as SpaceInvaders then became successful in 1978. In1983, the Commodore 64, an inexpensive homecomputer, outperformed any video game con-soles. With too many products on the shelves froma multitude of publishers, many companies wentout of business. The video games were back in1985 as Nintendo released NES, debuting with itssuccess Super Mario Bros. In the late ninetiesSony introduced PlayStation, which in 2001 hadreached a household penetration of 11% inGermany, 19% in France, 16% in Italy, 17% inSpain/Portugal and 11% in Benelux according toELSPA.
According to Deutsche Bank, the worldwide videogames market was worth 17 billion euro in 2001.
Video games market in the EU
Eurostat estimates that the total video games mar-ket in the EU was worth 6.6 billion euro in 2000,an increase of 2% from the previous year.
Eurostat estimates that the advanced consolemarket in the EU was worth 1.4 billion euro in2000, an increase of 4% compared to the previ-ous year. Old consoles are phased out at thesame time as new consoles increase sales.Germany had the highest turnover from sales ofconsoles: 348 million euro, followed by UK with325 million euro and France with 266 millioneuro.
Eurostat estimates that the video game softwaremarket was worth 5.9 billion euro in 2000.Germany is the largest EU market: 1.62 billioneuro, followed by the UK (1.56 billion euro) and
68 63 62 6471 74 69 74
65 68
2827 26 26
29 22 31 2429
31
0
10
20
30
40
50
60
70
80
90
100
B D E F I NL A S UK CH
cartridges
CD-ROM
game console
peripheralequipment
PCs
[%]
9157
475
13
325
45 43 29
114
348
266
773
195322
111
46 24
297
486
158
53 250
100
200
300
400
500
600
700
800
D UK F E NL B CH S
game consoleCD-ROMcartridges
[million ECU/EUR]
A 123
Source: EAO
Source: EAO
France (0.80 billion euro).
Video games industry in the US
According to Interactive Digital Software Association (IDSA)and Eurostat estimates, the total video games market wasworth 11 billion euro in 2001, an increase by 38% from2000 when the market had a size of 8 billion euro.
This extraordinary growth in 2001 was triggered in part by thelaunch of three new gaming systems: Nintendo's GameCubeand Game Boy Advance and Microsoft's Xbox. According toNPDFunworldSM, total video game hardware unit salesincreased by 39 percent in 2001, compared to one year ear-lier. Next-generation console systems such as GameCube,Xbox and Sony PlayStation 2 led to an increase of turnoverover 139% in euro for annual 2001 versus 2000. Console
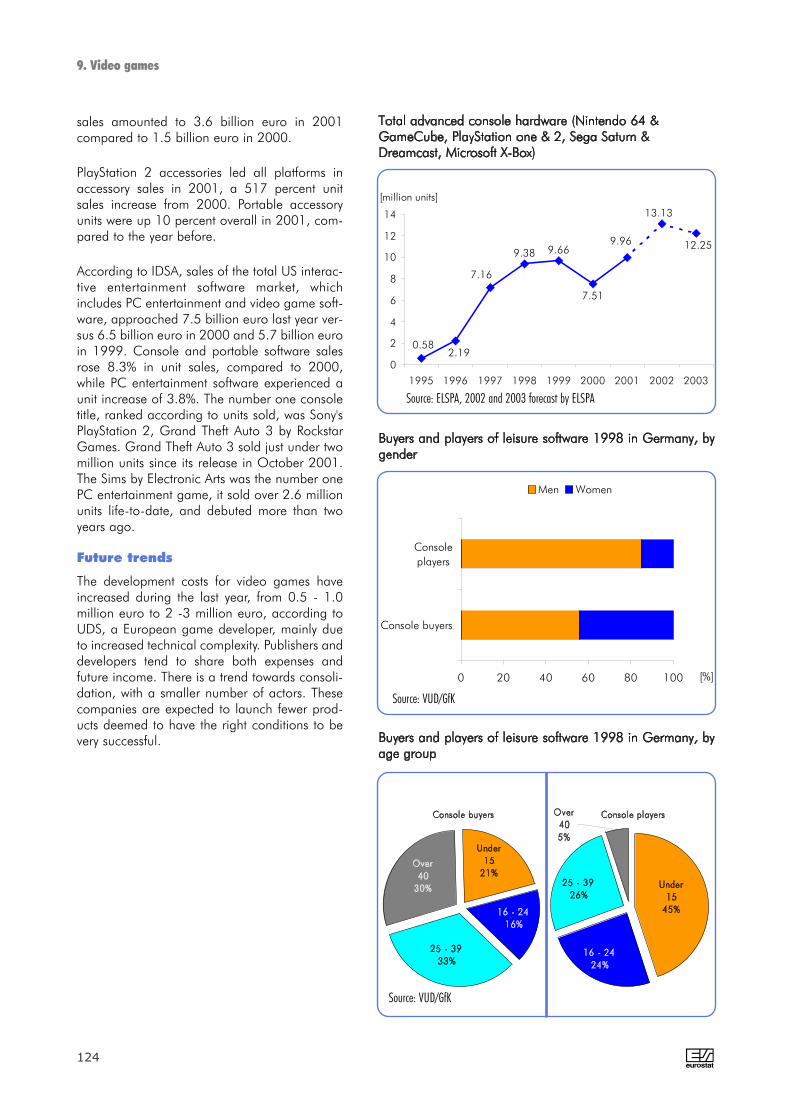
A124
sales amounted to 3.6 billion euro in 2001compared to 1.5 billion euro in 2000.
PlayStation 2 accessories led all platforms inaccessory sales in 2001, a 517 percent unitsales increase from 2000. Portable accessoryunits were up 10 percent overall in 2001, com-pared to the year before.
According to IDSA, sales of the total US interac-tive entertainment software market, whichincludes PC entertainment and video game soft-ware, approached 7.5 billion euro last year ver-sus 6.5 billion euro in 2000 and 5.7 billion euroin 1999. Console and portable software salesrose 8.3% in unit sales, compared to 2000,while PC entertainment software experienced aunit increase of 3.8%. The number one consoletitle, ranked according to units sold, was Sony'sPlayStation 2, Grand Theft Auto 3 by RockstarGames. Grand Theft Auto 3 sold just under twomillion units since its release in October 2001.The Sims by Electronic Arts was the number onePC entertainment game, it sold over 2.6 millionunits life-to-date, and debuted more than twoyears ago.
Future trends
The development costs for video games haveincreased during the last year, from 0.5 - 1.0million euro to 2 -3 million euro, according toUDS, a European game developer, mainly dueto increased technical complexity. Publishers anddevelopers tend to share both expenses andfuture income. There is a trend towards consoli-dation, with a smaller number of actors. Thesecompanies are expected to launch fewer prod-ucts deemed to have the right conditions to bevery successful.
0 20 40 60 80 100
Console buyers
Consoleplayers
Men Women
[%]
12.25
13.13
0.582.19
7.16
9.96
7.51
9.669.38
0
2
4
6
8
10
12
14
1995 1996 1997 1998 1999 2000 2001 2002 2003
[million units]
Source: ELSPA, 2002 and 2003 forecast by ELSPA
Source: VUD/GfK
Under 15
21%
16 - 2416%
25 - 3933%
Over 40
30%
Console buyers Over 405%
25 - 3926%
16 - 2424%
Under 15
45%
Console players
Source: VUD/GfK
9. Video games

A 125
1998 1999 2000 1998 1999 2000 1998 1999 2000 1998 1999 2000 1998 1999 2000
: : : : : : : : : : : : : : :: : : : : : : : : : : : : : :
1 220 1 340 1 293 507 515 528 30 37 43 : 44 46 : : :: : : : : : : : : : : : : : :
8 859 10 288 10 572 4 850 4 793 4 586 264 306 348 761 741 773 442 466 486: : : : : : : : : : : : : : :
1 492 1 445 2 040 819 833 862 143 199 114 72 101 111 98 189 1584 686 5 944 6 812 2 357 2 687 2 763 205 220 266 222 343 322 253 435 475
: : : : : : : : : : : : : : :2 550 3 345 4 016 1 160 1 344 1 605 91 : : : : : 83 : :
: : : : : : : : : : : : : : :2 367 2 769 3 018 987 1 032 894 19 19 45 : 93 91 13 46 53 405 a) 607 849 : 359 378 : : : : : : : : :
: : : : : : : : : : : : : : :: : : : : : : : : : : : : : :
1 750 a) 2 048 1 718 : 693 562 : : : : 32 57 13 : :7 233 8 625 8 470 2 018 2 668 3 708 258 306 325 118 169 195 247 294 297
: : : : : : : : : : : : : : :: : : : : : : : : : : : : : :: : : : : : : : : : : : : : :
1 326 1 525 1 693 558 617 759 28 28 29 : 24 : : 25 :: : : : : : : : : : : : : : :: : : : : : : : : : : : : : :
sales value sales value (CD-ROM)Video game
cartridgesPC Computer peripheral Video game console Video game software
(monitors, printers)sales valuesales value sales value
9. Video games
9.2 PC sales value, Computer peripheral sales value, Video game console salesvalue, Video game software and Video game cartridges sales value
Source: European Audiovisual Observatory
a) PC sales value in 1997
1998 1999 2000 1998 1999 2000
d) : 5 100 5 200 : 1 350 1 400: 3 500 3 500 : 950 1 000: : 96 d) 30 b) 37 b) 43 b)
a) : : 42 : : :1 468 1 575 1 618 264 b) 306 b) 348 b)
: : : : : : 170 b) 290 b) 269 b) 143 b) 199 b) 114 b) 475 b) 778 b) 797 205 220 266
: : : : : : 439 e) 514 e) 507 e) 91 60 c) 51 c)
: : : : : :b) 137 142 142 19 19 45
: : : : : :: : : : : :: : : : 18 22: : 75 : : 28
b) 1 228 e) 1 472 e) 1 554 e) 258 306 325: : : : : :: : : : : :: : : : : :: : : : : :
4 906 f) 5 724 f) 6 508 f) 1 134 g) 1 322 g) 1 504: : : : : :
9.1 Turnover from video game software and video game hardware. Number ofvideo game software and video game consoles
Source: Eurostat, AUVIS domaina) Turnover from video games, totalb) Source EAOc) Eurostat estimate based on volume
d) Eurostat estimatee) Source ELSPA (European Leisure Software Publishers Association)f) Source IDSAg) Eurostat estimate based on IDSA

A126
1995 1996 1997 1998 1999 2000 2001 577 2 189 7 161 9 382 9 662 7 514 9 955
23 76 319 490 444 341 459 88 330 1 592 1 634 1 565 1 242 1 936
177 503 1 392 1 673 1 559 1 337 2 059 25 85 515 1 060 1 247 818 693 35 170 487 968 1 398 741 683
229 1 025 2 856 3 557 3 450 3 035 4 126
9. Video games
9.3 Total advanced console hardware sales in Western Europe, 1,000 units
Source: Screen Digest from industry sources via ELSPA (European Leisure Software Publishers Association) Western European countries included:Austria, Belgium, Denmark, Finland, France, Germany, Greece, Ireland, Italy, Netherlands, Norway, Spain, Sweden, Switzerland and the UK. 2001data are provisional
Console buyers Console players PC buyers PC players
55.9 85.0 73.7 86.144.1 15.0 26.3 13.9
20.9 45.0 15.0 32.416.3 24.2 19.9 25.832.9 26.0 37.3 31.029.9 4.8 27.7 10.8
9.4 Buyers and players of leisure software 1998 in Germany
Source: VUD/GfK
1995 1996 1997 1998 1999 2000 20011 817 9 951 24 649 42 908 58 360 58 569 61 936
114 508 1 586 3 277 3 182 3 251 3 794 359 1 949 6 065 8 180 10 231 10 527 12 489 531 3 162 4 816 8 884 11 739 12 299 13 992 125 605 2 914 5 370 7 920 7 987 7 073 105 759 1 715 4 198 7 420 7 125 6 259 583 2 968 7 552 12 999 17 869 17 380 18 329
9.5 Leisure software market (total advanced consoles) by volume, 1 000 units
Source: Screen Digest from industry sources via ELSPA (European Leisure Software Publishers Association)
1995 1996 1997 1998 1999 2000 2001 94 510 1 230 1 787 2 202 2 153 2 509
20 104 301 365 409 400 491 30 187 248 373 450 460 620 7 36 150 227 292 283 285 5 37 74 146 222 205 194
32 146 458 676 829 807 918
9.6 Leisure software market (total advanced consoles) by value, million EUR
Source: Screen Digest from industry sources via ELSPA (European Leisure Software Publishers Association)

A 127
2 PS2 Madden NFL 2002 Electronic Arts August ’01
3 GBC Pokemon Crystal Nintendo of America July ’01
4 PS2 Metal Gear Solid 2 Konami of America November ’01
5 GBA Super Mario Advance Nintendo of America June ’01
6 PS2 Gran Turismo 3: A-Spec Sony July ’01
7 PS2 Tony Hawks Pro Skater 3 Activision October’01
8 PSX Tony Hawks Pro Skater 2 Activision September ’00
9 GBC Pokemon Silver Nintendo of America October ’00
10 PSX Driver 2 Infogrames November’00
1 PS2 Grand Theft Auto 3 October ’01Rockstar Games
9. Video games
9.7 Top 10 Video Game Titles in US in 2001, sorted by units
Source: NPDFunworld TRSTS Video Games
2 MP Roller Coaster Tycoon Infogrames February ’99
3 Harry Potter & The Sorcerer’s Stone Electronic Arts November ’01
4 Diablo 2 Expansion Set: Lord of Destruction
Vivendi Universal June ’01
5 The Sims: House Party Expansion Pack
Electronic Arts February ’01
6 The Sims: Livin’ Large Expansion Pack
Electronic Arts December ’99
7 The Sims: Hot Date Expansion Pack Electronic Arts November ’01
8 Diablo 2 Vivendi Universal March ’99
9 Sim Theme Park Electronic Arts November’99
10 MS Age of Empires: Age of Kings Microsoft August ’99
1 The Sims Electronic Arts November ’99
9.8 Top 10 PC Titles in US in 2001, sorted by units
Source: NPDFtechworld


Other related information


Ericsson7%
Samsung7%
Siemens7%
Motorola15%
Others29%
Nokia35%
A 131
PC density
According to the ITU, the number of PCs in use inthe EU increased from 93 million in 1999 to 108million in 2000 (+16%). There are, however, strongdifferences in the density of PCs between MemberStates, and between the EU-15 (35 PCs per 100inhabitants) and the US (59%). The Nordic countriesand Luxembourg have the highest PC density (over40%). The density in Greece (7%), Portugal (10%)and Spain (14%) remains low compared to the EUaverage. In 2000, 35% of the EU citizens (aged 15and over) had a desktop computer at home, while5% had a laptop. PCs are more and more develop-ing into multimedia tools. A CD Rom drive, and, toa larger extent, a DVD Rom drive are now standardfeatures enabling the playing of music CDs and filmson a normal PC. With the Internet, radio and TV-ser-vices can be accessed via a PC. Slow connectionspeeds have limited the popularity of the latter.
Worldwide mobile phone sales in 2001declined for first time in industry's histo-ry
The number of mobile phone subscribers in the EUhas increased rapidly over the last few years, but2001 marked a period of consolidation with a slow-ing down in the growth (18% according to ‘MobileCommunications’, Informa Telecoms Group). At theend of 2000 the number of subscribers in the EUreached 63 per 100 inhabitants (‘MobileCommunications’ estimate for 1 January 2002: 279million subscribers or 73/100). Luxembourg,Austria, Norway, Italy, the UK and Finland recordedthe highest densities of subscribers (above 72/100).France and Belgium registered the lowest. The den-sity of mobile phone subscribers in the US (40/100)and in Japan (53/100) is still lower than the EUaverage.
According to Gartner Dataquest, worldwide mobilephone sales totalled nearly 399.6 million units in2001, a decline of 3.2 percent from 2000 sales.Worldwide mobile phone sales between 1996 and2000 experienced a compound annual growth rateof close to 60 percent, but in 2001, for the first timein its history, the mobile phone industry suffered adrop in unit sales, partly due to the removal of pre-paid subsidies supporting mobile terminal sales.Another reason was a burgeoning market for sec-ond-hand terminals across the developing world.Unsold inventory from the fourth quarter of 2000and the economic slowdown further depressedsales. While the overall industry declined, Nokiaextended its lead in the market. Samsung showedthe strongest unit sales growth among the top-tiervendors as it grew 36.8 percent. Ericsson's unit salesdeclined 35 percent in 2001, but the combinedsales of Ericsson and Sony during 2001 were closeto 34 million units.
Other general information
5146
4340 39
36 34 34 3430 28
21
1410
7
35
59
32
0
10
20
30
40
50
60
S L DK FIN NL IRL B D UK F A I E P EL EU-
15
US JP
Source: International Telecommunication Union
source: Gartner Dataquest (March 2002)
0.2
238.9
66.8
85.3
109.5
0.42.53.43.4
3.710.7 6.7 5.3
5.96.3
6.424.7
42.229.1
43.5
48.2
0
20
40
60
80
100
120
140
160
180
200
220
240
260
D UK I F E NL P S A EL B FIN N DK IRL L IS EU-
15
US JP CN
8777 75 73 73 72 72 68 67 67 66 63 63
49
64
40
53
7
525659
0
20
40
60
80
100
120
L A N I UK FIN S NL IS P IRL DK E D EL B F EU-
15
US JP CN
Growth (%) Mobile phone subscribers per 100 inhabitants
source: ITU
source: ITU

A132
Other general information
Internet users
According to a Eurobarometer survey from June2001, Internet penetration in EU-15 householdsreached 36.1% (November 2001: 37.7%). TheNordic countries and the Netherlands show thehighest Internet household penetration.
In the EU-15 there was an average of 38 Internetusers per 100 inhabitants in August 2001, or over140 million in total, while in the United States therewere 63 Internet users per 100 inhabitants, with atotal of 175 million users. The density in Japan wasabout the same as in EU-15. The Internet is,amongst other things, increasingly used to down-load music, picture and video files and more andmore radio services are available on the Internet.Internet is also used as promotion medium for newfilms. The most popular Website is starwars.com. Inone week in March 2001, 315 000 surfers down-loaded the trailer for the new Starwars ‘Episode 2:Attack of the clones’ film.
Household size
There are strong differences in the average size ofhouseholds among the EU countries. In Ireland andin the southern countries (Spain, Portugal) we canfind the biggest households with about 3 members.On the other side of the scale was Germany andSweden with just 2 members per household.
Increase in population
During the last 5 years the EU 15 populationincreased in average by 0.3% per year or 1.3% intotal (nearly 5 million persons). There are pro-nounced differences among the member states. InLuxembourg the population increased by 7.2%.Also in Ireland and Iceland the increase was muchhigher than in the other countries. In seven mem-ber states the population increased by 0.5 to 1.0%.
Handicapped population
About 1 million persons in the EU are blind (0.3%of population) and 1 million are profoundly deaf.The number of visually impaired persons (above16) in the EU is 5 million and in the US 7.3 million.The number of persons 16 years and older withhearing impairment in the EU is 7.6 million com-pared to 7.0 million in the US. These persons haveobvious difficulties to consume audiovisual prod-ucts. They together represent 5 % of the adult pop-ulation.
7.2
5.04.5
3.0 2.92.2 2.1 2.1 1.9
1.41.0 1.0 0.9 0.8 0.8 0.7 0.7 0.5
1.3
4.7
0.6
0.0
1.0
2.0
3.0
4.0
5.0
6.0
7.0
8.0
L IRL IS N NL DK F CH UK FIN B EL P A D I E S EU-
15
US JP
3.0
2.5 2.4 2.4 2.3 2.3 2.3 2.3 2.2 2.2 2.2 2.12.4
2.6 2.62.72.72.72.73.03.0
0
1
2
3
4
IRL E P IS EL I L A F B UK NL N CH FIN DK D S EU-
15
US JP
Source: see tables on the following pages
69 67 6561
55
42 41 40 3935
2925
18 1813
34
63
35
0
20
40
60
80
S DK NL FIN A UK B EL D L IRL I F E P EU-
15
US JP
JP 1999 data

A 133
7 15 17 23 25 35
9 18 22 29 31 34
11 27 31 38 41 43
8 19 23 28 30 34
2 3 4 5 6 7
3 9 10 11 12 14
7 13 15 21 22 30
8 18 21 27 32 36
4 8 9 17 19 21
30 34 38 39 40 46
9 20 23 32 36 39
6 16 17 24 26 28
3 6 7 8 9 10
10 24 27 35 36 40
8 25 29 40 45 51
11 20 22 26 30 34
20 33 37 46 52 59
6 12 16 24 29 32
Other general information
10.1 PCs per 100 inhabitants
Source: International Telecommunication Union
5 10 15 24 345 8 14 29 41
11 19 28 48 676 13 19 24 392 3 7 13 403 4 7 14 182 6 10 15 184 8 12 27 292 5 9 23 257 12 18 22 356 10 19 46 658 7 11 37 555 6 7 7 13
20 26 32 44 6123 34 41 56 697 14 21 34 42
15 22 41 56 639 13 15 31 35
10.2 Internet users per 100 inhabitants
Source: From 1997 to 99: International Telecommunication Union ;
source: Nua 2000 refers to November data, except for B September, for EL and AOctober, for F March ; for L June ; for P July ; for FIN August;
2001 refers to survey in April
Source: 2001 data for UK: Netsizer
Luxembourg 2001 estimated

1980 1985 1990 1995 1996 1997 1998 1999 2000 2001
: : 3.81 4.07 4.08 4.14 a) 4.17 a) 4.23 a) 4.31 a) 4.29i) : : 2.27 2.36 2.37 2.39 2.41 2.42 2.43 2.43
: : 28.72 36.41 36.81 36.82 37.05 37.31 37.48 38.12 i)
: : 3.50 3.76 3.82 3.88 3.83 3.84 3.89 3.99: : 11.46 12.11 12.15 12.30 b) 12.51 b) 12.77 b) 12.98 13.18: : 21.64 23.13 23.43 23.70 23.87 24.08 24.41 24.48: : 1.06 1.15 1.16 1.19 1.23 1.24 1.24 1.20: : 19.82 20.37 20.18 20.16 21.32 21.47 21.66 21.97: : 0.14 0.14 0.16 0.16 0.16 0.16 0.16 :: : 6.11 6.42 6.48 6.61 6.82 6.79 6.82 6.85: : 2.94 3.12 3.16 3.17 3.20 3.24 3.27 3.30: : 3.30 3.27 3.35 3.40 3.34 3.36 3.39 3.41: : 2.17 2.26 2.29 2.31 c) 2.33 c) 2.36 c) 2.35 c) 2.37 i): : 3.79 4.10 4.11 4.14 d) 4.12 d) 4.17 d) 4.23 i) 4.35 i): : 22.66 24.45 24.65 24.98 e) 25.09 e) 25.43 e) 25.60 25.82: : 0.09 0.10 0.10 0.10 f) 0.10 f) 0.10 f) 0.10 0.10: : 1.75 1.85 1.86 1.89 1.91 1.94 1.94 :
: : 2.84 3.02 3.08 3.10 3.13 3.18 3.18g) : 92.80 93.30 98.90 99.60 101.00 102.50 103.90 103.90 104.70
35.82 37.98 40.67 45.45 h) 46.03 h) 46.71 h) 47.35 h) 48.07 h) : :
Other general information
10.3 Households, million
A134
Source: Eurostat (estimates) a) Since 1998, National Register 1 Jan - INS (estimate) b) Source: INE; Encuesta Continua de Presupuestos Familiares. c) Source: Statistics Finland; Number of households at last day of the previous year. d) Source: Statistics Sweden, Income survey. Reference period 1st of January.e) Source: DETR Household projections (GB - mid year) and Labour Force Survey for Northern Ireland (|Regional Trends- Spring) f) Estimated by SI g) US, source:the Motion Picture Association of America h) Eurostat estimate based on NHK figures, which in turn is based on Basic Register of Residents at the end of fiscal year.i) Source: EAO
9.9 9.9 9.9 10.1 10.1 10.2 10.2 10.2 10.25.1 5.1 5.1 5.2 5.3 5.3 5.3 5.3 5.3
78.2 77.7 79.1 81.5 81.8 82.0 82.1 82.0 82.29.6 9.9 10.1 10.4 10.5 10.5 10.5 10.5 10.5
37.2 38.4 38.8 39.2 39.2 39.3 39.3 39.4 39.453.7 55.2 56.6 58.0 58.3 58.5 58.7 58.5 59.23.4 3.5 3.5 3.6 3.6 3.7 3.7 3.7 3.8
56.4 56.6 56.7 57.3 57.3 57.5 57.6 57.6 57.70.4 0.4 0.4 0.4 0.4 0.4 0.4 0.4 0.4
14.1 14.5 14.9 15.4 15.5 15.6 15.7 15.8 15.97.5 7.6 7.7 8.0 8.1 8.1 8.1 8.1 8.19.7 10.0 9.9 9.9 9.9 9.9 10.0 10.0 10.04.8 4.9 5.0 5.1 5.1 5.1 5.1 5.2 5.28.3 8.3 8.5 8.8 8.8 8.8 8.8 8.9 8.9
56.3 56.6 57.5 58.5 58.7 58.9 59.1 59.4 59.60.2 0.2 0.3 0.3 0.3 0.3 0.3 0.3 0.34.1 4.1 4.2 4.3 4.4 4.4 4.4 4.4 4.5
6.3 6.5 6.7 7.0 7.1 7.1 7.1 7.1 7.2: 236.9 248.1 261.7 264.2 266.5 269.1 271.5 274.0
117.1 121.0 123.6 125.6 125.5 124.6 126.1 126.1 126.3
10.4 Population, million
Source: Eurostat New Cronos database

A 135
1980 1985 1990 1995 1996 1997 1998 1999 2000EUR 1.0000 1.0000 1.0000 1.0000 1.0000 1.0000 1.0000 1.0000 1.0000Belgian Franc 40.598 44.914 42.426 38.552 39.299 40.533 40.621 40.340 40.340Danish Krone 7.8274 8.0188 7.8565 7.3280 7.3593 7.4836 7.4993 7.4356 7.4538German Mark 2.5242 2.2263 2.0521 1.8738 1.9095 1.9644 1.9691 1.9558 1.9558Greek Drachma 59.418 105.74 201.41 302.99 305.55 309.36 330.73 325.76 336.63Spanish Peseta 99.702 129.14 129.41 163.00 160.75 165.89 167.18 166.39 166.39French Franc 5.8690 6.7950 6.9141 6.5251 6.4930 6.6126 6.6014 6.5596 6.5596Irish Pound 0.6760 0.7152 0.7678 0.8155 0.7934 0.7475 0.7862 0.7876 0.7876Italian Lira 1189.2 1448.0 1522.0 2130.1 1959.0 1929.3 1943.7 1936.3 1936.3Luxembourg Franc 40.598 44.914 42.426 38.552 39.299 40.533 40.621 40.340 40.340Dutch Guilder 2.7603 2.5110 2.3121 2.0989 2.1397 2.2108 2.2197 2.2037 2.2037Austrian Schilling 17.969 15.643 14.440 13.182 13.435 13.824 13.855 13.760 13.760Portuguese Escudo 69.552 130.25 181.11 196.11 195.76 198.59 201.70 200.48 200.48Finnish Markka 5.1722 4.6942 4.8550 5.7086 5.8282 5.8806 5.9825 5.9457 5.9457Swedish Krona 5.8810 6.5213 7.5205 9.3319 8.5147 8.6512 8.9159 8.8075 8.4452Pound Sterling 0.5985 0.5890 0.7139 0.8288 0.8138 0.6923 0.6764 0.6587 0.6095Iceland Krona : 31.669 : 84.685 84.656 80.439 79.698 77.182 72.585Norwegian Krone 6.8655 6.5110 7.9485 8.2858 8.1966 8.0186 8.4659 8.3104 8.1129Swiss Franc 2.3278 1.8557 1.7622 1.5457 1.5679 1.6440 1.6220 1.6003 1.5579US Dollar 1.3923 0.7631 1.2734 1.3080 1.2698 1.1340 1.1211 1.0658 0.9219Yen (Japan) 315.04 180.56 183.66 123.01 138.08 137.08 146.42 121.32 99.475
Other general information
10.5 Exchange rate, 1 ECU/EUR =
Source: Eurostat New Cronos database


Appendix


A 139
1. Audiovisual services and advertising
Number of enterprises (Code 11 11 0)
A count of the number of enterprises registered to the population concerned in the business register corrected for errors, in par-ticular frame errors. Dormant units are excluded. This statistic should include all units active during at least a part of the refer-ence period.
Turnover (Code 12 11 0)
Turnover comprises the totals invoiced by the observation unit during the reference period, and this corresponds to market salesof goods or services supplied to third parties.
Turnover includes all duties and taxes on the goods or services invoiced by the unit with the exception of the VAT invoiced by theunit vis-à-vis its customer and other similar deductible taxes directly linked to turnover.
It also includes all other charges (transport, packaging, etc.) passed on to the customer, even if these charges are listed sepa-rately in the invoice. Reduction in prices, rebates and discounts as well as the value of returned packing must be deducted.
Income classified as other operating income, financial income and extra-ordinary income in company accounts is excluded fromturnover. Operating subsidies received from public authorities or the institutions of the European Union are also excluded.
Number of persons employed (Code 16 11 0)
The number of persons employed is defined as the total number of persons who work in the observation unit (inclusive of work-ing proprietors, partners working regularly in the unit and unpaid family workers), as well as persons who work outside the unitwho belong to it and are paid by it (e.g. sales representatives, delivery personnel, repair and maintenance teams). It includes per-sons absent for a short period (e.g. sick leave, paid leave or special leave), and also those on strike, but not those absent for anindefinite period. It also includes part-time workers who are regarded as such under the laws of the country concerned and whoare on the pay-roll, as well as seasonal workers, apprentices and home workers on the pay-roll.
The number of persons employed excludes manpower supplied to the unit by other enterprises, persons carrying out repair andmaintenance work in the enquiry unit on behalf of other enterprises, as well as those on compulsory military service.
Unpaid family workers refer to persons who live with the proprietor of the unit and work regularly for the unit, but do not have acontract of service and do not receive a fixed sum for the work they perform. This is limited to those persons who are not includ-ed on the payroll of another unit as their principal occupation.
NACE Rev. 1 92.1 Motion picture and video activities (=92.11 + 92.12 +92.13)
NACE Rev. 1 92.11 Motion picture and video production
This class includes:
� production of theatrical and non-theatrical motion pictures whether on film or on video tape for direct projection in thetheatres or for broadcasting on television.
� production in a motion-picture studio, or in special laboratories for animated films or cartoons, of full-length films, doc-umentaries, shorts, etc., for public entertainment, for promotion, education or training
� supporting activities such as dubbing etc.
This class excludes:
� film duplicating as well as audio and video tape reproduction from master copies
� film processing other than for the motion picture industry
� agency activities
� production of films or tapes normally produced in television studios, see 92.20
� activities of own account actors, cartoonists, directors, consultants and other technical specialists
Appendix

Appendix
NACE Rev. 1 92.12 Motion picture and video distribution
This class includes:
� distribution of motion pictures and video tapes to other industries but not to the general public. This involves the sale or rental of movies or tapes to other industries, as well as activities allied to the distribution of films and video tapes such as film and tape booking, delivery, storage, etc.
� buying and selling of motion picture and video distribution rights
This class excludes:
� film duplicating as well as audio and video tape reproduction from master copies
� retail trade of tapes
� renting of tapes to the general public
NACE Rev. 1 92.13 Motion picture projection
This class includes:
� motion picture or video tape projection in cinemas, in the open air or in other projection facilities
This class also includes:
� activities of cine-clubs
NACE Rev. 1 92.2 = 92.20 Radio and television activities
This class includes:
� broadcasting of radio and television programmes
� production of radio and television programmes whether or not combined with broadcasting
The programmes produced and broadcast may be for entertainment, promotion, education or training or news dissemination.The production of programmes may result in a permanent tape which may be sold, rented or stored for broadcast or rebroad-cast.
This class excludes:
� radio and television transmission via cable networks
� radio and television transmission by relay or satellite
� production of movies and video tapes which are nominally produced in movie studios, see 92.11
� press agencies
Total advertising expenditure:
Total advertising expenditures including agency commissions and classified advertising but not production costs. Discounts on thenormal advertising rates are not taken into account (European Advertising Tripartite procedures). Here total advertising expendi-ture comprises newspapers, magazines, outdoor (including transport), radio and cinema advertising expenditures.
TV advertising expenditure:
Expenditures for advertising on TV programme services (e.g. spots on national TV channels, local TV channels whether terrestri-al, cable or satellite broadcasting transmission) including agency commissions and excluding production costs and net of dis-counts.
Radio advertising expenditure:
Expenditures for advertising on radio programme services (e.g. spots on national/local radio stations whether terrestrial, cable orsatellite broadcasting transmission) including agency commissions and excluding production costs and net of discounts.
Cinema advertising expenditure:
Expenditures for advertising in cinemas including agency commissions and excluding production costs and net of discounts.
A140

2. Cinema production and distribution market
Total number of cinematographic full-length films produced:
Production of new full-length fiction and animated films produced (with duration of 60 minutes and over), primarily intended fortheatrical release, finished during the reference year. This category includes 100% national films and international co-produc-tions (i.e. films co-produced by national producers with foreign producers, whether national producers are majority producers orminority producers). Excludes documentaries (if possible). Excludes domestic production of entirely foreign films etc.
Number of national cinematographic full-length films produced (with 100%national origin producers):
New full-length fiction and animated films produced entirely by one or several producers of national origin without foreign pro-ducers involved as producers or without foreign investments from foreign companies sharing investments and rights of the film.
Number of international co-productions of cinematographic full-length filmswith national origin producers:
New long length fiction and animated films produced by one or several producers of national origin (acting as majority or minor-ity producers) with foreign enterprises as producer sharing investments and rights of the films. Excludes entirely foreign films pro-duced or shot within the national territory. For some years, international co-productions do not cover all the componentsdescribed above. (E.g. in some countries, minority international co-productions may not be included in the statistics).
Number of majority international co-productions (international co-produc-tions of cinematographic full-length films with national origin producers asmajority producers):
International co-productions in which national producer(s) have the highest investment share of all participating co-producer(s).Note: Includes 50/50 co-productions (equally shared co-productions) for countries, where information are available.
Number of cinematographic full-length films produced (including nationalfilms and majority international co-productions):
This special variable - calculated for supranational comparison purposes - includes entirely national full-length films producedand majority co-productions. Note: important variable to be able to reduce double counting of international co-productions with-in EU and other aggregates total film production.
Number of cinematographic short length films produced:
Production of new cinematographic short length films (with duration up to 59 minutes) finished during the reference year, intend-ed for theatrical release (commercial exhibitions, festivals, clubs etc.). Includes fictional, documentaries and animated films ofwhatever theatrical format (35mm, 16mm, etc.). Note: Here, breakdown between national and international co-productions isnot mentioned, assuming that in most cases, for historical reasons and budget level involved, international co-productions arenot frequent (an exception may be animated films).
Number of film producers with at least one first release during the year:
Film producers of national origin (e.g. companies, foundations or state organisations, individuals) involved in the production ofat least one new full-length feature film produced during the year intended for theatrical release (also called "active full-lengthfilm production companies, individuals or organisations"). Excludes TV broadcasters and foreign producers or production com-panies.
Number of film distributors with at least one first release during the year:
Film distributors (or distribution companies) with at least one new feature film released in cinemas (on the national exhibition mar-ket) during the year (released for the first time during the reference year). Note: Some countries make the distinction betweenforeign distributors and national origin distributors: Here it is intended to include all distributors of films released on the nation-al exhibition market whatever origin.
Appendix
A 141

Appendix
3. Cinema exhibition market
Cinema income from gross box office receipts (incl. taxes and other duties):
Box office receipts from cinematographic film projection in fixed cinemas (receipts from tickets sold for cinema theatres exhibi-tion) including VAT and other special entertainment taxes (e.g. local taxes on cinema or entertainment, special taxes to supportfilm industry, etc.). Note: Sometimes, box office receipts breakdown by country of origin does not correspond exactly to total grossbox office receipts (due to methodological differences or due to calculation process) or refer to distribution receipts from cinemaexhibition.
Cinema income from gross box office receipts (incl. taxes and other duties)from national, US, British, German, French, Italian or Spanish cinemato-graphic films:
Here data only concern box office receipts from films classified as national, US, British, German, French, Italian or Spanish(including co-productions).
Number of cinema admissions (cinema audience):
Total number of admissions (number of tickets sold) to fixed cinemas during the reference year. Note: This indicator should bebased on cinema screens/sites definition (e.g. excluding mobile cinemas and non-profit cinema units).
Number of cinemas (cinema theatres):
Number of stationary cinema theatres (indoor cinemas and outdoor cinemas) and open- air grounds (e.g. drive-in cinemas) usedfor the projection of cinematographic motion pictures of all kinds. Cinema sites may have one or more screens for exhibitions.Excluding associative projection facilities (e.g. cinema clubs). Excludes mobile cinema projection units. Note: a cinema theatrewith one screen is a monoscreen cinema and a cinema theatre with 2 screens or more is called a multiscreen cinema or a cin-ema complex.
Number of screens (cinema halls):
Number of screens in cinemas used for projection of cinematographic motion pictures (in stationary cinema theatres, it refers tonumber of rooms or cinema halls or film theatres) in fixed cinema sites (i.e. indoor cinema theatres, open-air cinemas includingdrive-in cinemas but excluding mobile cinemas).
Number of cinema seats:
Total number of permanent seats in fixed cinema sites, i.e. in stationary cinema theatres (indoor and outdoor) and open airgrounds (for drive-in cinemas, estimated capacity based on number of car parking places multiplied by an average of 4 seats).
Number of new feature films released for the first time:
Number of new cinematographic long length films, which had their first public showing in cinemas during the reference year (newreleases). Note: For this table, EU-15 represent average number of films released based on individual country information avail-able. A total number will make no sense due to same films released in several countries at the same time and due to co-pro-ductions double counting.
Number of new cinematographic films released for the first time of national,EU or US origin:
Note: For this table, EU-15 represent average number of films released based on individual country information available. Inmany countries, data includes international co-productions.
A142

4. Video and DVD market
Number of VCR households:
Number of private households equipped with at least one videocassette recorder (VCR).
Number of DVD player households:
Number of private households equipped with at least one DVD player.
Number of outlets selling videos:
Total number of outlets selling videos (local units) of any format (cassettes and discs) to the general public (i.e. at consumer level);aggregation of all distribution channels at retail level (video shops, and other outlets, e.g. in department stores, supermarkets,entertainment electronic shops, book stores, newspaper kiosks (relevant in some countries) and mail order sales).
Outlets renting videos (video shops):
Total number of outlets renting videos (local units) of any format (cassettes and discs) to the general public (i.e. at consumer level);aggregation of all distribution channels at retail level (mainly video shops but also other outlets).
Home video sales and rental:
Receipts from pre-recorded videos (cassettes or discs) sales and rentals: Calculated variable if components provided. Totalreceipts from sales and rentals of pre-recorded videos (cassettes or discs) to the general public (i.e. at consumer level); aggre-gation of all distribution channels at retail level (video shops, and other outlets, e.g. in department stores, supermarkets, enter-tainment electronic shops, book stores, newspapers kiosks (relevant in some countries) and mail order sales). Excludes receiptsfrom unrecorded cassettes (also known as blank videotapes) (Indicate if data include or exclude VAT).
Home video sales:
Receipts from pre-recorded videos (cassettes or discs) sales: Total receipts from sales of pre-recorded videos (cassettes or discs)to the general public (i.e. at consumer level); aggregation of all distribution channels at retail level (video shops, and other out-lets, e.g. in department stores, supermarkets, entertainment electronic shops, book stores, newspaper kiosks (relevant in somecountries) and mail order sales). Also called "retail pre-recorded video market receipts at consumer level". Note: also calledreceipts from sell-through pre-recorded videos at consumer level: selling video cassettes through to consumers (as opposed toonly renting them out). (according to IVF, a rather dated word used only in the context of the video industry).
Home video rental:
Receipts from videos (cassettes or discs) rentals: Total receipts from rentals of videos (cassettes or discs) to the general public (i.e.at consumer level); aggregation of all distribution channels at retail level (video shops mainly, but it may also concern other out-lets, e.g. in department stores, supermarkets, book stores etc.). Note: rentals refer to hiring of videos (cassettes or discs) to con-sumers for a defined period (may be for a single night or more). Rental stores usually buy videocassettes outright specially dedi-cated for rental (In many countries trade price of a cassette dedicated for rental is several times that of a retail tape with or with-out an exclusive rental window), but in some cases they may lease them.
Home videos sold:
Pre-recorded cassettes sold: Number of pre-recorded video tapes sold to consumers. Data may include video discs. Data mayonly be available at distributor level/wholesaler. In this case it is also known as retail cassettes shipped (or shipments) to tradewhich should be net (i.e. excluding returns).
Home video rental transactions:
Video (cassettes or discs) rental transactions: Total number of videos (cassettes or discs) hired by the general public (i.e. at con-sumer level), whether for a short period or not (basic duration is for a single night); aggregation of all distribution channel at
Appendix
A 143

Appendix
retail level (mainly video shops, but also other outlets, e.g. in department stores, supermarkets, book stores etc.) Data may onlybe available at distributor level/wholesaler (e.g. not taking into account retailers stocks). In this case it is not rental transactionsbut number of cassettes or discs sold for rent to retailers (also named: rental cassettes or discs shipped to trade).
Home video titles released for sales
New video titles released for sale: Number of new audio-visual programmes released on video for selling to general public, onwhatever formats (same title may be released in different formats e.g. cassettes or discs).
Home video titles released for rental:
New video titles released for rental: Number of new audio-visual programmes released on video for rentals to general public onwhatever formats (same title may be released in different formats e.g. cassettes or discs).
DVD disc sales and rental:
Retail DVD consumer level spending on DVD discs and revenues from rental DVD discs.
DVD discs sold:
Count of number of DVD discs sold to consumers.
DVD discs rented:
Count of number of DVD disc rental transactions.
DVD titles released for sale:
Count of titles released for sale during the year. EU-15 figure reflects average per EU country.
DVD titles released for rental:
Count of titles released for rental during the year. EU-15 figure reflects average per EU country.
5. Television market
Television households:
Number of private households equipped with at least one TV broadcast receiving equipment (TV set).
TV licence fee accounts:
TV licences (total licence fee accounts): Number of TV licence fee accounts registered by the relevant authorities in charge of thecollection of such fee (to be paid by private households for authorisation to possess and/or use a TV receiving equipment) includ-ing licence fee accounts exempt from payments and non-private households (i.e. enterprises, public administrations etc.).
Annual TV licence fee:
Annual colour TV licence fee (amount of): Annual amount of the fee inclusive of any VAT charges payable (to be paid by privatehouseholds) for authorisation to possess and/or use colour TV broadcast receiving equipment (i.e colour TV set). It may be thatthere is no distinction between black&white and colour TV receiving equipment or there is only a combined fee payable for autho-risation to possess any kind of radio and /or TV receiving equipment.
A144

Turnover of public or private TV broadcasters of national origin:
Total revenue (operating incomes) from all services rendered by TV broadcasters if possible excluding revenue from radio activi-ties (radio programme services and related activities). Operating incomes may comprise receipts from TV licence fees, public sub-sidies, TV advertising, TV sponsorship, teleshopping, subscription fees (pay-TV), receipts from exploitation of own TV programmecopyrights and other operating incomes as income from concessions, patents, trademarks and similar value, etc. Turnover com-prises only ordinary activities and hence excludes the sales of fixed assets.
Income from TV advertising and sponsorship, public or private broadcastersof national origin:
Total receipts coming from advertising (i.e. receipts - based on air time allocation - in respect of any form of message for whichthe broadcaster is paid or otherwise remunerated by a public or a private enterprise or other entity) and sponsorship (i.e. all con-tributions by public or private enterprise to finance the broadcasting of programmes with the aim of promoting the enterprise'sname, brand image activities or operations but not its products or services).
Total number of TV programme services (TV channels)
Total number of TV programme services of national origin i.e. a sequence of television programmes broadcast regularly by what-ever technical means of transmission (terrestrial/cable/satellite) and forming a distinct named entity or channel within the outputof a TV broadcasting organisation or enterprise, located on the economic territory and which are primarily intended for target-ing national audience (whatever distribution coverage). Excludes regional or local windows of TV nation-wide programme ser-vices. Excludes also: TV programmes services not targeting national audience (e.g. TV programmes services for special areasabroad, pan-European TV programme services) and TV programmes services of broadcasters located abroad. Important: a TVprogramme service may use a TV channel (most of cases) or may use partly one or more TV channels. (e.g. In Finland in 1986there were 2 TV nation-wide channels (channel 1 and 2) but 4 TV nation-wide programme services: 2 public TV programmesservices (YLE1 sending programme on channel 1 and YLE2 sending programme on channel 2), a third public TV programme ser-vice (FST sending on both channel 1 and 2) and a private programme service (MTV sending on both channel 1 and 2).
Number of public TV programme services with nationwide distribution:
Total number of public TV programme services of national origin i.e. a sequence of television programmes broadcast regularlyby whatever technical means of transmission (terrestrial/cable/satellite) and forming a distinct named entity or channel within theoutput of a TV broadcasting organisation or enterprise, located on the economic territory and primarily intended for targetingnational audience with a representative nationwide households penetration distribution: at least 40% of TV households of thedomestic market. For cable and/or satellite distribution it refers to households connected to cable network and /or satellite dish-es where programme services in question are distributed. Excludes: TV programmes services not targeting national audience (e.g.TV programmes services for special areas abroad, pan-European TV programme services) and TV programmes services of broad-casters located abroad (even if primarily intended for targeting national audience).
TV programme service which have a public service obligation and which may be financed totally or partly financed by licencefees or by public subsidies. Public programme services may also be partly or mostly financed by advertising, sponsorship, receiptsfrom teleshopping etc.
Number of private TV programme services with nationwide distribution:
Total number of public TV programme services of national origin i.e. a sequence of television programmes broadcast regularlyby whatever technical means of transmission (terrestrial/cable/satellite) and forming a distinct named entity or channel within theoutput of a TV broadcasting organisation or enterprise, located on the economic territory and primarily intended for targetingnational audience with a representative nationwide households penetration distribution: at least 40% of TV households of thedomestic market. For cable and/or satellite distribution it refers to households connected to cable network and /or satellite dish-es where programme services in question are distributed. Excludes: TV programmes services not targeting national audience (e.g.TV programmes services for special areas abroad, pan-European TV programme services) and TV programmes services of broad-casters located abroad (even if primarily intended for targeting national audience).
Appendix
A 145

Appendix
TV programme service, which does not have a public service obligation. Private programme services are usually financed byadvertising, sponsorship, subscription fee, pay-per view fee or receipts from teleshopping etc.
Daily TV viewing time:
Total amount of viewing time spent by a sample population of individuals (previously the unit used may have been TV house-holds) of all age categories (in general here 3-9 years old and over) watching TV programme services, expressed as an averagedaily amount of viewing in minutes. VCR and non-TV uses of the screen should not be taken into account (average daily cumu-lative audience). Annual average.
6. Cable operating market and satellite market
Private households passed by operated cable network:
Aggregated number of private households through or directly outside which an operated cable network passes, whether thehousehold is physically connected to a cable network service or not.
Number of households connected to cable networks:
Private households which are connected to cable services (i.e. through cable network), whether they pay a service of programmespackage subscription fee or not (at least they pay for the technical connection). Note: for heavily cabled countries there mightnot be much difference between, homes connected and cable subscribers.
Cable operators:
Number of enterprises operating technical installations intended for the transmission of broadcasting programme signals bymeans of metallic cables, optical fibres, waveguides, radio links and /or any combinations of such (including collective antennasof large sites); the operator is responsible for the selection of TV and radio programme services which are transmitted.
Satellite households:
Number of households connected to satellite dishes: Aggregated number of private households which are connected to a col-lective satellite dish (SMATV: satellite master antenna television) or which are equipped with an individual dish (DTH: Direct tohome) able to receive TV or radio programme services transmitted via satellite.
7. Sound recordings market
Turnover from sound recordings sales:
Total receipts from sound recordings sales: Total receipts from selling sound recordings to the general public (i.e. at consumerlevel); aggregation of all distribution channels (e.g. in department stores, supermarkets, entertainment electronic shops, musicstores, and mail order sales). Includes total receipts from singles (e.g. vinyl records, audiocassette singles and Compact Disc sin-gles) and albums e.g. vinyl records (LPs), audiocassettes (MCs) and digitally encoded laser discs (CDs). Music videos should beexcluded from the total according to IFPI definition. Note: According to IFPI definitions, a sound recording is a recording unit,which includes any recordings of sound of a performance as well as other sounds. Sound recordings classified by duration includeon one hand "short play" sound recordings - which include singles (vinyl records singles), CD singles (compact disc singles) andMC singles (audio cassettes singles) - and on the other hand "long play" sound recordings (also named albums with minimumduration of an LP vinyl record i.e. 35 to 45 min) - which includes LPs (vinyl records), MCs (audio cassettes) and CDs (CompactDiscs). There are various format of singles on vinyl discs: 17 cm, maxi-singles, EP (extended play) and Mini LPs.
Total sound recordings sold:
Total number of sound recordings units of whatever format sold to the general public (i.e. at consumer level); aggregation of alldistribution channels (e.g. in department stores, supermarkets, entertainment electronic shops, music stores, and mail ordersales). Includes singles (e.g. vinyl records, audiocassettes singles and Compact Disc singles) and albums e.g. vinyl discs (LPs),
A146

audiocassettes (MCs) and digitally encoded laser discs (CDs).
Singles sold:
Number of singles sold (Vinyl, CDs, MCs): Total number of "short play" sound recordings (singles) of whatever format sold to thegeneral public (i.e. at consumer level); aggregation of all distribution channels (e.g. in department stores, supermarkets, enter-tainment electronic shops, music stores, and mail order sales). If available, this category should include all kinds of singles (e.g.vinyl records (singles), cassette singles (MCs) and Compact Disc singles (CDs).
Music Cassettes sold:
Number of MCs sold: Number of sound recordings albums on audiocassettes (MCs) sold to the general public (i.e. at consumerlevel); aggregation of all distribution channels (e.g. in department stores, supermarkets, entertainment electronic shops, musicstores, and mail order sales). For recent years, may include digital compact cassettes (DCCs).
LPs sold:
Number of LPs sold: Number of sound recording albums on "Long Play" vinyl records (LPs) sold to the general public (i.e. at con-sumer level); aggregation of all distribution channels (e.g. in department stores, supermarkets, entertainment electronic shops,music stores, and mail order sales).
CDs sold:
Number of CDs sold: Number of sound recordings albums on digitally encoded laser discs (CDs) sold to the general public (i.e.at consumer level); aggregation of all distribution channels (e.g. in department stores, supermarkets, entertainment electronicshops, music stores, and mail order sales). For recent years, may include mini discs (MDs). Excludes CD singles.
Private households with a CD player: Number of private households equipped with at least one Compact Disc (fixed or portable)player (digitally encoded laser disc player).
8. Radio market
Radio programme services (radio stations) of national origin:
Total number of radio programme services (radio stations) of national origin: Total number of radio programme services (publicand private) of national origin i.e. a sequence of radio programmes broadcast regularly by whatever technical means of trans-mission (terrestrial/cable/satellite) and forming a distinct named entity or station (channel) within the output of a radio broad-casting organisation or enterprise, located on the economic territory and which are primarily intended for targeting national audi-ence (whatever distribution coverage). Excludes local/regional windows of radio nation-wide programme services. Excludes also:radio programmes services not targeting national audience (e.g. radio programmes services for special areas abroad, pan-European or worldwide radio programme services). Important: a radio programme service may use a radio station/channel (mostof cases) or may use partly one or more radio stations (channels).
Public radio programme services (radio stations) of national origin:
Total number of public radio broadcasters of national origin: Total number of enterprises located on the national economic ter-ritory broadcasting one or more radio programme services (whatever the distribution penetration of households) which have apublic service obligation and which may be totally or partly financed by licence fees or by public subsidies or any kind of statefunding. Public radio broadcasters may also include enterprises which are partly financed by advertising, sponsorship etc.
Private radio programme services (radio stations) of national origin:
Total number of private radio broadcasters of national origin: Total number of enterprises located on the national economic ter-ritory broadcasting one or more radio programme services (whatever the distribution penetration of households) which does nothave a public service obligation. Private radio broadcasters are usually totally or partly financed by advertising, sponsorship, sub-scription fees (voluntary payments included), etc.
Appendix
A 147

Appendix
Daily listening time of adults:
Total amount of listening time spent by a sample population of individuals (previously the unit used may have been households)of all age categories (in general here 14-18 years old and over) listening radio programme services, expressed as an averagedaily amount of listening in minutes. Non-radio uses of a combined radio set should not be taken into account (average dailycumulative audience). Annual average.
9. Other general information
Personal computer (PC):
includes portables, desktops and personal workstations. Board-level products are excluded. Data on the number of PCs per 100inhabitants from International Telecommunication Union represent estimates.
Internet user:
person using the Internet. Data relate to persons above a defined age limit. Data come from household surveys or represent esti-mates or projections. In NUA estimates, figures represent both adults and children who have accessed the Internet at least onceduring the 3 months prior to being surveyed. NUA estimates of the worldwide number of Internet users are thus higher than esti-mates from other sources.
Household:
Number of private households: Number of private households including single member households and multiple households withtwo or more members.
Note: According to household budget surveys, these are defined in terms of having a shared residence and common arrange-ments. A household comprises either one person living alone or a group of people, not necessarily related, living at the sameaddress with common housekeeping i.e. sharing at least one meal a day or sharing a living or sitting room.
The statistics presented are based on Eurostat data revised and updated by each NSI in order to complete the time series request-ed and ensure that the figures are compatible with national audio-visual information linked to households (e.g. information con-cerning the penetration rate of audio-visual domestic equipment, information on household consumption of audio-visual appli-ances and services, information used for assessing TV and radio licence-fee evasion rate, etc.). Three different concepts forhouseholds are used at national level in the EU and EFTA countries:
� the household-dwelling concept (DK, F, FIN, S, N),
� the household-keeping unit concept, which has been adopted by 10 countries (B, D, EL, E, IRL, L, NL, A, UK, CH) and
� the household-keeping unit concept with family link (I, P).
Population:
Number of inhabitants: Number of inhabitants at 1st of January each year.
The statistics presented are based on Eurostat data revised and updated by each National Statistical Institute (NSI) or nationalcorrespondents for the AUVIS domain.
Exchange rate 1 ECU/EUR =
The ECU or euro exchange rates, annual average. Data before 1999 are denominated in ECU. Data from 1999 are denomi-nated in euro.
EUR
The abbreviation for euro.
A148
A 149
Appendix
Address: 40 West Carmel Valley Rd., Carmel Valley,CA 93924http://adamsmediaresearch.com/
Brandon GrayP.O. Box 2651Santa Rosa, CA 95405USPhone: 3104526054Email: [email protected]
Taunusanlage 12Tower AD-60325 Frankfurt am MainGermanyTel.: +49-69-910-38080/35395Fax: +49-69-910-38591http://www.db.comE-mail: [email protected]
Address:15 Regent Street, London SW1Y 4LR, UKhttp://www.eiu.com
Address: 76, allée de la Robertsau, F-67000Strasbourg, Francehttp://www.obs.coe.int/Statistical Yearbook
Address: Ancienne route 17A, CH-1218 Grand-Saconnex GE, http://www.ebu.ch
ELSPA (UK) Ltd,Haddonsacre,Station Road, Offenham, Worcs.WR11 8JJ UKhttp://www.elspa.com
Address: 1-11-10, Tsukiji, Chuo-ku, Tokyo 104-8426, Japan, http://www.dentsu.com
Europe HeadquartersGartner, Inc.
TamesisThe GlantyEghamSurrey TW20 9AWUnited KingdomTel: + 44 1784 431611http://www.gartner.com
WirtschaftsforschungRolf BürklNordwestring 10190319 NürnbergGermanyhttp://www.gfk.de/
1211, Connecticut Ave,NW #600Washington, DC 20036United Stateshttp://www.idsa.com
Address: 54 Regent Street, London, WIR 5PJhttp://www.ifpi.org
http://www.recordingmedia.org
Address: Place des Nations, CH-1211 GenevaSwitzerland; http://www.itu.int/ITU Yearbook
http://www.ita.doc.gov
Address: 38 Avenue des Art, B-1040 Bruxelles http://www.ivf-video.org/International Video Yearbook
1126 Ridgemont Dr Milpitas, CA 95035 US
at theMinistry, Regional Broadcasting Division, Informationand Communications Policy Bureau, Ministry ofPublic Management, Home Affairs, Post andTelecommunications

Appendix
A150
http://www.nhk.or.jp/index-e.html
Address: 750 Third Avenue, New York 10017http://www.mccann.com/
Address: Via Soperga 2, 20127 Milano, Italyhttp://www.mediasalles.it/
Address: 1600 Eye Street, NW, Washington,DC20006.(202) 293-1966http://www.mpaa.org
Address: 2-15-2 Ginza, Chuo-ku, Tokyo 104-0061http://www.cric.or.jp
http://www.nielsenmedia.com
http://www.npd.com
2 rue André-Pascal, 75775 Paris CEDEX 16,FRANCE http://www.oecd.orgBroadcasting services 1999; Observatoire Mondial des Systemes deCommunication (1997)
105 Ladbroke Grove, London W11 1PGUnited Kingdomhttp://www.oando.co.uk/
RealNetworks, Inc 2601 Elliott Ave Seattle, Washington 98121 United States
Address: Lyme House Studios, 38 Georgiana Street,London NVI OEBhttp://www.screendigest.com
; Societe Europeenne des Satellites,
Address: L-6815 Chateau de Betzdorf, Luxembourg,http://www.ses-astra.com
Uwe RoseliusDorfstr. 99D-16247 Gross ZiethenGermany
7, place de Fontenoy, 75352 PARIS 07 SP, Francehttp://www.unesco.org
Address: 2 Massachusetts Avenue, N.E. Room 2860,Washington, D. C. 20212 http://stats.bls.gov
was prepared jointly by the International TradeAdministration of the U.S. Department of Commerce,and the McGraw-Hill Companies, Ind.http://www.ntis.gov
Address: 16530 Ventura Blvd., Suite 400, Encino,CA 91436-4551http://www.vsda.org/
Verband der UnterhaltungssoftwareDeutschland e.V.Riemekestr. 16033106 Paderbornhttp://www.vud.de/
BRS Media Inc.760 Market St. Suite 958 San Francisco, CA 94102 United States