aeration 101 – back to basics · aeration system design 5 . aeration 100 – foundation class •...
TRANSCRIPT
Aeration 101 – Back to Basics
Scott Mulinix, P.E.
1
• Located in Brown Deer, WI • Started in 1967 • Acquired ABJ (SBR manufacturer)
in 1995 • Purchased in 1999 by ITT Corp • 2011 spun off to be Xylem • Approximately 60 employees • Leader in diffused aeration and
SBR technology
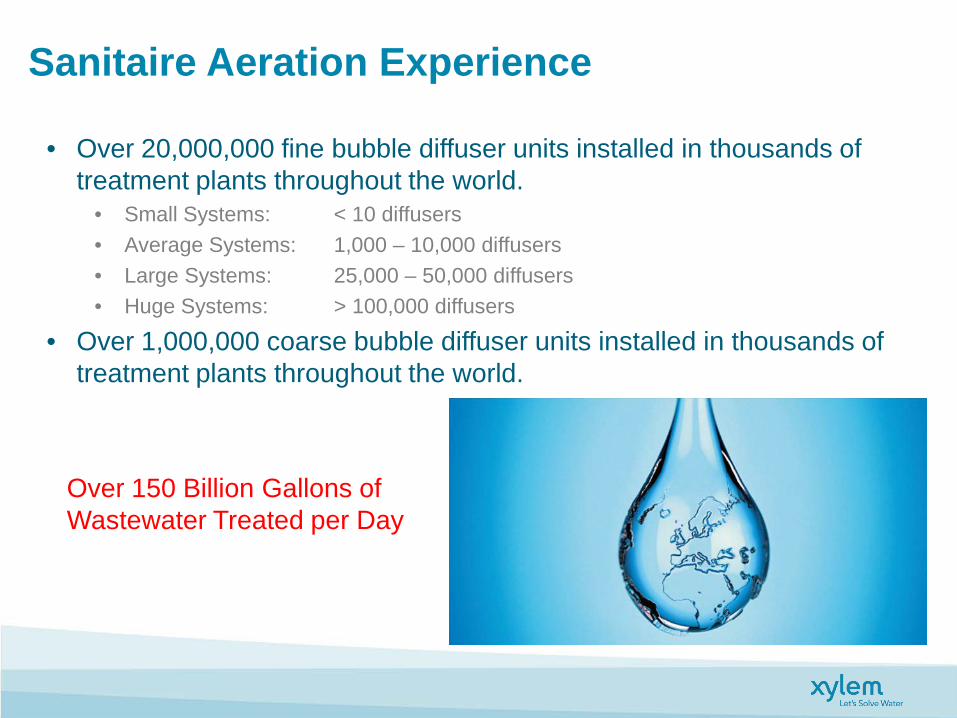
Sanitaire Aeration Experience
• Over 20,000,000 fine bubble diffuser units installed in thousands of treatment plants throughout the world.
• Small Systems: < 10 diffusers • Average Systems: 1,000 – 10,000 diffusers • Large Systems: 25,000 – 50,000 diffusers • Huge Systems: > 100,000 diffusers
• Over 1,000,000 coarse bubble diffuser units installed in thousands of treatment plants throughout the world.
Over 150 Billion Gallons of Wastewater Treated per Day
Aeration System Design
5
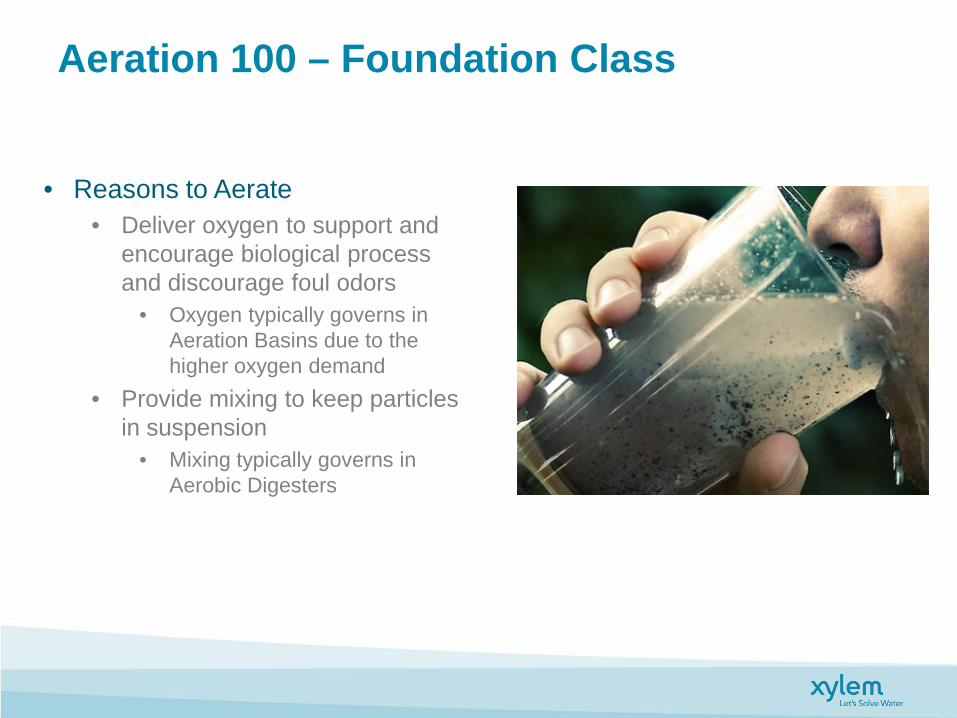
Aeration 100 – Foundation Class
• Reasons to Aerate • Deliver oxygen to support and
encourage biological process and discourage foul odors
• Oxygen typically governs in Aeration Basins due to the higher oxygen demand
• Provide mixing to keep particles in suspension
• Mixing typically governs in Aerobic Digesters
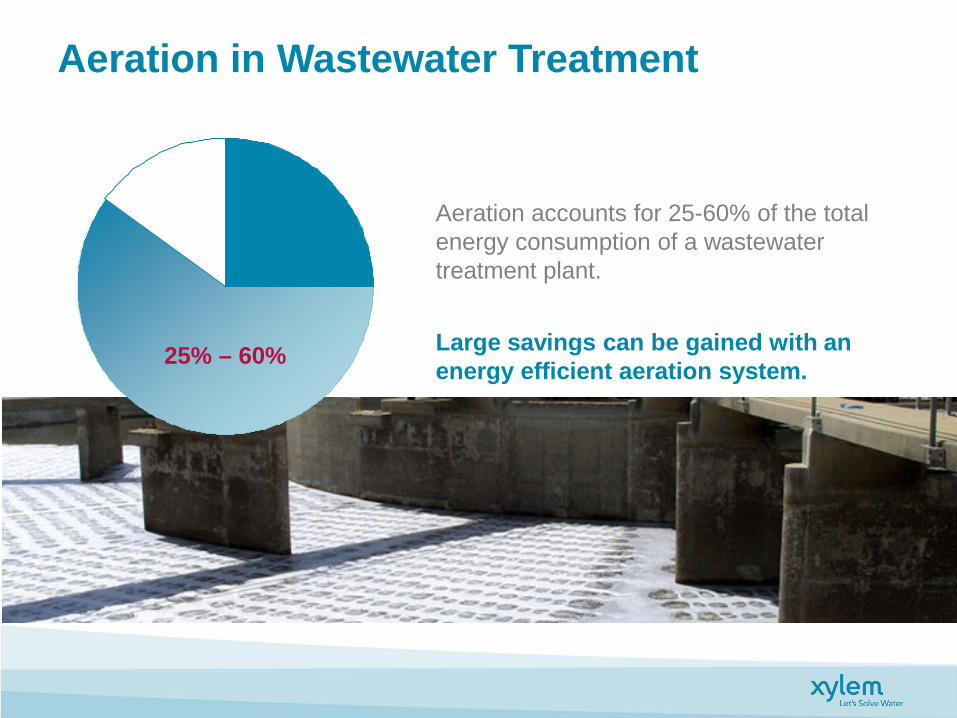
Aeration in Wastewater Treatment
Aeration accounts for 25-60% of the total energy consumption of a wastewater treatment plant.
Large savings can be gained with an energy efficient aeration system. 25% – 60%
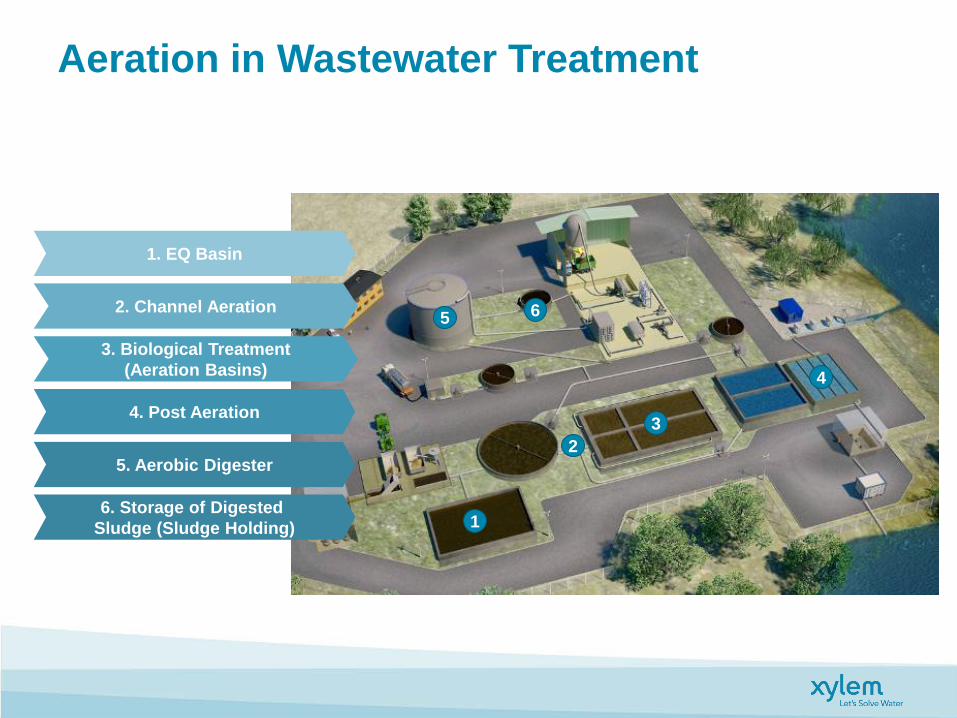
Aeration in Wastewater Treatment
1
2 3
4
5 6
1. EQ Basin
2. Channel Aeration
4. Post Aeration
3. Biological Treatment (Aeration Basins)
5. Aerobic Digester
6. Storage of Digested Sludge (Sludge Holding)
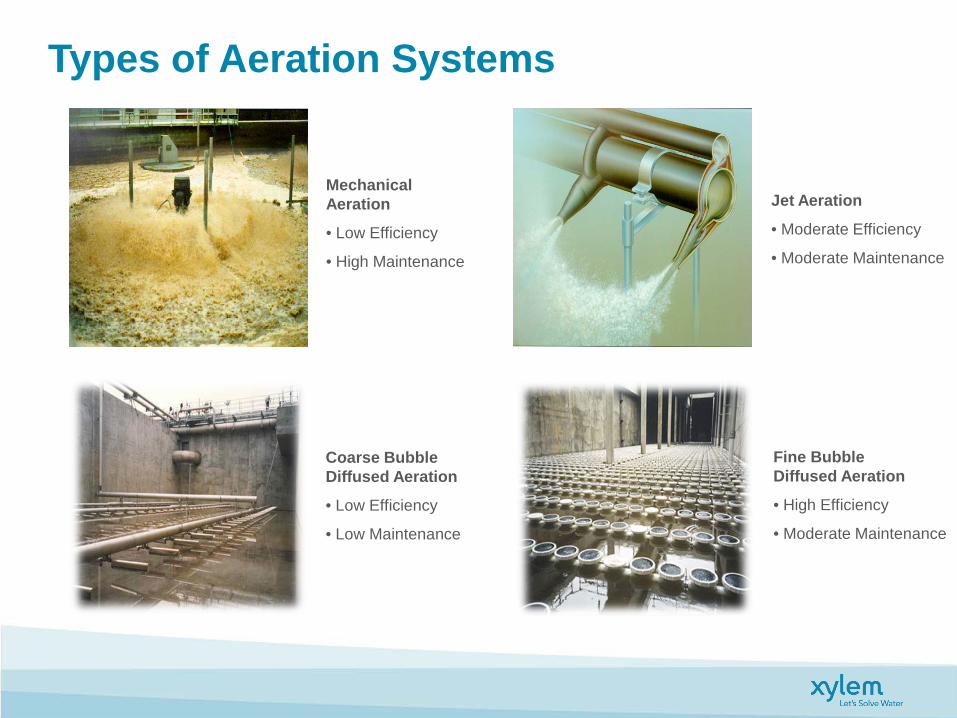
Types of Aeration Systems
Mechanical Aeration
• Low Efficiency
• High Maintenance
Fine Bubble Diffused Aeration
• High Efficiency
• Moderate Maintenance
Jet Aeration
• Moderate Efficiency
• Moderate Maintenance
Coarse Bubble Diffused Aeration
• Low Efficiency
• Low Maintenance
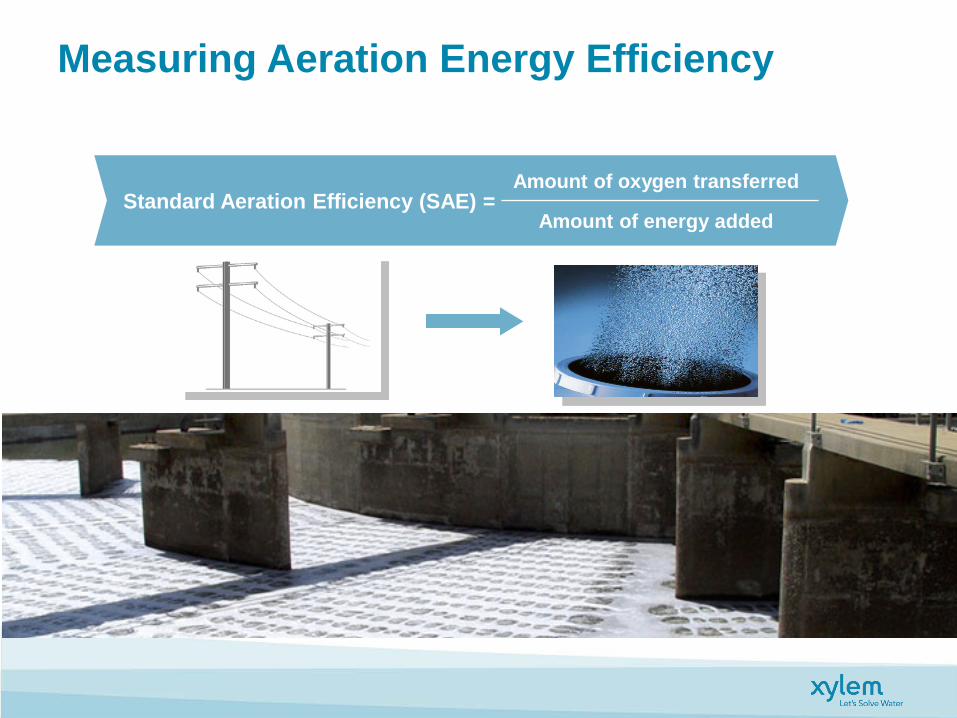
Measuring Aeration Energy Efficiency
Amount of oxygen transferred
Amount of energy added Standard Aeration Efficiency (SAE) =
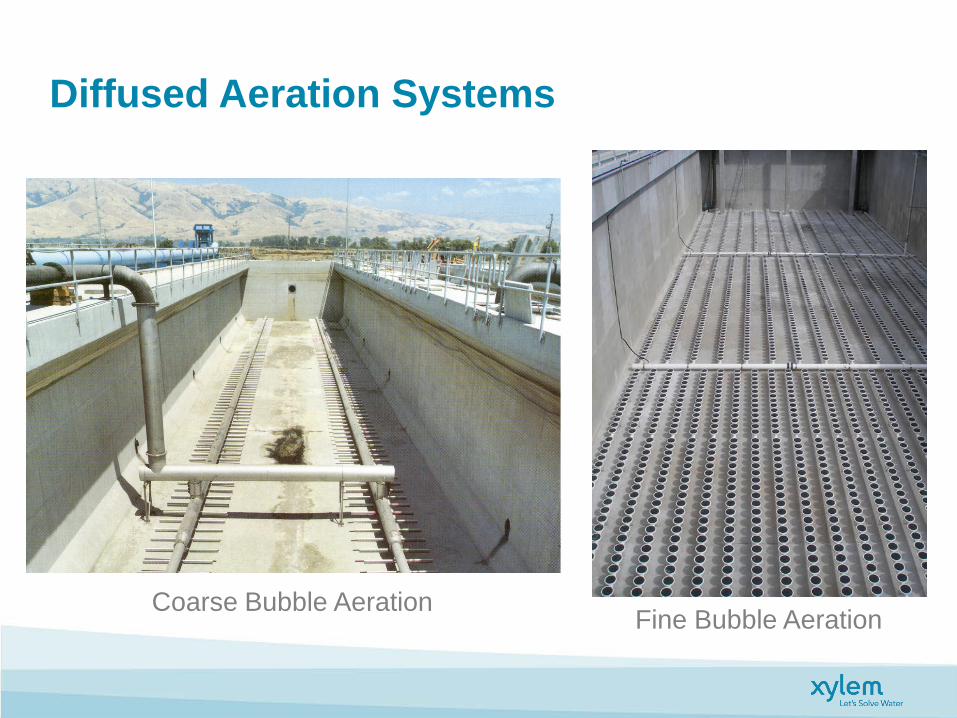
Diffused Aeration Systems
Coarse Bubble Aeration Fine Bubble Aeration
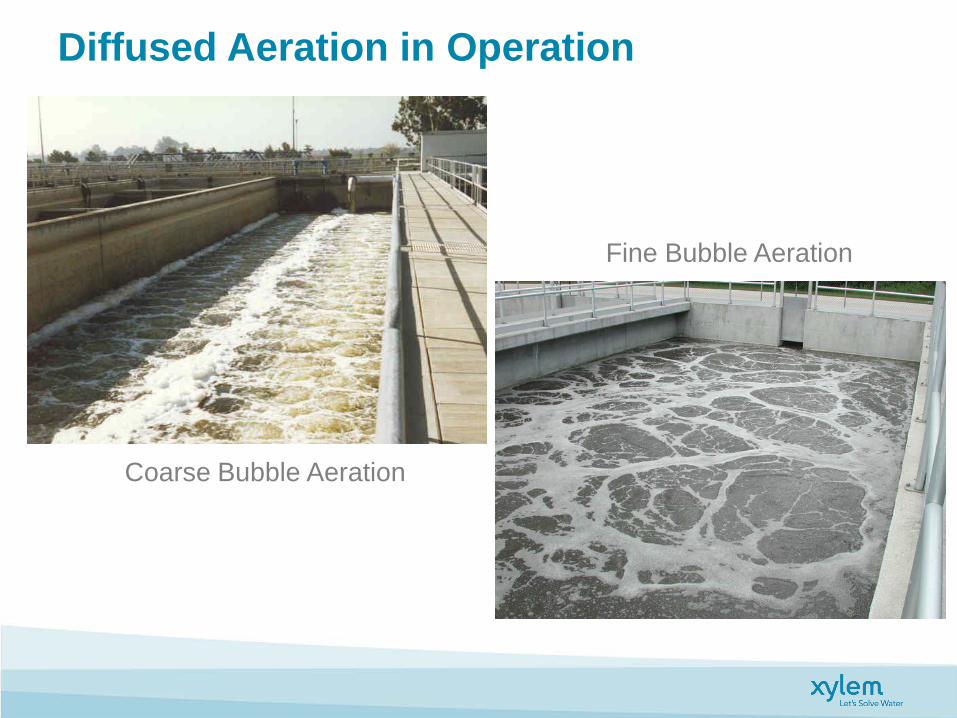
Diffused Aeration in Operation
Coarse Bubble Aeration
Fine Bubble Aeration
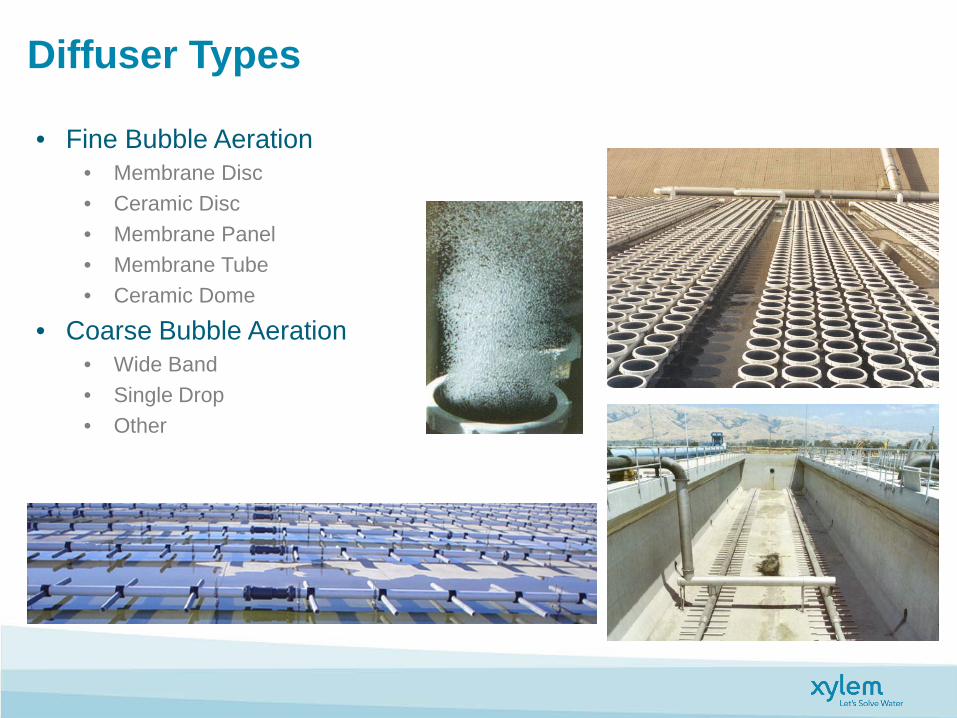
Diffuser Types
• Fine Bubble Aeration • Membrane Disc • Ceramic Disc • Membrane Panel • Membrane Tube • Ceramic Dome
• Coarse Bubble Aeration • Wide Band • Single Drop • Other
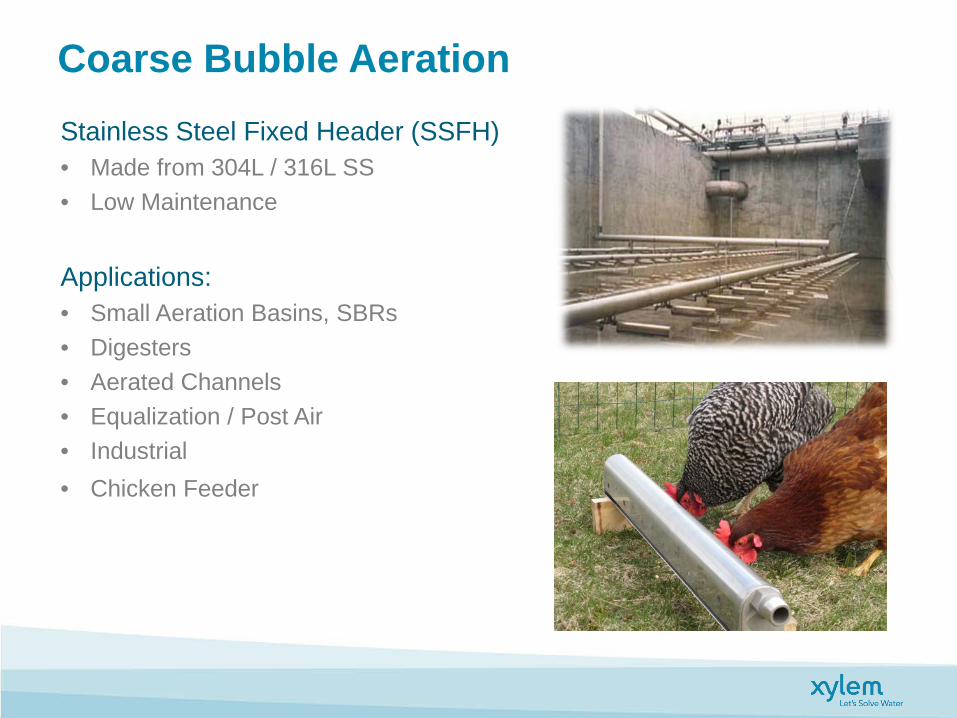
Stainless Steel Fixed Header (SSFH) • Made from 304L / 316L SS • Low Maintenance Applications: • Small Aeration Basins, SBRs • Digesters • Aerated Channels • Equalization / Post Air • Industrial • Chicken Feeder
Coarse Bubble Aeration
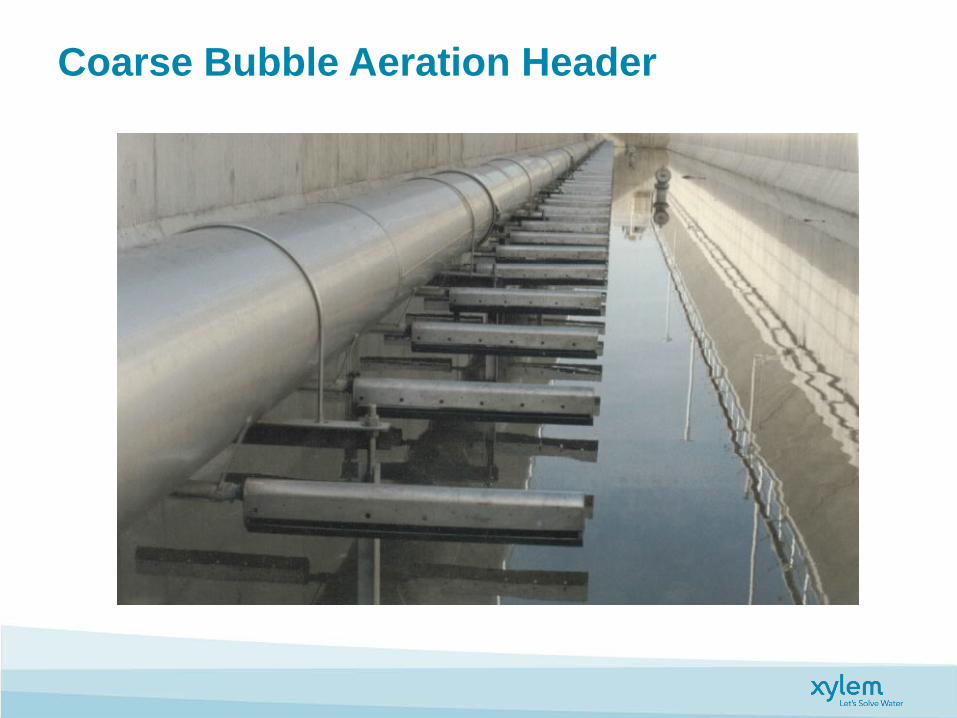
Coarse Bubble Aeration Header
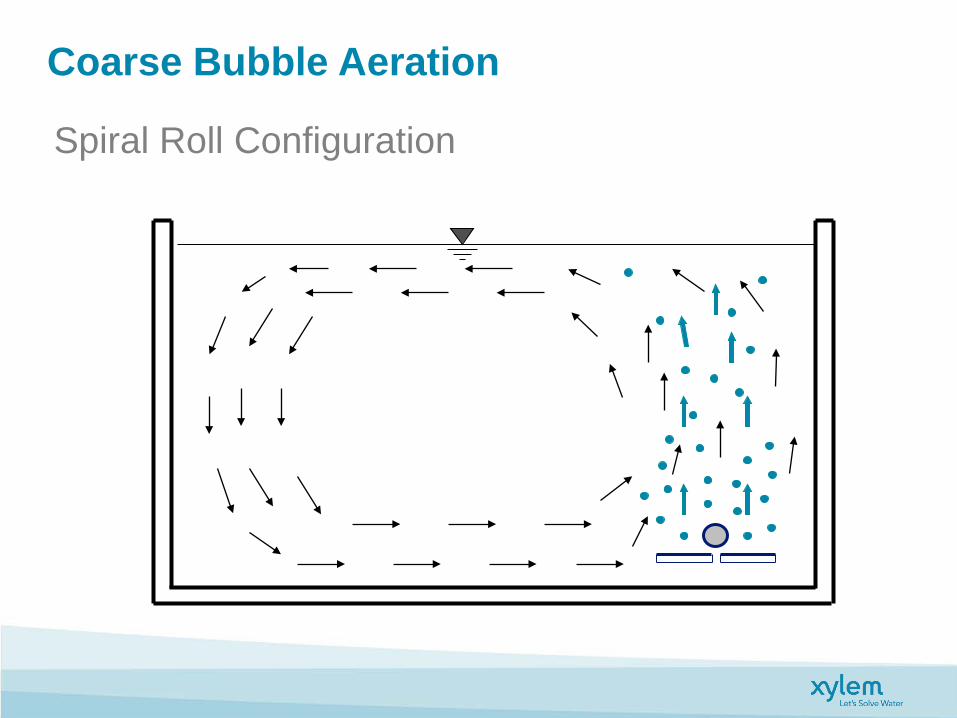
Spiral Roll Configuration
Coarse Bubble Aeration
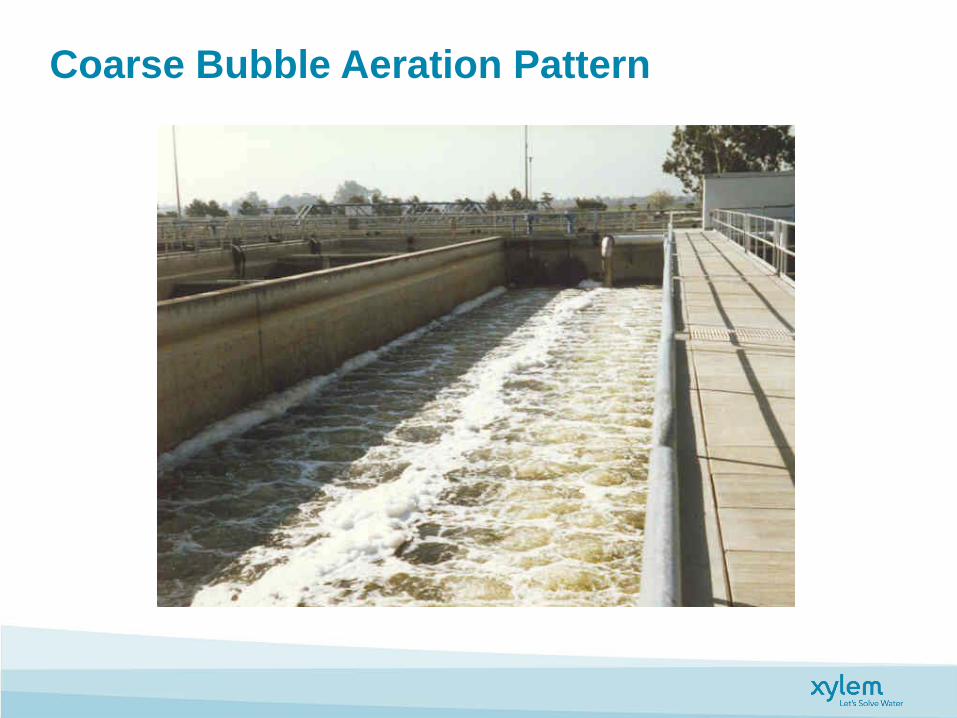
Coarse Bubble Aeration Pattern
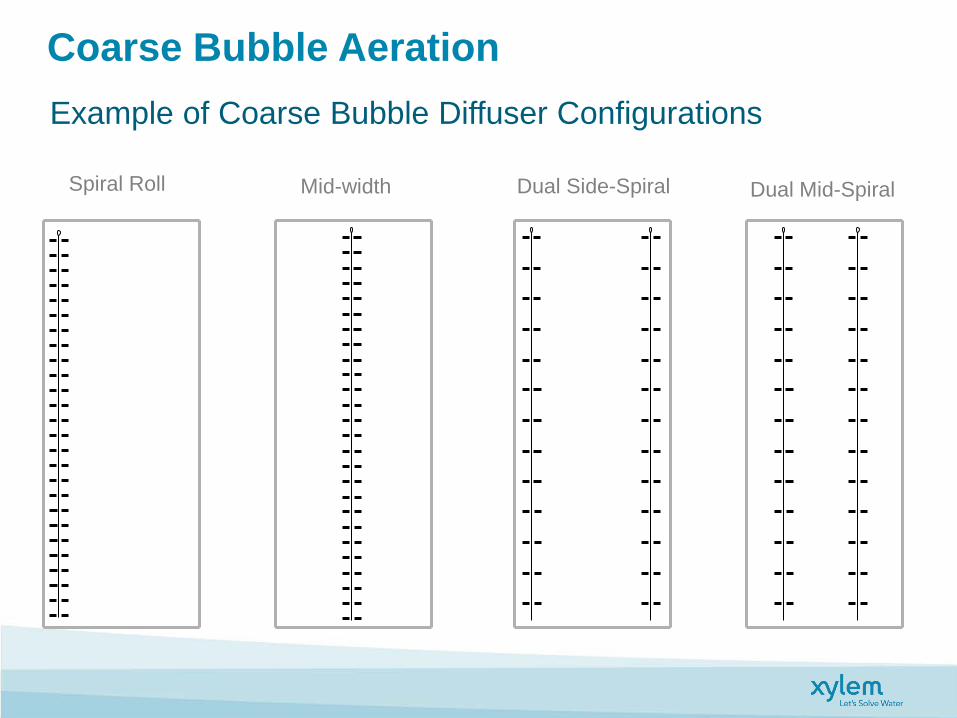
Example of Coarse Bubble Diffuser Configurations
Coarse Bubble Aeration
Spiral Roll Mid-width Dual Side-Spiral Dual Mid-Spiral
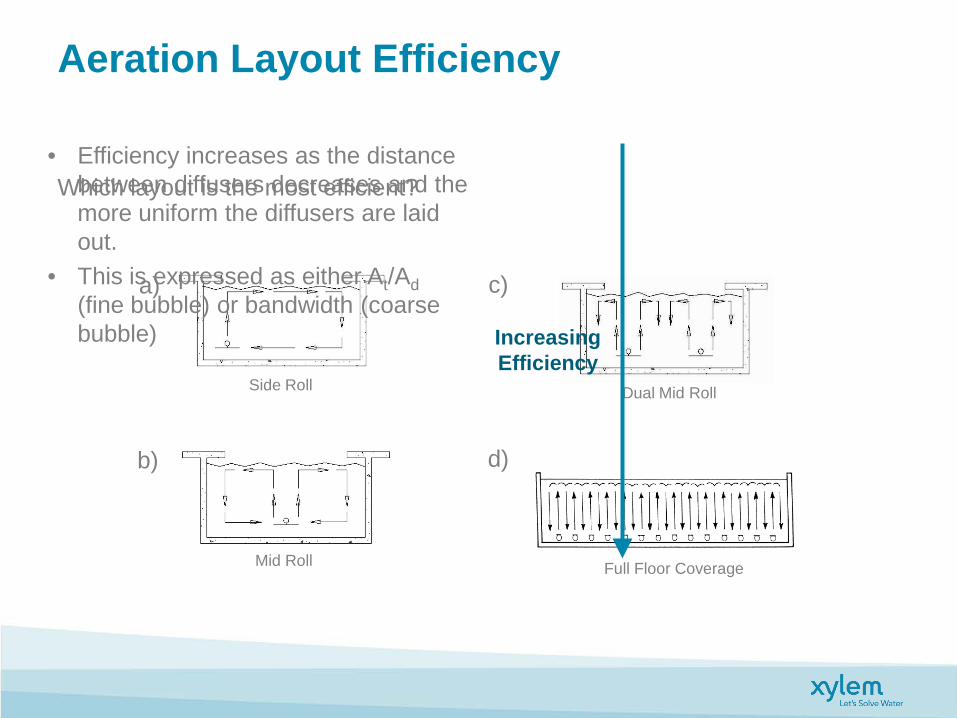
Which layout is the most efficient?
Aeration Layout Efficiency
Side Roll
Mid Roll
Dual Mid Roll
Full Floor Coverage
• Efficiency increases as the distance between diffusers decreases and the more uniform the diffusers are laid out.
• This is expressed as either At/Ad (fine bubble) or bandwidth (coarse bubble)
a)
b) d)
c)
Increasing Efficiency
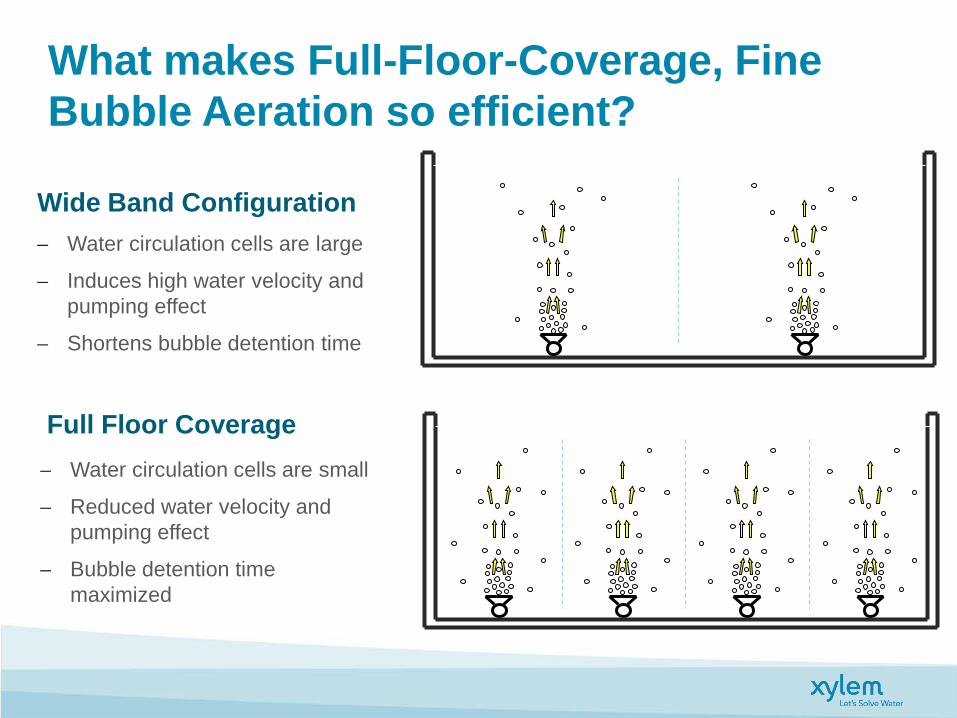
What makes Full-Floor-Coverage, Fine Bubble Aeration so efficient?
− Water circulation cells are small
− Reduced water velocity and pumping effect
− Bubble detention time maximized
Full Floor Coverage
− Water circulation cells are large
− Induces high water velocity and pumping effect
− Shortens bubble detention time
Wide Band Configuration
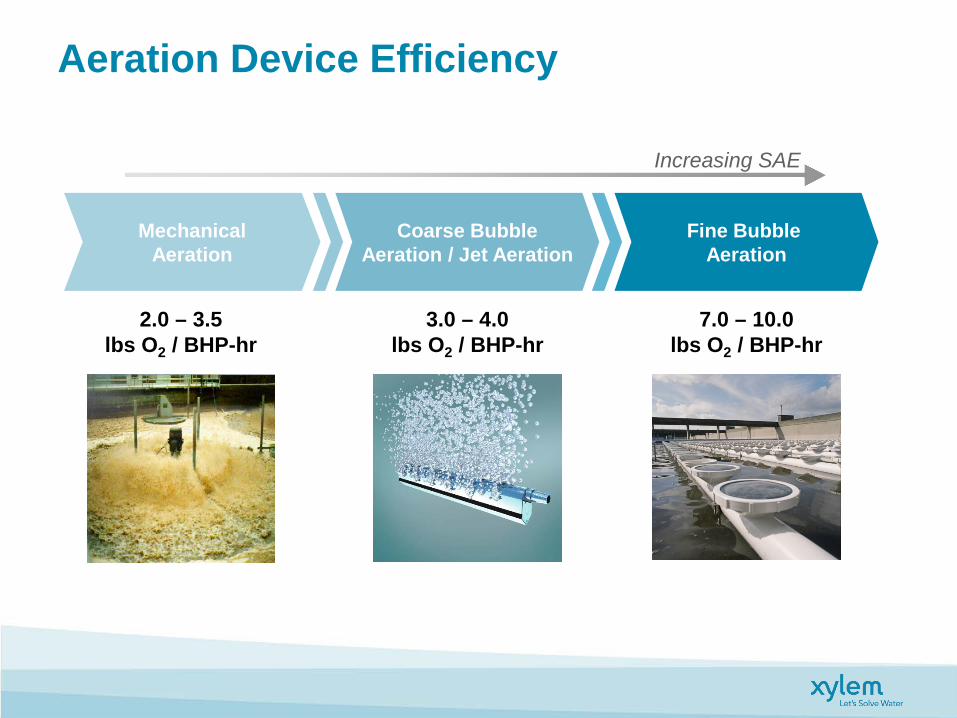
Aeration Device Efficiency
2.0 – 3.5 lbs O2 / BHP-hr
Mechanical Aeration
Coarse Bubble Aeration / Jet Aeration
Fine Bubble Aeration
7.0 – 10.0 lbs O2 / BHP-hr
3.0 – 4.0 lbs O2 / BHP-hr
Increasing SAE
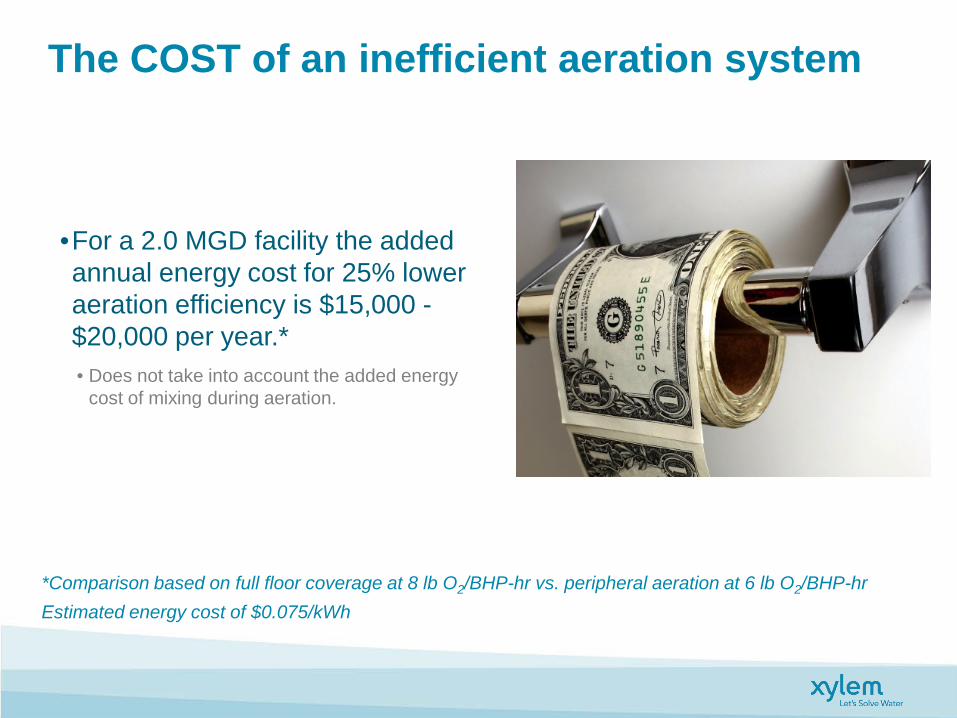
The COST of an inefficient aeration system
•For a 2.0 MGD facility the added annual energy cost for 25% lower aeration efficiency is $15,000 - $20,000 per year.* • Does not take into account the added energy
cost of mixing during aeration.
*Comparison based on full floor coverage at 8 lb O2/BHP-hr vs. peripheral aeration at 6 lb O2/BHP-hr Estimated energy cost of $0.075/kWh
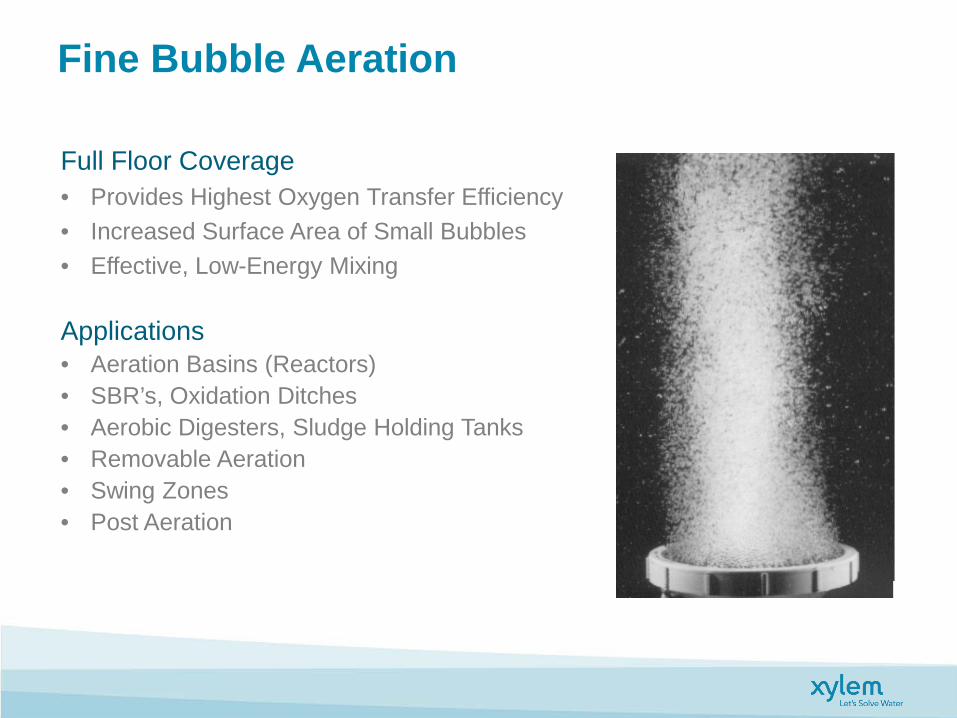
Full Floor Coverage • Provides Highest Oxygen Transfer Efficiency • Increased Surface Area of Small Bubbles • Effective, Low-Energy Mixing
Applications • Aeration Basins (Reactors) • SBR’s, Oxidation Ditches • Aerobic Digesters, Sludge Holding Tanks • Removable Aeration • Swing Zones • Post Aeration
Fine Bubble Aeration
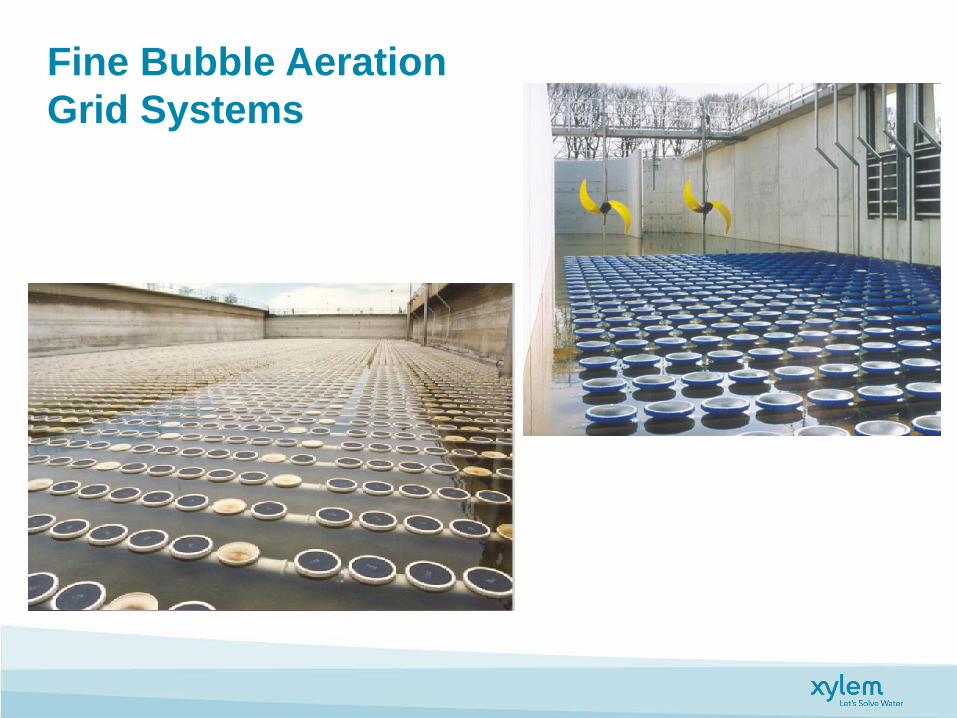
Fine Bubble Aeration Grid Systems
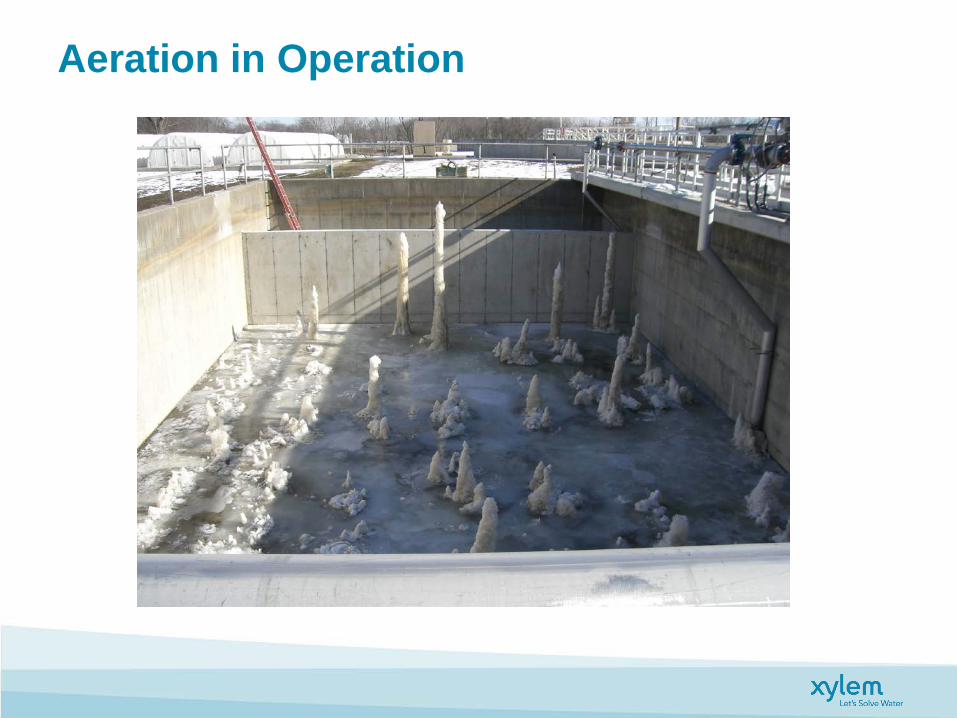
Aeration in Operation
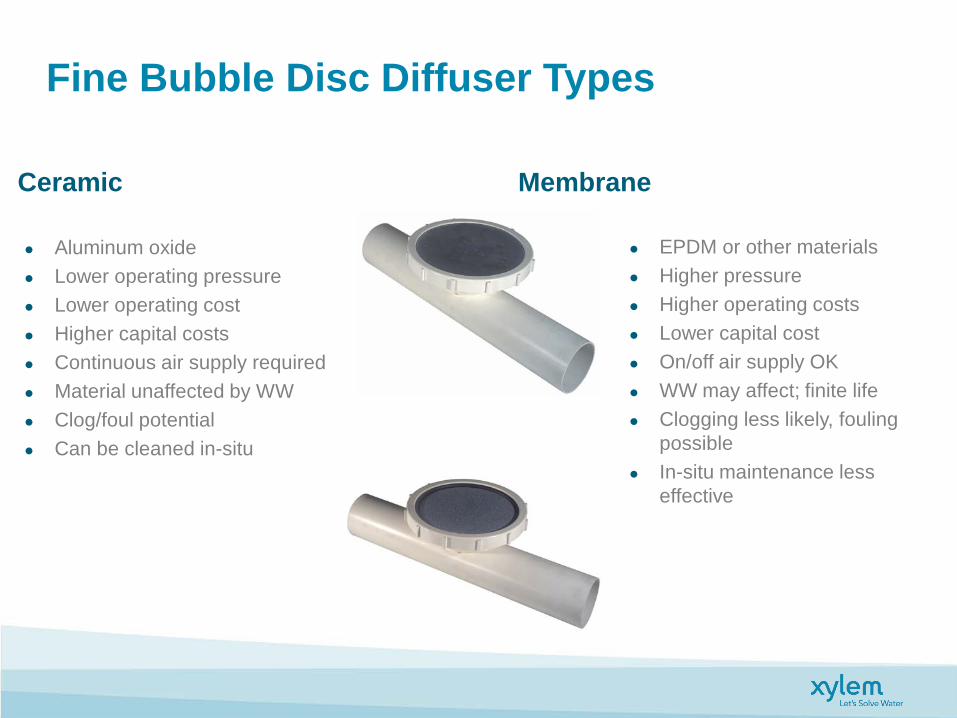
Fine Bubble Disc Diffuser Types
Ceramic Membrane
Aluminum oxide Lower operating pressure Lower operating cost Higher capital costs Continuous air supply required Material unaffected by WW Clog/foul potential Can be cleaned in-situ
EPDM or other materials Higher pressure Higher operating costs Lower capital cost On/off air supply OK WW may affect; finite life Clogging less likely, fouling
possible In-situ maintenance less
effective
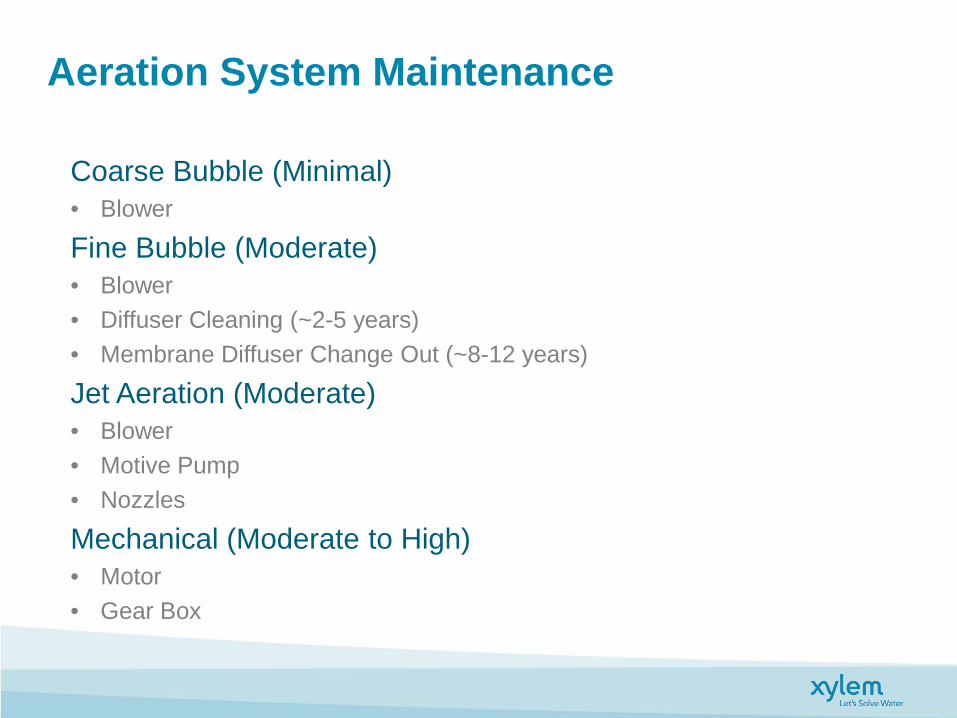
Coarse Bubble (Minimal) • Blower
Fine Bubble (Moderate) • Blower • Diffuser Cleaning (~2-5 years) • Membrane Diffuser Change Out (~8-12 years)
Jet Aeration (Moderate) • Blower • Motive Pump • Nozzles
Mechanical (Moderate to High) • Motor • Gear Box
Aeration System Maintenance
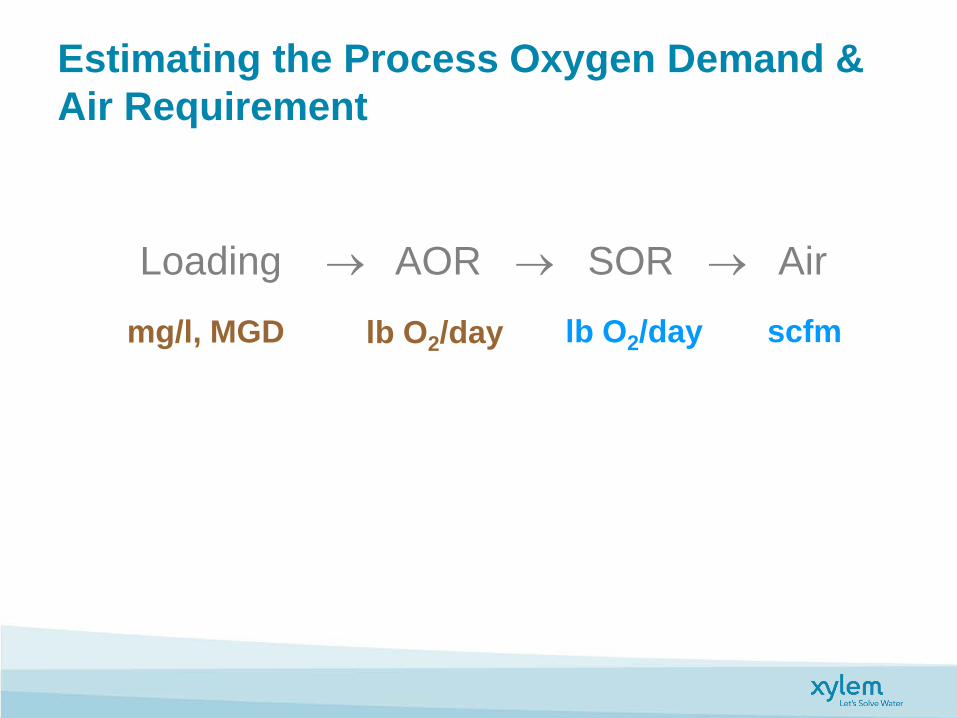
Estimating the Process Oxygen Demand & Air Requirement
Loading → AOR → SOR → Air
mg/l, MGD lb O2/day lb O2/day scfm
Actual Oxygen Requirement (AOR – lbs/day)
29
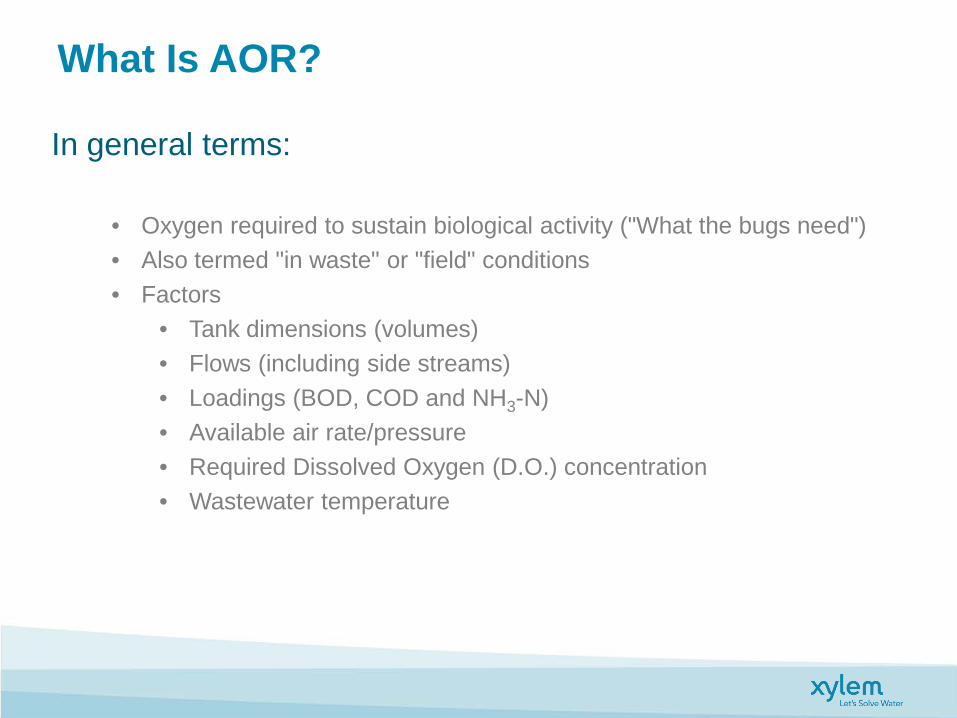
What Is AOR?
• Oxygen required to sustain biological activity ("What the bugs need") • Also termed "in waste" or "field" conditions • Factors
• Tank dimensions (volumes) • Flows (including side streams) • Loadings (BOD, COD and NH3-N) • Available air rate/pressure • Required Dissolved Oxygen (D.O.) concentration • Wastewater temperature
In general terms:
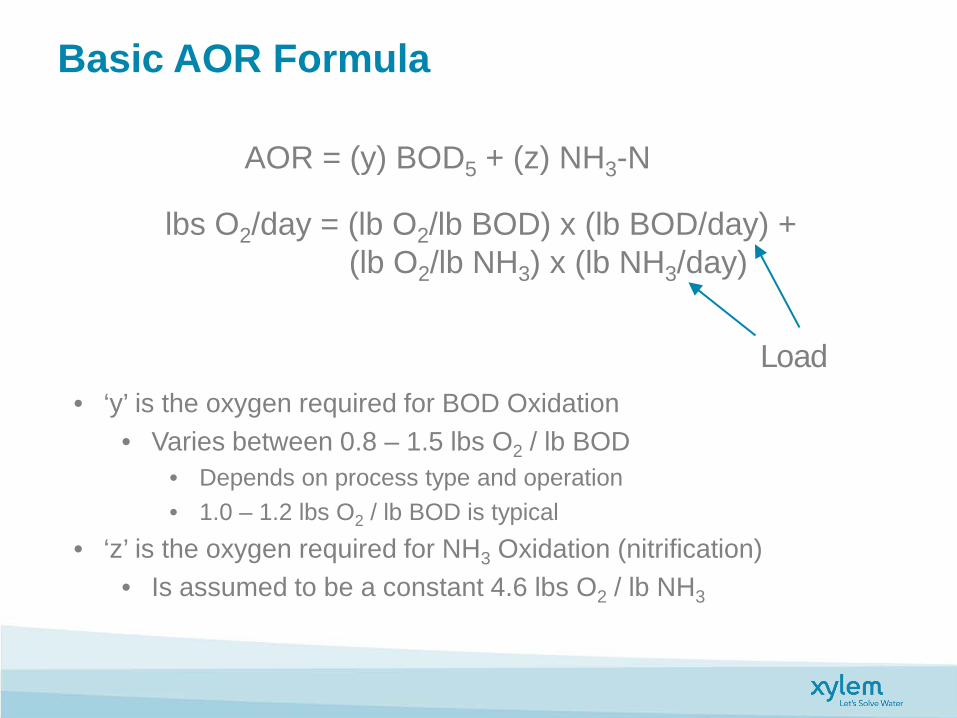
Basic AOR Formula
AOR = (y) BOD5 + (z) NH3-N
lbs O2/day = (lb O2/lb BOD) x (lb BOD/day) + (lb O2/lb NH3) x (lb NH3/day)
Load • ‘y’ is the oxygen required for BOD Oxidation
• Varies between 0.8 – 1.5 lbs O2 / lb BOD • Depends on process type and operation • 1.0 – 1.2 lbs O2 / lb BOD is typical
• ‘z’ is the oxygen required for NH3 Oxidation (nitrification) • Is assumed to be a constant 4.6 lbs O2 / lb NH3
Standard Oxygen Requirement (SOR – lbs/day)
32
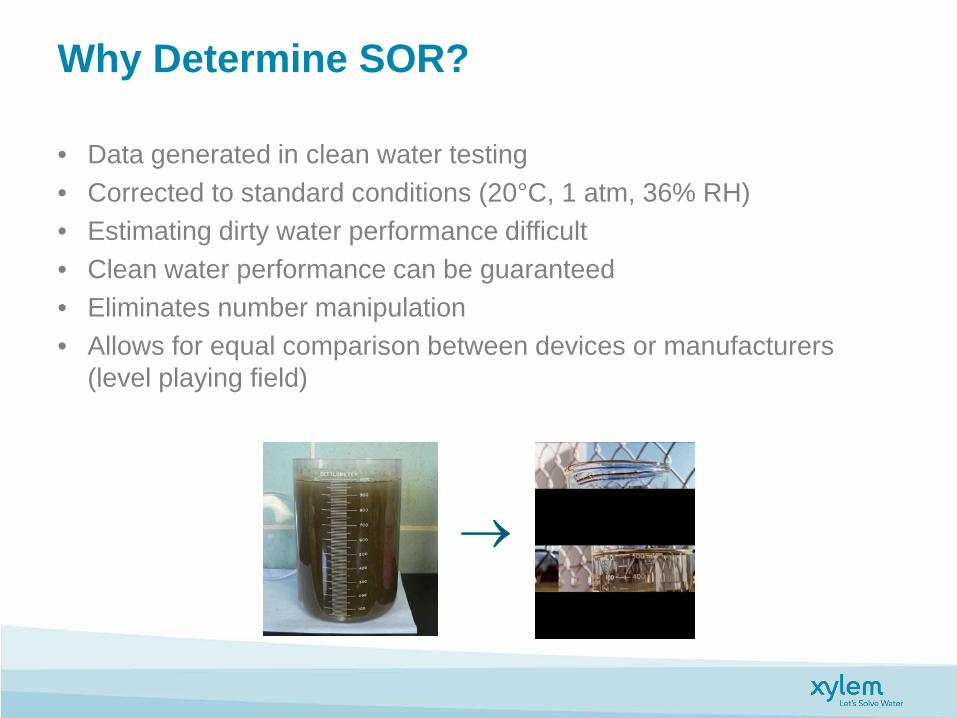
Why Determine SOR?
• Data generated in clean water testing • Corrected to standard conditions (20°C, 1 atm, 36% RH) • Estimating dirty water performance difficult • Clean water performance can be guaranteed • Eliminates number manipulation • Allows for equal comparison between devices or manufacturers
(level playing field)
→
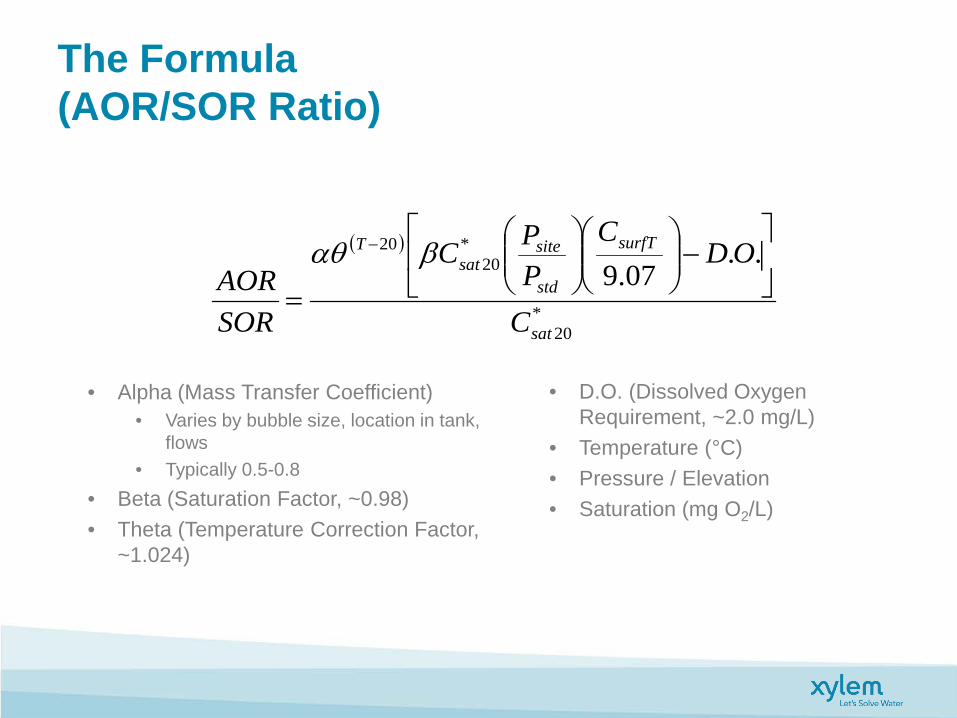
The Formula (AOR/SOR Ratio)
• Alpha (Mass Transfer Coefficient) • Varies by bubble size, location in tank,
flows • Typically 0.5-0.8
• Beta (Saturation Factor, ~0.98) • Theta (Temperature Correction Factor,
~1.024)
• D.O. (Dissolved Oxygen Requirement, ~2.0 mg/L)
• Temperature (°C) • Pressure / Elevation • Saturation (mg O2/L)
( )
*20
*20
20 ..07.9
sat
surfT
std
sitesat
T
C
ODC
PPC
SORAOR
−
=
− βαθ
Air Requirement (scfm)
35
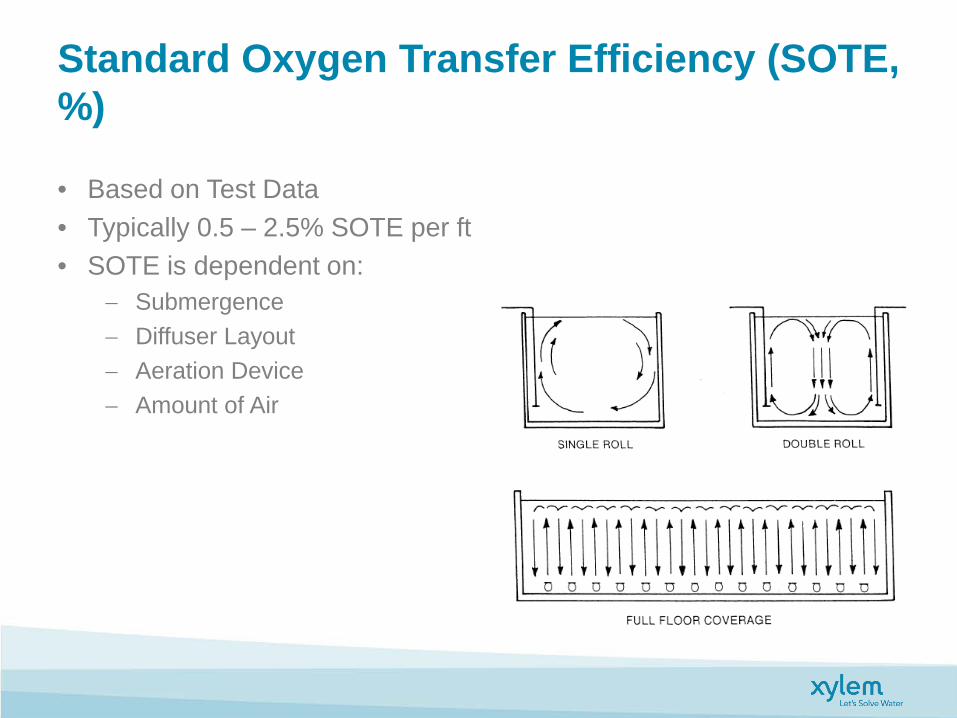
Standard Oxygen Transfer Efficiency (SOTE, %)
• Based on Test Data • Typically 0.5 – 2.5% SOTE per ft • SOTE is dependent on:
− Submergence − Diffuser Layout − Aeration Device − Amount of Air
The Triangle of Aeration
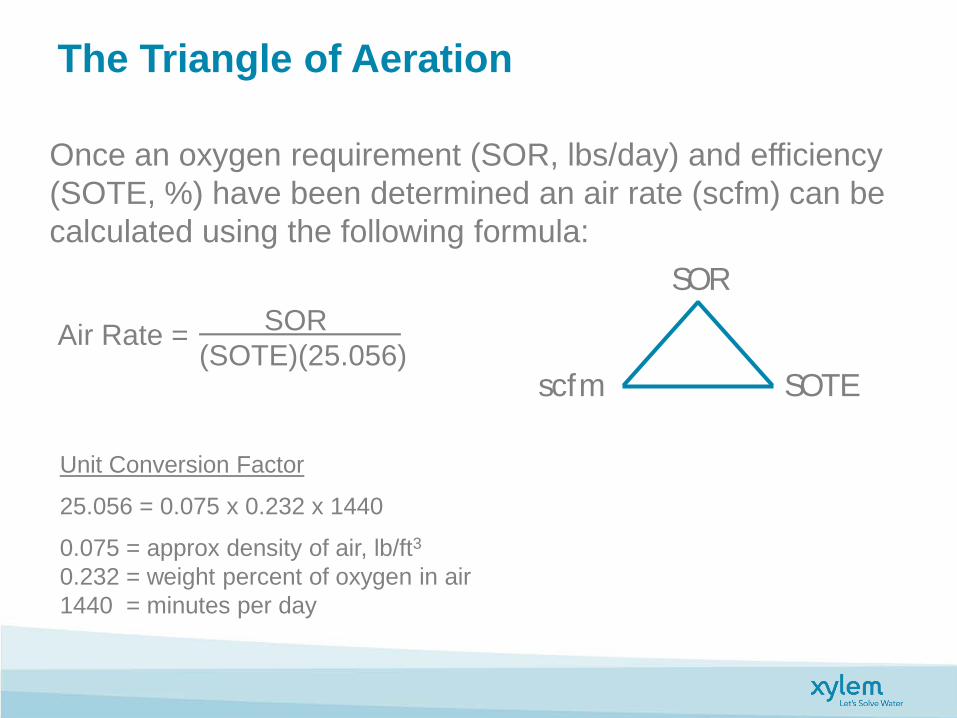
Once an oxygen requirement (SOR, lbs/day) and efficiency (SOTE, %) have been determined an air rate (scfm) can be calculated using the following formula:
Unit Conversion Factor
25.056 = 0.075 x 0.232 x 1440
0.075 = approx density of air, lb/ft3
0.232 = weight percent of oxygen in air 1440 = minutes per day
SOR . (SOTE)(25.056)
Air Rate =
scfm
SOR
SOTE
Oxygen Transfer Testing
38

Clean Water Oxygen Transfer Testing
• Conducted per ASCE standards • Method of verifying specified
SOTE performance for a given configurations
• Uses same diffuser density, SWD, submergence, and diffuser air rate as full scale installation
• De-oxygenate water with sodium sulfite then aerate and measure rate of D.O. rise
Mixing Air (scfm / ft² or scfm / kcf)
40
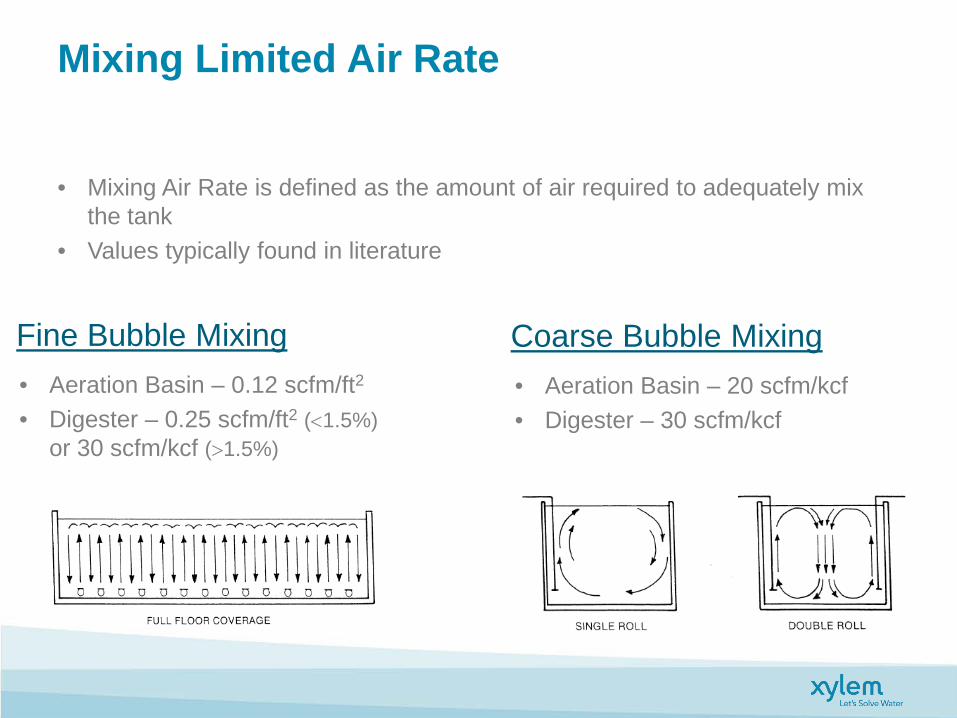
Mixing Limited Air Rate
• Mixing Air Rate is defined as the amount of air required to adequately mix the tank
• Values typically found in literature
Fine Bubble Mixing Coarse Bubble Mixing • Aeration Basin – 0.12 scfm/ft2
• Digester – 0.25 scfm/ft2 (<1.5%) or 30 scfm/kcf (>1.5%)
• Aeration Basin – 20 scfm/kcf
• Digester – 30 scfm/kcf
Conclusion
• Aeration is used to deliver oxygen and mix the content of the tanks
• Fine bubble full floor coverage is the most efficient at transferring oxygen
• Experience and layout affect aeration system performance
Questions
43