aeroacoustic analysis using natural helmholtz–hodge … · d. haufe et al.: aeroacoustic analysis...
TRANSCRIPT

J. Sens. Sens. Syst., 7, 113–122, 2018https://doi.org/10.5194/jsss-7-113-2018© Author(s) 2018. This work is distributed underthe Creative Commons Attribution 3.0 License.
Aeroacoustic analysis using natural Helmholtz–Hodgedecomposition
Daniel Haufe1, Johannes Gürtler1, Anita Schulz2, Friedrich Bake2, Lars Enghardt2,3, andJürgen Czarske1
1Laboratory for Measurement and Sensor System Techniques, Department of Electrical Engineering andInformation Technology, TU Dresden, Helmholtzstr. 18, 01069 Dresden, Germany
2Institute of Propulsion Technology, German Aerospace Center (DLR), 10623 Berlin, Germany3Institute of Fluid Dynamics and Technical Acoustics, TU Berlin, 10623 Berlin, Germany
Correspondence: Johannes Gürtler ([email protected])
Received: 22 May 2017 – Revised: 27 November 2017 – Accepted: 23 January 2018 – Published: 1 March 2018
Abstract. The analysis of aeroacoustic phenomena is crucial for a deeper understanding of the damping mech-anisms of a sound-absorbing bias flow liner (BFL). For this purpose, simultaneous measurements of the soundfield and the flow field in a BFL are required. The fluid velocity can serve as the measurand, where both theacoustic particle velocity and the aerodynamic flow velocity contribute and, thus, can be acquired simultane-ously. However, there is a need to separate these two quantities to distinguish between them. This is challengingbecause they generally coincide with each other in the time domain. Due to the interaction of sound and flowin a BFL, both velocities also overlap in the temporal frequency domain, having a coherent oscillation at theacoustic frequency. For this reason, the recently developed natural Helmholtz–Hodge decomposition (NHHD) isapplied to separate both quantities from the measured oscillation velocity field in the spatial domain. The evalu-ation of synthetic vector field data shows that the quality of the decomposition is enhanced when a smaller gridsize is chosen. The velocity field in a generic BFL, necessarily recorded within a three-dimensional region of in-terest at more than 4000 measurement locations, is evaluated using NHHD. As a result, the measured oscillationvelocity in the BFL is dominated by the flow that is related to vortices and also by irrotational aerodynamic flow.Moreover, indications for an aeroacoustic source near the facing sheet of the liner are revealed.
1 Introduction
In order to improve the efficiency of modern aeroacousticnoise absorbers in aircraft engines, a deeper understanding ofthe underlying damping phenomena is necessary, accordingto Zhao and Li (2015). Therefore, an enhanced knowledgeabout the interaction between flow and sound in noise ab-sorbers has to be obtained. Since the effort of a direct numer-ical simulation is too excessive, simultaneous measurementsof the flow field and the sound field are needed as a prerequi-site for an aeroacoustic analysis. The choice of optical mea-surement methods is advantageous, since these methods areusually contactless and, thus, do not alter the measured field.The measurement of the fluid velocity is beneficial concern-ing the simultaneous acquisition of both the (aerodynamic)flow velocity and the acoustic particle velocity, since both
are included in the measurand. However, the separation ofboth quantities is impossible in the time domain because bothcoincide with each other at the velocity signal in the tempo-ral domain. A separation in the temporal frequency domainis also challenging, since the flow velocity also oscillates atacoustic frequencies. Such an oscillation occurs due to an in-teraction of the flow and the sound wave. As an example,this interaction is analyzed in a bias flow liner in this paper.A bias flow liner is a perforated acoustic liner with an ad-ditional flow through the perforation; see Heuwinkel et al.(2010). Thus, the scientific question arises: can the decom-position of the oscillating fluid velocity field, measured ina bias flow liner, into the flow velocity field and the acousticparticle velocity field, which is impossible in both the time
Published by Copernicus Publications on behalf of the AMA Association for Sensor Technology.

114 D. Haufe et al.: Aeroacoustic analysis using natural Helmholtz–Hodge decomposition
domain and the temporal frequency domain, be performed inthe spatial domain?
Previous separation approaches using the Proper Orthog-onal Decomposition (POD) of the measured velocity field,like in Rupp et al. (2010) and Marx et al. (2010), suffer fromambiguities; i.e., it is unclear whether the resulting modesare related to the flow field or the sound field. Unlike thePOD, the Helmholtz–Hodge decomposition (HHD) providesthe separation between the solenoidal (divergence-free) flowvelocity field and the irrotational (curl-free) acoustic parti-cle velocity field for Mach numbers below 0.3; cf. De Roecket al. (2007). However, the unique calculation HHD relieson the assumption of boundary conditions, which are typ-ically not (exactly) known. To overcome this difficulty, anenhanced method, called natural Helmholtz–Hodge decom-position (NHHD) from Bhatia et al. (2014), has been devel-oped recently, where the flow field is separated into inter-nal (known) and external (unknown) components and, thus,no flow-dependent boundary conditions have to been chosen,though they result from the separation. Since the NHHD hasbeen applied neither to experimental data nor in aeroacous-tics at all before, the application of this method is discussedin this paper for the example of measurements in a genericbias flow liner. The paper is structured as follows: first, theNHHD method is explained and its implementation is pre-sented in Sect. 2. Afterwards, the verification of this imple-mentation and the characterization of the NHHD method forthe aeroacoustic application based on synthetic data is per-formed in Sect. 3. Next, the NHHD is applied to separate theacoustic particle velocity and the aerodynamic flow velocityfrom the fluid velocity measured in a bias flow liner. Thisapplication of the NHHD is demonstrated and the analysisresults are discussed in Sect. 4. Finally, the paper is closedwith a conclusion in Sect. 5, including an outlook for futureinvestigations.
2 Method
To split a spatially bounded vector field into its solenoidaland its irrotational part, the conventional HHD has previ-ously been applied in many research fields, including fluidmechanics, by Denaro (2003), Rousseaux et al. (2007), andGalvin et al. (2012). A comprehensive overview of applica-tion fields and a history outline have already been given byBhatia et al. (2013). When using the HHD, however, bound-ary conditions have to be known or at least assumed in orderto ensure a unique solution. This results in calculation errorsif the assumptions for the boundaries are inaccurate or in-correct. Consequently, artifacts in the decomposed velocitydata set will occur for a given measured velocity field withunknown boundary conditions. In contrast, the idea of theNHHD, according to Bhatia et al. (2014), is to distinguishbetween internal and external influences of the vector field,determined by the measured field and resulting from the (un-
known) exterior field, respectively. Thus, the NHHD methodeliminates the need for flow-dependent boundary conditionsto uniquely decompose the measured field. This decomposi-tion of a given vector field is termed natural, since the com-plete information that is necessary is contained in the givenvector data itself. Hence, further knowledge about the exte-rior field is not required, nor do any (potentially invalid) as-sumptions about the boundary conditions have to be made.One minor drawback for the application of the NHHD is thatorthogonality of the decomposed fields cannot be guaranteed(in contrast to the conventional HHD using boundary condi-tions), which may provoke higher errors in numerical simula-tions; however, orthogonality is not required for the analysisof data, in accordance with Bhatia et al. (2014).
In the following paragraphs, the theoretical aspects of theNHHD from Bhatia et al. (2014) and its implementation de-tails used for the subsequent Sects. 3 and 4 are briefly intro-duced.
2.1 Theory
According to the ideas of Helmholtz (1858), every spatiallyunbounded, simply connected vector field V :Rn −→Rnfor n= 2,3 that vanishes at infinity can be decomposed intoa sum of an irrotational divergent term
d =∇D with ∇ × d = 0, (1)
related to the scalar potential D, and a solenoidal rotationalterm
r = J∇R in R2 with ∇ · r = 0,
r =∇ ×R in R3 with ∇ · r = 0, (2)
where
J =
(cosθ −sinθsinθ cosθ
)with θ =
π
2(3)
is the π/2-rotation operator, R is a scalar potential, and R
a vector potential. As a consequence, the divergence and curlof the vector field V in a convex domain are completely rep-resented by the divergence of d and curl of r , i.e.,
∇ · d =∇2D =∇ ·V in Rn (4)
and
∇ × r =∇ · (−J r)=∇2R =∇ ×V in R2,
∇ × r =−∇2R =∇ ×V in R3, (5)
where ∇2 is the (scalar) Laplacian (if R2) or the vec-tor Laplacian (if R3). If a spatially bounded vector fieldv(s) :�−→Rn for n= 2,3 and the convex spatial domain�⊂Rn is considered such that V (s)= v(s) for all positionvectors s ∈�, a harmonic term
h= v− d − r with ∇ ×h= 0 and ∇ ·h= 0 (6)
J. Sens. Sens. Syst., 7, 113–122, 2018 www.j-sens-sens-syst.net/7/113/2018/
D. Haufe et al.: Aeroacoustic analysis using natural Helmholtz–Hodge decomposition 115
may remain that is both irrotational and solenoidal, followingBhatia et al. (2014).
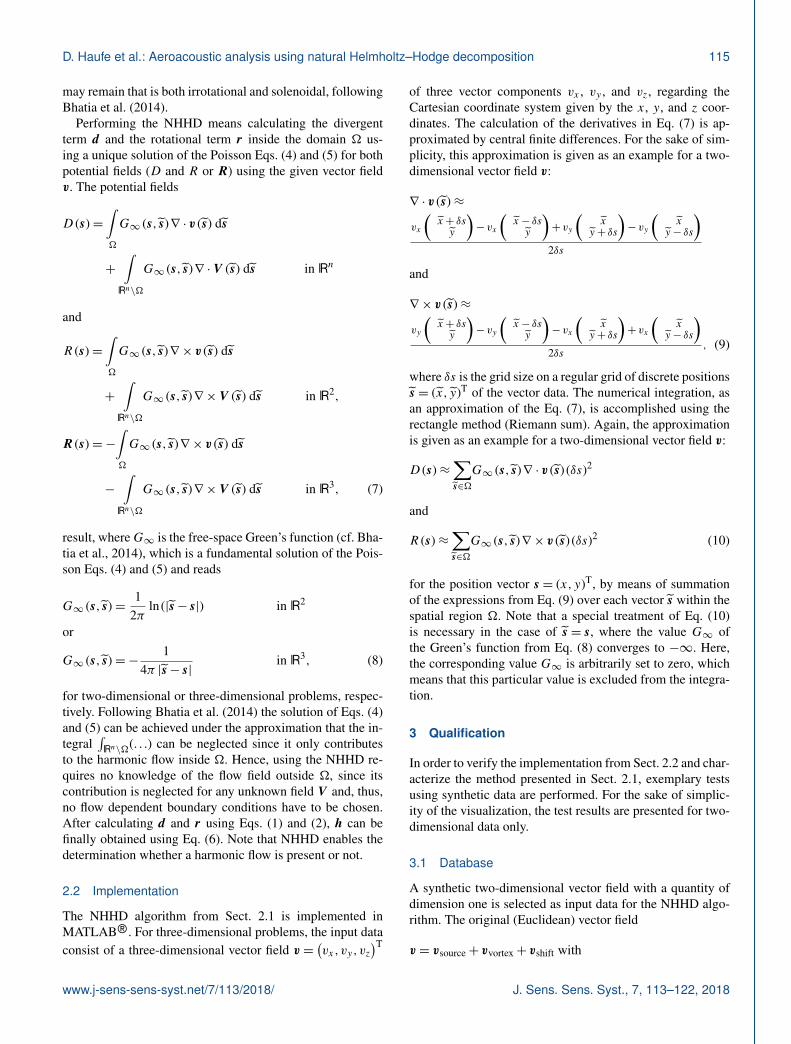
Performing the NHHD means calculating the divergentterm d and the rotational term r inside the domain � us-ing a unique solution of the Poisson Eqs. (4) and (5) for bothpotential fields (D and R or R) using the given vector fieldv. The potential fields
D (s)=∫�
G∞ (s, s)∇ · v (s) ds
+
∫Rn\�
G∞ (s, s)∇ ·V (s) ds in Rn
and
R (s)=∫�
G∞ (s, s)∇ × v (s) ds
+
∫Rn\�
G∞ (s, s)∇ ×V (s) ds in R2,
R (s)=−∫�
G∞ (s, s)∇ × v (s) ds
−
∫Rn\�
G∞ (s, s)∇ ×V (s) ds in R3, (7)
result, whereG∞ is the free-space Green’s function (cf. Bha-tia et al., 2014), which is a fundamental solution of the Pois-son Eqs. (4) and (5) and reads
G∞ (s, s)=1
2πln (|s− s|) in R2
or
G∞ (s, s)=−1
4π |s− s|in R3, (8)
for two-dimensional or three-dimensional problems, respec-tively. Following Bhatia et al. (2014) the solution of Eqs. (4)and (5) can be achieved under the approximation that the in-tegral
∫Rn\�(. . .) can be neglected since it only contributes
to the harmonic flow inside �. Hence, using the NHHD re-quires no knowledge of the flow field outside �, since itscontribution is neglected for any unknown field V and, thus,no flow dependent boundary conditions have to be chosen.After calculating d and r using Eqs. (1) and (2), h can befinally obtained using Eq. (6). Note that NHHD enables thedetermination whether a harmonic flow is present or not.
2.2 Implementation
The NHHD algorithm from Sect. 2.1 is implemented inMATLABr. For three-dimensional problems, the input dataconsist of a three-dimensional vector field v =
(vx,vy,vz
)T
of three vector components vx , vy , and vz, regarding theCartesian coordinate system given by the x, y, and z coor-dinates. The calculation of the derivatives in Eq. (7) is ap-proximated by central finite differences. For the sake of sim-plicity, this approximation is given as an example for a two-dimensional vector field v:
∇ · v (s)≈
vx
(x+ δsy
)− vx
(x− δsy
)+ vy
(x
y+ δs
)− vy
(x
y− δs
)2δs
and
∇ × v (s)≈
vy
(x+ δsy
)− vy
(x− δsy
)− vx
(x
y+ δs
)+ vx
(x
y− δs
)2δs
, (9)
where δs is the grid size on a regular grid of discrete positionss = (x, y)T of the vector data. The numerical integration, asan approximation of the Eq. (7), is accomplished using therectangle method (Riemann sum). Again, the approximationis given as an example for a two-dimensional vector field v:
D (s)≈∑s∈�
G∞ (s, s)∇ · v (s) (δs)2
and
R (s)≈∑s∈�
G∞ (s, s)∇ × v (s) (δs)2 (10)
for the position vector s = (x,y)T, by means of summationof the expressions from Eq. (9) over each vector s within thespatial region �. Note that a special treatment of Eq. (10)is necessary in the case of s = s, where the value G∞ ofthe Green’s function from Eq. (8) converges to −∞. Here,the corresponding value G∞ is arbitrarily set to zero, whichmeans that this particular value is excluded from the integra-tion.
3 Qualification
In order to verify the implementation from Sect. 2.2 and char-acterize the method presented in Sect. 2.1, exemplary testsusing synthetic data are performed. For the sake of simplic-ity of the visualization, the test results are presented for two-dimensional data only.
3.1 Database
A synthetic two-dimensional vector field with a quantity ofdimension one is selected as input data for the NHHD algo-rithm. The original (Euclidean) vector field
v = vsource+ vvortex+ vshift with
www.j-sens-sens-syst.net/7/113/2018/ J. Sens. Sens. Syst., 7, 113–122, 2018

116 D. Haufe et al.: Aeroacoustic analysis using natural Helmholtz–Hodge decomposition
−2
0
2
vsource
y
vvortex vshift
∇ · vsource
y
−2
0
2
∇ · vvortex ∇ · vshift
∇× vsource
x
y
−2 0 2
−2
0
2
∇× vvortex
x−2 0 2
∇× vshift
x−2 0 2
−2 −1.5 −1 −0.5 0 0.5 1 1.5 2
(a)
(b)
(c)
Figure 1. Synthetic input vector field terms (a), the correspondingdivergence (b) and curl (c), depicted for field data with a grid sizeof δs = 1/2.
vsource = (x,y)T· exp
[−0.5
(x2+ y2
)],
vvortex = (−y,x)T· exp
[−0.5
(x2+ y2
)], and
vshift = (0.1,0.1) (11)
is a sum of exemplary terms, which are visualized in Fig. 1a,with a grid size of δs = 1/2 regarding the Cartesian coor-dinates x and y. According to the analytic expressions inEq. (11), the source term vsource in Eq. (11) has no curl (i.e.,∇×vsource = 0) and the vortex term vvortex has no divergence(i.e., ∇ · vvortex = 0). Given these fields, the source term isrepresentative of an acoustic field (spherical wave) and thevortex term is representative of a rotational aerodynamic flowfield. The shift term vshift has neither curl nor divergence (i.e.,∇×vshift =∇ ·vshift = 0) and represents an irrotational aero-dynamic flow. Since vshift is solenoidal, it cannot be relatedto the acoustic field because of its compressibility by defi-nition. There are also nontrivial vector fields that have thesame properties as vshift, which are not considered here fur-ther. Note that the exemplary terms were chosen such thattheir divergence or curl has a (preferably representative) in-homogeneous spatial distribution, which was realized by ex-ponential functions in Eq. (11).
For comparison with the output vector field terms in thefollowing subsection, the divergence and curl of the inputvector field terms are calculated numerically using central fi-nite differences; cf. Eq. (9). The resulting divergence and curl
−2
0
2
d
y
r h
∇ · d
y
−2
0
2
∇ · r ∇ · h
0.01
0.1
∇× d
x
y
−2 0 2
−2
0
2
∇× r
x−2 0 2
∇× h
x
0.01
0.1
−2 0 2
−2 −1.5 −1 −0.5 0 0.5 1 1.5 2
(a)
(b)
(c)
Figure 2. Output vector fields (a), as well as the correspondingdivergence (b) and curl (c) using the natural Helmholtz–Hodge de-composition of the synthetic vector field from Eq. (11); cf. Fig. 1for a grid size of δs = 1/2.
are depicted in Fig. 1b and c as well. The numerical result hasslight deviations below 10−2 from the analytic result due tothe discretization of the vector field terms and the approxi-mation in Eq. (9). Note that the original field from Eq. (11) isfree from noise terms, which can, however, be easily includedin the synthetic data. As a consequence, the noise will beindependently decomposed into irrotational, solenoidal, andharmonic terms due to the linearity of the NHHD. However,the focus of this paper is an initial quantitative characteriza-tion of the NHHD in the first place.
3.2 Characterization
Using its implementation according to Sect. 2.2, the NHHDalgorithm is applied to the input data base v from Eq. (11);see Sect. 3.1. Assuming an ideal decomposition followingSect. 2.1, the resulting output vector fields consequently read
d = vsource,
r = vvortex, andh= vshift. (12)
The actual result of the NHHD is depicted in Fig. 2 for fielddata of d,r , and h with a grid size of δs = 1/2, as well asthe corresponding divergence and curl. In the resulting out-put field, there are no vector data at the outermost positions
J. Sens. Sens. Syst., 7, 113–122, 2018 www.j-sens-sens-syst.net/7/113/2018/

D. Haufe et al.: Aeroacoustic analysis using natural Helmholtz–Hodge decomposition 117
10−1
100
−60
−50
−40
−30
−20
Grid size δs
Cro
ssta
lk[d
B]
Crosstalk ∇·hCrosstalk ∇×h
Figure 3. Resulting crosstalk, according to Eq. (13) as a qualityfactor of the natural Helmholtz–Hodge decomposition, when ap-plied to the synthetic input vector field from Eq. (11) for severalgrid sizes δs of the vector field.
due to the double use of central finite differences for the ap-proximation of the derivatives both in Eqs. (1)–(6) and inEq. (7). Notwithstanding, according to Eq. (12), Fig. 2 shouldbe identical to Fig. 1 in the case of an ideal decomposition. Infact, there are (minor) deviations from the expectation; e.g.,in particular, the term h does not completely agree with theinput vector field term vshift from Eq. (12). In addition, bothdivergence and curl of h are not exactly zero, which is con-trary to the characteristic properties defined in Eq. (6). Sincethese deviations were not discussed before by Bhatia et al.(2014), they are investigated in the following. In order tocharacterize these deviations, the term crosstalk is used inthe following as a figure of merit. Typically, the crosstalk isdefined as the squared ratio of the root mean square of theundesired signal to the root mean square of another adjacentsignal. Following that,
crosstalk∇·h =
∑s∈�
|∇ ·h (s)|2∑s∈�
|∇ · v (s)|2and
crosstalk∇×h =
∑s∈�
|∇×h (s)|2∑s∈�
|∇× v (s)|2(13)
are defined regarding the parasitic divergence and curl of theharmonic signal h relating to the divergence and the curl ofthe input vector field v, respectively, within the complete setof the region �.
The crosstalk from Eq. (13) in Fig. 2 is investigated forseveral grid sizes δs of the vector field; cf. Figure 3. In Fig. 2,crosstalk∇·h and crosstalk∇×h are identical for the exemplaryterms chosen here. A smaller grid size obviously leads toa lower crosstalk; a decrease of up to 30 dB per decade canbe achieved. This behavior can be explained by the fact thatcomputational errors of the spatial derivatives in Eqs. (1)–(7)that are approximated by Eq. (9) using finite difference quo-
tients increase when the grid size is enlarged. Although notbeing investigated further, a qualitatively similar observationis expected for three-dimensional problems as well.
4 Application
In order to obtain experimental data for the aeroacousticanalysis, an optical measurement of the velocity vector fieldin a generic bias flow liner is performed using frequency-modulated Doppler global velocimetry (FM-DGV) fromHaufe et al. (2013). In contrast to previous measurementsby Haufe et al. (2013), here, a set of three-dimensional ve-locity vector data is gathered in order to apply the NHHD,since a three-dimensional problem is expected for the vectorfield in the bias flow liner. For the experiments, FM-DGVoffers a high dynamic range of more than 3 orders of mag-nitude; see Haufe et al. (2013). Moreover, the velocity un-certainty is nearly identical for all vector components (seeSect. 4.1.2), which is in contrast to other optical methodslike stereoscopic particle image velocimetry. Apart from that,any other measurement method providing volumetric veloc-ity vector data can be considered for the evaluation usingNHHD. In any case, time-resolved or phase-resolved veloc-ity data (when the region of interest is successively scanned,like here) are necessary since time-averaged values do notcontain any acoustic information.
4.1 Experimental setup
4.1.1 Aeroacoustics
The aeroacoustic experiment in a generic bias flow liner isconducted in Berlin at the “Duct acoustic test rig with rect-angular cross section” (DUCT-R), which is about 3 m long.The DUCT-R has anechoic terminations at both ends andhas a cross section of 60mm× 80mm (inner dimensions).Flow and sound are generated under ambient conditions bya radial compressor and a Monacor speaker KU-516, re-spectively. The mean flow velocity is set to approximately34 ms−1 (corresponding to Mach 0.1 and a mean mass flowrate of about 700 kgh−1) with a turbulence intensity of about7 %. The sound pressure level of the incident acoustic waveis about 118 dB for the sinusoidal excitation at a frequencyof 1122 Hz, where the liner exhibits its maximum dissipationcoefficient of about 60 %, according to a previous study onthe same liner by Schulz et al. (2015).
The design of the bias flow liner is based on previouswork by Heuwinkel et al. (2010); see Fig. 4. The perforationis composed of a 1 mm thick facing sheet with 53 circularorifices, each with a diameter of 2.5 mm and a distance of8.5 mm. The only difference of this liner to the one investi-gated by Heuwinkel et al. (2010) is that the cross section isrectangular in order to match with DUCT-R. The cavity isa cuboid with a size of 60mm× 49mm× 72mm (in the di-rection of x, y, and z). A bias flow with a mass flow rate of
www.j-sens-sens-syst.net/7/113/2018/ J. Sens. Sens. Syst., 7, 113–122, 2018

118 D. Haufe et al.: Aeroacoustic analysis using natural Helmholtz–Hodge decomposition
8.5 mm
2.5 mm
Cavity (underneath)
Glass windows
Flow
Sound
1 cm 3 regionof interesty
xz
Figure 4. Top view of the setup of the aeroacoustic measurement in a generic bias flow liner with optical access through glass windows; thepoint of origin is at the center of the central orifice.
(a) Axial position x [mm]
Line
rdis
tanc
ey
[mm
] |v| [m s ]
−2 0 2 4 6
0
5
10
0
0.5
1
(b) Axial position x [mm]
Line
rdis
tanc
ey
[mm
] ∇ · v [1 s ]
−2 0 2 4 6
0
5
10
−1
0
1
(c) Axial position x [mm]
Line
rdis
tanc
ey
[mm
] |∇ × v| [1 s ]
−2 0 2 4 6
0
5
10
0
1
2
-1 -1 -1
Figure 5. (a) Measured input vector field, i.e., phase-averaged oscillation velocity v, (b) its divergence ∇ ·v, and (c) curl ∇×v for a selectedphase ϕ = 2π at the lateral position z= 0 (see Fig. 4); vectorial quantities are depicted regarding their l2 norm.
5 kgh−1 is fed into the cavity. This value corresponds to anestimated bias flow velocity, according to Heuwinkel et al.(2010), of about 7 ms−1 at vena contracta, where an equaldistribution of the mass flow through the orifices and an em-pirically found jet contraction factor of 0.61 is assumed. Theresulting Reynolds number of the bias flow is about 103, as-suming dry air at 20 ◦C and the diameter of the orifice as thecharacteristic length.
4.1.2 Metrology
The velocity data are measured by FM-DGV at eightlocations in parallel, linearly arranged in y direction, asdescribed in detail by Haufe et al. (2013). For this purpose,tracer particles made of diethylhexyl sebacate with a diame-ter of about 1 µm and a response time of 3,4 µs (see Albrechtet al. (2003, p. 606)), corresponding to a slippage of less than0.1 % at 1122 Hz, are added to the fluid. A measurementfrequency of 100 kHz is chosen, which is a typical choicefor the FM-DGV system and (more than) sufficiently largeto resolve the acoustic frequency, regarding the samplingtheorem. In order to achieve a volumetric acquisition,successive linear traversing in the direction of x, y, and zis used for 16, 2, and 16 positions. This results in a largenumber of 163
= 4096 locations on a regular grid; the spatialresolution is about 0.6 mm in each direction x, y, and z. Theminimal distance to the perforation was at y ≈ 0.8 mm. Thechosen region of interest is a cube with a volume of 1 cm3 inthe vicinity of the central orifice, where the optical access is
provided through glass windows. The laser light enters theregion of interest along the incidence vector i = (0,−1,0)T,is scattered by the tracer particles, and is finally observed inthree different directions, along the observation vectors o1 =
(sin[35◦],0,cos[35◦])T, o2 = (−sin[35◦],0,−cos[35◦])T
and o3 = (sin[35◦],0,−cos[35◦])T, which gives three (non-Cartesian) velocity components vo1−i , vo2−i , and vo3−i , eachalong the vectors o1− i, o2− i, and o3− i, respectively.The Cartesian velocity vector v = (vx,vy,vz)T is eventuallyobtained by a coordinate transform, according to Schlüßleret al. (2015). Following Schlüßler et al. (2015), the standarduncertainty of vx , vy , and vz can be calculated by Gaus-sian uncertainty propagation. The resulting uncertaintiesread 1.74σ , 1.00σ , and 1.22σ , respectively, assuming anequal uncertainty σ for each of the originally measured(non-Cartesian) velocity components. As a consequence, theuncertainty of all Cartesian velocity components vx , vy , andvz is almost identical in this FM-DGV measurement.
4.2 Results and discussion
The NHHD is applied to the three-dimensional vector fieldof the measured fluid velocity in order to separate the acous-tic particle velocity and the aerodynamic flow velocity. Here,this is only done for the oscillation velocity at the acousticexcitation frequency fosc, as an example. For this purpose,the time-dependent velocity signal is evaluated regarding thephase ϕ with respect to fosc and yields a zero-mean phase-averaged oscillation velocity, like in Haufe et al. (2013). In
J. Sens. Sens. Syst., 7, 113–122, 2018 www.j-sens-sens-syst.net/7/113/2018/

D. Haufe et al.: Aeroacoustic analysis using natural Helmholtz–Hodge decomposition 119
0
5
10
Line
rdis
tanc
ey
[mm
] |d| [m s ]
0
0.2
0.4
|r| [m s ]
0
0.2
0.4
|h| [m s ]
0
0.2
0.4
0
5
10
Line
rdis
tanc
ey
[mm
] ∇ · d [1 s ]
−1
0
1
∇ · r [1 s ]
−1
0
1
∇ · h [1 s ]
−1
0
1
−2 0 2 4 6
0
5
10
Axial position x [mm]
Line
rdis
tanc
ey
[mm
] |∇ × d| [1 s ]
0
1
2
−2 0 2 4 6
Axial position x [mm]
|∇ × r| [1 s ]
0
1
2
−2 0 2 4 6
Axial position x [mm]
|∇ × h| [1 s ]
0
1
2
-1 -1 -1
-1 -1 -1
-1 -1 -1
Figure 6. Output vector fields (l2 norm) at the lateral position z= 0, when applying the natural Helmholtz–Hodge decomposition onthe measured phase-averaged oscillation velocity v for a selected phase ϕ = 2π from Fig. 5a as input vector field, using a grid size ofδs ≈ 0.04 mm.
order to reduce computational errors due to discretizationof the spatial derivatives from Eqs. (1)–(7) according to theEq. (9) and the resulting crosstalk (see Fig. 3), an interpola-tion of the vector data on a finer grid size (with an interpo-lation factor N = 16) using cubic splines was performed be-forehand. As a result, the spatial resolution of initially about600 µm turns into a grid size of approximately 40 µm. As a re-sult, the crosstalk is decreased, like observed in Sect. 3.2 (al-though no measurement information is obtained by applyingthe interpolation).
The phase-averaged oscillation velocity vector field, de-noted by v in the following, as well as the correspondingdivergence and the curl of the vector field, are depicted inFig. 5, as an example for the plane at z= 0. Regardingrandom deviations, the standard uncertainty of v is about20 mms−1 for a measurement duration of 5 s, where a phaseresolution of π/8 is used for phase-averaging (i.e., 500,000velocity samples are averaged), similar to Haufe et al. (2013).According to Haufe et al. (2014), the phase-averaging acts asa band pass filter, suppressing random velocity terms like theturbulence and measurement noise with a spectral width of1/T , where T is the measurement duration. Note that thechoice of the phase resolution results from a compromise
between short temporal resolution and low velocity uncer-tainty. In order to further decrease the velocity uncertainty,T may be increased, as proposed by Haufe et al. (2013). Ac-cording to Fig. 5a, there is a high oscillation velocity in thevicinity of the orifice, which coincides with previous obser-vations by Heuwinkel et al. (2010). The magnitude of thedivergence of the oscillation velocity is low compared to itscurl; see Fig. 5b and c. Hence, a high vorticity is present,which also agrees well with existing results from Heuwinkelet al. (2010) using a comparable liner (though with circularcross section). There are some domains of high oscillationvelocity in Fig. 5a which remain stationary above the orificeand downstream at about x = (2. . .4) mm. In these places,sources and sinks can be found (see Fig. 5b), which alternatein time. However, most of the domains of high oscillationvelocity are convected downstream in time, as do the corre-sponding domains of high vorticity in Fig. 5c, which agreeswith previous results in the identical liner from Schulz et al.(2015).
In order to provide further insight, the NHHD is appliedto the measured data following Sect. 2.2. The resulting out-put vector fields are depicted in Fig. 6, again as an exam-ple for the plane at z= 0. In the irrotational term d, a struc-
www.j-sens-sens-syst.net/7/113/2018/ J. Sens. Sens. Syst., 7, 113–122, 2018

120 D. Haufe et al.: Aeroacoustic analysis using natural Helmholtz–Hodge decomposition
0
5
10
Line
rdis
tanc
ey
[mm
] |d|RMS [m s ]
0
0.2
0.4
|r|RMS [m s ]
0
0.2
0.4
|h|RMS [m s ]
0
0.2
0.4
0
5
10
Line
rdis
tanc
ey
[mm
] |∇ · d|RMS [1 s ]
0
0.5
1
|∇ · r|RMS [1 s ]
0
0.5
1
|∇ · h|RMS [1 s ]
0
0.5
1
−2 0 2 4 6
0
5
10
Axial position x [mm]
Line
rdis
tanc
ey
[mm
] |∇ × d|RMS [1 s ]
0
1
2
−2 0 2 4 6
Axial position x [mm]
|∇ × r|RMS [1 s ]
0
1
2
−2 0 2 4 6
Axial position x [mm]
|∇ × h|RMS [1 s ]
0
1
2
-1 -1 -1
-1 -1 -1
-1 -1 -1
Figure 7. Root mean square (rms) of the output vector fields (l2 norm) from Fig. 6 at the lateral position z= 0 using all phase values ϕregarding the acoustic excitation frequency.
ture like a breathing sphere is identified near the orifice atx = 2 mm, which coincides with the stationary domains ofhigh oscillation velocity seen in Fig. 5a. In the solenoidalterm r there are structures that move downstream, which co-incides with the convecting domains of high oscillation ve-locity from Fig. 5a. In addition, a pulsating structure occurswithin the harmonic term h, which could not be determinedin Fig. 5, but is discovered using the NHHD. According tothe theory of the NHHD, the divergence and curl of v are ap-proximately equivalent to the divergence and the curl of theirrotational term d and the solenoidal term r , respectively.For the final discussion, the root mean square (rms) fieldsof the values are visualized in Fig. 7 using all phase val-ues regarding the acoustic excitation frequency. Accordingto Figs. 6 and 7, three scientific findings are obtained.
1. The irrotational term d , which is equivalent to theacoustic particle velocity, amounts up to 0.13 ms−1
(rms) in the vicinity of the central orifice at (x,y)≈(2mm,1mm). For comparison, the rms of the acous-tic particle velocity of the incident wave would be onlyabout 0.04 m s−1, assuming plane waves and the char-acteristic impedance of air; see Rossing (2007, p. 60f.).Consequently, the local acoustic particle velocity at the
orifice is approximately 3 times higher than from theacoustic excitation. Hence, the hypothesis arises that anacoustic source near the facing sheet is supposed to beinduced by the interaction of sound and flow. Similarobservations have been made, e.g., by Marx et al. (2010)in a liner without bias flow. In contrast, the applicationof the NHHD in the present paper allows the aerody-namic and the acoustic velocity field to be quantitativelydistinguished from each other for the first time.
2. The solenoidal term r , which is associated with the rota-tional flow field, is mostly higher than d and has a max-imum value of 0.31 ms−1 (rms). This proves the gener-ation of flow vortices being induced by the interactionof sound and flow, which agrees well with previous ob-servations, e.g., by Eldredge and Dowling (2003), Ruppet al. (2010), or (with a comparable liner) by Heuwinkelet al. (2010).
3. The harmonic term h, which is associated with the ir-rotational (and solenoidal) flow field, amounts up to0.38 ms−1 (rms) and only approximately exhibits thecharacteristic property ∇×h=∇ ·h= 0 as defined byEq. (6); i.e., the decomposition is not ideal. Like al-ready investigated in Sect. 3.2, this is caused by the dis-
J. Sens. Sens. Syst., 7, 113–122, 2018 www.j-sens-sens-syst.net/7/113/2018/
D. Haufe et al.: Aeroacoustic analysis using natural Helmholtz–Hodge decomposition 121
cretization of the vector field data and can be reducedby choosing a smaller grid size. The crosstalk in Fig. 6according to the Eq. (13) is about −36 and −8 dB re-garding divergence and curl, respectively.
To conclude, the application of the NHHD for aeroacousticanalysis is a promising method in order to obtain a better un-derstanding about the interaction of sound and flow in a biasflow liner. The grid size has to be decreased in the futurein order to decrease the crosstalk, according to Fig. 3. Thiscan be done by utilizing a finer spatial resolution, e.g., us-ing a velocity profile sensor from Haufe et al. (2014) withmicrometer resolution. Alternatively, the interpolation factorcan be increased further. Then, the finer discretization willresult in smaller computational errors, though the physicalinformation will of course not be enhanced. Note that thecomputation time using an interpolation factor of N is in-creased on the order of O(N6) for the complete solution ofthree-dimensional problems as evident here. As an example,the calculation time for generating the results from Fig. 6,at z= 0 only, is about 23 days (for N = 16) using a FujitsuCelsius R920 workstation with an Intel® Xeon® hexa-coreprocessor E5-2620 at 2 GHz.
5 Conclusions
The aim of this work is to perform an aeroacoustic analysis ofan experimentally obtained volumetric velocity vector field,measured in a bias flow liner. For this purpose, the oscilla-tion velocity with respect to the frequency of the sinusoidalacoustic excitation is evaluated using the natural Helmholtz–Hodge decomposition (NHHD). This vector field decompo-sition of the fluid velocity into the irrotational acoustic par-ticle velocity and the solenoidal flow velocity is successfullyapplied on a three-dimensional vector field in a 1 cm3 regionof interest. The phase-averaged oscillation velocity is mea-sured at 163
= 4096 locations in a generic bias flow liner byDoppler global velocimetry with laser frequency modulation.The application of the NHHD was enabled by the first volu-metric measurement in such a liner.
The analysis shows that the flow velocity, which is relatedto vortices, dominates in the fluid velocity field, which coin-cides with previous experimental work by Heuwinkel et al.(2010). Moreover, the application of the NHHD also revealsa prominent irrotational flow velocity. In addition, the hy-pothesis of an aeroacoustic source near the facing sheet ofthe liner was suggested. Thus, the application of the NHHDoffers a promising perspective for the future, especially forthe quantitative investigation of the energy transfer from thesound field to the flow field, as proposed in Schulz et al.(2015).
Furthermore, the influence of the grid size on the qualityof the NHHD is investigated using synthetic data. As a re-sult, the grid size has to be minimized in order to minimize
computational errors. However, this yields a higher compu-tational effort.
In the future, the employment of parallel computing, e.g.,using a graphics processing unit, should be considered tosave calculation time (see Kirk and Hwu (2010)). On theone hand, this facilitates an in-depth characterization of evenmore complex vector fields and a detailed uncertainty analy-sis by statistical means in the future, similar to Ribeiro et al.(2016). On the other hand, an additional calculation of the de-composition of the oscillation velocity regarding overtonesof the excitation frequency to study potentially nonlineardamping phenomena is enabled. The analysis of aeroacous-tic phenomena contributes to an enhanced understanding ofaeroacoustic damping.
Data availability. Due to their large volume (16 TB), the underly-ing data can not be accessed online; however the data are stored onlocal mass storage devices at TU Dresden. Please contact the corre-sponding author regarding any data access.
Competing interests. The authors declare that they have no con-flict of interest.
Acknowledgements. The authors thank the German ResearchFoundation (DFG) for the sponsoring of the projects CZ 55/25-3and EN 797/2-3. Many thanks go to Toptica Photonics for contin-uous support concerning the modulatable, high-power diode laser.Harsh Bhatia from the Lawrence Livermore National Laboratoryis gratefully acknowledged for fruitful discussions. Further thanksare due to Heiko Scholz for supporting the implementation inMATLAB.
Edited by: Rainer TutschReviewed by: two anonymous referees
References
Albrecht, H.-E., Borys, M., Damaschke, N., and Tropea, C.: LaserDoppler and Phase Doppler Measurement Techniques, Springer,Berlin, Heidelberg, New York, https://doi.org/10.1007/978-3-662-05165-8, 2003.
Bhatia, H., Norgard, G., Pascucci, V., and Bremer, P.-T.: TheHelmholtz-hodge decomposition – a survey, IEEE T. Vis.Comput. Gr., 19, 1386, https://doi.org/10.1109/TVCG.2012.316,2013.
Bhatia, H., Pascucci, V., and Bremer, P.-T.: The natu-ral Helmholtz-hodge decomposition for open-boundaryflow analysis, IEEE T. Vis. Comput. Gr., 20, 1566,https://doi.org/10.1109/TVCG.2014.2312012, 2014.
De Roeck, W., Baelmans, M., and Desmet, W.: An aerody-namic/acoustic splitting technique for hybrid CAA applications,in: 13th AIAA/CEAS Aeroacoustics Conference, 2007-3726,21–23 May 2007, Rome, Italy, https://doi.org/10.2514/6.2007-3726, 2007.
www.j-sens-sens-syst.net/7/113/2018/ J. Sens. Sens. Syst., 7, 113–122, 2018

122 D. Haufe et al.: Aeroacoustic analysis using natural Helmholtz–Hodge decomposition
Denaro, F. M.: On the application of the Helmholtz–Hodge de-composition in projection methods for incompressible flows withgeneral boundary conditions, Int. J. Numer. Meth. Fl., 43, 43,https://doi.org/10.1002/fld.598, 2003.
Eldredge, J. D. and Dowling, A. P.: The absorption of axial acousticwaves by a perforated liner with bias flow, J. Fluid Mech., 485,307, https://doi.org/10.1017/S0022112003004518, 2003.
Galvin, K. J., Linke, A., Rebholz, L. G., and Wilson, N. E.:Stabilizing poor mass conservation in incompressible flowproblems with large irrotational forcing and application tothermal convection, Comput. Method. Appl. M., 237, 166,https://doi.org/10.1016/j.cma.2012.05.008, 2012.
Haufe, D., Fischer, A., Czarske, J., Schulz, A., Bake, F., and En-ghardt, L.: Multi-scale measurement of acoustic particle veloc-ity and flow velocity for liner investigations, Exp. Fluids, 54, 1,https://doi.org/10.1007/s00348-013-1569-4, 2013.
Haufe, D., Pietzonka, S., Fischer, A., Schulz, A., Bake, F., Eng-hardt, L., and Czarske, J.: Aeroacoustic near-field measurementswith microscale resolution, Meas. Sci. Technol., 25, 105301-1,https://doi.org/10.1088/0957-0233/25/10/105301, 2014.
Helmholtz, H.: Über Integrale der hydrodynamischen Gleichun-gen, welche den Wirbelbewegungen entsprechen, J. reine angew.Math., 1858, 25, https://doi.org/10.1515/crll.1858.55.25, 1858.
Heuwinkel, C., Fischer, A., Röhle, I., Enghardt, L., Bake, F.,Piot, E., and Micheli, F.: Characterization of a Perforated Linerby Acoustic and Optical Measurements, in: 16th AIAA/CEASAeroacoustics Conference, 2010–3765, Stockholm, Sweden,https://doi.org/10.2514/6.2010-3765, 2010.
Kirk, D. B. and Hwu, W. W.: Programming Massively Parallel Pro-cessors: A Hands-on Approach, Morgan Kaufmann, Burlington,USA, ISBN: 978-0-12-381472-2, 2010.
Marx, D., Aurégan, Y., Bailliet, H., and Valière, J. C.:PIV and LDV evidence of hydrodynamic instability overa liner in a duct with flow, J. Sound Vib., 329, 3798,https://doi.org/10.1016/j.jsv.2010.03.025, 2010.
Ribeiro, P. C., de Campos Velho, H. F., and Lopes, H.:Helmholtz-Hodge decomposition and the analysis of2D vector field ensembles, Comput. Graph., 55, 80,https://doi.org/10.1016/j.cag.2016.01.001, 2016.
Rossing, T. D.: Handbook of acoustics, Springer, New York City,US-NY, https://doi.org/10.1007/978-1-4939-0755-7, 2007.
Rousseaux, G., Seifer, S., Steinberg, V., and Wiebel, A.: On theLamb vector and the hydrodynamic charge, Exp. Fluids, 42, 291,https://doi.org/10.1007/s00348-006-0238-2, 2007.
Rupp, J., Carrotte, J., and Spencer, A.: Interaction Between theAcoustic Pressure Fluctuations and the Unsteady Flow FieldThrough Circular Holes, J. Eng. Gas Turb. Power, 132, 061501–1, https://doi.org/10.1115/1.4000114, 2010.
Schlüßler, R., Bermuske, M., Czarske, J., and Fis-cher, A.: Simultaneous three-component velocity mea-surements in a swirl-stabilized flame, Exp. Fluids, 56, 1,https://doi.org/10.1007/s00348-015-2055-y, 2015.
Schulz, A., Haufe, D., Czarske, J., Fischer, A., Bake, F.,and Enghardt, L.: Spectral Analysis of Velocity Fluctua-tions in the Vicinity of a Bias Flow Liner with respect tothe Damping Efficiency, Acta Acust. united Ac., 101, 24,https://doi.org/10.3813/AAA.918801, 2015.
Zhao, D. and Li, X. Y.: A review of acoustic dampers applied tocombustion chambers in aerospace industry, Prog. Aerosp. Sci.,74, 114, https://doi.org/10.1016/j.paerosci.2014.12.003, 2015.
J. Sens. Sens. Syst., 7, 113–122, 2018 www.j-sens-sens-syst.net/7/113/2018/