aerodynamic and performance measurements on a … and performance measurements on a swt-2.3-101 wind...
TRANSCRIPT

Aerodynamic and Performance Measurements on a SWT-2.3-101 Wind Turbine P. Medina and M. Singh Siemens Energy Inc.
J. Johansen, A. Rivera Jove, and E. Machefaux Siemens Wind Power A/S
L.J. Fingersh and S. Schreck National Renewable Energy Laboratory
Presented at WINDPOWER 2011 Anaheim, California May 22 – 25, 2011
NREL is a national laboratory of the U.S. Department of Energy, Office of Energy Efficiency & Renewable Energy, operated by the Alliance for Sustainable Energy, LLC.
Conference Paper NREL/CP-5000-51649 October 2011
Contract No. DE-AC36-08GO28308

NOTICE
The submitted manuscript has been offered by an employee of the Alliance for Sustainable Energy, LLC (Alliance), a contractor of the US Government under Contract No. DE-AC36-08GO28308. Accordingly, the US Government and Alliance retain a nonexclusive royalty-free license to publish or reproduce the published form of this contribution, or allow others to do so, for US Government purposes.
This report was prepared as an account of work sponsored by an agency of the United States government. Neither the United States government nor any agency thereof, nor any of their employees, makes any warranty, express or implied, or assumes any legal liability or responsibility for the accuracy, completeness, or usefulness of any information, apparatus, product, or process disclosed, or represents that its use would not infringe privately owned rights. Reference herein to any specific commercial product, process, or service by trade name, trademark, manufacturer, or otherwise does not necessarily constitute or imply its endorsement, recommendation, or favoring by the United States government or any agency thereof. The views and opinions of authors expressed herein do not necessarily state or reflect those of the United States government or any agency thereof.
Available electronically at http://www.osti.gov/bridge
Available for a processing fee to U.S. Department of Energy and its contractors, in paper, from:
U.S. Department of Energy Office of Scientific and Technical Information
P.O. Box 62 Oak Ridge, TN 37831-0062 phone: 865.576.8401 fax: 865.576.5728 email: mailto:[email protected]
Available for sale to the public, in paper, from:
U.S. Department of Commerce National Technical Information Service 5285 Port Royal Road Springfield, VA 22161 phone: 800.553.6847 fax: 703.605.6900 email: [email protected] online ordering: http://www.ntis.gov/help/ordermethods.aspx
Cover Photos: (left to right) PIX 16416, PIX 17423, PIX 16560, PIX 17613, PIX 17436, PIX 17721
Printed on paper containing at least 50% wastepaper, including 10% post consumer waste.
Aerodynamic and Performance Measurements on a
SWT-2.3-101 Wind turbine.
Paul Medina and Manjinder Singh,
Siemens Energy Inc., Boulder, CO, USA
Jeppe Johansen, Anna Rivera Jove, ∗ and Ewan Machefaux †
Siemens Wind Power A/S, Taastrup, Denmark
Lee Fingersh and Scott Schreck
National Renewable Energy Lab, Golden, CO, USA
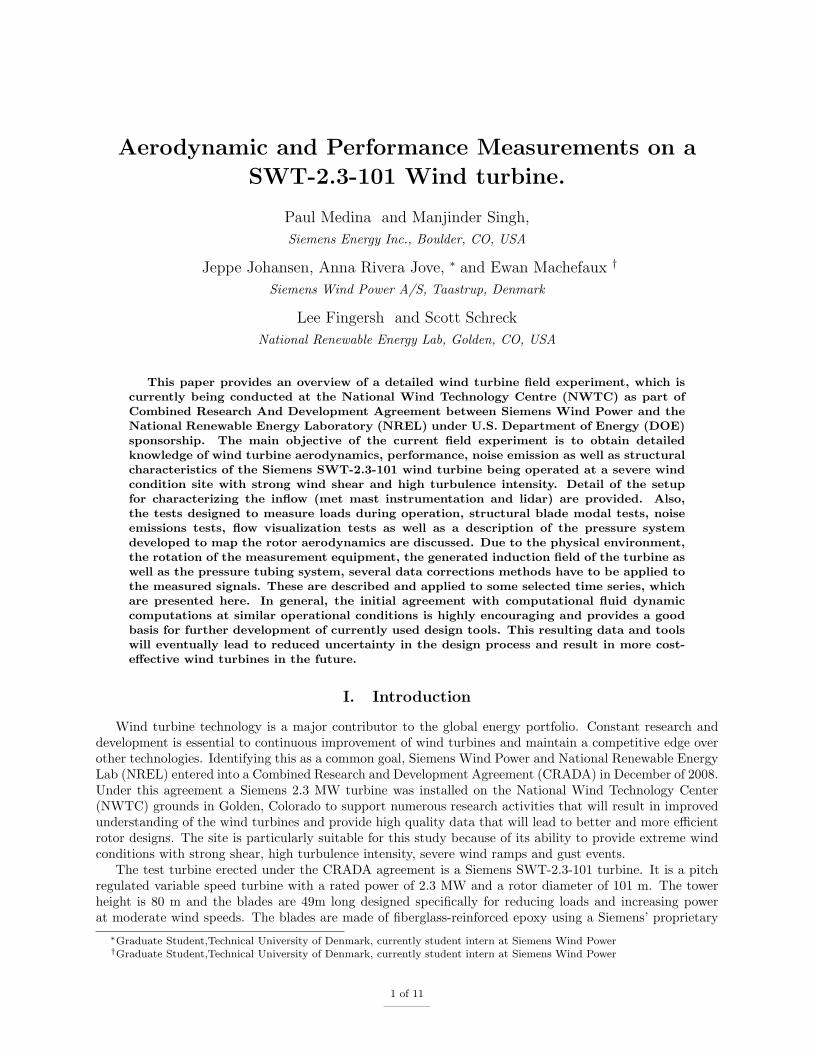
This paper provides an overview of a detailed wind turbine field experiment, which iscurrently being conducted at the National Wind Technology Centre (NWTC) as part ofCombined Research And Development Agreement between Siemens Wind Power and theNational Renewable Energy Laboratory (NREL) under U.S. Department of Energy (DOE)sponsorship. The main objective of the current field experiment is to obtain detailedknowledge of wind turbine aerodynamics, performance, noise emission as well as structuralcharacteristics of the Siemens SWT-2.3-101 wind turbine being operated at a severe windcondition site with strong wind shear and high turbulence intensity. Detail of the setupfor characterizing the inflow (met mast instrumentation and lidar) are provided. Also,the tests designed to measure loads during operation, structural blade modal tests, noiseemissions tests, flow visualization tests as well as a description of the pressure systemdeveloped to map the rotor aerodynamics are discussed. Due to the physical environment,the rotation of the measurement equipment, the generated induction field of the turbine aswell as the pressure tubing system, several data corrections methods have to be applied tothe measured signals. These are described and applied to some selected time series, whichare presented here. In general, the initial agreement with computational fluid dynamiccomputations at similar operational conditions is highly encouraging and provides a goodbasis for further development of currently used design tools. This resulting data and toolswill eventually lead to reduced uncertainty in the design process and result in more cost-effective wind turbines in the future.
I. Introduction
Wind turbine technology is a major contributor to the global energy portfolio. Constant research anddevelopment is essential to continuous improvement of wind turbines and maintain a competitive edge overother technologies. Identifying this as a common goal, Siemens Wind Power and National Renewable EnergyLab (NREL) entered into a Combined Research and Development Agreement (CRADA) in December of 2008.Under this agreement a Siemens 2.3 MW turbine was installed on the National Wind Technology Center(NWTC) grounds in Golden, Colorado to support numerous research activities that will result in improvedunderstanding of the wind turbines and provide high quality data that will lead to better and more efficientrotor designs. The site is particularly suitable for this study because of its ability to provide extreme windconditions with strong shear, high turbulence intensity, severe wind ramps and gust events.
The test turbine erected under the CRADA agreement is a Siemens SWT-2.3-101 turbine. It is a pitchregulated variable speed turbine with a rated power of 2.3 MW and a rotor diameter of 101 m. The towerheight is 80 m and the blades are 49m long designed specifically for reducing loads and increasing powerat moderate wind speeds. The blades are made of fiberglass-reinforced epoxy using a Siemens’ proprietary
∗Graduate Student,Technical University of Denmark, currently student intern at Siemens Wind Power†Graduate Student,Technical University of Denmark, currently student intern at Siemens Wind Power
1 of 11

manufacturing process. The turbine is designed to run between wind speeds of 4-25 m/s with nominal powerbeing reached at 12-13 m/s. The rotor speed varies between 6-16 rpm.
The overall objective of the CRADA is to enable a broad range of studies, designed to impact the windturbine design cycle at multiple stages, including but not limited to
1. inflow characterization,
2. aerodynamic performance characterization,
3. operational loads performance,
4. structural characterization
5. noise emission,
6. turbine wake etc.
The goal of this paper is to provide an overview of studies that are currently underway or are planned tomeet the overall objective. The work presented in this paper is more focussed on the aerodynamic tests,which are at a comparatively advanced stage.
II. Inflow Characterization
As the turbine size continues to grow, the interaction of turbine blades with the atmospheric boundarylayer (ABL) is increasing in complexity. ABL qualities (shear,turbulence, etc.) have a great influence on theturbine operation and performance. Inflow characterization is thus not only essential to accurately predictthe AEP but also the lifetime over which the turbine can be expected to perform without major deterioration.The objective of inflow characterization tests planned as a part of this study is to obtain data that can beused to correlate the power produced and loads acting on a turbine to variables that describe the inflow.Having such correlations will also enable short-term forecasting that can be used to improve the efficiencyof the turbine, and avoid overloads by anticipating high load events such as a gust. A brief overview of thetools/equipment that are available for characterizing the inflow to the test turbine are discussed here.
A. Meteorological Towers
The need to accurately characterize the ABL as well as the inflow across the turbine rotor led to the design ofa 135m (440 foot) meteorological tower for this project that is placed approximately 2 rotor diameters upwindof the turbine. This tower was based on the tower design used in the NREL Lamar Low Level Jet Projectwhich was designed primarily to be extremely stiff so that tower motions wouldn’t be detectable by the sonicanemometers leaving them free to measure only atmospheric conditions. However, this tower is both taller(135m versus 120m) and holds more instrumentation (six sonic levels versus four) thus necessitating someadjustments to the design. Further, the tower ended up having to serve double and triple duty for otherprojects ultimately leading to the installation of 13 instrumentation booms and several auxiliary devicesfor other purposes. All of this instrumentation requires substantial maintenance so a service lift was alsocustom-designed to facilitate frequent trips up the tower in a safe manner.
All of this customization led to substantial delays in the implementation of the 135m primary inflow tower.To help mitigate the effect of these delays, an existing nearby tower approximately 2.5 rotor diameters upwindof the turbine was placed into service for this project. This tower was 58m tall serving the Controls AdvancedResearch Turbines (CART) and was instrumented with one sonic, four levels of cups and vanes, and twolevels of temperature, plus barometric temperature. For this project, the tower was extended to 80m andIEC-class instrumentation was placed at the top at turbine hub height. This included a class-1 cup at 80m,another at 78.5m along with a vane at that level, and a barometric pressure sensor and temperature sensorjust below that. The data system was modified to run continuously at 20Hz and data has been collectedduring turbine pressure instrumentation commissioning procedures.
B. Lidar
In collaboration with University of Colorado, Boulder, a portable Windcube lidar has been installed on-siteapproximately 2.8 diameters upstream of the turbine in dominant wind direction to characterize the inflow.
2 of 11

The lidar is capable of measuring three velocity components (within 0-60m/s) within a 40-200m range, withscanning cone angle of 15◦ and 30◦. Though the system is capable of producing high temporal resolutiondata, currently it is being used to acquire averaged data (over 10 minutes) at 40, 50, 60, 80, 100, 120, 140,160, 180 and 200 meters above the ground.
III. Operational Loads Tests
The main purpose of the operational loads test is to identify how the SWT-2.3-101 wind turbine operatesfor a wide range of inflow conditions, such as high wind and high turbulence, during normal operation,idling, cut-in and cut-out. The data will also allow validation of in-house aeroelastic tools that are used asan integral part of the blade design process. In order to use the load measurements for validation, windinflow data is also captured simultaneously. To enable this study each of the three blades is instrumentedwith four strain gauges. Additional strain gauges are installed in the nacelle and the tower. In addition tothe strain gauges the turbine is also instrumented with bi- and tri-axial accelerometers at various locations,which will provide data sufficient to determine the modes of the tower and the blades. Though the systemis in place to acquire all the data required to meet the objectives of this test, analysis of the data has notbeen started yet.
IV. Blade Modal Tests
One of the most important part of the blade design cycle is determination of the structural response ofa blade to ensure that modes that can be detrimental to the blade are not excited in the expected range ofoperation. A series of modal tests are planned as a part of this study to obtain data that will be comparedagainst the structural models that are used in computations. This section provides information about thetests that have been conducted and are planned for the future.
A structural test of the B-49 blade was conducted at the NWTC to verify the structural data used inSiemens’ aeroelastic codes. The blade test included a static loads test and a modal test. The static loads testwas performed on a smaller 5.4 MN-m Stand and aims to verify the blade stiffness properties. The modaltest would be conducted in two phases, on the 5.4 MN-m stand and on a larger and more stiff 16.7 MN-mstand. The goal of the modal test was to identify the modal properties (frequencies, damping, and modeshapes) of the first ten blade modes. Blade adapters were designed and built to allow blade attachment toboth blade test stands.
In the static loads test, the blade was mounted in the cantilever position with the leading edge down,and the loads were applied at two blade stations separately (37 m and 48 m). Two wooden saddles werebuilt for each station so the loads can be applied safely to the blade. To simulate the flap loads, a tractorapplied a side pull to the blade; the edge loads were simulated using dead weights. For the torsion test, thetorsion loads were applied through the saddle with one end supported from above by a crane and the other
0 0.2 0.4 0.6 0.8 10
0.2
0.4
0.6
0.8
1
r/R
Non
-dim
ensi
onal
ized
Def
lect
ion
PredictedMeasured
Figure 1. An example of data that was obtained from a modal test.
3 of 11

end hung by dead weights. The static loads were applied at several levels and were measured with load cells.Blade flap and edge deflections were measured using a laser tracker and string pods; inclinometers measuredthe blade twist. Figure 1 shows a sample test result for the edgewise static load test.
In addition to the static loads test, the first phase of the modal tests was performed on the 5.4 MN-mstand, where the blade was cantilevered with the leading edge facing down. For this test, accelerometerswere mounted at ten stations along the blade span at the leading edge, trailing edge, and mid chord.Additionally, accelerometers at the blade roots and on the stand were used to measure their relative motions.Blade excitations were applied using impact hammer at several blade stations. Data acquisition and modalanalysis were performed with LMS Test Lab. Modal data were extracted using LMS’s PolyMAX method.The modal test was able to identify more than the first ten blade modes, and the preliminary test resultscorrelate fairly well with prediction. However, the measured frequencies were found to be 4-8 percent lowerthan prediction, probably due to the stand stiffness. Thus, the blade modal test would be repeated on thelarger, stiffer 16.7 MN-m stand in the next phase.
V. Noise Tests
The SWT 2.3-101 at the NWTC has also been utilized in noise emission evaluation and mitigationstudies since its commissioning. The majority of the testing is based around noise reduction through theuse of aerodynamic devices, with the aim of reducing the aero-acoustic noise without forcing the turbine tooperate in a curtailed state. Measurements of some preliminary aero-acoustic noise mitigation devices showthat a broadband noise reduction of up to at least 2 dB can be achieved at peak noise levels. Figure 2 showsthe background corrected sound power levels versus wind speed for the standard turbine blade configurationcompared to measurements made after the application of aero-acoustic noise mitigation devices to the blades.
4 6 8 10 12 14 16−20
−18
−16
−14
−12
−10
−8
−6
−4
−2
0
Wind Speed [m/s]
Nor
mal
ized
Sou
nd P
ower
Lev
el, L
wA [d
B]
Sound Power Level vs. Active Power (time−series averages [10sec])
LwA Standard (Binned Averages)
LwA Regression
LwA TE Treated NREL
LwA TE Treated NREL Regression
LwA TE Treated Siemens
LwA TE Treated Siemens Regression
Figure 2. Results from a noise measurement campaign on the turbine that compare baseline and aero-acoustically treated blades.
The measurements shown in figure 2 were made in accordance to the IEC 61400-11 standard [ref.1]. Inaddition to single microphone measurements, a small acoustic array has been employed in the evaluation ofnoise to attempt to localize dominate noise emission locations and better understand the directionality ofthese noise sources. Examples of these measurements can be seen in figure 3.
VI. Flow Visualization
To characterize blade suction surface boundary layer state and flow field topology with high spatialresolution, oil-flow visualization tests were conducted in May 2010. These visualizations were especiallywell suited to discerning the effect of different vortex generators under varying operating conditions. Dueto constraints related to turbine blade access and environmental sensitivity at the NREL/NWTC site, new
4 of 11

Figure 3. An example of acoustic image from data acquired using the acoustic array.
Figure 4. Typical oil flow visualization on wind turbine blade suction surface, through the blade radius range0.84 ≤ r/R ≤ 0.91. Leading edge is at upper border.
variations on traditional oil-flow techniques were developed. The relatively long time period and possiblevariation between separate test runs resulted in the use of a vegetable based oil that remained present andfluid throughout the test and was environmentally friendly. Despite inherent challenges and limitations, thisnew oil flow technique was effective in providing high quality measurements of the surface flow conditionsduring operation.
Oil flow visualization tests were performed on the blade over the radial region 0.85R ≤ r/R ≤ 0.91R.Vortex generators were installed at 0.60c, from 0.85R to 0.87R and from 0.89R to 0.91R. Two sizes of vortexgenerators were used, with a height of 8 mm from radius 0.85R to 0.86R and 6 mm from 0.86R to 0.87R andfrom 0.89R to 0.91R. The blade was left clean in the center region of study between radius 0.87R and 0.89R.
A Grove GMK5275 hydraulic crane with a man basket was used to provide access to the blade, approxi-mately 60 m above ground level. A combination of vegetable based oil and pigment were mixed together andapplied to the blade using a standard paint roller. Once the oil pigment mix was applied to the blade, theman basket was lowered and the crane boom was moved clear of the rotor. Finally, the turbine locks neces-sary for man basket work on the blade were released and the turbine was allowed to operate. This processresulted in a 10 to 20 minute delay from the time the oil was applied until the turbine began operating.
Still photography was taken either from the ground or from the top of a nearby wind turbine at a heightof approximately 40m. Distance from camera to test turbine varied somewhat from test to test, but wasapproximately 200 m. An 18 megapixel APS-c digital SLR was used with a 400mm lens to provide spatialresolution of approximately 3 mm at the blade surface. Because the turbine was rotating and the section ofinterest was tracked by hand, a fast shutter speed of 1/4000th was selected to minimize motion blur arisingfrom imperfect tracking. An attempt was made to capture approximately five frames per rotor revolution,at the 12, 3, 5, 7, and 9 o’clock positions. The 6 o’clock position was avoided because the tower blocked the
5 of 11

view of the rotating blade.Figure 4 contains a typical suction surface flow visualization photo. Visible in the panel is a planform
view of the blade suction surface for the radius range 0.84R ≤ r/R ≤ 0.91R. A black border has been drawnaround the blade to clearly demarcate its extent. The blade leading edge is located near the top of thepanel and the tip lies to the right. The oil visualizing medium is prominent over much of the frame as thedark medium irregularly patterned over the light blade surface. The oil flow pattern in Figure 4 shows welldefined, narrow dark bands parallel to the blade trailing edge. The photo shown in Figure 4 representsa low angle of attack that normally would result in negligible trailing edge separation. Clearly, the vortexgenerators were effective in delaying trailing edge separation, as they shifted separation 0.05c to 0.10c fartheraft for the same angle of attack.
VII. Aerodynamic Testing
One of the major research goals of this turbine is to characterize the general aerodynamic behavior of windturbine blades and more specifically those that are used on the SWT-2.3-101 turbine. The data resultingfrom this study will be used to validate the CFD tools and develop robust analytical models that are essentialpart of the blade design procedure. The data will thus play a critical role in producing tools that will leadto better and more efficient blades. This section describes the relevant instrumentation, methodology beingused for the aerodynamic measurements, and initial results obtained so far.
A. Pressure Instrumentation
In order to obtain useful surface pressure data, one of the blades is extensively instrumented to provide thepressure measurements at nine span-wise locations. Each of the nine span-wise locations has approximately60-64 pressure taps, distributed based on surface curvature, that provide sufficient resolution to developreliable models and CFD comparisons. Figure 5 depicts the span-wise locations used on the blade for pressuremeasurements and 5-hole pitot probes. The pressure at each of these stations is acquired using a combinationof ZOC33 and ERAD-4000 modules from Scanivalve Corporation at 25 Hz and is transmitted wirelessly to aremote computer for storage and post-processing. To avoid the sensor drifts due to variation in temperature,the pressure modules are housed in a Temperature Control Unit(TCU) that maintains the temperature of themodules at ≈ 25◦C. Additionally, in an attempt to reduce operational damage, the instruments are mountedwithin 25 m blade radius and aligned appropriately as suggested by the manufacturer. Furthermore, four5-hole pitot probes manufactured by Aeroprobe are installed to measure inflow angles and velocities and arealso shown in figure 5. These probes extend approximately 0.6m into the flow and the setup for the dataacquisition is essentially the same as that was described for the pressure measurements. A standard datareduction scheme is used for post-processing of the acquired data.
Figure 5. Schematic of the instrumented blade showing the locations of measurements stations and 5-holepitot probes.
B. Post-Processing: Data Corrections
Past studies1,2 have shown that certain physical phenomenon manifest themselves on the actual pressuredistribution and must be accounted for in the pressure measurements conducted on a turbine. While, mostof these corrections are well understood and have been successfully implemented previously, the nature
6 of 11

of measurements being conducted here also require an additional correction that have not been used onturbine scale experiments previously. As will be evident, validation tests for some of these corrections wereconducted using actual measurement configuration for increased confidence. For the remaining corrections,validations test are planned and will be carried out in near future. To summarize (for details, references 1–3are suggested), the corrections implemented for this work are,
1. Centrifugal correction: The column of air trapped between the sensor and the port exerts a net negativeforce on the sensor diaphragm as the blade rotates. The resulting difference in measured and actualsurface pressure, due to the centrifugal force is purely a function of span-wise location of the port, andis given by,
Pcent = 0.5ρ
(Vtiprsec
R
)2
2. Hydrostatic correction: As the blade rotates, the position of the transducer varies in the verticaldirection, thus resulting in varying hydrostatic pressure acting on the transducer diaphragm duringthe course of rotation (≈ 10 Pa/m at the test site). For a differential pressure transducer, it canbe shown that the resulting pressure changes will be negligible. However, since both the referenceand measurement side of the transducer are attached to tubing, a phase shift will be introduced thatdepends on the geometry of the tubing and the ambient conditions. The equation for the resultingpressure change due to the hydrostatic effect is then given by,
∆PHS = −ρgr cos(θ − ϕpr)− (−ρgr cos(θ − ϕref ))
Where, θ is the azimuthal angle and ϕ represents the phase lag on the pressure side and reference sideof the transducer, as indicated by the sub-scripts pr and ref , respectively. The phase lags are modeledusing the methodology discussed for tubing effect corrections later in this section.
3. Reference pressure correction: For the setup currently used in the CRADA turbine, the reference portsof the transducers are not open to the atmosphere but a closed basket (with small leak) in the hub.Thus, in order to reference the measurements to the free stream static pressure, the measured pressuresmust be offset appropriately. This offset can be calculated using the measured stagnation pressure andthe free stream velocity. Mathematically, this offset is determined by using
POffset = P∞ − Pbasket = Pstag,measured −Qmet
4. Pressure correction for the tubing effect: In addition to what was discussed above, in the currentsetup the pressure measurements are conducted remotely, where the sensors are not flushed with thesurface, but are connected to the surface ports through long pressure tubing of varying geometry. Insuch cases, the tubing affects the pressure measurements in a manner similar to a low pass filter byattenuating the amplitude and introducing a phase shift as compared to the original signal.3 In orderto reconstruct the original signal, a transfer function is created based on the tubing geometry used forthe measurements and the local conditions at the time of measurements. This method was validatedusing wind tunnel tests and the results (an example of which is shown in figure 6) showed that theoriginal signal can be reconstructed with a high degree of accuracy.
C. Current Results
The ultimate objective of this measurement campaign is to use the acquired data for improvement of mul-tiple processes that are essential for an efficient rotor design. Currently, preliminary data analysis is beingconducted that will lead to the development of a database with a much wider utility. This section brieflydescribes the results of these preliminary analysis.
7 of 11

2 2.2 2.4 2.6 2.8 3
−1200
−1000
−800
−600
−400
−200
0
Time (secs)
Pre
ssur
e (P
a)
corrected
reference
sensed
Figure 6. Results from validation tests for the tubing correction on an airfoil pitching at 8 Hz. The Sensedsignal is measured by the remote sensor, the reference signal is from a flush mounted transducer for validationand the corrected pressure is the corrected sensed signal.
1. Inflow angle and velocity: 5-hole pitot probes
In order to correctly identify the comparison points for the experimental and computational data, it isessential to determine the correct inflow angle and velocity at which the data is acquired. The 5-hole pitotprobes that are mounted on the leading edge of the blade are one of the most direct and reliable methodto instantaneously determine the inflow angles and velocities the turbine blades are subjected to as they goundergo rotation. Such direct measurements essentially eliminate the need to account (in post-processing) forturbulence, yaw and shear in the flow, that can dynamically alter the angle of attack the blade experiences.To provide an example of the type of data acquired and post-processing, figure 7 is presented. The acquiredpressures P1-6 are shown in the two figures in first column and the variables obtained after post-processing(local inflow and slip angles and local velocity) are shown in the figures in second column. Clearly, theimportance of having such data cannot be underestimated, as it produces parameters that must be used foraccurate comparison of data with CFD results. In future the tools used for processing the 5-hole probe datawill include upwash corrections for improved accuracy. The data will then be used to extract additionalparameters, such as shear and turbulence in the rotor plane.
2. Surface Pressure Measurements
As one of the main objective of the aerodynamic testing is to develop a database for comparison with CFDresults, the raw data is post-processed after acquisition using methods described previously and comparedwith the CFD results. As an example, the pressure distributions (after applying the corrections mentionedpreviously) for the nine stations at V∞ ≈ 10m/s are shown in figure 8. The gaps in the measured data aredue to a filtering of channels showing bad data due to freeze, plug, etc.. As the figure shows, the experimentaland CFD data are in better agreement at the outboard stations than at the inboard stations. This is dueto inability of CFD tools to capture the pressure distribution accurately over thick airfoils. This is a perfectexample that shows applications that can benefit from the data being collected in this campaign. On theoutboard stations CFD does a very good job predicting the pressure distribution.
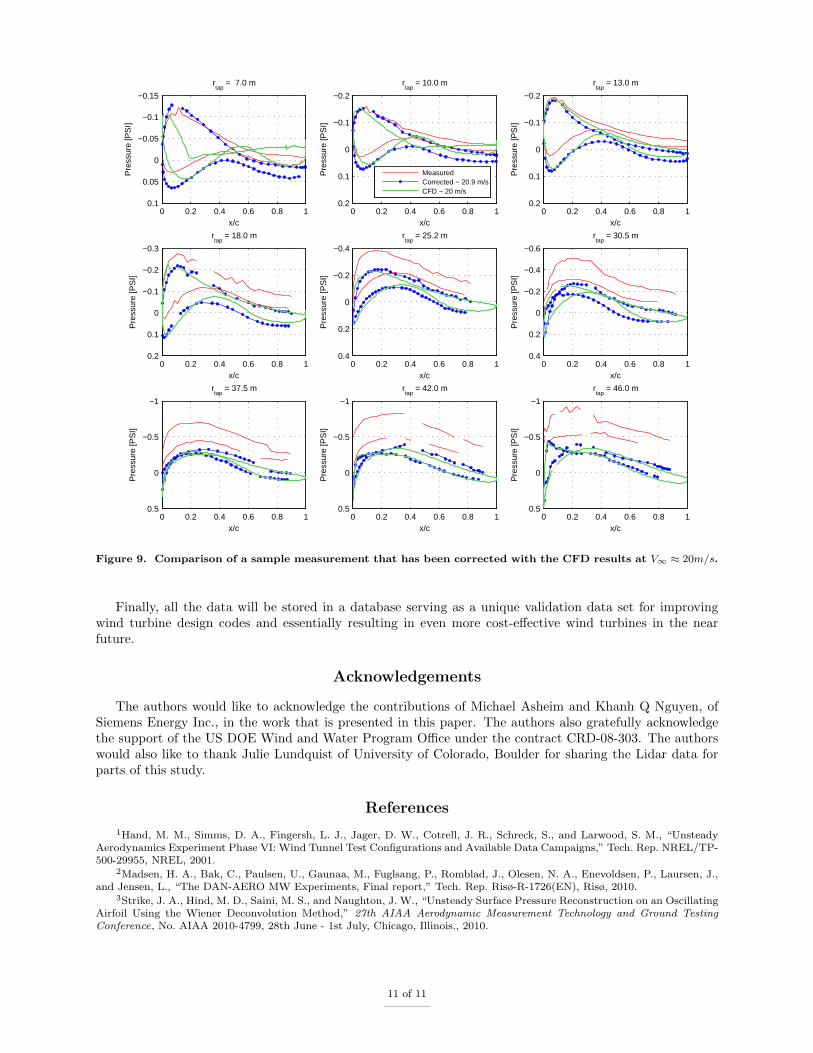
The results shown in figure 8 also show the importance of the corrections that are being used in thiswork. To emphasis the need of correction additional data at V∞ ≈ 20m/s is shown in the figure 9. For thiscase, the CFD tools do an extremely well job of predicting the pressure distribution at outboard stations.The mismatch at inboard stations can be attributed to points that were discussed earlier. Nonetheless, thegood agreement at outboard stations is a result of corrections and would not have been otherwise possible.
8 of 11

0 5000 10000 15000−0.15
−0.1
−0.05
0
0.05
frames
Pre
ssur
e [P
SI]
Pitot tube @ R =31.5 m Wsp =7.4 m/s
P1P2P3
0 5000 10000 15000−10
0
10
20
30
frames
Ang
les
[deg
.]
Local Inflow AngleLocal Slip Angle
0 5000 10000 15000−0.2
−0.15
−0.1
−0.05
0
0.05
frames
Pre
ssur
e [P
SI]
P4P5P6
0
10
20
30
40
50
60
frames
Vel
ocity
[m/s
]
0 5000 10000 150008
9
10
11
12
13
14
Turbine S
peed [rpm]
Wsp80m
Vmag
RPM
Figure 7. An example to demonstrate the data acquired and analyzed from five-hole pitot probes.
D. Collaboration with Academia
Besides the collaboration with government labs, such as NREL, Siemens Wind Power A/S is also dedicatedto creating long lasting relation with academia and train future engineers to meet industry needs. To furtherthis goal, currently two interns, from Technical University of Denmark are involved in development of post-processing tools and will be using the resulting data as part of their graduate thesis work. The studentsare currently involved in developing tools for implementing the corrections, aerodynamic characterization,and the inflow characterization using the data from 5-hole pitot probes, surface pressures, met mast and theon-site Lidar.
VIII. Conclusions
A Siemens SWT-2.3-101 turbine was installed as part of a Combined Research And Development Agree-ment (CRADA) between National Renewable Energy Lab and Siemens. The turbine was installed on NRELsite in Boulder, CO, which is known to provide extreme wind conditions with strong shear, high turbulenceintensity, severe wind ramps and gust events. The tests that have been completed or are planned in nearfuture include inflow characterization, aerodynamic performance characterization, loads performance, noiseemissions etc. As part of this ongoing research effort, tools have been developed to account for distortionsthat are inherent to the nature of experiments. The quantitative results obtained so far (such as those fromnoise emission tests and aerodynamic tests) have proven beneficial and have helped in identifying some ofthe areas in which improvements can be made. Final results from such a broad range of tests on the turbinewill allow to produce high quality data that can be used to validate, improve and produce a wide range ofin-house tools that are used as part of turbine design cycle.
IX. Future Work
With majority of the systems required for the studies outlined in this paper in place, future efforts willconcentrate on data acquisition and analysis for a wide range of wind velocities. Finally, as part of this
9 of 11

0 0.2 0.4 0.6 0.8 1
−0.1
−0.05
0
0.05
0.1
rtap
= 7.0 m
x/c
Pre
ssur
e [P
SI]
0 0.2 0.4 0.6 0.8 1
−0.15
−0.1
−0.05
0
0.05
x/c
Pre
ssur
e [P
SI]
rtap
= 10.0 m
MeasuredCorrected − 9.2 m/sCFD − 10 m/s
0 0.2 0.4 0.6 0.8 1
−0.2
−0.15
−0.1
−0.05
0
0.05
rtap
= 13.0 m
x/c
Pre
ssur
e [P
SI]
0 0.2 0.4 0.6 0.8 1
−0.3
−0.2
−0.1
0
0.1
rtap
= 18.0 m
x/c
Pre
ssur
e [P
SI]
0 0.2 0.4 0.6 0.8 1
−0.6
−0.4
−0.2
0
0.2
rtap
= 25.2 m
x/c
Pre
ssur
e [P
SI]
0 0.2 0.4 0.6 0.8 1
−1
−0.5
0
0.5
rtap
= 30.5 m
x/c
Pre
ssur
e [P
SI]
0 0.2 0.4 0.6 0.8 1
−1
−0.5
0
0.5
rtap
= 37.5 m
x/c
Pre
ssur
e [P
SI]
0 0.2 0.4 0.6 0.8 1
−1.5
−1
−0.5
0
0.5
rtap
= 42.0 m
x/c
Pre
ssur
e [P
SI]
0 0.2 0.4 0.6 0.8 1
−1.5
−1
−0.5
0
0.5
rtap
= 46.0 m
x/c
Pre
ssur
e [P
SI]
Figure 8. Comparison of a sample measurement that has been corrected with the CFD results at V∞ ≈ 10m/s.
research campaign, the efforts will concentrate on producing high fidelity models utilizing the collected dataand integrating these models into the turbine design cycle. Some of the future work was alluded to in theprevious discussion. Other studies that are to be completed in future include,
• Inflow Characterization: Future efforts in this category will concentrate on corrections that are requiredto produce useful data from the five-hole pitot probes, such as up-wash correction. The resulting datawill be used for variety of process validation, for example the process used for the site specific powercurve corrections.
• Aerodynamic Performance Characterization: The future analysis will focus on comparison betweenderived measurement, wind tunnel polar curves and those obtained from CFD. Additionally, the datawill be used to assess the performance of 3D correction models and validation of CFD models. Suchcomparison will reveal the robustness of in-house tools, which can be improved if required.
• Loads Performance: Future efforts in this category will emphasize on analysis of loads data that isbeing acquired. Additionally, advanced tests will be conducted to produce loads data with parkedrotor.
• Noise Emission: Future acoustic work will focus on systematically evaluating different design parame-ters for aero-acoustic noise mitigation devices in an attempt to more greatly reduce the overall level ofnoise being emitted from the rotor. This work will also look at the affect these noise mitigation deviceshave on spectral content and noise source location, hopefully revealing a better way of reducing noisewithout sacrificing energy production.
10 of 11
0 0.2 0.4 0.6 0.8 1
−0.15
−0.1
−0.05
0
0.05
0.1
rtap
= 7.0 m
x/c
Pre
ssur
e [P
SI]
0 0.2 0.4 0.6 0.8 1
−0.2
−0.1
0
0.1
0.2
x/c
Pre
ssur
e [P
SI]
rtap
= 10.0 m
MeasuredCorrected − 20.9 m/sCFD − 20 m/s
0 0.2 0.4 0.6 0.8 1
−0.2
−0.1
0
0.1
0.2
rtap
= 13.0 m
x/c
Pre
ssur
e [P
SI]
0 0.2 0.4 0.6 0.8 1
−0.3
−0.2
−0.1
0
0.1
0.2
rtap
= 18.0 m
x/c
Pre
ssur
e [P
SI]
0 0.2 0.4 0.6 0.8 1
−0.4
−0.2
0
0.2
0.4
rtap
= 25.2 m
x/c
Pre
ssur
e [P
SI]
0 0.2 0.4 0.6 0.8 1
−0.6
−0.4
−0.2
0
0.2
0.4
rtap
= 30.5 m
x/c
Pre
ssur
e [P
SI]
0 0.2 0.4 0.6 0.8 1
−1
−0.5
0
0.5
rtap
= 37.5 m
x/c
Pre
ssur
e [P
SI]
0 0.2 0.4 0.6 0.8 1
−1
−0.5
0
0.5
rtap
= 42.0 m
x/c
Pre
ssur
e [P
SI]
0 0.2 0.4 0.6 0.8 1
−1
−0.5
0
0.5
rtap
= 46.0 m
x/c
Pre
ssur
e [P
SI]
Figure 9. Comparison of a sample measurement that has been corrected with the CFD results at V∞ ≈ 20m/s.
Finally, all the data will be stored in a database serving as a unique validation data set for improvingwind turbine design codes and essentially resulting in even more cost-effective wind turbines in the nearfuture.
Acknowledgements
The authors would like to acknowledge the contributions of Michael Asheim and Khanh Q Nguyen, ofSiemens Energy Inc., in the work that is presented in this paper. The authors also gratefully acknowledgethe support of the US DOE Wind and Water Program Office under the contract CRD-08-303. The authorswould also like to thank Julie Lundquist of University of Colorado, Boulder for sharing the Lidar data forparts of this study.
References
1Hand, M. M., Simms, D. A., Fingersh, L. J., Jager, D. W., Cotrell, J. R., Schreck, S., and Larwood, S. M., “UnsteadyAerodynamics Experiment Phase VI: Wind Tunnel Test Configurations and Available Data Campaigns,” Tech. Rep. NREL/TP-500-29955, NREL, 2001.
2Madsen, H. A., Bak, C., Paulsen, U., Gaunaa, M., Fuglsang, P., Romblad, J., Olesen, N. A., Enevoldsen, P., Laursen, J.,and Jensen, L., “The DAN-AERO MW Experiments, Final report,” Tech. Rep. Risø-R-1726(EN), Risø, 2010.
3Strike, J. A., Hind, M. D., Saini, M. S., and Naughton, J. W., “Unsteady Surface Pressure Reconstruction on an OscillatingAirfoil Using the Wiener Deconvolution Method,” 27th AIAA Aerodynamic Measurement Technology and Ground TestingConference, No. AIAA 2010-4799, 28th June - 1st July, Chicago, Illinois., 2010.
11 of 11