aerosol forecasting at uk met office - observability...
TRANSCRIPT
© Crown copyright Met Office
Aerosol forecasting at UK Met OfficeJane Mulcahy, Malcolm Brooks, Bruce Ingelby, Yaswant Pradhan, Paul Agnew, David WaltersMet Office, Exeter, UK

© Crown copyright Met Office
Talk Overview
• Air quality forecasting update.• Aerosol strategy for global NWP & where we are.• Operational global dust forecasting and dust data assimilation
progress.• Application: Impact of aerosols on NWP forecasts• Example of sensitivity of aerosol deposition to model changes• Conclusions
© Crown copyright Met Office
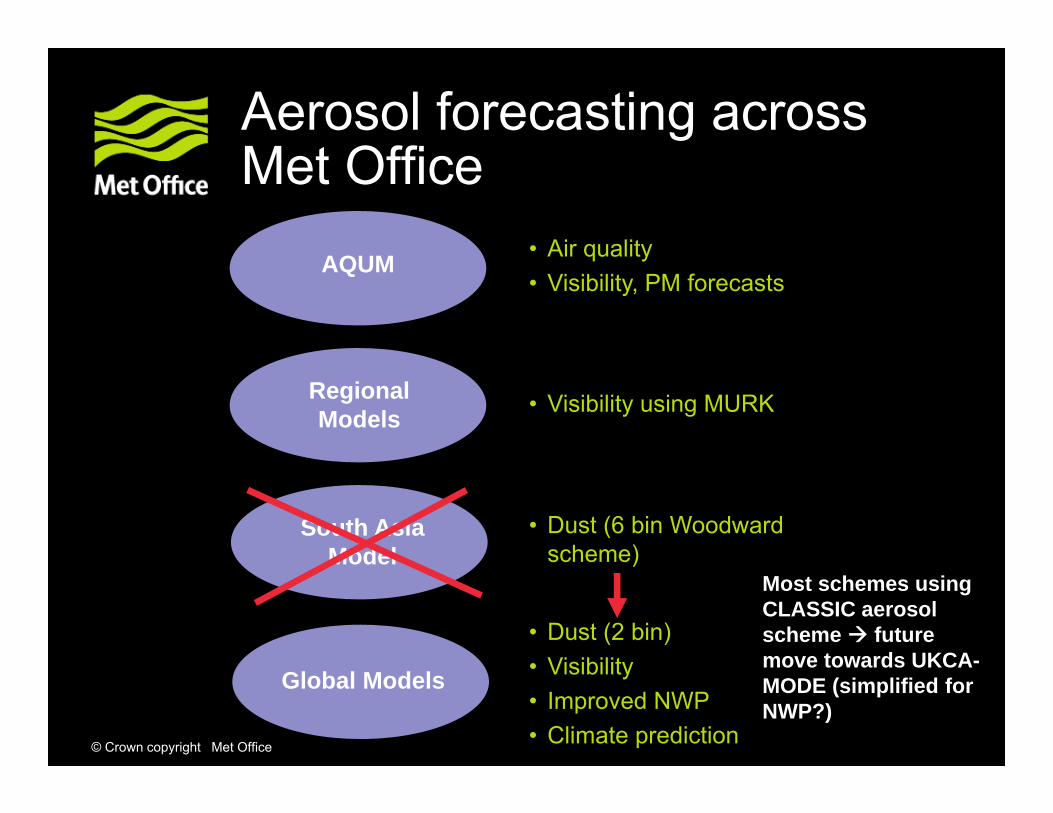
Aerosol forecasting across Met Office
• Air quality• Visibility, PM forecasts
• Visibility using MURK
• Dust (6 bin Woodward scheme)
• Dust (2 bin)• Visibility• Improved NWP• Climate prediction
AQUM
Regional Models
South Asia Model
Global Models
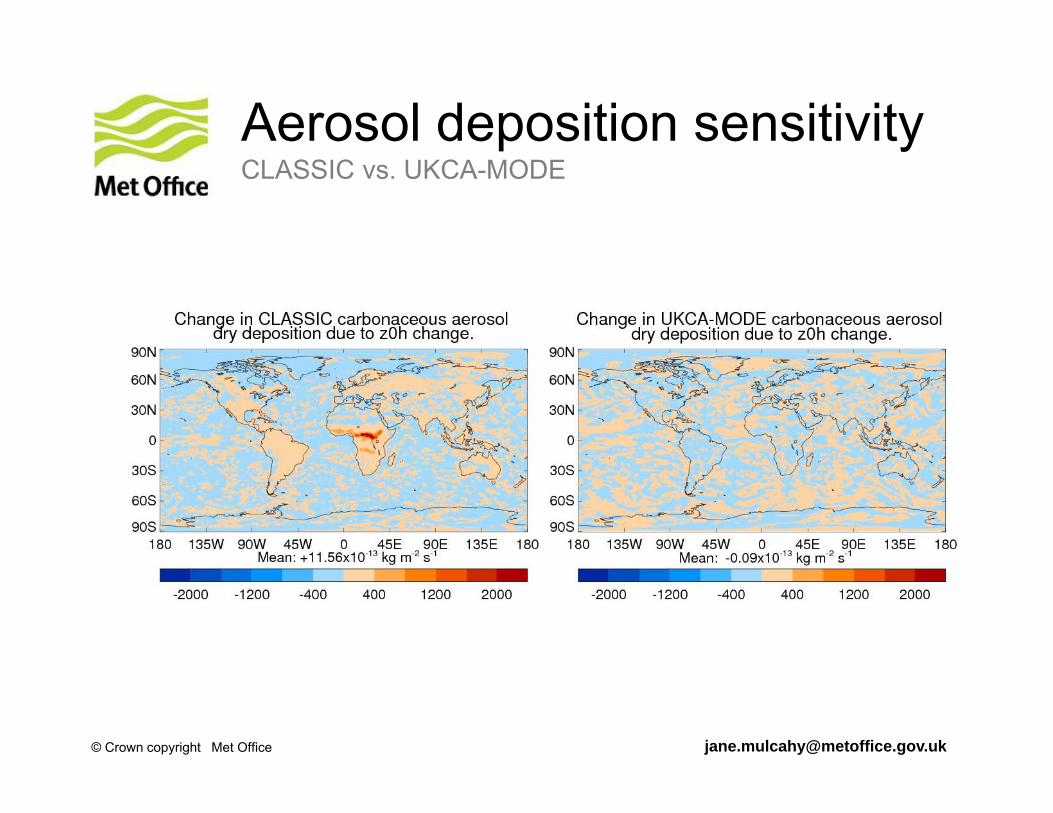
Most schemes using CLASSIC aerosol scheme future move towards UKCA-MODE (simplified for NWP?)

© Crown copyright Met Office
Air Quality ForecastingPaul Agnew

© Crown copyright Met Office
New UK Daily AQ Index
• AQ Index changed from 1st January 2012
• Addition of PM2.5 as a new component, alongside ozone, NO2, SO2, PM10
• Introduction of PM2.5 is already resulting in substantial number of UK exceedances
• Increases the importance of improved aerosol modelling and emission inventories

© Crown copyright Met Office
On-line modelling with AQUM
• AQ modelling in the UM offers advantages:
• On-line modelling, which allows:
• closer integration of meteorology and chemistry
• Incorporation of lateral boundary fluxes from a global model
• Potential for including feedbacks between composition and meteorology
• Influence of composition on radiation, cloud physics and visibility forecasting
An ozone field from an AQUM case study
© Crown copyright Met Office
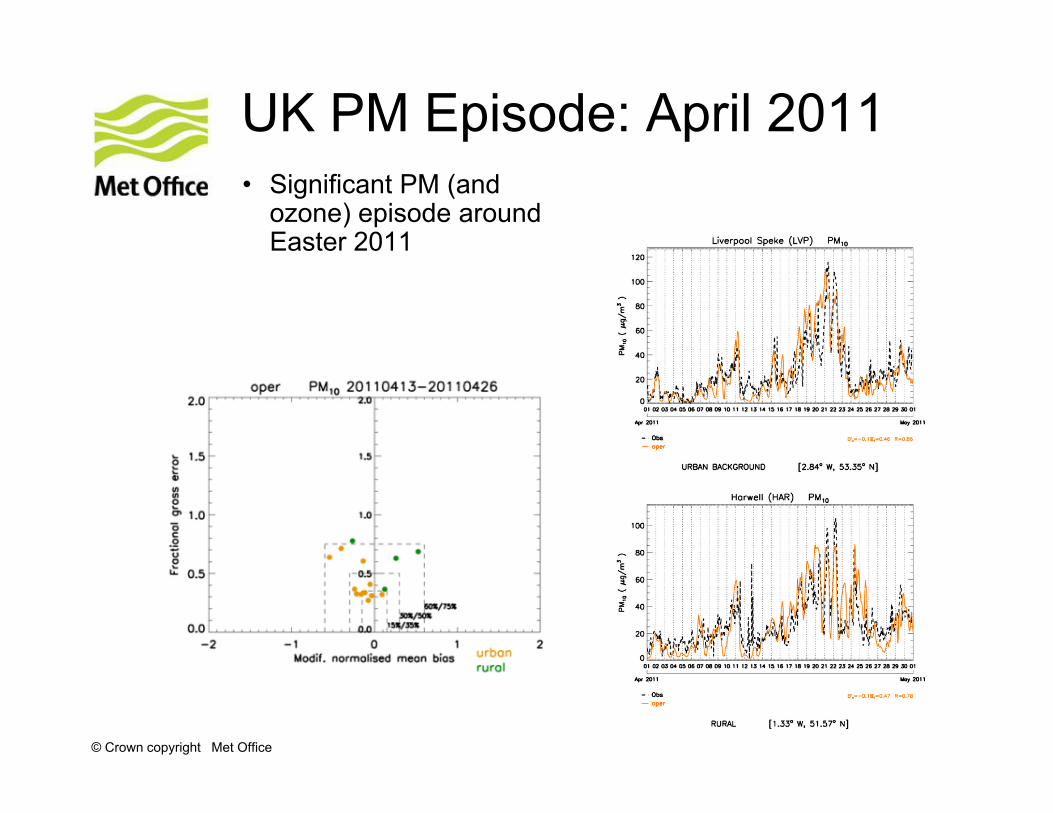
UK PM Episode: April 2011• Significant PM (and
ozone) episode around Easter 2011
© Crown copyright Met Office
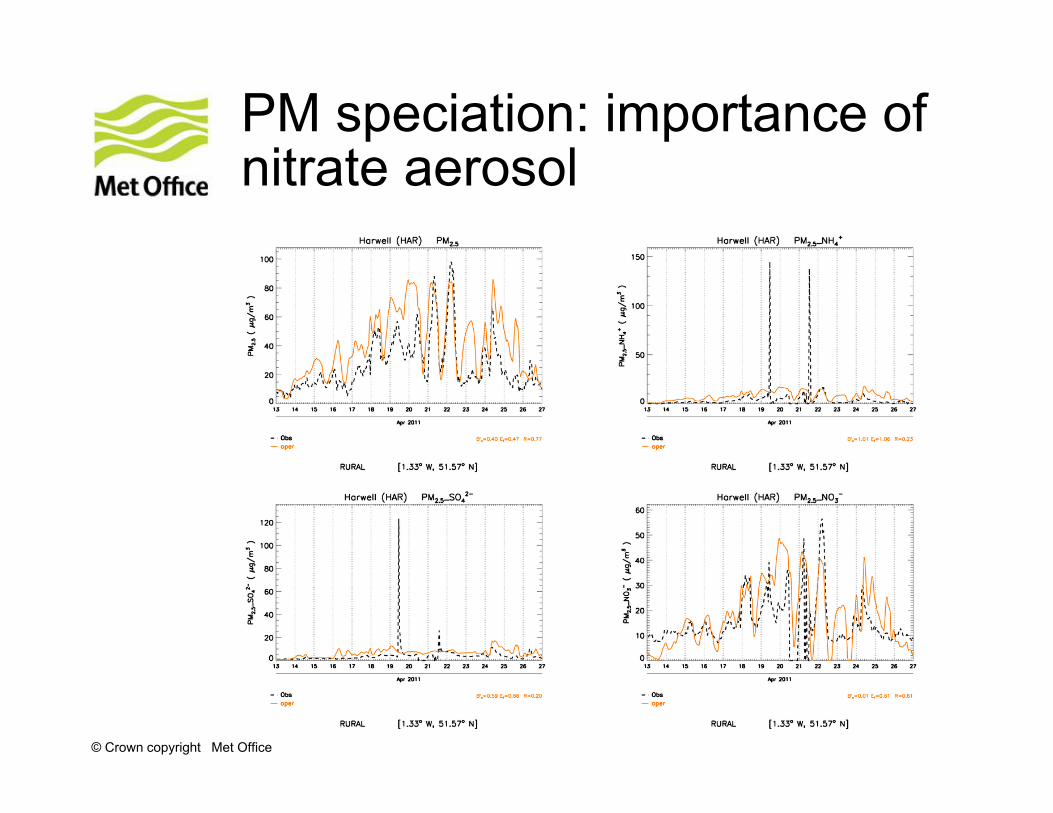
PM speciation: importance of nitrate aerosol

© Crown copyright Met Office
Aerosols in global NWP forecasts
Royal Meteorological Society Meeting, ECMWF, 19th Oct 2011© Crown copyright Met Office© Crown copyright Met Office
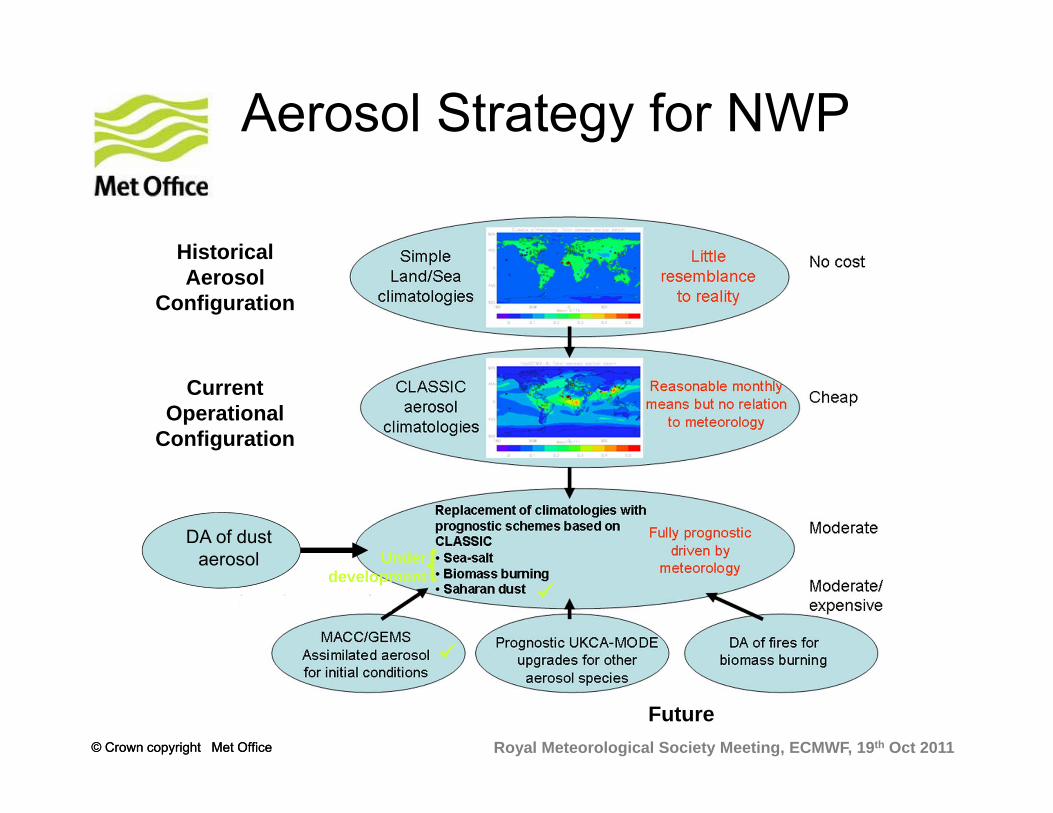
Aerosol Strategy for NWP
Historical Aerosol
Configuration
Current Operational
Configuration
Future
Under development
DA of dust aerosol
Royal Meteorological Society Meeting, ECMWF, 19th Oct 2011© Crown copyright Met Office
Dust in the UM global NWP model
• Operational global dust forecasts out to 6 days are available from the Met Office global NWP model since July 2011 .
• Dust scheme is a simplified 2-bin version (0.1-2μm, 2-10μm) of the Woodward (2001,2011) scheme currently used in the HadGEM climate model.
• Current operational horizontal resolution is 25km, 70 vertical levels.
• Undergoes advection & deposition but is currently not interacting with radiation (comes from dust climatology)
• Operational data assimilation of dust observations expected in 2013.
Royal Meteorological Society Meeting, ECMWF, 19th Oct 2011© Crown copyright Met Office
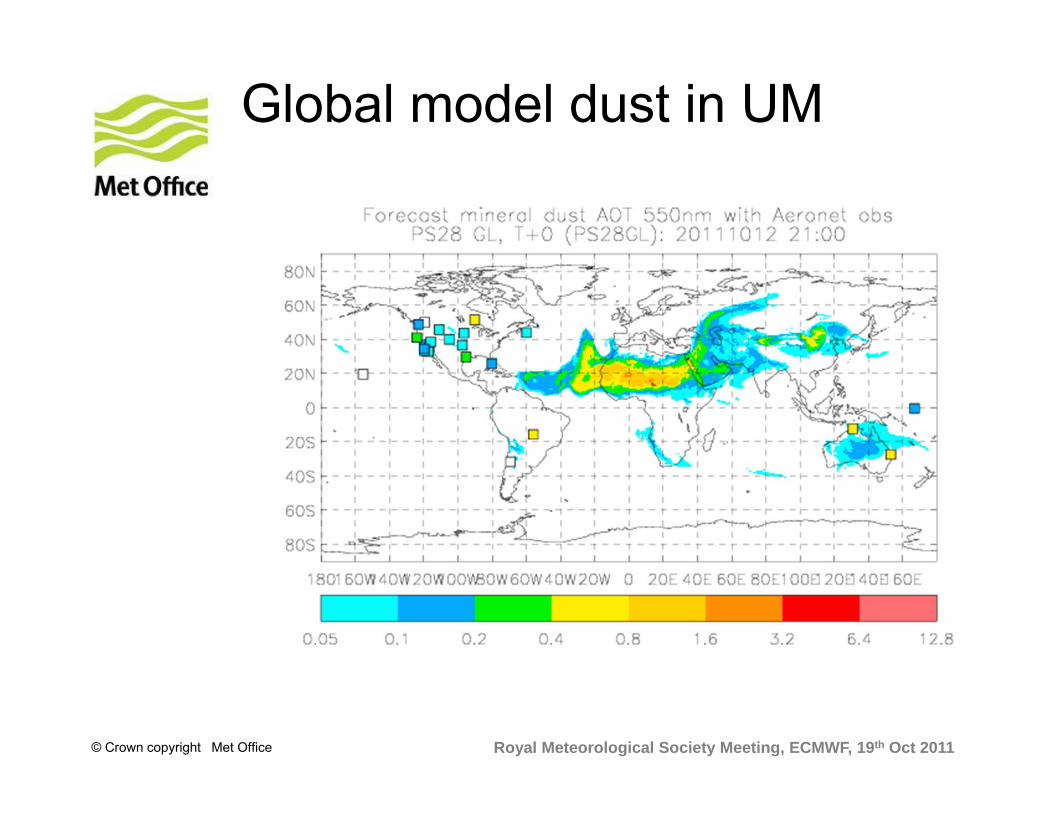
Global model dust in UM
Royal Meteorological Society Meeting, ECMWF, 19th Oct 2011© Crown copyright Met Office
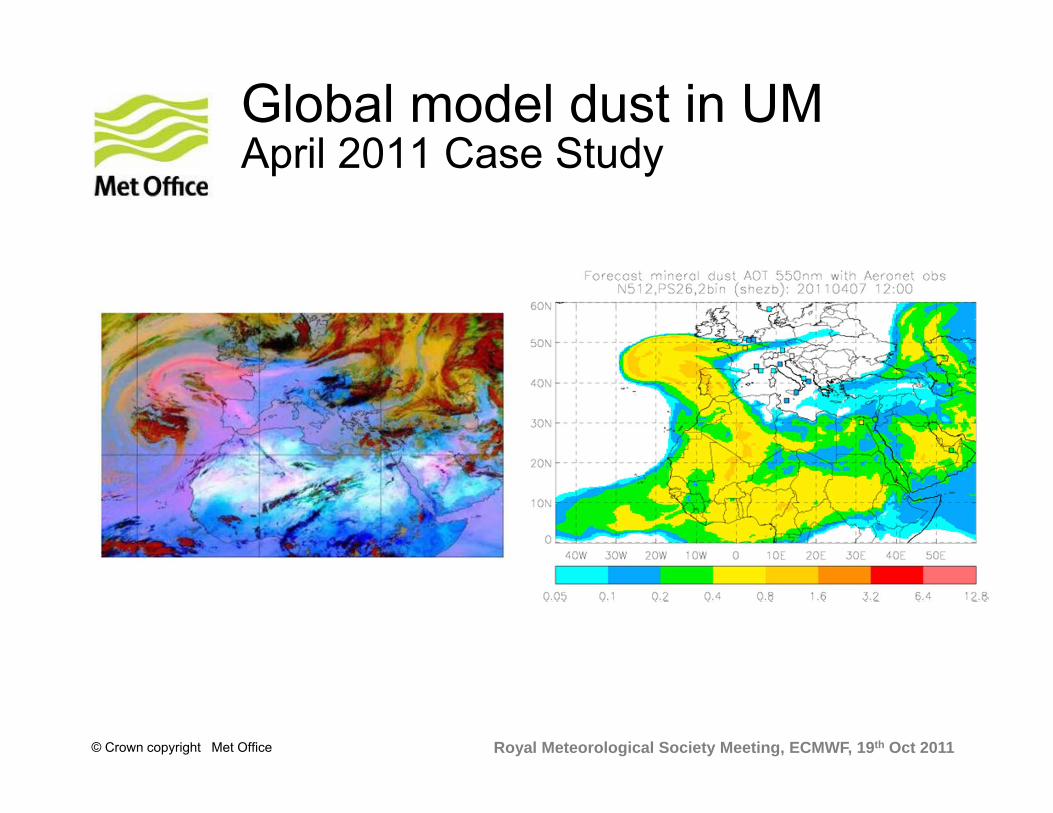
Global model dust in UMApril 2011 Case Study

© Crown copyright Met Office
http://sds-was.aemet.es/forecast-products/dust-forecasts/index_html/u.k.-met-office
© Crown copyright Met Office
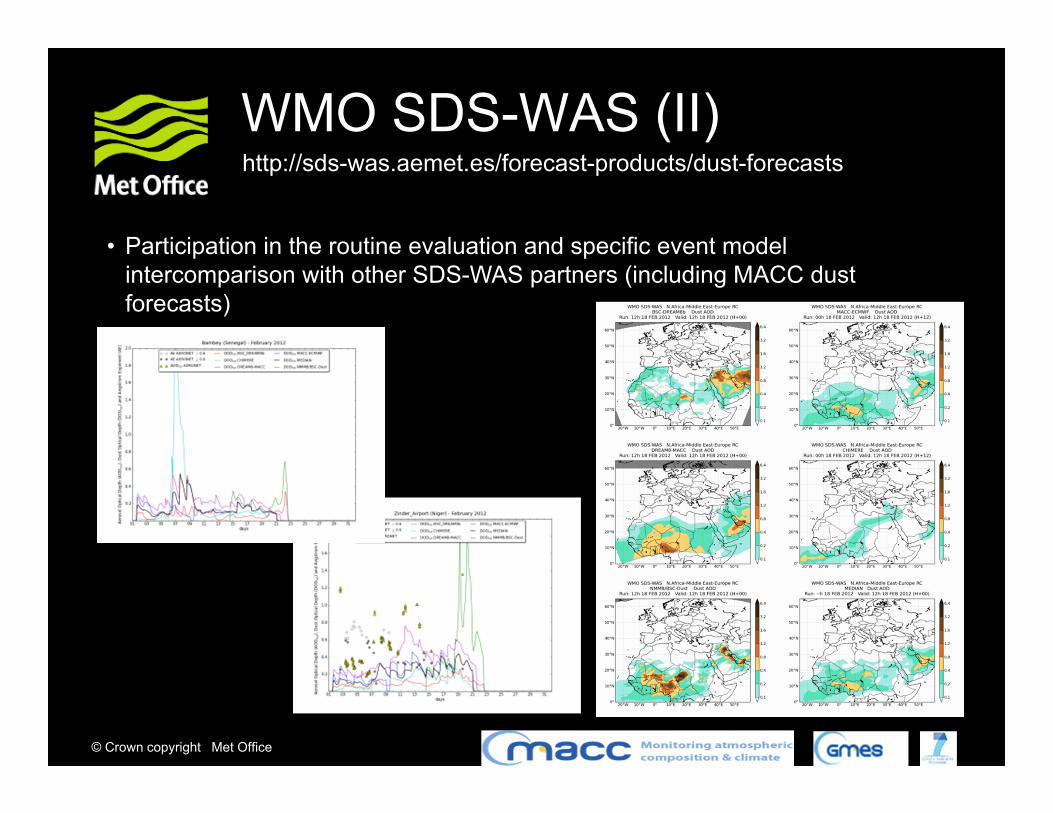
WMO SDS-WAS (II)http://sds-was.aemet.es/forecast-products/dust-forecasts
• Participation in the routine evaluation and specific event model intercomparison with other SDS-WAS partners (including MACC dust forecasts)

© Crown copyright Met Office
Dust Data Assimilation DevelopmentsBruce Ingleby, Yaswant Pradhan
ICAP Workshop, ESA, Frascati, Italy, May 2012© Crown copyright Met Office
Recent progress
• 2009: limited area 3D-Var version, short test with SEVIRI AOD
• 2011/12: global 4D-Var version
• code more generic/robust, MODIS processing added, minor improvements to AOD observation operator
• forecast has two size bins, analysis uses total dust
• new background error covariance statistics
• 2013 operational implementation of global 4D-Var planned
ICAP Workshop, ESA, Frascati, Italy, May 2012© Crown copyright Met Office
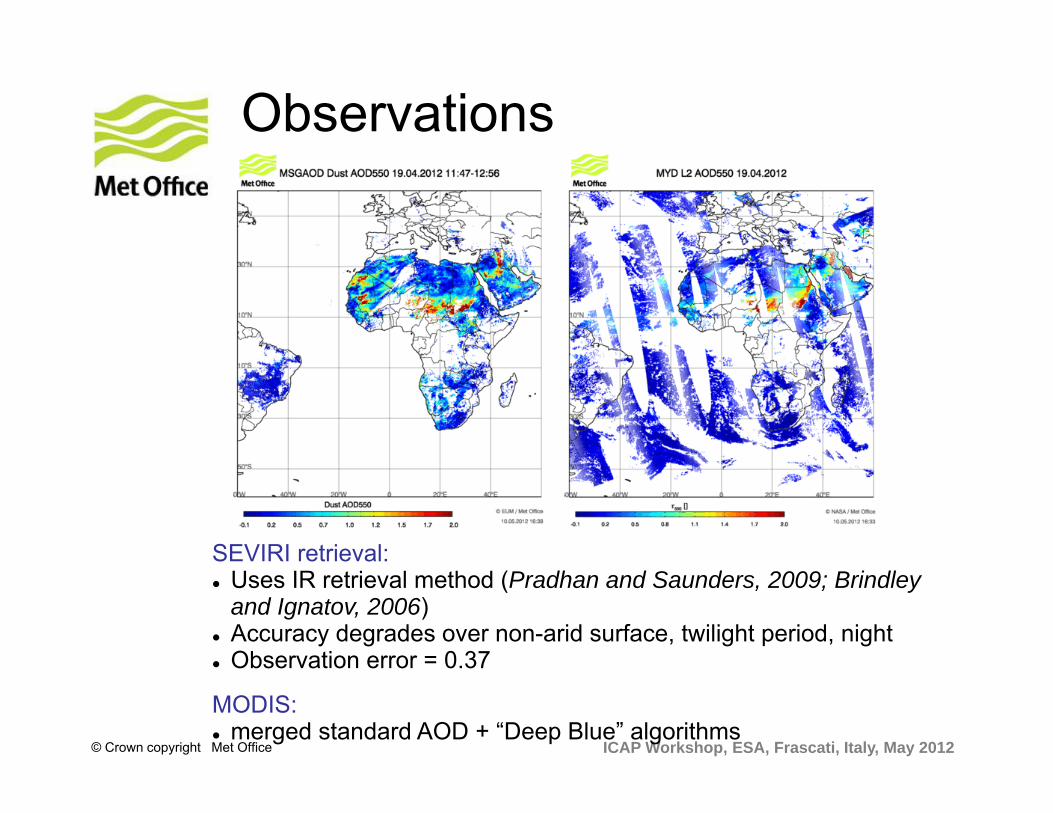
Observations
SEVIRI retrieval: Uses IR retrieval method (Pradhan and Saunders, 2009; Brindley
and Ignatov, 2006) Accuracy degrades over non-arid surface, twilight period, night Observation error = 0.37
MODIS: merged standard AOD + “Deep Blue” algorithms
ICAP Workshop, ESA, Frascati, Italy, May 2012© Crown copyright Met Office
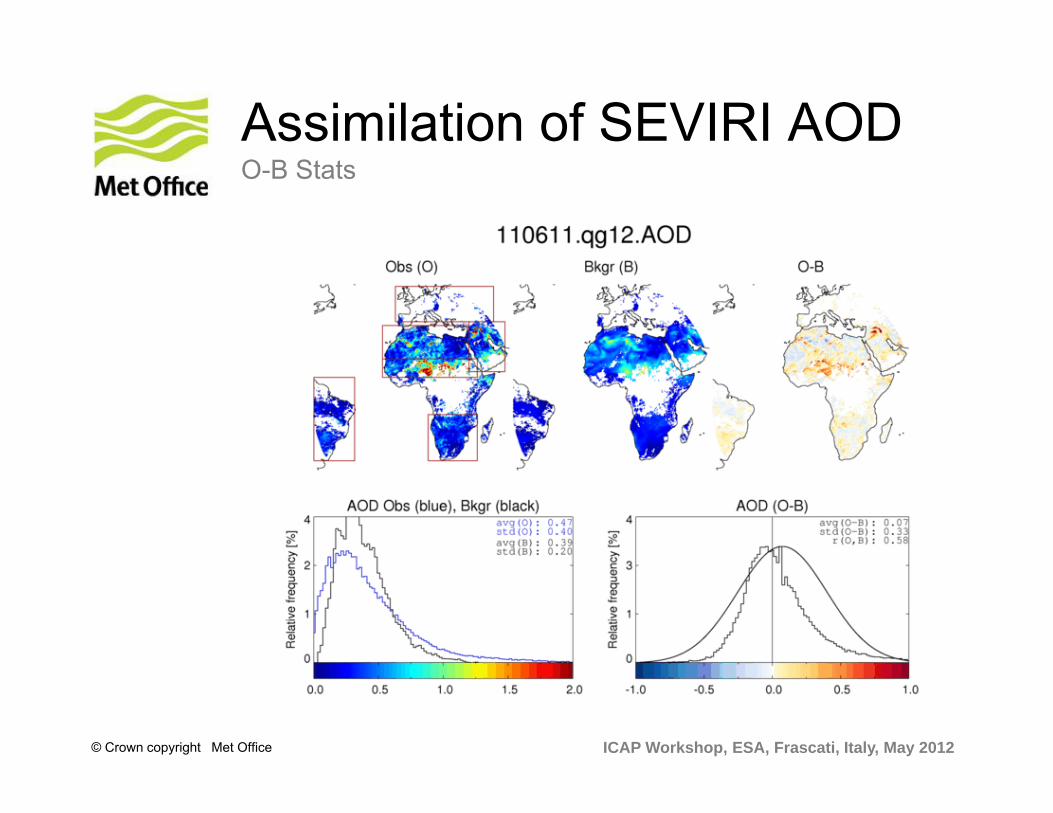
Assimilation of SEVIRI AODO-B Stats
ICAP Workshop, ESA, Frascati, Italy, May 2012© Crown copyright Met Office
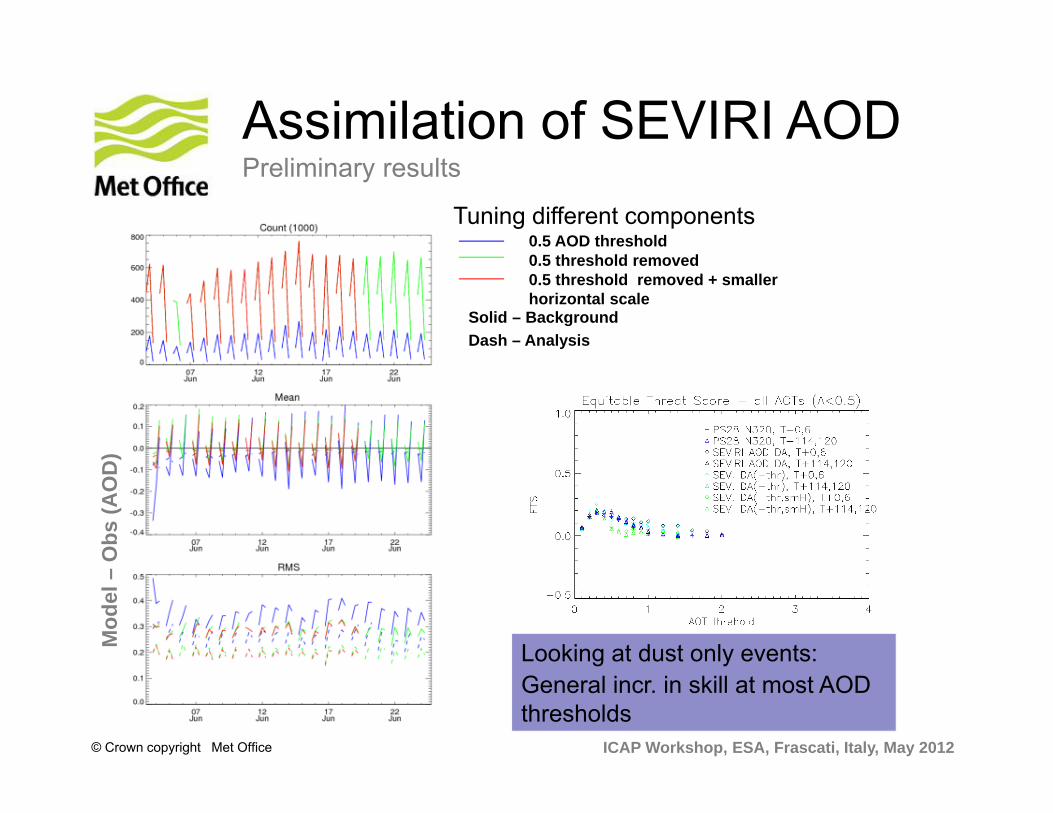
Assimilation of SEVIRI AODPreliminary results
0.5 AOD threshold
0.5 threshold removed + smaller horizontal scale
Solid – BackgroundDash – Analysis
0.5 threshold removed
Looking at dust only events:General incr. in skill at most AOD thresholds
Mod
el –
Obs
(AO
D)
Tuning different components
ICAP Workshop, ESA, Frascati, Italy, May 2012© Crown copyright Met Office
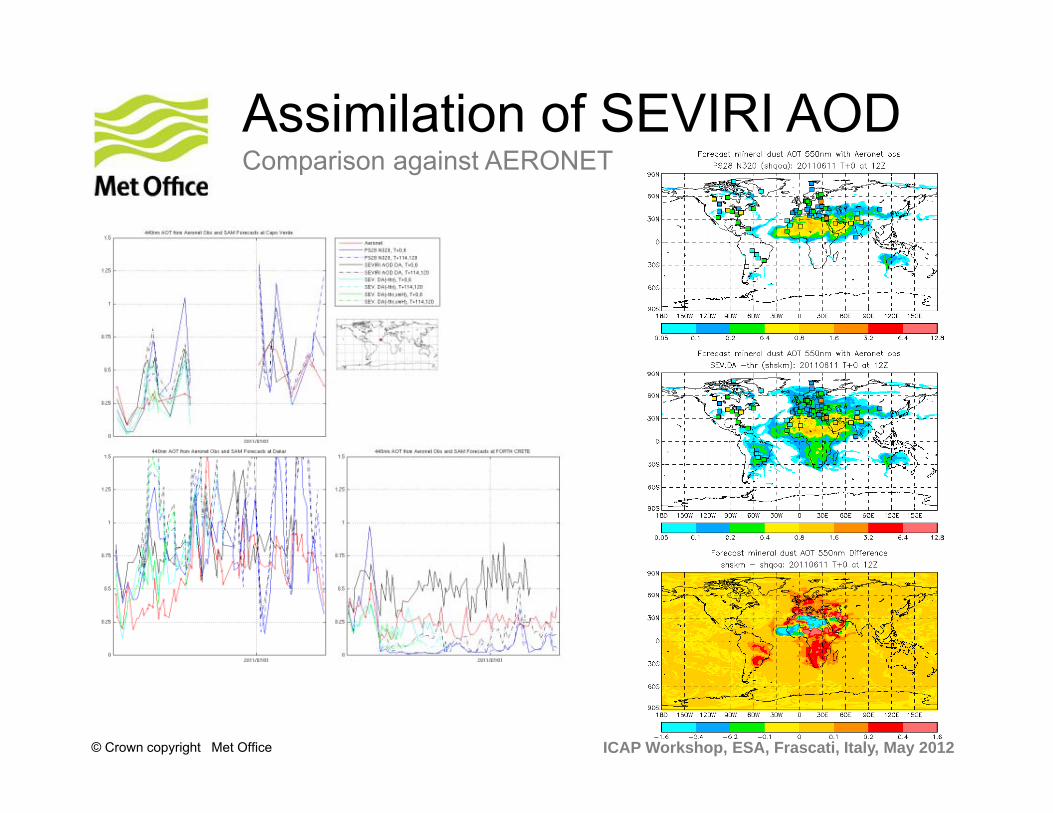
Assimilation of SEVIRI AODComparison against AERONET

© Crown copyright Met Office
Impact of fully prognostic aerosol in NWP forecasts

© Crown copyright Met Office [email protected]
CLASSIC Aerosol SchemeBellouin et al. (2011)
Advection and Deposition schemes
�21 Prognostic
Tracers
Full interaction with model’s
radiation scheme – direct and
indirect effects
Oxidants (climatology)
Sulphate
Mineral Dust
Black Carbon
Biomass Burning
Sea Salt (diagnostic)
OCFF
Biogenic (climatology)
SpeciatedEmissions
ICAP Workshop, ESA, Frascati, Italy, May 2012© Crown copyright Met Office© Crown copyright Met Office
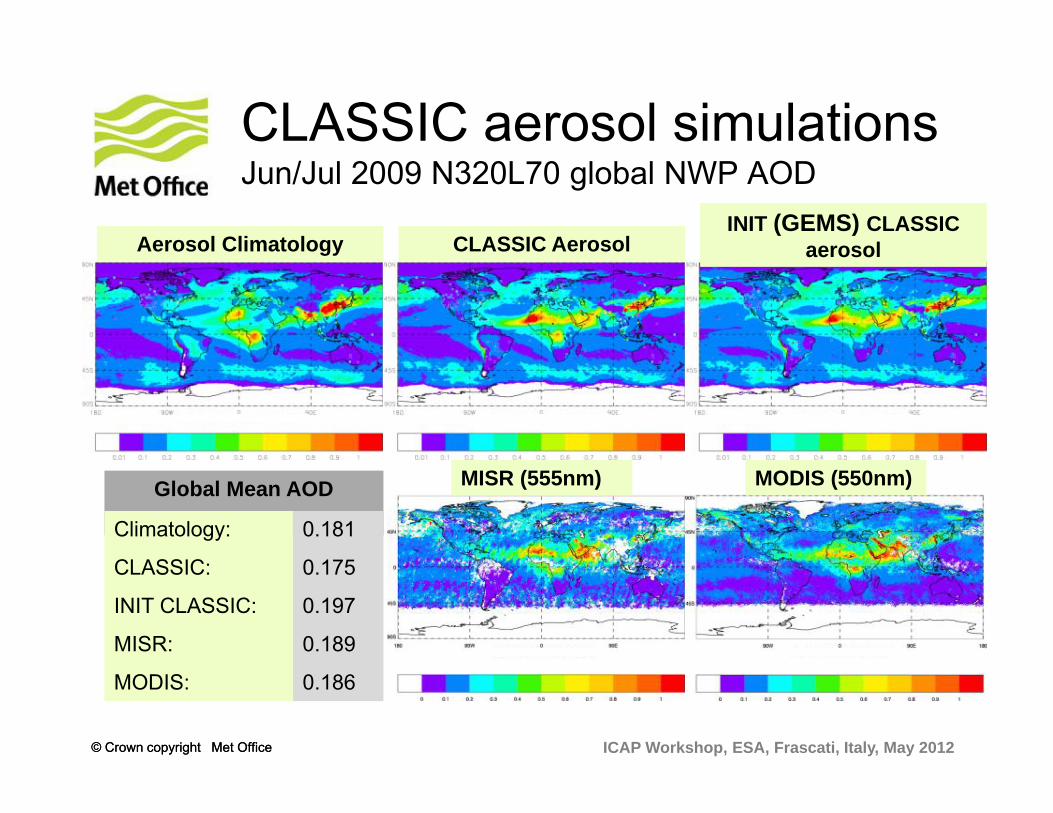
CLASSIC aerosol simulationsJun/Jul 2009 N320L70 global NWP AOD
Aerosol Climatology CLASSIC AerosolINIT (GEMS) CLASSIC
aerosol
MISR (555nm) MODIS (550nm)Global Mean AOD
0.181
0.175
0.197
0.189
0.186
Climatology:
CLASSIC:
INIT CLASSIC:
MISR:
MODIS:
ICAP Workshop, ESA, Frascati, Italy, May 2012© Crown copyright Met OfficeJuly July
© Crown copyright Met Office
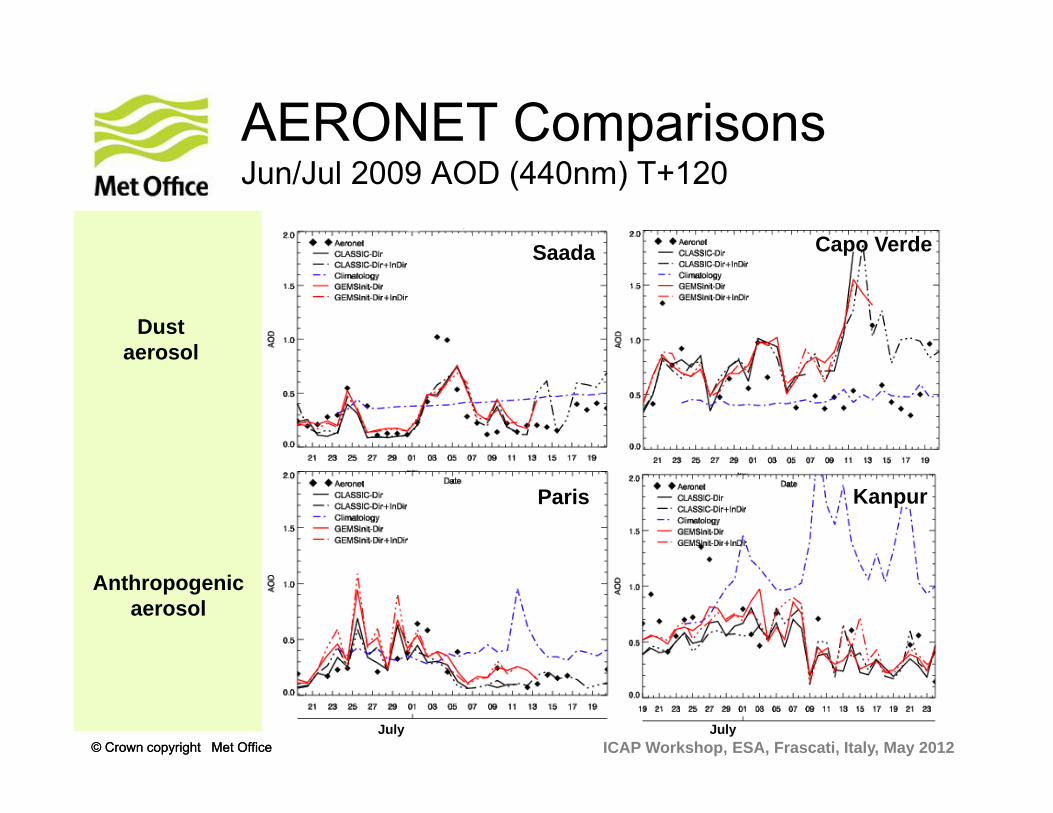
AERONET ComparisonsJun/Jul 2009 AOD (440nm) T+120
Dust aerosol
Anthropogenic aerosol
Saada
Paris
Capo Verde
Kanpur

[email protected]© Crown copyright Met Office© Crown copyright Met Office
Impact on radiation (I)Clear-sky OLR
Mean Error = 0.10 Wm-2 Mean Error = -2.42 Wm-2 Mean Error = -2.75 Wm-2 Mean Error = -1.68 Wm-2
Control Error Climatology ErrorCLASSIC
Aerosol ErrorINIT CLASSIC
Error
Error is calculated relative to FLASHFlux Observations derived from CERES.
[email protected]© Crown copyright Met Office
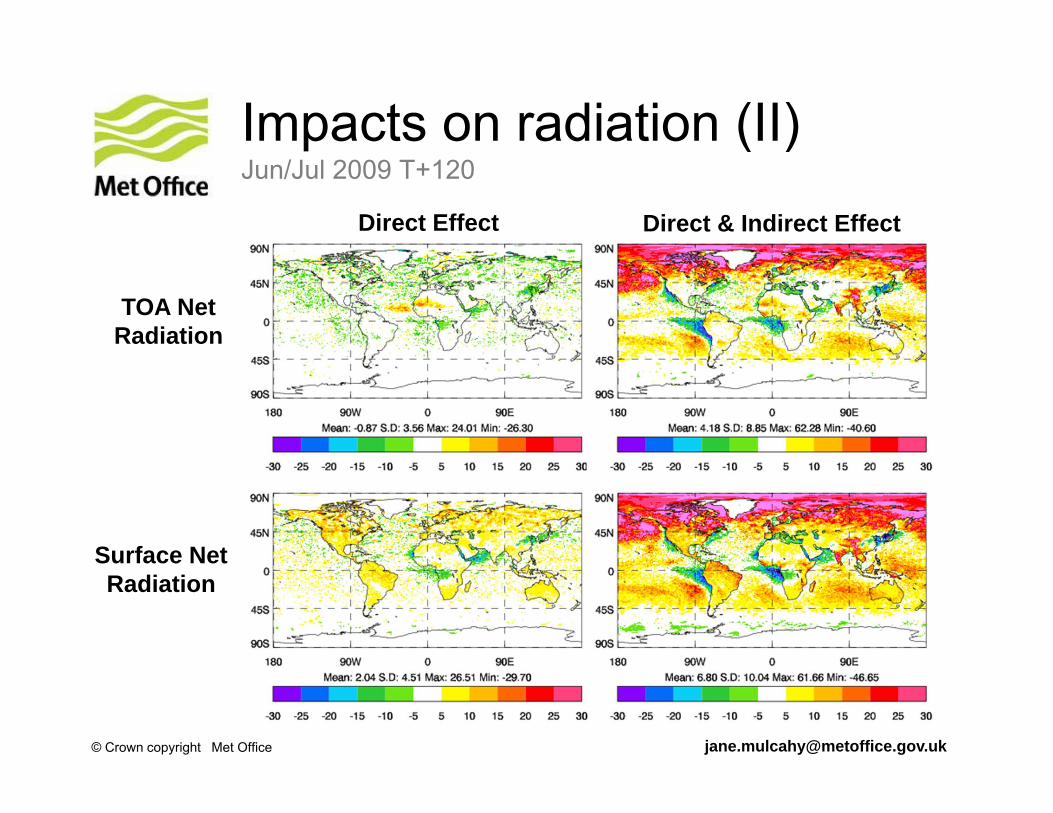
Impacts on radiation (II)Jun/Jul 2009 T+120
TOA Net Radiation
Surface Net Radiation
Direct Effect Direct & Indirect Effect
[email protected]© Crown copyright Met Office
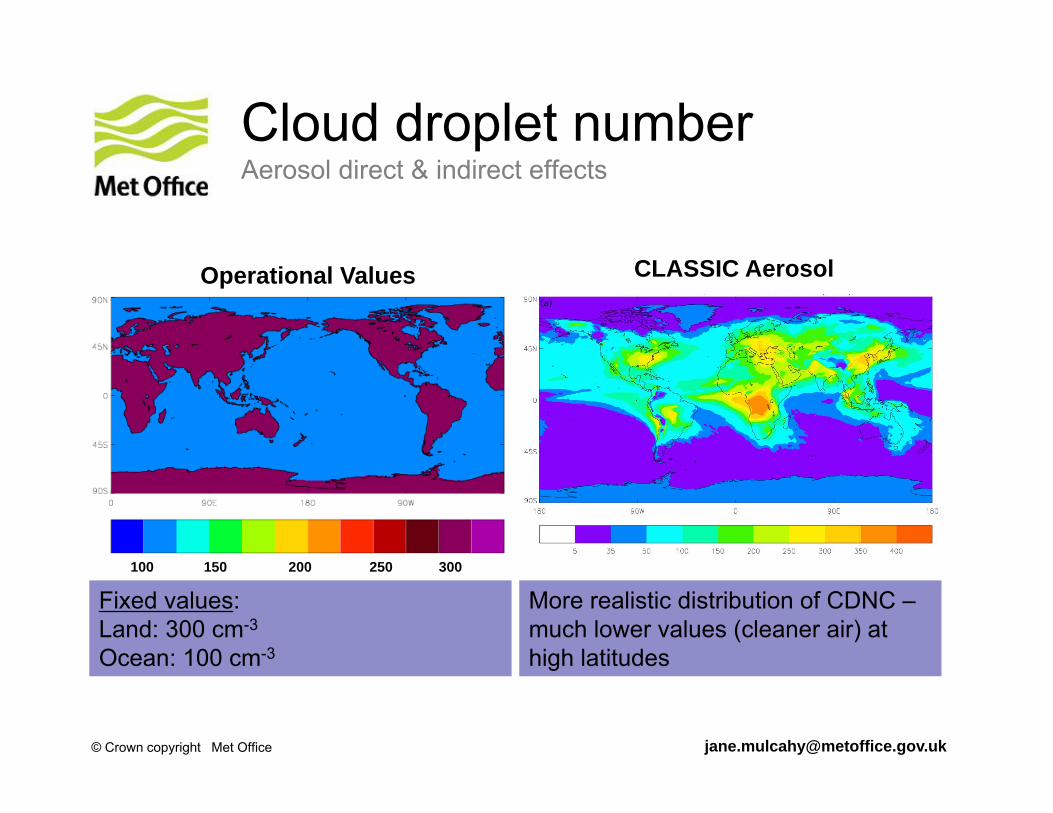
Cloud droplet numberAerosol direct & indirect effects
Operational Values CLASSIC Aerosol
Fixed values:Land: 300 cm-3
Ocean: 100 cm-3
More realistic distribution of CDNC –much lower values (cleaner air) at high latitudes
100 150 200 250 300

ICAP Workshop, ESA, Frascati, Italy, May 2012© Crown copyright Met Office© Crown copyright Met Office
Zonal Temperature T+120Jun/Jul 2009
Control Error (No aerosol) CLASSIC Aerosol – CNTRL
Improvement in NH cold bias and in some regions of SH

[email protected]© Crown copyright Met Office
Impact on monsoon flow850hPa Winds
Direct Effect
InitialisedDirect Effect
Direct & Indirect Effect
InitialisedDirect & Indirect Effect
All figures show Expt - Cntrl


[email protected]© Crown copyright Met Office
Impact of aerosol on SO bias VOCALS: Oct/Nov 2008
CNTRL Albedo Error
Expt Albedo Error
• Significant warming found in the SO
• Increases in bias compared with CERES
• Linked to significant reduction in low level cloud – minimum CDNC values
• Currently evaluating role of sea salt and DMS in this region
Potential CDNC
Expt (aerosol) – Cntrl (no aerosol)
© Crown copyright Met Office
Sensitivity of aerosol deposition schemes to model changes
[email protected]© Crown copyright Met Office
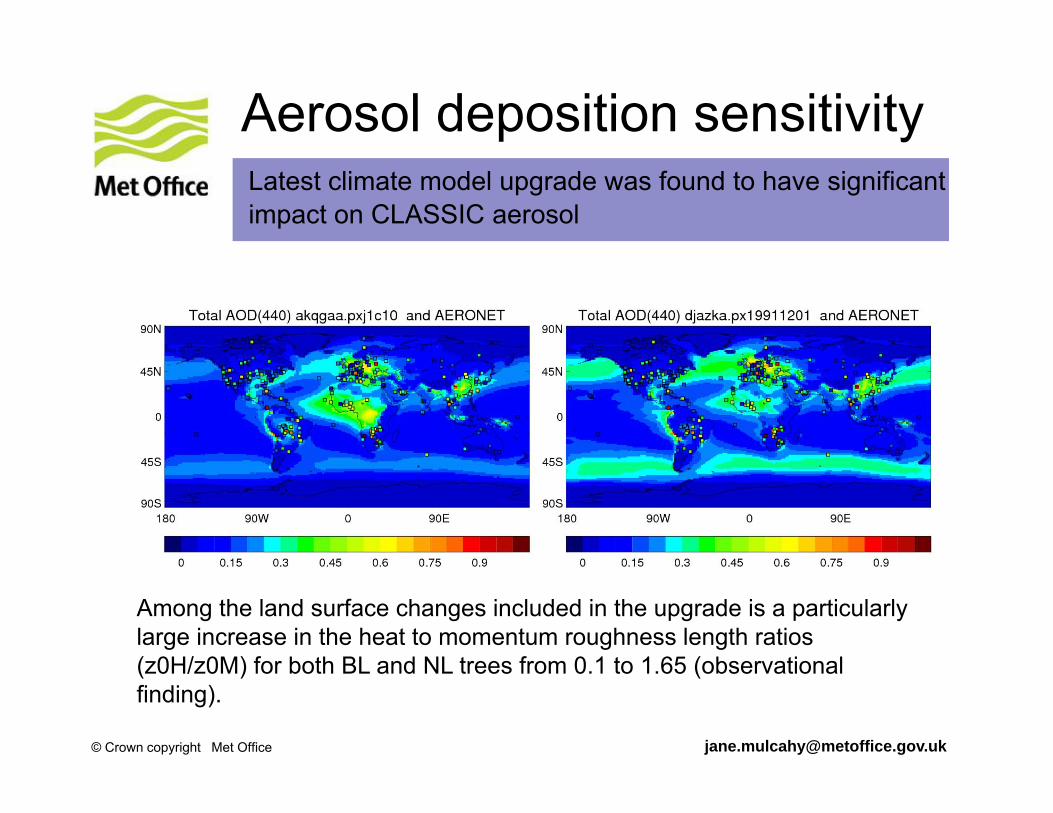
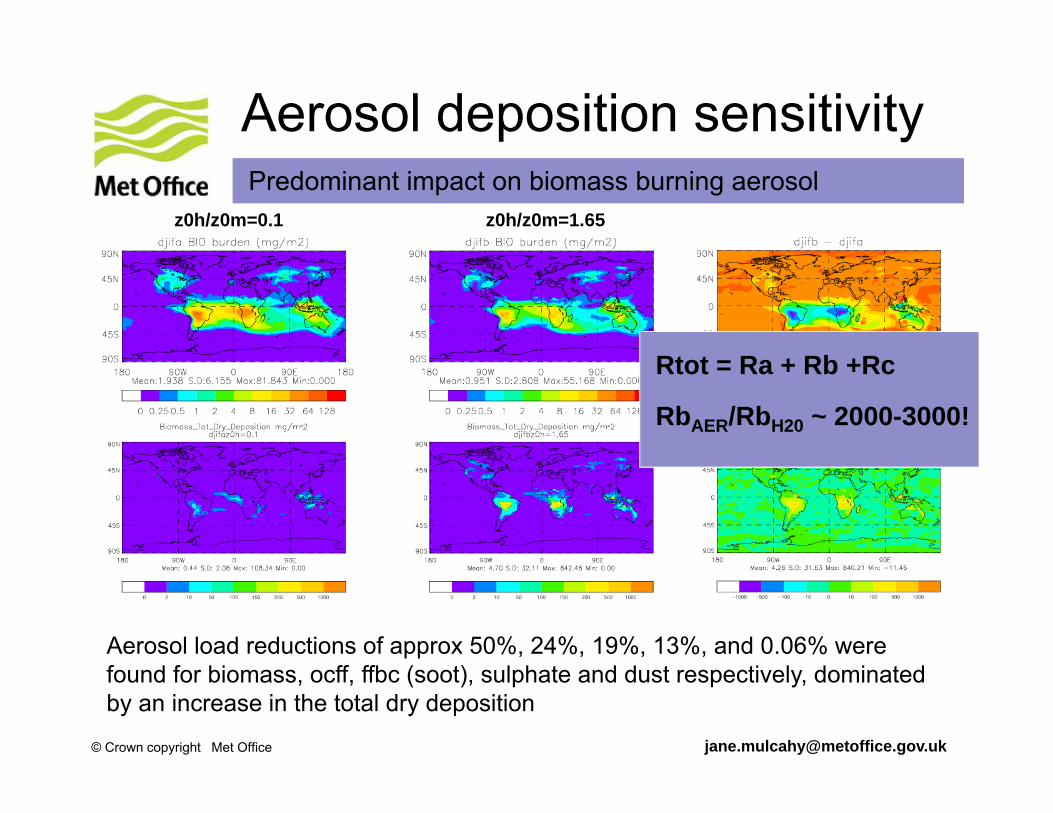
Aerosol deposition sensitivityLatest climate model upgrade was found to have significant impact on CLASSIC aerosol
Among the land surface changes included in the upgrade is a particularly large increase in the heat to momentum roughness length ratios (z0H/z0M) for both BL and NL trees from 0.1 to 1.65 (observational finding).
[email protected]© Crown copyright Met Office
Aerosol deposition sensitivity
Aerosol load reductions of approx 50%, 24%, 19%, 13%, and 0.06% were found for biomass, ocff, ffbc (soot), sulphate and dust respectively, dominated by an increase in the total dry deposition
Predominant impact on biomass burning aerosol
Rtot = Ra + Rb +Rc
RbAER/RbH20 ~ 2000-3000!
z0h/z0m=0.1 z0h/z0m=1.65

© Crown copyright Met Office© Crown copyright Met Office
Conclusions
• New air quality index has led to significant increase in number of exceedances increasing of air quality modelling in the UK.
• AQUM now online model, 5 day forecasts – moving to full UKCA-mode in near future
• Dust now operational in global NWP model - verifying well against observations.
• Further dust developments under way during MACC II project
• Dust DA also progressing with additional observations; move from LAM 3D to global 4D VAR data assimilation. Planned implementation in 2013.
• Direct & indirect impacts of prognostic aerosol in NWP forecasts highlight importance of improved representation at these timescales

© Crown copyright Met Office
Questions and answers
[email protected]© Crown copyright Met Office
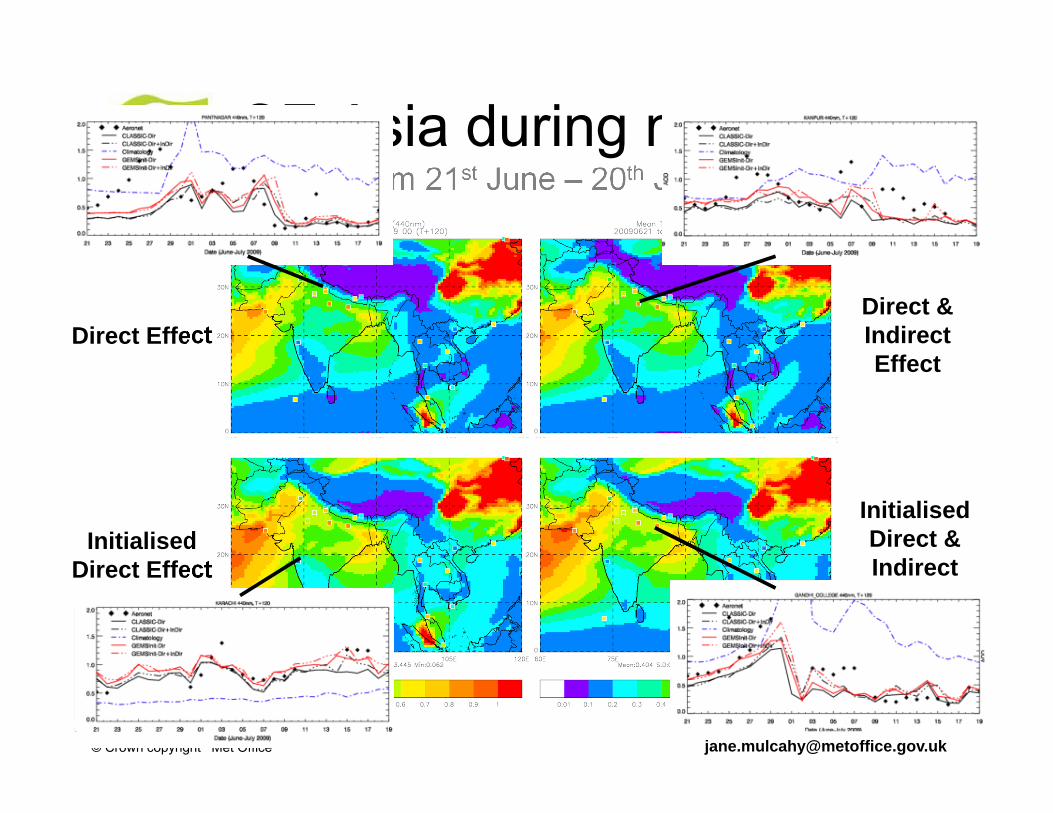
SE Asia during monsoonAOD 440nm 21st June – 20th July 2009
Direct Effect
InitialisedDirect Effect
Direct & Indirect Effect
InitialisedDirect & Indirect Effect
© Crown copyright Met Office
Dust Model DevelopmentsMalcolm Brooks, David Walters
ICAP Workshop, ESA, Frascati, Italy, May 2012© Crown copyright Met Office
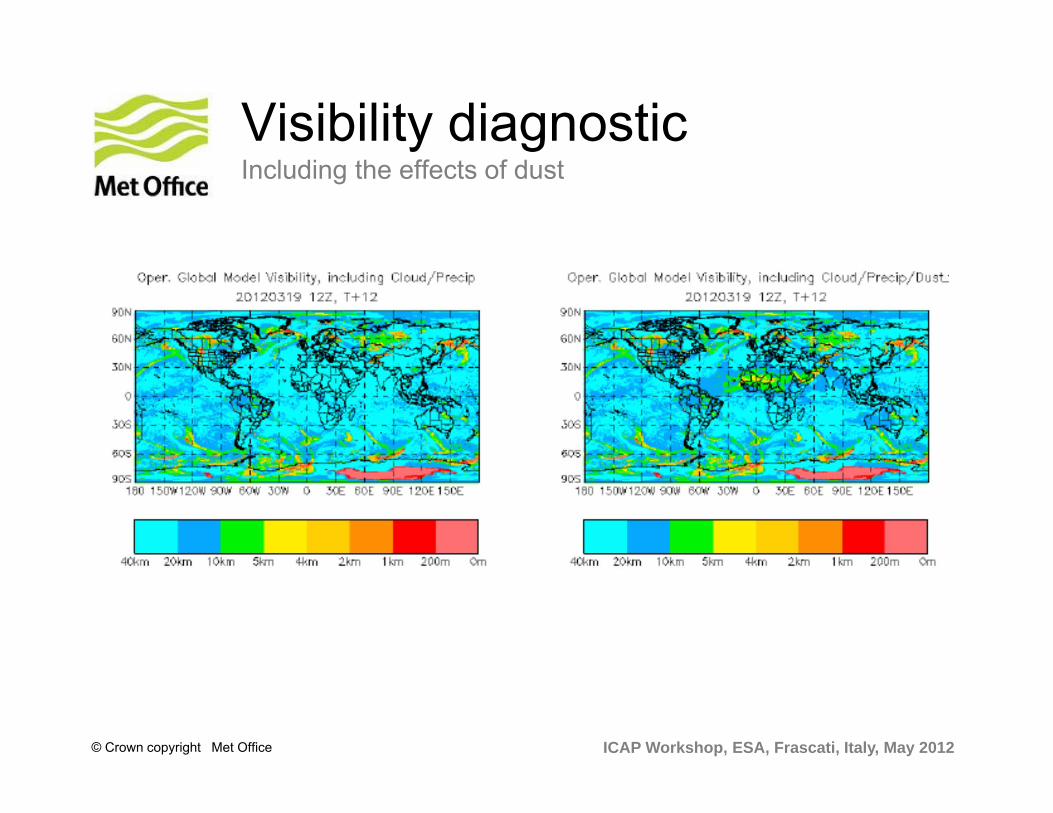
Visibility diagnosticIncluding the effects of dust

© Crown copyright Met Office
Comparison of GERBILCAM emissions with obs:
• During the campaign the N-S dist. of emissions compares well (a vs. c)
• Vegetation in the model makes the N-S dist. constant in the model.
• N-S dist. varies in the obs
• In the real world, dust is emitted where vegetation is seasonal.
Underway: Implementation of seasonal vegetation
Malcolm Brooks

Royal Meteorological Society Meeting, ECMWF, 19th Oct 2011© Crown copyright Met Office
Underway: Implementation of seasonal vegetation Malcolm Brooks
Use the same bare soil fraction for dust emission that is seen in radiation