aerosol meteorology of the maritime continent for the 2012 7seas
TRANSCRIPT
Atmos. Chem. Phys., 16, 14041–14056, 2016www.atmos-chem-phys.net/16/14041/2016/doi:10.5194/acp-16-14041-2016© Author(s) 2016. CC Attribution 3.0 License.
Aerosol meteorology of the Maritime Continent for the2012 7SEAS southwest monsoon intensive study –Part 1: regional-scale phenomenaJeffrey S. Reid1, Peng Xian1, Brent N. Holben2, Edward J. Hyer1, Elizabeth A. Reid1, Santo V. Salinas3,Jianglong Zhang4, James R. Campbell1, Boon Ning Chew5, Robert E. Holz6, Arunas P. Kuciauskas1, Nofel Lagrosas7,Derek J. Posselt8, Charles R. Sampson1, Annette L. Walker1, E. Judd Welton2, and Chidong Zhang9
1Marine Meteorology Division, Naval Research Laboratory, Monterey, CA, USA2NASA Goddard Space Flight Center, Greenbelt, MD, USA3Centre for Remote Imaging Sensing and Processing, National University of Singapore, Singapore4Dept. of Atmospheric Science, University of North Dakota, Grand Forks, ND, USA5Meteorological Service, Singapore6Space Sciences Engineering Center, University of Wisconsin, Madison, WI, USA7Manila Observatory, Manila, Philippines8Jet Propulsion laboratory, Pasadena, CA, USA9NOAA Pacific Marine Environmental Laboratory Seattle, WA, USA
Correspondence to: Jeffrey S. Reid ([email protected])
Received: 11 March 2016 – Published in Atmos. Chem. Phys. Discuss.: 25 April 2016Revised: 2 September 2016 – Accepted: 2 October 2016 – Published: 15 November 2016
Abstract. The largest 7 Southeast Asian Studies (7SEAS)operation period within the Maritime Continent (MC) oc-curred in the August–September 2012 biomass burning sea-son. Included was an enhanced deployment of AerosolRobotic Network (AERONET) sun photometers, multiple li-dars, and field measurements to observe transported smokeand pollution as it left the MC and entered the southwestmonsoon trough. Here we describe the nature of the over-all 2012 southwest monsoon (SWM) and biomass burningseason to give context to the 2012 deployment. The MCin 2012 was in a slightly warm El Niño/Southern Oscilla-tion (ENSO) phase and with spatially typical burning activ-ity. However, overall fire counts for 2012 were 10 % lowerthan the Reid et al. (2012) baseline, with regions of sig-nificant departures from this norm, ranging from southernSumatra (+30 %) to southern Kalimantan (−42 %). Fire ac-tivity and monsoonal flows for the dominant burning regionswere modulated by a series of intraseasonal oscillation events(e.g., Madden–Julian Oscillation, or MJO, and boreal sum-mer intraseasonal oscillation, or BSISO). As is typical, fireactivity systematically progressed eastward over time, start-
ing with central Sumatran fire activity in June related to amoderately strong MJO event which brought drier air fromthe Indian Ocean aloft and enhanced monsoonal flow. Fur-ther burning in Sumatra and Kalimantan Borneo occurred ina series of significant events from early August to a peak inthe first week of October, ending when the monsoon startedto migrate back to its wintertime northeastern flow condi-tions in mid-October. Significant monsoonal enhancementsand flow reversals collinear with tropical cyclone (TC) ac-tivity and easterly waves were also observed. Islands of theeastern MC, including Sulawesi, Java, and Timor, showedless sensitivity to monsoonal variation, with slowly increas-ing fire activity that also peaked in early October but lingeredinto November. Interestingly, even though fire counts weremiddling, resultant AERONET 500 nm aerosol optical thick-ness (AOT) from fire activity was high, with maximums of3.6 and 5.6 in the Sumatra and Kalimantan source regions atthe end of the burning season and an average of ∼ 1. AOTscould also be high at receptor sites, with a mean and max-imum of 0.57 and 1.24 in Singapore and 0.61 and 0.8 inKuching Sarawak. Ultimately, outside of the extreme 2015
Published by Copernicus Publications on behalf of the European Geosciences Union.
14042 J. S. Reid et al.: Aerosol meteorology of the Maritime Continent – Part 1
El Niño event, average AERONET AOT values were higherthan any other time since sites were established. Thus, whilesatellite fire data, models, and AERONET all qualitativelyagree on the nature of smoke production and transport, theMC’s complex environment resulted in clear differences inquantitative interpretation of these datasets.
1 Introduction and background
The Maritime Continent (MC) hosts one of the most com-plicated coupled systems on Earth. The intricate feedbacksbetween tropical meteorology, land surface, and oceans arecomplex and a challenge to understand and simulate. In-deed, early findings of the Coordinated Regional ClimateDownscaling Experiment (CORDEX; http://www.cordex.org/; Giorgi et al., 2012) yielded diverging climate modelsimulations for the Southeast Asian region. Strong biases intemperature and large uncertainties in precipitation estimateshave been diagnosed (Jamandre and Narisma, 2013). Atmo-spheric models have difficulty representing complex tropi-cal waves in the MC on scales ranging from Kelvin wavesthrough the Madden–Julian Oscillation (MJO) and the re-gional monsoon (e.g., Misra and Li, 2014; Zhang, 2014).Owing to its dependence on meteorology, the MC’s aerosolsystem is likewise complex, with the added challenge of per-sistent high clouds obscuring satellite remote sensing obser-vations of aerosol life cycle (Reid et al., 2013; Campbell etal., 2016). Field measurements in the MC are difficult to ob-tain in this part of the globe and likewise to quality assure in acomplex sampling environment. Ultimately, the high degreeof variability in the MC’s aerosol environment poses greatobservational and modeling challenges for determining howaerosol particles, weather, and climate relate.
Given the above research challenges inherent in the MC’senvironment, the 7 Southeast Asian Studies (7SEAS) pro-gram was motivated to improve the ability of the communityto observe and analyze aerosol and meteorology interactionsin the region (e.g., Reid et al., 2012, 2013; Lin et al., 2013).The role of El Niño/Southern Oscillation (ENSO) in regionaldrought and subsequent feedback into biomass burning haslong been a focus of the aerosol community’s efforts forthe MC’s aerosol environment (e.g., Nichol, 1998; Field andShen, 2008). However, while ENSO is clearly a strong inter-seasonal modulator of burning activity, biomass burning isimportant in all years (Reid et al., 2012). Further, if we wishto understand how aerosol particles, weather, and climate in-teract, much finer-scale phenomena than ENSO require in-vestigation. The aerosol system is of course dependent onmeteorology, and this meteorology is defined by the compli-cated interplay between such phenomena as the MJO and/orboreal summer intraseasonal oscillation (BSISO), equatorialwaves, tropical cyclones (TCs), and even features as fine asboundary layer dynamics and land–sea breezes (e.g., Reid et
al., 2012, 2015; Atwood et al., 2013; Campbell et al., 2013;Guo et al., 2013; Wang et al., 2013; Xian et al., 2013; Ge etal., 2014). At the same time, to infer aerosol impacts on radi-ation, clouds, and climate, meteorological context in relationto these phenomena must be taken into account.
7SEAS has worked to encourage networks and intensivemeasurements throughout Southeast Asia and integrate thesemeasurements into conceptual and numerical models of theaerosol system. Although all seasons and regions throughoutSoutheast Asia are of interest to the 7SEAS program, withinthe MC, 7SEAS field measurements and life cycle studieshave focused on the southwest monsoon (SWM) biomassburning season in Indonesia and Malaysia, with Singaporeand the Philippines as key receptor sites (e.g., Reid et al.,2012, 2015; Atwood et al., 2013; Chew et al., 2011, 2013;Salinas et al., 2013; Xian et al., 2013; Wang et al., 2013;Yang et al., 2013). The year 2012 was a high water markfor 7SEAS efforts in the MC, with over 15 Aerosol RoboticNetwork (AERONET; Holben et al., 1998) sun photome-ters and five Micro-Pulse Lidar Network (MPLNET) lidarson station. Additional intensive measurements were made inSingapore, as well as on a vessel stationed in the PalawanArchipelago as a receptor. Taken together, these sites pro-vided some of the first measurements of natural, industrial,and biomass-burning-influenced air masses that transited theSouth China and Sulu seas on their way into the SWM trough(Atwood et al., 2016; Reid et al., 2016).
To support the 2012 7SEAS MC effort, and in partic-ular the Palawan research cruise, this paper is the first oftwo that present an analysis of the many scale dependen-cies of the MC’s aerosol meteorology. The focus of Part Iis the regional-scale phenomena, such as ENSO, MJO, mon-soon enhancements, and TCs, and how they relate to biomassburning activity and transport. Our purpose is to give contextto the 2012 effort, examine how 2012 compares to other sea-sons in regard to overall fire and monsoonal activity, and tryto provide an overall narrative to 2012 aerosol meteorology.With the benefit of the research vessel observations from the2012 deployment, we leave results related to finer-scale phe-nomena such as squall lines and sea breeze fronts to Part 2 ofthis pair of papers (Reid et al., 2016).
2 Analysis data
The SWM burning season generally runs from June throughOctober (Reid et al., 2012), with a peak in September andOctober. The core 2012 7SEAS study period was Augustthrough September 2012 and is the focus here. Data forthese analyses come from three categories: observationsincluding surface-based aerosol optical thickness (AOT)from AERONET, thermodynamic structure from radioson-des, satellite-based remote sensing including Moderate-resolution Imaging Spectrometer (MODIS) AOT and activefire hotspots, as well as multi-sensor precipitation; and mod-
Atmos. Chem. Phys., 16, 14041–14056, 2016 www.atmos-chem-phys.net/16/14041/2016/
J. S. Reid et al.: Aerosol meteorology of the Maritime Continent – Part 1 14043
a. b.
c. f.
d..
e..
g.
h.
MTSAT Aug. 16, 2012 4:32 Z
i.
0o
10o
-10o
20o
110o100o 120o
SouthSouth
China China
SeaSea
Celebes Celebes
SeaSea
Sulu Sulu
SeaSea
Sumatra
Kalimantan
Sarawak
Sabah
Malay
Malay
Penninsula
Penninsula
Borneo
MindinaoMindinao
SulawesiSulawesi
Java
Timor
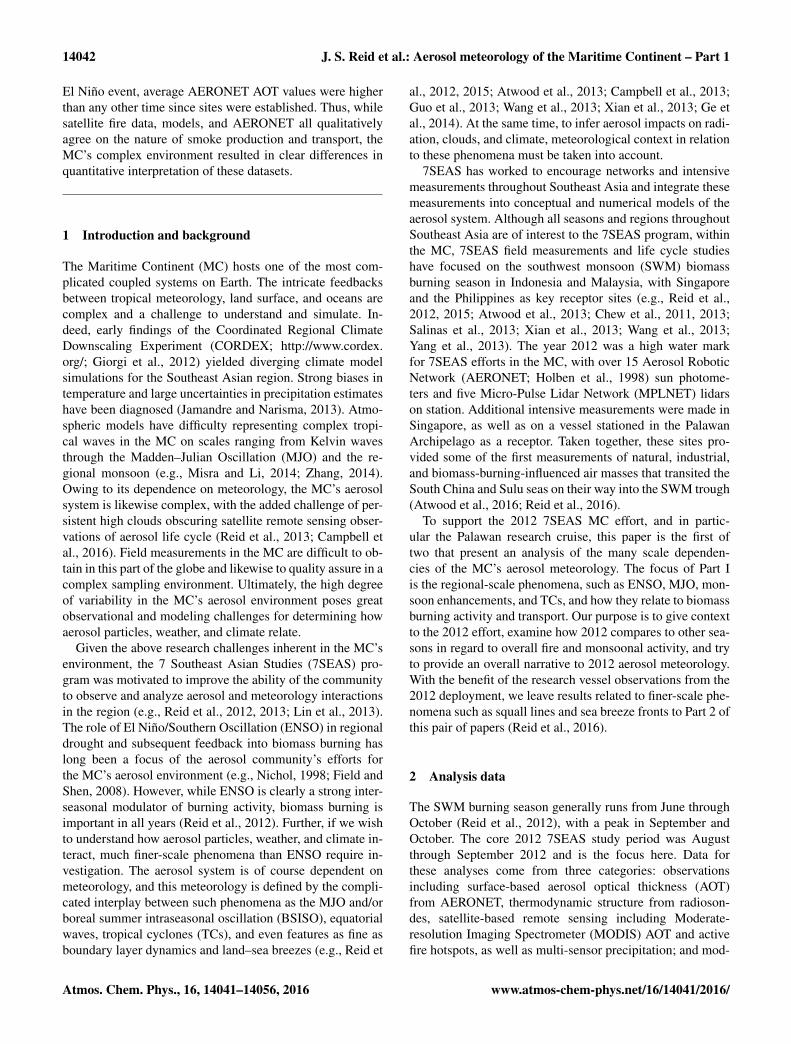
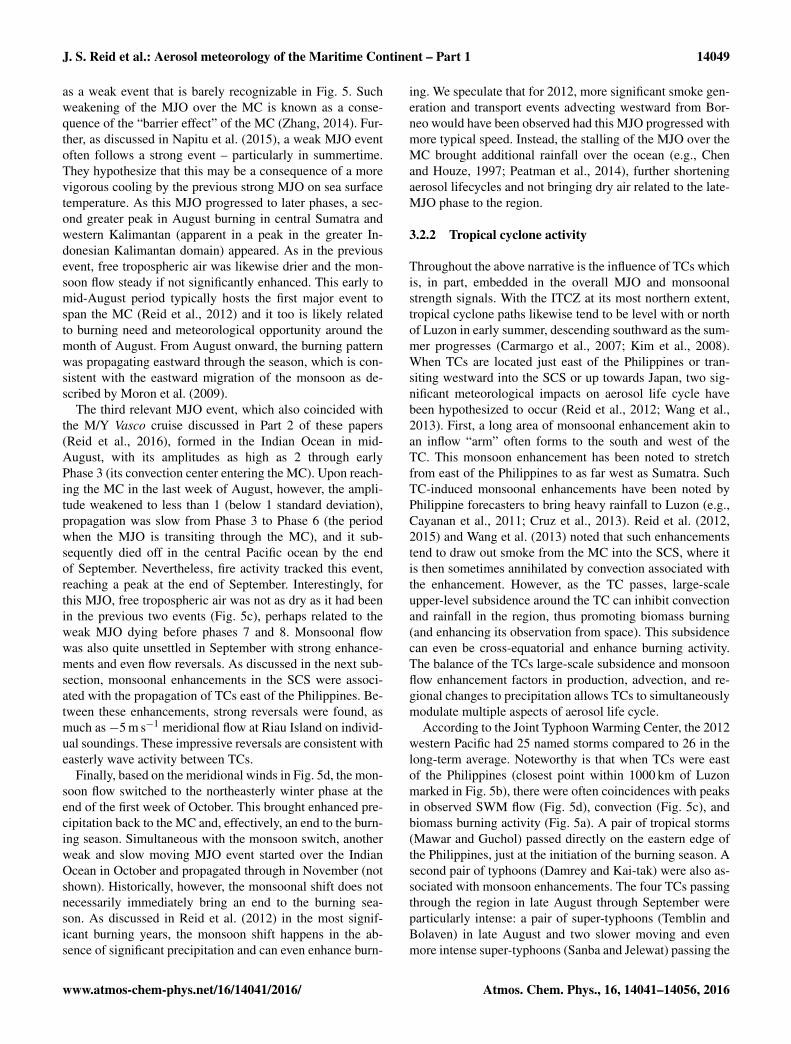
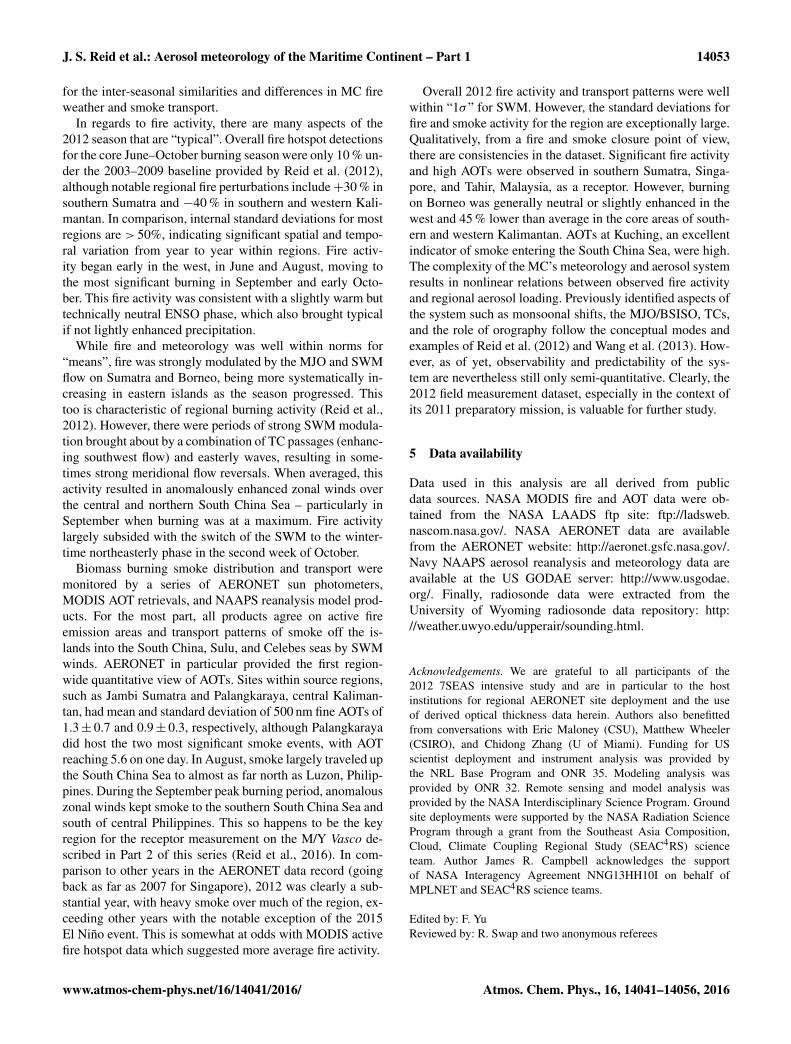
Figure 1. Map of network sites for the 2012 7SEAS southwest mon-soon intensive. Included are AERONET sites used in this analysis(yellow circles), other AERONET sites (dashed yellow circles), andMPLNET sites (red stars). Sites are (a) Jambi; (b) Palangkaraya;(c) Singapore; (d) Tahir; (e) Pontianak; (f) Kuching; (g) Notre Dameof Marbel University, Mindanao; and (h) Nha Trang. Also markedis the Riau Island radiosonde site (blue circle, i).
eling based on global US Navy meteorology and aerosol sys-tems. All of the products used are considered operational andthus are only briefly outlined here.
2.1 Observations
The maximum extent of 7SEAS aerosol observationsthroughout the MC occurred during the 2012 SWM sea-son. Specifically relevant to the analysis of 2012, over 15AERONET sun photometers were in operation, with startdates from mid- to late July through October. Of these, eightwere of particular use for evaluating the biomass burning sea-son. Locations are displayed in Fig. 1, overlaid on an MT-SAT false color image for 16 August 2012, representative ofone of the clearer periods during the biomass burning. Iden-tified are AERONET sites (circles) for the following sites:(a) Jambi, Sumatra, and (b) Palangkaraya, southern Kaliman-tan in the core biomass burning source regions of Indonesia;(c) Singapore; (d) Tahir, Malay Peninsula, Malaysia; (e) Pon-tianak, western Kalimantan, and (f) Kuching, Sarawak, askey coastal exit sites; and (g) Notre Dame of Marbel Uni-versity, Mindanao, and (h) Nha Trang, Vietnam, as outerboundaries and receptors. While there are many other sites inthe region, they are not used here because of excessive highcloud cover or instrumentation failure (these are marked asdashed circles). Although not analyzed here, for complete-ness MPLNET sites are marked (stars).
To track overall smoke or pollution transport, we utilizethe AERONET operational 500 nm daily averaged fine-mode
AOT derived from Level 2.0 Spectral Deconvolution Algo-rithm (SDA) Version 4.1 (O’Neill et al., 2003). Use of theSDA to separate fine- and coarse-mode extinction or opti-cal depth has been verified (Kaku et al., 2014). SDA is par-ticularly beneficial as it allows us to track fine-mode parti-cles, such as from biomass burning or anthropogenic sources,while at the same time removing the influence of thin cirruscontamination, which can be large in this region (Chew etal., 2011). Given the wavelength dependencies for biomassburning particles in the region, 500 nm AOT is approximately10–15 % higher than 550 nm AOT used in MODIS.
A second dataset used here is the radiosonde releases atRiau Island north of Borneo (Fig. 1 – location i) to gaugethe strength of the SWM. Data used here were hand evalu-ated to remove clear reporting errors. Most importantly, weemployed the 925 hPa meridional wind to track monsoonalstrength and transition. This metric was used in overarchingfire meteorology analyses of Reid et al. (2012) as suggestedin the monsoonal analysis paper of Lu and Chan (1999). Alsofrom this Riau Island radiosonde site we used the 700 hPa rel-ative humidity field. As discussed in Reid et al. (2015), thismetric is indicative of the advection of drier air from the In-dian Ocean that has a tendency to cap regional convection.In practice we have found this metric in particular to be agood predictor of convection (moist convection is more con-vectively active; dry convection is suppressed). To smoothtransients, a 3-day boxcar average was applied. Also, for TCfixes and intensities we utilized the Joint Typhoon WarningCenter best track and statistics from the Automated Tropi-cal Cyclone Forecast system (ATCF; Sampson and Schrader,2000).
2.2 Satellite data
For satellite monitoring of biomass burning, MODIS activefire hotspot analysis was utilized, integrated in the analysisstructure of Reid et al. (2012, 2015), with context as laidout in Hyer et al. (2013). In addition to fire we also utilizedNASA MODIS Collection 6 Level 3 data from monitoringAOT (Levy et al., 2013). As discussed in Reid et al. (2013),all satellite aerosol products suffer from a host of cloud con-tamination and sampling issues. For evaluating aerosol trans-port extent, Terra MODIS is preferable due to the generallylower fractions of cloud cover in the AM orbit. This said, thecurrent version of Terra MODIS AOT also suffers from in-strument and calibration issues. Hence, we only use the datain a semi-quantitative manner.
Other various datasets are also used, including geosta-tionary MTSAT satellite products as found on the NEXSATwebsite, which were examined for the study period to helpprovide context to day-to-day variability in meteorology(visible, infrared, cloud heights, scatterometer, etc.; Milleret al., 2006; http://www.nrlmry.navy.mil/nexsat-bin/nexsat.cgi). Daily precipitation was monitored using Climate Pre-
www.atmos-chem-phys.net/16/14041/2016/ Atmos. Chem. Phys., 16, 14041–14056, 2016
14044 J. S. Reid et al.: Aerosol meteorology of the Maritime Continent – Part 1
diction Center (CPC) MORPHing product (CMORPH; Joyceet al., 2004).
2.3 Model data
Model data are used to provide a larger contextual under-standing of the regional metrological and aerosol environ-ment. To be consistent with the analyses of Reid et al. (2012,2013, 2015), the Navy Global Atmospheric Prediction Sys-tem (NOGAPS; Hogan and Rosmond, 1991) is used to pro-vide baseline meteorological data for analyses as well as todrive offline Navy Aerosol Analysis and Prediction System(NAAPS) aerosol simulations. While NOGAPS horizontalresolution is ∼ 0.5◦ in this region, spectral files were trun-cated to 1◦× 1◦ for modeling aerosol transport for this sea-son in a configuration consistent with the NAAPS reanalysis(Lynch et al., 2016). In NAAPS, four species are simulated:dust, biomass burning smoke, fine anthropogenic/biogenic,and sea salt. In the reanalysis configuration, smoke fluxesare driven from the MODIS smoke source function drawnfrom a MODIS-only version of the Fire Locating and Mon-itoring of Burning Emissions (FLAMBE; Reid et al., 2009).To improve wet deposition, CMORPH precipitation is usedto constrain scavenging Xian et al. (2009). Data assimilationincludes MODIS AOT and MISR (Zhang et al., 2008), al-though there are few data-assimilation-grade AOT retrievalsin this part of the world. Nevertheless, NAAPS capability forsmoke characterization in the Maritime Continent region hasbeen demonstrated (e.g., Hyer and Chew, 2010; Reid et al.,2012, 2015; Xian et al., 2013) and has been further improvedupon in the reanalysis version used here. For this overviewpaper, we simply utilize fine NOGAPS winds and AOT anal-yses to map smoke, transport, and pollution extent.
3 Results
For the analysis of the regional meteorology in the 2012burning season, we break the problem down into a numberof subsections. First, we describe the overall fire and mon-soonal activity for 2012 (Sect. 3.1). Second, we examine thetime series of fire activity and monsoonal meteorology forthe 2012 monsoon season (Sect. 3.2). Finally, we examinethe variability in AOT throughout the region to assess overallsmoke patterns and transport behavior (Sect. 3.3).
3.1 Overall fire and monsoon characteristics
The SWM in the South China Sea (SCS) typically starts inlate April to early May, with flow reversal to northeast mon-soon in mid-October (Lu and Chan 1999; Chang et al., 2005;Moron et al., 2009; Reid et al., 2012). Thus, climatologically,the SWM is in full existence from June through September.In regards to precipitation, drier periods in the MC start inSumatra and propagate eastward over time (Moron et al.,2009). Based on MODIS active fire hotspot data, and as dis-
0
32
8
2
MO
DIS
fire
dete
ctio
ns p
er 1
000
km 2 MODIS fire hotspot prevalence
June–Oct MODIS, 2012
4
16
64
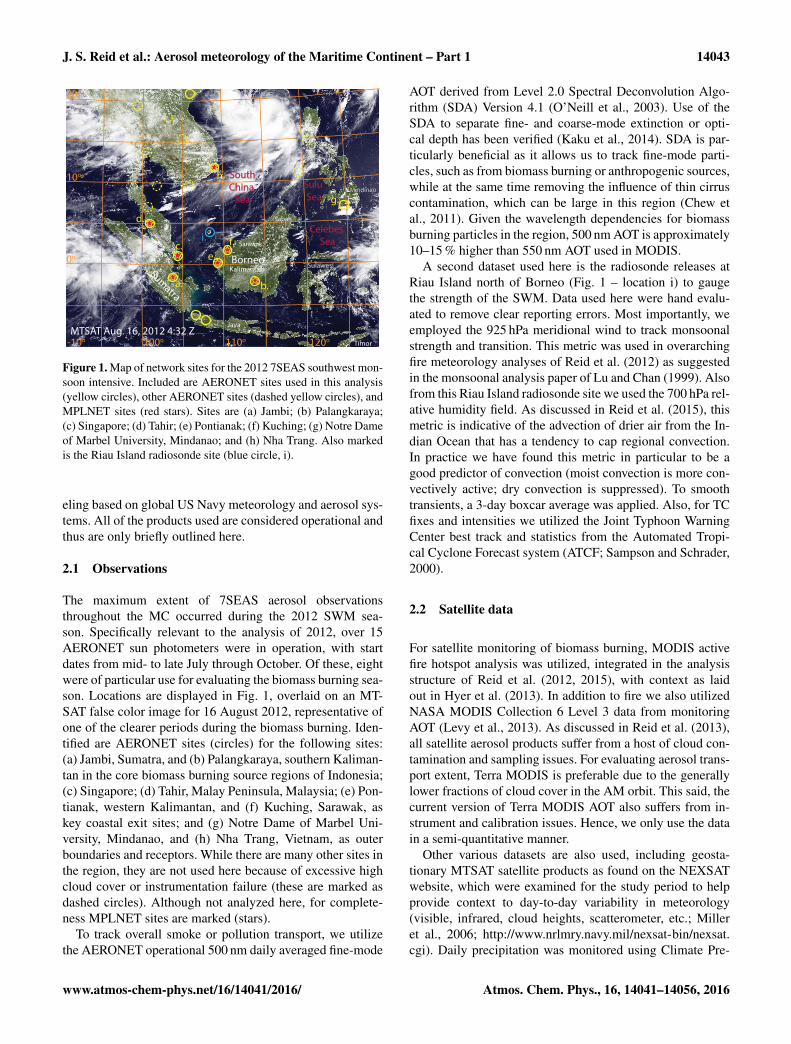
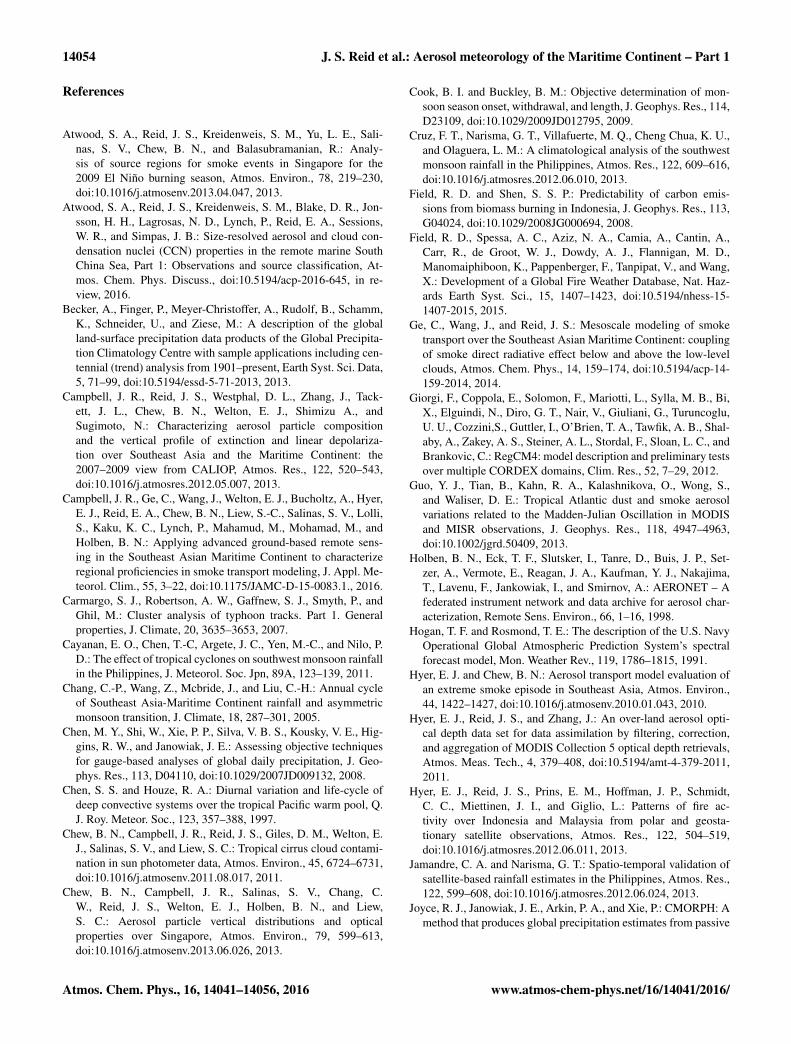
Figure 2. Overall Terra and Aqua MODIS detected fire prevalencefor June through October 2012.
cussed in the time series analysis in Sect. 3.2, the first sig-nificant fire events did not begin until June, with region-wideinitiation not beginning until August, which is typical for theregion (Reid et al., 2012). Fire activity largely diminisheswith the monsoon reversal in early October, with lingeringfire activity in the eastern MC lasting through October. Herewe will briefly review these features.
3.1.1 Overall fire activity
Figure 2 presents an overall fire prevalence map constructedfrom combined Terra and Aqua MODIS active fire hotspotdetections for 1 June through 31 October 2012. Fire countsby island, region, or province as defined in the 2003–2009baseline paper of Reid et al. (2012) are provided in Table 1.Overall fire patterns and activity are highly correlated withthe spatial map fire count baseline of Reid et al. (2012). Al-though there is some fire activity over the entire domain,the most significant areas of activity include central Suma-tra (9135 fires), southern Sumatra (12 241 fires), and south-ern Kalimantan (8120 fires). For 2012 the June–Novemberprimary burning season accounted for 99 % of these fires, al-though local but significant fire outbreaks occurred all yearround. Other significant burning includes eastern and west-ern Kalimantan at 1571 and 5721 fires each. Islands such asJava and Timor can also have significant fire prevalence.
From Table 1, overall MC fire counts from MODIS for2012 were 12 % lower than the 2003–2009 baseline. Giventhe complexities of fire observation and the significant in-terannual standard deviations of fire prevalence in the re-gion (generally > 50 %; Reid et al., 2012), we consider thisan overall “average” fire season. The most notable enhance-ments from the norm was in southern Sumatra and west-ern Kalimantan with a 30 % enhancement. Rates in the fire-prone eastern and southern Kalimantan were markedly downin 2012, by roughly 40 %.
The MODIS fire data suggest that 95 % of fire activitywas in the June–October burning season and roughly 1 cu-mulative standard deviation of the fire activity on Sumatraand Borneo occurred in August and September in particular(Table 1). This period was at the core of the SWM periodand also corresponded to the peak of the field activity. For
Atmos. Chem. Phys., 16, 14041–14056, 2016 www.atmos-chem-phys.net/16/14041/2016/
J. S. Reid et al.: Aerosol meteorology of the Maritime Continent – Part 1 14045
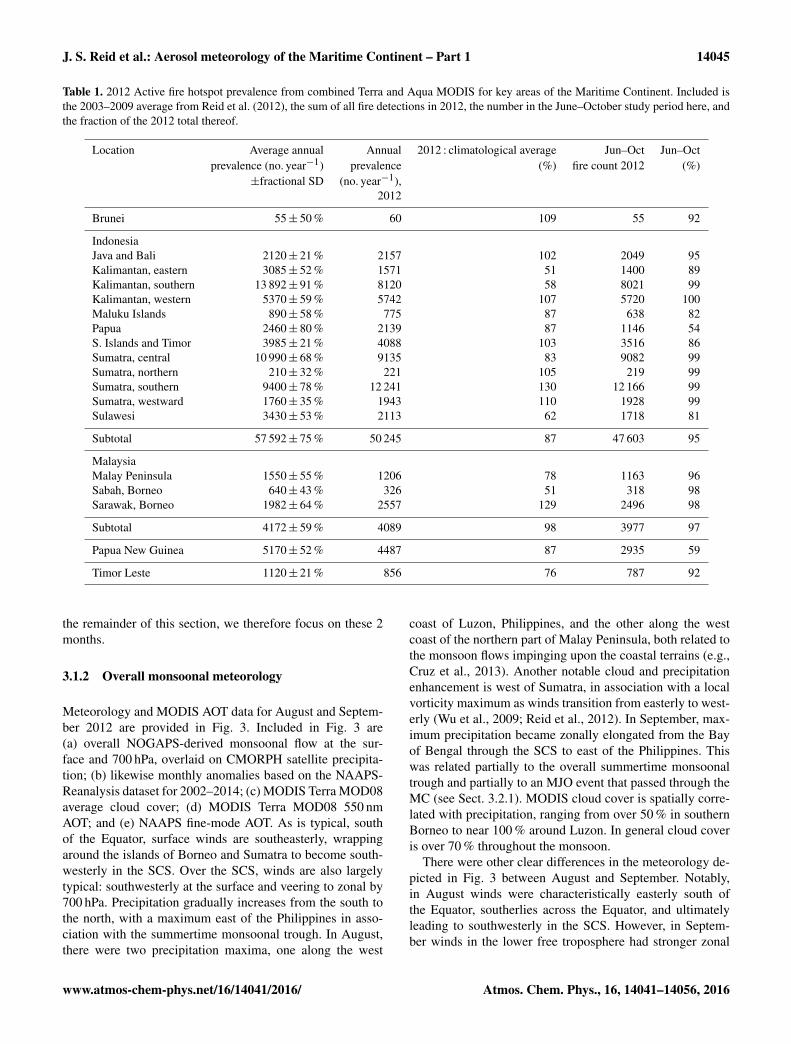
Table 1. 2012 Active fire hotspot prevalence from combined Terra and Aqua MODIS for key areas of the Maritime Continent. Included isthe 2003–2009 average from Reid et al. (2012), the sum of all fire detections in 2012, the number in the June–October study period here, andthe fraction of the 2012 total thereof.
Location Average annual Annual 2012 : climatological average Jun–Oct Jun–Octprevalence (no. year−1) prevalence (%) fire count 2012 (%)
±fractional SD (no. year−1),2012
Brunei 55± 50 % 60 109 55 92
IndonesiaJava and Bali 2120± 21 % 2157 102 2049 95Kalimantan, eastern 3085± 52 % 1571 51 1400 89Kalimantan, southern 13 892± 91 % 8120 58 8021 99Kalimantan, western 5370± 59 % 5742 107 5720 100Maluku Islands 890± 58 % 775 87 638 82Papua 2460± 80 % 2139 87 1146 54S. Islands and Timor 3985± 21 % 4088 103 3516 86Sumatra, central 10 990± 68 % 9135 83 9082 99Sumatra, northern 210± 32 % 221 105 219 99Sumatra, southern 9400± 78 % 12 241 130 12 166 99Sumatra, westward 1760± 35 % 1943 110 1928 99Sulawesi 3430± 53 % 2113 62 1718 81
Subtotal 57 592± 75 % 50 245 87 47 603 95
MalaysiaMalay Peninsula 1550± 55 % 1206 78 1163 96Sabah, Borneo 640± 43 % 326 51 318 98Sarawak, Borneo 1982± 64 % 2557 129 2496 98
Subtotal 4172± 59 % 4089 98 3977 97
Papua New Guinea 5170± 52 % 4487 87 2935 59
Timor Leste 1120± 21 % 856 76 787 92
the remainder of this section, we therefore focus on these 2months.
3.1.2 Overall monsoonal meteorology
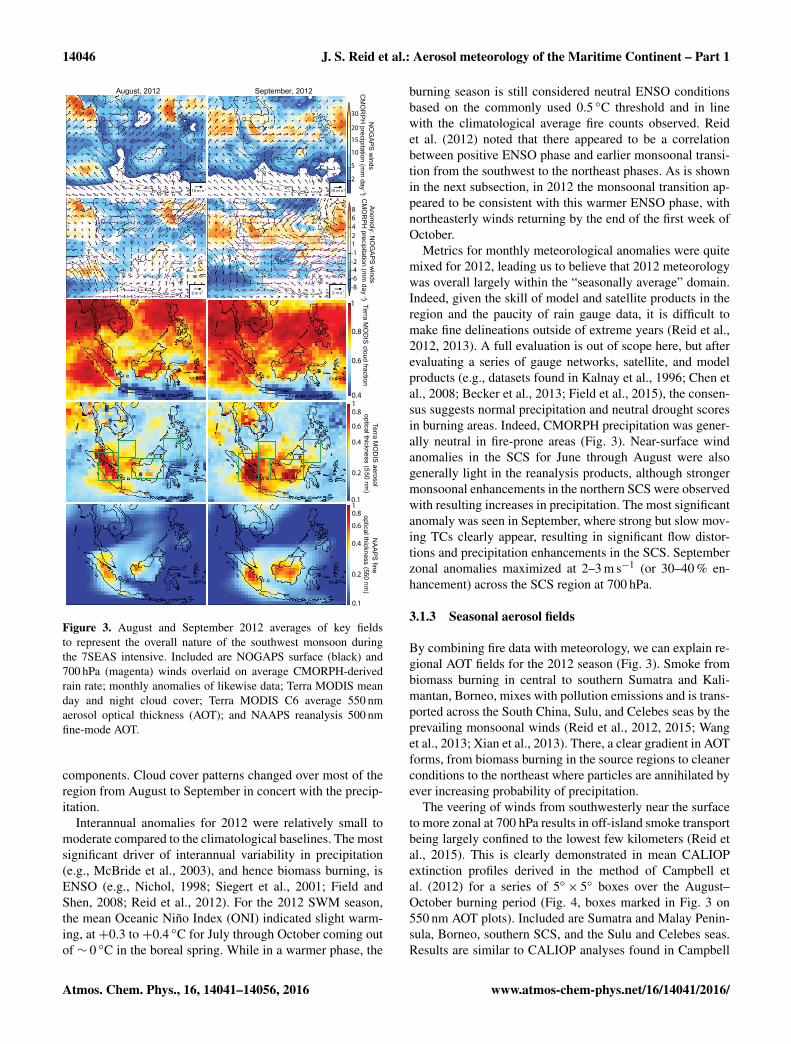
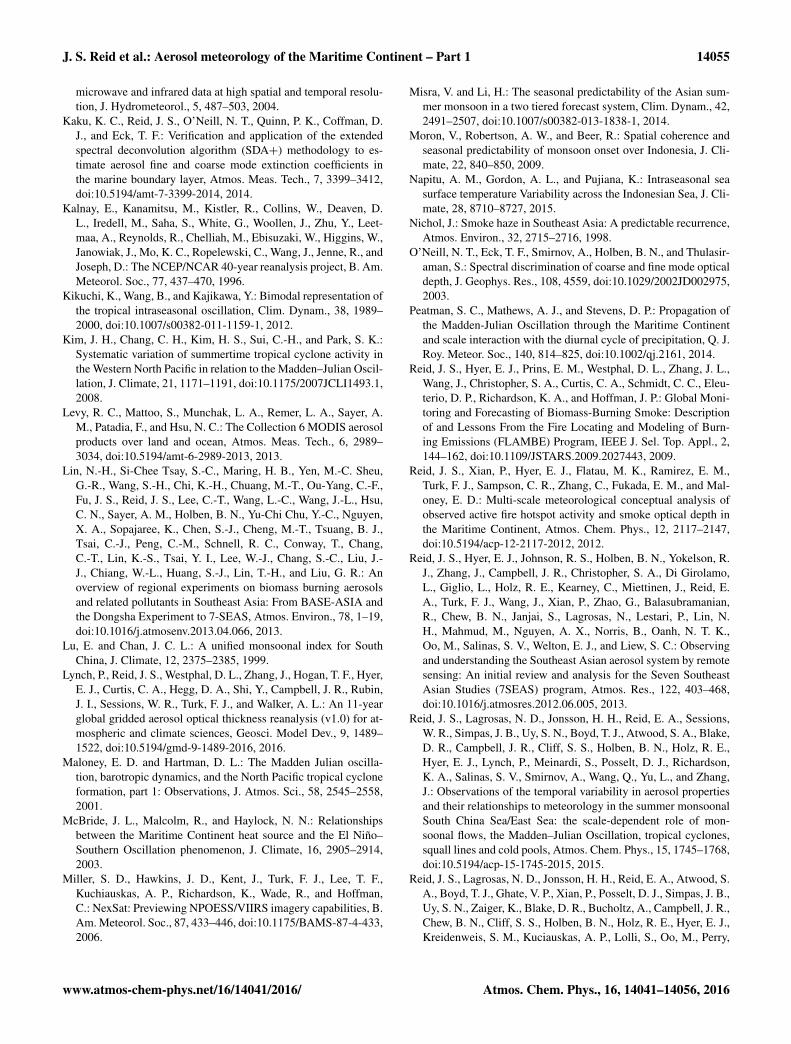
Meteorology and MODIS AOT data for August and Septem-ber 2012 are provided in Fig. 3. Included in Fig. 3 are(a) overall NOGAPS-derived monsoonal flow at the sur-face and 700 hPa, overlaid on CMORPH satellite precipita-tion; (b) likewise monthly anomalies based on the NAAPS-Reanalysis dataset for 2002–2014; (c) MODIS Terra MOD08average cloud cover; (d) MODIS Terra MOD08 550 nmAOT; and (e) NAAPS fine-mode AOT. As is typical, southof the Equator, surface winds are southeasterly, wrappingaround the islands of Borneo and Sumatra to become south-westerly in the SCS. Over the SCS, winds are also largelytypical: southwesterly at the surface and veering to zonal by700 hPa. Precipitation gradually increases from the south tothe north, with a maximum east of the Philippines in asso-ciation with the summertime monsoonal trough. In August,there were two precipitation maxima, one along the west
coast of Luzon, Philippines, and the other along the westcoast of the northern part of Malay Peninsula, both related tothe monsoon flows impinging upon the coastal terrains (e.g.,Cruz et al., 2013). Another notable cloud and precipitationenhancement is west of Sumatra, in association with a localvorticity maximum as winds transition from easterly to west-erly (Wu et al., 2009; Reid et al., 2012). In September, max-imum precipitation became zonally elongated from the Bayof Bengal through the SCS to east of the Philippines. Thiswas related partially to the overall summertime monsoonaltrough and partially to an MJO event that passed through theMC (see Sect. 3.2.1). MODIS cloud cover is spatially corre-lated with precipitation, ranging from over 50 % in southernBorneo to near 100 % around Luzon. In general cloud coveris over 70 % throughout the monsoon.
There were other clear differences in the meteorology de-picted in Fig. 3 between August and September. Notably,in August winds were characteristically easterly south ofthe Equator, southerlies across the Equator, and ultimatelyleading to southwesterly in the SCS. However, in Septem-ber winds in the lower free troposphere had stronger zonal
www.atmos-chem-phys.net/16/14041/2016/ Atmos. Chem. Phys., 16, 14041–14056, 2016
14046 J. S. Reid et al.: Aerosol meteorology of the Maritime Continent – Part 1
2
5
10
15
20
30
NO
GAPS w
indsC
MO
RPH
precipitation (mm
day
-1)
0.4
0.6
0.8
1 Terra MO
DIS cloud fraction
0.2
0.4
0.6
0.81
Terra MO
DIS aerosol
optical thickness (5 50 nm)
0.1
0.2
0.4
0.6
0.81
NAAPS fine
optical thickness (5 50 nm)
0.1
August, 2012 September, 2012
10 m s
Anomoly: N
OG
APS winds
CM
OR
PH precipitation (m
m day )
-1
2
-2-4-6
-8
4
68
-1
1
2 m s2 m s
-1 10 m s-1
-1 -1
Figure 3. August and September 2012 averages of key fieldsto represent the overall nature of the southwest monsoon duringthe 7SEAS intensive. Included are NOGAPS surface (black) and700 hPa (magenta) winds overlaid on average CMORPH-derivedrain rate; monthly anomalies of likewise data; Terra MODIS meanday and night cloud cover; Terra MODIS C6 average 550 nmaerosol optical thickness (AOT); and NAAPS reanalysis 500 nmfine-mode AOT.
components. Cloud cover patterns changed over most of theregion from August to September in concert with the precip-itation.
Interannual anomalies for 2012 were relatively small tomoderate compared to the climatological baselines. The mostsignificant driver of interannual variability in precipitation(e.g., McBride et al., 2003), and hence biomass burning, isENSO (e.g., Nichol, 1998; Siegert et al., 2001; Field andShen, 2008; Reid et al., 2012). For the 2012 SWM season,the mean Oceanic Niño Index (ONI) indicated slight warm-ing, at +0.3 to +0.4 ◦C for July through October coming outof ∼ 0 ◦C in the boreal spring. While in a warmer phase, the
burning season is still considered neutral ENSO conditionsbased on the commonly used 0.5 ◦C threshold and in linewith the climatological average fire counts observed. Reidet al. (2012) noted that there appeared to be a correlationbetween positive ENSO phase and earlier monsoonal transi-tion from the southwest to the northeast phases. As is shownin the next subsection, in 2012 the monsoonal transition ap-peared to be consistent with this warmer ENSO phase, withnortheasterly winds returning by the end of the first week ofOctober.
Metrics for monthly meteorological anomalies were quitemixed for 2012, leading us to believe that 2012 meteorologywas overall largely within the “seasonally average” domain.Indeed, given the skill of model and satellite products in theregion and the paucity of rain gauge data, it is difficult tomake fine delineations outside of extreme years (Reid et al.,2012, 2013). A full evaluation is out of scope here, but afterevaluating a series of gauge networks, satellite, and modelproducts (e.g., datasets found in Kalnay et al., 1996; Chen etal., 2008; Becker et al., 2013; Field et al., 2015), the consen-sus suggests normal precipitation and neutral drought scoresin burning areas. Indeed, CMORPH precipitation was gener-ally neutral in fire-prone areas (Fig. 3). Near-surface windanomalies in the SCS for June through August were alsogenerally light in the reanalysis products, although strongermonsoonal enhancements in the northern SCS were observedwith resulting increases in precipitation. The most significantanomaly was seen in September, where strong but slow mov-ing TCs clearly appear, resulting in significant flow distor-tions and precipitation enhancements in the SCS. Septemberzonal anomalies maximized at 2–3 m s−1 (or 30–40 % en-hancement) across the SCS region at 700 hPa.
3.1.3 Seasonal aerosol fields
By combining fire data with meteorology, we can explain re-gional AOT fields for the 2012 season (Fig. 3). Smoke frombiomass burning in central to southern Sumatra and Kali-mantan, Borneo, mixes with pollution emissions and is trans-ported across the South China, Sulu, and Celebes seas by theprevailing monsoonal winds (Reid et al., 2012, 2015; Wanget al., 2013; Xian et al., 2013). There, a clear gradient in AOTforms, from biomass burning in the source regions to cleanerconditions to the northeast where particles are annihilated byever increasing probability of precipitation.
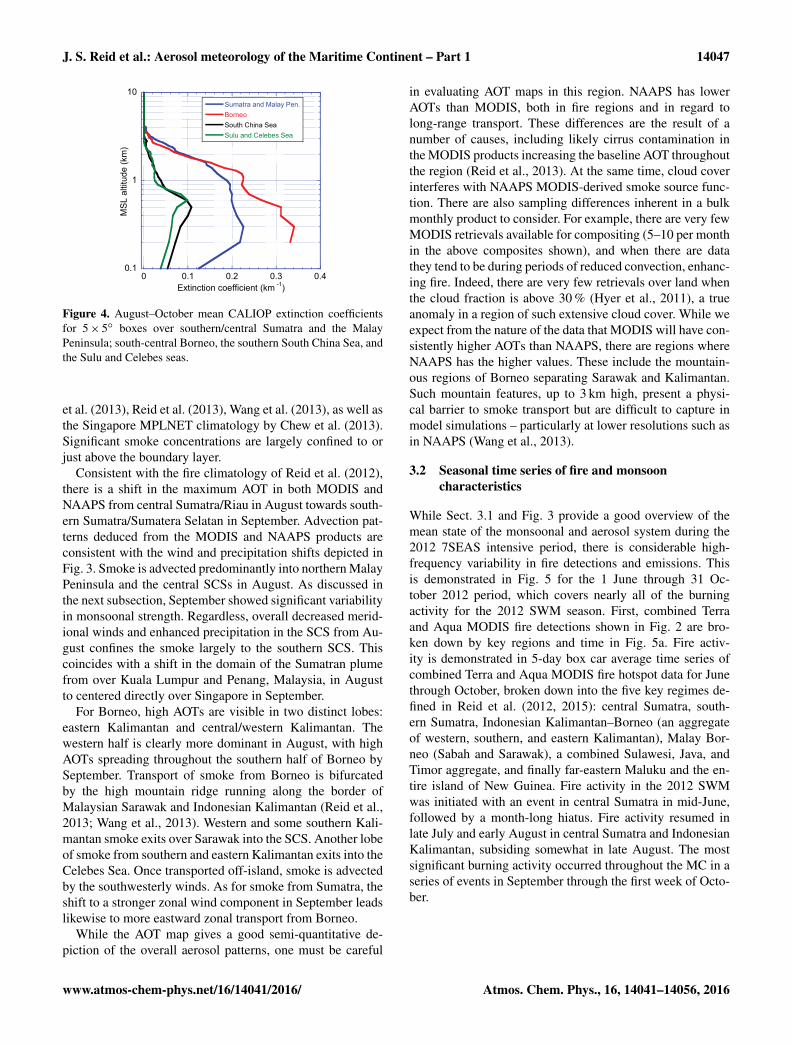
The veering of winds from southwesterly near the surfaceto more zonal at 700 hPa results in off-island smoke transportbeing largely confined to the lowest few kilometers (Reid etal., 2015). This is clearly demonstrated in mean CALIOPextinction profiles derived in the method of Campbell etal. (2012) for a series of 5◦× 5◦ boxes over the August–October burning period (Fig. 4, boxes marked in Fig. 3 on550 nm AOT plots). Included are Sumatra and Malay Penin-sula, Borneo, southern SCS, and the Sulu and Celebes seas.Results are similar to CALIOP analyses found in Campbell
Atmos. Chem. Phys., 16, 14041–14056, 2016 www.atmos-chem-phys.net/16/14041/2016/
J. S. Reid et al.: Aerosol meteorology of the Maritime Continent – Part 1 14047
0 0.1 0.2 0.3 0.40.1
1
10Sumatra and Malay Pen.BorneoSouth China SeaSulu and Celebes Sea
Extinction coefficient (km ) -1
MSL
alti
tude
(km
)
Figure 4. August–October mean CALIOP extinction coefficientsfor 5× 5◦ boxes over southern/central Sumatra and the MalayPeninsula; south-central Borneo, the southern South China Sea, andthe Sulu and Celebes seas.
et al. (2013), Reid et al. (2013), Wang et al. (2013), as well asthe Singapore MPLNET climatology by Chew et al. (2013).Significant smoke concentrations are largely confined to orjust above the boundary layer.
Consistent with the fire climatology of Reid et al. (2012),there is a shift in the maximum AOT in both MODIS andNAAPS from central Sumatra/Riau in August towards south-ern Sumatra/Sumatera Selatan in September. Advection pat-terns deduced from the MODIS and NAAPS products areconsistent with the wind and precipitation shifts depicted inFig. 3. Smoke is advected predominantly into northern MalayPeninsula and the central SCSs in August. As discussed inthe next subsection, September showed significant variabilityin monsoonal strength. Regardless, overall decreased merid-ional winds and enhanced precipitation in the SCS from Au-gust confines the smoke largely to the southern SCS. Thiscoincides with a shift in the domain of the Sumatran plumefrom over Kuala Lumpur and Penang, Malaysia, in Augustto centered directly over Singapore in September.
For Borneo, high AOTs are visible in two distinct lobes:eastern Kalimantan and central/western Kalimantan. Thewestern half is clearly more dominant in August, with highAOTs spreading throughout the southern half of Borneo bySeptember. Transport of smoke from Borneo is bifurcatedby the high mountain ridge running along the border ofMalaysian Sarawak and Indonesian Kalimantan (Reid et al.,2013; Wang et al., 2013). Western and some southern Kali-mantan smoke exits over Sarawak into the SCS. Another lobeof smoke from southern and eastern Kalimantan exits into theCelebes Sea. Once transported off-island, smoke is advectedby the southwesterly winds. As for smoke from Sumatra, theshift to a stronger zonal wind component in September leadslikewise to more eastward zonal transport from Borneo.
While the AOT map gives a good semi-quantitative de-piction of the overall aerosol patterns, one must be careful
in evaluating AOT maps in this region. NAAPS has lowerAOTs than MODIS, both in fire regions and in regard tolong-range transport. These differences are the result of anumber of causes, including likely cirrus contamination inthe MODIS products increasing the baseline AOT throughoutthe region (Reid et al., 2013). At the same time, cloud coverinterferes with NAAPS MODIS-derived smoke source func-tion. There are also sampling differences inherent in a bulkmonthly product to consider. For example, there are very fewMODIS retrievals available for compositing (5–10 per monthin the above composites shown), and when there are datathey tend to be during periods of reduced convection, enhanc-ing fire. Indeed, there are very few retrievals over land whenthe cloud fraction is above 30 % (Hyer et al., 2011), a trueanomaly in a region of such extensive cloud cover. While weexpect from the nature of the data that MODIS will have con-sistently higher AOTs than NAAPS, there are regions whereNAAPS has the higher values. These include the mountain-ous regions of Borneo separating Sarawak and Kalimantan.Such mountain features, up to 3 km high, present a physi-cal barrier to smoke transport but are difficult to capture inmodel simulations – particularly at lower resolutions such asin NAAPS (Wang et al., 2013).
3.2 Seasonal time series of fire and monsooncharacteristics
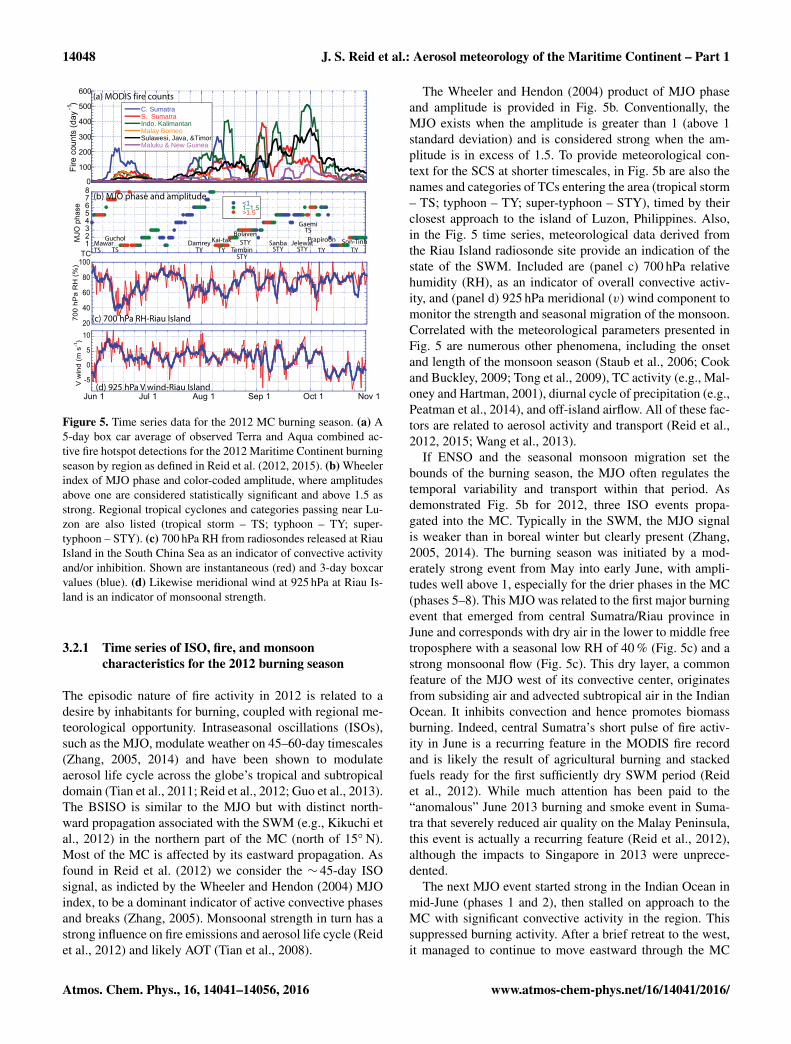
While Sect. 3.1 and Fig. 3 provide a good overview of themean state of the monsoonal and aerosol system during the2012 7SEAS intensive period, there is considerable high-frequency variability in fire detections and emissions. Thisis demonstrated in Fig. 5 for the 1 June through 31 Oc-tober 2012 period, which covers nearly all of the burningactivity for the 2012 SWM season. First, combined Terraand Aqua MODIS fire detections shown in Fig. 2 are bro-ken down by key regions and time in Fig. 5a. Fire activ-ity is demonstrated in 5-day box car average time series ofcombined Terra and Aqua MODIS fire hotspot data for Junethrough October, broken down into the five key regimes de-fined in Reid et al. (2012, 2015): central Sumatra, south-ern Sumatra, Indonesian Kalimantan–Borneo (an aggregateof western, southern, and eastern Kalimantan), Malay Bor-neo (Sabah and Sarawak), a combined Sulawesi, Java, andTimor aggregate, and finally far-eastern Maluku and the en-tire island of New Guinea. Fire activity in the 2012 SWMwas initiated with an event in central Sumatra in mid-June,followed by a month-long hiatus. Fire activity resumed inlate July and early August in central Sumatra and IndonesianKalimantan, subsiding somewhat in late August. The mostsignificant burning activity occurred throughout the MC in aseries of events in September through the first week of Octo-ber.
www.atmos-chem-phys.net/16/14041/2016/ Atmos. Chem. Phys., 16, 14041–14056, 2016
14048 J. S. Reid et al.: Aerosol meteorology of the Maritime Continent – Part 1
TC12345678
<11–1.5>1.5
MJO
pha
se
(a) MODIS fire counts
0
100
200
300
400
500
600
C. SumatraS. SumatraIndo. KalimantanMalay BorneoSulawesi, Java, &TimorMaluku & New Guinea
Fire
cou
nts
(day
)-1
(b) MJO phase and amplitude
MawarTS
SanbaSTY
JelewatSTY
Guchol
TSDamrey
TYKai-tak
TY TembinSTY
Son-TinhTY
GaemiTS
-5
0
5
10
V w
ind
(m s
)-1
20
40
60
80
100
700
hPa
RH
(%)
(d) 925 hPa V wind-Riau Island
(c) 700 hPa RH-Riau Island
Jun 1 Jul 1 Aug 1 Sep 1 Oct 1 Nov 1
BolavenSTY Prapiroon
TY
Figure 5. Time series data for the 2012 MC burning season. (a) A5-day box car average of observed Terra and Aqua combined ac-tive fire hotspot detections for the 2012 Maritime Continent burningseason by region as defined in Reid et al. (2012, 2015). (b) Wheelerindex of MJO phase and color-coded amplitude, where amplitudesabove one are considered statistically significant and above 1.5 asstrong. Regional tropical cyclones and categories passing near Lu-zon are also listed (tropical storm – TS; typhoon – TY; super-typhoon – STY). (c) 700 hPa RH from radiosondes released at RiauIsland in the South China Sea as an indicator of convective activityand/or inhibition. Shown are instantaneous (red) and 3-day boxcarvalues (blue). (d) Likewise meridional wind at 925 hPa at Riau Is-land is an indicator of monsoonal strength.
3.2.1 Time series of ISO, fire, and monsooncharacteristics for the 2012 burning season
The episodic nature of fire activity in 2012 is related to adesire by inhabitants for burning, coupled with regional me-teorological opportunity. Intraseasonal oscillations (ISOs),such as the MJO, modulate weather on 45–60-day timescales(Zhang, 2005, 2014) and have been shown to modulateaerosol life cycle across the globe’s tropical and subtropicaldomain (Tian et al., 2011; Reid et al., 2012; Guo et al., 2013).The BSISO is similar to the MJO but with distinct north-ward propagation associated with the SWM (e.g., Kikuchi etal., 2012) in the northern part of the MC (north of 15◦ N).Most of the MC is affected by its eastward propagation. Asfound in Reid et al. (2012) we consider the ∼ 45-day ISOsignal, as indicted by the Wheeler and Hendon (2004) MJOindex, to be a dominant indicator of active convective phasesand breaks (Zhang, 2005). Monsoonal strength in turn has astrong influence on fire emissions and aerosol life cycle (Reidet al., 2012) and likely AOT (Tian et al., 2008).
The Wheeler and Hendon (2004) product of MJO phaseand amplitude is provided in Fig. 5b. Conventionally, theMJO exists when the amplitude is greater than 1 (above 1standard deviation) and is considered strong when the am-plitude is in excess of 1.5. To provide meteorological con-text for the SCS at shorter timescales, in Fig. 5b are also thenames and categories of TCs entering the area (tropical storm– TS; typhoon – TY; super-typhoon – STY), timed by theirclosest approach to the island of Luzon, Philippines. Also,in the Fig. 5 time series, meteorological data derived fromthe Riau Island radiosonde site provide an indication of thestate of the SWM. Included are (panel c) 700 hPa relativehumidity (RH), as an indicator of overall convective activ-ity, and (panel d) 925 hPa meridional (v) wind component tomonitor the strength and seasonal migration of the monsoon.Correlated with the meteorological parameters presented inFig. 5 are numerous other phenomena, including the onsetand length of the monsoon season (Staub et al., 2006; Cookand Buckley, 2009; Tong et al., 2009), TC activity (e.g., Mal-oney and Hartman, 2001), diurnal cycle of precipitation (e.g.,Peatman et al., 2014), and off-island airflow. All of these fac-tors are related to aerosol activity and transport (Reid et al.,2012, 2015; Wang et al., 2013).
If ENSO and the seasonal monsoon migration set thebounds of the burning season, the MJO often regulates thetemporal variability and transport within that period. Asdemonstrated Fig. 5b for 2012, three ISO events propa-gated into the MC. Typically in the SWM, the MJO signalis weaker than in boreal winter but clearly present (Zhang,2005, 2014). The burning season was initiated by a mod-erately strong event from May into early June, with ampli-tudes well above 1, especially for the drier phases in the MC(phases 5–8). This MJO was related to the first major burningevent that emerged from central Sumatra/Riau province inJune and corresponds with dry air in the lower to middle freetroposphere with a seasonal low RH of 40 % (Fig. 5c) and astrong monsoonal flow (Fig. 5c). This dry layer, a commonfeature of the MJO west of its convective center, originatesfrom subsiding air and advected subtropical air in the IndianOcean. It inhibits convection and hence promotes biomassburning. Indeed, central Sumatra’s short pulse of fire activ-ity in June is a recurring feature in the MODIS fire recordand is likely the result of agricultural burning and stackedfuels ready for the first sufficiently dry SWM period (Reidet al., 2012). While much attention has been paid to the“anomalous” June 2013 burning and smoke event in Suma-tra that severely reduced air quality on the Malay Peninsula,this event is actually a recurring feature (Reid et al., 2012),although the impacts to Singapore in 2013 were unprece-dented.
The next MJO event started strong in the Indian Ocean inmid-June (phases 1 and 2), then stalled on approach to theMC with significant convective activity in the region. Thissuppressed burning activity. After a brief retreat to the west,it managed to continue to move eastward through the MC
Atmos. Chem. Phys., 16, 14041–14056, 2016 www.atmos-chem-phys.net/16/14041/2016/
J. S. Reid et al.: Aerosol meteorology of the Maritime Continent – Part 1 14049
as a weak event that is barely recognizable in Fig. 5. Suchweakening of the MJO over the MC is known as a conse-quence of the “barrier effect” of the MC (Zhang, 2014). Fur-ther, as discussed in Napitu et al. (2015), a weak MJO eventoften follows a strong event – particularly in summertime.They hypothesize that this may be a consequence of a morevigorous cooling by the previous strong MJO on sea surfacetemperature. As this MJO progressed to later phases, a sec-ond greater peak in August burning in central Sumatra andwestern Kalimantan (apparent in a peak in the greater In-donesian Kalimantan domain) appeared. As in the previousevent, free tropospheric air was likewise drier and the mon-soon flow steady if not significantly enhanced. This early tomid-August period typically hosts the first major event tospan the MC (Reid et al., 2012) and it too is likely relatedto burning need and meteorological opportunity around themonth of August. From August onward, the burning patternwas propagating eastward through the season, which is con-sistent with the eastward migration of the monsoon as de-scribed by Moron et al. (2009).
The third relevant MJO event, which also coincided withthe M/Y Vasco cruise discussed in Part 2 of these papers(Reid et al., 2016), formed in the Indian Ocean in mid-August, with its amplitudes as high as 2 through earlyPhase 3 (its convection center entering the MC). Upon reach-ing the MC in the last week of August, however, the ampli-tude weakened to less than 1 (below 1 standard deviation),propagation was slow from Phase 3 to Phase 6 (the periodwhen the MJO is transiting through the MC), and it sub-sequently died off in the central Pacific ocean by the endof September. Nevertheless, fire activity tracked this event,reaching a peak at the end of September. Interestingly, forthis MJO, free tropospheric air was not as dry as it had beenin the previous two events (Fig. 5c), perhaps related to theweak MJO dying before phases 7 and 8. Monsoonal flowwas also quite unsettled in September with strong enhance-ments and even flow reversals. As discussed in the next sub-section, monsoonal enhancements in the SCS were associ-ated with the propagation of TCs east of the Philippines. Be-tween these enhancements, strong reversals were found, asmuch as−5 m s−1 meridional flow at Riau Island on individ-ual soundings. These impressive reversals are consistent witheasterly wave activity between TCs.
Finally, based on the meridional winds in Fig. 5d, the mon-soon flow switched to the northeasterly winter phase at theend of the first week of October. This brought enhanced pre-cipitation back to the MC and, effectively, an end to the burn-ing season. Simultaneous with the monsoon switch, anotherweak and slow moving MJO event started over the IndianOcean in October and propagated through in November (notshown). Historically, however, the monsoonal shift does notnecessarily immediately bring an end to the burning sea-son. As discussed in Reid et al. (2012) in the most signif-icant burning years, the monsoon shift happens in the ab-sence of significant precipitation and can even enhance burn-
ing. We speculate that for 2012, more significant smoke gen-eration and transport events advecting westward from Bor-neo would have been observed had this MJO progressed withmore typical speed. Instead, the stalling of the MJO over theMC brought additional rainfall over the ocean (e.g., Chenand Houze, 1997; Peatman et al., 2014), further shorteningaerosol lifecycles and not bringing dry air related to the late-MJO phase to the region.
3.2.2 Tropical cyclone activity
Throughout the above narrative is the influence of TCs whichis, in part, embedded in the overall MJO and monsoonalstrength signals. With the ITCZ at its most northern extent,tropical cyclone paths likewise tend to be level with or northof Luzon in early summer, descending southward as the sum-mer progresses (Carmargo et al., 2007; Kim et al., 2008).When TCs are located just east of the Philippines or tran-siting westward into the SCS or up towards Japan, two sig-nificant meteorological impacts on aerosol life cycle havebeen hypothesized to occur (Reid et al., 2012; Wang et al.,2013). First, a long area of monsoonal enhancement akin toan inflow “arm” often forms to the south and west of theTC. This monsoon enhancement has been noted to stretchfrom east of the Philippines to as far west as Sumatra. SuchTC-induced monsoonal enhancements have been noted byPhilippine forecasters to bring heavy rainfall to Luzon (e.g.,Cayanan et al., 2011; Cruz et al., 2013). Reid et al. (2012,2015) and Wang et al. (2013) noted that such enhancementstend to draw out smoke from the MC into the SCS, where itis then sometimes annihilated by convection associated withthe enhancement. However, as the TC passes, large-scaleupper-level subsidence around the TC can inhibit convectionand rainfall in the region, thus promoting biomass burning(and enhancing its observation from space). This subsidencecan even be cross-equatorial and enhance burning activity.The balance of the TCs large-scale subsidence and monsoonflow enhancement factors in production, advection, and re-gional changes to precipitation allows TCs to simultaneouslymodulate multiple aspects of aerosol life cycle.
According to the Joint Typhoon Warming Center, the 2012western Pacific had 25 named storms compared to 26 in thelong-term average. Noteworthy is that when TCs were eastof the Philippines (closest point within 1000 km of Luzonmarked in Fig. 5b), there were often coincidences with peaksin observed SWM flow (Fig. 5d), convection (Fig. 5c), andbiomass burning activity (Fig. 5a). A pair of tropical storms(Mawar and Guchol) passed directly on the eastern edge ofthe Philippines, just at the initiation of the burning season. Asecond pair of typhoons (Damrey and Kai-tak) were also as-sociated with monsoon enhancements. The four TCs passingthrough the region in late August through September wereparticularly intense: a pair of super-typhoons (Temblin andBolaven) in late August and two slower moving and evenmore intense super-typhoons (Sanba and Jelewat) passing the
www.atmos-chem-phys.net/16/14041/2016/ Atmos. Chem. Phys., 16, 14041–14056, 2016
14050 J. S. Reid et al.: Aerosol meteorology of the Maritime Continent – Part 1
vicinity in September. The impact of these storms on themean monthly flow and precipitation of the central SCS inof September is clear in Fig. 3. Noteworthy for the Septem-ber storms was their relationship not only to regional mon-soon enhancements but also with monsoon hiatuses. Indeed,as mentioned in Sect. 3.2.1 the strongest amplitude shifts inmonsoonal strength for the entire 2012 burning season oc-curred in September when these storms were active. Strongsouthwesterly flow was replaced by complete flow reversalsin the SCS in a matter of days (Fig. 5d). These flow rever-sal features are consistent with the propagation of easterlywaves. Also in September, a strong tropical storm (Gaemi)formed in the SCS in late September. Aside from winds,the monsoonal enhancements from TCs resulted in the sig-nificant precipitation enhancement over the SCS in Septem-ber. Between winds and precipitation, TCs clearly modulatedsmoke transport and scavenging.
TCs may also have played a role post-monsoon season.The monsoon shift after the first week of October occurredcoincident with the arrival of Typhoon Prapiroon in thenortheastern Philippines as well as category 3 Son-Tinh asit propagated across the central Philippines. Thus, whilethe monthly mean wind fields were relatively normal (e.g.,Fig. 3), significant flow variability existed which, as we show,affected long-range aerosol transport.
3.3 Significant smoke episodes
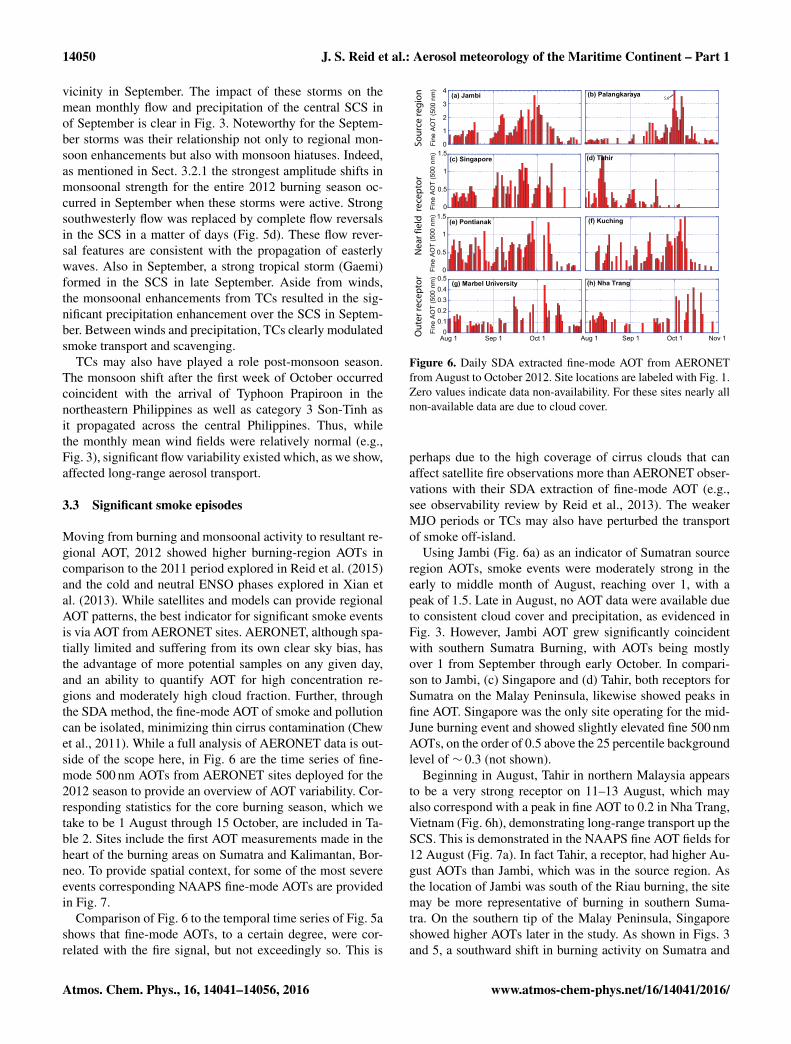
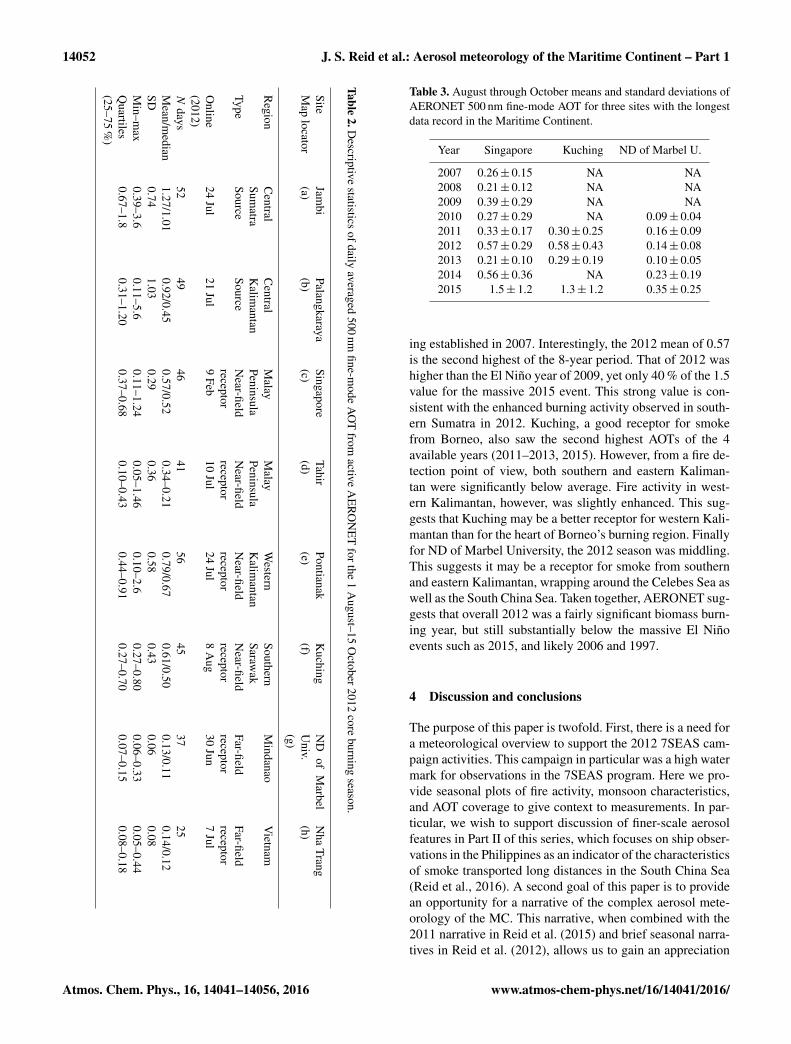
Moving from burning and monsoonal activity to resultant re-gional AOT, 2012 showed higher burning-region AOTs incomparison to the 2011 period explored in Reid et al. (2015)and the cold and neutral ENSO phases explored in Xian etal. (2013). While satellites and models can provide regionalAOT patterns, the best indicator for significant smoke eventsis via AOT from AERONET sites. AERONET, although spa-tially limited and suffering from its own clear sky bias, hasthe advantage of more potential samples on any given day,and an ability to quantify AOT for high concentration re-gions and moderately high cloud fraction. Further, throughthe SDA method, the fine-mode AOT of smoke and pollutioncan be isolated, minimizing thin cirrus contamination (Chewet al., 2011). While a full analysis of AERONET data is out-side of the scope here, in Fig. 6 are the time series of fine-mode 500 nm AOTs from AERONET sites deployed for the2012 season to provide an overview of AOT variability. Cor-responding statistics for the core burning season, which wetake to be 1 August through 15 October, are included in Ta-ble 2. Sites include the first AOT measurements made in theheart of the burning areas on Sumatra and Kalimantan, Bor-neo. To provide spatial context, for some of the most severeevents corresponding NAAPS fine-mode AOTs are providedin Fig. 7.
Comparison of Fig. 6 to the temporal time series of Fig. 5ashows that fine-mode AOTs, to a certain degree, were cor-related with the fire signal, but not exceedingly so. This is
0
1
2
3
4(a) Jambi
Fine
AO
T (5
00 n
m)
(b) Palangkaraya
(d) Tahir
(e) Pontianak
0
0.5
1
1.5
Fine
AO
T (5
00 n
m)
0
0.5
1
1.5
Fine
AO
T (5
00 n
m)
(c) Singapore
(f) Kuching
Aug 1 Sep 1 Oct 1
(h) Nha Trang
Aug 1 Sep 1 Oct 1
(g) Marbel University
00.10.20.30.40.5
Fine
AO
T (5
00 n
m)
Nov 1
Sour
ce re
gion
Out
er re
cep
tor
Nea
r fie
ld r
ecep
tor
5.6
Figure 6. Daily SDA extracted fine-mode AOT from AERONETfrom August to October 2012. Site locations are labeled with Fig. 1.Zero values indicate data non-availability. For these sites nearly allnon-available data are due to cloud cover.
perhaps due to the high coverage of cirrus clouds that canaffect satellite fire observations more than AERONET obser-vations with their SDA extraction of fine-mode AOT (e.g.,see observability review by Reid et al., 2013). The weakerMJO periods or TCs may also have perturbed the transportof smoke off-island.
Using Jambi (Fig. 6a) as an indicator of Sumatran sourceregion AOTs, smoke events were moderately strong in theearly to middle month of August, reaching over 1, with apeak of 1.5. Late in August, no AOT data were available dueto consistent cloud cover and precipitation, as evidenced inFig. 3. However, Jambi AOT grew significantly coincidentwith southern Sumatra Burning, with AOTs being mostlyover 1 from September through early October. In compari-son to Jambi, (c) Singapore and (d) Tahir, both receptors forSumatra on the Malay Peninsula, likewise showed peaks infine AOT. Singapore was the only site operating for the mid-June burning event and showed slightly elevated fine 500 nmAOTs, on the order of 0.5 above the 25 percentile backgroundlevel of ∼ 0.3 (not shown).
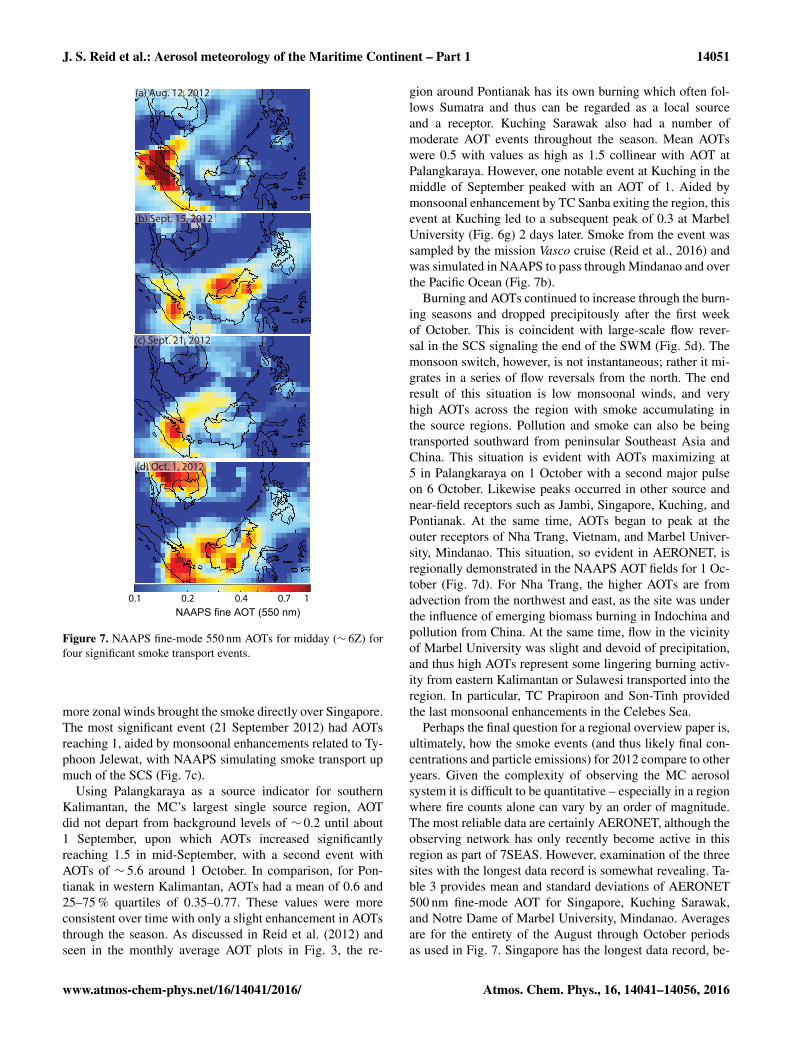
Beginning in August, Tahir in northern Malaysia appearsto be a very strong receptor on 11–13 August, which mayalso correspond with a peak in fine AOT to 0.2 in Nha Trang,Vietnam (Fig. 6h), demonstrating long-range transport up theSCS. This is demonstrated in the NAAPS fine AOT fields for12 August (Fig. 7a). In fact Tahir, a receptor, had higher Au-gust AOTs than Jambi, which was in the source region. Asthe location of Jambi was south of the Riau burning, the sitemay be more representative of burning in southern Suma-tra. On the southern tip of the Malay Peninsula, Singaporeshowed higher AOTs later in the study. As shown in Figs. 3and 5, a southward shift in burning activity on Sumatra and
Atmos. Chem. Phys., 16, 14041–14056, 2016 www.atmos-chem-phys.net/16/14041/2016/
J. S. Reid et al.: Aerosol meteorology of the Maritime Continent – Part 1 14051
(a) Aug. 12, 2012
(c) Sept. 21, 2012
(b) Sept. 15, 2012
(d) Oct. 1, 2012
0.1 0.2 10.4 0.7
NAAPS fine AOT (550 nm)
Figure 7. NAAPS fine-mode 550 nm AOTs for midday (∼ 6Z) forfour significant smoke transport events.
more zonal winds brought the smoke directly over Singapore.The most significant event (21 September 2012) had AOTsreaching 1, aided by monsoonal enhancements related to Ty-phoon Jelewat, with NAAPS simulating smoke transport upmuch of the SCS (Fig. 7c).
Using Palangkaraya as a source indicator for southernKalimantan, the MC’s largest single source region, AOTdid not depart from background levels of ∼ 0.2 until about1 September, upon which AOTs increased significantlyreaching 1.5 in mid-September, with a second event withAOTs of ∼ 5.6 around 1 October. In comparison, for Pon-tianak in western Kalimantan, AOTs had a mean of 0.6 and25–75 % quartiles of 0.35–0.77. These values were moreconsistent over time with only a slight enhancement in AOTsthrough the season. As discussed in Reid et al. (2012) andseen in the monthly average AOT plots in Fig. 3, the re-
gion around Pontianak has its own burning which often fol-lows Sumatra and thus can be regarded as a local sourceand a receptor. Kuching Sarawak also had a number ofmoderate AOT events throughout the season. Mean AOTswere 0.5 with values as high as 1.5 collinear with AOT atPalangkaraya. However, one notable event at Kuching in themiddle of September peaked with an AOT of 1. Aided bymonsoonal enhancement by TC Sanba exiting the region, thisevent at Kuching led to a subsequent peak of 0.3 at MarbelUniversity (Fig. 6g) 2 days later. Smoke from the event wassampled by the mission Vasco cruise (Reid et al., 2016) andwas simulated in NAAPS to pass through Mindanao and overthe Pacific Ocean (Fig. 7b).
Burning and AOTs continued to increase through the burn-ing seasons and dropped precipitously after the first weekof October. This is coincident with large-scale flow rever-sal in the SCS signaling the end of the SWM (Fig. 5d). Themonsoon switch, however, is not instantaneous; rather it mi-grates in a series of flow reversals from the north. The endresult of this situation is low monsoonal winds, and veryhigh AOTs across the region with smoke accumulating inthe source regions. Pollution and smoke can also be beingtransported southward from peninsular Southeast Asia andChina. This situation is evident with AOTs maximizing at5 in Palangkaraya on 1 October with a second major pulseon 6 October. Likewise peaks occurred in other source andnear-field receptors such as Jambi, Singapore, Kuching, andPontianak. At the same time, AOTs began to peak at theouter receptors of Nha Trang, Vietnam, and Marbel Univer-sity, Mindanao. This situation, so evident in AERONET, isregionally demonstrated in the NAAPS AOT fields for 1 Oc-tober (Fig. 7d). For Nha Trang, the higher AOTs are fromadvection from the northwest and east, as the site was underthe influence of emerging biomass burning in Indochina andpollution from China. At the same time, flow in the vicinityof Marbel University was slight and devoid of precipitation,and thus high AOTs represent some lingering burning activ-ity from eastern Kalimantan or Sulawesi transported into theregion. In particular, TC Prapiroon and Son-Tinh providedthe last monsoonal enhancements in the Celebes Sea.
Perhaps the final question for a regional overview paper is,ultimately, how the smoke events (and thus likely final con-centrations and particle emissions) for 2012 compare to otheryears. Given the complexity of observing the MC aerosolsystem it is difficult to be quantitative – especially in a regionwhere fire counts alone can vary by an order of magnitude.The most reliable data are certainly AERONET, although theobserving network has only recently become active in thisregion as part of 7SEAS. However, examination of the threesites with the longest data record is somewhat revealing. Ta-ble 3 provides mean and standard deviations of AERONET500 nm fine-mode AOT for Singapore, Kuching Sarawak,and Notre Dame of Marbel University, Mindanao. Averagesare for the entirety of the August through October periodsas used in Fig. 7. Singapore has the longest data record, be-
www.atmos-chem-phys.net/16/14041/2016/ Atmos. Chem. Phys., 16, 14041–14056, 2016
14052 J. S. Reid et al.: Aerosol meteorology of the Maritime Continent – Part 1
Table2.D
escriptivestatistics
ofdailyaveraged
500nm
fine-mode
AO
Tfrom
activeA
ER
ON
ET
forthe1
August–15
October2012
coreburning
season.
SiteM
aplocator
Jambi
(a)Palangkaraya(b)
Singapore(c)
Tahir(d)
Pontianak(e)
Kuching
(f)N
Dof
Marbel
Univ.
(g)
Nha
Trang(h)
Region
Central
Sumatra
Central
Kalim
antanM
alayPeninsula
Malay
PeninsulaW
esternK
alimantan
SouthernSaraw
akM
indanaoV
ietnam
TypeSource
SourceN
ear-fieldreceptor
Near-field
receptorN
ear-fieldreceptor
Near-field
receptorFar-fieldreceptor
Far-fieldreceptor
Online
(2012)24
Jul21
Jul9
Feb10
Jul24
Jul8
Aug
30Jun
7Jul
Ndays
5249
4641
5645
3725
Mean/m
edian1.27/1.01
0.92/0.450.57/0.52
0.34–0.210.79/0.67
0.61/0.500.13/0.11
0.14/0.12SD
0.741.03
0.290.36
0.580.43
0.060.08
Min–m
ax0.39–3.6
0.11–5.60.11–1.24
0.05–1.460.10–2.6
0.27–0.800.06–0.33
0.05–0.44Q
uartiles(25–75
%)
0.67–1.80.31–1.20
0.37–0.680.10–0.43
0.44–0.910.27–0.70
0.07–0.150.08–0.18
Table 3. August through October means and standard deviations ofAERONET 500 nm fine-mode AOT for three sites with the longestdata record in the Maritime Continent.
Year Singapore Kuching ND of Marbel U.
2007 0.26± 0.15 NA NA2008 0.21± 0.12 NA NA2009 0.39± 0.29 NA NA2010 0.27± 0.29 NA 0.09± 0.042011 0.33± 0.17 0.30± 0.25 0.16± 0.092012 0.57± 0.29 0.58± 0.43 0.14± 0.082013 0.21± 0.10 0.29± 0.19 0.10± 0.052014 0.56± 0.36 NA 0.23± 0.192015 1.5± 1.2 1.3± 1.2 0.35± 0.25
ing established in 2007. Interestingly, the 2012 mean of 0.57is the second highest of the 8-year period. That of 2012 washigher than the El Niño year of 2009, yet only 40 % of the 1.5value for the massive 2015 event. This strong value is con-sistent with the enhanced burning activity observed in south-ern Sumatra in 2012. Kuching, a good receptor for smokefrom Borneo, also saw the second highest AOTs of the 4available years (2011–2013, 2015). However, from a fire de-tection point of view, both southern and eastern Kaliman-tan were significantly below average. Fire activity in west-ern Kalimantan, however, was slightly enhanced. This sug-gests that Kuching may be a better receptor for western Kali-mantan than for the heart of Borneo’s burning region. Finallyfor ND of Marbel University, the 2012 season was middling.This suggests it may be a receptor for smoke from southernand eastern Kalimantan, wrapping around the Celebes Sea aswell as the South China Sea. Taken together, AERONET sug-gests that overall 2012 was a fairly significant biomass burn-ing year, but still substantially below the massive El Niñoevents such as 2015, and likely 2006 and 1997.
4 Discussion and conclusions
The purpose of this paper is twofold. First, there is a need fora meteorological overview to support the 2012 7SEAS cam-paign activities. This campaign in particular was a high watermark for observations in the 7SEAS program. Here we pro-vide seasonal plots of fire activity, monsoon characteristics,and AOT coverage to give context to measurements. In par-ticular, we wish to support discussion of finer-scale aerosolfeatures in Part II of this series, which focuses on ship obser-vations in the Philippines as an indicator of the characteristicsof smoke transported long distances in the South China Sea(Reid et al., 2016). A second goal of this paper is to providean opportunity for a narrative of the complex aerosol mete-orology of the MC. This narrative, when combined with the2011 narrative in Reid et al. (2015) and brief seasonal narra-tives in Reid et al. (2012), allows us to gain an appreciation
Atmos. Chem. Phys., 16, 14041–14056, 2016 www.atmos-chem-phys.net/16/14041/2016/
J. S. Reid et al.: Aerosol meteorology of the Maritime Continent – Part 1 14053
for the inter-seasonal similarities and differences in MC fireweather and smoke transport.
In regards to fire activity, there are many aspects of the2012 season that are “typical”. Overall fire hotspot detectionsfor the core June–October burning season were only 10 % un-der the 2003–2009 baseline provided by Reid et al. (2012),although notable regional fire perturbations include+30 % insouthern Sumatra and −40 % in southern and western Kali-mantan. In comparison, internal standard deviations for mostregions are > 50%, indicating significant spatial and tempo-ral variation from year to year within regions. Fire activ-ity began early in the west, in June and August, moving tothe most significant burning in September and early Octo-ber. This fire activity was consistent with a slightly warm buttechnically neutral ENSO phase, which also brought typicalif not lightly enhanced precipitation.
While fire and meteorology was well within norms for“means”, fire was strongly modulated by the MJO and SWMflow on Sumatra and Borneo, being more systematically in-creasing in eastern islands as the season progressed. Thistoo is characteristic of regional burning activity (Reid et al.,2012). However, there were periods of strong SWM modula-tion brought about by a combination of TC passages (enhanc-ing southwest flow) and easterly waves, resulting in some-times strong meridional flow reversals. When averaged, thisactivity resulted in anomalously enhanced zonal winds overthe central and northern South China Sea – particularly inSeptember when burning was at a maximum. Fire activitylargely subsided with the switch of the SWM to the winter-time northeasterly phase in the second week of October.
Biomass burning smoke distribution and transport weremonitored by a series of AERONET sun photometers,MODIS AOT retrievals, and NAAPS reanalysis model prod-ucts. For the most part, all products agree on active fireemission areas and transport patterns of smoke off the is-lands into the South China, Sulu, and Celebes seas by SWMwinds. AERONET in particular provided the first region-wide quantitative view of AOTs. Sites within source regions,such as Jambi Sumatra and Palangkaraya, central Kaliman-tan, had mean and standard deviation of 500 nm fine AOTs of1.3± 0.7 and 0.9± 0.3, respectively, although Palangkarayadid host the two most significant smoke events, with AOTreaching 5.6 on one day. In August, smoke largely traveled upthe South China Sea to almost as far north as Luzon, Philip-pines. During the September peak burning period, anomalouszonal winds kept smoke to the southern South China Sea andsouth of central Philippines. This so happens to be the keyregion for the receptor measurement on the M/Y Vasco de-scribed in Part 2 of this series (Reid et al., 2016). In com-parison to other years in the AERONET data record (goingback as far as 2007 for Singapore), 2012 was clearly a sub-stantial year, with heavy smoke over much of the region, ex-ceeding other years with the notable exception of the 2015El Niño event. This is somewhat at odds with MODIS activefire hotspot data which suggested more average fire activity.
Overall 2012 fire activity and transport patterns were wellwithin “1σ” for SWM. However, the standard deviations forfire and smoke activity for the region are exceptionally large.Qualitatively, from a fire and smoke closure point of view,there are consistencies in the dataset. Significant fire activityand high AOTs were observed in southern Sumatra, Singa-pore, and Tahir, Malaysia, as a receptor. However, burningon Borneo was generally neutral or slightly enhanced in thewest and 45 % lower than average in the core areas of south-ern and western Kalimantan. AOTs at Kuching, an excellentindicator of smoke entering the South China Sea, were high.The complexity of the MC’s meteorology and aerosol systemresults in nonlinear relations between observed fire activityand regional aerosol loading. Previously identified aspects ofthe system such as monsoonal shifts, the MJO/BSISO, TCs,and the role of orography follow the conceptual modes andexamples of Reid et al. (2012) and Wang et al. (2013). How-ever, as of yet, observability and predictability of the sys-tem are nevertheless still only semi-quantitative. Clearly, the2012 field measurement dataset, especially in the context ofits 2011 preparatory mission, is valuable for further study.
5 Data availability
Data used in this analysis are all derived from publicdata sources. NASA MODIS fire and AOT data were ob-tained from the NASA LAADS ftp site: ftp://ladsweb.nascom.nasa.gov/. NASA AERONET data are availablefrom the AERONET website: http://aeronet.gsfc.nasa.gov/.Navy NAAPS aerosol reanalysis and meteorology data areavailable at the US GODAE server: http://www.usgodae.org/. Finally, radiosonde data were extracted from theUniversity of Wyoming radiosonde data repository: http://weather.uwyo.edu/upperair/sounding.html.
Acknowledgements. We are grateful to all participants of the2012 7SEAS intensive study and are in particular to the hostinstitutions for regional AERONET site deployment and the useof derived optical thickness data herein. Authors also benefittedfrom conversations with Eric Maloney (CSU), Matthew Wheeler(CSIRO), and Chidong Zhang (U of Miami). Funding for USscientist deployment and instrument analysis was provided bythe NRL Base Program and ONR 35. Modeling analysis wasprovided by ONR 32. Remote sensing and model analysis wasprovided by the NASA Interdisciplinary Science Program. Groundsite deployments were supported by the NASA Radiation ScienceProgram through a grant from the Southeast Asia Composition,Cloud, Climate Coupling Regional Study (SEAC4RS) scienceteam. Author James R. Campbell acknowledges the supportof NASA Interagency Agreement NNG13HH10I on behalf ofMPLNET and SEAC4RS science teams.
Edited by: F. YuReviewed by: R. Swap and two anonymous referees
www.atmos-chem-phys.net/16/14041/2016/ Atmos. Chem. Phys., 16, 14041–14056, 2016
14054 J. S. Reid et al.: Aerosol meteorology of the Maritime Continent – Part 1
References
Atwood, S. A., Reid, J. S., Kreidenweis, S. M., Yu, L. E., Sali-nas, S. V., Chew, B. N., and Balasubramanian, R.: Analy-sis of source regions for smoke events in Singapore for the2009 El Niño burning season, Atmos. Environ., 78, 219–230,doi:10.1016/j.atmosenv.2013.04.047, 2013.
Atwood, S. A., Reid, J. S., Kreidenweis, S. M., Blake, D. R., Jon-sson, H. H., Lagrosas, N. D., Lynch, P., Reid, E. A., Sessions,W. R., and Simpas, J. B.: Size-resolved aerosol and cloud con-densation nuclei (CCN) properties in the remote marine SouthChina Sea, Part 1: Observations and source classification, At-mos. Chem. Phys. Discuss., doi:10.5194/acp-2016-645, in re-view, 2016.
Becker, A., Finger, P., Meyer-Christoffer, A., Rudolf, B., Schamm,K., Schneider, U., and Ziese, M.: A description of the globalland-surface precipitation data products of the Global Precipita-tion Climatology Centre with sample applications including cen-tennial (trend) analysis from 1901–present, Earth Syst. Sci. Data,5, 71–99, doi:10.5194/essd-5-71-2013, 2013.
Campbell, J. R., Reid, J. S., Westphal, D. L., Zhang, J., Tack-ett, J. L., Chew, B. N., Welton, E. J., Shimizu A., andSugimoto, N.: Characterizing aerosol particle compositionand the vertical profile of extinction and linear depolariza-tion over Southeast Asia and the Maritime Continent: the2007–2009 view from CALIOP, Atmos. Res., 122, 520–543,doi:10.1016/j.atmosres.2012.05.007, 2013.
Campbell, J. R., Ge, C., Wang, J., Welton, E. J., Bucholtz, A., Hyer,E. J., Reid, E. A., Chew, B. N., Liew, S.-C., Salinas, S. V., Lolli,S., Kaku, K. C., Lynch, P., Mahamud, M., Mohamad, M., andHolben, B. N.: Applying advanced ground-based remote sens-ing in the Southeast Asian Maritime Continent to characterizeregional proficiencies in smoke transport modeling, J. Appl. Me-teorol. Clim., 55, 3–22, doi:10.1175/JAMC-D-15-0083.1., 2016.
Carmargo, S. J., Robertson, A. W., Gaffnew, S. J., Smyth, P., andGhil, M.: Cluster analysis of typhoon tracks. Part 1. Generalproperties, J. Climate, 20, 3635–3653, 2007.
Cayanan, E. O., Chen, T.-C, Argete, J. C., Yen, M.-C., and Nilo, P.D.: The effect of tropical cyclones on southwest monsoon rainfallin the Philippines, J. Meteorol. Soc. Jpn, 89A, 123–139, 2011.
Chang, C.-P., Wang, Z., Mcbride, J., and Liu, C.-H.: Annual cycleof Southeast Asia-Maritime Continent rainfall and asymmetricmonsoon transition, J. Climate, 18, 287–301, 2005.
Chen, M. Y., Shi, W., Xie, P. P., Silva, V. B. S., Kousky, V. E., Hig-gins, R. W., and Janowiak, J. E.: Assessing objective techniquesfor gauge-based analyses of global daily precipitation, J. Geo-phys. Res., 113, D04110, doi:10.1029/2007JD009132, 2008.
Chen, S. S. and Houze, R. A.: Diurnal variation and life-cycle ofdeep convective systems over the tropical Pacific warm pool, Q.J. Roy. Meteor. Soc., 123, 357–388, 1997.
Chew, B. N., Campbell, J. R., Reid, J. S., Giles, D. M., Welton, E.J., Salinas, S. V., and Liew, S. C.: Tropical cirrus cloud contami-nation in sun photometer data, Atmos. Environ., 45, 6724–6731,doi:10.1016/j.atmosenv.2011.08.017, 2011.
Chew, B. N., Campbell, J. R., Salinas, S. V., Chang, C.W., Reid, J. S., Welton, E. J., Holben, B. N., and Liew,S. C.: Aerosol particle vertical distributions and opticalproperties over Singapore, Atmos. Environ., 79, 599–613,doi:10.1016/j.atmosenv.2013.06.026, 2013.
Cook, B. I. and Buckley, B. M.: Objective determination of mon-soon season onset, withdrawal, and length, J. Geophys. Res., 114,D23109, doi:10.1029/2009JD012795, 2009.
Cruz, F. T., Narisma, G. T., Villafuerte, M. Q., Cheng Chua, K. U.,and Olaguera, L. M.: A climatological analysis of the southwestmonsoon rainfall in the Philippines, Atmos. Res., 122, 609–616,doi:10.1016/j.atmosres.2012.06.010, 2013.
Field, R. D. and Shen, S. S. P.: Predictability of carbon emis-sions from biomass burning in Indonesia, J. Geophys. Res., 113,G04024, doi:10.1029/2008JG000694, 2008.
Field, R. D., Spessa, A. C., Aziz, N. A., Camia, A., Cantin, A.,Carr, R., de Groot, W. J., Dowdy, A. J., Flannigan, M. D.,Manomaiphiboon, K., Pappenberger, F., Tanpipat, V., and Wang,X.: Development of a Global Fire Weather Database, Nat. Haz-ards Earth Syst. Sci., 15, 1407–1423, doi:10.5194/nhess-15-1407-2015, 2015.
Ge, C., Wang, J., and Reid, J. S.: Mesoscale modeling of smoketransport over the Southeast Asian Maritime Continent: couplingof smoke direct radiative effect below and above the low-levelclouds, Atmos. Chem. Phys., 14, 159–174, doi:10.5194/acp-14-159-2014, 2014.
Giorgi, F., Coppola, E., Solomon, F., Mariotti, L., Sylla, M. B., Bi,X., Elguindi, N., Diro, G. T., Nair, V., Giuliani, G., Turuncoglu,U. U., Cozzini,S., Guttler, I., O’Brien, T. A., Tawfik, A. B., Shal-aby, A., Zakey, A. S., Steiner, A. L., Stordal, F., Sloan, L. C., andBrankovic, C.: RegCM4: model description and preliminary testsover multiple CORDEX domains, Clim. Res., 52, 7–29, 2012.
Guo, Y. J., Tian, B., Kahn, R. A., Kalashnikova, O., Wong, S.,and Waliser, D. E.: Tropical Atlantic dust and smoke aerosolvariations related to the Madden-Julian Oscillation in MODISand MISR observations, J. Geophys. Res., 118, 4947–4963,doi:10.1002/jgrd.50409, 2013.
Holben, B. N., Eck, T. F., Slutsker, I., Tanre, D., Buis, J. P., Set-zer, A., Vermote, E., Reagan, J. A., Kaufman, Y. J., Nakajima,T., Lavenu, F., Jankowiak, I., and Smirnov, A.: AERONET – Afederated instrument network and data archive for aerosol char-acterization, Remote Sens. Environ., 66, 1–16, 1998.
Hogan, T. F. and Rosmond, T. E.: The description of the U.S. NavyOperational Global Atmospheric Prediction System’s spectralforecast model, Mon. Weather Rev., 119, 1786–1815, 1991.
Hyer, E. J. and Chew, B. N.: Aerosol transport model evaluation ofan extreme smoke episode in Southeast Asia, Atmos. Environ.,44, 1422–1427, doi:10.1016/j.atmosenv.2010.01.043, 2010.
Hyer, E. J., Reid, J. S., and Zhang, J.: An over-land aerosol opti-cal depth data set for data assimilation by filtering, correction,and aggregation of MODIS Collection 5 optical depth retrievals,Atmos. Meas. Tech., 4, 379–408, doi:10.5194/amt-4-379-2011,2011.
Hyer, E. J., Reid, J. S., Prins, E. M., Hoffman, J. P., Schmidt,C. C., Miettinen, J. I., and Giglio, L.: Patterns of fire ac-tivity over Indonesia and Malaysia from polar and geosta-tionary satellite observations, Atmos. Res., 122, 504–519,doi:10.1016/j.atmosres.2012.06.011, 2013.
Jamandre, C. A. and Narisma, G. T.: Spatio-temporal validation ofsatellite-based rainfall estimates in the Philippines, Atmos. Res.,122, 599–608, doi:10.1016/j.atmosres.2012.06.024, 2013.
Joyce, R. J., Janowiak, J. E., Arkin, P. A., and Xie, P.: CMORPH: Amethod that produces global precipitation estimates from passive
Atmos. Chem. Phys., 16, 14041–14056, 2016 www.atmos-chem-phys.net/16/14041/2016/
J. S. Reid et al.: Aerosol meteorology of the Maritime Continent – Part 1 14055
microwave and infrared data at high spatial and temporal resolu-tion, J. Hydrometeorol., 5, 487–503, 2004.
Kaku, K. C., Reid, J. S., O’Neill, N. T., Quinn, P. K., Coffman, D.J., and Eck, T. F.: Verification and application of the extendedspectral deconvolution algorithm (SDA+) methodology to es-timate aerosol fine and coarse mode extinction coefficients inthe marine boundary layer, Atmos. Meas. Tech., 7, 3399–3412,doi:10.5194/amt-7-3399-2014, 2014.
Kalnay, E., Kanamitsu, M., Kistler, R., Collins, W., Deaven, D.L., Iredell, M., Saha, S., White, G., Woollen, J., Zhu, Y., Leet-maa, A., Reynolds, R., Chelliah, M., Ebisuzaki, W., Higgins, W.,Janowiak, J., Mo, K. C., Ropelewski, C., Wang, J., Jenne, R., andJoseph, D.: The NCEP/NCAR 40-year reanalysis project, B. Am.Meteorol. Soc., 77, 437–470, 1996.
Kikuchi, K., Wang, B., and Kajikawa, Y.: Bimodal representation ofthe tropical intraseasonal oscillation, Clim. Dynam., 38, 1989–2000, doi:10.1007/s00382-011-1159-1, 2012.
Kim, J. H., Chang, C. H., Kim, H. S., Sui, C.-H., and Park, S. K.:Systematic variation of summertime tropical cyclone activity inthe Western North Pacific in relation to the Madden–Julian Oscil-lation, J. Climate, 21, 1171–1191, doi:10.1175/2007JCLI1493.1,2008.
Levy, R. C., Mattoo, S., Munchak, L. A., Remer, L. A., Sayer, A.M., Patadia, F., and Hsu, N. C.: The Collection 6 MODIS aerosolproducts over land and ocean, Atmos. Meas. Tech., 6, 2989–3034, doi:10.5194/amt-6-2989-2013, 2013.
Lin, N.-H., Si-Chee Tsay, S.-C., Maring, H. B., Yen, M.-C. Sheu,G.-R., Wang, S.-H., Chi, K.-H., Chuang, M.-T., Ou-Yang, C.-F.,Fu, J. S., Reid, J. S., Lee, C.-T., Wang, L.-C., Wang, J.-L., Hsu,C. N., Sayer, A. M., Holben, B. N., Yu-Chi Chu, Y.-C., Nguyen,X. A., Sopajaree, K., Chen, S.-J., Cheng, M.-T., Tsuang, B. J.,Tsai, C.-J., Peng, C.-M., Schnell, R. C., Conway, T., Chang,C.-T., Lin, K.-S., Tsai, Y. I., Lee, W.-J., Chang, S.-C., Liu, J.-J., Chiang, W.-L., Huang, S.-J., Lin, T.-H., and Liu, G. R.: Anoverview of regional experiments on biomass burning aerosolsand related pollutants in Southeast Asia: From BASE-ASIA andthe Dongsha Experiment to 7-SEAS, Atmos. Environ., 78, 1–19,doi:10.1016/j.atmosenv.2013.04.066, 2013.
Lu, E. and Chan, J. C. L.: A unified monsoonal index for SouthChina, J. Climate, 12, 2375–2385, 1999.
Lynch, P., Reid, J. S., Westphal, D. L., Zhang, J., Hogan, T. F., Hyer,E. J., Curtis, C. A., Hegg, D. A., Shi, Y., Campbell, J. R., Rubin,J. I., Sessions, W. R., Turk, F. J., and Walker, A. L.: An 11-yearglobal gridded aerosol optical thickness reanalysis (v1.0) for at-mospheric and climate sciences, Geosci. Model Dev., 9, 1489–1522, doi:10.5194/gmd-9-1489-2016, 2016.
Maloney, E. D. and Hartman, D. L.: The Madden Julian oscilla-tion, barotropic dynamics, and the North Pacific tropical cycloneformation, part 1: Observations, J. Atmos. Sci., 58, 2545–2558,2001.
McBride, J. L., Malcolm, R., and Haylock, N. N.: Relationshipsbetween the Maritime Continent heat source and the El Niño–Southern Oscillation phenomenon, J. Climate, 16, 2905–2914,2003.
Miller, S. D., Hawkins, J. D., Kent, J., Turk, F. J., Lee, T. F.,Kuchiauskas, A. P., Richardson, K., Wade, R., and Hoffman,C.: NexSat: Previewing NPOESS/VIIRS imagery capabilities, B.Am. Meteorol. Soc., 87, 433–446, doi:10.1175/BAMS-87-4-433,2006.
Misra, V. and Li, H.: The seasonal predictability of the Asian sum-mer monsoon in a two tiered forecast system, Clim. Dynam., 42,2491–2507, doi:10.1007/s00382-013-1838-1, 2014.
Moron, V., Robertson, A. W., and Beer, R.: Spatial coherence andseasonal predictability of monsoon onset over Indonesia, J. Cli-mate, 22, 840–850, 2009.
Napitu, A. M., Gordon, A. L., and Pujiana, K.: Intraseasonal seasurface temperature Variability across the Indonesian Sea, J. Cli-mate, 28, 8710–8727, 2015.
Nichol, J.: Smoke haze in Southeast Asia: A predictable recurrence,Atmos. Environ., 32, 2715–2716, 1998.
O’Neill, N. T., Eck, T. F., Smirnov, A., Holben, B. N., and Thulasir-aman, S.: Spectral discrimination of coarse and fine mode opticaldepth, J. Geophys. Res., 108, 4559, doi:10.1029/2002JD002975,2003.
Peatman, S. C., Mathews, A. J., and Stevens, D. P.: Propagation ofthe Madden-Julian Oscillation through the Maritime Continentand scale interaction with the diurnal cycle of precipitation, Q. J.Roy. Meteor. Soc., 140, 814–825, doi:10.1002/qj.2161, 2014.
Reid, J. S., Hyer, E. J., Prins, E. M., Westphal, D. L., Zhang, J. L.,Wang, J., Christopher, S. A., Curtis, C. A., Schmidt, C. C., Eleu-terio, D. P., Richardson, K. A., and Hoffman, J. P.: Global Moni-toring and Forecasting of Biomass-Burning Smoke: Descriptionof and Lessons From the Fire Locating and Modeling of Burn-ing Emissions (FLAMBE) Program, IEEE J. Sel. Top. Appl., 2,144–162, doi:10.1109/JSTARS.2009.2027443, 2009.
Reid, J. S., Xian, P., Hyer, E. J., Flatau, M. K., Ramirez, E. M.,Turk, F. J., Sampson, C. R., Zhang, C., Fukada, E. M., and Mal-oney, E. D.: Multi-scale meteorological conceptual analysis ofobserved active fire hotspot activity and smoke optical depth inthe Maritime Continent, Atmos. Chem. Phys., 12, 2117–2147,doi:10.5194/acp-12-2117-2012, 2012.
Reid, J. S., Hyer, E. J., Johnson, R. S., Holben, B. N., Yokelson, R.J., Zhang, J., Campbell, J. R., Christopher, S. A., Di Girolamo,L., Giglio, L., Holz, R. E., Kearney, C., Miettinen, J., Reid, E.A., Turk, F. J., Wang, J., Xian, P., Zhao, G., Balasubramanian,R., Chew, B. N., Janjai, S., Lagrosas, N., Lestari, P., Lin, N.H., Mahmud, M., Nguyen, A. X., Norris, B., Oanh, N. T. K.,Oo, M., Salinas, S. V., Welton, E. J., and Liew, S. C.: Observingand understanding the Southeast Asian aerosol system by remotesensing: An initial review and analysis for the Seven SoutheastAsian Studies (7SEAS) program, Atmos. Res., 122, 403–468,doi:10.1016/j.atmosres.2012.06.005, 2013.
Reid, J. S., Lagrosas, N. D., Jonsson, H. H., Reid, E. A., Sessions,W. R., Simpas, J. B., Uy, S. N., Boyd, T. J., Atwood, S. A., Blake,D. R., Campbell, J. R., Cliff, S. S., Holben, B. N., Holz, R. E.,Hyer, E. J., Lynch, P., Meinardi, S., Posselt, D. J., Richardson,K. A., Salinas, S. V., Smirnov, A., Wang, Q., Yu, L., and Zhang,J.: Observations of the temporal variability in aerosol propertiesand their relationships to meteorology in the summer monsoonalSouth China Sea/East Sea: the scale-dependent role of mon-soonal flows, the Madden–Julian Oscillation, tropical cyclones,squall lines and cold pools, Atmos. Chem. Phys., 15, 1745–1768,doi:10.5194/acp-15-1745-2015, 2015.
Reid, J. S., Lagrosas, N. D., Jonsson, H. H., Reid, E. A., Atwood, S.A., Boyd, T. J., Ghate, V. P., Xian, P., Posselt, D. J., Simpas, J. B.,Uy, S. N., Zaiger, K., Blake, D. R., Bucholtz, A., Campbell, J. R.,Chew, B. N., Cliff, S. S., Holben, B. N., Holz, R. E., Hyer, E. J.,Kreidenweis, S. M., Kuciauskas, A. P., Lolli, S., Oo, M., Perry,
www.atmos-chem-phys.net/16/14041/2016/ Atmos. Chem. Phys., 16, 14041–14056, 2016
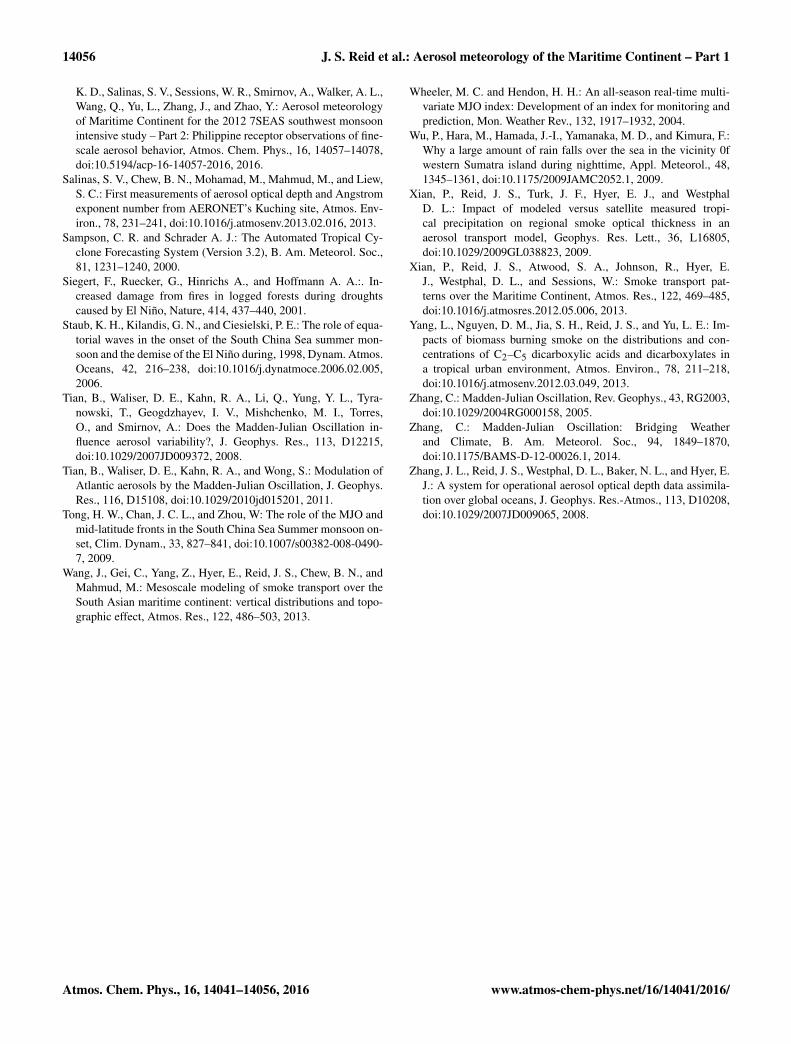
14056 J. S. Reid et al.: Aerosol meteorology of the Maritime Continent – Part 1
K. D., Salinas, S. V., Sessions, W. R., Smirnov, A., Walker, A. L.,Wang, Q., Yu, L., Zhang, J., and Zhao, Y.: Aerosol meteorologyof Maritime Continent for the 2012 7SEAS southwest monsoonintensive study – Part 2: Philippine receptor observations of fine-scale aerosol behavior, Atmos. Chem. Phys., 16, 14057–14078,doi:10.5194/acp-16-14057-2016, 2016.
Salinas, S. V., Chew, B. N., Mohamad, M., Mahmud, M., and Liew,S. C.: First measurements of aerosol optical depth and Angstromexponent number from AERONET’s Kuching site, Atmos. Env-iron., 78, 231–241, doi:10.1016/j.atmosenv.2013.02.016, 2013.
Sampson, C. R. and Schrader A. J.: The Automated Tropical Cy-clone Forecasting System (Version 3.2), B. Am. Meteorol. Soc.,81, 1231–1240, 2000.
Siegert, F., Ruecker, G., Hinrichs A., and Hoffmann A. A.:. In-creased damage from fires in logged forests during droughtscaused by El Niño, Nature, 414, 437–440, 2001.
Staub, K. H., Kilandis, G. N., and Ciesielski, P. E.: The role of equa-torial waves in the onset of the South China Sea summer mon-soon and the demise of the El Niño during, 1998, Dynam. Atmos.Oceans, 42, 216–238, doi:10.1016/j.dynatmoce.2006.02.005,2006.
Tian, B., Waliser, D. E., Kahn, R. A., Li, Q., Yung, Y. L., Tyra-nowski, T., Geogdzhayev, I. V., Mishchenko, M. I., Torres,O., and Smirnov, A.: Does the Madden-Julian Oscillation in-fluence aerosol variability?, J. Geophys. Res., 113, D12215,doi:10.1029/2007JD009372, 2008.
Tian, B., Waliser, D. E., Kahn, R. A., and Wong, S.: Modulation ofAtlantic aerosols by the Madden-Julian Oscillation, J. Geophys.Res., 116, D15108, doi:10.1029/2010jd015201, 2011.
Tong, H. W., Chan, J. C. L., and Zhou, W: The role of the MJO andmid-latitude fronts in the South China Sea Summer monsoon on-set, Clim. Dynam., 33, 827–841, doi:10.1007/s00382-008-0490-7, 2009.
Wang, J., Gei, C., Yang, Z., Hyer, E., Reid, J. S., Chew, B. N., andMahmud, M.: Mesoscale modeling of smoke transport over theSouth Asian maritime continent: vertical distributions and topo-graphic effect, Atmos. Res., 122, 486–503, 2013.
Wheeler, M. C. and Hendon, H. H.: An all-season real-time multi-variate MJO index: Development of an index for monitoring andprediction, Mon. Weather Rev., 132, 1917–1932, 2004.
Wu, P., Hara, M., Hamada, J.-I., Yamanaka, M. D., and Kimura, F.:Why a large amount of rain falls over the sea in the vicinity 0fwestern Sumatra island during nighttime, Appl. Meteorol., 48,1345–1361, doi:10.1175/2009JAMC2052.1, 2009.
Xian, P., Reid, J. S., Turk, J. F., Hyer, E. J., and WestphalD. L.: Impact of modeled versus satellite measured tropi-cal precipitation on regional smoke optical thickness in anaerosol transport model, Geophys. Res. Lett., 36, L16805,doi:10.1029/2009GL038823, 2009.
Xian, P., Reid, J. S., Atwood, S. A., Johnson, R., Hyer, E.J., Westphal, D. L., and Sessions, W.: Smoke transport pat-terns over the Maritime Continent, Atmos. Res., 122, 469–485,doi:10.1016/j.atmosres.2012.05.006, 2013.
Yang, L., Nguyen, D. M., Jia, S. H., Reid, J. S., and Yu, L. E.: Im-pacts of biomass burning smoke on the distributions and con-centrations of C2–C5 dicarboxylic acids and dicarboxylates ina tropical urban environment, Atmos. Environ., 78, 211–218,doi:10.1016/j.atmosenv.2012.03.049, 2013.
Zhang, C.: Madden-Julian Oscillation, Rev. Geophys., 43, RG2003,doi:10.1029/2004RG000158, 2005.
Zhang, C.: Madden-Julian Oscillation: Bridging Weatherand Climate, B. Am. Meteorol. Soc., 94, 1849–1870,doi:10.1175/BAMS-D-12-00026.1, 2014.
Zhang, J. L., Reid, J. S., Westphal, D. L., Baker, N. L., and Hyer, E.J.: A system for operational aerosol optical depth data assimila-tion over global oceans, J. Geophys. Res.-Atmos., 113, D10208,doi:10.1029/2007JD009065, 2008.
Atmos. Chem. Phys., 16, 14041–14056, 2016 www.atmos-chem-phys.net/16/14041/2016/