afcts & figures · agreement for quality of life at work won the award for the most innovative...
TRANSCRIPT

Renault13-15, quai Le Gallo92513 Boulogne-Billancourt Cedex – FranceTél. : +33 (0)1 76 84 04 04Groupe Renault Communication
Find all our latest news onwww.Groupe.Renault.comand follow us on social networks:
@Groupe_Renault Groupe Renault @GroupeRenault @GroupeRenault Groupe Renault
FACTS& FIGURES
March 2020 EDITION
FAC
TS &
FIG
UR
ES M
arch
2020
edi
tion

O N E G R O U P E , F I V E B R A N D S 4
—
K E Y F I G U R E S 6
—
I N D U S T R I A L
S I T E S 8
—
M A N U F A C T U R I N G 1 0
—
G L O B A L S A L E S 1 4
—
V E H I C L E R A N G E 3 4
—
S E R V I C E S 4 4
—
A L L I A N C E 4 6
CONT-ENTS
H I G H L I G H T S
HUMAN RESSOURCES: THE NEW GLOBAL FRAMEWORK AGREEMENTThe 1st global framework agreement for quality of life at workwon the award for the most innovative collective agreement.This agreement is already being implemented in all regions.
ZOEremains the top-selling EV in EuropeLaunch of the 3rd generation of Renault ZOE.
CLIO, CAPTURRenault renews its B-segment best-sellers offering the best offering the best in connected,
autonomy and electrification technologies.
INDUSTRY 4.0.2 Renault plants distinguishedby the World Economic Forum- The Cléon plant (France) recognized
as a pioneer in industry 4.0.This automotive industrial site is the first to be recognized in France with this label.
- The plant in Curitiba (Brazil) rewarded as the first «advanced lighthouse»car in Latin America for Industry 4.0.
2 I GROUPE RENAULT I FACTS & FIGURES 2019 GROUPE RENAULT I FACTS & FIGURES 2019 I 3

O N E G R O U P E ,F I V E B R A N D S
https://Groupe.Renault.com/en/our-company/our-brands
Groupe Renault has manufactured cars since 1898. Today it is an international multi-brand groupe. To address the major technological and societal challenges, while continuing to pursue its profitable growth strategy, Groupe Renault is focusing on its dynamic international expansion. To this end, it is drawing on the synergies of its five brands (Renault, Dacia, Renault Samsung Motors, Alpine and LADA), its pioneering know-how in electric mobility and its unique alliance with Nissan and Mitsubishi Motors. With a 100% Renault owned team committed to the Formula 1 World Championship since 2016, the brand is involved in motorsports, a real vector for innovation and awareness.
LADA412,889 VEHICLES SOLDIN 2019 (PC + LCV)The long-standing leader of the Russian market has the country’s largest dealership network with around 300 points of sale.LADA is represented by official importers in over 20 countries with 75 points of sale.With a completely renewed design and a fast changing network, LADA has entered a new era.
RSM79,081 VEHICLES SOLDIN 2019 (PC)Created in 2000, Renault Samsung Motors operates exclusively in South Korea. Particularly reputed for its service quality, RSM was voted number one on customer satisfaction in sales for the 18th consecutive year and after-sales for the 4th consecutive year.
ALPINE4,835 VEHICLES SOLD IN 2019Alpine is the sports-premium brand of Groupe Renault. In 2019 Alpine launched the A lp ine A110S. Developing 292hp, this version delivers an intense Alpine driving experience.The A110S is faithful to the brand’s timeless principles - lightness, compactness and agility -with one promise: driving pleasure.
RENAULT2,357,093 VEHICLES SOLDIN 2019 (PC + LCV)Renault, the leading French global brand, is present in 134 countries.As huge changes occur across the mobility sector, Renault keeps the focus on the human being by designing products and services that reflect the lives and habits of its customers. Renault is an open and generous brand that plants joie de vivre at the very centre of a new, greener mobility which is more shared and connected than ever.
DACIA736,570 VEHICLES SOLDIN 2019 (PC + LCV)Dacia is present in 44 countries, mainly based in Europe and the Mediterranean perimander.Created in Romania in 1968, the brand was bought and relaunched by Groupe Renault with the arrival of Dacia Logan in 2004.Dacia proposes the best value for money cars within the market. With emblematic models such as Logan, Sandero & Duster, Dacia has become a success story and reached 6,5 million customers in 2019.
CLIO
DUSTER
Vesta SW Cross
ALPINE A110S
SM6
4 I GROUPE RENAULT I FACTS & FIGURES 2019 GROUPE RENAULT I FACTS & FIGURES 2019 I 5

(1)�Automotive�operational�Free�cash�flow:�cash�flows�after�interest�and�tax�(excluding�dividends�received�from�publicly�listed�companies)�minus�tangible�and�intangible�investments�net�of�disposals�+/-�change�in�the�working�capital�requirement.
(2) 2019�figures�include�the�impacts�of�the�application�of�IFRS�16�“Leases”�from�January�1,�2019.�The�figures�for�2018�have not been restated.
Revenues In million of euros 2019 2018Automotive 52,132 54,211Sales financing 3,405 3,208Total Groupe Renault 55,537 57,419
Operating profitAutomotive division excluding AVTOVAZ 1,284 2,204AVTOVAZ 155 204Sales financing 1,223 1,204Total Groupe Renault 2,662 3,612% of Group revenues 4.8 % 6.3 %
Net incomeNet income 19 3,451Net income, Group share -141 3,302
Free cash flow and Automotive net cash positionAutomotive operational free cash flow (1) 153 607 Automotive net cash position(2) + 1,734 + 3,702 Shareholders’ equity 35,331 36,088
Contribution from associated companieso/w Nissan 242 1,509o/w Other associated companies -432 31Total -190 1,540
Tangible and intangible investments net of disposalsAutomotive excluding AVTOVAZ 4,846 4,171AVTOVAZ 135 84Sales financing 10 19Total 4,991 4,274
€55,537million
Group Revenues
€2,662million
Group operating profit
€153million
Automotive operational free cash flow (1)
2 0 1 9 K E Y F I G U R E S
(1)Indirect�shareholding�Renault�sas.�(2) The�employee-owned�shares�in�mutual�funds�corporate�investment�(present�and�former�employees)�included�in�this�category�as�well�as�to�registered�shares�held�directly�by�the�beneficiaries�of�free�share�grants�as�from�the�2016�grant�plan.
Wom
enM
en
24.5%
75.5%
-2.7%
-19.5%
-30.3%
-31.1%
-0.5%Under 20 -
Over 59 -
-15.9%20 to 29
30 to 39
40 to 49
50 to 59
WorkforceAt December 31, 2019
Ownership StructureAt December 31, 2019
Daimler Group
Employees(2)
French�StateNissan
Self-owned
Public
3.10%
2.91%
15.01%15%
1.54%
62.44%295,722,284Shares
Financial Information
Structure of the GroupeSimplified organization chart at December 31, 2019 (as a % of shares issued)
Automotive division Associated companies� �Sales�financing
RENAULT S.A.S
RCI BANKRENAULTSAMSUNGMOTORS
ALLIANCEROSTEC AUTO
B.V.
OTHER INDUSTRIALAND COMMERCIAL
COMPANIES
100% 80%(1) 67.61%
AVTOVAZ100%
Breakdown by regionEuropeo/w�27%�France
Eurasiao/w�25.8%�AVTOVAZ
40.7%
10.9%
Africa,� Middle�East,�India,�Pacific
Americas 6.7%
41.6%
China0.04%
179,565Employees
in 39 countries and 21 functions
families
6 I GROUPE RENAULT I FACTS & FIGURES 2019 GROUPE RENAULT I FACTS & FIGURES 2019 I 7

I N D U T R I A L S I T E Sand sales in 2019 of the 10 leading markets
GROUPE RENAULT PLANTS Passenger cars Light Commercial Vehicles (LCVs) Chassis, engines, gearboxes Foundry
PARTNER PLANTS Passenger cars Light Commercial Vehicles (LCVs) Chassis, engines, gearboxes Foundry
LOGISTICS SITES Logistics platform
ALLIANCE SITES Renault-Nissan Alliance plants
SITES IN FRANCE Batilly (Sovab) Caudan (Fonderie de Bretagne) Choisy-le-Roi Cléon Dieppe (Alpine) Douai Flins Le Mans Maubeuge (MCA) Ruitz (STA) Saint-André-de-l’Eure (Sofrastock International)Sandouville Villeurbanne
SITES IN EUROPEBarcelona Cacia Novo Mesto Palencia Seville Valladolid
SITES IN EURASIA Bursa (Oyak-Renault) Izhevsk (AVTOVAZ) Mioveni (Dacia) Moscow Togliatti (AVTOVAZ)
SITES IN AFRICA, MIDDLE EAST, INDIA AND PACIFIC Casablanca (Somaca) Chennai (Renault-Nissan) Oran Pune Tangier (Renault-Nissan) Busan (RSM)
SITES IN CHINA Shenyang (RBJAC) Wuhan (DRAC) Shiyan (eGT-NEV)
SITES IN AMERICAS Córdoba Cuernavaca (Nissan) Curitiba Envigado (Sofasa) Los Andes (Cormecanica)
RUSSIA508,647 SALES*
Moscow TogliattiIzhevsk
CHINA179,494 SALES**
WuhanShenyangShiyan
SOUTH KOREABusan
ALGERIAOran
INDIA88,869 SALES
PuneChennai
TURKEYBursa
ROMANIAMioveni
ARGENTINACórdoba
COLOMBIAEnvigado
CHILELos�Andes
BRAZIL 239,174 SALES
Curitiba MEXICOCuernavaca
BatillySandouville
Dieppe
Ruitz
Douai
Maubeuge
UK109,952 SALES
GERMANY247,155 SALES
SLOVENIANovo Mesto
ITALIA220,403 SALES
SPAIN183,264 SALES
BarcelonaPalenciaSeville
Valladolid��
PORTUGAL Cacia
FRANCE698,723 SALES
CaudanSaint-André-de-l’Eure
Le�MansCléonFlins
Choisy-le-Roi
Villeurbanne
BELGIUM, LUXEMBOURG90,989 SALES
*�Including�Avtovaz�sales**�Including�Jinbei&Huasong�sales
MOROCCOTangierCasablanca
8 I GROUPE RENAULT I FACTS & FIGURES 2019 GROUPE RENAULT I FACTS & FIGURES 2019 I 9

M A N U F A C T U R I N G
� In�Groupe�Renault�plants
� �In�partners�plants
� ��In�Groupe�Renault�plants and partners plants
Global production by regionAt December 31, 2019
Europe
Eurasia
Americas
China
Africa,�Middle�east,�India,�Pacific
Production by plant and region Automotive plants in Europe - 2019 - France
Plant Activity Production Plant workforceBatilly (Sovab)
Total vehicles
Renault MasterMaster Z.E.Nissan NV400Other
99,328342
6,64541,804
148,119
2,027
Caudan (Casting of Brandagne)
Casting (in tons) 10,612 385
Choisy-le-Roi Gearboxes ESEngines ES
29,40540,974
263
Cléon
GearboxesEngines Electric enginesAluminium casting (in tons)
327,776556,716100,168
16,721
3,492
Dieppe (Alpine) Total vehicles
Alpine 4,2454,245
386
Douai
Total vehicles
EspaceScenicTalisman
8,96167,59715,01691,574
2,993
Flins
Total vehicles
Clio 4ZOENissan Micra
41,93164,06154,118
160,110
2,574
Le Mans
Rear axlesFront axlesCasting (in tons)
1,351,450735,666
95,754
1,811
Maubeuge (MCA)
Total vehicles
Kangoo/CitanKangoo Z.E.Nissan NV250
133,12113,059
3,561149,741
1,725
Ruitz (STA) Automatic gearboxes 63,836 472Sandouville
Total vehicles
Renault TraficNissan NV300Other
101,2347,394
23,603132,231
1,848
Villeurbanne Front axles 295,087 192Total vehicles France 686,020 18,168
Vehicle production inGroupe Renault plants for its partnersAt December 31, 2019
Production by plant and region Automotive plants in Europe - 2019 - outside France
Plant Activity Production Plant workforceSpain – Palencia
Total Palencia Seville Valladolid
Total Valladolid Valladolid Motores Barcelona (Nissan) Total vehicles Spain
MéganeMégane EstateKadjar GearboxesTwizyCapturNew Captur
Engines Casting Alu. (in tons)Alaskan
77,64750,810
111,669240,126 996,394
623199,041
37,342237,006
1,335,8249,621
473477,605
2,378
1,0056,952
Portugal – Cacia Gearboxes 601,910 1,019Slovenia – Novo Mesto
Total vehicles Slovenia
Clio 4 Clio 5Twingo/Smart
32,57843,311
123,227199,116
2,885
Total vehicles Europe outside France 676,721 14,239Total vehicles Europe 1,362,741
RVI 15,580
Datsun 22,536
Daimler 49,969
Fiat 23,031
GM 26,796
Nissan 174,146
1,362,268 473
1,362,741
1,272,429
1,272,429
409,164489
409,653
618,941 100,546719,487
54,101 54,101
(1) Renault�Industriel�vehicle
3,818,411vehicles produced
worldwidein 2019
312,058vehicles produced in
the plants of the Groupein 2019 for its partners
10 I GROUPE RENAULT I FACTS & FIGURES 2019 GROUPE RENAULT I FACTS & FIGURES 2019 I 11

Production by plant and region Automotive plants in AMI Pacific - 2019
Plant Activity Production Plant workforceAlgeria - Oran Logan
SanderoClio 4
18,83623,02618,150
NC*
Total vehicles Algeria 60,012South Korea - Busan (Renault Samsung Motors)
Talisman / SM6Fluence / SM3Fluence / SM3 Z.E.Latitude / SM5Koleos / QM6SM7Nissan RogueTwizyOthersEnginesAlu. casting (in tons)
16,2032,3391,7312,717
67,1823,198
69,4841,124
5080,287
2,436
2,032
Total vehicles South Korea 164,028India - Chennai
(Renault-Nissan plant)
DusterKwidCapturTriber
8,96564,891
70725,983
NC*
Total vehicles India 100,546Morocco - Casablanca (Somaca)
LoganSandero
27,92363,331
1,626
Total vehicles Casablanca 91,254 - Tangier Lodgy
SanderoDokkerLogan MCVOthers
33,829156,593
95,55617,581
88
6,747
Total vehicles Tangier 303,647Total vehicles Morocco 394,901Total vehicles AMI Pacific 719,487
Production by plant and region Automotive plants in Eurasia - 2019 (afterpart)
Production by plant and region Automotive plants in Eurasia - 2019
Plant Activity Production Plant workforceRomania - Mioveni (Dacia)
LoganLogan MCVSanderoNew DusterGearboxesEnginesFront axlesAlu. casting (in tons)
34,24117,06435,188
263,035441,789537,782412,585
25,423
10,980
Total vehicles Roumania 349,528Russia - Moscow Kaptur
DusterNissan TerranoArkana
26,70040,58213,69019,168
NC*
Total vehicles Moscow 100,140 - Togliatti (AvtoVAZ)
LoganSanderoLada X-RayLada LargusLada KalinaLada GrantaLada 4X4Datsun MI-DODatsun ON-DOGearboxesEngines
39,17933,47631,69557,61218,739
123,88425,013
2,97119,56573,03366,363
2,461
Total vehicles Togliatti 352,134 NC*
Production by plant and region Automotive plants in China - 2019
Plant Activity Production Plant workforceWuhan (DRAC) Kadjar
KoleosCapturOthers
4,3407,1831,559
24
NC*
Total vehicles Wuhan 13,106Shenyang (RBJAC) Jinbei Haise, Grand Haise, Granse,
F50, Huasong 737,826 NC*
Total vehicles Shenyang 37,826Shiyan (eGT-NEV) City K-Z.E. 3,169 NC*Total vehicles Shiyan 3,169Total vehicles China 54 101
Production by plant and region Automotive plants in Americas - 2019
Plant Activity Production Plant workforceArgentina - Córdoba
Planta Fundición Aluminio (PFA)
SanderoLoganKangoo (Dokker)Nissan NavaraAlu. casting (in tons)
7,2514,3169,3139,9412,639
1,851
Total vehicles Argentina 30,821Brazil - Curitiba
MasterDusterDuster Pick-upLoganSanderoCapturKwidNew DusterEnginesAlu. casting (in tons)
10,32625,12635,15928,81852,81336,925
122,585107
314,6924,228
5,720
Total vehicles Brazil 311,859Chile - Los Andes (Cormecanica)
Gearboxes 313,566 406
Colombia - Envigado (Sofasa)
LoganSanderoDusterNew Duster
14,17025,32626,540
448
921
Total vehicles Colombia 66,484Mexico - Cuernavaca (Nissan)
Alaskan 489 NC*
Total vehicles Mexico 489Total vehicles Americas 409,653 NC*
Plant Activity Production Plant workforceRussia - Izhevsk (AvtoVAZ)
Lada Vesta 128,486 NC*
Total vehicles Izhevsk 128,486Total vehicles Russia 580,760Turkey - Bursa (Oyak Renault)
Clio 4Clio 4 EstateClio 5FluenceGearboxesEnginesRear AxlesFront axles
152,59929,342
122,45137,749
226,263507,289337,927350,563
6,296
Total vehicles Turkey 342,141Total vehicles Eurasia 1,272,429
* Not Communicated * Not Communicated
12 I GROUPE RENAULT I FACTS & FIGURES 2019 GROUPE RENAULT I FACTS & FIGURES 2019 I 13

G L O B A L S A L E S
15 largest markets of Groupe Renault - 2019 By volume and as a % of TIV, PCs + LCVs, incl. Renault, Dacia, Renault Samsung Motors, LADA and Jinbei&Huasong
Sales*Market
Share (%)France 698,723 25.9Russia** 508,647 29.0Germany 247,155 6.3Brazil 239,174 9.0Italy 220,403 10.5Spain + Canaries 183,264 12.4China*** 179,494 0.7United Kingdom 109,952 4.1Belgium + Luxembourg 90,989 13.1India 88,869 2.5South Korea 86,859 5.0Turkey 85,055 17.8Roumania 72,165 37.6Morocco 70,281 42.4Poland 69,090 11.1
Groupe Renault worldwide sales by brand By sales volume PCs + LCVsRenault 2019 2018Passenger Cars (PCs) 1,944,934 2,123,615Light Commercial Vehicles (LCVs) 412,159 408,987Total Renault 2,357,093 2,532,602
DaciaPassenger Cars (PCs) 690,525 654,996Light Commercial Vehicles (LCVs) 46,045 45,625Total Dacia 736,570 700,621
Renault Samsung MotorsPassenger Cars (PCs) 79,081 84,954
AlpinePassenger Cars (PCs) 4,835 2,094
LADAPassenger Cars (PCs) 400,256 385,181Light Commercial Vehicles (LCVs) 12,633 13,211Total LADA 412,889 398,392
Jinbei&HuasongPassenger Cars (PCs) 8,449 13,416Light Commercial Vehicles (LCVs) 153,452 152,194Total Jinbei&Huasong 161,901 165,610
AvtoVAZPassenger Cars (PCs) 1,354 0
Groupe RenaultPassenger Cars (PCs) 3,129,434 3,264,256Light Commercial Vehicles (LCVs) 624,289 620,017Total Groupe Renault 3,753,723 3,884,273*�Excluding�Twizy�sales��**�Including�Avtovaz�sales��***�Including�Jinbei&Huasong�sales
Groupe Renault worldwide sales(1) by brand and model By sales volume PCs + LCVsPassenger Cars (PCs)Renault 2019 2018Arkana 12,069 0Captur 239,332 230,070Captur GA(2) 69,812 78,907Clio 404,759 415,982Other 3,106 2,906Dokker 2884 2987Duster 126,518 136,377Espace 10,061 12,722Fluence/Fluence Z.E. 100 1,775Kadjar 125,300 133,505Kangoo/Kangoo Z.E. 20,492 33,862Koleos 33,187 68,135Kwid 183,989 171,088K-Z.E. 2,658 0Lodgy 869 1,460Logan 132,380 194,149Master 670 1,586Mégane/Scenic 248,352 279,362Sandero 135,356 188,009Talisman 16,903 23,127Trafic 15,084 17,513Triber 24,192 0Twingo 89,876 90,618ZOE 46,985 39,475Total Renault 1,944,934 2,123,615Dacia 2019 2018Other 47 43Dokker 48,399 48,560Duster 256,982 213,153Lodgy 36,025 35,946Logan 75,394 79,017Sandero 273,678 278,277Total Dacia 690,525 654,996Renault Samsung Motors 2019 2018Qm3 4,702 6,367Qm6 47,640 32,999Sm3/Sm3 Z.E. 3,475 6,485Sm5 3,200 9,492Sm6 16,263 24,800Sm7 3,801 4,811Total Renault Samsung Motors 79,081 84,954Alpine 2019 2018A110 4,835 2,094Total Alpine 4,835 2,094LADA 2019 20184x4 42,070 42,419Other 890 748Granta 148,613 113,314Kalina 93 12,904Largus 48,255 48,341Priora 5 10,594Vesta 127,888 119,318Xray 32,442 37,543Total LADA 400,256 385,181(1)�Including�non-registred�vehicles.�(2) Captur Global Access: Kaptur/Captur outside Europe.
14 I GROUPE RENAULT I FACTS & FIGURES 2019 GROUPE RENAULT I FACTS & FIGURES 2019 I 15

AvtoVAZ 2019 2018Niva 1,354 0Total AvtoVAZ 1,354 0
Total PCs Groupe 3 129 434 3 264 256
Passenger Cars (PCs) (continued)Jinbei&Huasong 2019 2018Total Jinbei&Huasong 8,449 13,416
LADA 2019 20184x4 1,029 868Other 29 18Granta 1,401 1,927Largus 10,174 10,398Total LADA 12,633 13,211
Dacia 2019 2018Other 37 7Dokker 41,988 41,872Duster 3,137 2,824Lodgy 48 65Logan 138 209Sandero 697 648Total Dacia 46,045 45,625
Light Commercial Vehicles (LCVs)Renault 2019 2018Alaskan 1,757 3,736Captur 1,792 1,681Clio 28,442 35,502Other 17,315 17,262Dokker 17,378 14,049Duster Oroch 36,729 36,664Kangoo 95,070 101,611Kangoo Z.E. 10,349 8,684Master/Master Z.E. 108,090 102,822Mégane/Scenic 5,748 6,024Trafic 88,205 79,910ZOE 1,284 1,042Total Renault 412,159 408,987
Jinbei&Huasong 2019 2018Total Jinbei&Huasong 153,452 152,194
Total LCVs Groupe 624,289 620,017
Total PCs + LCVs Groupe 3,753,723 3,884,273
Internationalization of the Groupe% of sales outside the Europe region
983,
682
1,19
4,73
5
1,17
2,69
6
1,37
5,70
4
1,27
7,22
9
1,85
0,25
3
1,32
6,28
8
1,96
3,52
2
1,24
7,10
1
1,80
7,90
2
2010 2011 2012 2013 2014 2015 2016 2017(1) 2018(2) 2019(3)
37.4% 43.1% 50.1% 50.5% 46.0% 42.5% 43.2% 49.2% 50.6% 48.2%
(1)�Including�LADA�from�2017�.��(2)�Including�Jinbei&Huasong�from�2018.�(3)�Including�AvtoVAZ�Niva�from�December�2019
Worldwide automotive market by region By volume and as a % of TIV, PCs + LCVs
Volume% TIV
(PCs+LCVs)Total Europe 17,868,111 20.3France 2,694,063 3.1G9 15,174,048 17.2Total International 70,352,906 79.7Africa - Middle East - India - Pacific 17,967,673 20.4Eurasia 2,801,745 3.2Americas 5,686,261 6.4China 24,923,351 28.3North America 18,973,876 21.5Total Worldwide 88,221,017 100.0
Groupe Renault electric vehicles worldwide salesBy sales volume PCs + LCVs
2019 2018ZOE 48,269 40,517Kangoo Z.E. 10,349 8,686K-Z.E. 2,658 0Sm3 Z.E. 875 1,235Master Z.E. 296 113Fluence Z.E. 0 6Total Z.E. 62,447 50,557
Twizy 3,273 3,916
Groupe Renault worldwide sales by region PCs + LCVs, including Dacia, Renault Samsung Motors,LADA and Jinbei&Huasong
2019 2018Total Europe 1,945,821 1,920,751France 698,723 689,788G9 1,247,098 1,230,963Total International 1,807,902 1,963,522Africa - Middle East - India - Pacific 453,223 561,860Eurasia 750,571 747,729Americas 424,537 437,081China 179,571 216,852Total Worldwide 3,753,723 3,884,273
16 I GROUPE RENAULT I FACTS & FIGURES 2019 GROUPE RENAULT I FACTS & FIGURES 2019 I 17

Total industry volumes, Europe regionBy volume of registrations PCs + LCVs
2019 2018Germany 3,916,208 3,724,842France 2,694,063 2,632,621United Kingdom 2,687,530 2,734,276Italy 2,102,373 2,093,226Spain + Canaries 1,473,983 1,536,664Belgium + Luxembourg 696,809 690,362Poland 622,460 598,358Netherlands 522,723 522,865Sweden 410,118 410,596Austria 372,971 384,837Switzerland 351,900 336,640Czech Republic 270,351 281,662Portugal 262,251 267,721Denmark 259,881 253,394Hungary 184,316 159,654Norway 181,634 186,836Ireland 142,444 151,115Finland 129,799 136,878Greece 122,366 110,490Slovakia 110,091 107,243Baltic States 104,081 86,957Slovenia 84,503 85,571Croatia 72,145 69,190Serbia 29,250 28,000Balkan States 27,979 25,000Republic of Cyprus 14,250 14,833Iceland 13,137 19,953Malta 8,495 9,084TIV Europe 17,868,111 17,658,868
S A L E S E U R O P E R E G I O NTIV weight of main European markets - 2019As a % of TIV, PCs + LCVs
Belgium�+�Luxembourg
France
Poland 3.5%
Spain�+�Canaries8.2%
3.9%
15.1% United-Kingdom15%
Others20.6%
Italy11.8%
Germany21.9%17,868,111
Sales(1) and market share of the Renault brand As a % of TIV, PCs + LCVs
2019 2018
Renault markets SalesMarket
share (%) SalesMarket
share (%)France 554,975 20.6 547,026 20.8Germany 160,793 4.1 158,228 4.2Italy 131,796 6.3 142,295 6.8Spain + Canaries 113,018 7.7 124,382 8.1United Kingdom 78,830 2.9 79,216 2.9Belgium + Luxembourg 66,622 9.6 66,918 9.7Poland 37,238 6.0 36,604 6.1Portugal 37,007 14.1 39,659 14.8Netherlands 34,926 6.7 48,173 9.2Austria 22,279 6.0 22,692 5.9Sweden 19,737 4.8 19,426 4.7Switzerland 16,162 4.6 16,551 4.9Denmark 15,080 5.8 16,461 6.5Slovenia 12,333 14.6 13,051 15.3Czech Republic 12,326 4.6 12,556 4.5Ireland 10,186 7.2 10,625 7.0Hungary 9,917 5.4 8,787 5.5Croatia 7,487 10.4 7,749 11.2Baltic States 6,540 6.3 6,272 7.2Slovakia 5,029 4.6 5,311 5.0Finland 4,605 3.5 4,124 3.0Greece 4,504 3.7 4,413 4.0Norway 3,426 1.9 5,217 2.8Serbia 2,405 8.2 2,281 8.1Balkan States 1,718 6.1 1,842 7.4Malta 490 5.8 528 5.8Republic of Cyprus 488 3.4 84 0.6Iceland 485 3.7 1,001 5.0Total Renault 1,370,402 7.7 1,401,472 7.9(1)�Excluding�sales�to�government�departments.
18 I GROUPE RENAULT I FACTS & FIGURES 2019 GROUPE RENAULT I FACTS & FIGURES 2019 I 19

Sales(1) and market share of the Dacia brandBy volume and as % of TIV, PCs + LCVs
2019 2018
Dacia markets SalesMarket
share (%) SalesMarket
share (%)France 140,568 5.2 141,606 5.4Italy 88,499 4.2 66,377 3.2Germany 83,518 2.1 74,525 2.0Spain + Canaries 70,189 4.8 65,102 4.2Poland 31,809 5.1 26,839 4.5United Kingdom 30,951 1.2 24,249 0.9Belgium + Luxembourg 23,998 3.4 21,781 3.2Czech Republic 15,542 5.7 16,069 5.7Hungary 12,152 6.6 9,713 6.1Austria 9,839 2.6 10,387 2.7Switzerland 8,547 2.4 8,813 2.6Portugal 6,851 2.6 6,849 2.6Slovakia 6,145 5.6 5,095 4.8Sweden 5,001 1.2 4,634 1.1Slovenia 4,250 5.0 3,139 3.7Croatia 4,162 5.8 3,378 4.9Netherrands 3,420 0.7 4,967 0.9Denmark 3,354 1.3 3,157 1.2Baltic States 3,263 3.1 2,205 2.5Ireland 3,103 2.2 3,719 2.5Balkan States 2,431 8.7 2,184 8.7Serbia 2,290 7.8 2,027 7.2Greece 2,036 1.7 1,414 1.3Finland 1,829 1.4 2,085 1.5Iceland 700 5.3 717 3.6Norway 165 0.1 263 0.1Republic of Cyprus 118 0.8 3 0.0Malta 106 1.2 119 1.3Total Dacia 564,836 3.2 511,416 2.9
Sales(1) of the Alpine brandBy sales volume PCs
(1)�Excluding�sales�to�government�departments.
Alpine markets 2019 2018France 3,172 1,156Germany 324 218Belgium + Luxembourg 302 89Switzerland 183 145United Kingdom 171 142Italy 62 35Netherrands 57 52Austria 54 46Spain + Canaries 39 27Portugal 24 14Sweden 20 0Poland 16 19Czech Republic 4 2Hungary 1 0Norway 1 0Baltic States 1 1Total Alpine 4,431 1,946
Sales(1) of the LADA brand By sales volume PCs + LCVs
(1)�Excluding�sales�to�government�departments.
LADA markets 2019 2018Germany 2,520 2,684Slovakia 1,023 652Hungary 635 879Baltic States 444 421Serbia 413 526Balkan States 379 128Austria 221 248Czech Republic 136 102Belgium + Luxembourg 67 25Italy 46 60Poland 27 18Spain + Canaries 18 2Switzerland 17 10France 8 0Croatia 6 4Finland 3 9Slovenia 2 12Sweden 0 6Total LADA 5,965 5,786
Groupe Renault sales(1) by brand and model By sales volume PCs + LCVs
Passenger Cars (PCs)Renault 2019 2018Captur 223,199 213,149Clio 316,256 332,636Other 1,248 1,133Espace 9,561 12,072Kadjar 109,884 100,805Kangoo/Kangoo Z.E. 9,877 20,725Koleos 12,222 19,233Master 608 975Mégane/Scenic 204,189 229,276Talisman 16,021 19,971Trafic 14,430 16,974Twingo 86,940 87,020ZOE 45,745 38,433Total Renault 1,050,180 1,092,402Dacia 2019 2018Other 47 43Dokker 33,222 32,243Duster 212,660 171,322Lodgy 29,734 28,520Logan 36,394 37,219Sandero 217,085 207,806Total Dacia 529,142 477,153Alpine 2019 2018A110 4,431 1,946Total Alpine 4,431 1,946(1)�Excluding�sales�to�government�departments.
20 I GROUPE RENAULT I FACTS & FIGURES 2019 GROUPE RENAULT I FACTS & FIGURES 2019 I 21

Passenger Cars (PCs) (continued)LADA 2019 20184x4 2,962 2,718Other 834 748Granta 14 157Kalina 81 529Vesta 1,510 1,255Total LADA 5,401 5,407
Total PCs Groupe 1,589,154 1,576,908
Dacia 2019 2018Other 37 7Dokker 32,063 31,069Duster 2,786 2,341Lodgy 48 65Logan 113 187Sandero 665 623Total Dacia 35,712 34,292
Light Commercial Vehicles (LCVs)Renault 2019 2018Alaskan 967 2,580Captur 1,755 1,638Clio 27,957 35,005Other 16,156 14,346Kadjar 692 878Kangoo 88,070 82,787Kangoo Z.E. 10,077 8,412Master/Master Z.E. 83,960 81,922Mégane/Scenic 5,738 6,015Trafic 83,519 74,370Twingo 218 183ZOE 1,282 1,036Total Renault 320,391 309,172
LADA 2019 20184x4 535 361Other 29 18Total LADA 564 379
Total LCVs Groupe 356,667 343,843
Total PCs + LCVs Groupe 1,945,821 1,920,751
Total industry volumes Africa - Middle East - India - Pacific regionBy volume, PCs + LCVs
Main markets 2019 2018Japan 5,088,912 5,167,100India 3,528,040 3,976,113South Korea 1,752,013 1,781,677Thailand 1,050,577 1,041,689Indonesia 1,040,754 1,151,308Australia 1,034,379 1,121,396Malaysia 599,174 598,714Saudi Arabia 530,000 410,699South Africa + Namibia 509,468 525,886Philippines 415,826 401,345Vietnam 280,742 246,500Israel 258,622 271,497Pakistan 186,581 254,938Egypt 170,000 184,456Morocco 165,916 177,359TIV Africa - Middle East - India - Pacific 17,967,673 19,627,437
S A L E S A F R I C A , M I D D L E E A S T , I N D I A A N D P A C I F I C R E G I O N
Sales(1) and market share of the Renault brand By volume and as % of TIV, PCs + LCVs
2019 2018
Main Renault markets SalesMarket
share (%) SalesMarket
share (%)India 88,869 2.5 82,368 2.1Algeria 36,970 29.6 37,505 29.5South Africa + Namibia 27,249 5.3 25,500 4.8Morocco 24,238 14.6 25,769 14.5Egypt 15,550 9.1 18,503 10.0DOM(2) 12,840 16.5 13,155 17.0Israel 9,831 3.8 11,904 4.4Saudi Arabia 8,839 1.7 6,195 1.5Australia 8,634 0.8 10,018 0.9Total Renault 280,569 1.6 374,441 1.9(1) Sales�volume�+�Brokers.�(2) French�Overseas�Departments:�Réunion,�Martinique,�Guadeloupe,�Guyane�and�Saint�Pierre-and-Miquelon.
22 I GROUPE RENAULT I FACTS & FIGURES 2019 GROUPE RENAULT I FACTS & FIGURES 2019 I 23

Sales of the Alpine brandBy sales volume PCs
Alpine markets 2019 2018Japan 349 116Australia 35 32Singapore 15 0DOM(2) 4 0Total Alpine 403 148
Sales of the Jinbei&Huasong brandsBy sales volume PCs + LCVs
Main Jinbei&Huasong markets 2019 2018Egypt 500 0Jordan 200 0Myanmar 129 67South Africa + Namibia 39 511Lebanon 12 20Vanuatu 10 0Cuba 3 287Total Jinbei&Huasong 893 892
Sales(1) and market share of the Dacia brandAs a % of TIV, PCs + LCVs
2019 2018
Main Dacia markets SalesMarket
share (%) SalesMarket
share (%)Morocco 46,043 27.8 49,649 28.0Algeria 23,066 18.5 33,432 26.3DOM(2) 6,879 8.9 6,650 8.6Israel 3,320 1.3 4,622 1.7Tunisia 1,343 2.8 1,055 2.1New Caledonia 887 11.4 784 9.5Tahiti 665 9.1 665 9.3Mayotte 438 20.6 343 19.8Lebanon 316 1.4 648 1.8Total Dacia 89,243 0.5 98,338 0.5
Sales(1) and market share of the LADA brandVolume and en % MTM PCs + LCVs
2019 2018
LADA markets SalesMarket
share (%) SalesMarket
share (%)Egypt 2,603 1.5 2,001 1.1 Lebanon 257 1.1 425 1.2Tunisia 77 0.2 195 0.4 Jordan 97 0.4 122 0.6Total LADA 3,034 0.0 3,087 0.0
Sales(1) and market share of the Renault Samsung Motors brand As a % of TIV, PCs + LCVs
2019 2018
Renault Samsung Motors markets SalesMarket
share (%) SalesMarket
share (%)South Korea 79,081 5.2 84,954 5.5Total Renault Samsung Motors 79,081 0.5 84,954 0.5
(1) Sales�volume�+�Brokers.�(2) French�Overseas�Departments:�Réunion,�Martinique,�Guadeloupe,�Guyane�and�Saint�Pierre-and-Miquelon.
Groupe Renault sales(1) by brand and model By sales volume PCs + LCVs
Passenger Cars (PCs)Renault 2019 2018Captur 10,112 9,169Captur GA 1,782 3,680Clio 49,693 46,947Other 1,660 1,743Duster 22,734 25,078Kadjar 5,998 8,882Kangoo/Kangoo Z.E. 10,552 11,653Koleos 4,438 9,573Kwid 66,138 78,034Lodgy 634 1,228Logan 31,536 88,480Mégane/Scenic 15,888 14,418Sandero 9,886 49,814Talisman 297 2,120Twingo 2,936 3,598Triber 24,192 0Trafic 490 410ZOE 499 634Total Renault 259,465 355,461
Renault Samsung Motors 2019 2018Qm3 4,702 6,367Qm6 47,640 32,999Sm3/Sm3 Z.E. 3,475 6,485Sm5 3,200 9,492Sm6 16,263 24,800Sm7 3,801 4,811Total Renault Samsung Motors 79,081 84,954Alpine 2019 2018A110 403 148Total Alpine 403 148
Jinbei 2019 2018Total Jinbei 5 20
Total PCs Groupe 427,742 539,097
Dacia 2019 2018Dokker 11,750 13,094Duster 19,203 14,447Lodgy 3,283 3,402Logan 12,606 14,508Sandero 38,990 50,057Total Dacia 85,832 95,508
LADA 2019 20184x4 203 400Granta 2,670 2,054Kalina 0 48Largus 24 87Vesta 59 417Total LADA 2,956 3,006
(1)�Sales�volume�+�Brokers.
24 I GROUPE RENAULT I FACTS & FIGURES 2019 GROUPE RENAULT I FACTS & FIGURES 2019 I 25

Light Commercial Vehicles (LCVs) (continued)Renault 2019 2018Alaskan 72 197Captur 37 43Clio 484 497Other 262 241Dokker 3,939 2,916Duster Oroch 397 366Kangoo/Kangoo Z.E. 3,823 4,287Logan 0 1,629Master 9,381 5,944Trafic 2,709 2,860Total Renault 21,104 18,980Dacia 2019 2018Dokker 3,257 2,734Duster 122 71Sandero 32 25Total Dacia 3,411 2,830LADA 2019 2018Largus 78 81Total LADA 78 81Jinbei 2019 2018Total Jinbei 888 872
Total LCVs Groupe 25,481 22,763
Total PCs + LCVs Groupe 453,223 561,860
Total industry volumes EurasiaBy volume, PCs + LCVs
Main markets 2019 2018Russia 1,754,297 1,800,591Turkey 479,060 620,937Romania 191,922 179,397Ukraine 97,608 86,613Kazakhstan 72,081 58,253Uzbekistan 68,000 61,400Belarus 63,275 52,345Bulgaria 43,767 42,731TIV Eurasia 2,801,745 2,930,643
Sales and market share of the Renault brandAs a % of TIV, PCs + LCVs
2019 2018
Main Renault markets SalesMarket
share (%) SalesMarket
share (%)Russia 144,989 8.3 137,062 7.6Turkey 64,977 13.6 85,839 13.8Romania 16,702 8.7 14,853 8.3Ukraine 16,480 16.9 11,025 12.7Belarus 11,895 18.8 11,310 21.6Total Renault 263,110 9.4 267,538 9.1
Sales and market share of the Dacia brandAs a % of TIV, PCs + LCVs
2019 2018
Main Dacia markets SalesMarket
share (%) SalesMarket
share (%)Romania 55,463 28.9 54,593 30.4Turkey 20,006 4.2 29,918 4.8Bulgaria 5,772 13.2 5,170 12.1Moldavia 1,232 17.9 1,157 18.1Total Dacia 82,473 2.9 90,838 3.1
S A L E S E U R A S I A R E G I O N
26 I GROUPE RENAULT I FACTS & FIGURES 2019 GROUPE RENAULT I FACTS & FIGURES 2019 I 27
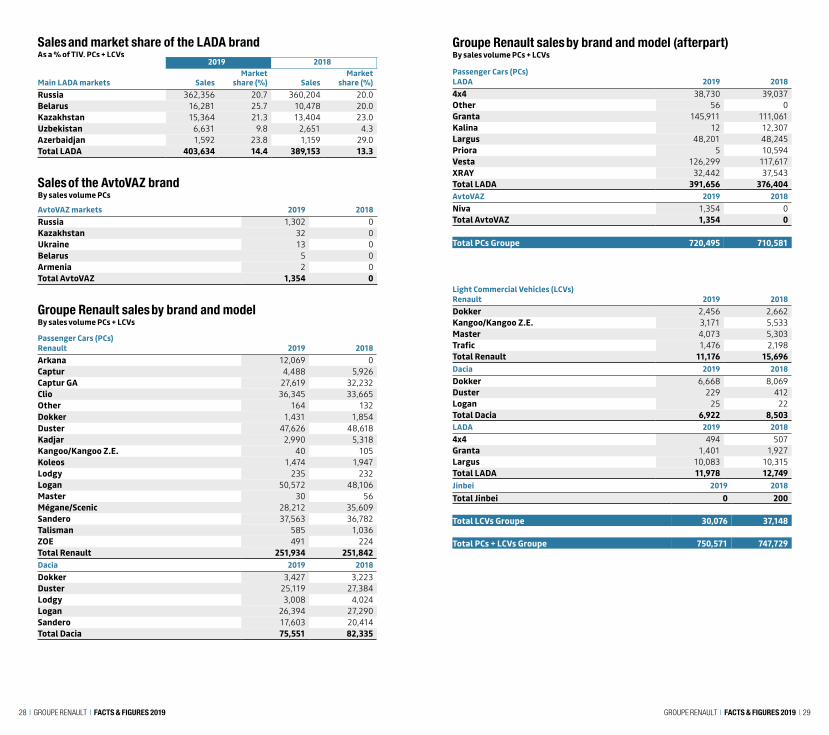
Sales and market share of the LADA brandAs a % of TIV, PCs + LCVs
2019 2018
Main LADA markets SalesMarket
share (%) SalesMarket
share (%)Russia 362,356 20.7 360,204 20.0Belarus 16,281 25.7 10,478 20.0Kazakhstan 15,364 21.3 13,404 23.0Uzbekistan 6,631 9.8 2,651 4.3Azerbaidjan 1,592 23.8 1,159 29.0Total LADA 403,634 14.4 389,153 13.3
Sales of the AvtoVAZ brandBy sales volume PCs
AvtoVAZ markets 2019 2018Russia 1,302 0Kazakhstan 32 0Ukraine 13 0Belarus 5 0Armenia 2 0Total AvtoVAZ 1,354 0
Groupe Renault sales by brand and model By sales volume PCs + LCVs
Passenger Cars (PCs)Renault 2019 2018Arkana 12,069 0Captur 4,488 5,926Captur GA 27,619 32,232Clio 36,345 33,665Other 164 132Dokker 1,431 1,854Duster 47,626 48,618Kadjar 2,990 5,318Kangoo/Kangoo Z.E. 40 105Koleos 1,474 1,947Lodgy 235 232Logan 50,572 48,106Master 30 56Mégane/Scenic 28,212 35,609Sandero 37,563 36,782Talisman 585 1,036ZOE 491 224Total Renault 251,934 251,842Dacia 2019 2018Dokker 3,427 3,223Duster 25,119 27,384Lodgy 3,008 4,024Logan 26,394 27,290Sandero 17,603 20,414Total Dacia 75,551 82,335
Light Commercial Vehicles (LCVs)Renault 2019 2018Dokker 2,456 2,662Kangoo/Kangoo Z.E. 3,171 5,533Master 4,073 5,303Trafic 1,476 2,198Total Renault 11,176 15,696Dacia 2019 2018Dokker 6,668 8,069Duster 229 412Logan 25 22Total Dacia 6,922 8,503LADA 2019 20184x4 494 507Granta 1,401 1,927Largus 10,083 10,315Total LADA 11,978 12,749Jinbei 2019 2018Total Jinbei 0 200
Total LCVs Groupe 30,076 37,148
Total PCs + LCVs Groupe 750,571 747,729
Groupe Renault sales by brand and model (afterpart) By sales volume PCs + LCVs
Passenger Cars (PCs)LADA 2019 20184x4 38,730 39,037Other 56 0Granta 145,911 111,061Kalina 12 12,307Largus 48,201 48,245Priora 5 10,594Vesta 126,299 117,617XRAY 32,442 37,543Total LADA 391,656 376,404AvtoVAZ 2019 2018Niva 1,354 0Total AvtoVAZ 1,354 0
Total PCs Groupe 720,495 710,581
28 I GROUPE RENAULT I FACTS & FIGURES 2019 GROUPE RENAULT I FACTS & FIGURES 2019 I 29

Total industry volumes AmericasBy sales volume , PCs + LCVsMain markets 2019 2018Brazil 2,651,737 2,468,434Mexico 1,317,727 1,421,458Argentina 441,507 773,641Chile 345,512 417,495Colombia 248,689 245,622Peru 155,697 147,916Ecuador 120,516 130,783Porto Rico 101,931 90,000TIV Americas 5,686,261 6,021,047
Sales(1) and market share of the Renault brandAs a % of TIV, PCs + LCVs
2019 2018
Main Renault markets SalesMarket
share (%) SalesMarket
share (%)Brazil 239,173 9.0 214,822 8.7Argentina 63,453 14.4 114,348 14.8Colombia 56,639 22.8 49,588 20.2Mexico 32,890 2.5 27,784 2.0Chile 8,719 2.5 13,503 3.2Total Renault 420,897 7.4 436,162 7.2
Sales of the LADA brandBy sales volume PCs + LCVsLADA markets 2019 2018Bolivia 209 181Chile 47 185Total LADA 256 366
S A L E S A M E R I C A S R E G I O N
Groupe Renault sales by brand and model By sales volume PCs + LCVs
Passenger Cars (PCs)Renault 2019 2018Captur 566 1,025Captur GA 40,411 42,995Clio 2,449 2,698Other 285 213Dokker 1,402 1,132Duster 56,158 62,681Fluence/Fluence Z.E. 95 1,631Kangoo 23 1,379Koleos 3,737 4,592Kwid 117,851 93,054Logan 50,272 57,563Master 27 540Sandero 87,907 101,413ZOE 228 108Total Renault 361,411 371,024LADA 2019 20184x4 175 264Granta 18 42Kalina 0 20Largus 30 9Vesta 20 29Total LADA 243 364Alpine 2019 2018A110 1 0Total Alpine 1 0Jinbei 2019 2018Total Jinbei 2,464 0
Total PCs Groupe 364,119 371,388
Sales of the Alpine brandBy sales volume PCsAlpine markets 2019 2018Brazil 1 0Total Alpine 1 0
Sales of the Jinbei brandBy sales volume PCsMain Jinbei markets 2019 2018Chile 1,716 0Pérou 908 178Bolivia 552 222Total Jinbei 3,383 553
Light Commercial Vehicles (LCVs)Renault 2019 2018Alaskan 718 959Clio 1 0Dokker 10 982 8 471Duster Oroch 36 332 36 298Kangoo/Kangoo Z.E. 276 9 275Master 10 676 9 653Trafic 501 482Total Renault 59 486 65 138LADA 2019 2018Largus 13 2Total LADA 13 2Jinbei 2019 2018Total Jinbei 919 553
Total LCVs Groupe 60 418 65 693
Total PCs + LCVs Groupe 424 537 437 081
30 I GROUPE RENAULT I FACTS & FIGURES 2019 GROUPE RENAULT I FACTS & FIGURES 2019 I 31

Total industry volumes ChinaBy sales volume, PCs + LCVsMain markets 2019 2018China 24,464,235 26,678,536Taiwan 425,000 423,182Hong Kong 34,116 39,139TIV China 24,923,351 27,140,857
Sales of the Jinbei&Huasong brandsBy sales volume PCs + LCVsMain Jinbei&Huasong markets 2019 2018China 157,625 163,965Total Jinbei&Huasong 157,625 163,965
Sales(1) and market share of the Renault brandBy volume and as a % of TIV, PCs + LCVs
2019 2018
Main Renault markets SalesMarket
share (%) SalesMarket
share (%)China 21,869 0.1 52,734 0.2Hong Kong 77 0.2 153 0.4Total Renault 21,946 0.1 52,887 0.2
S A L E S C H I N A R E G I O N
Light Commercial Vehicles (LCVs)Renault 2019 2018Kangoo/Kangoo Z.E. 2 1Total Renault 2 1Jinbei&Huasong 2019 2018Total Jinbei&Huasong 151,645 150,569
Total LCVs Groupe 151,647 150,570
Total PCs + LCVs Groupe 179,571 216,852
Groupe Renault sales by brand and model By sales volume PCs + LCVs
Passenger Cars (PCs)Renault 2019 2018Captur 967 801Clio 16 36Other 4 8Espace 497 640Kadjar 6,428 18,500Koleos 11,316 32,790K-Z.E. 2,658 0Mégane/Scenic 36 35ZOE 22 76Total Renault 21,944 52,886Jinbei&Huasong 2019 2018Total Jinbei&Huasong 5,980 13,396
Total PCs Groupe 27,924 66,282
32 I GROUPE RENAULT I FACTS & FIGURES 2019 GROUPE RENAULT I FACTS & FIGURES 2019 I 33

V E H I C L E R A N G E
RENAULT - Passenger Cars - Europe
New Twingo
Scenic Also exists in an Grand Scenic version
New Clio
New Mégane Also exists in Estate version
Kadjar
New Captur
TalismanAlso exists in an Estate version
New Koleos
New Espace Kangoo
Trafic Combi
Mégane R.S.
RENAULT - Sport cars
34 I GROUPE RENAULT I FACTS & FIGURES 2019 GROUPE RENAULT I FACTS & FIGURES 2019 I 35

RENAULT - Passenger cars internationally
Sandero Stepway Kaptur
DusterMégane Sedan
Oroch
Kwid Logan
New Koleos
RENAULT - Light Commercial Vehicles (LCVs)
Alaskan
New Trafic
Kangoo Express
New Master
36 I GROUPE RENAULT I FACTS & FIGURES 2019 GROUPE RENAULT I FACTS & FIGURES 2019 I 37

ALPINE
Kangoo Z.E.
New Master Z.E.
RENAULT - Electric vehicles
Twizy
Renault City K-Z.E.
New ZOE
Alpine A110 Dokker Van
DACIA - Light Commercial Vehicles (LCVs)
DACIA - Passenger cars
Dokker/Dokker Stepway Lodgy/Lodgy Stepway
Logan Logan MCV/Logan MCV Stepway
Sandero/Sandero StepwayDuster
38 I GROUPE RENAULT I FACTS & FIGURES 2019 GROUPE RENAULT I FACTS & FIGURES 2019 I 39

RSM
SM3
SM7 QM6
SM.SM6 QM3
SM5 SM3 Z.E.
LADA
New Vesta SportVesta
Granta Cross
Largus/Largus Cross
4x4
Vesta SW/Vesta SW Cross
Granta
XRAY/XRAY Cross
40 I GROUPE RENAULT I FACTS & FIGURES 2019 GROUPE RENAULT I FACTS & FIGURES 2019 I 41

P O W E R T R A I N R A N G EAs a full-line carmaker, Groupe Renault offers a range of powertrains adapted to the needs of its customers around the world.
EnginesPetrol engines
Normally aspirated Turbo
B4A SCe 55
H4Bt TCe 75/90/LPG
B4D SCe 65/70/75
1.0 SCe / 1.0 SCe FlexH4Dt
TCe 95/100/LPG
H4K 1.5 16v 106
H5Ft TCe 115/130
K7M 1.6 8v 85
M5Mt TCe 190/205/220
K4M 1.6 16v 105/ 1.6 16v 110
M5Pt TCe 225/250/300/Alpine A110
H4M SCe 100/115/125
1.6 SCe Flex SCe 110 LPG / SCe 115 LPG
F4R 2.0 16v 145
2.0 16v 150 FlexQR25
SCe 170/175
Diesel enginesK9K
dCi 70/75/85/90/95/110 Blue dCi 75/80/95/115
R9M dCi 95/130
R9M Twiszn Turbo dCi 160
R9N dCi 120/150/160
M9R dCi 175
Blue dCi 120/145/160/170/190/200M9T
dCi 110/125/130/150M9T Twiszn Turbo
dCi 130/145/165/170 Blue dCi 140/150/180
Electric engines
5AM Gen2 65kW/70kW
3CG 4kW / 13kW5AQ Gen3
44/57/80/100 kW5AL Gen3
63kW
4DB 33kW
GearboxesManual Automated manual Automatic
SG1 MT5 - 100 N.m
SA1 AM5 - 120 N.m
DP AT4 2WD /4WD - 250 N.m
JH3-JHQ MT5 - 160 N.m
JS3 AM5 - 160 N.m
AJ AT6 - 4WD 450 N.m
JRQ MT5 - 200 N.m
TS4 AM6 - 260 N.m
HG AT7 - 4WD 450 N.m
TL4 MT6 - 260 N.m
PA0 AM6 - 380 N.m
DC EDC7 - 240 N.m
TL6 MT6 285 N.m
DW6 EDC6 - 450 N.m
ND4 MT6 - 320 N.m
DW5 EDC7 - 300/320 N.m
ND5 MT6 - 340 N.m
DXK C VT – 150 N.m
PF6 MT6 - 380 N.m
FK CVT 2WD/4WD –
250/380 N.m PK4
MT6 - 400 N.m UK
CVT 2WD/4WD – 330 N.m
JT4 MT6 - 220 N.m
JE3 MT5 - 160 N.m
ZF4 MT6 - 380 N.m
ND8 MT6 - 4WD - 360 N.m
TL8 MT6 - 4WD - 260 N.m
42 I GROUPE RENAULT I FACTS & FIGURES 2019 GROUPE RENAULT I FACTS & FIGURES 2019 I 43

S E R V I C E SPurchasingThe Purchasing Division buys the parts, services and equipment for Groupe Renault worldwide operations. It meets all of the company’s needs thanks to a panel of responsible and competitive suppliers in terms of quality, cost, lead time on development and management.Cost of Groupe Renault purchasesScope: worldwide – in billion of euros 2019 2018Automotive components( (1) 26.87 27.59Industrial goods, tertiary purchasing and services, logistics 6.64 6.82After-sales (2) 1.65 1.75Total 35.16 36.16(1) Including Alliance component purchasing (Nissan, Daimler and AVTOVAZ). (2) Including tires and accessories purchasing..
Supply ChainThe Supply Chain’s activities extend from parts suppliers all the way to the transport of vehicles to customers; and from the project phase through to production and delivery.AILN platform activities Volumes (in m3) at December 31, 2019
AILN Platforms Total
IPO (1)
exportactivity
KD (2)
exportactivity
Localdistribution
activity(3)Import
activityBursa (Turkey) 821,769 654,990 166,779Busan (South Korea) 97,223 97,223Chennai (India) 200,693 192,759 7,934Córdoba (Argentina) 21,081 17,439 3,642Curitiba (Brazil) 258,161 258,161Grand-Couronne (France) 333,825 304,086 29,739Mioveni (Romania) 1,921,774 1,921,774Moscow (Russia) 350,657 350,657Pune (India) 82,738 82,618 120Tangiers (Morocco) 92,913 92,913Valladolid (Spain) 387,350 239,000 47,500 15,350 85,500Total 4,568,184 4,211,620 47,500 193,825 115,239(1) Individual Parts Orders. (2) Knock Down. (3) Local distribution activity (for after-sales).
Sales NetworkGroupe Renault sells its vehicles and services of the Renault, Dacia, Renault Samsung Motors, Alpine, LADA and Jinbei brands worldwide through around 12,800 points of sales. There are 10,898 sites for Renault, 7,969 for Dacia (mostly in common with Renault), 665 for RSM, 594 for LADA, 81 for Alpine and 288 for Jinbei.Number of Renault sites at the end of 2019Region R1* sites Incl. France R2** sites Incl. France Total sitesEurope 2,469 649 5,709 3,185 8,178AMI Pacific 953 190 1,143Eurasia 409 48 457China 191 191Americas 850 79 929Total 4,872 6,026 10,898
RCI Bank and ServicesRCI Bank and Services is a wholly-owned subsidiary of Renault SAS.New financing and outstanding loansIn million of euros 2019 2018Penetration rate excluding companies accounted(1) (for NV) 44.2% 42.9 %New vehicle financing 21,395 20,922Number of vehicle contracts (in thousands) 1,798 1,799Average performing assets 47,410 44, 402(1) Companies accounted for under the equity mandhod are Russia, Turkey and India.
Services activity: RCI Bank and Services is stepping up the development of this activity, with 5,092,196 contracts sold in 2019.Penetration and net assets by regionNet assets at year-end as a % and in million of euros
2019 2018 2019 2018France 49.3 % 47.5 % 14,421 14,324Europe (with France) 45.4 % 44.9 % 42,286 41,832Africa, Middle East, India 40.9 % 27.8 % 2,009 493Americas 38.0 % 35.0 % 2,844 2,769Eurasia 29.7 % 27.0 % 271 258
Batilly
DouaiMaubeuge
FRANCE
SLOVENIANovo Mesto
ROMANIAPitesti
PalenciaValladolid��
TangierCasablanca
SandouvilleHeudebouville
FlinsLe�Plessis-Robinson
TURKEYBursa
12 satellites opened at Groupe Renault factories�(including�Dacia)�Head�office�and�dedicated�factory�Sales�department
Renault TechMissionFor more than 10 years Renault Tech, thanks to its unique know-how in terms of industrial tailor-made , designs, produces and commercializes vehicle conversions and provides all associated services for the entire Groupe Renault, the Alliance and partners, in response to the needs of both private and professional customers, in compliance with the Groupe Quality standards.
2019 key figures
488WORKFORCE
€119 MREVENUE
282,271TRANSFORMATIONS
*��Primary�network.�*�*�Secondary�network. MOROCCO
44 I GROUPE RENAULT I FACTS & FIGURES 2019 GROUPE RENAULT I FACTS & FIGURES 2019 I 45

A L L I A N C E
2019, a new start for the Alliance
On 12 March 2019, an Alliance Operating Board was set up to supervise the operations and governance of the Renault - Nissan - Mitsubishi Motors Alliance; the sign of a new start for the world’s very first automotive alliance.
Chaired by Jean-Dominique Senard, the Board consists of Makoto Uchida, CEO of Nissan, Osamu Masuko, CEO of Mitsubishi Motors, and Clotilde Delbos, temporary acting CEO of Renault. It meets every month in Paris, Yokohama or Tokyo.
On the basis of consensus, its members jointly take decisions that are designed to reinforce the Alliance’s operational efficiency, the key to the strategic growth and increased competitiveness of each of the three companies.
Hadi Zablit, General Secretary, coordinates and facilitates Alliance projects.He reports to the Alliance Operating Board and the CEOs of the three companies.
Makoto Uchida, Clotilde Delbos, Jean-Dominique Senard, Osamu Masuko, Hadi Zablit
Notes
46 I GROUPE RENAULT I FACTS & FIGURES 2019 GROUPE RENAULT I FACTS & FIGURES 2019 I 47

Notes
48 I GROUPE RENAULT I FACTS & FIGURES 2019 GROUPE RENAULT I FACTS & FIGURES 2019 I 49

Notes
Photo credits: cover: ©Julien Oppenheim – P. 4-5 : Renault ©Jean-Brice Lemal, RSM ©Renault Samsung Motor, Alpine ©Yannick BROSSARD, Dacia ©Jean-Brice Lemal, LADA ©LADA – P. 21-24 : ©Renault Markanding 3D-Commerce – P. 25 ©Renault communication – P.26 : ©AVTOVAZ GroupeDesign and production: Axiom-Graphic.
50 I GROUPE RENAULT I FACTS & FIGURES 2019

Renault 13-15, quai Le Gallo92513 Boulogne-Billancourt Cedex – FranceTél. : +33 (0)1 76 84 04 04Groupe Renault Communication
Find all our latest news onwww.Groupe.Renault.comand follow us on social networks:
@Groupe_Renault Groupe Renault @GroupeRenault @GroupeRenault Groupe Renault
FACTS& FIGURES March 2020 EDITION
FAC
TS &
FIG
UR
ES M
arch
202
0 ed
itio
n