afdb · them to create business, this could have a “snow ball” effect on their welfare and the...
TRANSCRIPT

AfDB
A f r i c a n D e v e l o p m e n t B a n k
The Role of Nascent Entrepreneurshipin Driving Inclusive Economic Growthin North Africa
2016www.afdb.org
W o r k i n g B r i e fNorth Africa Policy Series
Key Messages
• T his study analysed the role of nascent entrepreneurship in driving inclusive growth in North
Africa. Inclusive growth is economic growth that allows vulnerable population (poor, women,
youth), to participate in, contribute equally to, and benefit from economic growth. The vulnerable
population can participate to economic growth through the private by two ways including as
employees (job creation) or as business owners (entrepreneurship). This policy paper examined
the determinants for the vulnerable population to act as business creators or owners. Using
the GEM unique survey data on 4 out of 5 North Africa countries including Algeria, Egypt,
Morocco and Tunisia, we assessed the determinants that allow an individual to create a
business. These characteristics allowed us to draw policy recommendations for governments
to support the vulnerable population to create business and then participate to economic
growth.
• The empirical results show that at the very early stage of business creation (nascent
entrepreneurship), young adults (25-34 years old) with secondary education are more involved
in business creation. However, when it comes to the steps to create or run a business, it is
mostly individuals with a job, coming from wealthy family and with access to informal investors
that are active. Gender seems to have low impact on the decision to participate to business
creation. Policy recommendations include the implementation of entrepreneurship trainings
and ease of access to finance for the vulnerable population.
Keywords: Private sector, Inclusive economic growth, Entrepreneurship, North Africa.
This paper was prepared by Hela Miniaoui (Université de Wollongong à Dubaï, Emirats arabes unis), Gaston Gohou (CESSInstitute, Québec, Canada) and Vincent Castel (Chief Country Economist, ORNA). Overall guidance was received fromJacob Kolster (Director, ORNA).This document was prepared by the African Development Bank (AfDB). Designations employed in this publication do not implythe expression of any opinion on the part of the institution concerning the legal status of any country, or the limitation of itsfrontier. While efforts have been made to present reliable information, the AfDB accepts no responsibility whatsoever for anyconsequences of its use.
CONTENTS
Introduction p.2
1 – Private Sector andEntrepreneurship in NorthAfrica p.3
1.1 The Private Sector as a Leaderin North Africa p.3
1.2 North Africa DevelopmentChallenges p.3
1.3 Overview and Definitions ofInclusive Growth p.4
2 – Entrepreneurial Process,Results and Public PolicyChallenges p.6
2.1 Entrepreneurship p.6
2.2 GEM survey and Data:Processes Affecting BusinessCreation p.7
2.3 Descriptive Statistics p.7
2.4 Measuring the Stage ofParticipation in Business Creation:Main Results p.8
2.4.1 Total Entrepreneurial Activity(TEA) Results p.8
2.4.2 Nascent Entrepreneurs Results p.8
2.4.3 New Firms’ Owners Results p.9
3 – Conclusions andRecommendations p.10
4 – References p.12
Annex p.15
Jacob KolsterDirector ORNA [email protected]+216 7110 2065

A f r i c a n D e v e l o p m e n t B a n k
2
AfDBW o r k i n g P a p e r
North Africa Policy Series
2 0 1 6 • w w w . a f d b . o r g
Most of the North African countries, which had adopted a state-led
centrally planned economic structure since the independence,
could no longer sustain this model and looked to involve the private
sector in job creation, poverty alleviation and other critical tasks
necessary to grow their economies.
Inclusive growth is defined as economic growth that allows all economic
agents of a country, especially the vulnerable population (poor, women,
youth), to participate in, contribute equally to, and benefit from economic
growth, regardless of individual characteristics1.
To ensure that inclusive growth happens in countries, one needs to
make sure that the vulnerable population is participating and contributing
equally to the country economic growth. As it is widely recognized now,
this participation can also be achieved through the private sector, which
should become main driver of economic growth in countries.
Thus, inclusive growth will require greater participation of the vulnerable
population to the private sector. Two options are possible. Vulnerable
population can enter the private sector activities as employees (job
creation) or as business owners (entrepreneurship). As employees,
inclusive growth will focus on job creation, as job is mainly what a poor
can have to improve his or her welfare. The literature on job creation
strategy is abundant and will not be the focus of this policy paper.
The second possibility, enabling the vulnerable population to become
business owner, is not widely discussed in the literature. This policy
paper will hence analyze the conditions of participation to business
creation (or entrepreneurship) and assess the conditions for the
vulnerable population to participate. If the opportunity is available for
them to create business, this could have a “snow ball” effect on their
welfare and the economy as a whole. They will then secure a job for
themselves and also create job for other people than may be vulnerable.
The main objective of this policy paper is to assess the conditions for
the population to participate to entrepreneurship. This policy paper has
two main policy questions: (i) what are the characteristics of the
population that create a firm/business? in other words what are the
determinants (personal context and personal attributes) that drive
individual participation in business creation; and (ii) how the government
can help the vulnerable population to become entrepreneur or business
creators?
Using the GEM unique survey data on 4 out 5 North Africa countries
including Algeria, Egypt, Morocco and Tunisia2, the determinants of
being a business owner were assessed. The empirical results show
that at the very early stage of business creation (nascent entrepreneurship),
young adults (25-34 years old) with only secondary education are more
involved. However, when it comes to the steps to create or run a
business, it is mostly individuals with a job, coming from wealthy
family and with access to informal investors that are active. Gender
seems to have low impact on the decision to participate to business
creation.
This policy paper is organized as followed the next section discusses
the private sector and entrepreneurship in North Africa. The role of the
private sector as a growth engine in North Africa is explained as well
as the government role in stimulating entrepreneurship. The second
section presents the entrepreneurial process and the empirical results.
The last section is the main conclusion and policy recommandations.
These policy recommandations will help policy makers in order to help
nascent entrepreneur to move to new business owners.
Introduction
1 This definition summarizes Ali and Zhuang (2007, 2009) and the international development agencies definition of this concept.2 Libya is excluded mainly for lack of data availability.

A f r i c a n D e v e l o p m e n t B a n k
3
W o r k i n g P a p e rNorth Africa Policy Series
2 0 1 6 • w w w . a f d b . o r g
AfDB
1. Secteur privé et entreprenariat en Afrique du Nord
1.1 The Private Sector as a Leader in North Africa
The North Africa region suffers from a fragile private sector that is weakly
connected with global markets and thrives largely under state
patronage. The weak and dependent private sector is one of the most
pressing development challenges.
Recent research from Africa provides support for the increasing
importance of the private sector in the continent (Lyakurwa,
2009; Benzing and Chu, 2009; Robeinson, 2004; Spring and McDade,
1998).
The private sector plays a crucial role in the development process by
creating jobs, innovating and providing products that can transform
the lives of the most vulnerable . In fact, governments have a role to
encourage productive investment and business practices in developing
countries. The dynamism of the private sector is led by business creation
or entrepreneurship.
Entrepreneurship is defined as the willingness of individuals to take the
initiative to set up their own business, work on their own account and
create jobs for others (Fonsica et al. 2001). The authors showed that,
for a sample of OECD countries, higher start-up costs discourage
entrepreneurs and increase the fraction of the population who become
workers. Job creation suffers and employment settles at a low level.
Sriram and Mersha (2010) identified some important factors that
contribute to the start-up and success of new business ventures. They
highlighted that while individual initiative, competency and resources
are critical for the successful launch of a new business venture,
government policy does also have significant impact in promoting or
inhibiting the effectiveness of such entrepreneurial efforts. The authors
showed that it costs more and takes longer to start a business in the
Sub-Saharan region.
Several factors constitute the business climate such as the global and
domestic macro environment, the physical and social infrastructure;
the rule of law may actively encourage business start-ups or act as a
hurdle. While the North African state has appeared to be busily engaged
in pursuing programs of economic liberalization, it has not so much
retreated as reorganized and retrenched (Murphy, 2001).
The government can intervene at three levels to stimulate
entrepreneurship: an invisible hand, a helping hand, or a grabbing hand
(Frye and Shleifer, 1997). The government has a crucial role in creating
the right business climate, enacting appropriate legislation to facilitate
entrepreneurial initiative, identifying and nurturing start-ups with potential,
and providing the necessary training and education for entrepreneurs.
OECD (2013) analyzed four main areas of interest for entrepreneurship
and enterprise development in the MENA region and considering Algeria,
Egypt, Morocco and Tunisia. The study highlighted that the owner-
managers in the MENA countries appear to have fewer women involved
at all stages of the firm life course and to have a larger proportion of
young adults (18-34 years of age) involved in the early stages of the
business life course (nascent, infant, and young). The completion of
secondary (or high) school revealed to provide some advantage in the
business creation process.
The limited development of entrepreneurship in MENA can be explained
by at least three factors: First, high barriers to do business, particularly
for smaller firms (eg. corruption, complex licenses, rigid labor laws and
unfair competition). Second, cultural norms in which entrepreneurial
activity is seen by young graduates as second best compared with
employment in the public sector, which offers better job security; and
third the very low participation of women in the labor force and in
entrepreneurial activity (OECD-World Economic Forum, 2011).
1.2 North Africa Development Challenges
North African countries present several medium-term challenges (IMF,
2011). Leveraging the potential to return to rapid— but also more
inclusive—economic growth to provide sufficient employment for the
fast growing labor force will be key. This can be achieved by creating
a more transparent and competitive economy, improving the business
environment—especially for small enterprises, and generally providing
more equal access to opportunities for all parts of the society. Sustained
inclusive growth will also require a stable macroeconomic environment.
In November 2014, the IMF considered unemployment as a main
challenge for Egypt as it has increased to high level. More public
spending on education, health and research & development should

A f r i c a n D e v e l o p m e n t B a n k
4
AfDBW o r k i n g P a p e r
North Africa Policy Series
2 0 1 6 • w w w . a f d b . o r g
support long-term growth, and help the poor and other vulnerable
people achieve a better life.
In the case of Morocco, accelerating structural reforms is necessary
to promote inclusive growth and improve social indicators. In November
2014, according to the IMF, more needs to be done to increase
employment, reduce inequalities, and improve education and access
to basic infrastructure. In fact, fiscal reforms that create space for
investment in infrastructure, health, education, and social protection
are crucial to fostering higher and more inclusive growth. The authorities’
efforts to improve financial inclusion and access to credit are also
welcome.
In the case of Tunisia, improving governance, transparency, and the
business environment; stepping up infrastructure; restructuring banks;
and reforming the labor market and education system are crucial to
fostering private investment, growth, and job creation. In the Arab
countries3 in transition in general, economic developments will depend
on confidence, which remains susceptible to political and social
developments. In February 2014, the IMF stated that a concomitant
pursuit of structural reforms will be essential to promote private sector
development and generate inclusive growth that will reduce
unemployment. In fact, addressing vulnerabilities in the banking sector
will improve confidence, increase credit supply to the private sector,
and foster investment and employment creation. The implementation
of the structural reform agenda should be accelerated to make a dent
in unemployment and inequality and ensure that the foundations for
stronger and more inclusive growth are rapidly out in place.
In Algeria, the main challenge is o consolidate long term macroeconomic
stability and promote economic diversification and job creation. The
IMF in December 2014, considered a well-functioning labor market,
strong institutions, and an improved jobs-skills match help achieve a
substantial decline in unemployment (in 2014, youth 24.8%, women
14.24%). Faster growth, combined with improved labor market
effectiveness, would increase job creation.
The transition to dynamic economies that creates more jobs urgently
requires policymakers to design and implement a bold agenda of
structural reforms that benefits from broad public support. Each country
will define its own unique path, but all paths should converge on
accelerated private-sector growth and international trade, through
structural reforms that deepen trade integration, lower the cost of doing
business, foster hiring by private firms, develop high-quality human
capital, and expand access to finance.
1.3 Overview and Definitions of Inclusive Growth
In order for economic growth to be sustainable and effective in reducing
poverty, it needs to be inclusive (Berg et al., 2011; Kraay, 2004). Inclusive
growth has been discussed widely recently in the literature, however,
there is not yet a universally agreed definition of this concept. The Asia
Development Bank (2010) and the African Development Bank, (2013)
presented a comprehensive discussion on this concept that is
summarized in this section.
Inclusive growth is a multidimensional concept. Indeed, Inclusive
growth is economic growth, which already widely define, plus
“inclusion” that is a multidimensional concept. Loosely, inclusive growth
is sometimes defined as growth that benefits everyone i.e. all stripes
of society, including the poor, the near-poor, the middle income groups,
and even the rich. The definition of inclusive growth implies direct links
between the macroeconomic and microeconomic determinants of the
economy and economic growth. The micro dimension captures the
importance of structural transformation for economic diversification
and competition, while the macro dimension refers to changes in
economic aggregates such as the country’s Gross National Product
(GNP) or Gross Domestic Product (GDP), total factor productivity, and
aggregate factor inputs.
According to Arezki and Nabli (2012), inclusive growth is a growth that
provides rapid and sustained poverty reduction to allow people to
contribute to and benefit from economic growth. An inclusive growth
can also be defined as growth that is accompanied by declining income
inequality (Rauniyar and Kanbur, 2010). This definition is nearly identical
to the concept of relative pro-poor growth, which is growth
accompanied by declining income inequality between the poor and
the non-poor. The only (slight) difference is that relative pro-poor growth
focuses on the relative growth and inequality of the poor versus the
non-poor, while inclusive growth considers changes in inequality more
generally (Klasen, 2010).
Inclusive growth is also defined as pro-poor improvements in social
opportunities and examines to what extent social opportunities (e.g.,
access to health or education) are distributed according to income and
how this distribution changes over time (Ali and Son, 2007). Ali and
3 Egypt, Jordan, Libya, Morocco, Tunisia, and Yemen.
A f r i c a n D e v e l o p m e n t B a n k
5
W o r k i n g P a p e rNorth Africa Policy Series
2 0 1 6 • w w w . a f d b . o r g
AfDB
Zhuang (2007) and Zhuang and Ali (2009) define inclusive growth as
growth that promotes equal opportunities and also increases access
to these opportunities. This definition of inclusive growth is very close
to two concepts: the pro-poor growth advocated by the OECD-
Development Assistance Committee (DAC), which seeks a pace and
pattern of growth that will rapidly reduce poverty; and a pro-poor growth
process that will allow the poor to participate actively in, and benefit
from, economic growth.
The Commission on Growth and Development (2008) notes that
inclusiveness—a concept that encompasses equity, equality of
opportunity, and protection in market and employment transitions—is
an essential ingredient of any successful growth strategy.
Most of the international multilateral development agencies associate
inclusive growth with access to economic opportunities and jobs by
the vulnerable population, especially the poor. The Asian Development
Bank (2007) refers to inclusive growth as ‘economic opportunities’ that
are ‘available to all – particularly the poor – to the maximum possible
extent’. The African Development Bank (2011) considers the growth
to be inclusive when it creates economic opportunities – the pace of
growth– while ensuring equal access to them – the pattern of growth.
The World Bank approach of inclusive growth involves focusing on
productive employment. Increasing employment (i.e., number of jobs)
and productivity of employment (i.e., earnings from jobs) presumably
are important for a sustainable growth strategy that leads to poverty
reduction because the poor mostly rely on labour as their most important
asset. Thus, the main distinction in this approach to a more general
focus on pro-poor growth (and thus, for example, the OECD-DAC
approach) involves concentrating on the poor as participants and
contributors to economic growth, and explicitly eliminates focusing on
the poor as beneficiaries of growth (e.g., through transfer programs or
explicit redistribution).
In this policy paper, inclusive growth is defined as economic growth that
allows all economic agents of a country, especially the vulnerable
population (poor, women, youth), to participate in, contribute equally
to, and benefit from economic growth, regardless of individual
characteristics4.
To ensure that inclusive growth happens in countries, one needs to
make sure that the vulnerable population is participating and contributing
equally to the country economic growth. As it is widely recognized
now, this participation can be easily done through the private sector,
which is the main driver of economic growth in countries.
Thus, inclusive growth will require greater participation of the vulnerable
population to the private sector. Two options are possible. Vulnerable
population can enter the private sector activities as employees (job
creation) or as business owners (entrepreneurship). As employees,
inclusive growth will focus on job creation, as job is mainly what a poor
can have to improve his or her welfare. The literature on job creation
strategy is abundant and will not be the focus of this policy paper.
The second possibility, enabling the vulnerable population to become
business owner, is not widely discussed in the literature. This policy paper
will hence analyze the conditions of participation to business creation
(or entrepreneurship) and assess the conditions for the vulnerable
population to participate. If the opportunity is available for them to create
business, this will have an important “snow ball” effect on their welfare
and the economy as a whole. They will then secure a job for themselves
and also create job for other people than may be vulnerable.
4 This definition summarizes Ali and Zhuang (2007, 2009) and the international development agencies definition of this concept.

A f r i c a n D e v e l o p m e n t B a n k
6
AfDBW o r k i n g P a p e r
North Africa Policy Series
2 0 1 6 • w w w . a f d b . o r g
2.1 Entrepreneurship
The most frequently used indicators to describe a country’s
entrepreneurial activity are the level of nascent entrepreneurs
(NASCENT), the level of new business owner-managers (NEW FIRM)
and the total early-stage entrepreneurial activity rate (or TEA rate)5.
TEA is a composite of the two other measures: (1) the national rate
of nascent entrepreneurs, encompassing all those individuals in the
adult population who take first steps towards setting up a business,
but who have not yet paid wages or salaries for longer than 3 months,
and (2) the national rate of NEW FIRM, representing those who own
or co-own a for profit business (s) and is less than 3.5 years old
(Reynolds et al. 2005).
According to Carter et al. (1996), nascent entrepreneurs are individuals
who take steps to create a venture, such as looking for equipment or
a location, organizing a start-up team, preparing a business plan or
beginning to save money. We developed a theorical model to assess
the determinants of business founder. The model is presented in detail
in annexe 1. The main variables of the model used for the empirical
estimations are presented below.
Three groups of dependent variables are used to measure the stage
of participation in business creation. Individuals are either considered
nascent entrepreneurs or not (NASCENT); they are considered to be
actively involved in business creation (TEA) or they are considered new
firm owner-managers (NEW FIRM). Independent variables are grouped
in 2 categories. At the country level, outside of exogenous factors
which apply to all entrepreneurs (business climate , business
opportunities), two main factors can allow (or forbid) an individual to
participate to the business creation process: personal context, and
personal attributes (see Figure 1). Personal context include variables
financial support from family or investors while personal attributes
are individual characteristics such as age, gender, education, or fear
of failure.
2. Entrepreneurial Process, Results and Public Policy Challenges
Figure 1: Processes Affecting Business Creation
Dependent variables Independent variables
Personalsupport from
household
Financial supportfrom informal
investors
Age, Gender,Education, Work,
experience
Confidence inability to create
business, a,d fearof failure
Personalcontext
Personalattributes
1. Nascent
2. Active inbusiness creation
3. New firmowner-managers
5 (Bergmann and Stephan (2013), Amoro´s et al. (2011); Bergmann et al. (2009); Bosma et al (2012).

A f r i c a n D e v e l o p m e n t B a n k
7
W o r k i n g P a p e rNorth Africa Policy Series
2 0 1 6 • w w w . a f d b . o r g
AfDB
2.2 GEM survey and Data: Processes AffectingBusiness Creation
The main data used is the Global Entrepreneurship Monitor (GEM) survey
that includes the Adult Population Survey (APS), conducted with a
randomly selected representative sample of at least 1,500 adults, aged
18-64 years old. For this policy paper, we are using the individual data
for Algeria (2009), Egypt (2010), Morocco (2009) and Tunisia (2010).
The GEM data are unique since it surveyed the North African countries'
adult populations to locate individuals in any of three stages of the
business life course: (i) active involvement (thinking process/ creation)
in the start-up process; (ii) owner-manager of a new business; or (iii)
owner manager of an established business. These variables will be used
as dependent variables for various models that will be tested.
Some individuals may simultaneously be involved in more than one phase.
For example, some with new or established businesses are also involved
in creating another new business. In the interview with representative
adults, individuals that appear to be actively involved in a business start-
up are asked questions to determine that they have done something to
implement the new firm in the past year, expect to own part of the business,
and the new venture has not yet reached a level of initial profits. Such
individuals are referred to as nascent entrepreneurs and the start-up
initiative may be considered a nascent enterprise.
Those that report they are involved in an existing business are asked
questions to ensure they are active in the management of the firm and
not passive investors, own part of the business, and that the business
has had a period of initial profitability. For analysis the business owners
are divided into two categories based on the time since initial profits
were reported. Those with profits for less than 42 months are considered
new businesses; those with profits for over 42 months are considered
established businesses. Hence, the data from the individual interviews
provides the capacity to identify individuals active in three stages of the
business life course: (i) Nascent entrepreneurs active in the business
start-up process6/7; (ii) New firm owner-managers ; and (iii) Established
firm owner-managers8. The structure of the interview also allows
identification of those active as both nascent entrepreneurs and new
firm owner-managers or nascent entrepreneurs and established firm
owner-managers.
2.3 Descriptive Statistics
The sample consists of 7974 individuals from North Africa, except
Mauritania and Libya; all aged between 18 and 64 years. At country
level, they are 2000 individuals from Algeria, 2596 from Egypt, 1500
from Morocco and 1878 from Tunisia. The actual allocations for each
dependent variable are summarized in tables 1 in Annex 3.
Regarding the personal attribute, the population is composed of 4017
men; who represents 50.4% and whose average age is about 36 years
old. In general, women in the sample are as old as men; they also are
36 years old in average. However, at country level the average age
slightly varies from one country to another. Indeed, it is estimated at
36 years for the whole sample, while at country level it is about 34
years, 39 years, 35 years and 37 years for Algeria, Egypt, Morocco
and Tunisia respectively.
By category of age, about 23% of surveyed individuals are between 18
and 24 years, about 26% are between 25 and 34 years, about 21 %
belong to the class of 35-44 years, about 17% are in the class of
45-54 years and 13% are between 55 and 64 years old.
Moreover, about 52% of individuals in the sample are working on
either full time or part time basis; whereas about 16 % are students
or retired. The remaining 32% of individuals are not working. Finally,
30% of the population expressed a fear of failure before going into
the business creation process.
Regarding the personal context, 24.6% of the population is
from a low income family while 39.58% is from a middle income
family and 35.79% from a high income family. As of the possibility
to access informal investor, only 5.09% of the population is able
to have.
In the population, almost 31% declare themselves as nascent
entrepreneurs of whom 16% are doing it because an opportunity
shows up and 5% by necessity. Only 11% of the population surveyed
is engaged in a total entrepreneurship activity (TEA), 8% by opportunity
and 3% by necessity. Finally, only 6% of the population are running
a new firm (less than 42 months old) of which 4% by opportunity and
2% by necessity.
6 Nascent_all: help start a new business; Nascent_opp: help start a new business by opportunity; Nascent_nec: help start a new business by necessity.7 TEAyy: Involved in Total early-stage Entrepreneurial Activity; TEAyyopp: Involved in Opportunity early-stage Entrepreneurial Activity; TEAyynec: Involved in Necessity early-stage Entrepreneurial Activity.8 New_Firm_all: Manages and owns a business that is up to 42 months old; New_Firm_opp: Manages and owns a business that is up to 42 months old by opportunity; New_Firm_nec:Manages and owns a business that is up to 42 months old by necessity.

A f r i c a n D e v e l o p m e n t B a n k
8
AfDBW o r k i n g P a p e r
North Africa Policy Series
2 0 1 6 • w w w . a f d b . o r g
Table 2 in annex 3 present the correlation matrix of dependent variables
(TEA, Nascent and New firms), the personal attributes factors and
the personal context factors; for the whole sample and for each
country.
The three level of business creation process are strongly correlated.
The total entrepreneurial activity (TEA) is strongly correlated with the
nascent and new firm indicators. As expected, there is no correlation
between the personal attributes and personal context factors.
2.4 Measuring the stage of participation in businesscreation: Main results
The population of entrepreuneurs is therefore divided into three groups:
those who are nascent entrepreneur (NASCENT) ie who are thinking
about setting up a firm; those who are working actively to set up a
firm ie who in total entrepreneurship activity (TEA); and the owner of
a new firm in business for less than 42 months (NEW FIRM). For each
group, three models have been tested. The first model uses the whole
population of the group. The two other models the population is
divided in two: one sub-group is the sub-population setting up a
business creation because an opportunity shows up; and the second
sub-group is the one creating a business because they do not have
another alternative or by necessity. For instance, three NASCENT
variables are being tested: NASCENT as a whole, NASCENT by
opportunity and NASCENT by necessity. Thus, nine dependent
variables are being tested.
The impact of the two categories of variables (personal attributes and
personal context) is tested by running three models: (i) model 1 tests
only personal attribute variables; (ii) model 2 tests only personal
contextual variable; and (iii) model 3 tests both personal attributes and
contextual factors.
Finally, for each country as well as the whole sample, 27 models have
been run to test the impact of the personal context and attributes on
business creation. We use logistic regression models to test the impact
of the determinant of business creation. These regressions are
conducted, first for the whole sample, and then for each country
separately. In few cases, some modalities of some independent
variables have been excluded from the model or the entire regression
has not been possible due to one of the following issues: data
unavailability, multicolinearity among dummies, and invariability of a
modality.
The results of the regressions are presented for each of these three
groups of population.
2.4.1 Total Entrepreneurial Activity (TEA) Results
The results for the logit regression using for early stage of
Entrepreneurial Activity (TEA) entrepreneur are presented in tables
4 in Annex 3. The results for the involvement in early-stage
Entrepreneurial Activity (TEA) provide strong and negative evidence
of the impact of the personal attributes in general. Indeed, adults
over 44 years hold are statistically less engaged actively in the creation
of a business. This is the same for student and retired. The gender
does not seem to impact the TEA. As for personal context, being
from a high-income family and having an informal investor help to
start the entrepreneurship activities.
In term of individual country, gender seems to have no impact on
Algerian, Moroccan and Tunisian early- stage Entrepreneurial Activity;
but has a major effect in Egypt. Females in Egypt are statistically more
likelly than man to be engaged by necessity into the early stages of an
entrepreuneurial activity.
Compared to those that have not finished secondary school, those that
have completed only secondary school and beyond are less likely to
be involved as TEA entrepreneurs in North African countries. At country
level, this previous result holds for Egypt and Tunisia; however, the level
of education has no significant impact on Algerian TEA entrepreneurs.
Compared to those actively working (part time or full time), those not
working or retired statistically less involved in new firm creation.
Our results show that the fear of failure has different impact on
entrepreneurship activities across countries. It appears to be a barrier
for many TEA entrepreneurs in Egypt and Tunisia; since it reduces their
tendency to be involved.
In terms of personal context, the availability of financial support from
the household or informal investor (as a measure of access to financial
support) seems to to statistically positively the participation overall, in
necessity and in opportunity in business creation.
2.4.2 Nascent Entrepreneurs Results
The results for the logit regression using for Nascent entrepreneurs
are presented in tables 3 in Annex 3. The results show the impact of
both personal attributes and context on the business creation
participation. The first stage of business creation participation (nascent)
results shows that the personal attributes do not impact the will to
create a business. Young adults between the age of 25 and 34 years
old with secondary education are the ones mostly engaged in nascent
entrepreneurship.

When we look at the individual countries, for Algeria, Morocco and Tunisia,
the gender has no significant impact on nascent entrepreneurship. In
contrast, in Egypt, women are statistically more involved in the process
of thinking of business creation by necessity. Also, individual with a part
time or full time job are more involved than unemployed, student or
retired people. It has to be noted also that education has an impact for
a nascent entrepreneur by opportunity. Indeed, having a secondary
education level increase the probability to consider creating a business
when an opportunity arises.
Finally, the " fear to fail" is statistically more mentioned by nascent
entrepreneur. This observation is counter intuitive be but could be
the result of two potentially combined processes : i) the fear to fail
raises among nascent entrepreneurs at the early stages of
entrepreneurship ; ii) the fear to fail blocks potential entrepreneurs at
this stage and they do move to the next stage. The model does not
allow us to gofurther.
As for the personal context variables, the availability of an informal
investor to help to start up a firm has, in general, has a positive but not
significant impact on the process of thinking of business creation; even
by opportunity or necessity.
The econometric results on the early stages of creating a business
therefore show that: a) the process exist over a relatively wide base
without gender discrimination globally; b) at this stage funding issues
do not slow down process. On this basis (and not taking into account
the aspect of education) it is possible to unleash in North Africa a
broad base private sector growth if the constraints are released.
2.4.3 New Firms’ Owners Results
The results for the logit regression using for NEW FIRM OWNERS (less
than 42 months in business) are presented in tables 5 in Annex 3.
The last stage of business creation participation (new firm owners)
results displays a more significant impact of personal attributes and
personal context. Gender does not seem to have a statistical impact
on owning a firm in Egypt, Morocco and Tunisia. This result is true
whenever we consider the personal attributes alone in the regression
or the personal context alone or both. In Algeria, new firms are
statistically more owned by men.
Statistically new business are more owned by yound adults (18-44
years old). Having a any post secondary education affects statistically
negatively business creation in the region. This observation goes well,
with the well described of public sector jobs attractiveness jobs for
the educated youth in the region.
The fear to fail reduces the willingness to manage new businesses in
the Region and in Egypt and Tunisia in particular; even when new
opportunities arise.
As for the personal context variable, only the availability of an informal
investor to help to start up a firm has a positive impact on creating
and owning a business, whatever the purpose of the business creation.
In summary, the models show that, from a gender perspective, in
some countries, support for entrepreneurship could be to the benefit
of women who are statistically more involved in business creation. In
Egypt for example, women are more involved in the three stage of
business creation. In Tunisia, they are more involved in new firms creation
by opportunity.
In addition, middle age individuals (25-44 years old) are statistically more
involved in private business creation. Individuals with a job are more
involved also in the process of business creation. Moreover, education
plays a paradoxical role. While people with secondary education are
the one who think statistically more about entrepreneurship they are
statistically less taking action. There are distortions here which need
to be analyzed in more depth but they already are well aligned with
some well described distortions in North Africa and in particular the
attractiveness of the public sector for young graduates. With the regard
to the personal context, household income and the prevalence of an
informal investor increase the probability to be involved in business
creation.
A f r i c a n D e v e l o p m e n t B a n k
9
W o r k i n g P a p e rNorth Africa Policy Series
2 0 1 6 • w w w . a f d b . o r g
AfDB

A f r i c a n D e v e l o p m e n t B a n k
10
AfDBW o r k i n g P a p e r
North Africa Policy Series
2 0 1 6 • w w w . a f d b . o r g
3. Conclusions and Recommendations
This study analysed the role of nascent entrepreneurship in driving
inclusive growth in North Africa. Inclusive growth is economic growth
that allows vulnerable population (poor, women, youth), to participate
in, contribute equally to, and benefit from economic growth. The role
of nascent entrepreneurship is assessed through their participation that
can be done by two ways including as employees or as business owners
(entrepreneurs). This study examined the determinants for the vulnerable
population to act as business owners.
Using the GEM unique survey data on 4 out 5 North Africa countries
including Algeria, Egypt, Morocco and Tunisia, we assessed the
determinants of being a business owner. The empirical results
show that at the very early stage of business creation (nascent
entrepreneurship), young adults (25-34 years old) with only secondary
education are statistically more involved, and the fear of failure is
statistically higher in this population. However, when it comes to the
steps to create or run a business, it is mostly individuals with a job,
coming from wealthy family and with access to informal investors that
are statistically more active Gender seems to have low impact on the
decision to participate to business creation. In fact, in Morocco and
Tunisia, women and men are equally involved. In Egypt, women seem
to be more involved in the process of thinking of business creation than
men especially by necessity. In Algeria, women involvement appears to
depend on the stage of entrepreneurship. The real effect of the fear to
fail is ambiguous and could be sometimes positively influenced by many
factors such as the regulatory framework to encourage new start-up,
the access to available entrepreneurship support programs, the social
perception of business owners and the other economic and financial
conditions.
The major conclusion is that entrepreneurship skills are present among
the youth but the initial conditions are making the main difference. In
fact, entrepreneurship skills are present among the youth, however,
there is too much loss during the process and to the detriment of a
private sector led growth.
In this trajectory nascent entrepreneurs are not at the end new firm
owners. Statistically, nascent entrepreneurs are young (25-34 years)
and coming from families with low income. To the contrary and from
a statistical point of view "new firm owners" are individuals working
(part-time/full) from rich families and having access to informal
investors.
Two main constraints are identified for the vulnerable to contribution
to economic growth as business owner. The first constraint is the low
education level. Indeed, the results have shown that most of the
individuals that engage in business creation have at least post
secondary education. This implies that they are able to deal with the
basic paperwork required to set up a business but it may affect at a
later stage their ability to develop their business. The second constraint
referred to the access to finance. It has been shown that individual
with informal investor and/or wealthy family are willing to be business
owner.
Two policy recommendations are drawn from our findings:
Firstly, it is necessary to improve the level of education for the vulnerable
population. This must not only be the formal education but mostly
vocational training to develop entrepreneur skills of vulnerable population.
The second key policy recommendation is to remove the financial
constraints that forbid the vulnerable people to become a business
owner. Micro-finance programs have to be strengthened with few access
conditions to allow vulnerable population to access these funds and
set up a business.
Within these countries, the mortality rate of created enterprises is
high as a result of a lack of accompagnement for these nascent
entrepreneurs. As a matter of fact, governments’ role is crucial on
supporting nascent entrepreneurs during the transition to new-
business owners firms. In fact, governments should provide nascent
entrepreneurs with the skills and experience they need to be successful
entrepreneurs through a high quality of training programs including
skills development, enhancing international languages, improved
career guidance and direct linkages with employment opportunities.
Indeed, governments have to ensure the quality of trainings covering
the whole chain of the economic sector considered by the nascent
entrepreneur and addressing its specificities.
The low level of education does not guarantee the innovation aspect
for the new entreprises. Governments, through mentoring and internship

A f r i c a n D e v e l o p m e n t B a n k
11
W o r k i n g P a p e rNorth Africa Policy Series
2 0 1 6 • w w w . a f d b . o r g
AfDB
opportunities, are able to make nascent entrepreneurs innovative and
transforming the entreprenarial spirit to a culture of entrepreneurship
allowing new firms to grow and thrive in a difficult business environment.
Governments should involve partners such as financial institutions,
NGOs, businesses and various youth-serving organizations, including
educational institutions as well as the civil society.
Some best practices from different countries should be adapted to the
North African case9.
Selected examples from these best practices include:
• The creation of decent jobs or backward and forward firms to support
through a major public-private partnership (PPP). The experience
of artisans in Angkor, in Cambodia could be applied in North African
countries particularly in Tunisia and Morocco since they both have
budding tourism industries.
• The provision of training and grant aid to young people through
PPP Boosting the “advantage skills” through circular migration such
as the MIDA health project in Ghana.
• The promotion of knowledge exchange through diaspora networks
as Chinese and Pilipino professionals residing in foreign countries;
• The Souk Attanmia is an economic development initiative, which
combines fiancing (donations) and accompagning services to
support the creation of innovative project10.
• A call for projects to train 200 young people in agricultural
entrepreneurship has been launched by the Agency for Agricultural
Development. The objective is to promote the emergence of micro
enterprises in the agricultural sector in Morocco11.
Finally, it is well recognized by the literature that new ventures face
difficulties in attracting external finance at their very initial stage, be
it through bank loans or equity capital. Crowdfunding may then appear
as a useful alternative route. Crowdfunding is the use of small amounts
of capital from a large number of individuals to finance a new business
venture. It makes use of the easy accessibility of vast networks of
friends, family and colleagues through social media websites like
Facebook, Twitter and LinkedIn to get the word out about a new
business and attract investors. The main objective of crowdfunding
is to provide entrepreneurs with an alternative way to raise funds. It
is not a donation; it is an investment in a business. Compared to
Sukuk, crowdfunding very cheap as it does not require the issuer to
prepare a detailed Sukuk prospectus. Both Sukuk and Crowdfunding
are regulated by the financial market authority in several countries.
Certain countries have started using crowdfunding platforms and
could be a model to be adopted such as Qatar with its key connection
point helping youth people to make successful transitions to the world
of work12 named Silatech and a crowdfunding platform called Narwi13,
the Egyptian experience called Shekra14 and the Amaerican initiative
called Kiva15.
9 African Development Bank, Economic Note “How to reduce youth unemployment in the Maghreb region”, 2011.10 http://www.soukattanmia.org/11 http://www.challenge.ma/jeunes-entrepreneurs-agricoles-a-vos-projets-26584/12 Silatech: http://www.silatech.com/ /13 Narwi: http://launch.narwi.org/14 http://www.shekra.com/15 http://www.kiva.org/)

A f r i c a n D e v e l o p m e n t B a n k
12
AfDBW o r k i n g P a p e r
North Africa Policy Series
2 0 1 6 • w w w . a f d b . o r g
4. References
ADB (2007), “Toward a New Asian Development Bank in a New Asia: Report of the Eminent Persons Group,” Manila: Asian Development Bank.
Ali, Ifzal and Hyun Hwa Son. 2007. Measuring Inclusive Growth. Asian Development Review, Vol. 24, No. 1, pp. 11–31. Manila: ADB.
Ali, Ifzal and Juzhong Zhuang. 2007. Inclusive Growth toward a Prosperous Asia: Policy Implications. ERD Working Paper Series No. 97. July.Manila: ADB.
Ali, Ifzal. 2007. Pro-Poor to Inclusive Growth: Asian Prescriptions. ERD Policy Brief No. 48. May. Manila: Asian Development Bank (ADB).
Amoro, J. E., Bosma, N., & Levie, J. (2011). Ten years of Global Entrepreneurship Monitor: accomplishments and prospects. International Journalof Entrepreneurial Venturing (forthcoming).
Anand, R., S. Mishra and S. J. Peiris, 2013. Inclusive Growth: Measurement and Determinants, IFM Working Paper, WP/13/135.
Arezki and Nabli, 2012. Natural Resources, Volatility, and Inclusive Growth: Perspectives from the Middle East and North Africa. IMF WorkingPaper, WP/12/111.
Arezki, Catherine Pattillo, Marc Quintyn, and Min Zhu, International Monetary Fund.
Berg, Andrew, and Jonathan D. Ostry, 2011, “Inequality and Unsustainable Growth: Two Sides of the Same Coin?” IMF Staff Discussion Note11/08 (Washington: International Monetary Fund).
Bergmann, H. and U. Stephan. 2013. “Moving on from nascent entrepreneurship: measuring cross-national differences in the transition to newbusiness ownership”, Small Business Economics, Vol.41, pp. 945-959.
Bergmann, H., Mueller, S., & Schrettle, T. (2009). Stairway to heaven or highway to hell? The use of global entrepreneurship monitor data inacademic research. BCERC 2009 Interactive Paper. Frontiers of Entrepreneurship Research, 29(22). Available at: http://digitalknowledge.babson.edu/fer/vol29/iss22/.
Bosma, N., Coduras, A., Litovsky, Y., & Seaman, J. (2012). GEM manual. A report on the design, data and quality control of the GlobalEntrepreneurship Monitor. Available from:www.gemconsortium.org/docs/2375/gem-manual-design-data-and-quality-control.
Bosma, Niels and Jonathan Levie. 2010. Global Entrepreneurship Monitor: 2009 Executive Report. Global Entrepreneurship Research Association.
Bygrave, William D. and Mark Quill. (2007). Global Entrepreneurship Monitor: 2006 Financing Report. Babson Park, MA and London, UK: BabsonCollege and London Business School.
Carter, N. M. Gartner, W. B., & Reynolds, P. D. 1996. Exploring start-up event sequences. Journal of Business Venturing, Vol. 11, No. 3, pp. 151-166.
Commission on Growth and Development, 2008. Growth Report: Strategies for Sustained Commodity Prices and Inclusive Growth in Low-IncomeCountries. ed. by Rabah Growth and Inclusive Development (Washington: World Bank).
Ianchovichina, E., and S. Lundstrom Gable, 2012, “What is Inclusive Growth?” in IMF (2011) “Middle East and North Africa: Economic Outlookand Key Challenges”, Report, September.
IMF (2013) “Regional Economic Outlook Update”, Report, May.
Kirkpatrick, C., D. Parkar and Y-F. Zhang, 2006. An Empirical Analysis of State and Private-Sector Provision of Water Services in Africa. The WorldBank Review, Vol. 20, No. 1, pp. 143–163.

A f r i c a n D e v e l o p m e n t B a n k
13
W o r k i n g P a p e rNorth Africa Policy Series
2 0 1 6 • w w w . a f d b . o r g
AfDB
Kraay, A., 2004. When is Growth Pro-Poor? Cross-Country Evidence. IMF Working Paper No. 04/47.
Murphy, E. C. 2001, “The State and the Private Sector in North Africa: Seeking Specificity”, Mediterranean Politics, Vol.6, No.2 (Summer), pp. 1–28.
Parker, D., and C. Kirkpatrick. 2005. ‘‘Privatisation in Developing Countries: a Review of the Evidence and the Policy Lessons.’’ Journal ofDevelopment Studies, Vol. 41, No. 4, pp. 513–41.
Reynolds, Paul D. and Diane Hechavarria. (2007) Consolidated Global Entrepreneurship Monitor [GEM] Adult Population Survey Data Set: 1988-2003. Ann Arbor: MI: Institute for Social Research. ICPSR Study 20320.
Reynolds, Paul D. and Richard T. Curtin. 2009a. Business Creation in the United States: Entry, Startup Activities, and the launch of New Ventures.Chapter 7 in U.S. Small Business Administration, The Small Business Economy: A Report to the President 2008. Washington, DC: U.S. GovernmentPrinting Office, pp. 165-240.
Reynolds, Paul D. and Richard T. Curtin (Eds). 2009b. New Firm Creation in the U.S.: Initial Explorations with the PSED II Data Set. New York:Springer.
Reynolds, Paul D., Brenda Miller, and Wilbur Maki. 1995. "Explaining Regional Variation in Business Births and Deaths: U.S. 1976-88" SmallBusiness Economics Vol. 7, pp. 389-407.
Reynolds, Paul D., David J. Storey, and Paul Westhead. 1994. Cross-National Comparisons of the Variation in New Firm Formation Rates. RegionalStudies Vol. 28, No. 4, pp. 443-456.
Reynolds, Paul D., N. Bosma, E. Autio, S. Hunt, N. De Bono, I. Servais et al., 2005. Global entrepreneurship monitor ; Data collection design andimplementation. 1998-2003. Small Business Economics. Vol. 24, pp. 205-231.
Rijk, Adrianus. 2010. ADB’s Contribution to Inclusive Growth in Agriculture and SME Development Projects.
Roemer, J. 1998. Equality of Opportunity. Cambridge: Harvard University Press.
Silber, J. and H. Son. 2010. On the link between the Bonferroni index and the measurement of inclusive growth. Economics Bulletin, Vol. 30,No.1, pp. 421–428.
Solt, Frederick. 2009. Standardizing the World Income Inequality Database. Social Science Quarterly. Vol. 90, No. 2, pp. 231-242.
Stampini, M., R. Leung, S.M. Diarra and L. Pla 2011, “How Large Is the Private Sector in Africa? Evidence from National Accounts and LaborMarkets”, IZA Discussion Paper No. 6267, December.
Stephan Klasen, “Measuring and Monitoring Inclusive Growth: Multiple Definitions, Open Questions, and Some Constructive Proposals” AsianDevelopment Bank (ADB) Sustainable Development Working Paper Series, No. 12 | June 2010.
Tandon, Ajay and Juzhong Zhuang. 2007. Inclusiveness of Economic Growth in the People’s Republic of China: What Do Population HealthOutcomes Tell Us? ERD Policy Brief No. 47. January. Manila: ADB.
The African Development Bank, 2011. Africa in 50 Years’ Time-The Road Towards Inclusive Growth.
UNESCO. 2009. Global Monitoring Report: Overcoming Marginalization. Paris: UNESCO.
Warner, Andrew, 2012. Inclusive Growth in Natural Resource Intensive Countries. in Commodity Prices and Inclusive Growth in Low-IncomeCountries, ed. by Rabah Arezki, Catherine Pattillo, Marc Quintyn, and Min Zhu, International Monetary Fund.
World Bank, The. 2009. What Is Inclusive Growth? PRMED Knowledge Brief. February 10. Washington, DC: Economic Policy and Debt Department,The World Bank.
World Bank. 2009a. Doing Business 2010. New York: Palgrave MacMillan.

A f r i c a n D e v e l o p m e n t B a n k
14
AfDBW o r k i n g P a p e r
North Africa Policy Series
2 0 1 6 • w w w . a f d b . o r g
World Bank. 2009b. Middle East and North Africa Region: 2009 Economic Developments and Prospects. Washington, DC: The World Bank.Zhuang,Juzhong and Afzal Ali. 2009. Inequality and Inclusive Growth in Developing Asia. Introduction to a book publication. ADB.
Stephan Klasen, “Measuring and Monitoring Inclusive Growth: Multiple Definitions, Open Questions, and Some Constructive Proposals” AsianDevelopment Bank (ADB) Sustainable. Development Working Paper Series, No. 12, June 2010.
African Development Bank, 2013, “The Search for Inclusive Growth in North Africa: A Comparative Approach” Economic Brief, 2013.

A f r i c a n D e v e l o p m e n t B a n k
15
W o r k i n g P a p e rNorth Africa Policy Series
2 0 1 6 • w w w . a f d b . o r g
AfDB

A f r i c a n D e v e l o p m e n t B a n k
16
AfDBW o r k i n g P a p e r
North Africa Policy Series
2 0 1 6 • w w w . a f d b . o r g
Annex 1: The Model
The main objective is to find the extent of business creation and the
reasons behind this fact. The dependent variable indicates whether
or not a person is engaged in a process of creating a business or if he
is running a business. It is modeled as follows:
=zwifzwif
yi
ii 0
1
Wi is the indicator to see whether individual i is in the process of creating
a business. When the indicator is under the threshold, then the individual
is creating a business. Wi is called a latent variable, Xi is the set of
characteristics of individual i (personal context and personal attribute)
and α is the vector of coefficients to be estimated.
The model is designed as follows:
( )( ) ii
i XyPyP
==
=
111
log
The distribution of y is formalized as:
This is the logistic distribution. The vector is obtained using the maximum
likelihood estimation method. Each coefficient represents a breakdown
of the probabilities of an individual in the process of creating a business
compared to a reference modality. The objective is to see changes
in probabilities with variations in independent variables. For each
independent variable, one modality is set as the reference and the other
modalities of that variable are compared to the reference modality.
An odds ratio or probability ratio of less than 1 means that a probability
of creating a business for an individual with the corresponding modality
is lower than that of the reference modality individual; the opposite holds
when the odds ratio is greater than 1.
The dependent variable, which measures the decision to participate in
entrepreneurship, is identified as a dichotomous variable that is YES (or
1) if the individual participate and 0 otherwise. Three groups of dependent
variables are used to measure the stage of participation in business
creation. Individuals are either considered nascent entrepreneurs or not
(NASCENT); they are considered to be actively active in business creation
(TEA) or they are considered new firm owner-managers (NEW FIRM).
We used logit models to assess the impact of the individual determinants
of business creation. As different independent variables are included in
the model, their contribution is assessed in terms of improved predictive
accuracy.
Independent variables can be grouped in 2 categories. At the country
level, two main factors can allow (or forbid) an individual to participate
to the business creation process: personal context, and personal
attributes. Personal context factors include two main components:
(i) potential support for financial support from household; Indeed, the
capacity or wiliness to create a business may be influenced by
household higher income level that can support the individual to begin
a business. The measures of household income is relative to others and
each sample respondents are classified as approximately in the upper
third, middle third, or lowest thirds of the distribution for their country.
( ) ( )( )i
ii X
Xyobexp1
exp1Pr
+==

A f r i c a n D e v e l o p m e n t B a n k
17
W o r k i n g P a p e rNorth Africa Policy Series
2 0 1 6 • w w w . a f d b . o r g
AfDB
(ii) potential support for financial support from informal investors; if an
individual has access to informal potential investors (extended family
or friends), he may easily enter the business creation process since
he may receive some financial support for that. In the survey, all
respondents are asked about recent contributions, in the past three
years, as informal investors to a business start-up that they are not
involved with. As the samples represent the adult population in each
country, this information is used to estimate the prevalence of informal
investors, which can be considered a measure of the personal context
for those attempting to assemble resources to implement new firms.
The second set of factors that impact business creation are the personal
attributes that includes variables like Age, Gender, Education, Work
Experience, Confidence in ability to create business, and Fear of failure.
These factors are easily to measure and then used widely in the literature.
Age may impact the business creation process at two levels. The first
one is when the individual has a lot of energy, enthusiasm and openness
to new adventures. This peaks at around 20 years and may decline
after. The second level appears for older people that have more
education, professional experience and easier access to finance, all
of which can increase the wiliness or capacity to create a new
establishment. The combination of these two elements implies that the
age participation in the business creation should be at its highest level
around 30-40 years of age. In the model, the variable age is divided in
5 categories: 18-24, 25-34, 35-44, 45-54, 55-64 years of age.
Gender is used to measure various status of the individual including
differences in innate attributes, socialization experiences, social roles
and cultural expectations. Empirical studies showed that woman and
man are equally involved in business creation in developing countries
while men are more involved in developed countries.
Education enables the individual with the capacity of business creation.
Previous empirical studies showed that the impact of education beyond
secondary or high school levels appears to be almost null. In addition,
with a very low level or no education, the wiliness to create a business
is very low. For simplification, education is divided into three categories,
less than a primary or high school degree, earning a secondary (high
school) degree, and education beyond a secondary (high school) degree.
Measure of participation in the labor force is harmonized by utilizing
three categories, working reflects reports of full or part time work, not
working reflects those unemployed and homemakers, and a residual
category includes students, retirees, and the disabled.
An individual can enter a business creation process if she is aware of
that business opportunities exist. Individual that has confidence in
business opportunity is likely to create a new business.
Finally, fear of failure in the business creation received widely coverage
recently. However, the variable may have less impact than generally
discussed in the literature.

A f r i c a n D e v e l o p m e n t B a n k
18
BADD o c u m e n t d e t ra v a i l
Série sur les notes de politiques en Afrique du Nord
2 0 1 6 • w w w . a f d b . o r g
Annex 2: Descriptive Statistics
Inclusive growth in North Africa
1990 2000 2010 2011 2012 2013
GDP per capita growth (annual %)
Algeria -1.7 0.8 1.7 0.9 1.4 0.8
Egypt, Arab Rep. 3.6 3.7 3.4 0.1 0.5 0.4
Morocco 2.1 0.4 2.4 3.6 1.2 2.8
Tunisia 5.4 3.5 2.5 -1.4 3.1 1.8
Libya - 2.0 3.7 -62.5 102.8 -10.1
Life expectancy at birth, total (years)Algeria 66.8 68.9 70.6 70.8 70.9 -
Egypt, Arab Rep. 64.5 68.6 70.5 70.7 70.9 -
Morocco 64.7 68.1 70.2 70.4 70.6 -
Tunisia 70.3 72.6 74.6 74.9 75.1 -
Libya 68.6 72.0 74.8 75.0 75.2 -
Mortality rate, neonatal (per 1,000 live births)Algeria 23.2 17.9 12.3 12.0 11.6 -
Egypt, Arab Rep. 32.6 21.3 12.7 12.3 11.8 -
Morocco 34.5 25.4 18.9 18.4 17.8 -
Tunisia 23.5 15.8 10.3 9.9 9.5 -
Libya 21.2 15.5 10.1 9.7 9.4 -
Age dependency ratio (% of working-age population)Algeria 88.8 61.5 46.7 46.9 47.2 47.9
Egypt, Arab Rep. 79.5 68.8 58.7 58.6 58.5 58.5
Morocco 78.3 63.2 49.6 49.1 48.9 48.9
Tunisia 73.4 55.9 43.8 43.5 43.5 43.6
Libya 82.2 59.2 51.6 51.7 51.9 52.1
Labor force participation rate, total (% of total population ages 15-64) (modeled ILO estimate)
Algeria 44.3 46.1 45.7 46.0 46.3 -
Egypt, Arab Rep. 52.4 49.2 51.9 52.2 52.4 -
Morocco 54.7 56.1 52.0 52.1 52.3 -
Tunisia 50.8 50.5 50.6 50.8 51.0 -
Libya 50.1 53.8 55.9 55.8 55.7 -
Employment to population ratio, 15+, total (%) (modeled ILO estimate)Algeria - 30.7 38.8 39.1 39.4 -
Egypt, Arab Rep. - 42.0 44.2 42.9 43.2 -
Morocco - 46.3 45.5 5.7 45.8 -
Tunisia - 40.2 41.0 41.2 41.4 -
Libya - 46.9 48.8 49.0 48.4 -
Source: World Development Indicators 2014

A f r i c a n D e v e l o p m e n t B a n k
19
D o c u m e n t d e t ra v a i lSérie sur les notes de politiques
en Afrique du Nord
2 0 1 6 • w w w . a f d b . o r g
BAD
Annex 3: Empirical results tables
Variable N Mean STD.. Dev. Min Max
DEPENDENT VARIABLES
TEA ALL 7974 0.11 0.31 0 1
TEA OPP 7974 0.08 0.26 0 1
TEA NEC 7974 0.03 0.17 0 1
NASCENT ALL 2070 0.31 0.46 0 1
NASCENT OPP 2070 0.16 0.37 0 1
NASCENT NEC 2070 0.05 0.22 0 1
NEW FIRM ALL 7974 0.06 0.23 0 1
NEW FIRM OPP 7974 0.04 0.19 0 1
NEW FIRM NEC 7974 0.02 0.13 0 1
INDEPENDENT VARIABLES
PERSONAL ATTRIBUTES
MALE 7974 0.50 0.50 0 1
FEMALE 7974 0.50 0.50 0 1
AGE 7909 36.22 12.83 18 64
AGE: 18-24 YEARS 7972 0.23 0.42 0 1
AGE: 25-34 YEARS 7972 0.26 0.44 0 1
AGE: 35-44 YEARS 7972 0.21 0.41 0 1
AGE: 45-54 YEARS 7972 0.17 0.38 0 1
AGE: 55-64 YEARS 7972 0.13 0.34 0 1
NO SECONDARY EDUCATION: EDU0011C 7828 0.42 0.49 0 1
SECONDARY EDUCATION ONLY: EDU1212C 7828 0.24 0.43 0 1
ANY POST SECONDARY EDUCATION: EDU1320C 7828 0.34 0.47 0 1
WORKING, FULL TIME PART TIME 7956 0.52 0.50 0 1
NOT WORKING 7956 0.32 0.47 0 1
RETIRED, STUDENTS 7956 0.16 0.37 0 1
FEAR OF FAILURE 7140 0.30 0.46 0 1
PERSONAL CONTEXT
LOW HH INC 3984 0.25 0.43 0 1
MEDIUM HH INC 3984 0.40 0.49 0 1
HIGH HH INC 3984 0.36 0.48 0 1
PREVALENCE OF INFORMAL INVESTORS: BUSANG 7903 0.05 0.22 0 1
Table 1 a - The four countries together: Descriptive Statistics of the Dependent Variables,Personal Attributes and Personal Context

A f r i c a n D e v e l o p m e n t B a n k
20
AfDBW o r k i n g P a p e r
North Africa Policy Series
2 0 1 6 • w w w . a f d b . o r g
Variable N Mean STD.. Dev. Min Max
DEPENDENT VARIABLES
TEA ALL 2000 0.17 0.37 0 1
TEA OPP 2000 0.12 0.33 0 1
TEA NEC 2000 0.03 0.17 0 1
NASCENT ALL 468 0.80 0.40 0 1
NASCENT OPP 468 0.37 0.48 0 1
NASCENT NEC 468 0.09 0.29 0 1
NEW FIRM ALL 2000 0.06 0.23 0 1
NEW FIRM OPP 2000 0.04 0.20 0 1
NEW FIRM NEC 2000 0.01 0.10 0 1
INDEPENDENT VARIABLES
PERSONAL ATTRIBUTES
MALE 2000 0.50 0.50 0 1
FEMALE 2000 0.50 0.50 0 1
AGE 1996 33.65 12.20 18 64
AGE: 18-24 YEARS 2000 0.29 0.45 0 1
AGE: 25-34 YEARS 2000 0.30 0.46 0 1
AGE: 35-44 YEARS 2000 0.21 0.40 0 1
AGE: 45-54 YEARS 2000 0.12 0.32 0 1
AGE: 55-64 YEARS 2000 0.09 0.28 0 1
NO SECONDARY EDUCATION: EDU0011C 1958 0.37 0.48 0 1
SECONDARY EDUCATION ONLY: EDU1212C 1958 0.35 0.48 0 1
ANY POST SECONDARY EDUCATION: EDU1320C 1958 0.28 0.45 0 1
WORKING, FULL TIME PART TIME 1984 0.49 0.50 0 1
NOT WORKING 1984 0.28 0.45 0 1
RETIRED, STUDENTS 1984 0.23 0.42 0 1
FEAR OF FAILURE 1471 0.29 0.45 0 1
PERSONAL CONTEXT
LOW HH INC 975 0.33 0.47 0 1
MEDIUM HH INC 975 0.31 0.46 0 1
HIGH HH INC 975 0.36 0.48 0 1
PREVALENCE OF INFORMAL INVESTORS: BUSANG 1935 0.06 0.24 0 1
Table 1. b – Algeria: Descriptive Statistics of the Dependent Variables, Personal Attributesand Personal Context

A f r i c a n D e v e l o p m e n t B a n k
21
W o r k i n g P a p e rNorth Africa Policy Series
2 0 1 6 • w w w . a f d b . o r g
AfDB
Variable N Mean STD.. Dev. Min Max
DEPENDENT VARIABLES
TEA ALL 2596 0.07 0.26 0 1
TEA OPP 2596 0.04 0.20 0 1
TEA NEC 2596 0.03 0.18 0 1
NASCENT ALL 581 0.19 0.40 0 1
NASCENT OPP 581 0.10 0.30 0 1
NASCENT NEC 581 0.06 0.23 0 1
NEW FIRM ALL 2596 0.04 0.20 0 1
NEW FIRM OPP 2596 0.02 0.14 0 1
NEW FIRM NEC 2596 0.02 0.14 0 1
INDEPENDENT VARIABLES
PERSONAL ATTRIBUTES
MALE 2596 0.52 0.50 0 1
FEMALE 2596 0.48 0.50 0 1
AGE 2567 38.63 13.35 18 64
AGE: 18-24 YEARS 2596 0.20 0.40 0 1
AGE: 25-34 YEARS 2596 0.20 0.40 0 1
AGE: 35-44 YEARS 2596 0.21 0.40 0 1
AGE: 45-54 YEARS 2596 0.20 0.40 0 1
AGE: 55-64 YEARS 2596 0.19 0.39 0 1
NO SECONDARY EDUCATION: EDU0011C 2593 0.34 0.47 0 1
SECONDARY EDUCATION ONLY: EDU1212C 2593 0.32 0.47 0 1
ANY POST SECONDARY EDUCATION: EDU1320C 2593 0.34 0.47 0 1
WORKING, FULL TIME PART TIME 2596 0.55 0.50 0 1
NOT WORKING 2596 0.35 0.48 0 1
RETIRED, STUDENTS 2596 0.11 0.31 0 1
FEAR OF FAILURE 2493 0.36 0.48 0 1
PERSONAL CONTEXT
LOW HH INC 2292 0.24 0,43 0 1
MEDIUM HH INC 2292 0.41 0,49 0 1
HIGH HH INC 2292 0.35 0,48 0 1
PREVALENCE OF INFORMAL INVESTORS: BUSANG 2593 0.07 0,25 0 1
Table 1. c – Egypt: Descriptive Statistics of the Dependent Variables, Personal Attributesand Personal Context

A f r i c a n D e v e l o p m e n t B a n k
22
BADD o c u m e n t d e t ra v a i l
Série sur les notes de politiques en Afrique du Nord
2 0 1 6 • w w w . a f d b . o r g
Variable N Mean STD.. Dev. Min Max
DEPENDENT VARIABLES
TEA ALL 1500 0.16 0.36 0 1
TEA OPP 1500 0.12 0.32 0 1
TEA NEC 1500 0.04 0.20 0 1
NASCENT ALL 971 0.11 0.32 0 1
NASCENT OPP 971 0.09 0.28 0 1
NASCENT NEC 971 0.02 0.15 0 1
NEW FIRM ALL 1500 0.09 0.29 0 1
NEW FIRM OPP 1500 0.07 0.25 0 1
NEW FIRM NEC 1500 0.03 0.16 0 1
INDEPENDENT VARIABLES
PERSONAL ATTRIBUTES
MALE 1500 0.50 0.50 0 1
FEMALE 1500 0.50 0.50 0 1
AGE 1497 34.99 12.27 18 64
AGE: 18-24 YEARS 1500 0.25 0.43 0 1
AGE: 25-34 YEARS 1500 0.27 0.45 0 1
AGE: 35-44 YEARS 1500 0.22 0.41 0 1
AGE: 45-54 YEARS 1500 0.16 0.37 0 1
AGE: 55-64 YEARS 1500 0.09 0.29 0 1
NO SECONDARY EDUCATION: EDU0011C 1498 0.83 0.38 0 1
SECONDARY EDUCATION ONLY: EDU1212C 1498 0.12 0.33 0 1
ANY POST SECONDARY EDUCATION: EDU1320C 1500 0.05 0.22 0 1
WORKING, FULL TIME PART TIME 1500 0.51 0.50 0 1
NOT WORKING 1500 0.35 0.48 0 1
RETIRED, STUDENTS 1500 0.14 0.34 0 1
FEAR OF FAILURE 1361 0.24 0.43 0 1
PERSONAL CONTEXT
LOW HH INC 231 0.00 0.00 0 0
MEDIUM HH INC 231 0.52 0.50 0 1
HIGH HH INC 231 0.48 0.50 0 1
PREVALENCE OF INFORMAL INVESTORS: BUSANG 1500 0.01 0.07 0 1
Table 1. d – Morocco: Descriptive Statistics of the Dependent Variables, Personal Attributesand Personal Context

A f r i c a n D e v e l o p m e n t B a n k
23
D o c u m e n t d e t ra v a i lSérie sur les notes de politiques
en Afrique du Nord
2 0 1 6 • w w w . a f d b . o r g
BAD
Variable N Mean STD.. Dev. Min Max
DEPENDENT VARIABLES
TEA ALL 1878 0.06 0.24 0 1
TEA OPP 1878 0.04 0.20 0 1
TEA NEC 1878 0.02 0.12 0 1
NASCENT ALL 50 0.78 0.42 0 1
NASCENT OPP 50 0.50 0.51 0 1
NASCENT NEC 50 0.14 0.35 0 1
NEW FIRM ALL 1878 0.04 0.20 0 1
NEW FIRM OPP 1878 0.03 0.17 0 1
NEW FIRM NEC 1878 0.01 0.11 0 1
INDEPENDENT VARIABLES
PERSONAL ATTRIBUTES
MALE 1878 0.49 0.50 0 1
FEMALE 1878 0.51 0.50 0 1
AGE 1849 36.66 12.57 18 64
AGE: 18-24 YEARS 1876 0.20 0.40 0 1
AGE: 25-34 YEARS 1876 0.28 0.45 0 1
AGE: 35-44 YEARS 1876 0.22 0.41 0 1
AGE: 45-54 YEARS 1876 0.18 0.39 0 1
AGE: 55-64 YEARS 1876 0.12 0.32 0 1
NO SECONDARY EDUCATION: EDU0011C 1779 0.27 0.44 0 1
SECONDARY EDUCATION ONLY: EDU1212C 1779 0.11 0.31 0 1
ANY POST SECONDARY EDUCATION: EDU1320C 1779 0.63 0.48 0 1
WORKING, FULL TIME PART TIME 1876 0.50 0.50 0 1
NOT WORKING 1876 0.32 0.46 0 1
RETIRED, STUDENTS 1876 0.18 0.39 0 1
FEAR OF FAILURE 1815 0.26 0.44 0 1
PERSONAL CONTEXT
LOW HH INC 486 0.22 0.41 0 1
MEDIUM HH INC 486 0.44 0.50 0 1
HIGH HH INC 486 0.34 0.48 0 1
PREVALENCE OF INFORMAL INVESTORS: BUSANG 1875 0.05 0.22 0 1
Table 1. e - Tunisia: Descriptive Statistics of the Dependent Variables, Personal Attributesand Personal Context

A f r i c a n D e v e l o p m e n t B a n k
24
AfDBW o r k i n g P a p e r
North Africa Policy Series
2 0 1 6 • w w w . a f d b . o r g
TEA ALL
1.00
TEA OPP
0.81
1.00
TEA NEC
0.43
-0.14
1.00
NASCENT ALL
0.74
0.62
0.28
1.00
NASCENT OPP
0.74
0.91
-0.12
0.70
1.00
NASCENT NEC
0.38
-0.12
0.87
0.36
-0.111.00
NEW FIRM ALL
0.55
0.46
0.24
0.24
0.30
0.09
1.00
NEW FIRM OPP
0.46
0.57
-0.08
0.24
0.39
-0.070.85
1.00
NEW FIRM NEC
0.26
-0.08
0.60
0.05
-0.080.29
0.48
-0.051.00
MALE
0.05
0.03
0.04
0.02
0.01
0.02
0.09
0.08
0.05
1.00
AGE: 18-24 YEARS
-0.04-0.06
0.04
-0.04-0.050.03
-0.05-0.070.02
-0.031.00
AGE: 25-34 YEARS
0.08
0.08
0.03
0.10
0.07
0.03
0.09
0.06
0.06
-0.02-0.341.00
AGE: 35-44 YEARS
-0.010.00
-0.04
0.00
0.03
-0.060.02
0.03
-0.010.00
-0.30-0.371.00
AGE: 45-54 YEARS
0.00
0.02
-0.04-0.04-0.02-0.02-0.010.03
-0.050.04
-0.23-0.29-0.251.00
AGE: 55-64 YEARS
-0.06-0.07
0.01
-0.06-0.050.03
-0.10-0.08-0.050.02
-0.15-0.19-0.17-0.131.00
NO SECONDARY EDUCATION:
EDU0011C
-0.07-0.08
0.01
-0.08-0.05-0.01-0.11-0.11-0.02-0.06-0.03-0.08-0.030.10
0.09
1.00
SECONDARY EDUCATION
ONLY: EDU1212C
0.01
0.02
0.01
0.01
0.01
0.02
0.03
0.03
0.01
0.02
0.14
-0.030.01
-0.10-0.04-0.51
1.00
ANY POST SECONDARY
EDUCATION: EDU1320C
0.06
0.06
-0.02
0.07
0.04
-1.010.09
0.09
0.02
0.04
-0.100.11
0.01
-0.01-0.06-0.55
-0.44
1.00
WORKING, FULL TIME PART
TIME
0.17
0.15
0.06
0.19
0.13
0.02
0.10
0.09
0.05
0.43
-0.180.07
0.06
0.10
-0.07-0.13
-0.07
0.21
1.00
NOT WORKING
-0.12-0.11-0.03-0.12-0.100.00
-0.08-0.07-0.03-0.49-0.020.03
0.04
-0.04-0.02
0.14
-0.03
-0.12
-0.771.00
RETIRED, STUDENTS
-0.10-0.07-0.04-0.13-0.07-0.03-0.05-0.04-0.030.00
0.32
-0.16-0.15-0.100.14
0.01
0.15
-0.16
-0.49-0.181.00
FEAR OF FAILURE
-0.04-0.02-0.05-0.010.00
-0.03-0.04-0.01-0.05-0.14-0.03-0.020.03
-0.020.08
0.03
0.03
-0.06
-0.100.09
0.02
1.00
LOW HH INC
0.02
0.00
0.01
-0.010.00
0.00
-0.01-0.030.01
-0.04-0.05-0.040.07
-0.040.08
0.09
0.00
-0.09
-0.110.11
0.01
0.02
1.00
MEDIUM HH INC
-0.07-0.07-0.02-0.04-0.03-0.02-0.08-0.08-0.03-0.02-0.01-0.010.00
0.05
-0.02
0.15
-0.01
-0.14
-0.010.03
-0.020.12
-0.401.00
HIGH HH INC
0.06
0.06
0.01
0.05
0.03
0.02
0.09
0.10
0.02
0.06
0.06
0.05
-0.06-0.02-0.04-0.22
0.02
0.22
0.09
-0.110.01
-0.13-0.41-0.671.00
PREVALENCE OF INFORMAL
INVESTORS: BUSANG
0.07
0.05
0.05
0.05
0.03
0.02
0.09
0.05
0.07
0.07
-0.070.06
0.02
0.00
-0.02-0.16
0.04
0.12
0.13
-0.09-0.08-0.070.00
-0.100.09
1.00
Table 2. a - The four countries together: Correlation matrix of the dependent variables, Personal Attributes and Personal Context
TEA ALL
TEA OPP
TEA NEC
NASCENT ALL
NASCENT OPP
NASCENT NEC
NEW FIRM ALL
NEW FIRM OPP
NEW FIRM NEC
MALE
AGE: 18-24 YEARS
AGE: 25-34 YEARS
AGE: 35-44 YEARS
AGE: 45-54 YEARS
AGE: 55-64 YEARS
NO SECONDARYEDUCATION:EDU0011C
SECONDARYEDUCATION ONLY:EDU1212CANY POSTSECONDARY EDUCATION:EDU1320CWORKING, FULLTIME PART TIME
NOT WORKING
RETIRED, STUDENTS
FEAR OF FAILURE
LOW HH INC
MEDIUM HH INC
HIGH HH INC
PREVALENCE OFINFORMAL INVES-TORS: BUSANG
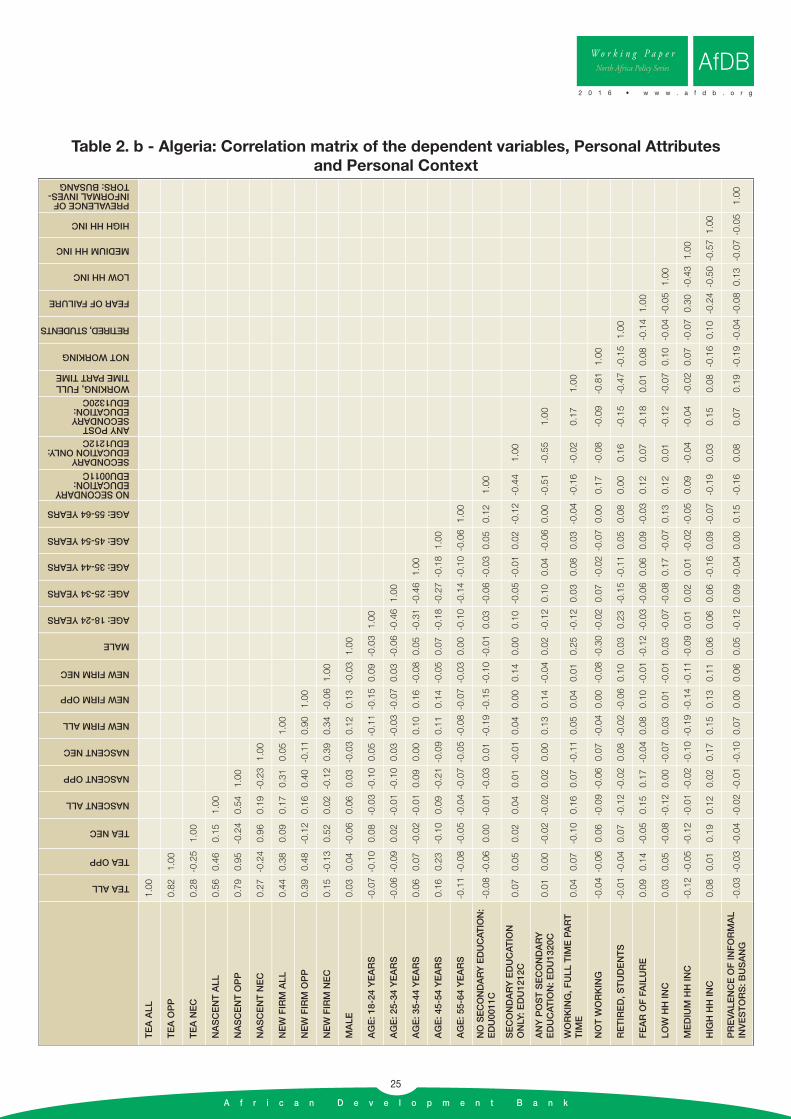
A f r i c a n D e v e l o p m e n t B a n k
25
W o r k i n g P a p e rNorth Africa Policy Series
2 0 1 6 • w w w . a f d b . o r g
AfDB
TEA ALL
1.00
TEA OPP
0.82
1.00
TEA NEC
0.28
-0.25
1.00
NASCENT ALL
0.56
0.46
0.15
1.00
NASCENT OPP
0.79
0.95
-0.24
0.54
1.00
NASCENT NEC
0.27
-0.24
0.96
0.19
-0.231.00
NEW FIRM ALL
0.44
0.38
0.09
0.17
0.31
0.05
1.00
NEW FIRM OPP
0.39
0.48
-0.12
0.16
0.40
-0.110.90
1.00
NEW FIRM NEC
0.15
-0.13
0.52
0.02
-0.120.39
0.34
-0.061.00
MALE
0.03
0.04
-0.06
0.06
0.03
-0.030.12
0.13
-0.031.00
AGE: 18-24 YEARS
-0.07-0.10
0.08
-0.03-0.100.05
-0.11-0.150.09
-0.031.00
AGE: 25-34 YEARS
-0.06-0.09
0.02
-0.01-0.100.03
-0.03-0.070.03
-0.06-0.461.00
AGE: 35-44 YEARS
0.06
0.07
-0.02-0.010.09
0.00
0.10
0.16
-0.080.05
-0.31-0.461.00
AGE: 45-54 YEARS
0.16
0.23
-0.10
0.09
-0.21-0.090.11
0.14
-0.050.07
-0.18-0.27-0.181.00
AGE: 55-64 YEARS
-0.11-0.08-0.05-0.04-0.07-0.05-0.08-0.07-0.030.00
-0.10-0.14-0.10-0.061.00
NO SECONDARY EDUCATION:
EDU0011C
-0.08-0.06
0.00
-0.01-0.030.01
-0.19-0.15-0.10-0.010.03
-0.06-0.030.05
0.12
1.00
SECONDARY EDUCATION
ONLY: EDU1212C
0.07
0.05
0.02
0.04
0.01
-0.010.04
0.00
0.14
0.00
0.10
-0.05-0.010.02
-0.12-0.44
1.00
ANY POST SECONDARY
EDUCATION: EDU1320C
0.01
0.00
-0.02-0.020.02
0.00
0.13
0.14
-0.040.02
-0.120.10
0.04
-0.060.00
-0.51
-0.55
1.00
WORKING, FULL TIME PART
TIME
0.04
0.07
-0.10
0.16
0.07
-0.110.05
0.04
0.01
0.25
-0.120.03
0.08
0.03
-0.04-0.16
-0.02
0.17
1.00
NOT WORKING
-0.04-0.06
0.06
-0.09-0.060.07
-0.040.00
-0.08-0.30-0.020.07
-0.02-0.070.00
0.17
-0.08
-0.09
-0.811.00
RETIRED, STUDENTS
-0.01-0.04
0.07
-0.12-0.020.08
-0.02-0.060.10
0.03
0.23
-0.15-0.110.05
0.08
0.00
0.16
-0.15
-0.47-0.151.00
FEAR OF FAILURE
0.09
0.14
-0.05
0.15
0.17
-0.040.08
0.10
-0.01-0.12-0.03-0.060.06
0.09
-0.03
0.12
0.07
-0.18
0.01
0.08
-0.141.00
LOW HH INC
0.03
0.05
-0.08-0.120.00
-0.070.03
0.01
-0.010.03
-0.07-0.080.17
-0.070.13
0.12
0.01
-0.12
-0.070.10
-0.04-0.051.00
MEDIUM HH INC
-0.12-0.05-0.12-0.01-0.02-0.10-0.19-0.14-0.11-0.090.01
0.02
0.01
-0.02-0.05
0.09
-0.04
-0.04
-0.020.07
-0.070.30
-0.431.00
HIGH HH INC
0.08
0.01
0.19
0.12
0.02
0.17
0.15
0.13
0.11
0.06
0.06
0.06
-0.160.09
-0.07-0.19
0.03
0.15
0.08
-0.160.10
-0.24-0.50-0.571.00
PREVALENCE OF INFORMAL
INVESTORS: BUSANG
-0.03-0.03-0.04-0.02-0.01-0.100.07
0.00
0.06
0.05
-0.120.09
-0.040.00
0.15
-0.16
0.08
0.07
0.19
-0.19-0.04-0.080.13
-0.07-0.05
1.00
Table 2. b - Algeria: Correlation matrix of the dependent variables, Personal Attributesand Personal Context
TEA ALL
TEA OPP
TEA NEC
NASCENT ALL
NASCENT OPP
NASCENT NEC
NEW FIRM ALL
NEW FIRM OPP
NEW FIRM NEC
MALE
AGE: 18-24 YEARS
AGE: 25-34 YEARS
AGE: 35-44 YEARS
AGE: 45-54 YEARS
AGE: 55-64 YEARS
NO SECONDARYEDUCATION:EDU0011CSECONDARYEDUCATION ONLY:EDU1212CANY POSTSECONDARY EDUCATION:EDU1320CWORKING, FULLTIME PART TIME
NOT WORKING
RETIRED, STUDENTS
FEAR OF FAILURE
LOW HH INC
MEDIUM HH INC
HIGH HH INC
PREVALENCE OFINFORMAL INVES-TORS: BUSANG

A f r i c a n D e v e l o p m e n t B a n k
26
AfDBW o r k i n g P a p e r
North Africa Policy Series
2 0 1 6 • w w w . a f d b . o r g
TEA ALL
1.00
TEA OPP
0.72
1.00
TEA NEC
0.58
-0.10
1.00
NASCENT ALL
0.77
0.58
0.40
1.00
NASCENT OPP
0.64
0.88
-0.09
0.68
1.00
NASCENT NEC
0.48
-0.09
0.84
0.51
-0.081.00
NEW FIRM ALL
0.61
0.44
0.39
0.22
0.22
0.14
1.00
NEW FIRM OPP
0.45
0.63
-0.07
0.20
0.34
-0.060.75
1.00
NEW FIRM NEC
0.38
-0.07
0.66
0.10
-0.060.28
0.63
-0.041.00
MALE
0.04
0.01
0.06
-0.01-0.010.01
0.06
0.01
0.07
1.00
AGE: 18-24 YEARS
-0.01-0.02
0.03
-0.06-0.030.02
0.00
-0.010.01
0.01
1.00
AGE: 25-34 YEARS
0.05
0.03
0.06
0.05
0.04
0.05
0.11
0.06
0.09
0.03
-0.291.00
AGE: 35-44 YEARS
-0.020.02
-0.06
0.01
0.04
-0.100.00
-0.010.01
-0.05-0.30-0.331.00
AGE: 45-54 YEARS
-0.020.00
-0.05-0.01-0.05-0.01-0.040.01
-0.070.02
-0.25-0.27-0.281.00
AGE: 55-64 YEARS
-0.02-0.03
0.02
0.00
0.00
0.05
-0.11-0.08-0.07-0.01-0.18-0.20-0.20-0.171.00
NO SECONDARY EDUCATION:
EDU0011C
-0.06-0.13
0.06
-0.06-0.080.02
-0.10-0.150.03
-0.07-0.07-0.13-0.030.12
0.16
1.00
SECONDARY EDUCATION
ONLY: EDU1212C
0.01
0.04
-0.02
0.01
0.05
0.01
0.04
0.09
-0.050.01
0.16
-0.010.03
-0.13-0.07-0.48
1.00
ANY POST SECONDARY
EDUCATION: EDU1320C
0.06
0.08
-0.04
0.05
0.04
-0.030.06
0.06
0.02
0.05
-0.090.14
0.00
0.02
-0.08-0.50
-0.52
1.00
WORKING, FULL TIME PART
TIME
0.19
0.15
0.11
0.20
0.15
0.06
0.08
0.04
0.07
0.52
-0.180.07
0.06
0.12
-0.09-0.13
-0.09
0.22
1.00
NOT WORKING
-0.14-0.12-0.06-0.13-0.10-0.02-0.06-0.06-0.03-0.59-0.050.05
0.05
-0.050.00
0.11
0.00
-0.11
-0.761.00
RETIRED, STUDENTS
-0.11-0.07-0.08-0.13-0.09-0.06-0.040.01
-0.070.00
0.35
-0.17-0.16-0.120.14
0.05
0.14
-0.19
-0.50-0.191.00
FEAR OF FAILURE
-0.15-0.14-0.09-0.10-0.12-0.06-0.10-0.07-0.08-0.19-0.03-0.060.01
-0.010.12
0.03
0.02
-0.05
-0.190.14
0.11
1.00
LOW HH INC
-0.03-0.05
0.00
-0.05-0.04-0.01-0.05-0.060.00
-0.08-0.07-0.020.06
-0.030.07
0.26
-0.07
-0.18
-0.160.16
0.02
0.04
1.00
MEDIUM HH INC
-0.04-0.08
0.02
-0.03-0.020.01
-0.03-0.040.01
0.03
-0.03-0.070.03
0.06
0.01
0.08
0.05
-0.12
0.02
-0.040.02
0.08
-0.421.00
HIGH HH INC
0.07
0.12
-0.03
0.07
0.06
0.00
0.07
0.09
-0.010.04
0.09
0.08
-0.08-0.04-0.07-0.29
0.02
0.27
0.11
-0.10-0.04-0.11-0.44-0.631.00
PREVALENCE OF INFORMAL
INVESTORS: BUSANG
0.14
0.12
0.07
0.11
0.08
-0.060.11
0.10
0.06
0.08
-0.060.09
0.03
-0.01-0.07-0.09
-0.01
0.10
0.13
-0.07-0.10-0.11-0.09-0.080.15
1.00
Table 2. c – Egypt: Correlation matrix of the dependent variables, Personal Attributesand Personal Context
TEA ALL
TEA OPP
TEA NEC
NASCENT ALL
NASCENT OPP
NASCENT NEC
NEW FIRM ALL
NEW FIRM OPP
NEW FIRM NEC
MALE
AGE: 18-24 YEARS
AGE: 25-34 YEARS
AGE: 35-44 YEARS
AGE: 45-54 YEARS
AGE: 55-64 YEARS
NO SECONDARYEDUCATION:EDU0011CSECONDARYEDUCATION ONLY:EDU1212CANY POSTSECONDARY EDUCATION:EDU1320CWORKING, FULLTIME PART TIME
NOT WORKING
RETIRED, STUDENTS
FEAR OF FAILURE
LOW HH INC
MEDIUM HH INC
HIGH HH INC
PREVALENCE OFINFORMAL INVES-TORS: BUSANG

A f r i c a n D e v e l o p m e n t B a n k
27
W o r k i n g P a p e rNorth Africa Policy Series
2 0 1 6 • w w w . a f d b . o r g
AfDB
TEA ALL
1.00
TEA OPP
0.96
1.00
TEA NEC
0.22
-0.06
1.00
NASCENT ALL
0.78
0.77
0.10
1.00
NASCENT OPP
0.80
0.83
-0.05
0.93
1.00
NASCENT NEC
0.15
-0.04
0.70
0.18
-0.04
1.00
NEW FIRM ALL
0.60
0.63
-0.04
0.33
0.37
-0.03
1.00
NEW FIRM OPP
0.60
0.63
-0.04
0.33
0.37
-0.03
1.00
1.00
MALE
0.20
0.18
0.09
0.15
0.15
0.07
0.21
0.21
1.00
AGE: 18-24 YEARS
-0.13-0.11
-0.06
-0.07-0.05-0.04-0.12-0.12-0.12
1.00
AGE: 25-34 YEARS
0.14
0.17
-0.08
0.09
0.10
-0.06
0.17
0.17
-0.07-0.37
1.00
AGE: 35-44 YEARS
-0.01-0.07
0.20
0.06
0.01
0.14
-0.03-0.03
0.08
-0.31-0.41
1.00
AGE: 45-54 YEARS
-0.01
0.01
-0.05
-0.10-0.08-0.04-0.01-0.01
0.04
-0.23-0.30-0.25
1.00
AGE: 55-64 YEARS
-0.03-0.02
-0.02
-0.01
0.01
-0.02-0.07-0.07
0.17
-0.11-0.14-0.12-0.09
1.00
NO SECONDARY EDUCATION:
EDU0011C
0.01
0.00
0.06
0.09
0.07
0.04
-0.08-0.08-0.07
0.01
0.01
-0.04
0.07
-0.07
1.00
SECONDARY EDUCATION
ONLY: EDU1212C
-0.04-0.03
-0.04
-0.06-0.04-0.03-0.05-0.05
0.07
0.07
-0.03-0.02-0.10
0.14
-0.75
1.00
ANY POST SECONDARY
EDUCATION: EDU1320C
0.03
0.04
-0.03
-0.07-0.05-0.02
0.17
0.17
0.02
-0.09
0.02
0.07
0.02
-0.06
-0.59
-0.10
1.00
WORKING, FULL TIME PART
TIME
0.20
0.18
0.09
0.13
0.09
0.06
0.25
0.25
0.42
-0.25
0.10
0.05
0.09
0.01
-0.04
-0.08
0.16
1.00
NOT WORKING
-0.17-0.16
-0.07
-0.11-0.09-0.05-0.19-0.19-0.45
0.06
-0.05
0.05
0.00
-0.12
0.13
-0.07
-0.11
-0.79
1.00
RETIRED, STUDENTS
-0.08-0.07
-0.04
-0.04-0.02-0.03-0.11-0.11-0.01
0.31
-0.09-0.15-0.15
0.16
-0.12
0.23
-0.10
-0.45-0.20
1.00
FEAR OF FAILURE
0.17
0.12
0.20
0.10
0.05
0.14
-0.03-0.03-0.05-0.08
0.13
0.06
-0.12-0.04
0.04
-0.02
-0.05
0.08
-0.02-0.09
1.00
MEDIUM HH INC
-0.03-0.03
-0.02
0.04
0.03
0.07
-0.10-0.10-0.06
0.02
0.10
-0.07-0.01-0.10
0.14
-0.03
-0.17
-0.04
0.13
-0.12
0.15
1.00
HIGH HH INC
0.03
0.03
0.02
-0.04-0.03-0.07
0.10
0.10
0.06
-0.02-0.10
0.07
0.01
0.10
-0.14
0.03
0.17
0.04
-0.13
0.12
-0.15-1.00
1.00
Table 2. d - Morocco: Correlation matrix of the dependent variables, Personal Attributesand Personal Context
TEA ALL
TEA OPP
TEA NEC
NASCENT ALL
NASCENT OPP
NASCENT NEC
NEW FIRM ALL
NEW FIRM OPP
MALE
AGE: 18-24 YEARS
AGE: 25-34 YEARS
AGE: 35-44 YEARS
AGE: 45-54 YEARS
AGE: 55-64 YEARS
NO SECONDARY EDU-CATION: EDU0011C
SECONDARYEDUCATION ONLY:EDU1212C
ANY POSTSECONDARY EDUCATION:EDU1320C
WORKING, FULL TIMEPART TIME
NOT WORKING
RETIRED, STUDENTS
FEAR OF FAILURE
MEDIUM HH INC
HIGH HH INC

A f r i c a n D e v e l o p m e n t B a n k
28
AfDBW o r k i n g P a p e r
North Africa Policy Series
2 0 1 6 • w w w . a f d b . o r g
TEA ALL
1.00
TEA OPP
0.64
1.00
TEA NEC
0.29
-0.41
1.00
NASCENT ALL
0.76
0.49
0.22
1.00
NASCENT OPP
0.64
1.00
-0.41
0.49
1.00
NASCENT NEC
0.29
-0.41
1.00
0.22
-0.411.00
NEW FIRM ALL
0.23
0.36
-0.15
0.18
0.36
-0.151.00
NEW FIRM OPP
0.23
0.36
-0.15
0.18
0.36
-0.151.00
1.00
MALE
0.19
-0.15
0.33
0.14
-0.150.33
-0.09-0.091.00
AGE: 18-24 YEARS
-0.33-0.41
0.21
-0.13-0.410.21
-0.15-0.15-0.271.00
AGE: 25-34 YEARS
0.19
0.37
-0.12
-0.030.37
-0.120.02
0.02
-0.15-0.411.00
AGE: 35-44 YEARS
-0.02-0.12
-0.19
-0.13-0.12-0.19-0.15-0.150.33
-0.19-0.411.00
AGE: 45-54 YEARS
0.07
0.03
0.13
0.27
0.03
0.13
0.24
0.24
0.13
-0.22-0.49-0.221.00
NO SECONDARY EDUCATION:
EDU0011C
0.35
0.03
0.48
0.27
0.03
0.48
0.24
0.24
0.13
-0.22-0.23-0.220.68
1.00
SECONDARY EDUCATION
ONLY: EDU1212C
0.23
0.02
0.32
0.18
0.02
0.32
-0.12-0.12-0.090.32
0.02
0.15
-0.18
-0.18
1.00
ANY POST SECONDARY
EDUCATION: EDU1320C
-0.46-0.04
-0.64
0-.35-0.04-0.64-0.14-0.14-0.05-0.020.19
0.29
-0.48
-0.76
-0.50
1.00
WORKING, FULL TIME PART
TIME
0.14
0.33
-0.32
0.24
0.33
-0.320.12
0.12
0.09
-0.32-0.020.15
0.18
-0.24
0.12
0.14
1.00
NOT WORKING
0.16
-0.22
0.54
0.12
-0.220.54
-0.08-0.080.18
-0.100.25
-0.10-0.12
0.46
-0.08
-0.35
-0.69
1.00
RETIRED, STUDENTS
-0.35-0.22
-0.10
-0.46-0.22-0.10-0.08-0.08-0.310.54
-0.22-0.10-0.12
-0.12
-0.08
0.16
-0.69-0.06
1.00
FEAR OF FAILURE
-0.11-0.09
0.07
-0.28-0.090.07
0.18
0.18
0.21
0.07
0.15
0.07
-0.31
-0.31
0.18
0.15
0.21
-0.14-0.141.00
LOW HH INC
0.07
0.03
0.13
-0.050.03
0.13
-0.18-0.18-0.140.48
-0.23-0.220.05
0.05
0.24
-0.20
-0.24-0.12
0.46
-0.021.00
MEDIUM HH INC
-0.11-0.17
0.22
0.18
-0.170.22
0.05
0.05
-0.23-0.080.04
-0.370.34
0.34
0.05
-0.34
-0.05
0.28
-0.20-0.27-0.441.00
HIGH HH INC
0.05
0.15
-0.33
-0.140.15
-0.330.09
0.09
0.36
-0.330.15
0.57
-0.39
-0.39
-0.26
0.52
0.26
-0.18-0.18-0.29-0.39-0.651.00
PREVALENCE OF INFORMAL
INVESTORS: BUSANG
0.23
0.36
-0.15
0.18
0.36
-0.150.44
0.44
0.26
-0.150.02
0.32
-0.18
-0.18
-0.12
0.23
0.12
-0.08-0.080.57
-0.18-0.290.45
1.00
Table 2. e - Tunisia: Correlation matrix of the dependent variables, Personal Attributesand Personal Context
TEA ALL
TEA OPP
TEA NEC
NASCENT ALL
NASCENT OPP
NASCENT NEC
NEW FIRM ALL
NEW FIRM OPP
MALE
AGE: 18-24 YEARS
AGE: 25-34 YEARS
AGE: 35-44 YEARS
AGE: 45-54 YEARS
NO SECONDARYEDUCATION:EDU0011C
SECONDARYEDUCATION ONLY:EDU1212C
ANY POSTSECONDARY EDUCATION:EDU1320C
WORKING, FULLTIME PART TIME
NOT WORKING
RETIRED, STUDENTS
FEAR OF FAILURE
LOW HH INC
MEDIUM HH INC
HIGH HH INC
PREVALENCE OF IN-FORMAL INVES-TORS: BUSANG

A f r i c a n D e v e l o p m e n t B a n k
29
W o r k i n g P a p e rNorth Africa Policy Series
2 0 1 6 • w w w . a f d b . o r g
AfDB
Table 3. a - The four countries together: Logistic Regression for the Nascent entrepreneurs(all, by opportunity and by necessity)
NASCENT ALL NASCENT OPP NASCENT NEC
PERSONAL ATTRIBUTES
MALE -0.1886175(-1.55)
-0.3412776*(-1.85)
-0.1031967(-0.70)
-0.3078105(-1.43)
-0.1578976(-0.66)
0.1295077(0.34)
AGE: 25-34 YEARS 0.2543201*(1.72)
0.2354287(1.03)
0.3289842*(1.81)
0.4229472(1.51)
-0.0737731(-0.26)
-0.150114(-0.36)
AGE: 35-44 YEARS 0.0141798(0.09)
-0.0769493(-0.32)
0.2055057(1.05)
0.3103033(1.06)
-0.561659(-1.64)
-0.9900915*(-1.89)
AGE: 45-54 YEARS -0.0394592(-0.22)
-0.2706446(-1.01)
-0.0245662(-0.11)
0.0244671(0.07)
0.0931176(0.28)
-0.5553466(-1.05)
AGE: 55-64 YEARS -0.1470528(-0.63)
-0.3532409(-0.99)
-0.1529327(-0.51)
-0.3024531(-0.65)
-0.1042225(-0.24)
0.1743106(0.31)
SECONDARY EDUCATIONONLY: EDU1212C
0.627901***(4.84)
0.2283215(1.17)
0.5726318***
(3.66)
0.1715351(0.73)
0.4296443*(1.70)
0.1610396(0.43)
ANY POST SECONDARYEDUCATION: EDU1320C
0.8057556***(6.27)
0.1578606(0.82)
0.5719739***(3.67)
0.0985056(0.43)
0.2631421(0.98)
-0.1754717(-0.43)
NOT WORKING -0.9524449***(-6.33)
-1.018754***(-4.31)
-0.8264686***(-4.39)
-0.977053***(-0.33)
0.0270952(0.10)
0.055753(0.13)
RETIRED, STUDENTS -0.5608573***(-3.06)
-1.359167***(-3.78)
-0.5029477**
(-2.17)
-0.8013657*(-1.93)
-0.2234428(-0.62)
-0.7901229(-1.21)
FEAR OF FAILURE 0.4298452***(3.71)
0.0401262(0.23)
0.2244824(1.59)
0.0575686(0.28)
0.0691148(0.30)
-0.3048269(-0.81)
PERSONAL CONTEXT
MEDIUM HH INC -0.0091407(-0.04)
-0.1863141(-0.86)
-0.0129836(-0.05)
-0.1749721(-0.68)
-0.0267186(-0.06)
-0.1333187(0.31)
HIGH HH INC 0.2273036(1.12)
-0.0252112(-0.12)
0.188422(0.77)
-0.0357523(-0.14)
0.1246355(0.30)
0.0358345(0.08)
PREVALENCE OF INFORMALINVESTORS: BUSANG
0.2654046(1.22)
0.1248302(0.55)
0.1801364(0.70)
0.0487886(0.18)
0.2152235(0.51)
0.2154373(0.49)
CONSTANT -1.033942***(-6.25)
-0.9259153***(-5.43)
-0.3669458(-1.17)
-1.846963***(-9.01)
1.618706(-7.83)
-1.332299***(-3.51)
-2.880014***(-8.92)
-2.925121***(-8.41)
-2.522495***(-4.12)
Nb. Obs. Pseudo R2chi2
19400.0600139.37***
8820.00404.34
8490.046348.16***
19400.039466.75***
8820.00221.86
8490.031724.99**
19400.01038.05
8820.00140.53
8490.02518.83
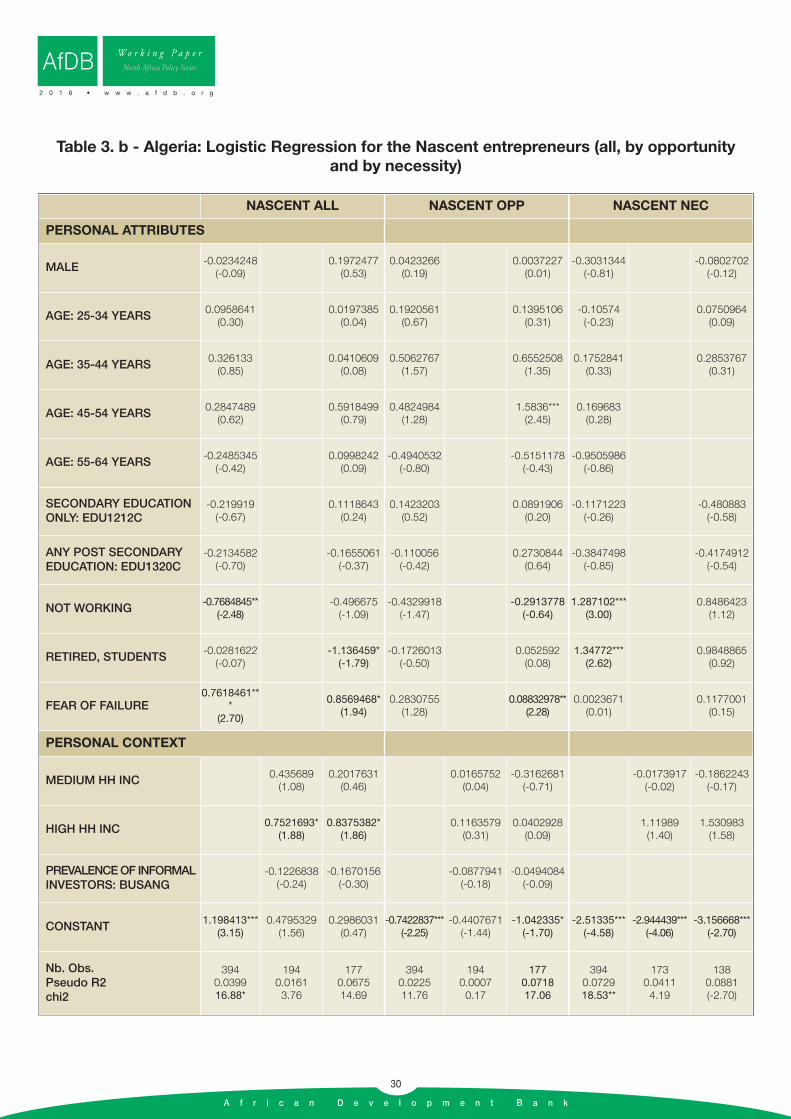
A f r i c a n D e v e l o p m e n t B a n k
30
AfDBW o r k i n g P a p e r
North Africa Policy Series
2 0 1 6 • w w w . a f d b . o r g
Table 3. b - Algeria: Logistic Regression for the Nascent entrepreneurs (all, by opportunityand by necessity)
NASCENT ALL NASCENT OPP NASCENT NEC
PERSONAL ATTRIBUTES
MALE -0.0234248(-0.09)
0.1972477(0.53)
0.0423266(0.19)
0.0037227(0.01)
-0.3031344(-0.81)
-0.0802702(-0.12)
AGE: 25-34 YEARS 0.0958641(0.30)
0.0197385(0.04)
0.1920561(0.67)
0.1395106(0.31)
-0.10574(-0.23)
0.0750964(0.09)
AGE: 35-44 YEARS 0.326133(0.85)
0.0410609(0.08)
0.5062767(1.57)
0.6552508(1.35)
0.1752841(0.33)
0.2853767(0.31)
AGE: 45-54 YEARS 0.2847489(0.62)
0.5918499(0.79)
0.4824984(1.28)
1.5836***(2.45)
0.169683(0.28)
AGE: 55-64 YEARS -0.2485345(-0.42)
0.0998242(0.09)
-0.4940532(-0.80)
-0.5151178(-0.43)
-0.9505986(-0.86)
SECONDARY EDUCATIONONLY: EDU1212C
-0.219919(-0.67)
0.1118643(0.24)
0.1423203(0.52)
0.0891906(0.20)
-0.1171223(-0.26)
-0.480883(-0.58)
ANY POST SECONDARYEDUCATION: EDU1320C
-0.2134582(-0.70)
-0.1655061(-0.37)
-0.110056(-0.42)
0.2730844(0.64)
-0.3847498(-0.85)
-0.4174912(-0.54)
NOT WORKING -0.7684845**(-2.48)
-0.496675(-1.09)
-0.4329918(-1.47)
-0.2913778(-0.64)
1.287102***(3.00)
0.8486423(1.12)
RETIRED, STUDENTS -0.0281622(-0.07)
-1.136459*(-1.79)
-0.1726013(-0.50)
0.052592(0.08)
1.34772***(2.62)
0.9848865(0.92)
FEAR OF FAILURE0.7618461**
*(2.70)
0.8569468*(1.94)
0.2830755(1.28)
0.08832978**(2.28)
0.0023671(0.01)
0.1177001(0.15)
PERSONAL CONTEXT
MEDIUM HH INC 0.435689(1.08)
0.2017631(0.46)
0.0165752(0.04)
-0.3162681(-0.71)
-0.0173917(-0.02)
-0.1862243(-0.17)
HIGH HH INC 0.7521693*(1.88)
0.8375382*(1.86)
0.1163579(0.31)
0.0402928(0.09)
1.11989(1.40)
1.530983(1.58)
PREVALENCE OF INFORMALINVESTORS: BUSANG
-0.1226838(-0.24)
-0.1670156(-0.30)
-0.0877941(-0.18)
-0.0494084(-0.09)
CONSTANT 1.198413***(3.15)
0.4795329(1.56)
0.2986031(0.47)
-0.7422837***(-2.25)
-0.4407671(-1.44)
-1.042335*(-1.70)
-2.51335***(-4.58)
-2.944439***(-4.06)
-3.156668***(-2.70)
Nb. Obs. Pseudo R2chi2
3940.039916.88*
1940.01613.76
1770.067514.69
3940.022511.76
1940.00070.17
1770.071817.06
3940.072918.53**
1730.04114.19
1380.0881(-2.70)

A f r i c a n D e v e l o p m e n t B a n k
31
W o r k i n g P a p e rNorth Africa Policy Series
2 0 1 6 • w w w . a f d b . o r g
AfDB
Table 3. c - Egypt: Logistic Regression for the Nascent entrepreneurs(all, by opportunity and by necessity)
NASCENT ALL NASCENT OPP NASCENT NEC
PERSONAL ATTRIBUTES
MALE -0.8438206***(-3.08)
-0.9991098***(-3.28)
-0.8624626**(-2.50)
-1.071664***(-2.81)
-0.3724125(-0.79)
-0.3230995(-0.61)
AGE: 25-34 YEARS 0.4224707(1.19)
0.1396906(0.36)
0.4113201(0.89)
0.1074415(0.21)
0.0707512(0.14)
-0.1611812(-0.29)
AGE: 35-44 YEARS 0.3117763(0.88)
0.0118518(0.03)
0.3715558(0.80)
0.1105925(0.22)
-1.000625(-1.54)
-1.811538**(-2.19)
AGE: 45-54 YEARS 0.1093738(0.29)
-0.1188043(-0.29)
-0.2891607(-0.53)
-0.5508085(-0.93)
-0.3474371(-0.59)
-0.5815834(-0.93)
AGE: 55-64 YEARS 0.6058157(1.44)
0.3241702(0.67)
0.5617581(1.01)
0.245794(0.38)
0.4170911(0.70)
0.308198(0.49)
SECONDARY EDUCATIONONLY: EDU1212C
0.1756642(0.62)
0.2578053(0.80)
0.6715555*(1.68)
0.6494126(1.46)
-0.3546367(-0.80)
-0.0682267(-0.14)
ANY POST SECONDARYEDUCATION: EDU1320C
0.0332946(0.12)
0.0318001(0.10)
0.4022768(1.01)
0.2699063(0.59)
-0.6913332(-1.50)
-0.538307(-0.99)
NOT WORKING -1.648402***(-4.38)
-1.727653***(-4.08)
-2.034247***(-3.47)
-1.89964***(-3.14)
-0.3743835(-0.69)
-0.6192575(-0.96)
RETIRED, STUDENTS -1.591035***(-2.82)
-2.255515***(-2.91)
-1.546224**(-1.97)
-2.242162**(-2.07)
-1.7889*(-1.69)
-1.773066(-1.65)
FEAR OF FAILURE -0.4954904*(-1.84)
-0.535835*(-1.76)
-0.9043877**(-2.21)
-1.060591**(-2.26)
-0.4369858(-0.97)
-0.591017(-1.13)
PERSONAL CONTEXT
MEDIUM HH INC 0.1161507(0.35)
-0.0270346(0.08)
0.2065857(0.46)
0.0534985(0.11)
0.1070577(0.20)
0.1096909(0.20)
HIGH HH INC 0.4318053(1.37)
0.1699817(0.49)
0.5261065(1.22)
0.1550525(0.33)
-0.0327542(-0.06)
-0.0691176(-0.12)
PREVALENCE OF INFORMALINVESTORS: BUSANG
0.6236658**(2.21)
0.4922095*(1.67)
0.548672(1.51)
0.3793212(1.00)
0.6165432(1.34)
0.5335806(1.12)
CONSTANT -0.6655221(-1.64)
-1.867857***(-7.03)
-0.5896422(-1.15)
-1.656408***(-3.07)
-2.698472***(-7.28)
-1.440622**(-2.1)
-1.736602***(-2.77)
-3.015358***(-7.08)
-1.773799**(-2.22)
Nb. Obs. Pseudo R2chi2
5670.070039.24***
5190.01708.32**
5070.088842.63***
5670.095534.91***
5190.01464.68
5070.105633.06***
5670.049412.44
5190.00781.69
5070.074916.22

A f r i c a n D e v e l o p m e n t B a n k
32
AfDBW o r k i n g P a p e r
North Africa Policy Series
2 0 1 6 • w w w . a f d b . o r g
Table 3. d - Morocco: Logistic Regression for the Nascent entrepreneurs(all, by opportunity and by necessity)
NASCENT ALL NASCENT OPP NASCENT NEC
PERSONAL ATTRIBUTES
MALE 0.0644893(0.26)
0.8415686(1.44)
0.1700251(0.61)
1.026574(1.64)
-0.4636039(-0.89)
AGE: 25-34 YEARS 0.1493279(0.52)
0.5316565(0.79)
0.2420853(0.57)
0.4877918(0.71)
-0.6688591(-1.10)
AGE: 35-44 YEARS -0.1341578(-0.42)
0.4589725(0.65)
-0.0219777(-0.06)
0.1185832(0.16)
-0.9554109(-1.34)
AGE: 45-54 YEARS -0.1655399(-0.45)
-0.6982363(-0.73)
-0.3145406(-0.71)
-0.6574435(-0.69)
0.1266377(0.21)
AGE: 55-64 YEARS -0.2208138(-0.43)
-0.0060314(-0.00)
0.09801(0.19)
-0.0172609(-0.01)
SECONDARY EDUCATIONONLY: EDU1212C
0.5483466**(1.98)
-0.7754992(-0.94)
0.4455903(1.41)
-0.6039038(-0.73)
0.5361341(0.91)
ANY POST SECONDARYEDUCATION: EDU1320C
0.327738(0.81)
-1.005647(-0.92)
0.4597947(1.07)
-0.7898975(-0.72)
-0.2309477(-0.22)
NOT WORKING -0.6680055**(-2.32)
-0.4688809(-0.68)
-0.4100928(-1.28)
-0.1442996(-0.21)
-1.198451*(-1.86)
RETIRED, STUDENTS -0.7804179(-2.00)
-0.2526321(-0.29)
-0.4520905(-1.09)
-0.1371897(-0.15)
-1.897699*(-1.73)
FEAR OF FAILURE 0.4334797(1.81)
0.402892(0.81)
0.329828(1.22)
0.1818264(0.34)
0.2508423(0.47)
PERSONAL CONTEXT
MEDIUM HH INC -0.2333767(-0.53)
-0.1579488(-0.33)
-0.1216652(-0.26)
-0.11396(-0.23)
HIGH HH INC
PREVALENCE OF INFORMALINVESTORS: BUSANG
CONSTANT -2.005176***(-6.31)
-1.415282***(-5.23)
-2.126727**(-2.58)
-2.498579***(-6.88)
-1.651402***(-5.66)
-2.355759***(-2.71)
-2.796142***(-4.68)
Nb. Obs. Pseudo R2chi2
9340.031320.57**
1490.00200.29
1460.077310.57
9340.020711.29
1490.00050.07
1460.05947.55
8740.05079.66

A f r i c a n D e v e l o p m e n t B a n k
33
W o r k i n g P a p e rNorth Africa Policy Series
2 0 1 6 • w w w . a f d b . o r g
AfDB
Table 3. e - Tunisia: Logistic Regression for the Nascent entrepreneurs(all, by opportunity and by necessity)
NASCENT ALL NASCENT OPP NASCENT NEC
PERSONAL ATTRIBUTES
MALE 2.570408**(2.25)
0.8473806(1.15)
0.9988509(0.82)
AGE: 25-34 YEARS -16.44004(-0.01)
0.4761887(0.25)
0.2650444(0.18)
AGE: 35-44 YEARS -17.74692(-0.01)
0.5382099(0.44)
AGE: 45-54 YEARS -15.72029(-0.01)
0.7103494(0.42)
AGE: 55-64 YEARS 0.8129854(0.66)
SECONDARY EDUCATIONONLY: EDU1212C
0.3210936(0.38)
-0.120639(-0.08)
ANY POST SECONDARYEDUCATION: EDU1320C
-0.0230327(-0.02)
-0.014802(-0.11)
-0.7615014(-0.66)
NOT WORKING 1.076561(0.66)
2.617946*(1.73)
RETIRED, STUDENTS -1.075418(-1.09)
FEAR OF FAILURE -1.303966(-1.03)
-1.060697(-0.80)
1.814364(1.46)
PERSONAL CONTEXT
MEDIUM HH INC 0.1541507(0.11)
-0.6931472(-0.57)
HIGH HH INC -0.6931472(-0.47)
-0.4054651(-0.30)
PREVALENCE OF INFORMALINVESTORS: BUSANG
CONSTANT 16.41223(0.01)
1.098612(0.95)
-3.80e-16(-0.00)
-2.791391(-1.34)
Nb. Obs. Pseudo R2chi2
320.24989.77
180.02380.51
430.05393.21
180.01350.32
370.18446.62

A f r i c a n D e v e l o p m e n t B a n k
34
AfDBW o r k i n g P a p e r
North Africa Policy Series
2 0 1 6 • w w w . a f d b . o r g
Table 4. a - The four countries together: Logistic Regression for the Total EntrepreneurialActivity - TEA (all, by opportunity and by necessity)
TEA ALL TEA OPP TEA NEC
PERSONAL ATTRIBUTES
MALE -0.1020638(-1.15)
-0.091705(-0.66)
-0.1625291(-1.58)
-0.2078131(-1.30)
0.0268119(0.16)
0.2007524(0.76)
AGE: 25-34 YEARS 0.094935(0.84)
0.1685178(0.95)
0.1007993(0.76)
0.2812037(1.32)
0.1637567(0.82)
-0.0584561(-0.20)
AGE: 35-44 YEARS -0.0760268(-0.64)
-0.0354535(-0.19)
-0.0755051(-0.54)
0.0367602(0.16)
-0.0826665(-0.39)
-0.3379999(-1.09)
AGE: 45-54 YEARS -0.5639854***(-4.12)
-0.5329678**(-2.57)
-0.4936783***(-3.08)
-0.2931944(-1.20)
-0.6700396**(-2.58)
-1.242769***(-3.05)
AGE: 55-64 YEARS -0.9651108***(-5.40)
-1.34681***(-4.52)
-1.027581***(-4.65)
-1.320937***(-3.49)
-0.5934347**(-2.00)
-1.340025***(-2.67)
SECONDARY EDUCATIONONLY: EDU1212C
-0.0984166(-1.02)
-0.2913673**(-1.97)
-0.0501294(-0.44)
-0.1983801(-1.12)
-0.1446594(-0.86)
-0.378529(-1.51)
ANY POST SECONDARYEDUCATION: EDU1320C
-0.5619427***(-6.06)
-0.6629724***(-4.50)
-0.4787443***(-4.40)
-0.5234938***(-3.00)
-0.7323362***(-4.23)
-0.9932455***(-3.69)
NOT WORKING -1.568266***(-12.79)
-1.546166***(-7.55)
-1.71354***(-11.24)
-1.613243***(-6.47)
-1.089962***(-5.17)
-1.114781***(-3.09)
RETIRED, STUDENTS -1.321978***(-8.42)
-1.113233***(-4.36)
-1.248494***(-6.79)
-1.04726***(-3.39)
-1.256164***(-4.17)
-1.335408***(-2.71)
FEAR OF FAILURE -0.1131315(-1.28)
-0.1861796(-1.39)
-0.0928077(-0.89)
-0.0559801(0.36)
-0.1173581(-0.73)
-0.4627942*(-1.79)
PERSONAL CONTEXT
MEDIUM HH INC 0.0518993(0.33)
-0.1444991(-0.88)
-0.0083551(-0.04)
-0.2459833(-1.23)
0.2658287(0.94)
0.1741644(0.59)
HIGH HH INC 0.5239725***(3.55)
0.413478**(2.59)
0.6037331***(3.41)
0.4372879**(2.33)
0.4607833(1.66)
0.4522443(1.52)
PREVALENCE OF INFORMALINVESTORS: BUSANG
1.046467***(6.49)
0.7507337***(4.29)
1.042673***(5.61)
0.7602167***(3.82)
0.6749915**(2.21)
0.4071707(1.25)
CONSTANT -1.067981***(-8.39)
-2.603977***(-20.99)
-1.404494***(-5.98)
-1.505904***(-10.19)
-3.060423***(-20.22)
-1.966825***(-7.00)
-2.63884***(-11.56)
-3.960918***(-16.97)
-2.700503***(-6.52)
Nb. Obs. Pseudo R2chi2
70040.0784392.98***
39600.024460.16***
35830.0962220.23***
70040.0734248.85***
39600.027651.41***
35830.0886154.17***
70040.047492.64***
39600.00807.68*
35830.077969.43***

A f r i c a n D e v e l o p m e n t B a n k
35
W o r k i n g P a p e rNorth Africa Policy Series
2 0 1 6 • w w w . a f d b . o r g
AfDB
Table 4. b - Algeria: Logistic Regression for the Total Entrepreneurial Activity - TEA(all, by opportunity and by necessity)
TEA ALL TEA OPP TEA NEC
PERSONAL ATTRIBUTES
MALE 0.1843807(1.25)
0.2394436(10.7)
0.1298412(-0.78)
0.163037(0.66)
0.1399692(0.45)
-0.0254882(-0.05)
AGE: 25-34 YEARS -0.1335116(-0.71)
-0.0779949(-0.26)
-0.0453366(-0.21)
-0.0290463(-0.09)
-0.0431494(-0.11)
-0.1196133(-0.18)
AGE: 35-44 YEARS 0.0129475(0.06)
0.0913391(0.29)
-0.0283033(-0.12)
0.0962952(0.28)
0.202942(0.49)
-0.2421821(-0.33)
AGE: 45-54 YEARS -0.0713014(-0.30)
-0.0090665(-0.03)
-0.0325774(-0.12)
0.1639354(0.42)
-0.0866671(-0.17)
-1.180414(-1.04)
AGE: 55-64 YEARS -1.347406***(-3.25)
-1.581851**(-2.08)
-1.233386**(-2.54)
-1.920175*(-1.84)
-1.712733(-1.64)
SECONDARY EDUCATIONONLY: EDU1212C
0.0290027(0.17)
0.2123873(0.78)
0.2968907(1.56)
0.3232004(1.08)
-0.6141588*(-1.73)
-0.3904134(-0.59)
ANY POST SECONDARYEDUCATION: EDU1320C
-0.0069423(-0.04)
0.2481187(0.94)
0.1326002(0.67)
0.2789232(0.95)
-0.5687436(-1.58)
-0.321204(-0.52)
NOT WORKING -0.6919068***(-3.78)
-0.7805854**(-2.56)
-1.013187***(-4.55)
-0.880988**(-2.57)
0.3239956(0.93)
0.0640388(0.10)
RETIRED, STUDENTS -0.80502***(-3.59)
-0.8429123**(-2.36)
-0.9994132***(-3.86)
-0.9739289**(-2.37)
0.2768243(0.61)
-0.6105546(-0.69)
FEAR OF FAILURE 0.2949282**(2.01)
0.3596846(1.56)
0.3469464**(2.16)
0.5394924**(2.18)
0.1902832(0.64)
-0.4436921(-0.67)
PERSONAL CONTEXT
MEDIUM HH INC 0.2188587(0.89)
-0.2030842(-0.74)
0.1802026(0.66)
-0.2007513(-0.67)
0.2530148(0.37)
-0.4086375(-0.44)
HIGH HH INC 0.5583704**(2.44)
0.4272252*(1.69)
0.4176437(1.64)
0.2415521(0.87)
1.173614**(2.05)
1.459323**(2.14)
PREVALENCE OF INFORMALINVESTORS: BUSANG
0.7393867**(2.49)
0.2126635(0.62)
0.4723073(1.36)
0.0017636(0.00)
0.2533319(0.34)
-0.3436843(-0.32)
CONSTANT 1.17355***(-5.36)
-2.134363***(-11.57)
-1.783838***(-4.66)
-1.62836***(-6.50)
-2.350061***(-11.60)
-2.052035***(-4.84)
-3.142205***(-6.93)
-4.354701***(-8.55)
-3.670555***(-4.00)
Nb. Obs. Pseudo R2chi2
14400.038855.54***
9540.014611.52**
7220.057637.42***
14400.049659.00***
9540.00664.53
7220.059233.04***
14400.022910.57
9540.02846.16
6710.080612.18

A f r i c a n D e v e l o p m e n t B a n k
36
AfDBW o r k i n g P a p e r
North Africa Policy Series
2 0 1 6 • w w w . a f d b . o r g
Table 4. c - Egypt: Logistic Regression for the Total Entrepreneurial Activity - TEA(all, by opportunity and by necessity)
TEA ALL TEA OPP TEA NEC
PERSONAL ATTRIBUTES
MALE -0.3749512**(-2.02)
-0.4524661**(-2.19)
-0.3542879(-1.48)
-0.5805287**(-2.16)
-0.1745025(-0.60)
-0.0990446(-0.31)
AGE: 25-34 YEARS 0.135255(0.57)
0.0114581(0.04)
0.0221249(0.07)
-0.073682(-0.20)
0.2319293(0.72)
0.096503(0.28)
AGE: 35-44 YEARS 0.0082516(0.03)
-0.1400029(-0.53)
0.2371397(0.75)
0.1540886(0.43)
-0.44257(-1.24)
-0.6248112(-1.65)
AGE: 45-54 YEARS -0.623469**(-2.32)
-0.739141**(-2.50)
-0.3461228(-0.98)
-0.3260098(-0.82)
-1.293172***(-2.93)
-1.435748***(-3.06)
AGE: 55-64 YEARS -0.8837408***(-2.85)
-1.215747***(-3.28)
-0.8471602*(-1.94)
-0.9501099*(-1.87)
-0.8624432**(-2.04)
-1.377444***(-2.64)
SECONDARY EDUCATIONONLY: EDU1212C
-0.1376664(-0.70)
-0.1066367(-0.48)
0.3582699(1.26)
0.4897395(1.47)
-0.5345189**(-1.97)
-0.4921818*(-1.65)
ANY POST SECONDARYEDUCATION: EDU1320C
-0.4455885**(-2.25)
-0.4896946**(-2.11)
0.200035(0.71)
0.1428524(0.42)
-1.108899***(-3.79)
-1.042872***(-3.10)
NOT WORKING -2.039101***(-7.23)
-2.017629***(-6.22)
-2.395854***(-5.25)
-2.057241***(-4.38)
-1.540968***(-3.99)
-1.741272***(-3.68)
RETIRED, STUDENTS -1.546682***(-3.92)
-1.558208***(-3.40)
-1.245242**(-2.47)
-1.489492**(-2.30)
-1.736463***(-2.79)
-1.44031**(-2.27)
FEAR OF FAILURE -0.6470786***(-3.46)
-0.791805***(-3.67)
-0.8630056***(-3.21)
-0.8905896***(-2.90)
-0.4285218(-1.61)
-0.7751437**(-2.43)
PERSONAL CONTEXT
MEDIUM HH INC -0.0386582(-0.16)
-0.1690904(0.69)
-0.3734033(-1.06)
-0.6072696*(-1.68)
0.2548533(0.78)
0.2515717(0.74)
HIGH HH INC 0.4610146**(2.06)
0.1789767(0.73)
0.730755**(2.40)
0.2919637(0.89)
0.1274859(0.37)
0.0115441(0.03)
PREVALENCE OF INFORMALINVESTORS: BUSANG
1.489953***(7.01)
1.24414***(5.56)
1.740891***(6.78)
1.488802***(5.56)
0.9612909***(2.80)
0.6727882*(1.88)
CONSTANT -1.130862***(-4.02)
-2.928661***(-15.64)
-1.179404***(-3.38)
-2.2873***(-5.85)
-3.724146***(-14.01)
-2.418794***(-4.84)
-1.803771***(-4.54)
-3.711554***(-13.63)
-1.881364***(-3.85)
Nb. Obs. Pseudo R2chi2
24900.0958128.70***
22890.046554.69***
22090.1358157.31***
24900.101586.46***
22890.085863.48***
22090.1588115.44***
24900.084660.40***
22890.01167.29*
22090.113070.17***

A f r i c a n D e v e l o p m e n t B a n k
37
W o r k i n g P a p e rNorth Africa Policy Series
2 0 1 6 • w w w . a f d b . o r g
AfDB
Table 4. d - Morocco: Logistic Regression for the Total Entrepreneurial Activity - TEA(all, by opportunity and by necessity)
TEA ALL TEA OPP TEA NEC
PERSONAL ATTRIBUTES
MALE -0.2600485(-1.48)
0.4993647(1.07)
-0.1785027(-0.92)
0.4956539(1.03)
-0.3821101(-1.26)
AGE: 25-34 YEARS 0.0464673(0.21)
1.050298(1.62)
0.0708468(0.30)
1.045128(1.63)
-0.0469013(-0.12)
AGE: 35-44 YEARS -0.1571051(-0.68)
0.6510556(0.98)
-0.25683(-0.99)
-0.0514877(-0.07)
0.0689483(0.17)
AGE: 45-54 YEARS -0.4696705*(1.74)
0.5675394(0.75)
-0.4567152(-1.53)
0.5602824(0.75)
-0.3427379(-0.68)
AGE: 55-64 YEARS -0.0672226(-0.20)
0.1115273(0.12)
-0.2039135(-0.55)
0.1509316(0.16)
0.2729578(0.48)
SECONDARY EDUCATIONONLY: EDU1212C
0.3604362*(1.67)
-1.001144(-1.50)
0.1157811(0.47)
-0.8167117(-1.21)
0.6451137*(1.86)
ANY POST SECONDARYEDUCATION: EDU1320C
-0.1176997(-0.36)
-0.9321264(-1.43)
-0.084262(-0.23)
-0.58796(-0.90)
-0.1653134(-0.27)
NOT WORKING -1.957812***(-7.97)
-1.333179**(-2.08)
-1.683065***(-6.29)
-1.118899*(-1.72)
-2.35978***(-4.26)
RETIRED, STUDENTS -1.954949***(-5.44)
-0.8492385(-1.01)
-1.600691***(-4.22)
-0.7619187(-0.91)
-2.800463***(-2.70)
FEAR OF FAILURE 0.2618475(1.47)
0.8658645**(2.18)
0.3311161*(1.71)
0.6919384*(1.69)
-0.0221564(-0.07)
PERSONAL CONTEXT
MEDIUM HH INC
HIGH HH INC 0.5448735*(1.66)
0.7045201*(1.84)
0.4139433(1.19)
0.5222801(1.32)
1.041454(1.23)
PREVALENCE OF INFORMALINVESTORS: BUSANG
CONSTANT -0.8305387***(-3.67)
-1.619388***(-6.62)
-2.461188***(-3.25)
-1.272063***(-5.10)
-1.744357***(-6.83)
-2.384098***(-3.13)
-2.55593***(-5.88)
-4.085976***(-5.73)
Nb. Obs. Pseudo R2chi2
13590.1028126.42***
2310.01182.79*
2140.136130.32***
13590.075076.81***
2310.00661.44
2140.112523.19**
13590.098446.54***
2310.02681.68
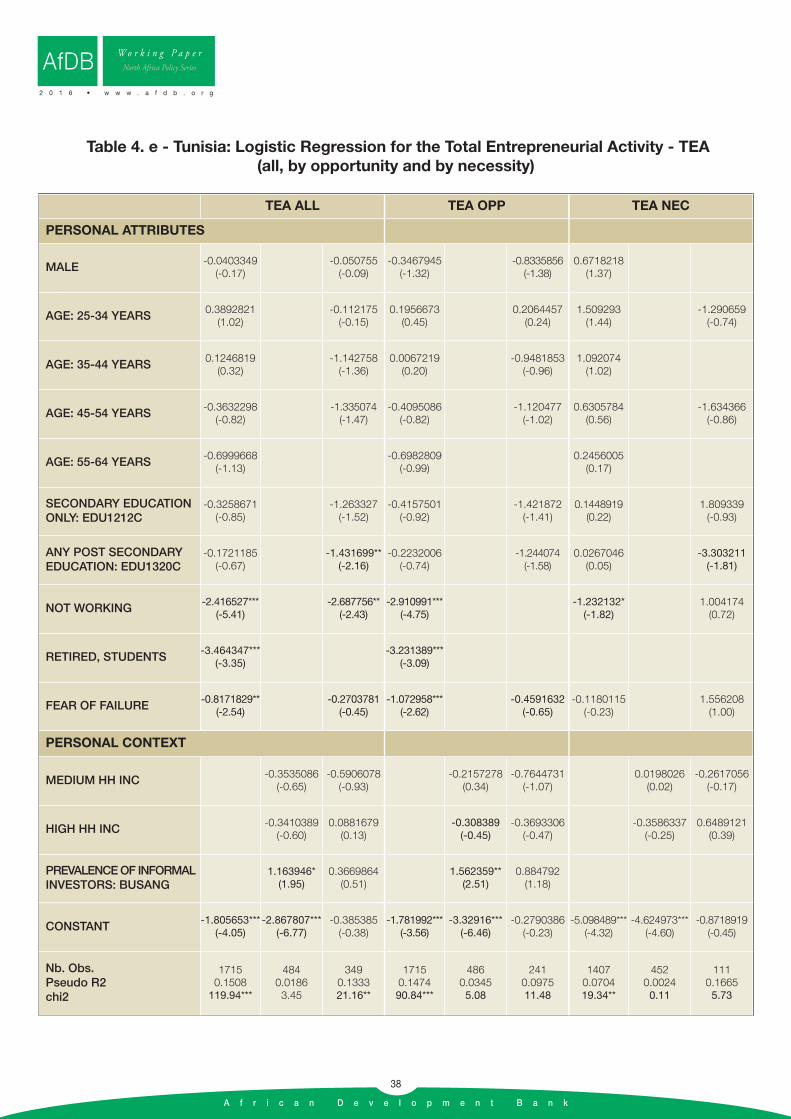
A f r i c a n D e v e l o p m e n t B a n k
38
AfDBW o r k i n g P a p e r
North Africa Policy Series
2 0 1 6 • w w w . a f d b . o r g
Table 4. e - Tunisia: Logistic Regression for the Total Entrepreneurial Activity - TEA(all, by opportunity and by necessity)
TEA ALL TEA OPP TEA NEC
PERSONAL ATTRIBUTES
MALE -0.0403349(-0.17)
-0.050755(-0.09)
-0.3467945(-1.32)
-0.8335856(-1.38)
0.6718218(1.37)
AGE: 25-34 YEARS 0.3892821(1.02)
-0.112175(-0.15)
0.1956673(0.45)
0.2064457(0.24)
1.509293(1.44)
-1.290659(-0.74)
AGE: 35-44 YEARS 0.1246819(0.32)
-1.142758(-1.36)
0.0067219(0.20)
-0.9481853(-0.96)
1.092074(1.02)
AGE: 45-54 YEARS -0.3632298(-0.82)
-1.335074(-1.47)
-0.4095086(-0.82)
-1.120477(-1.02)
0.6305784(0.56)
-1.634366(-0.86)
AGE: 55-64 YEARS -0.6999668(-1.13)
-0.6982809(-0.99)
0.2456005(0.17)
SECONDARY EDUCATIONONLY: EDU1212C
-0.3258671(-0.85)
-1.263327(-1.52)
-0.4157501(-0.92)
-1.421872(-1.41)
0.1448919(0.22)
1.809339(-0.93)
ANY POST SECONDARYEDUCATION: EDU1320C
-0.1721185(-0.67)
-1.431699**(-2.16)
-0.2232006(-0.74)
-1.244074(-1.58)
0.0267046(0.05)
-3.303211(-1.81)
NOT WORKING -2.416527***(-5.41)
-2.687756**(-2.43)
-2.910991***(-4.75)
-1.232132*(-1.82)
1.004174(0.72)
RETIRED, STUDENTS -3.464347***(-3.35)
-3.231389***(-3.09)
FEAR OF FAILURE -0.8171829**(-2.54)
-0.2703781(-0.45)
-1.072958***(-2.62)
-0.4591632(-0.65)
-0.1180115(-0.23)
1.556208(1.00)
PERSONAL CONTEXT
MEDIUM HH INC -0.3535086(-0.65)
-0.5906078(-0.93)
-0.2157278(0.34)
-0.7644731(-1.07)
0.0198026(0.02)
-0.2617056(-0.17)
HIGH HH INC -0.3410389(-0.60)
0.0881679(0.13)
-0.308389(-0.45)
-0.3693306(-0.47)
-0.3586337(-0.25)
0.6489121(0.39)
PREVALENCE OF INFORMALINVESTORS: BUSANG
1.163946*(1.95)
0.3669864(0.51)
1.562359**(2.51)
0.884792(1.18)
CONSTANT -1.805653***(-4.05)
-2.867807***(-6.77)
-0.385385(-0.38)
-1.781992***(-3.56)
-3.32916***(-6.46)
-0.2790386(-0.23)
-5.098489***(-4.32)
-4.624973***(-4.60)
-0.8718919(-0.45)
Nb. Obs. Pseudo R2chi2
17150.1508119.94***
4840.01863.45
3490.133321.16**
17150.147490.84***
4860.03455.08
2410.097511.48
14070.070419.34**
4520.00240.11
1110.16655.73
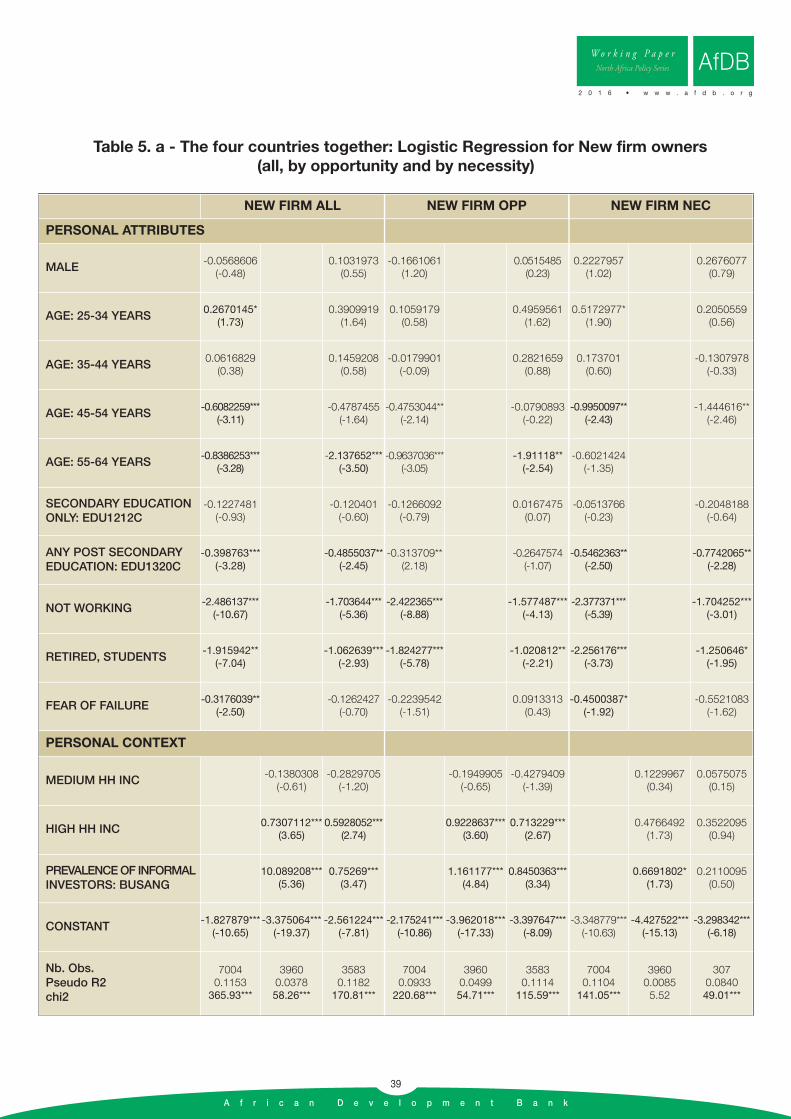
A f r i c a n D e v e l o p m e n t B a n k
39
W o r k i n g P a p e rNorth Africa Policy Series
2 0 1 6 • w w w . a f d b . o r g
AfDB
Table 5. a - The four countries together: Logistic Regression for New firm owners(all, by opportunity and by necessity)
NEW FIRM ALL NEW FIRM OPP NEW FIRM NEC
PERSONAL ATTRIBUTES
MALE -0.0568606(-0.48)
0.1031973(0.55)
-0.1661061(1.20)
0.0515485(0.23)
0.2227957(1.02)
0.2676077(0.79)
AGE: 25-34 YEARS 0.2670145*(1.73)
0.3909919(1.64)
0.1059179(0.58)
0.4959561(1.62)
0.5172977*(1.90)
0.2050559(0.56)
AGE: 35-44 YEARS 0.0616829(0.38)
0.1459208(0.58)
-0.0179901(-0.09)
0.2821659(0.88)
0.173701(0.60)
-0.1307978(-0.33)
AGE: 45-54 YEARS -0.6082259***(-3.11)
-0.4787455(-1.64)
-0.4753044**(-2.14)
-0.0790893(-0.22)
-0.9950097**(-2.43)
-1.444616**(-2.46)
AGE: 55-64 YEARS -0.8386253***(-3.28)
-2.137652***(-3.50)
-0.9637036***(-3.05)
-1.91118**(-2.54)
-0.6021424(-1.35)
SECONDARY EDUCATIONONLY: EDU1212C
-0.1227481(-0.93)
-0.120401(-0.60)
-0.1266092(-0.79)
0.0167475(0.07)
-0.0513766(-0.23)
-0.2048188(-0.64)
ANY POST SECONDARYEDUCATION: EDU1320C
-0.398763***(-3.28)
-0.4855037**(-2.45)
-0.313709**(2.18)
-0.2647574(-1.07)
-0.5462363**(-2.50)
-0.7742065**(-2.28)
NOT WORKING -2.486137***(-10.67)
-1.703644***(-5.36)
-2.422365***(-8.88)
-1.577487***(-4.13)
-2.377371***(-5.39)
-1.704252***(-3.01)
RETIRED, STUDENTS -1.915942**(-7.04)
-1.062639***(-2.93)
-1.824277***(-5.78)
-1.020812**(-2.21)
-2.256176***(-3.73)
-1.250646*(-1.95)
FEAR OF FAILURE -0.3176039**(-2.50)
-0.1262427(-0.70)
-0.2239542(-1.51)
0.0913313(0.43)
-0.4500387*(-1.92)
-0.5521083(-1.62)
PERSONAL CONTEXT
MEDIUM HH INC -0.1380308(-0.61)
-0.2829705(-1.20)
-0.1949905(-0.65)
-0.4279409(-1.39)
0.1229967(0.34)
0.0575075(0.15)
HIGH HH INC 0.7307112***(3.65)
0.5928052***(2.74)
0.9228637***(3.60)
0.713229***(2.67)
0.4766492(1.73)
0.3522095(0.94)
PREVALENCE OF INFORMALINVESTORS: BUSANG
10.089208***(5.36)
0.75269***(3.47)
1.161177***(4.84)
0.8450363***(3.34)
0.6691802*(1.73)
0.2110095(0.50)
CONSTANT -1.827879***(-10.65)
-3.375064***(-19.37)
-2.561224***(-7.81)
-2.175241***(-10.86)
-3.962018***(-17.33)
-3.397647***(-8.09)
-3.348779***(-10.63)
-4.427522***(-15.13)
-3.298342***(-6.18)
Nb. Obs. Pseudo R2chi2
70040.1153365.93***
39600.037858.26***
35830.1182170.81***
70040.0933220.68***
39600.049954.71***
35830.1114115.59***
70040.1104141.05***
39600.00855.52
3070.084049.01***

A f r i c a n D e v e l o p m e n t B a n k
40
AfDBW o r k i n g P a p e r
North Africa Policy Series
2 0 1 6 • w w w . a f d b . o r g
Table 5. b - Algeria: Logistic Regression for New firm owners(all, by opportunity and by necessity)
NEW FIRM ALL NEW FIRM OPP NEW FIRM NEC
PERSONAL ATTRIBUTES
MALE 0.4384207*(1.85)
0.5115151(1.50)
0.3622959(1.37)
0.5405713(1.40)
0.8820116(1.32)
0.2257876(0.26)
AGE: 25-34 YEARS -0.0415007(-0.14)
0.1584746(0.34)
-0.2395474(-0.69)
0.2543185(0.46)
0.6017331(0.83)
0.0965526(0.10)
AGE: 35-44 YEARS 0.1713626(0.53)
0.5651288(1.17)
0.0159187(0.04)
0.7212429(1.28)
0.3905768(0.50)
-0.716996(-0.55)
AGE: 45-54 YEARS 0.1116704(0.30)
0.3921224(0.72)
0.2431025(0.61)
0.6750885(1.10)
-0.5772072(-0.49)
-0.199059(-0.15)
AGE: 55-64 YEARS -0.863423(-1.36)
-1.148586(-1.06)
-1.032035(-1.35)
SECONDARY EDUCATIONONLY: EDU1212C
0.3138051(1.15)
0.1958659(0.46)
0.6754418**(2.11)
0.4273456(0.86)
-0.5876838(-0.94)
0.1890136(0.19)
ANY POST SECONDARYEDUCATION: EDU1320C
0.5072962*(1.94)
0.5477586(1.39)
0.8582033***(2.76)
0.8369186*(1.82)
-0.6762228(-1.10)
-0.3099611(-0.30)
NOT WORKING -1.174763***(-3.41)
-0.9372487*(-1.81)
-0.951156**(-2.59)
-0.6278697(-1.17)
-1.702066(-1.59)
RETIRED, STUDENTS -1.197819***(-3.01)
-0.6782066(-1.24)
-1.26103***(-2.80)
-0.7868728(-1.15)
-1.160078(-1.03)
-0.8243624(-0.68)
FEAR OF FAILURE 0.0185653(0.08)
0.6847883**(2.08)
0.1701352(0.65)
0.8880548**(2.45)
-0.4871996(-0.76)
-0.5391983(-0.49)
PERSONAL CONTEXT
MEDIUM HH INC -0.6174428(-1.38)
-0.8246414*(-1.71)
-0.5946716(-1.16)
-0.7862517(-1.49)
-1.063805(-0.92)
HIGH HH INC 0.7870217***(2.44)
0.6608052*(1.85)
0.7117972(1.91)
0.5158563(1.27)
0.7825588(1.12)
0.7317189(0.85)
PREVALENCE OF INFORMALINVESTORS: BUSANG
0.8543612**(2.08)
0.5301671(1.15)
0.3747103(0.69)
0.1466969(0.25)
1.10817(1.39)
0.2603238(0.23)
CONSTANT -2.728248***(-7.53)
-3.074727***(-11.24)
-3.514311***(-5.72)
-3.207906***(-7.66)
-3.332969***(-10.63)
-4.134615(-5.69)
-4.393367***(-4.90)
-4.777547***(-7.90)
-4.129601***(-3.01)
Nb. Obs. Pseudo R2chi2
14400.063546.44***
9540.045419.59***
7220.106238.62***
14400.061236.80***
9540.031610.70**
6710.0968028.26***
13260.090116.39*
9540.05006.00
3410.03312.26
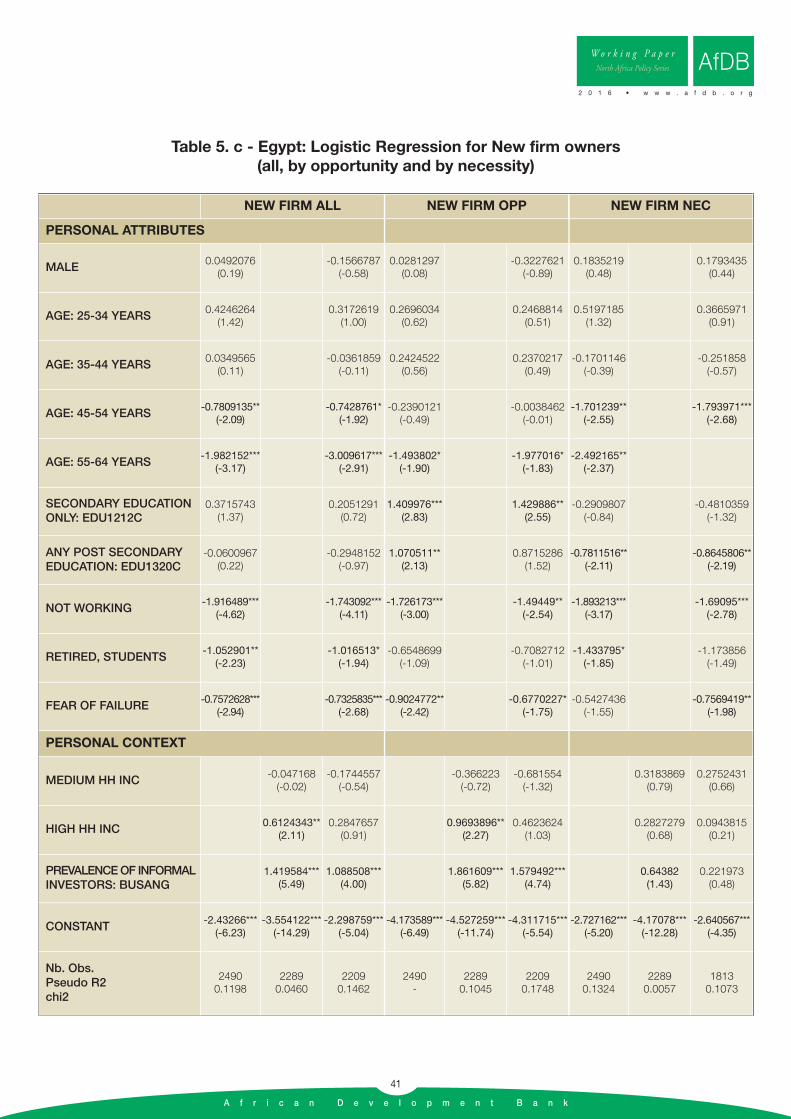
A f r i c a n D e v e l o p m e n t B a n k
41
W o r k i n g P a p e rNorth Africa Policy Series
2 0 1 6 • w w w . a f d b . o r g
AfDB
Table 5. c - Egypt: Logistic Regression for New firm owners(all, by opportunity and by necessity)
NEW FIRM ALL NEW FIRM OPP NEW FIRM NEC
PERSONAL ATTRIBUTES
MALE 0.0492076(0.19)
-0.1566787(-0.58)
0.0281297(0.08)
-0.3227621(-0.89)
0.1835219(0.48)
0.1793435(0.44)
AGE: 25-34 YEARS 0.4246264(1.42)
0.3172619(1.00)
0.2696034(0.62)
0.2468814(0.51)
0.5197185(1.32)
0.3665971(0.91)
AGE: 35-44 YEARS 0.0349565(0.11)
-0.0361859(-0.11)
0.2424522(0.56)
0.2370217(0.49)
-0.1701146(-0.39)
-0.251858(-0.57)
AGE: 45-54 YEARS -0.7809135**(-2.09)
-0.7428761*(-1.92)
-0.2390121(-0.49)
-0.0038462(-0.01)
-1.701239**(-2.55)
-1.793971***(-2.68)
AGE: 55-64 YEARS -1.982152***(-3.17)
-3.009617***(-2.91)
-1.493802*(-1.90)
-1.977016*(-1.83)
-2.492165**(-2.37)
SECONDARY EDUCATIONONLY: EDU1212C
0.3715743(1.37)
0.2051291(0.72)
1.409976***(2.83)
1.429886**(2.55)
-0.2909807(-0.84)
-0.4810359(-1.32)
ANY POST SECONDARYEDUCATION: EDU1320C
-0.0600967(0.22)
-0.2948152(-0.97)
1.070511**(2.13)
0.8715286(1.52)
-0.7811516**(-2.11)
-0.8645806**(-2.19)
NOT WORKING -1.916489***(-4.62)
-1.743092***(-4.11)
-1.726173***(-3.00)
-1.49449**(-2.54)
-1.893213***(-3.17)
-1.69095***(-2.78)
RETIRED, STUDENTS -1.052901**(-2.23)
-1.016513*(-1.94)
-0.6548699(-1.09)
-0.7082712(-1.01)
-1.433795*(-1.85)
-1.173856(-1.49)
FEAR OF FAILURE -0.7572628***(-2.94)
-0.7325835***(-2.68)
-0.9024772**(-2.42)
-0.6770227*(-1.75)
-0.5427436(-1.55)
-0.7569419**(-1.98)
PERSONAL CONTEXT
MEDIUM HH INC -0.047168(-0.02)
-0.1744557(-0.54)
-0.366223(-0.72)
-0.681554(-1.32)
0.3183869(0.79)
0.2752431(0.66)
HIGH HH INC 0.6124343**(2.11)
0.2847657(0.91)
0.9693896**(2.27)
0.4623624(1.03)
0.2827279(0.68)
0.0943815(0.21)
PREVALENCE OF INFORMALINVESTORS: BUSANG
1.419584***(5.49)
1.088508***(4.00)
1.861609***(5.82)
1.579492***(4.74)
0.64382(1.43)
0.221973(0.48)
CONSTANT -2.43266***(-6.23)
-3.554122***(-14.29)
-2.298759***(-5.04)
-4.173589***(-6.49)
-4.527259***(-11.74)
-4.311715***(-5.54)
-2.727162***(-5.20)
-4.17078***(-12.28)
-2.640567***(-4.35)
Nb. Obs. Pseudo R2chi2
24900.1198
22890.0460
22090.1462
2490-
22890.1045
22090.1748
24900.1324
22890.0057
18130.1073

A f r i c a n D e v e l o p m e n t B a n k
42
AfDBW o r k i n g P a p e r
North Africa Policy Series
2 0 1 6 • w w w . a f d b . o r g
Table 5. d - Morocco: Logistic Regression for New firm owners(all, by opportunity and by necessity)
NEW FIRM ALL NEW FIRM OPP NEW FIRM NEC
PERSONAL ATTRIBUTES
MALE -0.3149906(-1.48)
0.4402865(0.74)
-0.2990933(-1.23)
0.6348021(0.98)
-0.2567236(0.71)
AGE: 25-34 YEARS 0.235274(0.87)
1.650184(1.46)
0.1713427(0.56)
1.586247(1.41)
0.333918(0.67)
AGE: 35-44 YEARS -0.1514395(-0.51)
0.9647101(0.85)
-0.2546024(-0.76)
0.3583986(0.31)
0.13336(0.25)
AGE: 45-54 YEARS -0.7061316*(-1.92)
0.3269484(0.25)
-0.6589629(-1.59)
0.2608441(0.20)
-0.687429(-0.95)
AGE: 55-64 YEARS 0.2464427(0.60)
0.7922048(0.51)
-0.1550152(-0.31)
0.7401583(0.48)
0.8900053(1.4)
SECONDARY EDUCATIONONLY: EDU1212C
-0.1739163(-0.59)
-1.51218(-1.38)
-0.6053989(-1.55)
-1.360531(-1.23)
0.5520314(1.32)
ANY POST SECONDARYEDUCATION: EDU1320C
-0.3931861(-0.92)
-0.2613505(-0.38)
-0.4180622(-0.85)
-0.0106102(-0.002)
-0.2277386(-0.3)
NOT WORKING -4.872537***(-4.80)
-4.486911***(-4.40)
RETIRED, STUDENTS
FEAR OF FAILURE 0.1432512(0.62)
0.2958922(0.56)
0.3331081(1.31)
0.2590681(0.47)
-0.4043456(-0.89)
PERSONAL CONTEXT
MEDIUM HH INC
HIGH HH INC 1.223868***(2.64)
1.334962**(2.44)
1.019582***(2.15)
1.10956**(2.07)
PREVALENCE OF INFORMALINVESTORS: BUSANG
CONSTANT -1.20832***(-4.32)
-2.790288***(-7.17)
-3.72517***(-3.01)
-1.559512***(-4.95)
-2.790288***(-7.17)
-3.745243***(-2.98)
-2.840143***(-5.63)
Nb. Obs. Pseudo R2chi2
11850.1728145.24***
2310.04817.82***
1360.111414.46
11850.1516101.06***
2310.03355.02**
1360.109613.19
7280.0282-

A f r i c a n D e v e l o p m e n t B a n k
43
W o r k i n g P a p e rNorth Africa Policy Series
2 0 1 6 • w w w . a f d b . o r g
AfDB
Table 5. e - Tunisia: Logistic Regression for New firm owners(all, by opportunity and by necessity)
NEW FIRM ALL NEW FIRM OPP NEW FIRM NEC
PERSONAL ATTRIBUTES
MALE -0.2976693(-1.15)
-0.6192531(-0.81)
-0.6094673**(-2.06)
-0.9946672(-1.20)
AGE: 25-34 YEARS 0.5339953(1.12)
-0.7148861(-0.75)
0.0365259(0.07)
-1.040213(-1.02)
AGE: 35-44 YEARS 0.5656762(1.17)
-1.547651(-1.42)
0.1696715(0.34)
-1.52722(-1.38)
AGE: 45-54 YEARS -0.2774691(-0.49)
-2.180098(1.62)
-0.5624611(-0.94)
-2.215043(-1.59)
AGE: 55-64 YEARS -0.0310697(-0.05)
-0.3222556(-0.43)
SECONDARY EDUCATIONONLY: EDU1212C
-0.3140513(-0.69)
-2.109572(-1.56)
-0.6536713(-1.19)
-2.240616(-1.61)
ANY POST SECONDARYEDUCATION: EDU1320C
-0.11949(-0.39)
-1.775562*(-1.80)
-0.3663042(-1.08)
-2.06598**(-1.98)
NOT WORKING -3.330739***(-4.52)
-3.887996***(-3.78)
RETIRED, STUDENTS -3.082716***(-2.94)
-2.996361***(-2.83)
FEAR OF FAILURE -0.781983**(-2.11)
-0.2489398(-0.29)
-0.9037609**(-2.02)
-0.062435(-0.07)
PERSONAL CONTEXT
MEDIUM HH INC -0.273476(-0.37)
-0.4481593(-0.48)
0.1204081(0.14)
-0.422348(-0.44)
HIGH HH INC -0.4585804(-0.57)
0.1494344(0.15)
-0.4233686(-0.44)
-0.1835711(-0.17)
PREVALENCE OF INFORMALINVESTORS: BUSANG
1.653337**(2.31)
0.9170812(1.01)
1.941879***(2.62)
1.34276(1.41)
CONSTANT -2.249762***(-4.14)
-3.63884***(-6.13)
-0.1646149(-0.12)
-1.829962***(3.22)
-4.094771***(-5.64)
0.2601202(0.18)
Nb. Obs. Pseudo R2chi2
17150.157298.79***
4860.03774.24
2410.10358.61
17150.152274.06***
4860.05615.47
2410.12139.32

A f r i c a n D e v e l o p m e n t B a n k
© 2010 - AfDB - Design, External Relations and Com
munication Unit/YA
L