afl report draft 26sep2008 - anz personal banking€¦ · anz survey of adult financial literacy in...
TRANSCRIPT

ANZ Survey of Adult Financial Literacy in Australia
October 2008

ANZ Survey of Adult Financial Literacy in Australia (2008) i
The Social Research Centre
Contents
Executive summary..............................................................................................1
Section 1 Introduction to the Report..............................................................1 1.1 Background .................................................................................................................................1
1.2 Context of the survey .................................................................................................................1
1.3 Research objectives ...................................................................................................................1
1.4 Research design.........................................................................................................................2
1.5 Steering Committee....................................................................................................................3
1.6 Structure of the report ................................................................................................................3
Section 2 Financial Literacy............................................................................4 2.1 Introduction and key findings.....................................................................................................4
2.2 Defining financial literacy ...........................................................................................................6
2.3 The distribution of financial literacy within the population .......................................................9
2.4 Financial literacy and behaviour ..............................................................................................12
2.5 Financial literacy and ownership of financial products ..........................................................14
Section 3 Use and Understanding of Payment and Transacting Methods.........................................................................................16
3.1 Introduction and key findings...................................................................................................16
3.2 Use and understanding of methods of payment/transacting.................................................17
Section 4 Reported Money Management, Budgeting and Planning Behaviour ......................................................................................21
4.1 Introduction and key findings...................................................................................................21
4.2 Reported Money Management and Budgeting Behaviour ....................................................23 4.2.1 Responsibility for money management in the household .......................................................... 23 4.2.2 Saving and budgeting - attitudes and behaviour........................................................................ 25 4.2.3 Fee minimisation .......................................................................................................................... 29 4.2.4 Control of current financial situation............................................................................................ 30 4.2.5 Financial sustainability ................................................................................................................. 31
4.3 Sources of financial information and advice ...........................................................................33 4.3.1 Sources of general financial information and advice ................................................................. 33

ANZ Survey of Adult Financial Literacy in Australia (2008) ii
The Social Research Centre
Section 5 Transaction Products ...................................................................37 5.1 Introduction and key findings...................................................................................................37
5.2 Incidence of everyday banking accounts................................................................................37
5.3 Obtaining a new everyday banking account...........................................................................37
Section 6 Borrowing and Debt......................................................................39 6.1 Introduction and key findings...................................................................................................39
6.2 Incidence and source of loan products ...................................................................................41
6.3 Understanding of credit rating and repayment responsibility ................................................45
6.4 Credit card management .........................................................................................................47
6.5 Loan acquisition........................................................................................................................48 6.5.1 Comparison shopping for mortgages and other loans............................................................... 48 6.5.2 Use of mortgage brokers ............................................................................................................. 51
6.6 Management of current debt levels.........................................................................................52 6.6.1 Comfort with current level of debt ............................................................................................... 52 6.6.2 Ability to cope with increase in interest rates ............................................................................. 54 6.6.3 Missed loan repayments.............................................................................................................. 56
Section 7 Savings, Investment and Superannuation..................................58 7.1 Introduction and key findings...................................................................................................58
7.2 Incidence of savings products and investments.....................................................................62
7.3 Investing principles and process .............................................................................................64 7.3.1 Understanding of investment principles...................................................................................... 64 7.3.2 Details of most recent investment ............................................................................................... 66
7.4 Superannuation ........................................................................................................................69 7.4.1 Number and types of superannuation fund held ........................................................................ 69 7.4.2 Understanding of superannuation ............................................................................................... 71 7.4.3 Joining a new superannuation fund ............................................................................................ 78
7.5 Retirement Planning and Expectations...................................................................................80
7.6 Retirement income ...................................................................................................................85 7.6.1 Incidence and types of retirement income stream products...................................................... 85 7.6.2 Acquisition of retirement income stream products ..................................................................... 86 7.6.3 Reverse equity loans ................................................................................................................... 88
7.7 Financial planners ....................................................................................................................89 7.7.1 Use of financial planners ............................................................................................................. 89 7.7.2 Choosing a financial adviser ....................................................................................................... 90 7.7.3 Financial planners and conflict of interest .................................................................................. 93

ANZ Survey of Adult Financial Literacy in Australia (2008) iii
The Social Research Centre
Section 8 Insurance.......................................................................................95 8.1 Introduction and key findings...................................................................................................95
8.2 Incidence of insurance products..............................................................................................97
8.3 Understanding of insurance products .....................................................................................99
8.4 Acquisition of insurance products......................................................................................... 100
Section 9 Consumer Rights and Responsibilities ....................................104 9.1 Introduction and key findings................................................................................................ 104
9.2 Knowledge of consumer rights and responsibilities ............................................................ 105 9.2.1 Awareness of providers’ responsibilities and consumers’ protections.................................... 105 9.2.2 Awareness of consumers’ responsibilities................................................................................ 107 9.2.3 Complaints.................................................................................................................................. 108 9.2.4 Further education in relation to finance .................................................................................... 110
Section 10 On-line money and financial management............................115 10.1 Introduction and key findings................................................................................................ 115
10.2 Internet access ...................................................................................................................... 116
10.3 Use of the internet for accessing financial products and services ..................................... 118 10.3.1 Application for financial products over the internet .................................................................. 118 10.3.2 Use of on-line calculators to compare financial products ........................................................ 119
10.4 Risks associated with internet banking ................................................................................ 120
Appendix One: Survey Questionnaire...........................................................122
Appendix Two: Adult Financial Literacy Framework ...................................179 Appendix Three: Examples of Australian Geographic Classification Remoteness Areas .............................................................183

ANZ Survey of Adult Financial Literacy in Australia (2008) iv
The Social Research Centre
List of tables
Table 1.4a Sample distribution by geographic location ......................................................................................2 Table 2.2a Variables used in creating summary financial literacy scores......................................................7 Table 2.3a Financial literacy and demographic/geographic subgroups .......................................................10 Table 2.3b Financial literacy and socio-economic subgroups ........................................................................11 Table 2.4a Financial literacy and use of advisory/information sources ........................................................12 Table 2.4b Financial literacy and other financial behaviour ............................................................................13 Table 2.5a Financial literacy and ownership of financial products.................................................................14 Table 3.2a Methods of payment/transacting used by respondents ...............................................................17 Table 3.2b Methods of payment/transacting used and financial literacy......................................................19 Table 3.2c Methods of payment/transacting respondents either use or know how to use ......................20 Table 4.2.1a Financial literacy and household financial management by gender .........................................24 Table 4.2.2a Self-reported savings behaviour .......................................................................................................25 Table 4.2.2b Attitudes towards budgeting...............................................................................................................26 Table 4.2.2c Attitudes towards financial planning .................................................................................................27 Table 4.2.3a Steps taken to minimise fees .............................................................................................................29 Table 4.2.4a Extent to which current financial situation is felt to be under control ........................................30 Table 4.2.5a Coping with a major loss of income..................................................................................................31 Table 4.2.5b Source of support if sudden loss of income made it difficult to meet financial commitments32 Table 4.3.1a Use of financial education materials in the last 5 years...............................................................33 Table 4.3.1b Use of financial advice from other people.......................................................................................34 Table 4.3.1c Comparison of financial products and services .............................................................................35 Table 5.3.1a Comparison shopping for an everyday banking account ............................................................38 Table 5.3.1b Comparison shopping for an everyday banking account ............................................................38 Table 6.2.1a Incidence of loan products .................................................................................................................41 Table 6.2.1b Lending sources used in last 12 months.........................................................................................43 Table 6.3.1a Understanding of borrowing ...............................................................................................................45 Table 6.3.1b Awareness of information used to determine credit rating..........................................................46 Table 6.4.1a Checking of credit or store card transactions.................................................................................47 Table 6.5.1a Comparison shopping for mortgage and loan products...............................................................48 Table 6.5.1b Reasons for not comparison shopping for a mortgage................................................................49 Table 6.5.1c Reasons for not comparison shopping for a non-mortgage loan ..............................................50 Table 6.5.2a Use of mortgage brokers ....................................................................................................................51 Table 6.6.1a Comfort with current level of debt .....................................................................................................52 Table 6.6.1b Control over borrowings and credit card .........................................................................................53 Table 6.6.2a Ability to deal with an increase in interest rates ............................................................................54 Table 6.6.2b Action that would be taken by those struggling or unable to make mortgage repayments .55 Table 6.6.3a Missed debt repayments in the last 12 months .............................................................................56 Table 6.6.3b Reasons for missing repayments in the last 12 months ..............................................................57 Table 7.2.1a Types of investment held ....................................................................................................................62 Table 7.3.1a Understanding of investment principles ..........................................................................................64

ANZ Survey of Adult Financial Literacy in Australia (2008) v
The Social Research Centre
Table 7.3.2a Type of most recent investment ........................................................................................................66 Table 7.3.2b Sources of information for most recent investment ......................................................................67 Table 7.3.2c Objectives for most recent investment ............................................................................................68 Table 7.4.1a Number and type of superannuation fund held .............................................................................69 Table 7.4.1b Disadvantages of having more than one superannuation fund .................................................70 Table 7.4.2a Understanding of regulatory requirements and taxation of superannuation ...........................71 Table 7.4.2b Reading and understanding superannuation fund statements ..................................................72 Table 7.4.2c Reasons for not reading superannuation fund statements .........................................................72 Table 7.4.2d Things looked for when reading superannuation fund statements ...........................................73 Table 7.4.2e Ease of understanding an annual superannuation fund statement ..........................................74 Table 7.4.2f Indicators of superannuation fund performance............................................................................75 Table 7.4.2g Indicators of superannuation fund under-performance................................................................76 Table 7.4.2h Advantages of superannuation over other investments ..............................................................77 Table 7.4.3a Comparison shopping for a superannuation fund .........................................................................78 Table 7.4.3b Consideration factors when choosing a superannuation fund ...................................................79 Table 7.5.1a Expectations of government support for retirees ..........................................................................80 Table 7.5.1b Expectations of how superannuation will provide for retirement ...............................................81 Table 7.5.1c Expected retirement income requirement .......................................................................................82 Table 7.5.1d Factors to consider when calculating adequacy of retirement funding ....................................83 Table 7.5.1e Sources of information for working out amount needed for retirement ....................................84 Table 7.6.1a Incidence and types of retirement income products .....................................................................85 Table 7.6.2a Comparison shopping for retirement income products ................................................................86 Table 7.6.2b Reasons for not shopping around for retirement income products...........................................86 Table 7.6.2c Criteria considered important when choosing a retirement income product...........................87 Table 7.6.3a Knowledge of reverse equity loans ..................................................................................................88 Table 7.7.1a Use of financial planners ....................................................................................................................89 Table 7.7.2a Comparison shopping when choosing a financial planner/adviser ...........................................90 Table 7.7.2b Reasons for not shopping around when choosing a financial planner/ adviser.....................91 Table 7.7.2c Reasons for feeling positive about a financial planner ................................................................92 Table 7.7.3a Consideration of financial planners and conflict of interest.........................................................93 Table 7.7.3b Things looked at to see if financial planner has a conflict of interest .......................................94 Table 8.2.1a Incidence of insurance products amongst relevant population groups ....................................97 Table 8.3.1a Awareness of important requirements of insurance products ....................................................99 Table 8.4.1a Comparison shopping for insurance products .............................................................................100 Table 8.4.1b Reasons for not shopping around for insurance products ........................................................101 Table 8.4.1c Considerations when first taking out an insurance policy .........................................................102 Table 8.4.1d Considerations when renewing an insurance policy ..................................................................103 Table 9.2.1a Providers’ responsibilities and consumer protection ..................................................................106 Table 9.2.2a Awareness of consumers’ responsibilities ....................................................................................107 Table 9.2.3a Ability to handle problems experienced when dealing with a bank or other financial
institution...............................................................................................................................................108

ANZ Survey of Adult Financial Literacy in Australia (2008) vi
The Social Research Centre
Table 9.2.3b Who would be contacted if difficulties could not be resolved with the provider of the financial product or service...............................................................................................................109
Table 9.2.4a How well informed consumers feel when making financial decisions ....................................110 Table 9.2.4b Need for further education or information .....................................................................................111 Table 9.2.4c Topics for further education or information ...................................................................................112 Table 9.2.4d Preferred channels for additional information about financial issues .....................................113 Table 10.3.1a Types of financial product applied for over the internet .....................................................118 Table 10.3.2a Use of on-line calculators..........................................................................................................119 Table 10.3.2b Tasks for which on-line calculators have been used ..........................................................119 Table 10.4a Perceived risk associated with internet banking..........................................................................120 Table 10.4b Nature of risks associated with internet banking .........................................................................120 Table 10.4c Minimising the risk associated with internet banking .................................................................121 Table 10.4d Ways of minimising the risk associated with internet banking .................................................121

ANZ Survey of Adult Financial Literacy in Australia (2008) vii
The Social Research Centre
List of figures
Figure 2.2a Distribution of mean financial literacy scores by quintile ...............................................................8 Figure 4.2.1a Responsibility for household financial management in couple households............................23 Figure 10.2.1a Access to the internet ................................................................................................................116

ANZ Survey of Adult Financial Literacy in Australia (2008) 1
The Social Research Centre
Executive summary E1 Introduction
This report presents findings from the third (2008) ANZ Survey of Adult Financial Literacy in Australia1. The first survey, conducted in 2002, established a benchmark of the community’s financial literacy while the surveys conducted in 2005, and now in 2008, have been used to monitor the benchmark measures.
The three surveys provide a comprehensive set of data including both direct measures of financial literacy and attitudinal and behavioural information useful in explaining and understanding this concept. The three sets of data are the basis of this report.
In considering the results presented here, it should be kept in mind that the 2008 survey took place against a background of financial market volatility, some high profile business failures (including those of several property developers in 2006/07), rising interest rates and increasing prices for oil and food. As a result, the economic situation in 2008 is somewhat less favourable than for the earlier surveys.
E2 Key Findings
This executive summary focuses on research findings of particular interest rather than providing an exhaustive coverage of all the survey results. Specifically, it discusses what the research has to tell us about financial literacy (that is, its distribution within the population as well as the behaviours and risks that are associated respectively with high and low levels of financial literacy) and the changes that have occurred in both literacy and related behaviours during the last six years.
E2.1 What we have learned about financial literacy
Our surveys show that Australian adults generally are financially literate but there are certain groups who face particular challenges as well as certain areas of money management and products that are not as well understood as they should be.
E2.1.1 The distribution of financial literacy within the population
Financial literacy is strongly associated with a person’s age, gender, education and socio-economic characteristics.
• In the 2008 survey, a number of subgroups had mean financial literacy scores which were significantly below the mean FLS2 of 83.1 reported for the total 2008 sample (note: these scores are not percentages and can exceed 100). These subgroups included:
o People aged 18-24 years (mean FLS of 71.5) and people aged 70 years or over (mean FLS of 63.3);
o Females (mean FLS of 80.5), particularly females aged 70 years or over (mean FLS of 56.9);
o People whose formal education did not go beyond Year 10 secondary (mean FLS of 70.7);
o Those living in the 20% of postal areas classified as having the highest levels of relative socio-economic disadvantage3 (mean FLS of 75.5); and
o Reflecting this link to socio-economic disadvantage, mean scores were also lower amongst the unemployed (mean FLS of 66.7), people currently working in lower blue collar4 occupations (mean FLS of 76.5), people whose main source of income was a Government benefit or allowance (mean FLS of 67.2), and people whose household income was less than $25,000 per annum (mean FLS of 68.1).
1 A telephone survey of 3,500 randomly selected Australian adults between April 29 and June 6, 2008. 2 FLS=Financial Literacy Score. 3 According to the Australian Bureau of Statistics SEIFA index of Relative Socio-economic Disadvantage. See Section 2.3 for further discussion of this concept. 4 Major groups 7 (Machinery Operators and Drivers) and 8 (Labourers) in the Australian Bureau of Statistics Australian and New Zealand Standard Classification of Occupations (ANZSCO). ABS Catalogue No 1221.0.

ANZ Survey of Adult Financial Literacy in Australia (2008) 2
The Social Research Centre
o Those who speak a language other than English at home (mean FLS of 77.9); and
o Those of Aboriginal or Torres Strait Islander descent (mean FLS of 63.9), although this result is based on a relatively small number of interviews5 and should be treated with caution.
• Conversely, the mean financial literacy score was significantly higher than that of the total sample for:
o People aged 35-59 years (mean FLS of 89.8);
o Males (mean FLS of 85.9);
o People who had completed a university degree (mean FLS of 92.7);
o People living in the 20% of postal areas classified as having the least relative socio-economic disadvantage (mean FLS of 87.6); and
o Reflecting this, people currently working in upper white collar6 occupations (mean FLS of 94.5) and people whose annual household income was at least $150,000 per annum (mean FLS of 97.3).
These results point to a strong association between financial literacy and demographic/socio-economic characteristics. However, this does not necessarily imply that all members of a particular population subgroup have low (or high) levels of financial literacy.
For example, as discussed above the mean financial literacy score for people with household incomes below $25,000 (68.1) was lower than that of the total sample. Nevertheless, 19% of people from this low income group had financial literacy scores that placed them in the top 40% of the population and 7% had scores that fell in the top 20%. So although a large proportion of those with household incomes below $25,000 did have relatively low financial literacy scores (62% had scores in the lowest 40%) this was not true for all members of this group. Conversely, 6% of those with household incomes of $150,000 plus had financial literacy scores that fell in the lowest 20% of all scores.
To further assist with understanding the relative levels of financial literacy of different groups within the population, mean Financial Literacy Scores were used to assign survey respondents to bands of 20% of the population referred to as ‘quintiles’. Respondents in Quintile 1 have the lowest FLS and those in Quintile 5 the highest.
E2.1.2 Behaviours associated with high levels of financial literacy
There were behavioural differences between those whose financial literacy score was in the top 20% of the population (quintile five) and those whose score fell in the lowest 20% (quintile one). In looking at these, it should be kept in mind that socio-economic factors (such as those described in E2.1.1) can influence a person’s need for some of the services and information sources discussed below. For example, those with household incomes below $25,000 per annum would, prima facie, be less likely to need the services of a financial planner than those with household incomes of $150,000 or more. With that in mind, we note the following differences between these two quintiles.
• People in quintile five were more likely to use various sources of financial information and advice.
o 81% of those in quintile five had used information sources such as financial publications, financial web-sites and seminars (versus 38% of quintile one); and
o 80% had obtained advice from a financial management or planning specialist like an accountant, tax specialist or financial planner (versus 43% of quintile one).
5 Sample size, n=54 6 ANZSCO Major groups 1 (Managers) and 2 (Professionals).

ANZ Survey of Adult Financial Literacy in Australia (2008) 3
The Social Research Centre
• People in quintile five were more likely to compare alternatives when obtaining financial products and services by:
o Shopping around when looking for a new insurance policy (87% versus 56% of quintile one), mortgage (80% versus 59% of quintile one) or everyday banking account (77% versus 49% of quintile one);
o Using ratings agencies to compare financial products (35% versus 12% of quintile one); and
o Using on-line calculators to compare financial products (48% versus 15% of quintile one).
• Their transacting behaviour placed greater emphasis on convenience and fee minimisation.
o For their transacting, members of quintile five were more likely to use the convenient and lower cost electronic options such as internet banking (70% versus 26% of quintile one) and BPay (70% versus 31%).
o They were also more likely to have taken specific steps to minimise the fees associated with their everyday banking (91% versus 68% of quintile one).
• Members of quintile five7 were more likely to control their exposure to risk with building insurance on their home (88% versus 70% of quintile one) and by insuring the contents of their home (88% versus 60%).
• Those in quintile five also showed greater awareness of investment risk. They were more likely to say they would avoid an investment advertised as having “a return well above market rates with no risk” (87% versus 28% of quintile one) and those who have investments were more likely to consider diversification of their investment funds to be “very important” (65% versus 36% of quintile one).
E2.1.3 Risks associated with low levels of financial literacy
Most (79%) members of quintile one had sole (60%) or joint (19%) responsibility for the financial management of their household. In these circumstances, limited knowledge and understanding of financial issues has the potential to deliver negative financial outcomes for these households.
With that in mind, we note that members of quintile one performed at a relatively low level on several important aspects of financial knowledge and behaviour.
Compared to the total sample, members of quintile one were less aware of the following rights and responsibilities applicable to users of financial products and services.
• The requirement for accurate and honest disclosure.
o Only 17% of insurance holders in quintile one knew an insurance company can refuse a claim if questions relevant to the loss are not answered accurately when taking out or renewing the policy (versus 54% of all insurance holders).
• The responsibility for repayment of consumer debt and the consequences for a person’s credit rating if repayments are late.
o Only 35% of credit card holders in quintile one knew the primary card holder is responsible for all debt on the card (versus 77% of all credit card holders);
o 52% of loan holders in quintile one knew that both parties are responsible for the full repayment of a jointly held loan (versus 83% of all loan holders); and
o 38% of all quintile one members knew that being more than 60 days late with the minimum payment on a credit card is likely to give someone a bad credit rating (versus 59% of the total sample).
7 Bases for the incidence of insurance are those respondents for whom each type of insurance is appropriate. For example, those who own or are purchasing their home or who are renting are the base for reporting the incidence of contents insurance.

ANZ Survey of Adult Financial Literacy in Australia (2008) 4
The Social Research Centre
• The responsibility to keep personal banking details secure.
o 67% of quintile one knew that responsibility for any loss rests solely with the card-holder if the card and PIN have been kept together in a stolen wallet (compared with 87% of the total sample).
• Members of quintile one were also less confident they knew how to make an effective complaint about a bank or other financial institution if something does go wrong - 50% of quintile one were confident they knew how to do this versus 63% of the total sample.
As discussed earlier (see Section E2.1.2), when compared with those exhibiting relatively high levels of financial literacy, members of quintile one were less likely to engage in financial behaviours which had the potential to make their banking less expensive and more efficient. Members of quintile one were also:
• More likely to be at risk of loss due to their relatively lower use of insurance; and
• Less likely to obtain financial information from financial publications, the internet, seminars or advice from accountants, tax specialists or financial planners although, as mentioned earlier, socio-economic factors may limit the need to use these information sources.
E2.2 Other issues of interest including changes since 2002
This section looks at other aspects of financial literacy and related behaviours that were of particular interest. Where appropriate, changes that have occurred since 2002 or 20058 are noted. Consideration is given to community attitudes towards saving, awareness of consumer rights and responsibilities, investing and superannuation, comparison shopping for financial products and services, the growth in electronic banking and people’s management of borrowing and debt.
E2.2.1 Attitudes
Attitudinal changes were evident in two areas:
• In 2008 more people said they try to save on a regular basis (up from 67% in 2002 to 72% in 2008).
• Secondly, more under 65’s strongly disagreed with the view that “superannuation and retirement savings and planning don’t matter much because the Government will make up any gap” (up from 49% in 2005 to 57% in 2008). Ongoing publicity on ageing of the Australian population reducing the number of workers available to support retirees and perhaps the changes designed to enhance the attractiveness of superannuation and the longevity of retirees’ superannuation savings may be playing a role here.
E2.2.2 Consumers’ rights and responsibilities
• Consumers showed relatively high awareness of their rights.
o Two-thirds (67%) were very clear about their rights if they have a problem with a financial institution. This figure has not changed significantly since the 2005 survey when it was 68%.
o Most respondents nominated an industry ombudsman (36%) or Government organisation like Consumer Affairs or ASIC (26%) as the place they would go if they experienced difficulties that could not be resolved with the provider of a financial product or service.
o In 2008, more respondents were confident they knew how to make an effective complaint against a bank or financial institution (up from 59% very or fairly confident in 2002 to 63% in 2008).
• There was also greater awareness of several consumer responsibilities.
o More insurance holders were aware of their obligation for accurate disclosure of relevant information when taking out an insurance policy – 54% knew an insurer
8 A number of measures were used for the first time in 2005

ANZ Survey of Adult Financial Literacy in Australia (2008) 5
The Social Research Centre
could refuse a claim if questions relevant to a loss were not answered accurately when the policy was taken out, up 3 percentage points on the 2005 result of 51%.
o More credit card holders were aware that the primary cardholder has sole responsibility for any debt incurred on their credit card, up from 74% in 2002 to 77% in 2008.
E2.2.3 Investing and superannuation
The 2008 survey showed a somewhat mixed picture with respect to investing and superannuation. There were some improvements but there were also some areas that may require attention. Points of interest included the following.
• There were improvements in people’s understanding of some investment fundamentals.
o Compared to 2002, more people said they would not invest in “an investment advertised as having a return well above market rates and no risk”, up from 46% in 2002 to 52% in 2008; and
o More people understood that “short term fluctuations in market value can be expected, even with good investments”, up from 63% to 67% during this period.
On a less positive note:
o The proportion of investors who considered diversification of investments to be very important has remained unchanged over the last 6 years - 50% in 2008 compared with 51% in 2002.
o Of those who have used a financial planner, around one in three (35%) did not consider the possibility of a conflict of interest influencing the advice they received.
• There was reported improvement in understanding of superannuation fund statements but a significant proportion of people said they did not read their statements. Awareness of some advantages and risks of superannuation remained at a relatively low level.
o Of those superannuation fund members who said they received annual statements from their fund, 31% found them difficult to understand. This was 5 percentage points lower than in 2002.
Despite this improvement however, one in four (25%) fund members still say they don’t receive or don’t read their superannuation fund statements (versus 24% in 2005). Reasons for not reading superannuation fund statements were lack of interest (36% “couldn’t be bothered”) or because they were considered too difficult to understand (23%).
o There was relatively low awareness of the tax advantages of superannuation - only 58% of employed fund members under 65 years of age thought superannuation is taxed at a lower rate than other investments, relatively unchanged from the 56% who thought this was the case in 2005.
o Lack of awareness of things which result in under-performance of superannuation and managed investments has remained relatively high - 42% of employed fund members less than 65 years of age were unable to nominate anything that has this effect on fund performance, the same result as in the 2005 survey.
E2.2.4 Comparison shopping
In 2008, there was less comparison shopping for some products.
• 73% had shopped around when arranging a mortgage, down 9 percentage points on the 82% who said they had done this in 2002. This decline appears to be at least partly explained by increased use of mortgage brokers who may be seen by the consumer as doing their shopping for them (39% of mortgage holders had used a mortgage broker to arrange their loan in 2008). In 2008, 26% of respondents mentioned “going with the advice of a broker/financial expert” as their reason for not shopping around up from 16% in 2005.

ANZ Survey of Adult Financial Literacy in Australia (2008) 6
The Social Research Centre
• There was also less shopping around for insurance - 81% in 2002 compared with 75% in 2008. It may be that increased use of direct debit premium payment has made the process of switching providers a little more complex and as a result has encouraged some consumers to remain with their current provider when their policy is due for renewal. The presence of an existing relationship was the reason given most often for not shopping around for insurance (49%).
E2.2.5 Growth in use of electronic transaction channels
Since 2002, there has been substantial growth in the use of electronic channels for banking transactions.
• The greatest increase has occurred in the use of internet banking which has risen from 28% in 2002 to 51% in 2008.
• Increases are also evident in the use of BPay (up from 36% in 2002 to 52% in 2008), direct debit (up from 50% to 64%), EFTPOS (up from 71% to 76%) and ATM’s (up from 73% to 80%).
While use of Internet banking has increased, the proportion of internet users aware of risks associated with internet banking has remained unchanged since 2005 (at 22%) although there is new awareness of the threat posed by identity theft.
E2.2.6 Borrowing and debt
Several measures were taken of people’s comfort with their current debt position. These were not financial literacy measures but were first asked in 2005 to provide quantitative background for the qualitative study “Understanding Personal Debt and Financial Difficulty in Australia”.
Overall, there has been little change since 2005 in people’s comfort with their current level of debt.
• In both 2008 and 2005, 72% of respondents said they were very or fairly comfortable with their current debt while 18% (versus 17% in 2005) were somewhat or very uncomfortable.
As might be expected, those with significant mortgage commitments relative to their household income were the most likely to be experiencing some discomfort. Of those with mortgages of $300,000 or more and annual household incomes of $100,000 or less, 34% were “uncomfortable”9 with their current debt. This figure rose to 44% amongst those with mortgage outstandings of this level and annual household incomes of $65,000 or less.
In the event of another interest rate increase, the majority of mortgage holders felt they could meet the higher repayments - 44% “without too many problems” while 30% felt they would have to cut back other expenditure to do so. Eight percent felt they would “really struggle” and 1% felt they would be unable to make the repayments and would be at risk of defaulting on their loan. Couples with children and an annual household income of $65,000 or less were the most likely to feel they would either really struggle or be unable to make the higher repayments (24%).
E2.3 Concluding remarks
From the commencement of this research program in 2002, it has been acknowledged that raising the community’s levels of financial literacy is a long-term process and that it would be unrealistic to expect major changes in the short-term. This view is supported by the research findings. Policy focus needs to remain on those groups and areas identified in the research as requiring attention. For example, the research findings suggest that such areas as understanding of risk management, investment and superannuation are still of concern and that there continue to be some groups within the community who are more likely than others to experience difficulties in their financial dealings.
Future surveys could usefully focus on behaviour and the extent to which money management skills and knowledge translate into behaviour.
9 That is, very or somewhat uncomfortable.

ANZ Survey of Adult Financial Literacy in Australia (2008) 7
The Social Research Centre
In 2009 ANZ will release research that takes a behavioural approach to understanding the success of the matched savings account SaverPlus in promoting ongoing savings behaviour. Tracking studies by RMIT10 have shown that up to three years after participating in the Saver Plus program, 70% of participants continue to save at or above the levels they did while on the program and attribute that in some part to Saver Plus.
10 Russell R., Harlim J. and Brooks R. (2008), Saver Plus 2008 follow-up survey results.

ANZ Survey of Adult Financial Literacy in Australia (2008) 1
The Social Research Centre
Section 1 Introduction to the Report
1.1 Background Financial literacy refers to the ability to make informed judgements and to take effective decisions regarding the use and management of money11.
Financial literacy is regarded as an important requirement for functioning effectively in modern society and trends in retirement income policies, work patterns and demography suggest its importance can only increase in the years ahead. Raising financial literacy supports social inclusion and enhances the wellbeing of the community.
ANZ’s first national survey, conducted in 2002 and published in 2003, established a benchmark for ongoing measurement of financial literacy across the Australian population. A follow-up survey was conducted in 2005 to monitor the state of adult financial literacy in Australia three years on from the first survey.
In the period following the initial survey there was significant activity in Australia with the establishment of the Financial Literacy Foundation in 2005 by the Australian Government. The Foundation commissioned further research into financial literacy with the report (Australians understanding their money) published in 2007. From 1 July 2008, the Australian Securities and Investments Commission (ASIC) assumed responsibility for the functions previously undertaken by the Financial Literacy Foundation.
In this context of a growing profile of financial literacy and financial capability, ANZ has undertaken the third ANZ Survey of Adult Financial Literacy in Australia.
1.2 Context of the survey In considering the results presented in this report, it should be kept in mind that the 2008 survey took place against a background of volatility in financial markets following the emergence of problems in the US sub-prime mortgage market in mid-2007. Share markets have experienced volatility and difficulties have been experienced by brokers such as Tricom, Lift and Opes Prime and organisations like Centro, Allco and ABC Childcare. In addition, 2006/2007 saw significant loss of investors’ funds in the high profile failures of property developers Westpoint, Fincorp and Australian Capital Reserve.
Interest rates have risen and prices for fuel and food increased during the survey period, reflecting global rises in prices for oil and food commodities. Consumer confidence as measured by the Westpac-Melbourne Institute Index of Consumer Sentiment was declining during the survey period, falling to a 16 year low in June 2008.
While some difficulties were evident around the time of fieldwork for the 2005 survey (for example an interest rate increase of 0.25% just before fieldwork commenced in March 2005), the situation in 2008 appears somewhat less benign than it did for the earlier surveys.
1.3 Research objectives The broad objectives of the 2008 study were:
To monitor how levels of financial literacy have changed since the benchmark study of 2002-03, and the second study conducted in 2005;
To continue to inform public policy, particularly as it relates to low financial literacy segments, to encourage continued focus on the area and to stimulate further debate; and
To provide a valuable information resource which will assist with the development of strategies to improve financial literacy in the community.
11 Schagen, S “The Evaluation of NatWest Face 2 Face with Finance”, NFER, 1997.

ANZ Survey of Adult Financial Literacy in Australia (2008) 2
The Social Research Centre
1.4 Research design This study was a repeat measure of the 2002 and 2005 surveys and, given that comparative measures were required, the research methodology was kept as consistent as possible. With that in mind, key elements of the 2008 survey included the following:
Data collection was by telephone interview and was conducted between April 29 and June 6, 2008.
The questionnaire12 was very similar to that used in 2005 apart from the addition of a few questions to address new issues such as reverse equity loans, the increased use of mortgage brokers and further changes to superannuation and the deletion of several 2005 questions to allow for their inclusion. The questionnaire length remained at an average of 28 minutes.
As in both the previous surveys, core questions were asked of all respondents while other questions were only asked of particular subgroups. Knowledge was tested against an individual’s needs and circumstances rather than the entire array of financial products and services, some of which they would neither use nor need. To make sure no individual respondent was exposed to an excessively long interview, a number of questions which would have been appropriate to ask of all eligible respondents, were in fact only asked of a randomly selected subgroup. For example, many of the questions about financial planners were asked of 50% of eligible respondents. Sample size was sufficiently large to enable this to occur while still obtaining statistically robust results.
The target population for the survey was all Australians aged 18 years or over who were accessible by fixed-line telephone. Where more than one eligible person lived in a contacted household, a random selection procedure13 was used to select the survey respondent.
The sample was stratified by capital city/regional area in each state and territory. The number of interviews conducted in each stratum was proportional to the adult population resident in that location. The geographic breakdown of the final sample was as shown in Table 1.4a.
Table 1.4a Sample distribution by geographic location
A post-weighting procedure was used to align the survey data with the Australian Bureau of Statistics Census distribution of the population by age, sex and location.
12 See Appendix One. 13 The next person in the household to have a birthday.
Location
Capital
City Regional
Total
Interviews
Proportion of
Total
Interviews
n n n %
New South Wales . . . . . . . . . . . . . . . . . . . . . . . . . . . . . . . . . . . . . . 730 423 1153 33%
Victoria . . . . . . . . . . . . . . . . . . . . . . . . . . . . . . . . . . . . . . . .644 233 877 25%
Queensland . . . . . . . . . . . . . . . . . . . . . . . . . . . . . . . . . . . . . . . .309 370 679 19%
South Australia . . . . . . . . . . . . . . . . . . . . . . . . . . . . . . . . . . . . .201 71 272 8%
Western Australia . . . . . . . . . . . . . . . . . . . . . . . . . . . . . . . . . . . . . . . .252 94 346 10%
Tasmania . . . . . . . . . . . . . . . . . . . . . . . . . . . . . . . . 36 48 84 2%
Australian Capital Territory (ACT) . . . . . . . . . . . . . . . . . . . . . . . . . . . . . .58 - 58 2%
Northern Territory . . . . . . . . . . . . . . . . . . . . . . . . . . . . . .18 13 31 1%
Total interviews (n) . . . . . . . . . . . . . . . . . . . . . . . . . . . . . . . . . . . . . .2248 1252 3500 100%
Proportion of total interviews (%) . . . . . . . . . . . . . . . . . . . . . . . . . . . . . . . . . . . . . .64% 36% 100%

ANZ Survey of Adult Financial Literacy in Australia (2008) 3
The Social Research Centre
1.5 Steering Committee As with the previous studies, the 2008 survey was managed by a Steering Committee. The Committee comprised representatives of ANZ, the Australian Securities and Investments Commission and the Consumer Action Law Centre.
1.6 Structure of the report The remainder of this report is divided into nine sections. Each section begins with a summary of key findings which is followed by the detailed results including data tables, graphs and associated commentary. The broad topic areas covered in these sections are as follows:
Section 2 explains the definition of financial literacy as used in this research, the distribution of financial literacy across the population and its relationship to financial behaviour and the ownership of financial products;
Section 3 examines people’s use and understanding of methods of paying for goods and services;
Section 4 reports on people’s money management, budgeting and financial planning behaviour;
Sections 5, 6, 7 and 8 report on the use, understanding and acquisition of financial products and services including transaction accounts, loans and credit cards, savings accounts, investments, superannuation, retirement income products, financial planners and insurance;
Section 9 examines consumers’ understanding of their rights and responsibilities; and
Section 10 looks at consumers’ use and understanding of the internet in banking and finance related matters.
Not all of the questions used in the survey (and reported in this document) relate directly to financial literacy. There is also a comprehensive set of attitudinal and behavioural information which is useful in the explanation and understanding of this concept.
Statistical testing of results
As the results presented in this report are based on sample data rather than a census of the total population, some variation between the results from the three surveys (and between subgroups within each survey since they too are samples of larger populations) will occur by chance. To help decide whether differences are meaningful (that is, whether they represent genuine changes or differences rather than just random variation), testing of the statistical significance of these differences has been carried out. Results are only reported as changed or different if a statistically significant difference exists at the 95% level of confidence.

ANZ Survey of Adult Financial Literacy in Australia (2008) 4
The Social Research Centre
Section 2 Financial Literacy
2.1 Introduction and key findings This chapter discusses the definition of financial literacy that has been used in this study and then examines its distribution across demographic, geographic and socio-economic groupings of the adult Australian population. It also examines the relationship between financial literacy and financial behaviour as well as that between financial literacy and ownership of various financial products.
Key findings
Definition of financial literacy
Financial literacy was defined as the ability to make informed judgements and to take effective decisions regarding the use and management of money.
For this research, the above definition was operationalised through a subset of survey questions drawn from the areas of numeracy, financial understanding and competence and financial responsibility. These questions were used to calculate an average financial literacy score (FLS) for each respondent14. The total sample was then divided into quintiles based on these scores. The mean FLS for the total sample was 83.1. (Note: these scores are not percentages).
Distribution of financial literacy in the community
The demographic characteristics most strongly associated with financial literacy included:
o Age – the mean FLS was lower than that of the total sample amongst those aged 18-24 years (71.5) and those aged 70 years or over (63.3), particularly females in the latter age group (56.9)
o Educational attainment – those whose education did not extend beyond Year 10 had lower FLSs (mean of 70.7) than those who had completed either a university degree (92.7) or other post-secondary education (88.2). These differences were still evident even when the analysis was controlled for age by restricting the analysis to people aged 60 years or over. Amongst this older group, the mean FLS for those with a university degree was 85.4, well above the mean FLS of 64.8 for those who did not go beyond Year 10.
o Cultural and Linguistic Diversity - financial literacy scores were also lower than those of the total sample amongst people who used a language other than English at home (77.9) and amongst those from an ATSI background15 (63.9)
o Geographic location - compared to the total sample, those living in remote locations16 had a lower mean score (75.6) than those people living in Australia’s capital cities (83.4).
The socio-economic characteristics most strongly associated with financial literacy included:
o Socio-economic disadvantage - those living in areas identified as having the highest levels of relative socio-economic disadvantage according to the ABS SEIFA classification exhibited below average financial literacy (mean FLS 75.5) while those living in areas with the least relative disadvantage had average literacy scores (mean FLS 87.6)
o Occupation – the unemployed (mean FLS 66.7) and those working in lower blue collar occupations had lower financial literacy scores (mean FLS 76.5) while those in upper white collar (managers and professionals) occupations had higher scores (mean FLS 94.5)
14 The maximum score achieved as 131. 15 Caution, small sample size n=54 16 According to the ABS ARIA classification - see definition in Section 2.3.

ANZ Survey of Adult Financial Literacy in Australia (2008) 5
The Social Research Centre
o Household income – higher incomes were associated with higher scores (mean FLS of 97.3 amongst those with annual household incomes of $150,000 or more) while lower scores were found amongst those reporting lower incomes (mean FLS of 68.3 amongst those with annual household incomes of $25,000 or less). Literacy scores were also lower amongst those whose main source of income was a government benefit or payment (mean FLS 67.2).
o Savings and investments – those whose savings and investments had a total reported value of less than $2,000 had relatively low scores (mean FLS 67.2) while those with $500,000 or more had relatively high scores (mean FLS 97.7)
o Internet access – amongst 18-54 year olds, those with internet access had higher financial literacy scores (mean FLS 86.2) than those who did not (mean FLS 68.0).
Financial literacy and behaviour
Those in the top 20% of financial literacy scores (that is members of quintile five) were significantly more likely than those in the lowest 20% scores (quintile one) to engage in behaviours such as:
Reading finance related publications
Consulting financial advisers and specialists such as accountants, tax specialists and financial planners
Using financial and consumer rating agencies to compare financial products
Taking steps to minimise everyday banking fees
Comparison shopping when looking for financial products like everyday bank accounts, mortgages or insurance
Borrowing from mainstream financial institutions rather than from family or friends.
Financial literacy and ownership of financial products
Members of quintile five were significantly more likely than those in quintile one to have:
Deposit products such as a high interest savings accounts and term deposits
Investments including shares, managed funds, debentures, bonds, notes and derivatives and investment property
A retirement income stream product such as an annuity or allocated pension
Loans and credit cards (with the exception of store cards and equity release products), and
Most types of insurance including health insurance, life insurance, home and contents insurance, income protection insurance and motor vehicle insurance although a very high proportion of quintile one vehicle owners (93%) did have either comprehensive or third party motor vehicle insurance.
ANZ Survey of Adult Financial Literacy in Australia (2008) 6
The Social Research Centre
2.2 Defining financial literacy Financial literacy is an important requirement for functioning effectively in modern society with trends in retirement income policies, work patterns and demography suggesting its importance can only increase in the years ahead. Raising financial literacy supports social inclusion and enhances the general and economic wellbeing of the community.
High levels of financial literacy enable people to make informed and confident decisions on all aspects of their budgeting, spending, saving and planning for the future as well as on their use of financial products and services such as everyday banking, borrowing and investing.
For the purposes of this research, financial literacy was defined as:
“The ability to make informed judgements and to take effective decisions regarding the use and management of money”.
This definition draws on UK research17 and has been used as the cornerstone of the three Adult Financial Literacy in Australia surveys conducted in 2002, 2005 and now in 2008.
An operational definition of financial literacy
The above definition offers a broad conceptual view of financial literacy. However, it can only be operationalised though the survey questions used to assess people’s knowledge and decision-making on the management of their money.
With that in mind, an operational definition of financial literacy in the form of a framework developed in the UK by the Adult Financial Literacy Advisory Group and adapted to the Australian context18, was used to guide the detailed design of the initial Adult Financial Literacy in Australia Survey. This framework provided a detailed specification of the components of financial literacy in the areas of numeracy, financial understanding and competence and financial responsibility and these areas in turn formed the basis of the questionnaires used in the 2002, 2005 and 2008 surveys.
This approach provides a comprehensive coverage of the various components of financial literacy. However, a summary measure is needed to facilitate investigation of the ways in which financial literacy varied across demographic and socio-economic subgroups of the population.
To create this, each survey respondent’s financial literacy was summarised by calculating a financial literacy score based on their responses to 26 of the survey questions. Points were allocated (or deducted) according to the responses given and a total financial literacy score was created for each respondent.
Several of the 26 questions were asked only of subgroups of survey respondents. For example, only those people who had insurance were asked what factors they considered when renewing an insurance policy. Consequently, some respondents could have received a lower total score than others simply because they had answered fewer questions. To overcome this difficulty an average financial literacy score was produced for each respondent. This was calculated by dividing each respondent’s total financial literacy score by the number of questions (out of the 26) they were asked.
The 26 measures used are summarised in Table 2.2a.
17 Schagen, S “The Evaluation of NatWest Face 2 Face with Finance”, NFER, 1997 (this definition was adopted from UK research with a view to international consistency). 18 See Appendix Two for a detailed description of this operational framework.

ANZ Survey of Adult Financial Literacy in Australia (2008) 7
The Social Research Centre
Table 2.2a Variables used in creating summary financial literacy scores
Variables used to create summary financial literacy score
NUMERACY
Six questions used to test the basic mathematical operations of addition, subtraction, multiplication
and division and understanding of percentage
FINANCIAL UNDERSTANDING AND COMPETENCE
Attitudes to spending money and saving
Respondent's attitude to saving
Belief that the government will make up any shortfall in retirement savings/superannuation
Level of control over household and personal expenses
Understanding of risk and the relationship between risk and return
Reaction to investment offering " a return well above market rates with no risk "
Is the statement " an investment with a high return is likely to have higher than average risks" true or false?
Understanding the importance of diversification when investing over a timeframe of 5 years or more
Understanding that fluctuations in market value occur even with good investments
Understanding the main features of basic financial services
Factors considered when FIRST taking out an insurance policy
Factors considered when RENEWING an insurance policy
Awareness of the responsibility for debt incurred on a credit card by a secondary card holder
Awareness of the responsibility for repayment of a jointly held loan
Understanding of superannuation
Awareness that employers are legally required to make super payments for their employees
Awareness that employees can make additional super payments to those of their employer
Awareness of the best indication of superannuation fund performance
FINANCIAL RESPONSIBILITY
Making appropriate life choices about financial issues
Understanding the importance of having a short-term financial plan
Understanding the importance of having a long-term financial plan
Understanding consumer rights and responsibilities
Awareness providers of financial products and services have a legal duty to provide clear information to consumers
Awareness that an insurer can refuse a claim if relevant questions are not answered accurately
Awareness that consumers have a duty of honest disclosure when obtaining financial products or services
Awareness of responsibility for loss of money if PIN is kept with ATM/Bank card

ANZ Survey of Adult Financial Literacy in Australia (2008) 8
The Social Research Centre
All of these measures differentiated well between respondents of high and low levels of financial literacy. A few of the questions did not differentiate especially well between people in the top 40% of financial literacy scores. Nevertheless, these questions were retained in the calculation because of the fundamental importance of the skills or knowledge they measure to an individual’s financial literacy. Awareness that employers are legally required to make superannuation payments for their employees was a measure that fell into this category.
To facilitate reporting, the survey respondents were divided into quintiles (that is groups of 20% of the total sample) based on their average financial literacy score. The mean financial literacy score for all respondents, as well as the mean scores for each quintile, are shown in Figure 2.2a.
This graph shows that the mean financial literacy score for the total sample was 83.1 while the mean scores for each quintile ranged from 40.5 for quintile one through to 116.5 for quintile five. Statistically significant differences were evident between the mean scores of each quintile.
Figure 2.2a Distribution of mean financial literacy scores by quintile
Base: All respondents
40.5
70.4
86.6
100.8
116.5
83.1
0
25
50
75
100
125
Total Sample
(n=3500)
Quintile 1
(n=690)
Quintile 2
(n=678)
Quintile 3
(n=717)
Quintile 4
(n=739)
Quintile 5
(n=676)

ANZ Survey of Adult Financial Literacy in Australia (2008) 9
The Social Research Centre
2.3 The distribution of financial literacy within the population We turn now to a review of the extent to which financial literacy varies within the Australian population. This section begins by comparing financial literacy levels amongst demographic and geographic subgroups of the population.
Financial literacy and demographic/geographic subgroups
Table 2.3a presents the mean financial literacy scores (FLSs) for selected demographic subgroups and for the residents of different geographic areas.
There are significant associations between age and financial literacy. Specifically, financial literacy was well below the total sample average amongst those aged 70 years or over (mean FLS of 63.3 versus 83.1 for the total sample) and amongst those aged 18-24 years (mean FLS of 71.5). By contrast the highest levels of financial literacy were amongst those aged between 35 and 59 years of age.
Financial literacy was also higher amongst males than females (mean FLSs of 85.9 and 80.5 respectively). Further, analysis of age by gender showed that differences between males and females were greatest amongst those respondents who were aged 70 years or over - in this age group the mean FLS for males was 70.9 while that for females was only 56.9.
In attempting to explain the lower scores seen amongst young people, it seems feasible that this, to some degree, reflects their limited exposure to finance-related life experiences. Once people have participated in such activities as purchasing homes and motor vehicles and have been more closely involved in superannuation and other investments, insurance and so on, the breadth and depth of their financial understanding, and hence their financial literacy scores, might be expected to increase. Similarly, the incidence of interaction with finance professionals such as accountants and financial advisers, and the opportunity to learn from this, tends to be limited amongst under 25’s.
Other points of interest in Table 2.3a include:
Indications of an association between financial literacy and educational attainment (mean FLS of 70.7 amongst those who did not go beyond Year 10 versus 92.7 amongst those who have completed a university degree). It is likely that age plays some role in this association as older people are more likely to have left school at the end of year 10. Nevertheless, even when the analysis is restricted to people aged 60 years or over, financial literacy was still significantly higher amongst those with a university degree (mean FLS 85.4) than it was amongst those who did not go beyond Year 10 (mean FLS 64.8).
Financial literacy scores were also lower than the total sample score amongst those who use a language other than English at home (mean FLS 77.9), those with an ATSI background19 (mean FLS 63.9) and those living in areas classified as “remote” or “very remote” according to the Australian Standard Geographical Classification remoteness structure based on Australian Bureau of Statistics ARIA20 values (FLS 75.6).
19 Due to the relatively small sample size (n=54) this result should be treated with caution 20 ARIA (Accessibility/Remoteness Index of Australia) is an ABS classification based on the premise that remoteness is a factor of the relative distance one must travel to access a full range of services. ARIA measures the remoteness of a point based on road distances to the nearest ABS defined Urban Centre. ARIA scores provide the basis for the Australian Standard Geographical Classification remoteness structure. For examples see Appendix Three.

ANZ Survey of Adult Financial Literacy in Australia (2008) 10
The Social Research Centre
Table 2.3a Financial literacy and demographic/geographic subgroups
Base: Total sample within each subgroup
Financial literacy and socio-economic subgroups
Table 2.3b examines variation in financial literacy across a number of socio-economic measures. The figures shown indicate that financial literacy scores are typically higher amongst those who:
Exhibit the least socio-economic disadvantage according to the Australian Bureau of Statistics’ SEIFA Index of Relative Socio-economic Disadvantage21 - mean FLS of 87.6 amongst those living in the least disadvantaged 20% of postcodes versus 75.5 amongst those from the 20% of postcodes classified as being the most socio-economically disadvantaged;
Work in upper white collar (professional and managerial) occupations (mean FLS of 94.5);
Report their main activity as paid employment and whose income is mainly derived from salary, wages or from their own business;
Report higher levels of household income and higher levels of savings and investments; and
21 ABS Socio-Economic Index for Areas (SEIFA) is a set of four indexes created from Census data that shows how disadvantaged or advantaged each Census collection district is relative to all others (some cd’s are not assigned an index value because of small populations or missing data). Disadvantage refers to an individual’s access to material and social resources and their ability to participate in society relative to what is commonly accepted by the wider community. The Index of Relative Socio-economic Disadvantage is used here. (see Information Paper An Introduction to Socio-Economic Indexes for Areas (SEIFA) ABS Catalogue No. 2039.0 for a more detailed explanation and discussion). All postal areas have been allocated to quintiles based on their relative level of socio-economic disadvantage.
Financial Literacy and demographic/
geographic subgroups2008
Financial Literacy and demographic/
geographic subgroups2008
Subgroup Subgroup
Mean FLS Mean FLS
Total Sample . . . . . . . . . . . . . . . . . . . . . . . . . . . . . . . . . . . . . . . . . . . . . . . . . . . . . . . . . . . . . . . . . . . . .83.1 Total Sample . . . . . . . . . . . . . . . . . . . . . . . . . . . . . . . . . . . . . . . . . . . . . . . . . . . . . . . . . . . . . . . . . . . . .83.1
Age group Highest level of education completed
18-24 years . . . . . . . . . . . . . . . . . . . . . . . . . . . . . . . . . . . . . . . . . . . . . . . . . . . . . . . . . . . . . . . . . . . . .71.5 Year 10 or less . . . . . . . . . . . . . . . . . . . . . . . . . . . . . . . . . . . . . . . . . . . . . . . . . . . . . . . . . . . . . . . . . . . . .70.7
25-34 years . . . . . . . . . . . . . . . . . . . . . . . . . . . . . . . . . . . . . . . . . . . . . . . . . . . . . . . . . . . . . . . . . . . . .86.0 Year 11/12 . . . . . . . . . . . . . . . . . . . . . . . . . . . . . . . . . . . . . . . . . . . . . . . . . . . . . . . . . . . . . . . . . . . . .80.4
35-44 years . . . . . . . . . . . . . . . . . . . . . . . . . . . . . . . . . . . . . . . . . . . . . . . . . . . . . . . . . . . . . . . . . . . . .90.9 Trade/TAFE/Diploma . . . . . . . . . . . . . . . . . . . . . . . . . . . . . . . . . . . . . . . . . . . . . . . . . . . . . . . . . . . . . . . . . . . . .88.2
45-59 years . . . . . . . . . . . . . . . . . . . . . . . . . . . . . . . . . . . . . . . . . . . . . . . . . . . . . . . . . . . . . . . . . . . . .89.1 University . . . . . . . . . . . . . . . . . . . . . . . . . . . . . . . . . . . . . . . . . . . . . . . . . . . . . . . . . . . . . . . . . . . . .92.7
60-69 years . . . . . . . . . . . . . . . . . . . . . . . . . . . . . . . . . . . . . . . . . . . . . . . . . . . . . . . . . . . . . . . . . . . . .81.6 Language spoken at home
70 years or over . . . . . . . . . . . . . . . . . . . . . . . . . . . . . . . . . . . . . . . . . . . . . . . . . . . . . . . . . . . . . . . . . . . . .63.3 English . . . . . . . . . . . . . . . . . . . . . . . . . . . . . . . . . . . . . . . . . . . . . . . . . . . . . . . . . . . . . . . . . . . . .84.0
Age by Gender Other language . . . . . . . . . . . . . . . . . . . . . . . . . . . . . . . . . . . . . . . . . . . . . . . . . . . . . . . . . . . . . . . . . . . . .77.9
Males . . . . . . . . . . . . . . . . . . . . . . . . . . . . . . . . . . . . . . . . . . 85.9 ATSI background
18-24 years . . . . . . . . . . . . . . . . . . . . . . . . . . . . . . . . . . . . . . . . . . . . . . . . . . . . . . . . . . . . . . . . . . . . .72.4 Yes . . . . . . . . . . . . . . . . . . . . . . . . . . . . . . . . . . . . . . . . . . . . . . . . . . . . . . . . . . . . . . . . . . . . .63.9
25-34 years . . . . . . . . . . . . . . . . . . . . . . . . . . . . . . . . . . . . . . . . . . . . . . . . . . . . . . . . . . . . . . . . . . . . .88.0 No . . . . . . . . . . . . . . . . . . . . . . . . . . . . . . . . . . . . . . . . . . . . . . . . . . . . . . . . . . . . . . . . . . . . .83.4
35-44 years . . . . . . . . . . . . . . . . . . . . . . . . . . . . . . . . . . . . . . . . . . . . . . . . . . . . . . . . . . . . . . . . . . . . .94.3 Geographic - place of residence
45-59 years . . . . . . . . . . . . . . . . . . . . . . . . . . . . . . . . . . . . . . . . . . . . . . . . . . . . . . . . . . . . . . . . . . . . .91.0 Capital city . . . . . . . . . . . . . . . . . . . . . . . . . . . . . . . . . . . . . . . . . . . . . . . . . . . . . . . . . . . . . . . . . . . . .83.4
60-69 years . . . . . . . . . . . . . . . . . . . . . . . . . . . . . . . . . . . . . . . . . . . . . . . . . . . . . . . . . . . . . . . . . . . . .84.0 Non-capital city . . . . . . . . . . . . . . . . . . . . . . . . . . . . . . . . . . . . . . . . . . . . . . . . . . . . . . . . . . . . . . . . . . . . .82.5
70 years or over . . . . . . . . . . . . . . . . . . . . . . . . . . . . . . . . . . . . . . . . . . . . . . . . . . . . . . . . . . . . . . . . . . . . .70.9 ARIA classification
Females . . . . . . . . . . . . . . . . . . . . . . . . . . . . . . . . . . . . . . . . . . 80.5 Major cities . . . . . . . . . . . . . . . . . . . . . . . . . . . . . . . . . . . . . . . . . . . . . . . . . . . . . . . . . . . . . . . . . . . . .83.7
18-24 years . . . . . . . . . . . . . . . . . . . . . . . . . . . . . . . . . . . . . . . . . . . . . . . . . . . . . . . . . . . . . . . . . . . . .70.4 Inner regional . . . . . . . . . . . . . . . . . . . . . . . . . . . . . . . . . . . . . . . . . . . . . . . . . . . . . . . . . . . . . . . . . . . . .83.4
25-34 years . . . . . . . . . . . . . . . . . . . . . . . . . . . . . . . . . . . . . . . . . . . . . . . . . . . . . . . . . . . . . . . . . . . . .84.2 Outer regional . . . . . . . . . . . . . . . . . . . . . . . . . . . . . . . . . . . . . . . . . . . . . . . . . . . . . . . . . . . . . . . . . . . . .80.8
35-44 years . . . . . . . . . . . . . . . . . . . . . . . . . . . . . . . . . . . . . . . . . . . . . . . . . . . . . . . . . . . . . . . . . . . . .87.5 Remote/Very remote areas . . . . . . . . . . . . . . . . . . . . . . . . . . . . . . . . . . . . . . . . . . . . . . . . . . . . . . . . . . . . . . . . . . . . .75.6
45-59 years . . . . . . . . . . . . . . . . . . . . . . . . . . . . . . . . . . . . . . . . . . . . . . . . . . . . . . . . . . . . . . . . . . . . .87.3
60-69 years . . . . . . . . . . . . . . . . . . . . . . . . . . . . . . . . . . . . . . . . . . . . . . . . . . . . . . . . . . . . . . . . . . . . .79.5
70 years or over . . . . . . . . . . . . . . . . . . . . . . . . . . . . . . . . . . . . . . . . . . . . . . . . . . . . . . . . . . . . . . . . . . . . .56.9

ANZ Survey of Adult Financial Literacy in Australia (2008) 11
The Social Research Centre
Who have access to the internet from their place of work or from their own home. Separate analyses of internet access have been conducted for people aged 18 to 54 years and for those aged 55 years or over. This was done to control for the low rates of internet use amongst older people. As older people also exhibit relatively low levels of financial literacy, including them in the same analysis as younger people has the potential to depress literacy scores amongst non-internet users.
Table 2.3b Financial literacy and socio-economic subgroups
Base: Total sample within each subgroup
Financial literacy scores were lower amongst the unemployed (66.7), those whose main source of income was a government benefit or payment (67.2), those with less than $2,000 in savings and investments (67.2), those with household incomes of less than $25,000 per annum (68.1), those from areas exhibiting the greatest socio-economic disadvantage (SEIFA group 1 - 75.5) and those who do not use the internet.
A cautionary note
It should be noted that the preceding discussion focuses on biases towards high or low levels of financial literacy within subgroups. It does not imply that all members of a particular subgroup have a high (or low) level of financial literacy.
For example, on average those with household incomes below $25,000 had lower financial literacy scores (mean FLS of 68.1) than those with household incomes of $150,000 or more (mean FLS 97.3). Nevertheless, 19% of people with household incomes below $25,000 had financial literacy scores which were in the top 40% of the population and 7% had scores in the top 20%. So, although a large proportion of those with household incomes below $25,000 did have relatively low financial literacy scores (62% had scores in the lowest 40%) this is not true for all members of this low household income group.
Conversely, 6% of those with household incomes of $150,000 or more had financial literacy scores which fell in the lowest 20% of the population.
Financial Literacy and socio-economic
subgroups 2008
Financial Literacy and socio-economic
subgroups 2008
Subgroup Subgroup
Mean FLS Mean FLS
Total Sample . . . . . . . . . . . . . . . . . . . . . . . . . . . . . . . . . . . . . . . . . . . . . . . . . . . . . . . . . . . . . . . . . . . . .83.1 Total Sample . . . . . . . . . . . . . . . . . . . . . . . . . . . . . . . . . . . . . . . . . . . . . . . . . . . . . . . . . . . . . . . . . . . . .83.1
Gross annual household income
SEIFA group 1 (greatest disadvantage) . . . . . . . . . . . . . . . . . . . . . . . . . . . . . . . . . . . . . . . . . . . . . . . . . . . . . . . . . . . . . . . . . . . . .75.5 Less than $25,000 . . . . . . . . . . . . . . . . . . . . . . . . . . . . . . . . . . . . . . . . . . . . . . . . . . . . . . . . . . . . . . . . . . . . .68.1
SEIFA group 2 . . . . . . . . . . . . . . . . . . . . . . . . . . . . . . . . . . . . . . . . . . . . . . . . . . . . . . . . . . . . . . . . . . . . .80.7 $25,000-$57,999 . . . . . . . . . . . . . . . . . . . . . . . . . . . . . . . . . . . . . . . . . . . . . . . . . . . . . . . . . . . . . . . . . . . . .77.1
SEIFA group 3 . . . . . . . . . . . . . . . . . . . . . . . . . . . . . . . . . . . . . . . . . . . . . . . . . . . . . . . . . . . . . . . . . . . . .84.9 $58,000 -$79,999 . . . . . . . . . . . . . . . . . . . . . . . . . . . . . . . . . . . . . . . . . . . . . . . . . . . . . . . . . . . . . . . . . . . . .89.5
SEIFA group 4 . . . . . . . . . . . . . . . . . . . . . . . . . . . . . . . . . . . . . . . . . . . . . . . . . . . . . . . . . . . . . . . . . . . . .82.9 $80,000 -$99,999 . . . . . . . . . . . . . . . . . . . . . . . . . . . . . . . . . . . . . . . . . . . . . . . . . . . . . . . . . . . . . . . . . . . . .90.1
SEIFA group 5 (least disadvantage) . . . . . . . . . . . . . . . . . . . . . . . . . . . . . . . . . . . . . . . . . . . . . . . . . . . . . . . . . . . . . . . . . . . . .87.6 $100,000 -$149,999 . . . . . . . . . . . . . . . . . . . . . . . . . . . . . . . . . . . . . . . . . . . . . . . . . . . . . . . . . . . . . . . . . . . . .92.1
Current occupation type $150,000 or more . . . . . . . . . . . . . . . . . . . . . . . . . . . . . . . . . . . . . . . . . . . . . . . . . . . . . . . . . . . . . . . . . . . . .97.3
Upper white collar . . . . . . . . . . . . . . . . . . . . . . . . . . . . . . . . . . . . . . . . . . . . . . . . . . . . . . . . . . . . . . . . . . . . .94.5 Estimated value of all savings and investments
Middle/lower white collar . . . . . . . . . . . . . . . . . . . . . . . . . . . . . . . . . . . . . . . . . . . . . . . . . . . . . . . . . . . . . . . . . . . . .87.1 Less than $2,000 . . . . . . . . . . . . . . . . . . . . . . . . . . . . . . . . . . . . . . . . . . . . . . . . . . . . . . . . . . . . . . . . . . . . .67.2
Upper blue collar . . . . . . . . . . . . . . . . . . . . . . . . . . . . . . . . . . . . . . . . . . . . . . . . . . . . . . . . . . . . . . . . . . . . .83.6 $2,000-$19,999 . . . . . . . . . . . . . . . . . . . . . . . . . . . . . . . . . . . . . . . . . . . . . . . . . . . . . . . . . . . . . . . . . . . . .80.7
Lower blue collar . . . . . . . . . . . . . . . . . . . . . . . . . . . . . . . . . . . . . . . . . . . . . . . . . . . . . . . . . . . . . . . . . . . . .76.5 $20,000-$99,999 . . . . . . . . . . . . . . . . . . . . . . . . . . . . . . . . . . . . . . . . . . . . . . . . . . . . . . . . . . . . . . . . . . . . .87.3
Current main activity $100,000-$499,999 . . . . . . . . . . . . . . . . . . . . . . . . . . . . . . . . . . . . . . . . . . . . . . . . . . . . . . . . . . . . . . . . . . . . .92.9
Paid work . . . . . . . . . . . . . . . . . . . . . . . . . . . . . . . . . . . . . . . . . . . . . . . . . . . . . . . . . . . . . . . . . . . . .89.8 $500,000 or more . . . . . . . . . . . . . . . . . . . . . . . . . . . . . . . . . . . . . . . . . . . . . . . . . . . . . . . . . . . . . . . . . . . . .97.7
Home duties . . . . . . . . . . . . . . . . . . . . . . . . . . . . . . . . . . . . . . . . . . . . . . . . . . . . . . . . . . . . . . . . . . . . .76.7 Internet access
Student . . . . . . . . . . . . . . . . . . . . . . . . . . . . . . . . . . . . . . . . . . . . . . . . . . . . . . . . . . . . . . . . . . . . .73.6 Respondents aged 18-54 years
Retired . . . . . . . . . . . . . . . . . . . . . . . . . . . . . . . . . . . . . . . . . . . . . . . . . . . . . . . . . . . . . . . . . . . . .72.6 Access internet at all . . . . . . . . . . . . . . . . . . . . . . . . . . . . . . . . . . . . . . . . . . . . . . . . . . . . . . . . . . . . . . . . . . . . .86.2
Unemployed . . . . . . . . . . . . . . . . . . . . . . . . . . . . . . . . . . . . . . . . . . . . . . . . . . . . . . . . . . . . . . . . . . . . .66.7 Don't use internet . . . . . . . . . . . . . . . . . . . . . . . . . . . . . . . . . . . . . . . . . . . . . . . . . . . . . . . . . . . . . . . . . . . . .68.0
Main source of income Respondents aged 55 years and over
Salary, wages or business income . . . . . . . . . . . . . . . . . . . . . . . . . . . . . . . . . . . . . . . . . . . . . . . . . . . . . . . . . . . . . . . . . . . . .88.9 Access internet at all . . . . . . . . . . . . . . . . . . . . . . . . . . . . . . . . . . . . . . . . . . . . . . . . . . . . . . . . . . . . . . . . . . . . .88.7
Goverment benefit or payment . . . . . . . . . . . . . . . . . . . . . . . . . . . . . . . . . . . . . . . . . . . . . . . . . . . . . . . . . . . . . . . . . . . . .67.2 Don't use internet . . . . . . . . . . . . . . . . . . . . . . . . . . . . . . . . . . . . . . . . . . . . . . . . . . . . . . . . . . . . . . . . . . . . .62.7
Retired, government benefit . . . . . . . . . . . . . . . . . . . . . . . . . . . . . . . . . . . . . . . . . . . . . . . . . . . . . . . . . . . . . . . . . . . . .66.0
Retired, other source of income . . . . . . . . . . . . . . . . . . . . . . . . . . . . . . . . . . . . . . . . . . . . . . . . . . . . . . . . . . . . . . . . . . . . .81.8
SEIFA classificaton (Index of Relative Socio-
economic Disadvantage)

ANZ Survey of Adult Financial Literacy in Australia (2008) 12
The Social Research Centre
2.4 Financial literacy and behaviour This section of the report describes some of the key behavioural differences between respondents with relatively high (quintile five) and those with relatively low (quintile one) financial literacy. Table 2.4a compares the use of various sources of financial information and advice by these two quintiles. In looking at the results, it should be kept in mind that socio-economic factors can influence a person’s need for financial services and information. For example, those with household incomes below $25,000 per annum would perhaps be less likely to need the services of a financial planner than those with household incomes of $150,000 or more. With that in mind, we note the following:
Members of quintile five were significantly more likely than those in quintile one to have read such financial publications as the financial sections of newspapers and magazines (63% versus 22%), books and other publications dealing with financial matters (44% versus 13%) and finance industry publications (44% versus 13%).
They were also more likely to have visited financial websites (46% versus 12%) and to have attended seminars on financial topics (23% versus 8%).
Table 2.4a Financial literacy and use of advisory/information sources
Financial Literacy and BEHAVIOURTotal
Sample
Quintile
One
Quintile
Five
% % %
Self-education
Base: Total Sample (n=3,500) (n=690) (n=676)
Publications/Seminars used in last 5 yrs
Any of these . . . . . . . . . . . . . . . . . . . . . . . . . . . . . . . . . . . . . . . . . . . . . . . . . . . . . . . . . . . . . . . . . . . . .60 38 81
Financial sections - newspapers/magazines . . . . . . . . . . . . . . . . . . . . . . . . . . . . . . . . . . . . . . . . . . . . . . . . . . . . . . . . . . . . . . . . . . . . .42 22 63
Books/other financial publications . . . . . . . . . . . . . . . . . . . . . . . . . . . . . . . . . . . . . . . . . . . . . . . . . . . . . . . . . . . . . . . . . . . . .26 13 44
Internet finance sites . . . . . . . . . . . . . . . . . . . . . . . . . . . . . . . . . . . . . . . . . . . . . . . . . . . . . . . . . . . . . . . . . . . . .27 12 46
Finance industry publications . . . . . . . . . . . . . . . . . . . . . . . . . . . . . . . . . . . . . . . . . . . . . . . . . . . . . . . . . . . . . . . . . . . . .27 13 44
Government finance publications . . . . . . . . . . . . . . . . . . . . . . . . . . . . . . . . . . . . . . . . . . . . . . . . . . . . . . . . . . . . . . . . . . . . .23 12 34
Community organisation publications . . . . . . . . . . . . . . . . . . . . . . . . . . . . . . . . . . . . . . . . . . . . . . . . . . . . . . . . . . . . . . . . . . . . .12 10 16
Seminars . . . . . . . . . . . . . . . . . . . . . . . . . . . . . . . . . . . . . . . . . . . . . . . . . . . . . . . . . . . . . . . . . . . . .15 8 23
Financial advisers/specialists used
Used any of these sources of advice . . . . . . . . . . . . . . . . . . . . . . . . . . . . . . . . . . . . . . . . . . . . . . . . . . . . . . . . . . . . . . . . . . . . .85 73 93
Used a financial management/planning specialist . . . . . . . . . .. . . . . . . . . . .. . . . . . 64 43 80
An accountant . . . . . . . . . . . . . . . . . . . . . . . . . . . . . . . . . . . . . . . . . . . . . . . . . . . . . . . . . . . . . . . . . . . . .45 29 63
Tax specialist . . . . . . . . . . . . . . . . . . . . . . . . . . . . . . . . . . . . . . . . . . . . . . . . . . . . . . . . . . . . . . . . . . . . .26 16 32
Financial planner/adviser . . . . . . . . . . . . . . . . . . . . . . . . . . . . . . . . . . . . . . . . . . . . . . . . . . . . . . . . . . . . . . . . . . . . .34 21 50
A mortgage broker . . . . . . . . . . . . . . . . . . . . . . . . . . . . . . . . . . . . . . . . . . . . . . . . . . . . . . . . . . . . . . . . . . . . .18 7 25
An insurance broker . . . . . . . . . . . . . . . . . . . . . . . . . . . . . . . . . . . . . . . . . . . . . . . . . . . . . . . . . . . . . . . . . . . . .12 5 19
A stock broker . . . . . . . . . . . . . . . . . . . . . . . . . . . . . . . . . . . . . . . . . . . . . . . . . . . . . . . . . . . . . . . . . . . . .10 5 14
Bank manager/employee . . . . . . . . . . . . . . . . . . . . . . . . . . . . . . . . . . . . . . . . . . . . . . . . . . . . . . . . . . . . . . . . . . . . .39 30 45
Family/friends . . . . . . . . . . . . . . . . . . . . . . . . . . . . . . . . . . . . . . . . . . . . . . . . . . . . . . . . . . . . . . . . . . . . .47 39 53
Centrelink financial information service officers . . . . . . . . . . . . . . . . . . . . . . . . . . . . . . . . . . . . . . . . . . . . . . . . . . . . . . . . . . . . . . . . . . . . .11 16 7
Use of ratings agencies/organisations
Base: Total Sample (n=1,205) (n=238) (n=237)
Either of these . . . . . . . . . . . . . . . . . . . . . . . . . . . . . . . . . . . . . . . . . . . . . . . . . . . . . . . . . . . . . . . . . . . . .23 12 35
Financial products rating agency . . . . . . . . . . . . . . . . . . . . . . . . . . . . . . . . . . . . . . . . . . . . . . . . . . . . . . . . . . . . . . . . . . . . .6 3 15
An organisation like the Australian Consumers'
Association or their magazine " Choice " . . . . . . . . . . . . . . . . . . . . . . . . . . . . . . . . . . . . . . . . . . . . . . . . . . . . . . . . . . . . . . . . . . . . .19 11 24
Literacy Quintile

ANZ Survey of Adult Financial Literacy in Australia (2008) 13
The Social Research Centre
Members of quintile five were also significantly more likely than members of quintile one to have obtained financial advice from various people, particularly specialists in financial management and planning such as accountants (63% versus 29%), tax specialists (32% versus 16%) and financial planners/advisers (50% versus 21%). The only source of advice members of quintile one were more likely to have used was a Centrelink financial information service officer (16% versus 7% of quintile five).
Quintile five members were also more likely to have used product rating agencies and organisations than were members of quintile one (35% versus 12%).
Table 2.4b compares quintiles one and five on several other financial behaviours which might be expected to show some association with financial literacy. From this table it can be seen that members of quintile five:
Were more likely to have taken steps to minimise their everyday banking fees; and
Were more likely to comparison shop when taking out financial products such as an everyday banking account, a mortgage or other type of loan or an insurance policy.
Table 2.4b Financial literacy and other financial behaviour
Financial Literacy and BEHAVIOURTotal
Sample
Quintile
One
Quintile
Five
% % %
Steps taken to minimise everyday banking fees
Base: Total Sample (n=1,176) (n=230) (n=226)
None /Can't say what steps are taken . . . . . . . . . . . . . . . . . . . . . . . . . . . . . . . . . . . . . . . . . . . . . . . . . . . . . . . . . . . . . . . . . . . . .19 32 9
Take some steps to minimise fees . . . . . . . . . . . . . . . . . . . . . . . . . . . . . . . . . . . . . . . . . . . . . . . . . . . . . . . . . . . . . . . . . . . . .81 68 91
Comparison shopping for new financial products
Shop around "at all" for the following products
Base: Have arranged an everyday banking account (n=1,065) (n=202) (n=211)
Everyday banking account . . . . . . . . . . . . . . . . . . . . . . . . . . . . . . . . . . . . . . . . . . . . . . . . . . . . . . . . . . . . . . . . . . . . .65 49 77
Base: Arranged mortgage on home/investment property (n=1,279) (n=125) (n=349)
Mortgage . . . . . . . . . . . . . . . . . . . . . . . . . . . . . . . . . . . . . . . . . . . . . . . . . . . . . . . . . . . . . . . . . . . . .73 59 80
Base: Have arranged insurance policy (n=1,052) (n=178) (n=216)
Insurance . . . . . . . . . . . . . . . . . . . . . . . . . . . . . . . . . . . . . . . . . . . . . . . . . . . . . . . . . . . . . . . . . . . . .75 56 87
Literacy Quintile

ANZ Survey of Adult Financial Literacy in Australia (2008) 14
The Social Research Centre
2.5 Financial literacy and ownership of financial products Finally this section provides an overview of financial product ownership by members of quintile one and quintile five. As shown in Table 2.5a:
Members of quintile one were less likely than those from quintile five to hold a high interest savings account such as a cash management account, bonus saver or on-line savings account (29% versus 60%). However, they were no less likely to have a term deposit and, while slightly lower than for quintile five, 95% held an everyday savings account (and 97% have either an everyday account or a high interest savings account - that is, an account that can be used for transacting purposes)
Table 2.5a Financial literacy and ownership of financial products
Financial Literacy and Financial Product
OwnershipTotal
Sample
Quintile
One
Quintile
Five
% % %
Base: Total Sample (n=3,500) (n=690) (n=676)
Transacting and Deposit accounts
Ordinary or everyday account . . . . . . . . . . . . . . . . . . . . . . . . . . . . . . . . . . . . . . 97 95 98
High interest savings account . . . . . . . . . . . . . . . . . . . . . . . . . . . . . . . . . . . . . . . . 46 29 60
Term deposit . . . . . . . . . . . . . . . . . . . . . . . . . . . . . . . . . . . . . . . . 20 20 21
Investments
Any superannuation fund . . . . . . . . . . . . . . . . . . . . . . . . . . . . . . . . 76 45 98
Self-managed superannuation fund . . . . . . . . . . . . . . . . . . . . . . . . . . . . . . . . 10 6 16
Shares . . . . . . . . . . . . . . . . . . . . . . . . . . . . . . . . . . . . . . . . 38 23 54
Managed investments other than superannuation . . . . . . . . . . . . . . . . . . . . . . . . . . . . . . . . . . . . . .20 14 27
Investment property . . . . . . . . . . . . . . . . . . . . . . . . . . . . . . . . 19 11 28
Other investments (eg: debentures, bonds, etc) . . . . . . . . . . . . . . . 4 2 5
Base: All aged 55 years or over (n=1303) (n=366) (n=189)
Retirement income stream product . . . . . . . . . . . . . . . . . . . . . . . . . . . . . . . . . . . . . 20 13 28
Base: Total Sample (n=3,500) (n=690) (n=676)
Loans/Credit products
Mortgage on own home . . . . . . . . . . . . . . . . . . . . . . . . . . . . . . . . . . . . . . 34 18 48
Mortgage on investment property . . . . . . . . . . . . . . . . . . . . . . . . . . . . . . . . . . . . . . 11 5 18
Personal loan . . . . . . . . . . . . . . . . . . . . . . . . . . . . . . . . . . . . . . 17 13 17
Line of credit or overdraft . . . . . . . . . . . . . . . . . . . . . . . . . . . . . . . . . . . . . . 14 9 18
Lease or hire purchase agreement . . . . . . . . . . . . . . . . . . . . . . . . . . . . . . . . . . . . . . 9 6 11
Home equity loan . . . . . . . . . . . . . . . . . . . . . . . . . . . . . . . . . . . . . . 7 4 12
Margin loan . . . . . . . . . . . . . . . . . . . . . . . . . . . . . . . . . . . . . . 2 1 5
Equity release product . . . . . . . . . . . . . . . . . . . . . . . . . . . . . . . . . . . . . . 2 1 2
Credit card . . . . . . . . . . . . . . . . . . . . . . . . . . . . . . . . . . . . . . 65 48 81
Store card . . . . . . . . . . . . . . . . . . . . . . . . . . . . . . . . . . . . . . 13 12 13
Insurance
Private health insurance . . . . . . . . . . . . . . . . . . . . . . . . . . . . . . . . . . . . . . 55 39 72
Life insurance . . . . . . . . . . . . . . . . . . . . . . . . . . . . . . . . . . . . . . 34 21 49
Base: Own/Buying/Renting a home (n=3413) (n=660) (n=665)
Contents insurance . . . . . . . . . . . . . . . . . . . . . . . . . . . . . . . . . . . . . . 74 60 88
Base: Own/Buying a home (n=2579) (n=440) (n=562)
Building insurance . . . . . . . . . . . . . . . . . . . . . . . . . . . . . . . . . . . . . . 80 70 88
Base: Own/Buying a motor vehicle (n=2804) (n=462) (n=591)
Comprehensive motor vehicle insurance . . . . . . . . . . . . . . . . . . . . . . . . . . . . . . . . . . . . . .87 79 93
Third party motor vehicle insurance only . . . . . . . . . . . . . . . . . . . . . . . . . . . . . . . . . . . . . .10 14 6
Base: Working full-time (n=1434) (n=157) (n=387)
Income protection insurance . . . . . . . . . . . . . . . . . . . . . . . . . . . . . . . . . . . . . . 30 16 35
Literacy Quintile

ANZ Survey of Adult Financial Literacy in Australia (2008) 15
The Social Research Centre
Members of quintile one were less likely to have investments than were members of quintile five. Nevertheless, six percent of quintile one reported having a self-managed superannuation fund, less than for quintile five (16%) but still representing around 1% of the total adult population
With the exception of store cards and equity release products such as reverse mortgages and shared appreciation mortgages, members of quintile one were less likely than those from quintile five to make use of debt products such as mortgages, other loans and credit cards
They were also less likely to have insurance with:
o Only 60% of those who either owned their home outright, were paying it off or were renting the home they live in having contents insurance;
o Seventy percent of those who either owned their home or who were purchasing it had building insurance; and
o Amongst quintile one motor vehicle owners, 79% had comprehensive vehicle insurance (versus 93% of quintile five motor vehicle owners). However, they were more likely than members of quintile five to have third party vehicle insurance instead (14% versus 6%) and, as a result, were only slightly less likely than those in quintile five to have at least some form of motor vehicle insurance suggesting the need for vehicle insurance beyond the compulsory component is both widely understood and acted on.

ANZ Survey of Adult Financial Literacy in Australia (2008) 16
The Social Research Centre
Section 3 Use and Understanding of Payment and Transacting Methods
3.1 Introduction and key findings This section of the report examines the community’s use and understanding of various transaction methods used when paying for goods and services.
The understanding and use of transaction methods is important as those with greater knowledge of, and access to, the financial transacting system are more likely to achieve efficient and cost-effective outcomes when paying for goods and services.
Conversely, consumers with limited knowledge and access to the system may be disadvantaged in terms of transaction costs and personal convenience.
Key findings
Since 2002 there has been significant growth in the use and understanding of electronic transaction methods. In particular, there have been increases of 23 percentage points in the use of internet banking (to 51%), 16 points in the use of BPay (to 52%) and 14 points in the use of direct debit (to 64%).
However, people with lower financial literacy scores (members of quintiles one and two) make considerably less use of electronic transacting methods than do those whose financial literacy scores are in the top 40% of the population. This appears to be at least partly age related as those aged 70 years or more, (who are over-represented in the lower financial literacy groups), make significantly less use of all electronic methods. Socio-economic factors appear less of an issue although there is evidence of less use of internet banking, BPay and phone banking amongst those 18-54 year olds whose household income is less than $25,000.
Methods of payment where the incidence of use by those from quintile one is either higher than or at the same level as those from quintile five included money orders, layby and loans from family or friends or from payday lenders.

ANZ Survey of Adult Financial Literacy in Australia (2008) 17
The Social Research Centre
3.2 Use and understanding of methods of payment/transacting All respondents were asked if they used the methods of payment and transacting listed in Table 3.2a to pay for goods and services. For any method that was not used, respondents were subsequently asked if they knew how to use it with the total results for those who either used or knew how to use each method shown in Table 3.2c.
Current use of payment/transacting methods
Almost all respondents (92%) said they used cash with well over half also reporting the use of ATMs (80%), EFTPOS (76%), credit cards (65%) and direct debit payments (64%). In addition, just on one in two respondents said they used BPay (52%) and internet banking (51%).
Methods used by relatively few respondents included loans from family or friends (10%), store cards (13%), money orders (20%) and layby (25%).
Changes evident since 2002 include increased use of most electronic methods of payment and transacting, particularly internet banking (up 23 points from 28% to 51%), BPay (up 16 points to 52%) and direct debit (up 14 points to 64%) and, to a lesser extent, ATMs (up 7 points to 80%) and EFTPOS (up 5 points to 76%). There was also a slight increase (up 3 points to 38%) in the use of loans from financial institutions to pay for goods and services.
Decreases were evident in the use of cheques (down 7 points from 46% to 39%), telephone banking (down 4 points to 32%), probably the result of competition from internet banking, and cash (down 4 points to 92%).
Table 3.2a Methods of payment/transacting used by respondents
Methods of payment/transacting 2002 2005 2008
Base: Total sample (n=3548) (n=3513) (n=3500)
% % %
Cash . . . . . . . . . . . . . . . . . . . . . . . . . . . . . . . . . . . . . . . . . . . . . . . . . . . . . . . . . . . . . . . . . . . . . . . . . . . . . 96 95 92
Electronic transacting
ATM . . . . . . . . . . . . . . . . . . . . . . . . . . . . . . . . . . . . . . . . . . . . . . . . . . . . . . . . . . . . . . . . . . . . . . . . . . . . . . . . 73 78 80
EFTPOS . . . . . . . . . . . . . . . . . . . . . . . . . . . . . . . . . . . . . . . . . . . . . . . . . . . . . . . . . . . . . . . . . . . . . . . . . . . . . . . . 71 74 76
Direct debit . . . . . . . . . . . . . . . . . . . . . . . . . . . . . . . . . . . . . . . . . . . . . . . . . . . . . . . . . . . . . . . . . . . . . . . . . . . . . 50 60 64
Bpay . . . . . . . . . . . . . . . . . . . . . . . . . . . . . . . . . . . . . . . . . . . . . . . . . . . . . . . . . . . . . . . . . . . . . . . . . . . . . . . . 36 46 52
Internet banking . . . . . . . . . . . . . . . . . . . . . . . . . . . . . . . . . . . . . . . . . . . . . . . . . . . . . . . . . . . . . . . . . . . . . . . . 28 40 51
Telephone banking . . . . . . . . . . . . . . . . . . . . . . . . . . . . . . . . . . . . . . . . . . . . . . . . . . . . . . . . . . . . . . . . . . . . . . 36 36 32
Credit cards and loans
Credit card . . . . . . . . . . . . . . . . . . . . . . . . . . . . . . . . . . . . . . . . . . . . . . . . . . . . . . . . . . . . . . . . . . . . . . . . 64 68 65
Loans from financial institutions . . . . . . . . . . . . . . . . . . . . . . . . . . . . . . . . . . . . . . . . . . . . . . . . . . . . . . . 35 36 38
Store card . . . . . . . . . . . . . . . . . . . . . . . . . . . . . . . . . . . . . . . . . . . . . . . . . . . . . . . . . . . . . . . . . . . . . . . . . . . . . . 15 16 13
Loans from family/friends . . . . . . . . . . . . . . . . . . . . . . . . . . . . . . . . . . . . . . . . . . . . . . . . . . . . . . . . . . . . . . . . . . . . . . . . . . . . . . na na 10
Payday loans . . . . . . . . . . . . . . . . . . . . . . . . . . . . . . . . . . . . . . . . . . . . . . . . . . . . . . . . . . . . . . . . . . . . . . . . . . . . . . na na 2
Cheques, layby and money orders
Cheque . . . . . . . . . . . . . . . . . . . . . . . . . . . . . . . . . . . . . . . . . . . . . . . . . . . . . . . . . . . . . . . . . . . . . . . . . . . . . . 46 44 39
Layby . . . . . . . . . . . . . . . . . . . . . . . . . . . . . . . . . . . . . . . . . . . . . . . . . . . . . . . . . . . . . . . . . . . . . . . . . . . . . . 27 27 25
Money order . . . . . . . . . . . . . . . . . . . . . . . . . . . . . . . . . . . . . . . . . . . . . . . . . . . . . . . . . . . . . . . . . . . . . . . . . . . . . . 20 21 20
Methods currently used
Prompted question, multiple responses allowed.
Use of loans from family or friends and payday lenders were asked for the first time in 2008.
I’d like to talk about ways of paying for goods and services.
Which of the following payment methods do you use?

ANZ Survey of Adult Financial Literacy in Australia (2008) 18
The Social Research Centre
Use of payment and transacting methods by population subgroups
There were differences between demographic and socio-economic subgroups in the use of transacting and payment methods. These included the following.
Electronic methods
For the most part, differences in the use of electronic payment and transacting methods were associated with the age of the respondent. Thus:
Use of ATMs and EFTPOS was higher amongst those aged under 45 years (88% for both channels) than it was amongst those aged 45 years or over (72% for ATMs and 66% for EFTPOS). Use of both these channels was particularly low amongst people aged 70 years or over, 52% of whom used ATMs and 39% used EFTPOS.
Internet banking was also used more often by under 45’s (67%) than by those aged 45 years or over (36%). Females aged 70 years or over were the people least likely to use internet banking - only 5% reported doing so, significantly less than the 21% of males in this age category who said they used internet banking.
Direct debit and BPay both saw the age of users shift to a slightly older demographic. Those aged 18 to 24 years, who might be expected to make less use of these channels to pay bills for household utilities and services, were less likely than average to say they used either direct debit (54%) or BPay (38%). People aged 25 to 44 years were the most likely to use BPay (67%) while use of direct debit was high across a relatively broad age range of 25 to 59 years (71%).
Use of telephone banking was comparatively high across the broad age range of 25-59 years (37%). However, people of this age were still significantly more likely to use internet banking (60%). By contrast, those aged over 60 were just as likely to use telephone banking (23%) as they were to use internet banking (21%). These results suggest that, as the population ages, the preference for internet banking amongst younger people is likely to see the use of phone banking decline further in the future.
Credit/store cards and loans
Use of credit and store cards also appeared to be driven by respondents’ age (and related to this, differing transaction volumes) but also by level of income (and related to this, the ability to qualify for a card). Thus:
Reported use of credit cards was lowest amongst 18-24 year olds (32%) and those aged 70 years or over (57%). People with annual household incomes of less than $58,000 were also less likely to be using a credit card (54%).
Store cards were a little different in that there was some degree of gender bias in their use. Females (16%) were more likely to use these cards than males (10%), particularly females aged 35 to 69 years (18%). However, there was no clear association between household income and the reported use of store cards.
Loans from financial institutions were most likely to be used by people aged 25 to 49 years (49%) and people with household incomes of $80,000 or more (55%). Males (41%) were also slightly more likely than females (35%) to report using a loan from a financial institution to pay for goods and services.
Loans from family or friends were most likely to be used by younger people aged 18-24 years (25%) and, to a lesser extent, those aged 25-34 years (14%).
Other methods of transacting/paying for goods and services
Subgroup results for the four other methods of payment (cheque, money order, layby and payday loans) were as follows:
Use of cheques was most likely to be reported by older people (53% of those aged 45 years or over versus 24% of under 45’s), particularly those aged 45 years or more who had annual household incomes of at least $80,000 (61%) and who were working in upper white collar occupations (62%).

ANZ Survey of Adult Financial Literacy in Australia (2008) 19
The Social Research Centre
Money orders were used most often by those living in areas of relatively high socio-economic disadvantage (SEIFA groups 1 and 2 - both 26%) and those whose schooling did not extend beyond Year 10 (25%).
Reported use of layby was more prevalent amongst females (33%) than males (18%), particularly those females who were less than 60 years of age (37%), who were single parents (49%) but not those women working in upper white collar occupations (24%).
Use of payday loans was low (2%) with users most likely to be young (4% amongst 18-24 year olds) and of relatively lower financial literacy (3% amongst members of quintile one).
Use of payment/transacting methods and financial literacy
The relationship between methods used to pay for goods and services and financial literacy is presented in Table 3.2b.
No relationship was evident between financial literacy and the use of cash
There was a broad trend of increasing use of electronic methods as financial literacy increases. These methods were least likely to be used by members of quintile one and most likely to be used by quintile five. However, BPay and internet banking were the only channels where a significant difference existed in the level of use between every quintile and the next. For other electronic methods, differentiation was less marked with, for example, no significant difference evident between quintiles three, four and five in their reported use of ATMs.
There also appeared to be direct relationships between financial literacy and the use of credit cards and loans from financial institutions. It should be kept in mind however that those with lower financial literacy scores also tended to report lower levels of income and consequently were less likely to satisfy eligibility criteria for these products. Neither the use of store cards (no significant differences between any of the financial literacy quintiles) nor loans from family and friends (most likely to be used by members of quintile two) showed a clear relationship with financial literacy.
Table 3.2b Methods of payment/transacting used and financial literacy
Methods of payment/transacting Total One Two Three Four FiveBase: Total Sample (n=3500) (n=696) (n=682) (n=710) (n=740) (n=672)
% % % % % %
Cash . . . . . . . . . . . . . . . . . . . . . . . . . . . . . . . . . . . . . . . . . . . . . . . . . .92 93 92 93 92 93
Electronic transacting
ATMs . . . . . . . . . . . . . . . . . . . . . . . . . . . . . . . . . . . . . . . . . . .80 70 79 83 83 86
EFTPOS . . . . . . . . . . . . . . . . . . . . . . . . . . . . . . . . . . . . . . . . . . .76 63 75 79 80 84
Direct Debit . . . . . . . . . . . . . . . . . . . . . . . . . . . . . . . . . . . . . . . . . . .64 48 59 67 70 75
Bpay . . . . . . . . . . . . . . . . . . . . . . . . . . . . . . . . . . . . . . . . . . .52 31 42 54 64 70
Internet Banking . . . . . . . . . . . . . . . . . . . . . . . . . . . . . . . . . . . . . . . . . . .51 26 41 54 63 70
Telephone Banking . . . . . . . . . . . . . . . . . . . . . . . . . . . . . . . . . . . . . . . . . . .32 21 27 34 38 40
Credit cards and loans
Credit cards . . . . . . . . . . . . . . . . . . . . . . . . . . . . . . . . . . . . . . . . . . .65 48 51 65 78 81
Loans from a financial institution . . . . . . . . . . . . . . . . . . . . . . . . . . . . . . . . . . . . . . . . . . .38 22 27 41 46 54
Store cards . . . . . . . . . . . . . . . . . . . . . . . . . . . . . . . . . . . . . . . . . . .13 12 13 13 15 13
Loans from family or friends . . . . . . . . . . . . . . . . . . . . . . . . . . . . . . . . . . . . . . . . . . .10 10 15 11 8 7
Payday loans . . . . . . . . . . . . . . . . . . . . . . . . . . . . . . . . . . . . . . . . . . .2 3 2 2 <1 1
Cheques, layby and money orders
Cheques . . . . . . . . . . . . . . . . . . . . . . . . . . . . . . . . . . . . . . . . . . .39 32 34 38 42 50
Layby . . . . . . . . . . . . . . . . . . . . . . . . . . . . . . . . . . . . . . . . . . .25 24 31 27 23 22
Money orders . . . . . . . . . . . . . . . . . . . . . . . . . . . . . . . . . . . . . . . . . . .20 25 24 20 18 16
Financial Literacy Quintile

ANZ Survey of Adult Financial Literacy in Australia (2008) 20
The Social Research Centre
Cheques were more likely to be used by those with higher financial literacy scores while those with lower scores were the most likely to use money orders.
The use of layby peaked amongst members of quintiles two and three and was lowest in quintile five. There was no clear relationship, suggesting that factors other than financial literacy (perhaps socio-economic factors) are more important influences on whether or not this method of payment is used.
Payday loans were slightly more likely to be used by members of quintile one (3%). However, use of these loans was evident amongst a few members of quintile five. This issue is discussed further in Section 6.2 later in this report.
Understanding of payment/transacting methods
Table 3.2c presents results from the follow-up question which asked respondents if they knew how to use each of the payment and transacting methods which they did not currently use. As shown:
More than 80% of respondents either used or knew how to use ATMs, EFTPOS, credit cards, cheques, direct debit, layby and money orders.
Slightly fewer, but still a substantial majority used or knew how to use BPay, telephone banking, financial institution loans, store cards and internet banking; while
Fifteen percent used or knew how to use payday loans.
Table 3.2c Methods of payment/transacting respondents either use or know how to use
Methods of payment/transacting 2002 2005 2008
Base: Total sample (n=3548) (n=3513) (n=3500)
% % %
Electronic transacting
ATM . . . . . . . . . . . . . . . . . . . . . . . . . . . . . . . . . . . . . . . . . . . . . . . . . . . . . . . . . . . . . . . . . . . . . . . . . . . . . . . . 91 92 94
EFTPOS . . . . . . . . . . . . . . . . . . . . . . . . . . . . . . . . . . . . . . . . . . . . . . . . . . . . . . . . . . . . . . . . . . . . . . . . . . . . . . . . 89 90 91
Direct debit . . . . . . . . . . . . . . . . . . . . . . . . . . . . . . . . . . . . . . . . . . . . . . . . . . . . . . . . . . . . . . . . . . . . . . . . . . . . . 78 83 87
Bpay . . . . . . . . . . . . . . . . . . . . . . . . . . . . . . . . . . . . . . . . . . . . . . . . . . . . . . . . . . . . . . . . . . . . . . . . . . . . . . . . 60 68 72
Internet banking . . . . . . . . . . . . . . . . . . . . . . . . . . . . . . . . . . . . . . . . . . . . . . . . . . . . . . . . . . . . . . . . . . . . . . . . 52 62 69
Telephone banking . . . . . . . . . . . . . . . . . . . . . . . . . . . . . . . . . . . . . . . . . . . . . . . . . . . . . . . . . . . . . . . . . . . . . . 68 71 72
Credit cards and loans
Credit card . . . . . . . . . . . . . . . . . . . . . . . . . . . . . . . . . . . . . . . . . . . . . . . . . . . . . . . . . . . . . . . . . . . . . . . . 89 92 92
Loans from financial institutions . . . . . . . . . . . . . . . . . . . . . . . . . . . . . . . . . . . . . . . . . . . . . . . . . . . . . . . 71 72 71
Store card . . . . . . . . . . . . . . . . . . . . . . . . . . . . . . . . . . . . . . . . . . . . . . . . . . . . . . . . . . . . . . . . . . . . . . . . . . . . . . 71 71 69
Payday loans . . . . . . . . . . . . . . . . . . . . . . . . . . . . . . . . . . . . . . . . . . . . . . . . . . . . . . . . . . . . . . . . . . . . . . . . . . . . . . na na 15
Cheques, layby and money orders
Cheque . . . . . . . . . . . . . . . . . . . . . . . . . . . . . . . . . . . . . . . . . . . . . . . . . . . . . . . . . . . . . . . . . . . . . . . . . . . . . . 91 90 88
Layby . . . . . . . . . . . . . . . . . . . . . . . . . . . . . . . . . . . . . . . . . . . . . . . . . . . . . . . . . . . . . . . . . . . . . . . . . . . . . . 83 83 83
Money order . . . . . . . . . . . . . . . . . . . . . . . . . . . . . . . . . . . . . . . . . . . . . . . . . . . . . . . . . . . . . . . . . . . . . . . . . . . . . . 82 82 83
NET of actual use and responses to the question:
What other payment methods do you know how to use, even if
you don't use them yourself? (Read out those not being used)
Prompted question, multiple responses allowed. It was not considered appropriate to ask respondents if
they knew how to use cash or loans from family or friends.
Methods either currently
used or know how to use

ANZ Survey of Adult Financial Literacy in Australia (2008) 21
The Social Research Centre
Section 4 Reported Money Management, Budgeting and Planning Behaviour
4.1 Introduction and key findings This section examines respondents’ reported behaviour in terms of their money management and budgeting behaviour. Specifically, attention is given to:
Responsibility for money management within the household,
People’s management of their current financial situation including attitudes and behaviour with respect to saving, budgeting and financial planning, steps taken to minimise fees on everyday banking activities and the ability to deal with a major loss of income, and
Sources of general financial information and advice that people use.
Key findings
Money management and budgeting
Responsibility for household financial management
68% of respondents lived in a household where just one person was responsible for its financial management while 27% lived in a household where this responsibility was shared.
Not all those responsible for financial management exhibited high levels of financial literacy. In particular, single people and single parents who were responsible for their household’s financial management had mean financial literacy scores (females mean FLS 74.6; males mean FLS 80.9) which were below the mean FLS of 83.1 for the total sample.
Saving
Compared to 2002, a higher proportion of respondents in the 2008 survey said they try to save on a regular basis - up from 67% to 72%. This figure rose to 80% amongst those with household incomes of $150,000 pointing to the importance of financial capacity as a factor in reported attitudes towards saving.
By contrast, 10% of respondents said there’s no point trying to save because there’s never enough money, a figure which rose to 20% amongst those whose annual household income was less than $25,000.
From a financial literacy perspective, those in quintiles four (76%) and five (86%) were most likely to say they try and save on a regular basis compared with 59% of those in quintile one.
Budgeting
Insofar as attitudes towards household budgeting were concerned:
o 74% of respondents disagreed they have problems setting money for aside major financial outlays while 24% agreed they have problems doing this. The proportion who agreed they have problems rose to 40% amongst those with household incomes below $25,000 and to 34% amongst members of quintile one.
o 84% of respondents disagreed they spend all of their income as soon as they get it and don’t really plan for the future. Fourteen percent agreed with this statement, a figure which rose to 24% amongst those with household incomes below $25,000 and 23% amongst members of quintile one.
o 76% of respondents kept a close eye on their household and personal expenses with 30% using written records for this purpose. Around one in four (23%) respondents did not keep a close eye on their expenses with males under 35 years of age (34%) and members of quintile one (32%) the most likely to be in this situation.
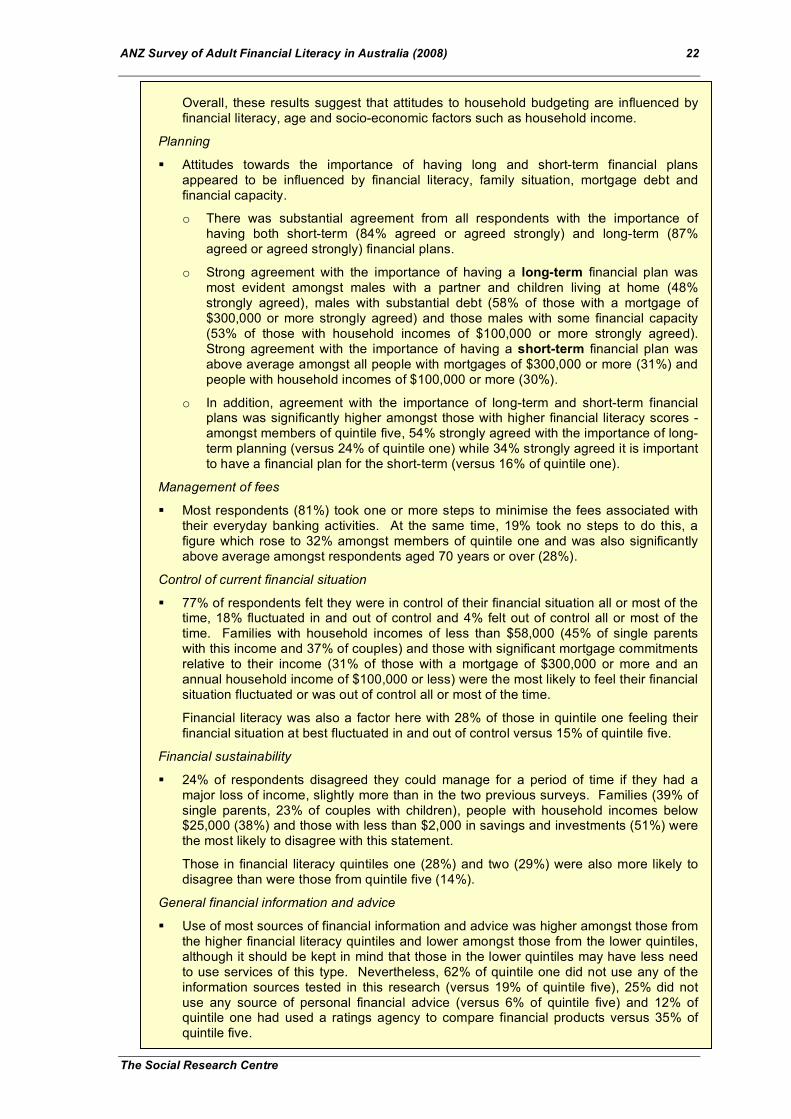
ANZ Survey of Adult Financial Literacy in Australia (2008) 22
The Social Research Centre
Overall, these results suggest that attitudes to household budgeting are influenced by financial literacy, age and socio-economic factors such as household income.
Planning
Attitudes towards the importance of having long and short-term financial plans appeared to be influenced by financial literacy, family situation, mortgage debt and financial capacity.
o There was substantial agreement from all respondents with the importance of having both short-term (84% agreed or agreed strongly) and long-term (87% agreed or agreed strongly) financial plans.
o Strong agreement with the importance of having a long-term financial plan was most evident amongst males with a partner and children living at home (48% strongly agreed), males with substantial debt (58% of those with a mortgage of $300,000 or more strongly agreed) and those males with some financial capacity (53% of those with household incomes of $100,000 or more strongly agreed). Strong agreement with the importance of having a short-term financial plan was above average amongst all people with mortgages of $300,000 or more (31%) and people with household incomes of $100,000 or more (30%).
o In addition, agreement with the importance of long-term and short-term financial plans was significantly higher amongst those with higher financial literacy scores - amongst members of quintile five, 54% strongly agreed with the importance of long-term planning (versus 24% of quintile one) while 34% strongly agreed it is important to have a financial plan for the short-term (versus 16% of quintile one).
Management of fees
Most respondents (81%) took one or more steps to minimise the fees associated with their everyday banking activities. At the same time, 19% took no steps to do this, a figure which rose to 32% amongst members of quintile one and was also significantly above average amongst respondents aged 70 years or over (28%).
Control of current financial situation
77% of respondents felt they were in control of their financial situation all or most of the time, 18% fluctuated in and out of control and 4% felt out of control all or most of the time. Families with household incomes of less than $58,000 (45% of single parents with this income and 37% of couples) and those with significant mortgage commitments relative to their income (31% of those with a mortgage of $300,000 or more and an annual household income of $100,000 or less) were the most likely to feel their financial situation fluctuated or was out of control all or most of the time.
Financial literacy was also a factor here with 28% of those in quintile one feeling their financial situation at best fluctuated in and out of control versus 15% of quintile five.
Financial sustainability
24% of respondents disagreed they could manage for a period of time if they had a major loss of income, slightly more than in the two previous surveys. Families (39% of single parents, 23% of couples with children), people with household incomes below $25,000 (38%) and those with less than $2,000 in savings and investments (51%) were the most likely to disagree with this statement.
Those in financial literacy quintiles one (28%) and two (29%) were also more likely to disagree than were those from quintile five (14%).
General financial information and advice
Use of most sources of financial information and advice was higher amongst those from the higher financial literacy quintiles and lower amongst those from the lower quintiles, although it should be kept in mind that those in the lower quintiles may have less need to use services of this type. Nevertheless, 62% of quintile one did not use any of the information sources tested in this research (versus 19% of quintile five), 25% did not use any source of personal financial advice (versus 6% of quintile five) and 12% of quintile one had used a ratings agency to compare financial products versus 35% of quintile five.

ANZ Survey of Adult Financial Literacy in Australia (2008) 23
The Social Research Centre
4.2 Reported Money Management and Budgeting Behaviour
4.2.1 Responsibility for money management in the household
All respondents were asked who was responsible for money management in their household. This was a prompted question where the response alternatives were read out to respondents. Results for the total sample were similar to those obtained in 200522 with responsibility allocated as follows.
Solely to the respondent - 59% versus 57% in 2005
Solely to the respondent’s partner - 9% versus 7% in 2005
Shared jointly between the respondent and their partner - 27%, slightly lower than the 31% reported in 2005, and
To another person such as another family member – 5% in both 2008 and 2005.
As might be expected, for people living in single person households the respondent was almost always the person responsible for financial management although in 2% of cases, some other person did have this responsibility.
Perhaps of greater interest is the situation of people living in couple households. As shown in Figure 4.2.1a:
For 2% of these people, management of finances was undertaken by another family member or other third party
45% shared the responsibilities jointly, while
For 53%, one member of the couple took sole responsibility for financial management (38% the respondent and 15% the respondent’s partner).
Figure 4.2.1a Responsibility for household financial management in couple households Base: All respondents living in couple households (n=2080) Question: Who is responsible for money management in your household? (Prompted question)
22 This question was not asked in the 2002 survey.
38
15
53
45
2
0
25
50
75
100
Self only Partner only Net: One member of
household
Joint responsibility Other family
member/person

ANZ Survey of Adult Financial Literacy in Australia (2008) 24
The Social Research Centre
Analysis of responsibility for financial management by gender showed that:
Of all female respondents, 65% had sole responsibility for their household’s financial management, 24% shared this responsibility with their partner and for 11% the responsibility lay with their partner or some other person.
Of all male respondents, 52% had sole responsibility, 30% shared the responsibility and 18% did not have any responsibility for the financial management of their household.
Thus, females (65%) were more likely than males (52%) to have sole responsibility for the financial management of their household.
Taking this analysis one step further, Table 4.2.1a examines the financial literacy levels of household financial managers by gender.
It is evident that:
The mean financial literacy score of those with sole or joint responsibility for household financial management was slightly higher than for the total sample (84.5 versus 83.1).
Male financial managers had a higher mean FLS than did females (87.5 versus 81.8). This applied to each of the categories shown in the table - that is, the mean FLS for females who had sole financial responsibility in single person, single parent or shared person households (74.6) was lower than for the corresponding group of males (80.9) and so on.
Finally, while those in couple households had above average FLSs, both males and females living in single person, single parent or shared households had FLSs that were well below the total sample average. In fact, 52% of females living in this type of household fell into either quintile one (28%) or quintile two (24%). Typically these quintile one or two females were older (51% were aged 55 years or over, 31% were aged 70 years or over) with relatively low household incomes (80% less than $58,000, 33% less than $25,000).
Table 4.2.1a Financial literacy and household financial management by gender
Financial Literacy and management of the
household finances 2008
Subgroup
Mean FLS
Total Sample . . . . . . . . . . . . . . . . . . . . . . . . . . . . . . . . . . . . . . . . . . . . . . . . . . . . . . . . . . . . . . . . . . . . .83.1
All sole or joint household financial managers . . . . . . . . . . . . . . . . . . . . . . . . . . . . . . . . . . . . . . . . . . . . . . . . . . . . . . . . . . . . . . . . . . . . .84.5
Household financial manager is …
Female, sole or joint manager. . . . . . . . . . . . . . . . . . . . . . . . . . . . . . . . . . . . . . . . . . 81.8
Sole manager in a single/single parent/shared household . . . . . . . . . . . . . . . . . . . . . . . . . . . . . . . . . . . . . . . . . . . . . . . . . . . . . . . . . . . . . . . . . . . . .74.6
Sole manager in a couple household . . . . . . . . . . . . . . . . . . . . . . . . . . . . . . . . . . . . . . . . . . . . . . . . . . . . . . . . . . . . . . . . . . . . .89.1
Joint manager in a couple household . . . . . . . . . . . . . . . . . . . . . . . . . . . . . . . . . . . . . . . . . . . . . . . . . . . . . . . . . . . . . . . . . . . . .87.0
Male, sole or joint manager. . . . . . . . . . . . . . . . . . . . . . . . . . . . . . . . . . . . . . . . . . 87.5
Sole manager in a single/single parent/shared household . . . . . . . . . . . . . . . . . . . . . . . . . . . . . . . . . . . . . . . . . . . . . . . . . . . . . . . . . . . . . . . . . . . . .80.9
Sole manager in a couple household . . . . . . . . . . . . . . . . . . . . . . . . . . . . . . . . . . . . . . . . . . . . . . . . . . . . . . . . . . . . . . . . . . . . .92.5
Joint manager in a couple household . . . . . . . . . . . . . . . . . . . . . . . . . . . . . . . . . . . . . . . . . . . . . . . . . . . . . . . . . . . . . . . . . . . . .91.1

ANZ Survey of Adult Financial Literacy in Australia (2008) 25
The Social Research Centre
4.2.2 Saving and budgeting - attitudes and behaviour
This section reports on a series of questions designed to assess respondents’ attitudes and self-reported behaviour in relation to saving, budgeting and money management.
Self-reported saving behaviour
Respondents were asked which of the four statements shown in Table 4.4.2a about saving best applied to them. As shown in this table:
Most respondents (72%) reported trying “to save on a regular basis if I possibly can”. Further, since 2002 there has been an increase (from 67% to 72%) in the proportion of respondents who felt this way. As discussed earlier in Section 2.2, those with higher levels of financial literacy were more likely to feel this statement applied to them - 86% of those in quintile five versus 59% of those in quintile one.
It should also be noted that those with lower financial literacy scores were more likely to feel statements such as “there’s no point trying to save because there’s never enough money” (15% of quintile one versus 4% of quintile five) and “saving is not something I need to do” (12% of quintile one versus 4% of quintile five) applied to them.
From a demographic perspective:
o Those aged 18-24 years were more likely to say they “save only when they want to save up for something big or special” (21%), while
o People aged 60 years or over were the most likely to feel “saving is not something they need to do” (14%).
o Those who felt “there’s no point trying to save because there’s never enough money” was the statement which best applied to them were over-represented in SEIFA group one (13%), that is in the group exhibiting the greatest level of socio-economic disadvantage. In line with this, single parents (20%), those with household incomes of less than $25,000 per year (20%) and those for whom government payments was their main source of income (17%) all had an above average proportion of people who felt this statement was the one which applied to them best.
Table 4.2.2a Self-reported savings behaviour
Self-reported savings behaviour 2002 2005 2008
Base: Total Sample (n=3548) (n=1756) (n=3500)
% % %
Which one of the following statements best applies to you?
I try to save on a regular basis if I possibly can. . . . . . . . . . . . . . . . . . . . . . . . . . . . . . . . . . . . . . . . . . . . . . . . . . . . . . . . . . . . . . . . . . .67 69 72
I save only when I want to save up for something big or special . . . . . . . . . . . . . . . . . . . . . . . . . . . . . . . . . . . . . . 12 10 10
There's no point in trying to save because there's never enough money. . . . . . . . . . . . . . . . . . . . . . . . . . . . . . . . . . . . . . . . . . . . . . . . . . . . . . . . . . . . . . . . . . .11 11 10
Saving is not something I need to do . . . . . . . . . . . . . . . . . . . . . . . . . . . . . . . . . . . . . . . . . . . . . . . . . . . . . . . . . . . . . . . . . . .8 8 7
Can't say. . . . . . . . . . . . . . . . . . . . . . . . . . . . . . . . . . . . . . . . . . . . . . . . . . . . . . . . . . . . . . . . . . . . . . . .2 2 1
Survey
Prompted question, multiple responses allowed.
Base: A randomly selected subset of all eligible respondents in 2005, all eligible respondents in 2002 and 2008.

ANZ Survey of Adult Financial Literacy in Australia (2008) 26
The Social Research Centre
Budgeting attitudes and behaviour
Attitudes and behaviour towards budgeting are presented in Table 4.2.2b. Here respondents were asked to state how strongly they agreed or disagreed with two statements “I have problems setting money aside for major financial outlays” and “I spend all of my income as I get it and don’t really plan for the future”. They were also asked which of the four descriptions shown in Table 4.2.2b best described the “extent to which you control your regular household/personal expenses”.
For the first statement, “I have problems setting money aside for major financial outlays”:
Most people (74%) disagreed they have problems doing this while around one in four (24%) agreed with the statement. There has been no significant change in the levels of agreement and disagreement since 2002.
Agreement with this statement was above average (30%) amongst members of SEIFA group one, (that is those with the greatest level of socio-economic disadvantage). In keeping with this, agreement was also well above average amongst those with household incomes of less than $25,000 per year (40%), single parents (40%) and those whose main source of income was government benefits (38%).
Those in financial literacy quintiles one (34%) and two (29%) were also more likely to agree with this statement.
Table 4.2.2b Attitudes towards budgeting
Attitude to budgeting 2002 2005 2008
Base: Total Sample (n=1767) (n=1756) (n=3500)
% % %
I have problems setting money aside for major financial outlays
Strongly agree . . . . . . . . . . . . . . . . . . . . . . . . . . . . . . . . . . . . . . . . . . . . . . . . . . . . . . . . . . . . . . . . . . . . . . . . . . . .5 5 6
Agree . . . . . . . . . . . . . . . . . . . . . . . . . . . . . . . . . . . . . . . . . . . . . . . . . . . . . . . . . . . . . . . . . . . . . . . . . . . .21 19 18
Net: "Agree" . . . . . . . . . . . . . . . . . . . . . . . . . . . . . . . . . . . . . . . . . . . . . . . . . . . . . . . . . . . . . . . . . . . . . . . . . . . .26 24 24
Disagree . . . . . . . . . . . . . . . . . . . . . . . . . . . . . . . . . . . . . . . . . . . . . . . . . . . . . . . . . . . . . . . . . . . . . . . . . . . .52 53 46
Strongly disagree . . . . . . . . . . . . . . . . . . . . . . . . . . . . . . . . . . . . . . . . . . . . . . . . . . . . . . . . . . . . . . . . . . . . . . . . . . . .21 22 28
Net: "Disagree" . . . . . . . . . . . . . . . . . . . . . . . . . . . . . . . . . . . . . . . . . . . . . . . . . . . . . . . . . . . . . . . . . . . . . . . . . . . .73 75 74
Can't say . . . . . . . . . . . . . . . . . . . . . . . . . . . . . . . . . . . . . . . . . . . . . . . . . . . . . . . . . . . . . . . . . . . . . . . . . . . . .1 1 2
I spend all of my income as I get it and don't really plan for the future
Strongly agree . . . . . . . . . . . . . . . . . . . . . . . . . . . . . . . . . . . . . . . . . . . . . . . . . . . . . . . . . . . . . . . . . . . . . . . . . . . .4 2 3
Agree . . . . . . . . . . . . . . . . . . . . . . . . . . . . . . . . . . . . . . . . . . . . . . . . . . . . . . . . . . . . . . . . . . . . . . . . . . . .12 12 11
Net: "Agree" . . . . . . . . . . . . . . . . . . . . . . . . . . . . . . . . . . . . . . . . . . . . . . . . . . . . . . . . . . . . . . . . . . . . . . . . . . . .16 14 14
Disagree . . . . . . . . . . . . . . . . . . . . . . . . . . . . . . . . . . . . . . . . . . . . . . . . . . . . . . . . . . . . . . . . . . . . . . . . . . . .47 49 41
Strongly disagree . . . . . . . . . . . . . . . . . . . . . . . . . . . . . . . . . . . . . . . . . . . . . . . . . . . . . . . . . . . . . . . . . . . . . . . . . . . .36 35 43
Net: "Disagree" . . . . . . . . . . . . . . . . . . . . . . . . . . . . . . . . . . . . . . . . . . . . . . . . . . . . . . . . . . . . . . . . . . . . . . . . . . . .83 84 84
Can't say . . . . . . . . . . . . . . . . . . . . . . . . . . . . . . . . . . . . . . . . . . . . . . . . . . . . . . . . . . . . . . . . . . . . . . . . . . . . .1 2 2
I don't keep an eye on expenses at all. . . . . . . . . . . . . . . . . . . . . . . . . . . . . . . . . . . . . . . . . . . . . . . . . . . . . . . . . . . . . . . . . . .3 5 5
I keep my eye on expenses a bit . . . . . . . . . . . . . . . . . . . . . . . . . . . . . . . . . . . . . . 20 19 18
Without keeping written records I keep a fairly close eye on expenses. . . . . . . . . . . . . . . . . . . . . . . . . . . . . . . . . . . . . . . . . . . . . . . . . . . . . . . . . . . . . . . . . . .47 44 46
I use written records to keep a close eye on expenses . . . . . . . . . . . . . . . . . . . . . . . . . . . . . . . . . . . . . . . . . . . . . . . . . . . . . . . . . . . . . . . . . . .29 32 30
Can't say. . . . . . . . . . . . . . . . . . . . . . . . . . . . . . . . . . . . . . . . . . . . . . . . . . . . . . . . . . . . . . . . . . . . . . . .1 - 1
Survey
Which one of the following best describe the extent to which you
control your regular household/personal expenses
Prompted question.
Base: A randomly selected subset of eligible respondents in 2002 and 2005, all eligible respondents in 2008.

ANZ Survey of Adult Financial Literacy in Australia (2008) 27
The Social Research Centre
For the statement, “I spend all of my income as I get it and don’t really plan for the future”:
84% of respondents disagree while 14% agree with this statement. Again, there has been no significant change since 2002 in levels of agreement and disagreement.
Members of quintiles one (23%) and two (17%) were the most likely to agree with this statement while those from quintiles four (10%) and five (5%) were the least likely to do so.
For the extent of control over expenses:
The great majority (76%) continue to feel they keep a close eye on expenses with 30% using written records for monitoring purposes. Once again, there have been no significant changes since 2002 in the way in which people feel they manage their expenses
Younger males (under 35 years of age) were the least likely to say they keep a close eye on expenses (66%) as were males currently working in lower blue collar occupations (62%) and both males and females whose partner had sole responsibility for managing the household finances (68%). Females aged 45 to 69 years were the most likely to say they keep a close eye on expenses (84%).
Attitudes towards the planning of finances
Results for two statements measuring people’s attitudes towards their perceived personal need for planning their finances are summarised in Table 4.2.2c.
Most respondents agreed with the importance of having both long-term (87%) and short-term (84%) financial plans.
In addition, there has been a significant increase since 2005 in the proportion of respondents who “strongly agree” it is important to have both long-term (up from 31% to 39%) and short-term (up from 23% to 26%) financial plans.
There is a evidence of a strong relationship between financial literacy score and agreement with both statements (long term plan – agreement 24% quintile one versus 54% quintile five; short term plan – agreement 16% quintile one versus 34% in quintile five).
Table 4.2.2c Attitudes towards financial planning
Attitudes to financial planning 2002 2005 2008
Base: Total Sample (n=1767) (n=1756) (n=3500)
% % %
It is important to me to have a long-term financial plan
Strongly agree . . . . . . . . . . . . . . . . . . . . . . . . . . . . . . . . . . . . . . . . . . . . . . . . . . . . . . . . . . . . . . . . . . . . . . . . . . . .38 31 39
Agree . . . . . . . . . . . . . . . . . . . . . . . . . . . . . . . . . . . . . . . . . . . . . . . . . . . . . . . . . . . . . . . . . . . . . . . . . . . .54 53 48
Net: "Agree" . . . . . . . . . . . . . . . . . . . . . . . . . . . . . . . . . . . . . . . . . . . . . . . . . . . . . . . . . . . . . . . . . . . . . . . . . . . .92 84 87
Disagree . . . . . . . . . . . . . . . . . . . . . . . . . . . . . . . . . . . . . . . . . . . . . . . . . . . . . . . . . . . . . . . . . . . . . . . . . . . .5 12 9
Strongly disagree . . . . . . . . . . . . . . . . . . . . . . . . . . . . . . . . . . . . . . . . . . . . . . . . . . . . . . . . . . . . . . . . . . . . . . . . . . . .2 2 2
Net: "Disagree" . . . . . . . . . . . . . . . . . . . . . . . . . . . . . . . . . . . . . . . . . . . . . . . . . . . . . . . . . . . . . . . . . . . . . . . . . . . .7 14 11
Can't say . . . . . . . . . . . . . . . . . . . . . . . . . . . . . . . . . . . . . . . . . . . . . . . . . . . . . . . . . . . . . . . . . . . . . . . . . . . . .1 2 2
It is important to me to have a financial plan for the short-term
Strongly agree . . . . . . . . . . . . . . . . . . . . . . . . . . . . . . . . . . . . . . . . . . . . . . . . . . . . . . . . . . . . . . . . . . . . . . . . . . . .25 23 26
Agree . . . . . . . . . . . . . . . . . . . . . . . . . . . . . . . . . . . . . . . . . . . . . . . . . . . . . . . . . . . . . . . . . . . . . . . . . . . .61 60 58
Net: "Agree" . . . . . . . . . . . . . . . . . . . . . . . . . . . . . . . . . . . . . . . . . . . . . . . . . . . . . . . . . . . . . . . . . . . . . . . . . . . .86 83 84
Disagree . . . . . . . . . . . . . . . . . . . . . . . . . . . . . . . . . . . . . . . . . . . . . . . . . . . . . . . . . . . . . . . . . . . . . . . . . . . .12 14 14
Strongly disagree . . . . . . . . . . . . . . . . . . . . . . . . . . . . . . . . . . . . . . . . . . . . . . . . . . . . . . . . . . . . . . . . . . . . . . . . . . . .1 1 1
Net: "Disagree" . . . . . . . . . . . . . . . . . . . . . . . . . . . . . . . . . . . . . . . . . . . . . . . . . . . . . . . . . . . . . . . . . . . . . . . . . . . .13 15 15
Can't say . . . . . . . . . . . . . . . . . . . . . . . . . . . . . . . . . . . . . . . . . . . . . . . . . . . . . . . . . . . . . . . . . . . . . . . . . . . . .1 2 1
Prompted question.
Base: A randomly selected subset of eligible respondents in 2002 and 2005, all eligible respondents in 2008.
Survey

ANZ Survey of Adult Financial Literacy in Australia (2008) 28
The Social Research Centre
Looking at other demographic and socio-economic subgroups, males (42%) were more likely than females (37%) to strongly agree with the importance of having a long-term financial plan. This applied particularly to the following groups of males –those who have a partner and children living at home (48%), those who have a mortgage of $300,000 or more (58%) and those with a household income of $100,000 or more (53%)
Strong agreement with the importance of having a short-term financial plan was highest amongst all people with a mortgage of $300,000 or more (31%) and people with household incomes of $100,000 or more (30%).

ANZ Survey of Adult Financial Literacy in Australia (2008) 29
The Social Research Centre
4.2.3 Fee minimisation
All respondents were asked what steps they took to minimise the fees and charges relating to their everyday banking. As shown in Table 4.2.3a:
Since 2005 there have been increases in the proportion of people who mention avoiding the use of foreign ATMs (27% versus 15% in 2005), in those using electronic channels such as telephone/internet banking (12% versus 4% in 2005), EFTPOS cash withdrawals (10% versus 4%) and in those minimising their use of branches (9% versus 5%). There were also more mentions of avoiding credit card fees - ensuring minimum monthly payments are made (up 4 points to 9%) and not exceeding card limit (up 6 points to 6%) – avoiding overdrawn account fees (up 3 points to 3%) and allowing transaction account balances to fall below the minimum needed to avoid low balance fees (up 4 points to 9%).
Approximately one in five respondents (19%) were unable to describe any steps taken to minimise everyday banking fees. Those with lower financial literacy scores were the most likely to give this response (32% of quintile one versus 9% of quintile five).
People aged 70 years or over were also more likely to be taking no steps to minimise fees (28%).
Table 4.2.3a Steps taken to minimise fees
Steps taken to minimise fees 2005 2008
Base: Total sample (n=1734) (n=1176)
% %
Management of transactions - number
Minimise the number of transactions I make per month. . . . . . . . . . . . . . . . . . . . . . . . . . . . . . . . . . . . . . 17 17
Keeping the number of transactions I make to my monthly limit. . . . . . . . . . . . . . . . . . . . . . . . . . . . . . . . . . . . . . 15 14
Make fewer but larger cash withdrawals. . . . . . . . . . . . . . . . . . . . . . . . . . . . . . . . . . . . . . 9 12
Management of transactions - channel
Only use ATM's from the same bank as my account. . . . . . . . . . . . . . . . . . . . . . . . . . . . . . . . . . . . . . 15 27
Minimise the number of branch visits . . . . . . . . . . . . . . . . . . . . . . . . . . . . . . . . . . . . . . 5 9
Use telephone/internet banking. . . . . . . . . . . . . . . . . . . . . . . . . . . . . . . . . . . . . . . . . . . . . . . . . . . 4 12
Withdraw cash when paying for other purchases. . . . . . . . . . . . . . . . . . . . . . . . . . . . . . . . . . . . . . 4 10
Use EFTPOS/Debit card. . . . . . . . . . . . . . . . . . . . . . . . . . . . . . . . . . . . . . . . . . . . . . . . . . . 1 3
Management of credit card
Pay off monthly credit card balance in full . . . . . . . . . . . . . . . . . . . . . . . . . . . . . . . . . . . . . . 12 12
Ensure minimum monthly payments are made on my credit card. . . . . . . . . . . . . . . . . . . . . . . . . . . . . . . . . . . . . . 5 9
Don't exceed limit on credit card . . . . . . . . . . . . . . . . . . . . . . . . . . . . . . . . . . . . . . na 6
Type of transacting account
Use no fee/fee exempt accounts. . . . . . . . . . . . . . . . . . . . . . . . . . . . . . . . . . . . . . . . . . . . . . . 6 5
Keep at least the minimum balance in my account. . . . . . . . . . . . . . . . . . . . . . . . . . . . . . . . . . . . . . 4 9
Pay flat account fee which caps monthly charge. . . . . . . . . . . . . . . . . . . . . . . . . . . . . . . . . . . . . . 3 5
Don't overdraw account . . . . . . . . . . . . . . . . . . . . . . . . . . . . . . . . . . . . . . . . . . . . . . . . . . . . . na 3
Other steps taken
Shop around/negotiate. . . . . . . . . . . . . . . . . . . . . . . . . . . . . . . . . . . . . . . . . . . . . . . . . . . . . . . . . . . . 4 4
All other steps taken. . . . . . . . . . . . . . . . . . . . . . . . . . . . . . . . . . . . . . . . . . . . . . . . . . . . . . . . . . . . . . . . . . . . . . . 13 17
None/Don't take any/Don't know . . . . . . . . . . . . . . . . . . . . . . . . . . . . . . . . . . . . . . . . . . . . . . . . . . . . . . . . . .22 19
Survey
Unprompted question, multiple responses allowed. Not asked in 2002.
Base: A randomly selected subset of eligible respondents in 2005 and 2008.

ANZ Survey of Adult Financial Literacy in Australia (2008) 30
The Social Research Centre
4.2.4 Control of current financial situation
All respondents were asked which of the five statements shown in Table 4.2.4a best described how they felt about their current financial situation. As shown in the table:
Most (77%) felt in control of their financial situation either all (33%) or most (44%) of the time. For 18%, the financial situation fluctuated between being in and out of control while 4% felt it was out of control all (1%) or most (3%) of the time.
Despite the less benign financial environment which currently prevails, none of these results has changed significantly since 2005.
Table 4.2.4a Extent to which current financial situation is felt to be under control
Nevertheless, looking at those who did not feel their financial situation was in control all or most of the time (that is, those whose financial situation either fluctuates in and out of control or is out of control all or most of the time), it is noteworthy that people most likely to feel this way were:
o Those with household incomes of less than $58,000 who have children living at home - single parents (45%) and couples (37%)
o Those people who have a mortgage of $300,000 or more and a household income of $100,000 or less (31%).
Families with below average household incomes (that is, below $58,000) and all people with significant mortgage commitments relative to their income appear the most likely to feel their financial situation is out of control for a substantial part of the time.
Control of financial situation 2005 2008
Base: Total Sample (n=3513) (n=3500)
% %
Out of control ALL of the time. . . . . . . . . . . . . . . . . . . . . . . . . . . . . . . . . . . . . . 1 1
Out of control MOST of the time. . . . . . . . . . . . . . . . . . . . . . . . . . . . . . . . . . . . . . 2 3
NET: Out of control. . . . . . . . . . . . . . . . . . . . . . . . . . . . . . . . . . . . . . . . . . . . . . . . . . . . . . . . . . . . . . . . . . . . . . . .3 4
In control ALL of the time. . . . . . . . . . . . . . . . . . . . . . . . . . . . . . . . . . . . . . 34 33
In control MOST of the time. . . . . . . . . . . . . . . . . . . . . . . . . . . . . . . . . . . . . . 45 44
NET: In control. . . . . . . . . . . . . . . . . . . . . . . . . . . . . . . . . . . . . . . . . . . . . . . . . . . . . . . . . . . . . . . . . . . . . . . .79 77
Fluctuates between being in and out of control. . . . . . . . . . . . . . . . . . . . . . . . . . . . . . . . . . . . . . 17 18
Can't say. . . . . . . . . . . . . . . . . . . . . . . . . . . . . . . . . . . . . . . . . . . . . . . . . . . . . . . . . . . . . . . . . . . . . . . .1 1
Survey
Which one of the following statements best describes how you
generally feel about your current financial situation?
Prompted question.

ANZ Survey of Adult Financial Literacy in Australia (2008) 31
The Social Research Centre
4.2.5 Financial sustainability
All respondents were asked about their ability to manage if they suffered a major loss of income. The results are summarised in Figure 4.2.5a which shows that:
74% of respondents agreed they could manage for a period of time if this happened, down slightly from 76% in 2002 and 77% in 2005. Just on one in four (24%) disagreed with the statement.
There has been a slight increase (from 7% to 9%) since the 2002 and 2005 surveys in the proportion who strongly disagree.
Given current concerns about increasing interest rates and the rising prices of petrol and food, these changes are not altogether unexpected.
Total disagreement was highest amongst single parents (39%), couples with children and household incomes of less than $58,000 (32%) people with household incomes of less than $25,000 (38%), people currently working in lower blue collar occupations (31%) those whose main source of income is a government benefit or allowance (36%).
Disagreement was also especially high amongst those with little in the way of financial reserves - 51% of those whose total savings and investments amounted to less than $2,000 disagreed with this statement.
Table 4.2.5a Coping with a major loss of income
Financial sustainability 2002 2005 2008
Base: Total Sample (n=3548) (n=1756) (n=3500)
% % %
If I had a major loss of income I could manage for a period of time
Strongly agree . . . . . . . . . . . . . . . . . . . . . . . . . . . . . . . . . . . . . . . . . . . . . . . . . . . . . . . . . . . . . . . . . . . . . . . . . . . .15 14 18
Agree . . . . . . . . . . . . . . . . . . . . . . . . . . . . . . . . . . . . . . . . . . . . . . . . . . . . . . . . . . . . . . . . . . . . . . . . . . . .61 63 56
Net: "Agree" . . . . . . . . . . . . . . . . . . . . . . . . . . . . . . . . . . . . . . . . . . . . . . . . . . . . . . . . . . . . . . . . . . . . . . . . . . . .76 77 74
Disagree . . . . . . . . . . . . . . . . . . . . . . . . . . . . . . . . . . . . . . . . . . . . . . . . . . . . . . . . . . . . . . . . . . . . . . . . . . . .15 15 15
Strongly disagree . . . . . . . . . . . . . . . . . . . . . . . . . . . . . . . . . . . . . . . . . . . . . . . . . . . . . . . . . . . . . . . . . . . . . . . . . . . .7 7 9
Net: "Disagree" . . . . . . . . . . . . . . . . . . . . . . . . . . . . . . . . . . . . . . . . . . . . . . . . . . . . . . . . . . . . . . . . . . . . . . . . . . . .22 22 24
Can't say . . . . . . . . . . . . . . . . . . . . . . . . . . . . . . . . . . . . . . . . . . . . . . . . . . . . . . . . . . . . . . . . . . . . . . . . . . . . .2 1 2
Survey
Prompted question.
Base: A randomly selected subset of eligible respondents in 2005, all eligible respondents in 2002 and 2008.

ANZ Survey of Adult Financial Literacy in Australia (2008) 32
The Social Research Centre
Respondents were also asked who they would go to if a sudden loss of income caused them difficulty in meeting their financial commitments. As shown in Table 4.2.5b, in these circumstances, people were most likely to turn to:
Their family (46%); or
To a mainstream financial institution such as a bank or credit union (40%).
Some differences were evident between subgroups with:
Younger people aged 18-24 years more likely to go to their family (77%) or friends (15%); and
Those with higher levels of financial literacy more likely to go to a bank or other mainstream financial institution - 57% of those in quintile five compared with 29% of those in quintile one.
Members of quintile one were also more likely than average to say they “didn’t know” who they would go to in this situation (14% compared with 9% of the total sample).
Table 4.2.5b Source of support if sudden loss of income made it difficult to meet financial commitments
Support if loss of income caused difficulty in meeting
financial commitments 2008
%
Base: Total sample (n=1162)
Family or friends
Family . . . . . . . . . . . . . . . . . . . . . . . . . . . . . . . . . . . . . . . . . . . . . . . . . . . . . . . . . . . . . . . . . . . . . . . . . . . 46
Friend . . . . . . . . . . . . . . . . . . . . . . . . . . . . . . . . . . . . . . . . . . . . . . . . . . . . . . . . . . . . . . . . . . . . . . . . . . . 7
Financial institution/organisation
Financial institution (eg: bank or credit union) . . . . . . . . . . . . . . . . . . . . . . . . . . . . . . . . . . . . . . . . . . . . . . . . . . . . . . . . . . . . . . . . . . . . . . . . . . . 40
Pawn broker/Payday lender . . . . . . . . . . . . . . . . . . . . . . . . . . . . . . . . . . . . . . . . . . . . . . . . . . . . . . . . . . . . . . . . . . . . . . . . . . . 1
Professional adviser
Financial planner . . . . . . . . . . . . . . . . . . . . . . . . . . . . . . . . . . . . . . . . . . . . . . . . . . . . . . . . . . . . . . . . . . . . . . . . . . . 9
Accountant . . . . . . . . . . . . . . . . . . . . . . . . . . . . . . . . . . . . . . . . . . . . . . . . . . . . . . . . . . . . . . . . . . . . . . . . . . . 4
Financial counsellor . . . . . . . . . . . . . . . . . . . . . . . . . . . . . . . . . . . . . . . . . . . . . . . . . . . . . . . . . . . . . . . . . . . . . . . . . . . 3
Solicitor . . . . . . . . . . . . . . . . . . . . . . . . . . . . . . . . . . . . . . . . . . . . . . . . . . . . . . . . . . . . . . . . . . . . . . . . . . . 1
Government agency (eg: Centrelink) . . . . . . . . . . . . . . . . . . . . . . . . . . . . . . . . . . . . . . . . . . . . . . . . . . . . . . . . . . . . . . . . . . . . . . . . . . . 8
Charity organisation . . . . . . . . . . . . . . . . . . . . . . . . . . . . . . . . . . . . . . . . . . . . . . . . . . . . . . . . . . . . . . . . . . . . . . . . . . . 2
Other response . . . . . . . . . . . . . . . . . . . . . . . . . . . . . . . . . . . . . . . . . . . . . . . . . . . . . . . . . . . . . . . . . . . . . . . . . . . 5
Wouldn't go to anyone . . . . . . . . . . . . . . . . . . . . . . . . . . . . . . . . . . . . . . . . . . . . . . . . . . . . . . . . . . . . . . . . . . . . . . . . . . . 2
Don't know . . . . . . . . . . . . . . . . . . . . . . . . . . . . . . . . . . . . . . . . . . . . . . . . . . . . . . . . . . . . . . . . . . . . . . . . . . . 9
If a sudden loss of income caused difficulty in meeting your financial
commitments, who would you go to?
Unprompted question, multiple responses allowed.
Base: A randomly selected subset of eligible respondents.

ANZ Survey of Adult Financial Literacy in Australia (2008) 33
The Social Research Centre
4.3 Sources of financial information and advice
4.3.1 Sources of general financial information and advice
Respondents’ use of general financial information was addressed by asking about their use of financial publications and seminars, the extent to which they sought financial advice from finance professionals and others and their use of rating agencies to evaluate financial products and services.
Looking first at the sources of financial information used, Table 4.3.1a presents the proportion of respondents who said they had read or used each of the information sources listed during the last five years. It is evident that:
While the majority of respondents had used one or more of the information sources, 40% had not used any of them, a result which is unchanged since 2005. Those most likely to be in this non-user category were people with lower financial literacy scores (62% of quintile one, 49% of quintile two). In line with the profile of these lower financial literacy groups, non-users of these information sources were most likely to be found amongst:
o People aged 18-24 years (47% of whom did not use any of these information sources) and those aged 70 years or more (50%);
o Females (43% versus 36% of males);
o Those not in paid work (48%) or, if working, employed in lower blue occupations (58%);
o Those with household incomes below $58,000 (50%);
o Those whose schooling did not go beyond Year 10 (57%); and
o Those who were members of the SEIFA groups exhibiting the greatest relative socio-economic disadvantage (49% in group one and 46% in group two).
Table 4.3.1a Use of financial education materials in the last 5 years
Compared to 2005, there were increases in:
o Readership of the financial section of newspapers (up 5 points to 42%), an activity which was particularly prevalent amongst males aged 60 to 69 years (57%); and
Sources of financial information (prompted) 2005 2008
Base: Total Sample (n=3513) (n=3500)
% %
Publications/Seminars used in last 5 years
Financial sections - newspapers/magazines . . . . . . . . . . . . . . . . . . . . . . . . . . . . . . . . . . . . . . . .37 42
Books/other financial publications . . . . . . . . . . . . . . . . . . . . . . . . . . . . . . . . . . . . . . . .27 26
Internet finance sites . . . . . . . . . . . . . . . . . . . . . . . . . . . . . . . . 22 27
Finance industry publications . . . . . . . . . . . . . . . . . . . . . . . . . . . . . . . . . . . . . . . . 30 27
Government finance publications (eg: ASIC, Consumer Affairs) . . . . . . . . . . . . . . . . . . . . . . . . . . . . . . . . . . . . . . . .24 23
Community organisation publications . . . . . . . . . . . . . . . . . . . . . . . . . . . . . . . . . . . . . . . .11 12
Seminars . . . . . . . . . . . . . . . . . . . . . . . . . . . . . . . . . . . . . . . . . . . . . . . . . . . . . . . . . . . . . . . . . . 17 15
Other sources . . . . . . . . . . . . . . . . . . . . . . . . . . . . . . . . . . . . . . . . . . . . . . . . . . . . . . . . . . . . . . . . . . 3 <1
None of these . . . . . . . . . . . . . . . . . . . . . . . . . . . . . . . . . . . . . . . . . . . . . . . . . . . . . . . . . . . . . . . . . . 40 40
Survey
Prompted question, multiple responses allowed. Not asked in 2002.

ANZ Survey of Adult Financial Literacy in Australia (2008) 34
The Social Research Centre
o Use of financial sites on the internet (up 5 points to 27%), an activity most likely to occur amongst males aged 25 to 44 years (39%).
Use of financial advice from others is summarised in Table 4.3.1b. All respondents were asked if they had consulted any of the people shown in the table. As shown:
The vast majority of respondents (86%) had consulted one or more of the people mentioned with financial management or planning specialists and friends or family mentioned most often
14% of respondents had not consulted any of the people mentioned, slightly fewer than in 2005 (17%). Those most likely to be in this category included people with relatively low financial literacy scores (25% of quintile one) and hence were more likely to be found in a similar set of demographic and socio-economic subgroups as those who did not use the sources of information discussed in relation to Table 3.3.6a. The highest proportion of people who had not consulted any of the sources listed in Table 3.3.6b included:
o Those aged 70 years or over (22%)
o Those not in paid work (21%) or, if not in paid work, employed in lower blue collar occupations (19%)
o Those with household incomes below $58,000 (21%)
o Members of SEIFA groups one (20%) and two (18%), and
o Single parents (20%).
Non-use of these sources by 18-24 year olds was not above average here although young people were much more likely to have consulted family or friends (76%) than a financial management/planning specialist like an accountant, tax specialist or financial planner (36%).
Table 4.3.1b Use of financial advice from other people
Sources of financial advice (prompted) 2005 2008
Base: Total Sample (n=3513) (n=3500)
% %
Financial advisers/specialists used
Used a financial management/planning specialist . . . . . . . . . . . . . . . . . . 62 64
Accountant . . . . . . . . . . . . . . . . . . . . . . . . . . . . . . . . . . . . . . . . . . . . . . . . . . . . . . . . . . . . . . . . . . . . . . 44 45
Taxation specialist . . . . . . . . . . . . . . . . . . . . . . . . . . . . . . . . . . . . . . . . . . . . . . . . . . . . . . . . . . . . . . . . . . . . . . 23 26
Financial planner or adviser . . . . . . . . . . . . . . . . . . . . . . . . . . . . . . . . . . . . . . . . . . . . . . . . . . . . . . . . . . . . . . . . . . . . . . 34 34
Mortgage broker . . . . . . . . . . . . . . . . . . . . . . . . . . . . . . . . . . . . . . . . . . . . . . . . . . . . . . . . . . . . . . . . . . . . . . 13 18
Insurance broker . . . . . . . . . . . . . . . . . . . . . . . . . . . . . . . . . . . . . . . . . . . . . . . . . . . . . . . . . . . . . . . . . . . . . . 12 12
Stock broker . . . . . . . . . . . . . . . . . . . . . . . . . . . . . . . . . . . . . . . . . . . . . . . . . . . . . . . . . . . . . . . . . . 10 10
Bank manager or employee . . . . . . . . . . . . . . . . . . . . . . . . . . . . . . . . . . . . . . . . . . . . . . . . . . . . . . . . . . . . . . . . . . . . . . 35 39
Financial counsellor . . . . . . . . . . . . . . . . . . . . . . . . . . . . . . . . . . . . . . . . . . . . . . . . . . . . . . . . . . . . . . . . . . . . . . 13 13
Centrelink Financial Information Service Officer . . . . . . . . . . . . . . . . . . . . . . . . . . . . . . . . . . . . . . . . . . . . . . . . . . . . . . . . . . . . . . . . . . na 11
Family or friends . . . . . . . . . . . . . . . . . . . . . . . . . . . . . . . . . . . . . . . . 45 47
Someone else . . . . . . . . . . . . . . . . . . . . . . . . . . . . . . . . . . . . . . . . . . . . . . . . . . . . . . . . . . . . . . . . . . 2 2
None of these. . . . . . . . . . . . . . . . . . . . . . . . . . . . . . . . . . . . . . . . . . . . . . . . . . . . . . . . . . . . . . . . . . 17 14
Survey
Prompted question, multiple responses allowed. Not asked in 2002.

ANZ Survey of Adult Financial Literacy in Australia (2008) 35
The Social Research Centre
The incidence of consulting specific types of people was largely unchanged since 2005 apart from a significant increase in the proportion who had consulted a mortgage broker (up 5 points to 18%). People aged 25-44 years, those most likely to be in the home buying market, were the most likely to have done this (28%).
There was also an increase in the proportion of people who had obtained financial advice from a bank manager/employee (up 4 points to 39%). Once again, 25-44 year olds were the most likely to have done this (46%), with the need to arrange a home loan possibly a key driver of this behaviour.
There was also a slight increase (from 23% to 26%) in the proportion of respondents who had contacted a tax specialist.
Finally, all respondents were asked whether they had used a financial products rating agency such as Cannex or Morningstar or an organisation such as the Australian Consumers’ Association or its magazine Choice to compare financial products or services. Those who had used either or both types of organisation were asked what types of financial products or services they had compared. As shown in Table 4.3.1c:
A total of 23% of respondents had used either or both of these types of organisation to compare financial products or services – 19% organisations such as the Australian Consumers’ Association and 6% ratings agencies such as Cannex or Morningstar.
Table 4.3.1c Comparison of financial products and services
Comparison of financial products or services 2008
%
Base: Total sample (n=1205)
Financial products rating agency like Cannex or Morningstar . . . . . . . . . . . . . . . . . . . . . . . . . . . . . . . . . . . . . . . . . . . . . . . . . . . . . . . . . . . . . . . . . . . . . . . . . . . 6
Organisation like the Australian Consumers Association or " Choice " . . . . . . . . . . . . . . . . . . . . . . . . . . . . . . . . . . . . . . . . . . . . . . . . . . . . . . . . . . . . . . . . . . . . . . . . . . . 19
Net: Have used either of these types of organisation . . . . . . . . . . . . . . . . . . . . . . . . . . . . . . . . . . . . . . . . . . . . . . . . . . . . . . . . . . . . . . . . . . . . . . . . . . . 23
No haven't used either of these types of organisation . . . . . . . . . . . . . . . . . . . . . . . . . . . . . . . . . . . . . . . . . . . . . . . . . . . . . . . . . . . . . . . . . . . . . . . . . . . 77
Types of financial products or services compared (unprompted)
Base: Have used either of these types of organisation (n=280)
Banking products - loans/accounts/credit cards
Mortgage products/investment loans . . . . . . . . . . . . . . . . . . . . . . . . . . . . . . . . . . . . . . . . . . . . . . . . . . . . . . . . . . . . . . . . . . . . . . . . . . . 25
Everyday banking accounts . . . . . . . . . . . . . . . . . . . . . . . . . . . . . . . . . . . . . . . . . . . . . . . . . . . . . . . . . . . . . . . . . . . . . . . . . . . 16
Credit cards . . . . . . . . . . . . . . . . . . . . . . . . . . . . . . . . . . . . . . . . . . . . . . . . . . . . . . . . . . . . . . . . . . . . . . . . . . . 13
Personal loans . . . . . . . . . . . . . . . . . . . . . . . . . . . . . . . . . . . . . . . . . . . . . . . . . . . . . . . . . . . . . . . . . . . . . . . . . . . 7
On-line savings accounts . . . . . . . . . . . . . . . . . . . . . . . . . . . . . . . . . . . . . . . . . . . . . . . . . . . . . . . . . . . . . . . . . . . . . . . . . . . 4
Superannuation/Investment products or advice
Superannuation funds . . . . . . . . . . . . . . . . . . . . . . . . . . . . . . . . . . . . . . . . . . . . . . . . . . . . . . . . . . . . . . . . . . . . . . . . . . . 20
Managed funds/Managed investments . . . . . . . . . . . . . . . . . . . . . . . . . . . . . . . . . . . . . . . . . . . . . . . . . . . . . . . . . . . . . . . . . . . . . . . . . . . 15
Financial advisers . . . . . . . . . . . . . . . . . . . . . . . . . . . . . . . . . . . . . . . . . . . . . . . . . . . . . . . . . . . . . . . . . . . . . . . . . . . 3
Stocks and shares . . . . . . . . . . . . . . . . . . . . . . . . . . . . . . . . . . . . . . . . . . . . . . . . . . . . . . . . . . . . . . . . . . . . . . . . . . . 3
Retirement income products . . . . . . . . . . . . . . . . . . . . . . . . . . . . . . . . . . . . . . . . . . . . . . . . . . . . . . . . . . . . . . . . . . . . . . . . . . . 1
Other financial products or services
Insurance . . . . . . . . . . . . . . . . . . . . . . . . . . . . . . . . . . . . . . . . . . . . . . . . . . . . . . . . . . . . . . . . . . . . . . . . . . . 23
Other financial products or services . . . . . . . . . . . . . . . . . . . . . . . . . . . . . . . . . . . . . . . . . . . . . . . . . . . . . . . . . . . . . . . . . . . . . . . . . . . 12
Can't recall . . . . . . . . . . . . . . . . . . . . . . . . . . . . . . . . . . . . . . . . . . . . . . . . . . . . . . . . . . . . . . . . . . . . . . . . . . . 14
Have you ever used the following types of organisation to compare
financial products or services? (prompted)
Unprompted question, multiple responses allowed.
Prompted question, multiple responses allowed.
Base: A randomly selected subset of eligible respondents.

ANZ Survey of Adult Financial Literacy in Australia (2008) 36
The Social Research Centre
Use of these types of ratings agencies was lowest amongst those with low levels of financial literacy (12% in quintile one and 16% in quintile two) and significantly higher amongst those with high financial literacy scores (32% in quintile four and 35% in quintile five).
Use was also above average amongst 35-44 year olds (30%), although males in this age group were above average in their use of financial product ratings agencies such as Cannex or Morningstar (14%) while 35-44 year old females made above average use of organisations such as the Australian Consumers’ Association (27%).
Use of ratings agencies was above average amongst those with high household incomes (34% amongst those with household incomes of $150,000 or more), those with a university degree (39%) and those working in upper white collar occupations (35%).

ANZ Survey of Adult Financial Literacy in Australia (2008) 37
The Social Research Centre
Section 5 Transaction Products
5.1 Introduction and key findings This section of the report examines the incidence of everyday banking accounts amongst the population and the extent to which people comparison shop when seeking a new account of this type.
Key findings
Everyday banking accounts continue to be widely held (97% of survey respondents said they had an everyday banking account).
Around two-thirds (65%) of those who had obtained a new everyday banking account shop around to some extent when looking for an account of this type. This proportion was not significantly different from those recorded in the 2002 and 2005 surveys.
Lack of comparison shopping was most evident amongst those exhibiting relatively low levels of financial literacy and amongst older people, particularly those aged 70 years or over.
5.2 Incidence of everyday banking accounts All respondents were asked if they held “an ordinary everyday account with a bank, building society or credit union”. Almost all (97%) responded in the affirmative, a result which matches the incidence of this product type in both the 2002 and 2005 surveys.
Those aged 70 years or over were slightly less likely than average to report having an everyday account. Nevertheless, even in this relatively “low incidence” age group, 95% held an account of this type and 97% said they had either an everyday account or a high interest savings account.
5.3 Obtaining a new everyday banking account All those who held an ordinary everyday account23 were asked to what extent they shop around24 when looking for an account of this type. Those who did not “shop around” at all, were asked why they did not do so. Results are summarised in Table 5.3.1a.
Around two thirds (65%) of those who had obtained a new everyday banking account do at least some comparison shopping when looking for a new account. The overall level of comparison shopping in 2008 was not significantly different from that reported in 2002 (66%) and 2005 (62%) although the proportion saying they “shopped around a little” was slightly higher in 2008 than in either of the earlier surveys.
Against this, just on one in three (34%) do not shop around at all when seeking a new everyday account.
Those most likely to say they do not shop around when looking for an everyday account were:
o Those with lower levels of financial literacy (50% of quintile one compared with 23% of those from quintile five)
o Older people aged 70 years or more (57%)
o Those living in areas of relatively high socio-economic disadvantage (43% amongst those from SEIFA group one) and, reflecting this, those with annual household incomes below $25,000 (48%) and those whose schooling ended at or before Year 10 (49%).
23 Note: Those who had never needed to obtain a new everyday account were excluded from the analysis. 24 This was defined as “… shop around by comparing financial products from different organisations”.
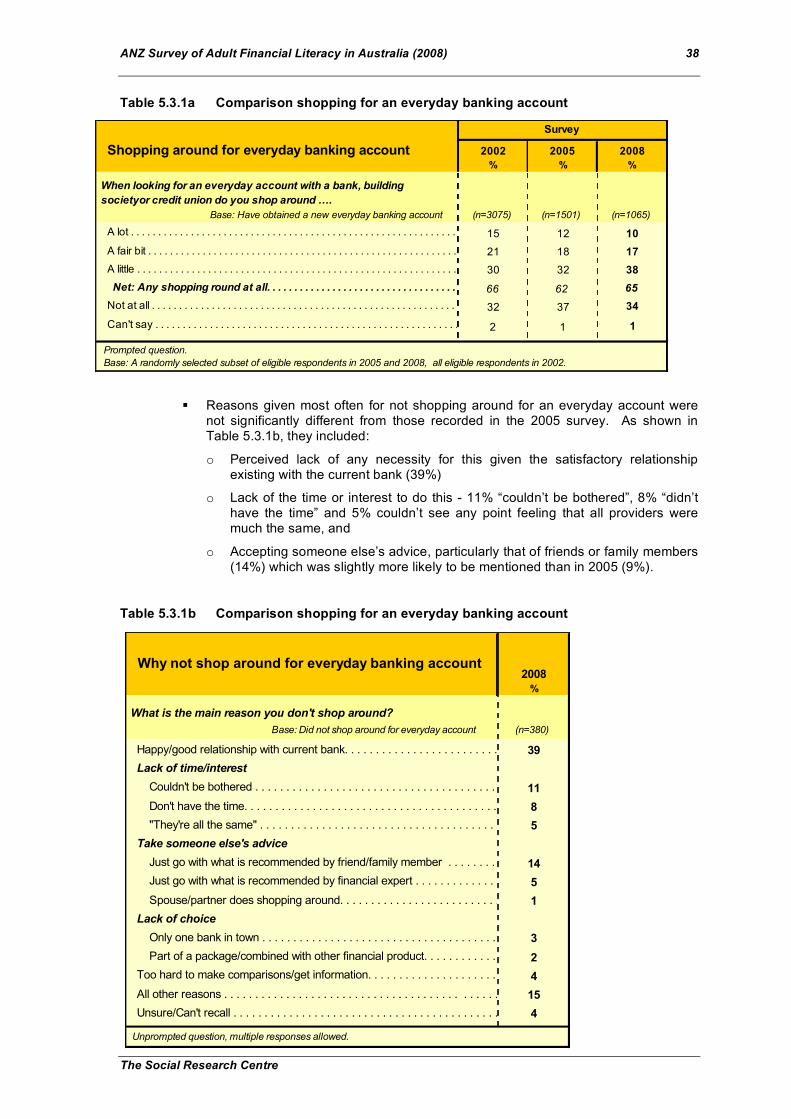
ANZ Survey of Adult Financial Literacy in Australia (2008) 38
The Social Research Centre
Table 5.3.1a Comparison shopping for an everyday banking account
Reasons given most often for not shopping around for an everyday account were not significantly different from those recorded in the 2005 survey. As shown in Table 5.3.1b, they included:
o Perceived lack of any necessity for this given the satisfactory relationship existing with the current bank (39%)
o Lack of the time or interest to do this - 11% “couldn’t be bothered”, 8% “didn’t have the time” and 5% couldn’t see any point feeling that all providers were much the same, and
o Accepting someone else’s advice, particularly that of friends or family members (14%) which was slightly more likely to be mentioned than in 2005 (9%).
Table 5.3.1b Comparison shopping for an everyday banking account
Shopping around for everyday banking account 2002 2005 2008
% % %
Base: Have obtained a new everyday banking account (n=3075) (n=1501) (n=1065)
A lot . . . . . . . . . . . . . . . . . . . . . . . . . . . . . . . . . . . . . . . . . . . . . . . . . . . . . . . . . . . . . . . . . . . . . . . . . 15 12 10
A fair bit . . . . . . . . . . . . . . . . . . . . . . . . . . . . . . . . . . . . . . . . . . . . . . . . . . . . . . . . . . . . . . . .21 18 17
A little . . . . . . . . . . . . . . . . . . . . . . . . . . . . . . . . . . . . . . . . . . . . . . . . . . . . . . . . . . . . . . . . 30 32 38
Net: Any shopping round at all. . . . . . . . . . . . . . . . . . . . . . . . . . . . . . . . . . . . . . . . . . . . . . . . . . . . . . . . . . . . . . . .66 62 65
Not at all . . . . . . . . . . . . . . . . . . . . . . . . . . . . . . . . . . . . . . . . . . . . . . . . . . . . . . . . . . . . . . . .32 37 34
Can't say . . . . . . . . . . . . . . . . . . . . . . . . . . . . . . . . . . . . . . . . . . . . . . . . . . . . . . . . . . . . . . . .2 1 1
Survey
When looking for an everyday account with a bank, building
societyor credit union do you shop around ….
Prompted question.
Base: A randomly selected subset of eligible respondents in 2005 and 2008, all eligible respondents in 2002.
Why not shop around for everyday banking account2008
%
Base: Did not shop around for everyday account (n=380)
Happy/good relationship with current bank. . . . . . . . . . . . . . . . . . . . . . . . . . . . . . . . . . . . . . . . . . . . . . . . . . . . . . . . . . . . . . . . . . . . .39
Lack of time/interest
Couldn't be bothered . . . . . . . . . . . . . . . . . . . . . . . . . . . . . . . . . . . . . . . . . . . . . . . . . . . . . . . . . . . . . . . . . . . . .11
Don't have the time. . . . . . . . . . . . . . . . . . . . . . . . . . . . . . . . . . . . . . . . . . . . . . . . . . . . . . . . . . . . . . . . . . . . .8
"They're all the same" . . . . . . . . . . . . . . . . . . . . . . . . . . . . . . . . . . . . . . . . . . . . . . . . . . . . . . . . . . . . . . . . . . . . .5
Take someone else's advice
Just go with what is recommended by friend/family member . . . . . . . . . . . . . . . . . . . . . . . . . . . . . . . . . . . . . . . . . . . . . . . . . . . . . . . . . . . . . . . . . . . . .14
Just go with what is recommended by financial expert . . . . . . . . . . . . . . . . . . . . . . . . . . . . . . . . . . . . . . . . . . . . . . . . . . . . . . . . . . . . . . . . . . . . .5
Spouse/partner does shopping around. . . . . . . . . . . . . . . . . . . . . . . . . . . . . . . . . . . . . . . . . . . . . . . . . . . . . . . . . . . . . . . . . . . . .1
Lack of choice
Only one bank in town . . . . . . . . . . . . . . . . . . . . . . . . . . . . . . . . . . . . . . . . . . . . . . . . . . . . . . . . . . . . . . . . . . . . .3
Part of a package/combined with other financial product. . . . . . . . . . . . . . . . . . . . . . . . . . . . . . . . . . . . . . . . . . . . . . . . . . . . . . . . . . . . . . . . . . . . .2
Too hard to make comparisons/get information. . . . . . . . . . . . . . . . . . . . . . . . . . . . . . . . . . . . . . . . . . . . . . . . . . . . . . . . . . . . . . . . . . . . .4
All other reasons . . . . . . . . . . . . . . . . . . . . . . . . . . . . . . . . . . . . . . . . . . . . . . . . . . . . . . . . . . . . . . . . . . . . .15
Unsure/Can't recall . . . . . . . . . . . . . . . . . . . . . . . . . . . . . . . . . . . . . . . . . . . . . . . . . . . . . . . . . . . . . . . . . . . . . . . . . . .4
Unprompted question, multiple responses allowed.
What is the main reason you don't shop around?

ANZ Survey of Adult Financial Literacy in Australia (2008) 39
The Social Research Centre
Section 6 Borrowing and Debt
6.1 Introduction and key findings This section of the report focuses on borrowing and debt. It examines the community’s use of loans and credit cards including people’s understanding of key rules governing their use, the extent to which people shop around during their acquisition and the management of both the products themselves and of current debt obligations.
Key findings
Product incidence
Since 2005 there have been increases in the incidence of owner occupier mortgages (up 5 points to 34%) and personal loans (up 3 points to 17%), while
The proportion of people saying they have credit cards (down 3 points to 65%) and store cards (down 3 points to 16%) was lower than in the 2005 survey.
Lending sources
During the last 12 months 45% of respondents had borrowed money. Most often this was from a mainstream financial institution (24%) or from family or friends (14%). The latter source was used frequently by young people - 46% of 18-24 year olds had borrowed from family or friend in the last 12 months.
Use of pawn brokers (2%), payday lenders (1%) and debt rescue companies (less than 1%) was low. These sources were slightly more likely to be used by members of financial literacy quintile one but were also used by a few respondents from the higher literacy quintiles, a finding that suggests personal circumstances may leave someone little option other than to use lenders of this type, regardless of their level of financial literacy.
Loan acquisition
Since 2005, fewer mortgage holders had shopped around when arranging their mortgage (down from 79% to 73%). This appears to be at least partly explained by the increased use of mortgage brokers (up from 13% to 18% of the total sample as a source of financial advice) and other sources of expert advice (there was a 10 point increase in mentions of “going with the advice of an expert/broker” as a reason for not shopping around for a mortgage).
39% of mortgage holders had used a mortgage broker to arrange their loan, with borrowers under 35 years of age the most likely to have done so (54%).
Management of current debt levels
The findings suggest that overall the proportion of people who say they are comfortable with their current debt levels has not changed since 2005. Those with substantial loan commitments and moderate incomes, are experiencing some discomfort with their current debt levels and, to varying degrees, are feeling vulnerable to further interest rate rises.
72% of all respondents were at least “fairly comfortable” with their current levels of debt, a result which is unchanged since 2005. At the same time 18% expressed some degree of discomfort with the amount of money they currently owe. This figure rose to 29% amongst those holding a mortgage of $300,000 or more and to 44% amongst those with this level of mortgage outstandings and an annual household income of $65,000 or less.
In the event of a further increase in interest rates
o 44% of mortgage holders said they could meet the higher mortgage repayments without too many problems
o 30% said they would have to cut back on other expenditure, typically people with moderate household incomes in the range $58,000-$79,999, and

ANZ Survey of Adult Financial Literacy in Australia (2008) 40
The Social Research Centre
o 9% said they would be in difficulty (8% would “really struggle”, 1% would not be able to make the additional repayments), typically those with annual household incomes below $58,000.
In the last 12 months, 8% of all respondents had missed a repayment on a loan, mortgage or credit card. This was up from 5% in 2005. Missed payments were generally on a credit card (40%), personal loan (25%) or mortgage (18%) with the most common reasons given for missing repayments being “not planning/budgeting correctly” or unemployment.
Understanding of credit rating and repayment responsibilities
There were indications of some improvement in the understanding of key aspects of debt products since 2005.
77% of credit card holders understood that the primary card holder is entirely responsible for debt incurred by a secondary card holder. This was up 5 percentage points from 72% in 2005. Despite this improvement, a substantial minority (40%) of those aged 18-24 years and of those aged 70 years or more gave a response other than the correct one.
83% of those with a loan understood that both parties are responsible for the full repayment of a jointly held loan, up 3 percentage points from 80% in 2005. Again however, 18-24 year olds (28%) and those aged 70 years or over (31%) were the most likely to be unaware of this.
59% of all respondents understood that being more than 60 days late with the minimum payment on a credit card was the thing most likely to give someone a bad credit rating. This was not significantly different from the result of 61% recorded in 2005. Forty-one percent of respondents were not aware of this with females aged 18-24 years (66%) and females aged 70 years or more (69%) the most likely to select an incorrect response.
Those with higher financial literacy scores were more likely to identify the correct response for each of these questions than were those with relatively lower levels of financial literacy.

ANZ Survey of Adult Financial Literacy in Australia (2008) 41
The Social Research Centre
6.2 Incidence and source of loan products Incidence of loan products
Table 6.2.1a shows the incidence of a range of loan products within the adult population. It is evident that:
There is wide variation in the incidence of products shown in the table ranging from the 65% who used a credit card down to just 2% who reported using margin loans and equity release products.
Some changes were evident since 2005 including slight decreases in the proportion who said they held credit cards (down 3 points to 65%) and store cards (down 3 points to 13%) and slight increases in the proportion holding owner/occupier mortgages (up 5 points to 34%) and personal loans (up 3 points to 17%).
Credit cards
Subgroup differences in the use of credit and store cards were discussed earlier in Section 3.2 where age and household income were seen to be strongly associated with the use of credit cards but not with store cards.
Table 6.2.1a Incidence of loan products
Loan products held 2002 2005 2008
Base: Total sample (n=3548) (n=3513) (n=3500)
% % %
Credit Cards
Credit card . . . . . . . . . . . . . . . . . . . . . . . . . . . . . . . . . . . . . . 64 68 65
Store card . . . . . . . . . . . . . . . . . . . . . . . . . . . . . . . . . . . . . . 15 16 13
Loans
Mortgage on own home . . . . . . . . . . . . . . . . . . . . . . . . . . . . . . . . . . . . . .32 29 34
Mortgage on investment property . . . . . . . . . . . . . . . . . . . . . . . . . . . . . . . . . . . . . .10 11 11
Personal loan . . . . . . . . . . . . . . . . . . . . . . . . . . . . . . . . . . . . . . 18 14 17
Line of credit or overdraft . . . . . . . . . . . . . . . . . . . . . . . . . . . . . . . . . . . . . .14 12 14
Lease or hire purchase agreement . . . . . . . . . . . . . . . . . . . . . . . . . . . . . . . . . . . . . .11 9 9
Home equity loan . . . . . . . . . . . . . . . . . . . . . . . . . . . . . . . . . . . . . . 8 9 7
Margin loan . . . . . . . . . . . . . . . . . . . . . . . . . . . . . . . . . . . . . . 2 2 2
Equity release product . . . . . . . . . . . . . . . . . . . . . . . . . . . . . . . . . . . . . .na na 2
Survey

ANZ Survey of Adult Financial Literacy in Australia (2008) 42
The Social Research Centre
Loans
34% of respondents held an owner-occupier mortgage. People aged 30-55 years were the most likely to have a mortgage of this type (51%), especially people of this age with household incomes of $58,000 or more (62%), who lived in a couple household with children (63%).
11% of respondents said they had a mortgage on an investment property (58% of those who owned an investment property). Incidence of this product was highest amongst a slightly older demographic than owner-occupier mortgages peaking amongst those aged 35-54 years (17%). Within this age group people with higher incomes (27% of those with household incomes of $100,000 or more per annum) were the most likely to hold a mortgage of this type.
Of those who held a mortgage on an investment property, 60% also had an owner occupier mortgage on their own home.
Home equity loans were held by 7% of respondents. The incidence of these loans was highest amongst those aged 35-59 years (12%), particularly people in this age group who had household incomes of $80,000 or more (16%).
A similar pattern was evident for the 14% of the total sample who said they had a line of credit or overdraft. That is, these loans were also more likely to be held by people aged 35-59 years (20%), people earning higher household incomes, in this case incomes of $150,000 or more (29%). Margin loans (held by 2% of the total sample) were also more likely to be held by people aged 35-59 years (4%) with household incomes of $150,000 or more (10%).
Use of lease and hire purchase agreements was highest amongst those aged 35-44 years (14%), particularly 35-44 year olds earning higher annual household incomes of $100,000 or more (20%).
Personal loans, held by 17% of respondents, were the type of loan used most often by people under 30 years of age - 24% of this age group held a personal loan.
Finally, just 2% of all respondents said they held an equity release product such as a reverse mortgage or shared appreciation mortgage.

ANZ Survey of Adult Financial Literacy in Australia (2008) 43
The Social Research Centre
Sources of borrowed funds
All respondents were asked if they had borrowed money from any of the sources shown in Table 6.2.1b.
55% of respondents said they had not borrowed any money during the last 12 months (note this does not mean these people do not have any loans, just that any loans they do have were taken out more than 12 months ago)
The lending sources used most often during the last 12 months were mainstream financial institutions (24% - slightly lower than the 2005 figure of 27%), family and friends (14%), particularly by those aged 18-24 years, 46% of whom had borrowed money from this source, store loans/retailer finance (10%) and finance companies (7%).
Table 6.2.1b Lending sources used in last 12 months
Retailer finance was used most often by those aged 35 to 44 years (18%) while no clear differences were evident in the types of people who had borrowed from a finance company in the last 12 months.
Use of pawn brokers (2%), payday lenders (1%) and debt rescue companies (less than 1%) were all at a low level.
Interestingly, there were no significant differences between financial literacy quintiles in terms of the use of these three sources (2% of those from quintile five had used one of these sources in the last 12 months versus 3% of those from quintile one).
In attempting to understand why this should be so, it is useful to look in some detail at the personal situations of those members of quintile five who had used this type of lender. While the number of people involved was very small (only 1 member of quintile five had used a payday lender in the last 12 months), the individual situations of these respondents provided in the following case summaries point to the fact that personal circumstances can over-ride a high level of financial literacy.
Lending sources used in last 12 months 2005 2008
Base: Total sample (n=3513) (n=1162)
% %
Bank, building society or credit union . . . . . . . . . . . . . . . . . . . . . . . . . . . . . . . . . . . . . . 27 24
Family or friends . . . . . . . . . . . . . . . . . . . . . . . . . . . . . . . . . . . . . . . . . . . . . . . . . . . . . . . . . . . . . . . . . . . . .14 14
Store loan or interest free/Retailer finance . . . . . . . . . . . . . . . . . . . . . . . . . . . . . . . . . . . . . .11 10
Finance company . . . . . . . . . . . . . . . . . . . . . . . . . . . . . . . . . . . . . . . . . . . . . . . . . . . . . . . . . . . . . . . . . . . . .6 7
Cash advance on salary . . . . . . . . . . . . . . . . . . . . . . . . . . . . . . . . . . . . . . 1 1
Pawn broker . . . . . . . . . . . . . . . . . . . . . . . . . . . . . . . . . . . . . . . . . . . . . . . . . . . . . . . . 1 2
Payday Lender . . . . . . . . . . . . . . . . . . . . . . . . . . . . . . . . . . . . . . . . . . . . . . . . . . . . . . 1 1
Debt rescue or debt relief company . . . . . . . . . . . . . . . . . . . . . . . . . . . . . . . . . . . . . . - <1
Other . . . . . . . . . . . . . . . . . . . . . . . . . . . . . . . . . . . . . . . . . . . . . . . . . . . . . . . . . . . . . . . . . . . . .1 2
None of these . . . . . . . . . . . . . . . . . . . . . . . . . . . . . . . . . . . . . . . . . . . . . . . . . . . . . . . . . . . . . . . . . . . . .55 55
Survey
Prompted question, multiple responses allowed.
Base: All respondents in 2005. Randomly selected subset of all respondents in 2008.
Which of the following, if any have YOU PERSONALLY used to
borrow money in the last 12 months for any purpose?

ANZ Survey of Adult Financial Literacy in Australia (2008) 44
The Social Research Centre
Case Summary One Glenda, a member of quintile five (with an average FLS of 119.2) has borrowed money from a payday lender in the last 12 months. Glenda is a 53 year old woman who works full-time to earn a personal income in the range $35,000 to $40,000. She has a partner, but her partner’s contribution to the total household income of $50,000-$60,000 is limited. The couple’s asset position is relatively weak as they are renting their home, the total value of their savings and investments is less than $5,000 and their total debt is in the range $5,000-$10,000. That is, their liabilities are greater than their assets. They also still have one child over 16 years of age living at home. They have struck financial trouble in the last 12 months when a credit card repayment was missed due to her partner becoming unemployed.
Case Summary Two Donna is a member of quintile five (with an average FLS of 113.6) who has borrowed money from a debt rescue company in the last 12 months. Donna is a 33 year old single mother of two children. She has a university degree and does some part-time work but government payments are her main source of income and, as a result, her household income is only $10,000-$15,000 a year. She has little in the way of assets as she rents her home, has less than $100 in savings and investments and has between $2,000-$5,000 in debts.

ANZ Survey of Adult Financial Literacy in Australia (2008) 45
The Social Research Centre
6.3 Understanding of credit rating and repayment responsibility Understanding some aspects of borrowing money was assessed via respondents’ knowledge of the factors which influenced a person’s credit rating and of the responsibility for repayment of debt on jointly held credit cards and loans.
Fifty-nine percent of respondents nominated the correct option of being more than 60 days late with the minimum payment on a credit card as the thing most likely to give someone a bad credit rating. This was not significantly different from the 61% who selected this response in 2005.
Forty-one percent did not select the correct option with those most likely to do this being females (47% versus males 35%), particularly females aged 18-24 years (66%) or 70 years plus (69%).
Seventy-seven percent of people with a credit card said correctly that the primary credit card-holder is solely responsible for the debt on that card, slightly higher than in 2005 and 2002. In total, 23% were unaware of this with lack of awareness highest amongst credit card holders aged 18-24 years and amongst those aged 70 years or over (40% from both of these groups selected an incorrect response).
Eighty-three percent of those who held loans of any sort, were aware that both holders of a joint loan are responsible for repayment of the entire debt. This result was slightly lower than that obtained in 2002 (87%) and slightly higher than the 80% reported in 2005. Seventeen percent were not aware of this responsibility, with lack of awareness above average amongst loan holders aged 18-24 years (28%) and amongst those aged 70 years or over (31%).
Table 6.3.1a Understanding of borrowing
Understanding of loan products 2002 2005 2008
% % %
Which one of the following is most likely to give someone a bad credit rating?
Base: Total Sample na (n=1756) (n=1162)
Being more than 60 days late with the minimum payment on a credit card . . . . . . . . . . . . . . . . . . . . . . . . . . . . . . . . . . . . . . na 61 59
Taking out a second mortgage to buy your own home . . . . . . . . . . . . . . . . . . . . . . . . . . . . . . . . . . . . . . na 11 11
Borrowing from an organisation other than a bank . . . . . . . . . . . . . . . . . . . . . . . . . . . . . . . . . . . . . . na 9 11
Asking the bank for an increased overdraft . . . . . . . . . . . . . . . . . . . . . . . . . . . . . . . . . . . . . . na 7 6
Unsure . . . . . . . . . . . . . . . . . . . . . . . . . . . . . . . . . . . . . . . . . . . . . . . . . . . . . . . . . . . . . . . . . . . . . . . . . . . . . . . . . . . . . . . . . . na 12 13
Base: Have credit or store card (n=2224) (n=2567) (n=2379)
You are entirely responsible for any debt the other person incurs on the card. . . . . . . . . . . . . . . . . . . . . . . . . . . . . . . . . . . . . . 74 72 77
You and the other person are each responsible for half the total debt on the card. . . . . . . . . . . . . . . . . . . . . . . . . . . . . . . . . . . . . . 9 11 8
You are only responsible for debt incurred on the card by the other person
if they are under 18. . . . . . . . . . . . . . . . . . . . . . . . . . . . . . . . . . . . . . . . . . . . . . . . . . . . . . . . . 6 5 5
You are not responsible for any debt the other person incurs on the card. . . . . . . . . . . . . . . . . . . . . . . . . . . . . . . . . . . . . . 5 8 5
Unsure . . . . . . . . . . . . . . . . . . . . . . . . . . . . . . . . . . . . . . . . . . . . . . . . . . . . . . . . . . . . . . . . . . . . . . . . . . . . . . . . . . . . . . . . . . 6 4 5
Base: Have loan (n=1862) (n=1763) (n=1885)
Both persons are responsible for repayment of the entire loan . . . . . . . . . . . . . . . . . . . . . . . . . . . . . . . . . . . . . . 87 80 83
Each person is responsible for repayment of half the loan. . . . . . . . . . . . . . . . . . . . . . . . . . . . . . . . . . . . . . 9 15 12
Only one person must be responsible for repayment of the entire loan . . . . . . . . . . . . . . . . . . . . . . . . . . . . . . . . . . . . . . 2 3 3
The older of the two persons is responsible for repayment of the entire loan . . . . . . . . . . . . . . . . . . . . . . . . . . . . . . . . . . . . . . <1 1 <1
Unsure . . . . . . . . . . . . . . . . . . . . . . . . . . . . . . . . . . . . . . . . . . . . . . . . . . . . . . . . . . . . . . . . . . . . . . . . . . . . . . . . . . . . . . . . . . 2 1 2
Survey
If two people jointly take out a loan, which one of the following most accurately
describes the responsibility for repayment of the loan?
If you, as primary holder of a credit card, arrange for a second person to be
provided with a card in your name, which one of the following most accurately
describes your responsibility for debt incurred by that person on the card?
Prompted question.
Prompted question. Not asked in 2002
Base: A randomly selected subset of eligible respondents in 2005 and 2008.

ANZ Survey of Adult Financial Literacy in Australia (2008) 46
The Social Research Centre
Further to the issue of understanding credit ratings, all respondents were asked what sort of information, as far as they knew, is collected to determine someone’s credit rating. As shown in Table 6.3.1b the things mentioned most frequently were:
Repayment defaults (29%), particularly by those with higher financial literacy scores (45% of quintile five compared with 13% of those in quintile one);
Making late repayments - 20% mentioned this without specifying any particular time-frame, 11% mentioned being late by 60 days or more and 6% mentioned making repayments that were less than 60 days late; and
14% thought someone’s history of loan and credit applications would be taken into account.
28% of respondents said they didn’t know what information was used. Those in quintile one (53%) were much more likely to give this response than people from quintile five (9%) as were those aged 70 years or more (55% “don’t know”).
Due to a change in the codes used25, these results are not strictly comparable to the figures from 2005. Nevertheless, the pattern of responses in 2008 was similar to that in 2005 when 29% of respondents mentioned repayment defaults, 22% mentioned late repayments and 30% gave a “don’t know” response.
Table 6.3.1b Awareness of information used to determine credit rating
25 The time period for late repayments was changed from 3 months in 2005 to 60 days for the 2008 survey.
Information used to determine credit rating 2008
%
Base: Total sample (n=1162)
Repayments history
Repayment defaults . . . . . . . . . . . . . . . . . . . . . . . . . . . . . . . . . . . . . . . . . . . . . . . . . . . . . . . . . . . . . . . . . . . . . . . . . . . 29
Late repayments - time not specified . . . . . . . . . . . . . . . . . . . . . . . . . . . . . . . . . . . . . . . . . . . . . . . . . . . . . . . . . . . . . . . . . . . . . . . . . . . 20
Late repayments - 60 days or more . . . . . . . . . . . . . . . . . . . . . . . . . . . . . . . . . . . . . . . . . . . . . . . . . . . . . . . . . . . . . . . . . . . . . . . . . . . 11
Late repayments - less than 60 days . . . . . . . . . . . . . . . . . . . . . . . . . . . . . . . . . . . . . . . . . . . . . . . . . . . . . . . . . . . . . . . . . . . . . . . . . . . 6
Repayment history . . . . . . . . . . . . . . . . . . . . . . . . . . . . . . . . . . . . . . . . . . . . . . . . . . . . . . . . . . . . . . . . . . . . . . . . . . . 4
Credit applications history
History of loan or credit applications made . . . . . . . . . . . . . . . . . . . . . . . . . . . . . . . . . . . . . . . . . . . . . . . . . . . . . . . . . . . . . . . . . . . . . . . . . . . 14
Any refusals of loan or credit applications . . . . . . . . . . . . . . . . . . . . . . . . . . . . . . . . . . . . . . . . . . . . . . . . . . . . . . . . . . . . . . . . . . . . . . . . . . . 8
Financial situation
Details of your income and expenditure . . . . . . . . . . . . . . . . . . . . . . . . . . . . . . . . . . . . . . . . . . . . . . . . . . . . . . . . . . . . . . . . . . . . . . . . . . . 11
Financial and banking history. . . . . . . . . . . . . . . . . . . . . . . . . . . . . . . . . . . . . . . . . . . . . . . . . . . . . . . . . . . . . . . . . . . . . . . . . . . 10
Current level of debt . . . . . . . . . . . . . . . . . . . . . . . . . . . . . . . . . . . . . . . . . . . . . . . . . . . . . . . . . . . . . . . . . . . . . . . . . . . 9
Record of bankruptcy or bad debts . . . . . . . . . . . . . . . . . . . . . . . . . . . . . . . . . . . . . . . . . . . . . . . . . . . . . . . . . . . . . . . . . . . . . . . . . . . 5
Employment history . . . . . . . . . . . . . . . . . . . . . . . . . . . . . . . . . . . . . . . . . . . . . . . . . . . . . . . . . . . . . . . . . . . . . . . . . . . 3
Other response . . . . . . . . . . . . . . . . . . . . . . . . . . . . . . . . . . . . . . . . . . . . . . . . . . . . . . . . . . . . . . . . . . . . . . . . . . . 6
Don't know . . . . . . . . . . . . . . . . . . . . . . . . . . . . . . . . . . . . . . . . . . . . . . . . . . . . . . . . . . . . . . . . . . . . . . . . . . . 28
As far as you are aware, what sort of information is collected to
determine your credit rating?
Unprompted question, multiple responses allowed.
Base: A randomly selected subset of eligible respondents.

ANZ Survey of Adult Financial Literacy in Australia (2008) 47
The Social Research Centre
6.4 Credit card management All those with a credit or store card were asked if they checked their credit or store card transactions. Those who said they did were asked what they looked for when checking these transactions while those who said they did not were asked why they didn’t do so. Results presented in Table 6.4.1a show that:
Almost all credit and store card holders (93%) do check their credit and store card transactions
Fraudulent activity (74%) and “checking everything is right” (28%) were the things card holders were most likely to check for.
Only 7% (n=53) said they did not check their card transactions.
The most common reasons for failing to do this included someone else checking the transactions (23%) and lack of interest in the task (“couldn’t be bothered” 23%, “don’t have the time” 20% and just assuming they’re correct 17%).
Table 6.4.1a Checking of credit or store card transactions
Checking of credit/store card transactions 2008
%
Do you check your credit or store card transactions?
Base: Have credit or store card (n=802)
Yes . . . . . . . . . . . . . . . . . . . . . . . . . . . . . . . . . . . . . . . . . . . . . . . . . . . . . . . . . . . . . . . . . . . . . . . . . . . 93
No . . . . . . . . . . . . . . . . . . . . . . . . . . . . . . . . . . . . . . . . . . . . . . . . . . . . . . . . . . . . . . . . . . . . . . . . . . . 7
Base: Check credit/store card transactions (n=747)
Transaction activity
Transactions are correct and not fraudulent . . . . . . . . . . . . . . . . . . . . . . . . . . . . . . . . . . . . . . . . . . . . . . . . . . . . . . . . . . . . . . . . . . . . . . . . . . . 74
Check that everything is right . . . . . . . . . . . . . . . . . . . . . . . . . . . . . . . . . . . . . . . . . . . . . . . . . . . . . . . . . . . . . . . . . . . . . . . . . . . 28
Date of transactions . . . . . . . . . . . . . . . . . . . . . . . . . . . . . . . . . . . . . . . . . . . . . . . . . . . . . . . . . . . . . . . . . . . . . . . . . . . 6
Account position
Account balance . . . . . . . . . . . . . . . . . . . . . . . . . . . . . . . . . . . . . . . . . . . . . . . . . . . . . . . . . . . . . . . . . . . . . . . . . . . 21
Amount spent . . . . . . . . . . . . . . . . . . . . . . . . . . . . . . . . . . . . . . . . . . . . . . . . . . . . . . . . . . . . . . . . . . . . . . . . . . . 18
Amount repaid . . . . . . . . . . . . . . . . . . . . . . . . . . . . . . . . . . . . . . . . . . . . . . . . . . . . . . . . . . . . . . . . . . . . . . . . . . . 6
Available credit . . . . . . . . . . . . . . . . . . . . . . . . . . . . . . . . . . . . . . . . . . . . . . . . . . . . . . . . . . . . . . . . . . . . . . . . . . . 5
Costs
Interest charged . . . . . . . . . . . . . . . . . . . . . . . . . . . . . . . . . . . . . . . . . . . . . . . . . . . . . . . . . . . . . . . . . . . . . . . . . . . 16
Account fees . . . . . . . . . . . . . . . . . . . . . . . . . . . . . . . . . . . . . . . . . . . . . . . . . . . . . . . . . . . . . . . . . . . . . . . . . . . 13
Foreign exchange fees . . . . . . . . . . . . . . . . . . . . . . . . . . . . . . . . . . . . . . . . . . . . . . . . . . . . . . . . . . . . . . . . . . . . . . . . . . . 1
Administrative issues
Date payment is due . . . . . . . . . . . . . . . . . . . . . . . . . . . . . . . . . . . . . . . . . . . . . . . . . . . . . . . . . . . . . . . . . . . . . . . . . . . 4
Minimum payment due . . . . . . . . . . . . . . . . . . . . . . . . . . . . . . . . . . . . . . . . . . . . . . . . . . . . . . . . . . . . . . . . . . . . . . . . . . . 3
Statement date . . . . . . . . . . . . . . . . . . . . . . . . . . . . . . . . . . . . . . . . . . . . . . . . . . . . . . . . . . . . . . . . . . . . . . . . . . . 2
Other things
Reward scheme points/information . . . . . . . . . . . . . . . . . . . . . . . . . . . . . . . . . . . . . . . . . . . . . . . . . . . . . . . . . . . . . . . . . . . . . . . . . . . 3
All other things . . . . . . . . . . . . . . . . . . . . . . . . . . . . . . . . . . . . . . . . . . . . . . . . . . . . . . . . . . . . . . . . . . . . . . . . . . . <1
And what do you generally look for when you check your credit or
store card transactions?
Question not comparable to the version used in 2005
Base: A randomly selected subset of eligible respondents.
Unprompted question, multiple responses allowed

ANZ Survey of Adult Financial Literacy in Australia (2008) 48
The Social Research Centre
6.5 Loan acquisition Two aspects of loan acquisition are considered in this section – the extent of comparison shopping for both mortgages and for loans other than mortgages and the use of mortgage brokers.
6.5.1 Comparison shopping for mortgages and other loans
Looking first at comparison shopping for loans, all those with a mortgage were asked how much they shopped around when arranging their mortgage. Similarly all those with a loan other than a mortgage were asked how much they shopped around when arranging a non-mortgage loan. Table 6.5.1a presents the results.
Seventy-three percent of those with a mortgage said they had shopped around when arranging their mortgage. This was lower than in 2002 (82%) and 2005 (79%).
Just over one in every four (26%) mortgage-holders said they had not shopped around, slightly more than in 2002 (16%) and 2005 (20%). This change reflects two factors. Firstly the question was changed slightly in 2008 to apply specifically to the most recently acquired mortgage while the question in 2002 and 2005 applied to shopping for mortgages in general. Secondly there is evidence of borrowers making greater use of advice from financial experts such as mortgage brokers (see Table 6.5.1b) than in 2005. Typically the use of expert advice in this situation is seen as a replacement for personal shopping around.
Those least likely to shop around for a mortgage were older borrowers (31% of those aged 45 to 59 years had not shopped around at all when arranging their mortgage). It should also be noted that 40% of mortgage borrowers from quintile one had not shopped around at all compared with 20% of quintile five suggesting that level of financial literacy was a factor in the extent to which comparison shopping took place.
Table 6.5.1a Comparison shopping for mortgage and loan products
Shopping around for mortgages/loans 2002 2005 2008
% % %
Base: Have obtained a mortgage on home/investment property (n=591) (n=595) (n=1279)
A lot . . . . . . . . . . . . . . . . . . . . . . . . . . . . . . . . . . . . . . . . . . . . . . . . . . . . . . . . . . . . . . . . . . . . . . . . . 34 30 23
A fair bit . . . . . . . . . . . . . . . . . . . . . . . . . . . . . . . . . . . . . . . . . . . . . . . . . . . . . . . . . . . . . . . .28 24 24
A little . . . . . . . . . . . . . . . . . . . . . . . . . . . . . . . . . . . . . . . . . . . . . . . . . . . . . . . . . . . . . . . .20 25 26
Net: Any shopping round at all. . . . . . . . . . . . . . . . . . . . . . . . . . . . . . . . . . . . . . . . . . . . . . . . . . . . . . . . . . . . . . . .82 79 73
Not at all . . . . . . . . . . . . . . . . . . . . . . . . . . . . . . . . . . . . . . . . . . . . . . . . . . . . . . . . . . . . . . . .16 20 26
Can't say . . . . . . . . . . . . . . . . . . . . . . . . . . . . . . . . . . . . . . . . . . . . . . . . . . . . . . . . . . . . . . . .2 1 1
Base: Have obtained a loan other than mortgage (n=1161) (n=486) (n=323)
A lot . . . . . . . . . . . . . . . . . . . . . . . . . . . . . . . . . . . . . . . . . . . . . . . . . . . . . . . . . . . . . . . . . . . . . . . . . 27 21 15
A fair bit . . . . . . . . . . . . . . . . . . . . . . . . . . . . . . . . . . . . . . . . . . . . . . . . . . . . . . . . . . . . . . . .23 25 23
A little . . . . . . . . . . . . . . . . . . . . . . . . . . . . . . . . . . . . . . . . . . . . . . . . . . . . . . . . . . . . . . . .28 29 32
Net: Any shopping round at all. . . . . . . . . . . . . . . . . . . . . . . . . . . . . . . . . . . . . . . . . . . . . . . . . . . . . . . . . . . . . . . .78 75 70
Not at all . . . . . . . . . . . . . . . . . . . . . . . . . . . . . . . . . . . . . . . . . . . . . . . . . . . . . . . . . . . . . . . .21 23 30
Can't say . . . . . . . . . . . . . . . . . . . . . . . . . . . . . . . . . . . . . . . . . . . . . . . . . . . . . . . . . . . . . . . .1 2 -
Prompted question.
Base: Randomly selected subset of eligible respondents in 2002, 2005 and 2008.
Survey
When arranging a new mortgage did you shop around ….
When arranging a new loan other than a mortgage do you
shop around ….
Prompted question.
Base: Randomly selected subset of eligible respondents in 2002 and 2005. All eligible respondents in 2008.

ANZ Survey of Adult Financial Literacy in Australia (2008) 49
The Social Research Centre
Seventy percent of those with loans other than a mortgage said they shopped around when arranging such loans, fewer than in 2002 (78%).
Thirty percent said they do not shop around for such loans. As with mortgages, more respondents said they don’t shop around in 2008 than in either 2005 (23%) or 2002 (21%). In this case the same question was used as in the earlier surveys so the change in shopping around appears most likely to reflect the increased use of advice from financial experts and brokers and friends/family members (see Table 6.5.1c).
For loans other than a mortgage there was no clear relationship between age and shopping around although financial literacy again appeared to be a factor. One in two (50%) of those from quintile one don’t shop around at all when arranging a loan of this type compared with 26% of those from quintile five.
Reasons for not shopping around for a mortgage are shown in Table 6.5.1b. Mentioned most frequently were:
A satisfactory pre-existing customer (43%) or working (8%) relationship with a bank or other lending organisation, and
Accepting the recommendation of a financial expert/mortgage broker (26%), up 10 points on the 2005 figure and pointing to the increased role played by advisers such as mortgage brokers during the last 3 years.
Table 6.5.1b Reasons for not comparison shopping for a mortgage
Reasons for not "shopping around" - mortgage 2008
Base: Did not shop around for mortgage (n=342)
%
Relationship with existing bank/FI
Happy with current one/like to keep with one bank. . . . . . . . . . . . . . . . . . . . . . . . . . . . . . . . . . . . . . . . . . . . . . . . . . . . . . . . . . . . . . . . . . . . .43
Work there/staff loans. . . . . . . . . . . . . . . . . . . . . . . . . . . . . . . . . . . . . . . . . . . . . . . . . . . . . . . . . . . . . . . . . . . . .8
Take someone else's advice
Go with recommendation of financial expert/broker . . . . . . . . . . . . . . . . . . . . . . . . . . . . . . . . . . . . . . . . . . . . . . . . . . . . . . . . . . . . . . . . . . . . .26
Just go with what is recommended by friend/family member . . . . . . . . . . . . . . . . . . . . . . . . . . . . . . . . . . . . . . . . . . . . . . . . . . . . . . . . . . . . . . . . . . . . .6
Spouse/partner does shopping around. . . . . . . . . . . . . . . . . . . . . . . . . . . . . . . . . . . . . . . . . . . . . . . . . . . . . . . . . . . . . . . . . . . . .2
Lack of time/interest
Couldn't be bothered. . . . . . . . . . . . . . . . . . . . . . . . . . . . . . . . . . . . . . . . . . . . . . . . . . . . . . . . . . . . . . . . . . . . .5
"They're all the same" . . . . . . . . . . . . . . . . . . . . . . . . . . . . . . . . . . . . . . . . . . . . . . . . . . . . . . . . . . . . . . . . . . . . .3
Don't have the time. . . . . . . . . . . . . . . . . . . . . . . . . . . . . . . . . . . . . . . . . . . . . . . . . . . . . . . . . . . . . . . . . . . . .4
Too hard to make comparisons/get information. . . . . . . . . . . . . . . . . . . . . . . . . . . . . . . . . . . . . . . . . . . . . . . . . . . . . . . . . . . . . . . . . . . . .5
All other reasons . . . . . . . . . . . . . . . . . . . . . . . . . . . . . . . . . . . . . . . . . . . . . . . . . . . . . . . . . . . . . . . . . . . . .4
Unsure/Can't recall . . . . . . . . . . . . . . . . . . . . . . . . . . . . . . . . . . . . . . . . . . . . . . . . . . . . . . . . . . . . . . . . . . . . . . . . . . .2
What is the main reason you didn't shop around?
Unprompted question, multiple responses allowed.
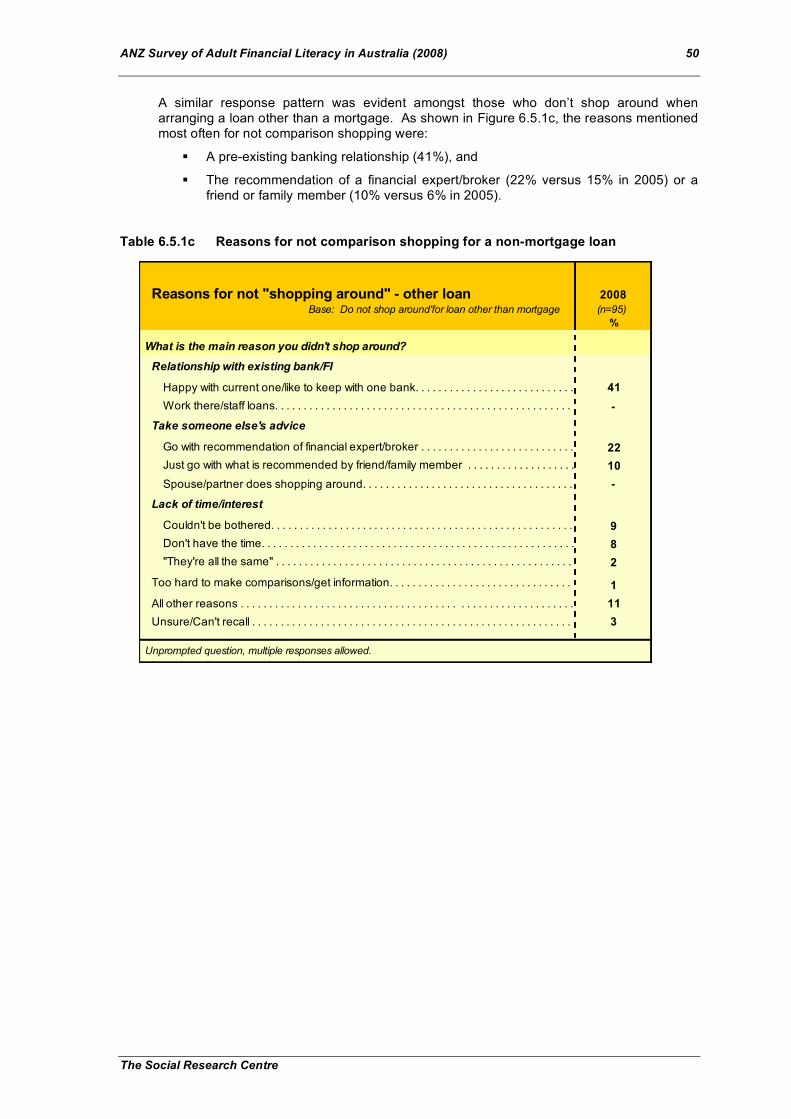
ANZ Survey of Adult Financial Literacy in Australia (2008) 50
The Social Research Centre
A similar response pattern was evident amongst those who don’t shop around when arranging a loan other than a mortgage. As shown in Figure 6.5.1c, the reasons mentioned most often for not comparison shopping were:
A pre-existing banking relationship (41%), and
The recommendation of a financial expert/broker (22% versus 15% in 2005) or a friend or family member (10% versus 6% in 2005).
Table 6.5.1c Reasons for not comparison shopping for a non-mortgage loan
Reasons for not "shopping around" - other loan 2008
Base: Do not shop around'for loan other than mortgage (n=95)
%
Relationship with existing bank/FI
Happy with current one/like to keep with one bank. . . . . . . . . . . . . . . . . . . . . . . . . . . . . . . . . . . . . . . . . . . . . . . . . . . . . . . . . . . . . . . . . . . . .41
Work there/staff loans. . . . . . . . . . . . . . . . . . . . . . . . . . . . . . . . . . . . . . . . . . . . . . . . . . . . . . . . . . . . . . . . . . . . .-
Take someone else's advice
Go with recommendation of financial expert/broker . . . . . . . . . . . . . . . . . . . . . . . . . . . . . . . . . . . . . . . . . . . . . . . . . . . . . . . . . . . . . . . . . . . . .22
Just go with what is recommended by friend/family member . . . . . . . . . . . . . . . . . . . . . . . . . . . . . . . . . . . . . . . . . . . . . . . . . . . . . . . . . . . . . . . . . . . . .10
Spouse/partner does shopping around. . . . . . . . . . . . . . . . . . . . . . . . . . . . . . . . . . . . . . . . . . . . . . . . . . . . . . . . . . . . . . . . . . . . .-
Lack of time/interest
Couldn't be bothered. . . . . . . . . . . . . . . . . . . . . . . . . . . . . . . . . . . . . . . . . . . . . . . . . . . . . . . . . . . . . . . . . . . . .9
Don't have the time. . . . . . . . . . . . . . . . . . . . . . . . . . . . . . . . . . . . . . . . . . . . . . . . . . . . . . . . . . . . . . . . . . . . .8
"They're all the same" . . . . . . . . . . . . . . . . . . . . . . . . . . . . . . . . . . . . . . . . . . . . . . . . . . . . . . . . . . . . . . . . . . . . .2
Too hard to make comparisons/get information. . . . . . . . . . . . . . . . . . . . . . . . . . . . . . . . . . . . . . . . . . . . . . . . . . . . . . . . . . . . . . . . . . . . .1
All other reasons . . . . . . . . . . . . . . . . . . . . . . . . . . . . . . . . . . . . . . . . . . . . . . . . . . . . . . . . . . . . . . . . . . . . .11
Unsure/Can't recall . . . . . . . . . . . . . . . . . . . . . . . . . . . . . . . . . . . . . . . . . . . . . . . . . . . . . . . . . . . . . . . . . . . . . . . . . . .3
What is the main reason you didn't shop around?
Unprompted question, multiple responses allowed.

ANZ Survey of Adult Financial Literacy in Australia (2008) 51
The Social Research Centre
6.5.2 Use of mortgage brokers
Given the increased profile of mortgage brokers in the lending market over the last few years, all those with a mortgage on either their own home or an investment property were asked if they had used a mortgage broker when this loan was arranged. Those who had done so were asked what things they had considered when deciding which mortgage broker to use. As shown in Table 6.5.2a:
Thirty-nine percent of those who held a mortgage on either their own home or an investment property said they had used a mortgage broker to arrange their loan. Borrowers aged under 35 years were the most likely to have done so (54%).
Choice of broker was most often influenced by the recommendation of friends or family (38%), the service obtained by using a broker both in terms of the convenience offered by someone else handling the comparison shopping (14%) and of the perceived professionalism of the service received (12%), the broker’s reputation (15%) and price related issues including gaining access to the best deals (13%) and charging low fees (10%).
Table 6.5.2a Use of mortgage brokers
Use of Mortgage Brokers 2008
%
Did you use a mortgage broker (when arranging new mortgage)?
Base: Have mortgage on home/investment property (n=1331)
Yes - used a mortgage broker . . . . . . . . . . . . . . . . . . . . . . . . . . . . . . . . . . . . . . . . . . . . . . . . . . . . . . . . . . . . . . . . . . . . . . . . . 39
No - didn't use a mortgage broker . . . . . . . . . . . . . . . . . . . . . . . . . . . . . . . . . . . . . . . . . . . . . . . . . . . . . . . . . . . . . . . .61
Base: Used a mortgage broker (n=491)
Recommendation
Recommended by friend/family member . . . . . . . . . . . . . . . . . . . . . . . . . . . . . . . . . . . . . . . . . . . . . . . . . . . . . . . . . . . . . . . . . . . . . . . . . 38
Recommended by financial expert . . . . . . . . . . . . . . . . . . . . . . . . . . . . . . . . . . . . . . . . . . . . . . . . . . . . . . . . . . . . . . . . . . . . . . . . . 11
Service
Convenience, didn't have to shop around myself . . . . . . . . . . . . . . . . . . . . . . . . . . . . . . . . . . . . . . . . . . . . . . . . . . . . . . . . . . . . . . . .14
Professional . . . . . . . . . . . . . . . . . . . . . . . . . . . . . . . . . . . . . . . . . . . . . . . . . . . . . . . . . . . . . . . .12
Friendly, good people skills . . . . . . . . . . . . . . . . . . . . . . . . . . . . . . . . . . . . . . . . . . . . . . . . . . . . . . . . . . . . . . . .8
Attentive, personal service . . . . . . . . . . . . . . . . . . . . . . . . . . . . . . . . . . . . . . . . . . . . . . . . . . . . . . . . . . . . . . . .5
Reputation/Image
Reputable brand . . . . . . . . . . . . . . . . . . . . . . . . . . . . . . . . . . . . . . . . . . . . . . . . . . . . . . . . . . . . . . . .15
They "knew the market" . . . . . . . . . . . . . . . . . . . . . . . . . . . . . . . . . . . . . . . . . . . . . . . . . . . . . . . . . . . . . . . .7
They were on my side . . . . . . . . . . . . . . . . . . . . . . . . . . . . . . . . . . . . . . . . . . . . . . . . . . . . . . . . . . . . . . . .5
Independence . . . . . . . . . . . . . . . . . . . . . . . . . . . . . . . . . . . . . . . . . . . . . . . . . . . . . . . . . . . . . . . .3
Endorsement by celebrity/Consumer testimonial . . . . . . . . . . . . . . . . . . . . . . . . . . . . . . . . . . . . . . . . . . . . . . . . . . . . . . . . . . . . . . . .1
Pricing
Had the best deals . . . . . . . . . . . . . . . . . . . . . . . . . . . . . . . . . . . . . . . . . . . . . . . . . . . . . . . . . . . . . . . . . . . . . . . . . 13
Low fees . . . . . . . . . . . . . . . . . . . . . . . . . . . . . . . . . . . . . . . . . . . . . . . . . . . . . . . . . . . . . . . . . . . . . . . . . 10
All other reasons . . . . . . . . . . . . . . . . . . . . . . . . . . . . . . . . . . . . . . . . . . . . . . . . . . . . . . . . . . . . . . . .6
No particular reason . . . . . . . . . . . . . . . . . . . . . . . . . . . . . . . . . . . . . . . . . . . . . . . . . . . . . . . . . . . . . . . .5
Can't recall . . . . . . . . . . . . . . . . . . . . . . . . . . . . . . . . . . . . . . . . . . . . . . . . . . . . . . . . . . . . . . . . 3
What were the things that you considered when deciding which
mortgage broker to use?
Question not asked in 2002 or 2005.
Unprompted question, multiple responses allowed.
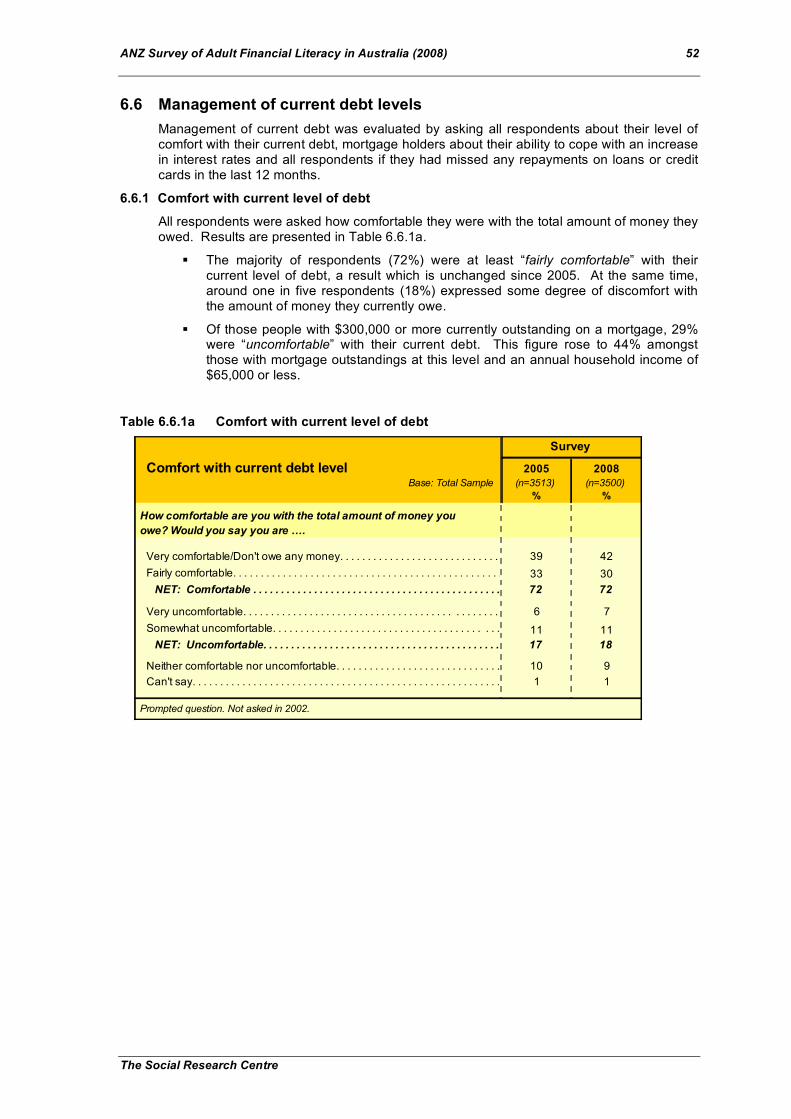
ANZ Survey of Adult Financial Literacy in Australia (2008) 52
The Social Research Centre
6.6 Management of current debt levels Management of current debt was evaluated by asking all respondents about their level of comfort with their current debt, mortgage holders about their ability to cope with an increase in interest rates and all respondents if they had missed any repayments on loans or credit cards in the last 12 months.
6.6.1 Comfort with current level of debt
All respondents were asked how comfortable they were with the total amount of money they owed. Results are presented in Table 6.6.1a.
The majority of respondents (72%) were at least “fairly comfortable” with their current level of debt, a result which is unchanged since 2005. At the same time, around one in five respondents (18%) expressed some degree of discomfort with the amount of money they currently owe.
Of those people with $300,000 or more currently outstanding on a mortgage, 29% were “uncomfortable” with their current debt. This figure rose to 44% amongst those with mortgage outstandings at this level and an annual household income of $65,000 or less.
Table 6.6.1a Comfort with current level of debt
Comfort with current debt level 2005 2008
Base: Total Sample (n=3513) (n=3500)
% %
Very comfortable/Don't owe any money. . . . . . . . . . . . . . . . . . . . . . . . . . . . . . . . . . . . . . . . . . . . . . . . . . . . .39 42
Fairly comfortable. . . . . . . . . . . . . . . . . . . . . . . . . . . . . . . . . . . . . . . . . . . . . . . . . . . . . 33 30
NET: Comfortable . . . . . . . . . . . . . . . . . . . . . . . . . . . . . . . . . . . . . . . . . . . . . . . . . . . . . . . . . . . . . . . . . . . . . . . .72 72
Very uncomfortable. . . . . . . . . . . . . . . . . . . . . . . . . . . . . . . . . . . . . . . . . . . . . . . . . . . . .6 7
Somewhat uncomfortable. . . . . . . . . . . . . . . . . . . . . . . . . . . . . . . . . . . . . . . . . . . . . . . . . . . . .11 11
NET: Uncomfortable. . . . . . . . . . . . . . . . . . . . . . . . . . . . . . . . . . . . . . . . . . . . . . . . . . . . . . . . . . . . . . . . . . . . . . . .17 18
Neither comfortable nor uncomfortable. . . . . . . . . . . . . . . . . . . . . . . . . . . . . . . . . . . . . . 10 9
Can't say. . . . . . . . . . . . . . . . . . . . . . . . . . . . . . . . . . . . . . . . . . . . . . . . . . . . . . . . . . . . . . . . . . . . . . . .1 1
Survey
How comfortable are you with the total amount of money you
owe? Would you say you are ….
Prompted question. Not asked in 2002.

ANZ Survey of Adult Financial Literacy in Australia (2008) 53
The Social Research Centre
Respondents were also asked if they agreed or disagreed with the statement “I feel out of control with my borrowing and credit card generally”. As shown in Table 6.6.1b:
The great majority of respondents (90%) disagreed with this statement, a similar result to those reported in 2002 (91%) and 2005 (90%).
Those in quintiles one (87%) and two (88%) were slightly less likely than members of quintile five (93%) to disagree with the statement.
Table 6.6.1b Control over borrowings and credit card
Control of borrowings & credit card debt 2002 2005 2008
Base: Total Sample (n=3548) (n=1756) (n=3500)
% % %
Strongly agree . . . . . . . . . . . . . . . . . . . . . . . . . . . . . . . . . . . . . . . . . . . . . . . . . . . . . . . . . . . . . . . . . . . . . . . . . . . .1 2 2
Agree . . . . . . . . . . . . . . . . . . . . . . . . . . . . . . . . . . . . . . . . . . . . . . . . . . . . . . . . . . . . . . . . . . . . . . . . . . . .6 5 5
Net: "Agree" . . . . . . . . . . . . . . . . . . . . . . . . . . . . . . . . . . . . . . . . . . . . . . . . . . . . . . . . . . . . . . . . . . . . . . . . . . . .7 7 7
Strongly disagree . . . . . . . . . . . . . . . . . . . . . . . . . . . . . . . . . . . . . . . . . . . . . . . . . . . . . . . . . . . . . . . . . . . . . . . . . . . .46 48 38
Disagree . . . . . . . . . . . . . . . . . . . . . . . . . . . . . . . . . . . . . . . . . . . . . . . . . . . . . . . . . . . . . . . . . . . . . . . . . . . .45 44 52
Net: "Disagree" . . . . . . . . . . . . . . . . . . . . . . . . . . . . . . . . . . . . . . . . . . . . . . . . . . . . . . . . . . . . . . . . . . . . . . . . . . . .91 92 90
Can't say . . . . . . . . . . . . . . . . . . . . . . . . . . . . . . . . . . . . . . 2 1 3
I feel out of control with my borrowing and credit card generally?
Survey
Prompted question
Base: A randomly selected subset of all eligible respondents in 2005, all eligible respondents in 2002 and 2008.

ANZ Survey of Adult Financial Literacy in Australia (2008) 54
The Social Research Centre
6.6.2 Ability to cope with increase in interest rates
All respondents who held an owner-occupier and/or an investment mortgage were asked about their ability to cope if they were advised of another26 interest rate increase. As shown in Table 6.6.2a:
Some 44% of mortgage holders felt they could make the higher repayments without too many problems. Those with higher incomes (66% of those with household incomes of $150,000 or more) and smaller mortgages (52% of those with mortgages of less than $150,000) were the most likely to feel this way. Another 16% held a fixed interest rate mortgage and did not see any immediate impact arising from an increase in interest rates.
However, 30% felt they would need to cut back on other expenditure in order to meet higher mortgage repayments (39% of those with moderate household incomes in the range $58,000 to $79,999), while
Almost 1 in 10 (9%) mortgage holders either felt they would “really struggle” to make higher repayments (8%) or that that they would be unable to do so and that there was a chance they would default on their loan (1%).
Those living in areas of greatest socio-economic disadvantage were the most likely to feel this way (15% of SEIFA group one) and, in line with this, those earning lower household incomes (17% of those with household incomes below $58,000) and single parents (15%) were also more likely to be in this situation.
Of all subgroups, couples with children and an annual household income of $65,000 or less were the most likely to feel they would really struggle or default on their loan (24%).
Table 6.6.2a Ability to deal with an increase in interest rates
26 Fieldwork for this survey took place after the RBA’s announcement of an interest rate increase in March, 2008 which took the cash rate to 7.25%. There were no further rate rises during the fieldwork period.
Ability to cope with interest rate rise 2008
Base: Have mortgage on home/investment property (n=1331)
%
I could make the higher mortgage repayments without too many problems. . . . . . . . . . . . . . . . . . . . . . . . . . . . . . . . . . . . . . . . . . . . . . . . .44
I could make the higher mortgage repayments but would have to cut back my
expenditure elsewhere. . . . . . . . . . . . . . . . . . . . . . . . . . . . . . . . . . . . . . . . . . . . . . . . . 30
I would really struggle to make my mortgage repayments as we are already
stretched. . . . . . . . . . . . . . . . . . . . . . . . . . . . . . . . . . . . . . . . . . . . . . . . . . . . . . . . . . . .. 8
I would not be able to make the higher mortgage repayments and there is a
chance I would default on my loan . . . . . . . . . . . . . . . . . . . . . . . . . . . . . . . . . . . . . . . 1
My mortgage is on a fixed interest rate so there would be no impact in the
immediate term . . . . . . . . . .. . . . . . . . . . . . . . . . . . . . . . . . . . . . . . . . . . . . . . . . . . . . . 16
Can't say. . . . . . . . . . . . . . . . . . . . . . . . . . . . . . . . . . . . . . . . . . . . . . . . . . . . . . . . . . . . . . . . . . . . . . . . 1
If you were advised of an upcoming increase in the interest rate on your
mortgage, which of the following statements would best apply to you?
Prompted question. Not asked in 2002 or 2005.
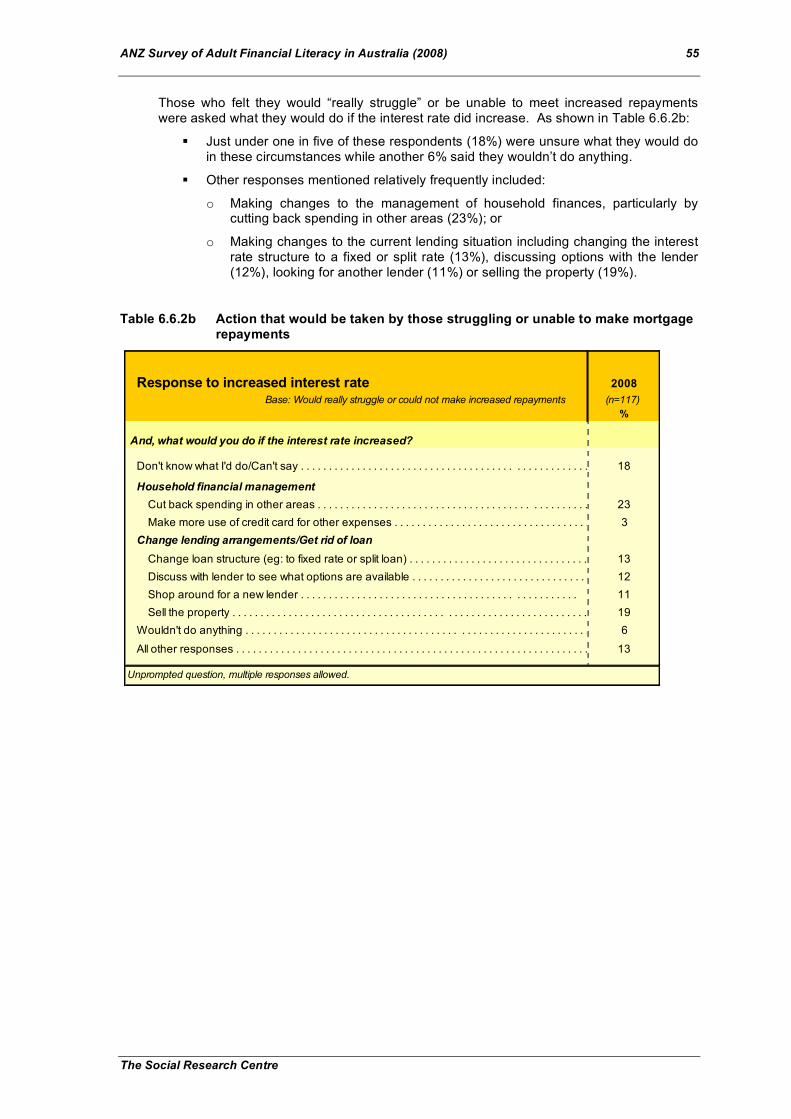
ANZ Survey of Adult Financial Literacy in Australia (2008) 55
The Social Research Centre
Those who felt they would “really struggle” or be unable to meet increased repayments were asked what they would do if the interest rate did increase. As shown in Table 6.6.2b:
Just under one in five of these respondents (18%) were unsure what they would do in these circumstances while another 6% said they wouldn’t do anything.
Other responses mentioned relatively frequently included:
o Making changes to the management of household finances, particularly by cutting back spending in other areas (23%); or
o Making changes to the current lending situation including changing the interest rate structure to a fixed or split rate (13%), discussing options with the lender (12%), looking for another lender (11%) or selling the property (19%).
Table 6.6.2b Action that would be taken by those struggling or unable to make mortgage repayments
Response to increased interest rate 2008
Base: Would really struggle or could not make increased repayments (n=117)
%
Don't know what I'd do/Can't say . . . . . . . . . . . . . . . . . . . . . . . . . . . . . . . . . . . . . . . . . . . . . . . . . . . . . . . . . . . . . . . . . . . . . . .18
Household financial management
Cut back spending in other areas . . . . . . . . . . . . . . . . . . . . . . . . . . . . . . . . . . . . . . . . . . . . . . . . . . . . . . . . . . . . . . . . . . . . . . .23
Make more use of credit card for other expenses . . . . . . . . . . . . . . . . . . . . . . . . . . . . . . . . . . . . . . . . . . . . . . . . .3
Change lending arrangements/Get rid of loan
Change loan structure (eg: to fixed rate or split loan) . . . . . . . . . . . . . . . . . . . . . . . . . . . . . . . . . . . . . . . . . . . . . . . . .13
Discuss with lender to see what options are available . . . . . . . . . . . . . . . . . . . . . . . . . . . . . . . . . . . . . . . . . . . . . . . . .12
Shop around for a new lender . . . . . . . . . . . . . . . . . . . . . . . . . . . . . . . . . . . . . . . . . . . . . . . . . 11
Sell the property . . . . . . . . . . . . . . . . . . . . . . . . . . . . . . . . . . . . . . . . . . . . . . . . . . . . . . . . . . . . . . . . . . . . . . . . .19
Wouldn't do anything . . . . . . . . . . . . . . . . . . . . . . . . . . . . . . . . . . . . . . . . . . . . . . . . . . . . . . . . . . . . . . . . . . . . . . . 6
All other responses . . . . . . . . . . . . . . . . . . . . . . . . . . . . . . . . . . . . . . . . . . . . . . . . . . . . . . . . . . . . . . . . . . . . . . .13
And, what would you do if the interest rate increased?
Unprompted question, multiple responses allowed.

ANZ Survey of Adult Financial Literacy in Australia (2008) 56
The Social Research Centre
6.6.3 Missed loan repayments
A further measure of people’s control over their debt situation was obtained by asking all respondents if they had missed any repayments on products like loans, mortgages or credit cards in the last 12 months. As shown in Table 6.6.3a:
In the 2008 survey, 8% of respondents said they had missed at least one repayment of this type. This was a significant increase on the 5% who had been in this situation in 2005.
Those most likely to have missed a repayment included 25-44 year olds (13%), those living in areas of greatest socio-economic disadvantage (12% of SEIFA group one) and, in line with this, single parents (17%) and people working in lower blue collar occupations (19%).
As might be expected, debt levels also have a role to play with 21% of those with mortgage outstandings of $300,000 or more and household incomes of $100,000 or less having missed a payment of this type.
As was the case in 2005, credit cards (40%), personal loans (25%) and mortgages (18%) were the products on which repayments were most likely to be missed.
Table 6.6.3a Missed debt repayments in the last 12 months
Missed repayments 2005 2008
% %
Base: Total sample (n=3513) (n=3500)
Yes . . . . . . . . . . . . . . . . . . . . . . . . . . . . . . . . . . . . . . . . . . . . . . . . . . . . . . . . . . . . . . . . . . . . . . . . . . . 5 8
No . . . . . . . . . . . . . . . . . . . . . . . . . . . . . . . . . . . . . . . . . . . . . . . . . . . . . . . . . . . . . . . . . . . . . . . . . . . 95 92
Base: Have missed repayment (n=184) (n=271)
Credit card . . . . . . . . . . . . . . . . . . . . . . . . . . . . . . . . . . . . . . . . . . . . . . . . . . . . . . . . . . . . . . . . . . . . . . . . . . . 47 40
Personal loan . . . . . . . . . . . . . . . . . . . . . . . . . . . . . . . . . . . . . . . . . . . . . . . . . . . . . . . . . . . . . . . . . . . . . . . . . . . 24 25
Mortgage . . . . . . . . . . . . . . . . . . . . . . . . . . . . . . . . . . . . . . . . . . . . . . . . . . . . . . . . . . . . . . . . . . . . . . . . . . . 16 18
Motor vehicle lease . . . . . . . . . . . . . . . . . . . . . . . . . . . . . . . . . . . . . . . . . . . . . . . . . . . . . . . . . . . . . . . . . . . . . . . . . . . 6 6
Hire purchase . . . . . . . . . . . . . . . . . . . . . . . . . . . . . . . . . . . . . . . . . . . . . . . . . . . . . . . . . . . . . . . . . . . . . . . . . . . 3 2
Store card . . . . . . . . . . . . . . . . . . . . . . . . . . . . . . . . . . . . . . . . . . . . . . . . . . . . . . . . . . . . . . . . . . . . . . . . . . . 2 <1
Personal overdraft . . . . . . . . . . . . . . . . . . . . . . . . . . . . . . . . . . . . . . . . . . . . . . . . . . . . . . . . . . . . . . . . . . . . . . . . . . . - 1
Something else . . . . . . . . . . . . . . . . . . . . . . . . . . . . . . . . . . . . . . . . . . . . . . . . . . . . . . . . . . . . . . . . . . . . . . . . . . . 9 11
Can't say . . . . . . . . . . . . . . . . . . . . . . . . . . . . . . . . . . . . . . . . . . . . . . . . . . . . . . . . . . . . . . . . . . . . . . . . . . . 2 2
Survey
At any time in the last 12 months have you NOT been able to make
a repayment on any loans, mortgages, credit cards or any other
types of repayments that you have?
Could you please tell me what repayment it was that you were
unable to meet? Were there any others?
Unprompted question, multiple responses allowed. Not asked in 2002.

ANZ Survey of Adult Financial Literacy in Australia (2008) 57
The Social Research Centre
Those who had missed a repayment were asked why this had happened. Results are presented in Table 6.6.3b. The most frequently mentioned reasons were:
A loss of income, usually a result of the respondent losing their job (26%); and
Those related to financial management and planning including failing to budget correctly (24%) and lack of funds/not having the money when payments were due (20%).
Only 3% specifically mentioned increased interest rates as the reason for missing a repayment although rising rates may have been a contributing factor in the other reasons mentioned in the “poor financial management/planning” category.
The reasons given for missing repayments were similar to those mentioned in 2005 apart from increased proportions who “didn’t have the money when payment was due” (up from 9% in 2005) or who has encountered “an unexpected emergency expenditure” (up from 6% in 2005).
Table 6.6.3b Reasons for missing repayments in the last 12 months
Reasons for missing repayments 2008
%
Base: Have missed repayment (n=271)
Poor financial management/planning
Didn't budget/plan correctly . . . . . . . . . . . . . . . . . . . . . . . . . . . . . . . . . . . . . . . . . . . . . . . . . . . . . . . . . . . . . . . . . . . . . . . . . . . 24
Lack of funds, didn’t have the money when payment was due . . . . . . . . . . . . . . . . . . . . . . . . . . . . . . . . . . . . . . . . . . . . . . . . . . . . . . . . . . . . . . . . . . . . . . . . . . . 20
Overspent on my credit/charge/store card . . . . . . . . . . . . . . . . . . . . . . . . . . . . . . . . . . . . . . . . . . . . . . . . . . . . . . . . . . . . . . . . . . . . . . . . . . . 6
Increase in interest rates . . . . . . . . . . . . . . . . . . . . . . . . . . . . . . . . . . . . . . . . . . . . . . . . . . . . . . . . . . . . . . . . . . . . . . . . . . . 3
Borrowed too much originally . . . . . . . . . . . . . . . . . . . . . . . . . . . . . . . . . . . . . . . . . . . . . . . . . . . . . . . . . . . . . . . . . . . . . . . . . . . 2
Loss of income
Loss of income/lost job . . . . . . . . . . . . . . . . . . . . . . . . . . . . . . . . . . . . . . . . . . . . . . . . . . . . . . . . . . . . . . . . . . . . . . . . . . . 26
Loss of partner's income/job . . . . . . . . . . . . . . . . . . . . . . . . . . . . . . . . . . . . . . . . . . . . . . . . . . . . . . . . . . . . . . . . . . . . . . . . . . . 5
Unexpected expense
Unexpected emergency expenditure . . . . . . . . . . . . . . . . . . . . . . . . . . . . . . . . . . . . . . . . . . . . . . . . . . . . . . . . . . . . . . . . . . . . . . . . . . . 12
An expense I had was a lot more than expected . . . . . . . . . . . . . . . . . . . . . . . . . . . . . . . . . . . . . . . . . . . . . . . . . . . . . . . . . . . . . . . . . . . . . . . . . . . 9
Unexpected medical expenses . . . . . . . . . . . . . . . . . . . . . . . . . . . . . . . . . . . . . . . . . . . . . . . . . . . . . . . . . . . . . . . . . . . . . . . . . . . 7
Other
Relationship breakdown . . . . . . . . . . . . . . . . . . . . . . . . . . . . . . . . . . . . . . . . . . . . . . . . . . . . . . . . . . . . . . . . . . . . . . . . . . . 2
Something else . . . . . . . . . . . . . . . . . . . . . . . . . . . . . . . . . . . . . . . . . . . . . . . . . . . . . . . . . . . . . . . . . . . . . . . . . . . 5
Can't say . . . . . . . . . . . . . . . . . . . . . . . . . . . . . . . . . . . . . . . . . . . . . . . . . . . . . . . . . . . . . . . . . . . . . . . . . . . <1
Would you mind telling me what were the main reasons you could
not make this/these payments?
Unprompted question, multiple responses allowed.

ANZ Survey of Adult Financial Literacy in Australia (2008) 58
The Social Research Centre
Section 7 Savings, Investment and Superannuation
7.1 Introduction and key findings This section of the report examines the community’s understanding of and behaviour in relation to investments and superannuation. It includes a discussion of the incidence of different types of savings account and investments, people’s understanding of fundamental investment principles and the incidence and basic rules governing superannuation. It also looks at retirement planning, retirement income and the use and choice of financial planners.
Financial literacy is of considerable importance here as poorly informed investment and superannuation decisions are likely to make it difficult for consumers to plan and save effectively for their retirement as well as placing them at greater risk of suffering financial loss.
Key findings
Product incidence
High interest savings accounts and investments were held widely, but not universally.
46% of all respondents said they had a high interest savings account. Those most likely to have this type of account were people aged under 35 years (54%) who had the financial capacity to save (63% amongst under 35’s with a personal income of $58,000 or more) and a goal to save for (63% amongst under 35’s who intended taking out a mortgage in the next 12 months).
20% of respondents had a term deposit. This was slightly lower than in 2002 (24%) and the decrease may reflect competition from high interest on-line savings accounts.
38% held shares and 20% said they had investments in managed funds.
19% had an investment property.
Four percent said they have investments in debentures, bonds, notes or derivatives.
20% of those aged 55 years or over said they held a retirement income stream product, most often an allocated pension (37%) or a lifetime pension or annuity (24%).
Those people who did not hold any of the above products27, a group comprising 30% of the total sample, were most likely to be younger (39% of 18-24 year olds) and earning lower incomes (39% of those with personal incomes under $25,000, 46% of those whose main source of income was a Government benefit or allowance). These people were also more likely to be found amongst those with relatively lower financial literacy (46% of quintile one members).
Understanding of investment principles
Understanding of risk and fluctuation in the value of investments showed some improvements on the 2005 results.
In 2008, 52% of respondents said they wouldn’t invest in an investment offering a return well above the market rate with no risk. This was a five point increase on 2005 and may reflect the failures of various property developers and stockbrokers since 2006. However, almost half the sample (48%) still chose a response other than this. Most often this was to “invest lightly to see how it goes before investing more heavily” (39%), the principle on which many financial scams operate.
There were also more respondents who understood that short term fluctuations in market value can be expected even with good investments (up 3 points to 67%). Recent share market volatility is likely to be a key factor in this result.
27 Apart from retirement income stream products.

ANZ Survey of Adult Financial Literacy in Australia (2008) 59
The Social Research Centre
Other measures of understanding have not changed significantly:
An investment with a high return is likely to have higher than average risks was regarded as true by the great majority (86%) of respondents; while
92% considered diversification across different types of investments to be of at least some importance.
Superannuation
76% of respondents said they belonged to a superannuation fund. Of all superannuation fund members:
o 54% belonged to one fund (down slightly from 59% in 2005) while 43% said they belonged to more than one fund28. Typically members of more than one fund had household incomes of $80,000 or more (49%) and were aged 25-44 years (48%).
Twenty-three percent of those who belonged to more than one fund could not see any disadvantage in doing so (13% none, 10% can’t say) while those who could were most likely to mention the increased fees (40% multiple administration fees, 20% multiple set-up fees) incurred by membership of more than one fund.
o 14% of fund members said they belonged to a self-managed superannuation fund, typically people aged 45 years or over (19%) and those with household incomes in excess of $100,000 (18%). There were no significant differences between financial literacy groups insofar as the incidence of SMSF membership was concerned - 16% of quintile five superannuation fund members belonged to an SMSF as did 13% of quintile one and two fund members. That is, around one in ten of those with relatively low levels of financial literacy were potentially the investment decision makers for their own superannuation fund.
Understanding of certain basic rules relating to superannuation remained very high although there continues to be considerable uncertainty about its tax treatment:
o 96% understood that employers are required by law to make superannuation payments on behalf of employees (not significantly different from 97% in the previous two surveys);
o 90% understood employees can make superannuation payments additional to any payments made by their employer (not significantly different from 91% in 2002 and 92% in 2005);
o 58% thought superannuation is taxed at a lower rate than other investments (not significantly different from the 56% recorded in 2005), 10% thought it was taxed at the same rate, 5% thought the rate was higher and 27% were unsure. Those least likely to nominate the “lower tax rate” option were females (53% versus 63% of males) and members of financial literacy quintiles one (39%) and two (32%).
There was some improvement in reported understanding of superannuation fund statements - 31% of those who received such statements considered them difficult or very difficult to understand, down from 36% in 2002. Those with relatively low financial literacy scores were the most likely have difficulty understanding fund statements (46% difficult/very difficult amongst members of quintile one) as were those who received superannuation statements but did not read them (50% difficult/very difficult).
28 3% of members were unsure how many superannuation funds they belonged to.

ANZ Survey of Adult Financial Literacy in Australia (2008) 60
The Social Research Centre
Understanding of superannuation as an investment was moderate amongst fund members aged under 65:
o 20% were unable to nominate any advantages of superannuation over other forms of investment, particularly 18-24 year olds (35%) and members of financial literacy quintiles one (46%) and two (34%). The advantages most often mentioned for superannuation were the favourable tax treatment of contributions (30%) and restricted access to the funds (29%).
o 42% didn’t know what factors resulted in a reduction in the final value. Again young people aged 18-24 years (62%) and members of quintiles one (60%) and two (61%) were the most likely to be unable to give a response to this question. Those who did give a response most often attributed fund under-performance to inadequate contributions (22%), poor choice of fund (too risky - 10%, poor fund choice for life circumstances 10%) and lack of long term focus (particularly withdrawing money early 15% or switching funds frequently 6%).
71% of those who said they had chosen a superannuation fund (42% of fund members) said they shop around when looking for a new fund.
Choice criteria for a new fund were the fees, the fund’s performance and the nature of the fund and its investment, particularly the fund risk. Compared to 2005, there appears to have been less emphasis on performance and more on fees and risk.
Retirement planning and expectations
Most of those under 65 years of age (91%) did not think the Government would make up any shortfall in retirement funding, particularly those with higher household incomes who are the least likely to be eligible for Centrelink payments.
50% expect their superannuation will let them live either more comfortably or about as comfortably as now, a 6 point increase on the 2005 result. The strong growth in asset values, at least up until late 2007, is likely to have influenced this result.
27% of fund members29 had identified a target income for retirement. This figure increased to 34% amongst those aged 45 to 59 years, for whom retirement planning is a more immediate concern.
Two-thirds (66%) of those who had identified a target income nominated an income figure in the range $25,000 to $74,999. Factors considered when establishing the adequacy of current retirement funding arrangements focused on fund members’ desired standard of living and expected future financial situation.
Retirement income
When looking for a retirement income stream product, 57% of those aged 55 years or more and who have arranged a product of this type say they shop around. This was higher than in 2005 (42%) but still significantly less than for products like insurance (75%) and mortgages (73%).
There was evidence of limited familiarity with reverse equity loans. Of all respondents aged 60 years or over, 51% said they didn’t know what a reverse equity loan was and another 3% were unsure. Further, of those who said they did know what this product was, 33% (another 15% of all those aged 60 years plus) didn’t know enough about it to identify any factors they would consider when deciding whether or not to take one out.
29 To maintain consistency with previous surveys this was reported for those fund members aged under 65 years, who were in paid work and not self-employed.

ANZ Survey of Adult Financial Literacy in Australia (2008) 61
The Social Research Centre
Financial Planners
Of all respondents, 34% had consulted a financial planner - unchanged from 2005. Those aged 55-69 years (that is, those approaching retirement or recently retired) were the most likely to have consulted a financial planner (48%). Use of financial planners was also associated with higher incomes (46% amongst those with personal incomes of $80,000 or more) and relatively higher financial literacy (50% amongst members of quintile five).
When choosing a financial planner 59% shop around.
Choice criteria used when selecting a planner were most likely to include the knowledge/professionalism of the planner (36%), recommendation by friend or family member (21%), assessment of the planner as having good people skills (19%) and having a reputable brand (16%).
35% of those who had consulted a financial planner said they don’t consider conflicts of interest in any investment recommendations they receive, generally because they trust their planner (54%). Those who say they do consider the possibility of conflicts (58%) are most likely to look for the payment of commissions by product providers as the indicator.

ANZ Survey of Adult Financial Literacy in Australia (2008) 62
The Social Research Centre
7.2 Incidence of savings products and investments Table 7.2.1a summarises the population incidence of various types of savings products and investments.
Savings deposit accounts
High interest savings accounts (including bonus savings accounts, on-line savings accounts and cash management accounts) were held by 46% of survey respondents. Most often, these accounts were held by those aged under 35 years (54%), particularly those under 35’s who had personal incomes of $58,000 or more (63%), who were working in upper white collar occupations (63%) and who had established a clear savings goal by intending to take out a mortgage in the next 12 months (63%).
One in five respondents (20%) held a term deposit, slightly fewer than in 2002 when 24% reported holding this type of account. Increased competition from high interest on-line savings accounts, is likely to be a factor in this decrease. Term deposits were held most often by older people (28% of those aged 60-69 years, 44% of those aged 70 years or over).
Table 7.2.1a Types of investment held
Other investments
Three in four respondents (76%) were members of a superannuation fund, not significantly different from the situation in 2005 but higher than the 71% who reported being members of a superannuation fund in 2002.
At 94%, membership of superannuation funds was highest amongst those working for an employer on a full-time, part-time or casual basis. Nevertheless, while regulation requires employers to pay superannuation on behalf of all employees, this result shows that 6% of those in paid employment were either unaware this was happening or were not receiving their superannuation entitlements.
Of all respondents, 38% said they held shares and 20% managed investments other than superannuation. Question changes made to obtain information on high interest savings accounts and other investments have reduced comparability with the earlier surveys. The substantial decrease in the incidence of “managed investments other than superannuation” is most likely to be a consequence of these changes although losses sustained by many market linked investment funds since late 2007 may also have made some contribution to this decline.
Investment products held 2002 2005 2008
% % %
Base: Total respondents (n=3548) (n=3513) (n=3500)
Deposit accounts
High interest savings account . . . . . . . . . . . . . . . . . . . . . . . . . . . . . . . . . . . . . . . .na na 46
Term deposit . . . . . . . . . . . . . . . . . . . . . . . . . . . . . . . . . . . . . . . . 24 22 20
Other Investments
Superannuation fund . . . . . . . . . . . . . . . . . . . . . . . . . . . . . . . . 71 74 76
Shares . . . . . . . . . . . . . . . . . . . . . . . . . . . . . . . . . . . . . . . . 44 40 38
Managed investments other than superannuation. . . . . . . . . . . . . . . . . . . . . . . . . . . . . . . . . . . . . .29 27 20
Investment property . . . . . . . . . . . . . . . . . . . . . . . . . . . . . . . . 18 19 19
Other investments (eg: debentures, bonds, etc) . . . . . . . . . . . . . . .na na 4
Base: All respondents aged 55 years or more na (n=1096) (n=1303)
Retirement income stream product . . . . . . . . . . . . . . . . . . . . . . . . . . . . . . . . . . . . .na 24 20
Survey
ANZ Survey of Adult Financial Literacy in Australia (2008) 63
The Social Research Centre
Both types of investment were more likely to be held by people aged 45 years or older (45% of this age group held shares, 25% managed investments), particularly those in this age group with household incomes of $100,000 or more (65% shares, 37% managed investments). There was also an association between ownership of these investments and financial literacy - 54% of quintile five held shares versus 23% of quintile one while 27% of quintile five held managed investments compared with 14% of those in quintile one.
Approximately one in five (19%) respondents held an investment property, typically those aged 40-64 years (26%) and those earning personal incomes of $80,000 or more (36%)
Other investments, including debentures, bonds, notes or derivatives were held by 4% of respondents, 6% of those aged 70 years or over.
Twenty percent of all respondents aged 55 years or more30 said they had a retirement income stream product, slightly less than in 2005 (24%). We do not believe this is a consequence of a lower population incidence for this product but rather, reflects the greater effort made in 2008 to prevent respondents including themselves in this category because they received the government age pension.
Overall, 30% of all respondents did not hold a high interest savings account, term deposit, shares, managed investment, investment property or other investments such as debentures, bonds, notes or derivatives. Typically such people were younger (39% amongst those aged 18-24 years) and earning lower incomes (39% of those with a personal income of less than $25,000, 46% of those whose main source of income was a Government benefit or allowance). They were also more likely to be found amongst those with lower financial literacy (46% amongst members of quintile one compared with 18% of quintile five).
30 In 2008, 4% of those aged under 55 years incorrectly said they held this product type. This suggests the existence of some confusion as to the meaning of the term Retirement Income Stream.

ANZ Survey of Adult Financial Literacy in Australia (2008) 64
The Social Research Centre
7.3 Investing principles and process This section reports on respondents’ understanding of investment principles and, amongst investors, the details of their most recent investment - what it was, what sources of information were used to inform the decision and what investors were looking to gain from this investment.
7.3.1 Understanding of investment principles
All respondents31 were asked four questions about fundamental investment principles. Respondents with higher financial literacy scores were more likely to identify the most appropriate responses on all of these questions than were respondents with lower financial literacy scores. As a result, the demographic and socio-economic profile of people more likely to select the most appropriate responses reflected the profile of the upper literacy quintiles as discussed in Section 2 – these are not reiterated here.
With that in mind, as shown in Table 7.3.1a:
86% of respondents said it was true that investments with high returns are likely to have higher than average risks. At the same time, 14% did not choose this response, typically those with lower levels of financial literacy (38% of quintile one, 21% of quintile two).
There have been no significant changes in these responses across the three surveys.
Table 7.3.1a Understanding of investment principles
31 For consistency with previous surveys, the question on diversification is only reported for those who held investments.
Understanding of investment principles 2002 2005 2008
% % %
An investment with a high return is likely to have higher than average risks?
Base: Total Sample (n=3293) (n=3513) (n=3500)
True . . . . . . . . . . . . . . . . . . . . . . . . . . . . . . . . . . . . . . . . . . . . . . . . . . . . . . . . . . . . . . . . . . . . . . . . . . . . . . . . . . . . . . . . . . 85 87 86
False . . . . . . . . . . . . . . . . . . . . . . . . . . . . . . . . . . . . . . . . . . . . . . . . . . . . . . . . . . . . . . . . . . . . . . . . . . . . . . . . . . . . . . . . . . 8 8 7
Unsure . . . . . . . . . . . . . . . . . . . . . . . . . . . . . . . . . . . . . . . . . . . . . . . . . . . . . . . . . . . . . . . . . . . . . . . . . . . . . . . . . . . . . . . . . . 7 5 7
Base: Total Sample (n=3293) (n=3513) (n=3500)
Consider it "too good to be true" and not invest. . . . . . . . . . . . . . . . . . . . . . . . . . . . . . . . . . . . . . . . . . . . . . . . . 46 47 52
Invest lightly to see how it goes before investing more heavily. . . . . . . . . . . . . . . . . . . . . . . . . . . . . . . . . . . . . . 44 44 39
Invest heavily to maximise your return . . . . . . . . . . . . . . . . . . . . . . . . . . . . . . . . . . . . . . 3 4 3
Unsure . . . . . . . . . . . . . . . . . . . . . . . . . . . . . . . . . . . . . . . . . . . . . . . . . . . . . . . . . . . . . . . . . . . . . . . . . . . . . . . . . . . . . . . . . . 7 6 6
Base: Total Sample (n=3293) (n=3513) (n=3500)
Short-term fluctuations in market value can be expected, even with good investments . . . . . . . . . . . . . . . . . . . . . . . . . . . . . . . . . . . . . . 63 64 67
Good investments are always increasing in value . . . . . . . . . . . . . . . . . . . . . . . . . . . . . . . . . . . . . . 19 21 16
Investments that fluctuate in value are not good in the long term . . . . . . . . . . . . . . . . . . . . . . . . . . . . . . . . . . . . . . . . . . . . . . . . .6 5 5
Unsure . . . . . . . . . . . . . . . . . . . . . . . . . . . . . . . . . . . . . . . . . . . . . . . . . . . . . . . . . . . . . . . . . . . . . . . . . . . . . . . . . . . . . . . . . . 13 10 12
Base: Have investments (n=2187) (n=2058) (n=1987)
Very important . . . . . . . . . . . . . . . . . . . . . . . . . . . . . . . . . . . . . . . . . . . . . . . . . . . . . . . . . . . . . . . . . . . . . . . . . . . . . . . . . . . . . . . . . .51 49 50
Quite important . . . . . . . . . . . . . . . . . . . . . . . . . . . . . . . . . . . . . . . . . . . . . . . . . . . . . . . . . . . . . . . . . . . . . . . . . . . . . . . . . . . . . . . . . .28 30 28
Of some importance . . . . . . . . . . . . . . . . . . . . . . . . . . . . . . . . . . . . . . . . . . . . . . . . . . . . . . . . . . . . . . . . . . . . . . . . . . . . . . . . . . . . . . . . . .12 14 14
Not at all important . . . . . . . . . . . . . . . . . . . . . . . . . . . . . . . . . . . . . . . . . . . . . . . . . . . . . . . . . . . . . . . . . . . . . . . . . . . . . . . . . . . . . . . . . .5 4 5
Unsure . . . . . . . . . . . . . . . . . . . . . . . . . . . . . . . . . . . . . . . . . . . . . . . . . . . . . . . . . . . . . . . . . . . . . . . . . . . . . . . . . . . . . . . . . . 5 3 3
Prompted questions.
Survey
Which of the following would you recommend for an investment advertised as
having a return well above market rates and no risk?
Which ONE of the following is the most accurate statement about fluctuations
in market values?
Thinking about investing over 5 years or more, how Important do you consider
diversification of your funds across different types of investments?

ANZ Survey of Adult Financial Literacy in Australia (2008) 65
The Social Research Centre
Almost one in every two respondents (48%) selected a response other than the most appropriate recommendation for an investment advertised as having a return well above market rates and no risk – that is, consider it would be “too good to be true” and not invest in it. Those with low levels of financial literacy were the most likely to pick another response (72% of quintile one, 60% of quintile two and 52% of quintile three), typically to invest lightly and see how it goes before investing more heavily, a choice which is the basis for the design of many financial scams.
Nevertheless, the proportion of respondents who chose the most appropriate response (that is, not invest) was significantly higher than in 2005 (47%) and in 2002 (46%) suggesting the collapse of property developers such as Westpoint and Fincorp has had some impact on community perceptions.
Two in three respondents (67%) understood that even with good investments, short term fluctuations in market values can be expected. One in three respondents (33%) did not choose this option. Selection of other alternatives occurred most often amongst those with lower levels of financial literacy (64% of quintile one, 41% of quintile two).
Once again however, the proportion who chose the most appropriate response (that is, fluctuations can be expected even with good investments) was significant higher than in 2005 (64%) and in 2002 (63%).
Finally, 78% of those respondents who held investments considered diversification of funds across different types of investments to be very (50%) or quite (28%) important while just 8% were unsure (3%) or did not think it was important at all (5%). These results showed no significant changes across the three financial literacy surveys.
Overall, there appeared to be slightly greater awareness of investment risk than in 2005, a possible reflection of the difficulties experienced by those who invested in organisations such as Westpoint, Fincorp and Australian Capital Reserve. There also appeared to be greater awareness of the potential for fluctuation in the market value of investments, perhaps not unexpected in light of the current high level of share market volatility.

ANZ Survey of Adult Financial Literacy in Australia (2008) 66
The Social Research Centre
7.3.2 Details of most recent investment
All those who held investments were asked what type of investment they had made most recently. Responses are shown in Table 7.3.2a where it is evident that the most recent investments made were most likely to be:
In equities - 28% shares and 4% through managed investments;
Property (29% of all investors, 39% of those aged 35-44 years); and
Deposit accounts such as term deposits (14% of all investors, 32% of investors aged 70 or over) and high interest savings accounts (2%).
Table 7.3.2a Type of most recent investment
Those who nominated a specific type of investment were asked two further questions:
How they had found out about their most recent investment; and
What they were looking for with this investment - that is, what were their investment objectives.
Sources of information about most recent investment
Responses to the first of these questions are presented in Table 7.3.2b. Results are shown in summary form for all nominated investments as well as separately for the three most common types of investment - shares/managed investments, property and term deposit/high interest savings accounts.
Points of interest in Table 7.3.2b include the following:
24% of these investors said they found out about their most recent investment through their friends, family or work colleagues. This figure rose to 53% amongst young people aged 18-24 years and was still at 43% amongst those aged 25-34 years.
This information source was more likely to be used by investors in equities (29%) and property (27%) than by those whose most recent investment was in a term deposit or high interest savings account (13%).
Type of most recent investment 2008
%
Base: Have investment (n=1013)
Equities
Shares . . . . . . . . . . . . . . . . . . . . . . . . . . . . . . . . . . . . . . . . . . . . . . . . . . . . . . . . . . . . . . . . . . . . . . . . . . . 28
Managed investments . . . . . . . . . . . . . . . . . . . . . . . . . . . . . . . . . . . . . . . . . . . . . . . . . . . . . . . . . . . . . . . . . . . . . . . . . . . 4
Property . . . . . . . . . . . . . . . . . . . . . . . . . . . . . . . . . . . . . . . . . . . . . . . . . . . . . . . . . . . . . . . . . . . . . . . . . . . 29
Deposit account
Term deposit . . . . . . . . . . . . . . . . . . . . . . . . . . . . . . . . . . . . . . . . . . . . . . . . . . . . . . . . . . . . . . . . . . . . . . . . . . . 14
High interest savings account . . . . . . . . . . . . . . . . . . . . . . . . . . . . . . . . . . . . . . . . . . . . . . . . . . . . . . . . . . . . . . . . . . . . . . . . . . . 2
Superannuation . . . . . . . . . . . . . . . . . . . . . . . . . . . . . . . . . . . . . . . . . . . . . . . . . . . . . . . . . . . . . . . . . . . . . . . . . . . 5
Business . . . . . . . . . . . . . . . . . . . . . . . . . . . . . . . . . . . . . . . . . . . . . . . . . . . . . . . . . . . . . . . . . . . . . . . . . . . 1
Something else . . . . . . . . . . . . . . . . . . . . . . . . . . . . . . . . . . . . . . . . . . . . . . . . . . . . . . . . . . . . . . . . . . . . . . . . . . . 7
Can't recall . . . . . . . . . . . . . . . . . . . . . . . . . . . . . . . . . . . . . . . . . . . . . . . . . . . . . . . . . . . . . . . . . . . . . . . . . . . 10
Thinking about your most recent investment, what did you decide
to invest in?
Unprompted question, single response only.
Base: Randomly selected subgroup of all eligible respondents.

ANZ Survey of Adult Financial Literacy in Australia (2008) 67
The Social Research Centre
The main source of information about deposit accounts was from the account provider - 41% of those whose investment was of this type had found out about it through a bank or other financial institution. At 18%, advertising was also mentioned relatively frequently by those investing in these accounts.
Apart from family, friends and work colleagues, investors in equities also made relatively frequent use of financial information available from newspapers and magazines (15%), financial planners (13%) and internet sites (11%).
In addition to personal networks, property investors also made use of advertising (17%), the relevant sections of newspapers/magazines (13%) and internet sites (12%). Another 13% of this group referred to their own general research and knowledge about the property category.
Table 7.3.2b Sources of information for most recent investment
Sources of information used to find out about
most recent investmentAny
Investment
Shares/
Mgd Inv Property
Term Dep/
Savings a/c
% % % %
Base: Nominated a type of investment (n=906) (n=320) (n=284) (n=166)
Friends, family, work colleagues . . . . . . . . . . . . . . . . . . . . . . . . . . . . . . . . . . . . . . . . . . . . . . . . . . . . . . . . . . . . . . . . . . . . . . . . . . . .24 29 27 13
Own research/knowledge
Information in newspapers or magazines . . . . . . . . . . . . . . . . . . . . . . . . . . . . . . . . . . . . . . . . . . . . . . . . . . . . . . . . . . . . . . . . . . . . . . . . . . . .11 15 13 5
Internet / Relevant sites on the internet . . . . . . . . . . . . . . . . . . . . . . . . . . . . . . . . . . . . . . . . . . . . . . . . . . . . . . . . . . . . . . . . . . . . . . . . . . . . . . . . . . . . . . . . . . . . . . 9 11 12 7
Books about finance / investing . . . . . . . . . . . . . . . . . . . . . . . . . . . . . . . . . . . . . . . . . . . . . . . . . . . . . . . . . . . . . . . . . . . . . . . . . . . . . . . . . . . . . . . . . . . . . . 3 6 2 1
Finance industry publications . . . . . . . . . . . . . . . . . . . . . . . . . . . . . . . . . . . . . . . . . . . . . . . . . . . . . . . . . . . . . . . . . . . . . . . . . . . . . . . . . . . . . . . . . . . . . . 3 5 2 4
Publications by Government / Community organisations . . . . . . . . . . . . . . . . . . . . . . . . . . . . . . . . . . . . . . . . . . . . . . . . . . . . . . . . . . . . . . . . . . . . . . . . . . . . . . . . . . . . . . . . . . . . . . 1 1 <1 <1
Attendance at seminars . . . . . . . . . . . . . . . . . . . . . . . . . . . . . . . . . . . . . . . . . . . . . . . . . . . . . . . . . . . . . . . . . . . . . . . . . . . . . . . . . . . . . . . . . . . . . . 1 1 1 -
Own general research / knowledge . . . . . . . . . . . . . . . . . . . . . . . . . . . . . . . . . . . . . . . . . . . . . . . . . . . . . . . . . . . . . . . . . . . . . . . . . . . . . . . . . . . . . . . . . . . . . . 11 11 13 4
Industry professional
Financial planner . . . . . . . . . . . . . . . . . . . . . . . . . . . . . . . . . . . . . . . . . . . . . . . . . . . . . . . . . . . . . . . . . . . . . . . . . . . . . . . . . . . . . . . . . . . . . . 8 13 2 2
Stockbroker/Accountant . . . . . . . . . . . . . . . . . . . . . . . . . . . . . . . . . . . . . . . . . . . . . . . . . . . . . . . . . . . . . . . . . . . . . . . . . . . . . . . . . . . . . . . . . . . . . . 3 6 3 -
Real estate agent . . . . . . . . . . . . . . . . . . . . . . . . . . . . . . . . . . . . . . . . . . . . . . . . . . . . . . . . . . . . . . . . . . . . . . . . . . . . . . . . . . . . . . . . . . . . . . 2 - 7 -
Advertising . . . . . . . . . . . . . . . . . . . . . . . . . . . . . . . . . . . . . . . . . . . . . . . . . . . . . . . . . . . . . . . . . . . . . . . . . . . . . . . . . . . . . . . . . . . . . . 12 6 17 18
From bank or other financial institution . . . . . . . . . . . . . . . . . . . . . . . . . . . . . . . . . . . . . . . . . . . . . . . . . . . . . . . . . . . . . . . . . . . . . . . . . . . . . . . . . . . . . . . . . . . . . . 11 6 1 41
Other responses . . . . . . . . . . . . . . . . . . . . . . . . . . . . . . . . . . . . . . . . . . . . . . . . . . . . . . . . . . . . . . . . . . . . . . . . . . . . . . . . . . . . . . . . . . . . . . 3 4 3 -
Didn't use any information source . . . . . . . . . . . . . . . . . . . . . . . . . . . . . . . . . . . . . . . . . . . . . . . . . . . . . . . . . . . . . . . . . . . . . . . . . . . . . . . . . . . . . . . . . . . . . . 8 4 8 9
Can't recall . . . . . . . . . . . . . . . . . . . . . . . . . . . . . . . . . . . . . . . . . . . . . . . . . . . . . . . . . . . . . . . . . . . . . . . . . . 2 1 3 3
Unprompted question, multiple responses allowed
How did you find out about this investment?
Type of Investment

ANZ Survey of Adult Financial Literacy in Australia (2008) 68
The Social Research Centre
Investment objectives
Table 7.3.2c presents the objectives these investors had for their most recent investment. Mentioned most often were:
Long term capital or financial gain (27%), although this was most likely to be mentioned by investors in equities (37%) or property (30%);
22% said they were seeking “a good return”; and
21% were looking for security from their investment - 30% of those investing in a deposit account and 25% of those investing in equities.
In addition, 22% of those whose most recent investment was in property mentioned lifestyle benefits (eg: owning a larger home, having a home in a desirable retirement location) as one of their objectives.
Table 7.3.2c Objectives for most recent investment
Investment objectivesAny
Investment
Shares/
Mgd Inv Property
Term Dep/
Savings a/c
% % % %
Base: Nominated a type of investment (n=906) (n=320) (n=284) (n=166)
Capital/Financial gain
Long term capital/financial gain . . . . . . . . . . . . . . . . . . . . . . . . . . . . . . . . . . . . . . . . . . . . . . . . . . . . . . . . . . . . . . . . . . . . . . . . . . . .27 37 30 11
Short term capital/financial gain . . . . . . . . . . . . . . . . . . . . . . . . . . . . . . . . . . . . . . . . . . . . . . . . . . . . . . . . . . . . . . . . . . . . . . . . . . . . . . . . . . . . . . . . . . . . . . 5 6 3 10
General return
A good return . . . . . . . . . . . . . . . . . . . . . . . . . . . . . . . . . . . . . . . . . . . . . . . . . . . . . . . . . . . . . . . . . . . . . . . . . . . . . . . . . . . . . . . . . . . . . . 22 25 16 27
Better long term return than cash . . . . . . . . . . . . . . . . . . . . . . . . . . . . . . . . . . . . . . . . . . . . . . . . . . . . . . . . . . . . . . . . . . . . . . . . . . . . . . . . . . . . . . . . . . . . . . 9 11 9 10
Income
A future income stream (eg: in retirement ) . . . . . . . . . . . . . . . . . . . . . . . . . . . . . . . . . . . . . . . . . . . . . . . . . . . . . . . . . . . . . . . . . . . . . . . . . . . . . . . . . . . . . . . . . . . . . . 7 6 8 3
An immediate income stream . . . . . . . . . . . . . . . . . . . . . . . . . . . . . . . . . . . . . . . . . . . . . . . . . . . . . . . . . . . . . . . . . . . . . . . . . . . . . . . . . . . . . . . . . . . . . . 5 7 4 4
Interest income . . . . . . . . . . . . . . . . . . . . . . . . . . . . . . . . . . . . . . . . . . . . . . . . . . . . . . . . . . . . . . . . . . . . . . . . . . . . . . . . . . . . . . . . . . . . . . 2 1 <1 9
Other objectives
Security . . . . . . . . . . . . . . . . . . . . . . . . . . . . . . . . . . . . . . . . . . . . . . . . . . . . . . . . . . . . . . . . . . . . . . . . . . . . . . . . . . . . . . . . . . . . . . 21 25 14 30
Saving / Investing for the future . . . . . . . . . . . . . . . . . . . . . . . . . . . . . . . . . . . . . . . . . . . . . . . . . . . . . . . . . . . . . . . . . . . . . . . . . . . . . . . . . . . . . . . . . . . . . . 11 10 12 12
Better lifestyle now or in retirement . . . . . . . . . . . . . . . . . . . . . . . . . . . . . . . . . . . . . . . . . . . . . . . . . . . . . . . . . . . . . . . . . . . . . . . . . . . . . . . . . . . . . . . . . . . . . . 9 - 22 -
Access, flexibility . . . . . . . . . . . . . . . . . . . . . . . . . . . . . . . . . . . . . . . . . . . . . . . . . . . . . . . . . . . . . . . . . . . . . . . . . . . . . . . . . . . . . . . . . . . . . . 5 3 6 5
Tax benefits . . . . . . . . . . . . . . . . . . . . . . . . . . . . . . . . . . . . . . . . . . . . . . . . . . . . . . . . . . . . . . . . . . . . . . . . . . . . . . . . . . . . . . . . . . . . . . 4 3 4 2
Diversification . . . . . . . . . . . . . . . . . . . . . . . . . . . . . . . . . . . . . . . . . . . . . . . . . . . . . . . . . . . . . . . . . . . . . . . . . . . . . . . . . . . . . . . . . . . . . . 2 5 <1 1
Other responses . . . . . . . . . . . . . . . . . . . . . . . . . . . . . . . . . . . . . . . . . . . . . . . . . . . . . . . . . . . . . . . . . . . . . . . . . . . . . . . . . . . . . . . . . . . . . . 6 6 7 2
Nothing in particular / Don't know . . . . . . . . . . . . . . . . . . . . . . . . . . . . . . . . . . . . . . . . . . . . . . . . . . . . . . . . . . . . . . . . . . . . . . . . . . . . . . . . . . . . . . . . . . . . . . 7 8 7 9
Unprompted question, multiple responses allowed
And what were you looking for in this investment?
Type of Investment

ANZ Survey of Adult Financial Literacy in Australia (2008) 69
The Social Research Centre
7.4 Superannuation This section reports on membership of superannuation funds. It also examines members’ understanding of the regulatory requirements, taxation, statements and factors influencing the performance of superannuation funds as well as the extent of comparison shopping undertaken when choosing a fund.
7.4.1 Number and types of superannuation fund held
Table 7.4.1a reports on the number and types of superannuation fund to which respondents said they belonged. As shown:
54% belonged to just one superannuation fund, slightly fewer than in 2005 when 59% were in this situation. Against this, 43% were members of more than one fund - 28% belonged to two funds, 9% to three and 6% to four or more.
Those most likely to be members of more than one fund were people aged 25-44 years (48%) and those with household incomes of $80,000 or more (49%). People aged 18-24 years were the group most likely to be unsure about how many funds they belonged to (10%).
Superannuation fund members most often said they belonged to an industry superannuation fund (33%), a corporate or employer fund (19%), a public sector fund (18%) or a self-managed superannuation fund (14%). These figures show some differences from those reported in 2005. There has been an increase in the proportion who say they belong to an industry fund (up from 21% to 33%) - this may reflect increased membership but may also be a result of greater awareness following the significant mass media advertising of industry funds that has occurred since the 2005 survey. There was also a slight increase (from 15% to 18%) in the proportion who said they belonged to a public sector fund and a decrease (from 27% to 19%) in the proportion saying they were members of a corporate or employer fund
Table 7.4.1a Number and type of superannuation fund held
Incidence and Type of Superannuation Fund 2002 2005 2008
% % %
Fund membership
Base: Total Sample (n=3548) (n=3513) (n=3500)
Member of one or more superannuation funds . . . . . . . . . . . . . . . . . . . . . . . . . . . . . . . . . . . . . . . . . . . . . . . . . . . . . . . . . . . . . . . . . . . . . . . . . . . . . . . . . . . . . . . . . .71 74 76
Does not have superannuation/Unsure . . . . . . . . . . . . . . . . . . . . . . . . . . . . . . . . . . . . . . . . . . . . . . . . . . . . . . . . . . . . . . . . . . . . . . . . . . . . . . . . . . . . . . . . . .29 26 24
Base: Have superannuation na (n=2629) (n=2612)
One fund only . . . . . . . . . . . . . . . . . . . . . . . . . . . . . . . . . . . . . . . . . . . . . . . . . . . . . . . . . . . . . . . . . . . . . . . . . . . . . . . . . . . . . . . . . . na 59 54
Two funds . . . . . . . . . . . . . . . . . . . . . . . . . . . . . . . . . . . . . . . . . . . . . . . . . . . . . . . . . . . . . . . . . . . . . . . . . . . . . . . . . . . . . . . . . . na 26 28
Three funds . . . . . . . . . . . . . . . . . . . . . . . . . . . . . . . . . . . . . . . . . . . . . . . . . . . . . . . . . . . . . . . . . . . . . . . . . . . . . . . . . . . . . . . . . . na 8 9
Four or more funds . . . . . . . . . . . . . . . . . . . . . . . . . . . . . . . . . . . . . . . . . . . . . . . . . . . . . . . . . . . . . . . . . . . . . . . . . . . . . . . . . . . . . . . . . .na 6 6
Unsure . . . . . . . . . . . . . . . . . . . . . . . . . . . . . . . . . . . . . . . . . . . . . . . . . . . . . . . . . . . . . . . . . . . . . . . . . . . . . . . . . . . . . . . . . . na 2 3
Base: Have superannuation na (n=2629) (n=2612)
Corporate or employer fund . . . . . . . . . . . . . . . . . . . . . . . . . . . . . . . . . . . . . . . . . . . . . . . . . . . . . . . . . . . . . . . . . . . . . . . . . . . . . . . . . . . . . . . . . .na 27 19
Industry fund . . . . . . . . . . . . . . . . . . . . . . . . . . . . . . . . . . . . . . . . . . . . . . . . . . . . . . . . . . . . . . . . . . . . . . . . . . . . . . . . . . . . . . . . . . na 21 33
Public sector fund . . . . . . . . . . . . . . . . . . . . . . . . . . . . . . . . . . . . . . . . . . . . . . . . . . . . . . . . . . . . . . . . . . . . . . . . . . . . . . . . . . . . . . . . . .na 15 18
Self-managed superannuation fund . . . . . . . . . . . . . . . . . . . . . . . . . . . . . . . . . . . . . . . . . . . . . . . . . . . . . . . . . . . . . . . . . . . . . . . . . . . . . . . . . . . . . . . . . .na 14 14
Retail superannuation fund . . . . . . . . . . . . . . . . . . . . . . . . . . . . . . . . . . . . . . . . . . . . . . . . . . . . . . . . . . . . . . . . . . . . . . . . . . . . . . . . . . . . . . . . . .na 7 7
Retirement savings account (RSA) . . . . . . . . . . . . . . . . . . . . . . . . . . . . . . . . . . . . . . . . . . . . . . . . . . . . . . . . . . . . . . . . . . . . . . . . . . . . . . . . . . . . . . . . . .na 5 5
Private fund - bank/insurance . . . . . . . . . . . . . . . . . . . . . . . . . . . . . . . . . . . . . . . . . . . . . . . . . . . . . . . . . . . . . . . . . . . . . . . . . . . . . . . . . . . . . . . . . .na 1 1
Other response . . . . . . . . . . . . . . . . . . . . . . . . . . . . . . . . . . . . . . . . . . . . . . . . . . . . . . . . . . . . . . . . . . . . . . . . . . . . . . . . . . . . . . . . . . na 1 2
Unsure . . . . . . . . . . . . . . . . . . . . . . . . . . . . . . . . . . . . . . . . . . . . . . . . . . . . . . . . . . . . . . . . . . . . . . . . . . . . . . . . . . . . . . . . . . na 21 20
Survey
Approximately how many superannuation or roll-over funds do you have?
And which of the following fund types do you or your employer currently contribute to?
Prompted question.

ANZ Survey of Adult Financial Literacy in Australia (2008) 70
The Social Research Centre
The figures do not match especially well with those from APRA32 which, at June 2007, showed 51% of all superannuation accounts held with a retail fund, 35% with an industry fund, 10% with a public sector fund and 2% with a corporate fund. The APRA report is based on accounts rather than people, so some discrepancy with the survey results might be expected. Nevertheless, there does appear to be confusion amongst consumers about the type of superannuation funds, particularly with respect to the difference between retail and corporate funds.
Members of self-managed superannuation funds were most likely to be found amongst people aged 45 years or over (19%) and those with higher household incomes of $100,000 or more (18%). There were no significant differences in the financial literacy of SMSF members – 16% of quintile five said they belonged to a self-managed superannuation fund as did 13% of those in quintile one and 13% of those in quintile two. That is, around one in ten superannuation fund members with relatively low levels of financial literacy are potentially the investment decision makers for their own superannuation fund.
Further to the issue of belonging to more than one superannuation fund, all members were asked what problems they could see in being a member of more than one fund. Results presented in Table 7.4.1b show that:
The disadvantages mentioned most often were those related to fees including having to deal with multiple administration or management fees (34%) and multiple entry or set-up fees (20%). The potential for losing track of superannuation funds (36%) was also mentioned frequently as a possible problem.
The reasons given were much the same as in 2005 when 36% mentioned multiple administration or management fees, 20% multiple entry or set-up fees and 41% the potential for losing track of superannuation funds.
The responses of those who actually belonged to more than one superannuation fund were similar to those who only belonged to one fund. The only differences were less mention of “losing track of funds” (30% versus 41% of those with only one fund) and greater mention of “multiple administration or management fees” (40% versus 27%). Those with more than one fund were also more likely to see no disadvantages in this situation (13% “none” versus 4% of those with only one fund).
Table 7.4.1b Disadvantages of having more than one superannuation fund
32 “Statistics: Annual Superannuation Bulletin”, Australian Prudential Regulation Authority , June 2007.
Disadvantages of multiple super funds2008
One
Only
More than
One
Base: Have superannuation and under 65 (n=465) (n=233) (n=232)
% % %
Fees
Multiple administration/management fees . . . . . . . . . . . . . . . . . . . . . . . . . . . . . . . . . . . . . . . .34 27 40
Multiple entry/set-up fees . . . . . . . . . . . . . . . . . . . . . . . . . . . . . . . . 20 19 20
Multiple exit fees . . . . . . . . . . . . . . . . . . . . . . . . . . . . . . . . . . . . . 12 13 11
Fees/ additional fees . . . . . . . . . . . . . . . . . . . . . . . . . . . . . . . . . . . . . 3 3 4
Other disadvantages
Lose track of them . . . . . . . . . . . . . . . . . . . . . . . . . . . . . . . . . . . . . . . . 36 41 30
Return not as good/Limited growth . . . . . . . . . . . . . . . . . . . . . . . . . . . . . . . . . . . . . . . .6 6 5
All other disadvantages . . . . . . . . . . . . . . . . . . . . . . . . . . . . . . . . . . . . . . 2 2 3
None . . . . . . . . . . . . . . . . . . . . . . . . . . . . . . . . . . . . . . . . . . . . . . . . . . . . . . . .. 9 4 13
Can't say . . . . . . . . . . . . . . . . . . . . . . . . . . . . . . . . . . . . . . . . . . . . . . . . . . . . . . . 16 23 10
As far as you're aware, what are the potential problems
with having more than one superannuation fund?
No of funds
Unprompted question, multiple responses allowed

ANZ Survey of Adult Financial Literacy in Australia (2008) 71
The Social Research Centre
7.4.2 Understanding of superannuation
To test understanding of superannuation, fund members were asked about some of its regulatory requirements, its taxation treatment, their own use and understanding of fund statements, the advantages of superannuation over other types of investment and the ways in which the performance of a superannuation fund might be assessed.
Regulatory requirements and tax treatment of superannuation
Regulatory requirements and the taxation of superannuation were addressed through the questions shown in Table 7.4.2a.
Virtually all those asked (96%) were aware that employers are required to make superannuation payments on behalf of their employees and that employees can make superannuation contributions in addition to the payments made by employers (90%). These results did not differ significantly from those in the 2005 survey.
There was however, more uncertainty in relation to the tax treatment of superannuation. Here 58% of those asked thought that superannuation is taxed at a lower rate than other investments, 10% thought the taxation rate was the same, 5% thought it was higher and 27% were unsure. The proportion who thought superannuation was taxed at a lower rate did not differ significantly from the 2005 results. However, in 2008 fewer respondents thought tax on superannuation was higher than on other investments (down 4 points from 9% to 5%) although more were unsure as to how the tax rate compared (up 5 points from 22% to 27%).
Those least likely to choose the lower taxation rate option included females (53% versus 63% of males) and people from financial literacy quintiles one (39%) and two (32%) rather than those from quintiles four (65%) and five (75%).
Table 7.4.2a Understanding of regulatory requirements and taxation of superannuation
Understanding of superannuation 2002 2005 2008
% % %
Base: Have superannuation, employed and under 65 (n=1616) (n=1897) (n=1684)
True . . . . . . . . . . . . . . . . . . . . . . . . . . . . . . . . . . . . . . . . . . . . . . . . . . . . . . . . . . . . . . . . . . . . . . . . . . . . . . . . . . . . . . . . . . 97 97 96
False . . . . . . . . . . . . . . . . . . . . . . . . . . . . . . . . . . . . . . . . . . . . . . . . . . . . . . . . . . . . . . . . . . . . . . . . . . . . . . . . . . . . . . . . . . 3 2 3
Unsure . . . . . . . . . . . . . . . . . . . . . . . . . . . . . . . . . . . . . . . . . . . . . . . . . . . . . . . . . . . . . . . . . . . . . . . . . . . . . . . . . . . . . . . . . . - 1 1
Base: Have superannuation, employed and under 65 (n=1616) (n=1897) (n=1684)
True . . . . . . . . . . . . . . . . . . . . . . . . . . . . . . . . . . . . . . . . . . . . . . . . . . . . . . . . . . . . . . . . . . . . . . . . . . . . . . . . . . . . . . . . . . 5 6 6
False . . . . . . . . . . . . . . . . . . . . . . . . . . . . . . . . . . . . . . . . . . . . . . . . . . . . . . . . . . . . . . . . . . . . . . . . . . . . . . . . . . . . . . . . . . 91 92 90
Unsure . . . . . . . . . . . . . . . . . . . . . . . . . . . . . . . . . . . . . . . . . . . . . . . . . . . . . . . . . . . . . . . . . . . . . . . . . . . . . . . . . . . . . . . . . . 4 2 4
Is superannuation taxed at a lower, higher or the same rate as other investments?
Base: Have superannuation, employed and under 65 na (n=1897) (n=550)
Lower rate . . . . . . . . . . . . . . . . . . . . . . . . . . . . . . . . . . . . . . . . . . . . . . . . . . . . . . . . . . . . . . . . . . . . . . . . . . . . . . . . . . . . . . . . . . na 56 58
Higher rate . . . . . . . . . . . . . . . . . . . . . . . . . . . . . . . . . . . . . . . . . . . . . . . . . . . . . . . . . . . . . . . . . . . . . . . . . . . . . . . . . . . . . . . . . . na 9 5
The same rate . . . . . . . . . . . . . . . . . . . . . . . . . . . . . . . . . . . . . . . . . . . . . . . . . . . . . . . . . . . . . . . . . . . . . . . . . . . . . . . . . . . . . . . . . .na 13 10
Unsure . . . . . . . . . . . . . . . . . . . . . . . . . . . . . . . . . . . . . . . . . . . . . . . . . . . . . . . . . . . . . . . . . . . . . . . . . . . . . . . . . . . . . . . . . . na 22 27
Survey
Employees cannot make superannuation payments additional to any
payments made by their employer
Employers are required by law to make superannuation payments
on behalf of their employees
Prompted question.
Base: A randomly selected subset of all eligible respondents in 2008, all eligible respondents in 2005
Base: All eligible respondents for each survey

ANZ Survey of Adult Financial Literacy in Australia (2008) 72
The Social Research Centre
Superannuation fund statements
Information was also sought on members’ understanding of superannuation fund statements. As shown in Table 7.4.2b:
Seventy-five percent of fund members both received and read their superannuation statements, not significantly different from the 76% reported in 2005.
Eight percent of superannuation fund members said they did not personally receive statements from their fund while a further 17% said they received statements but did not read them. Neither of these results differed significantly from those reported in 2005.
Those most likely to be in these groups included young people under 25 years of age (16% of whom said they did not receive statements, 31% received them but didn’t read them) and people aged 70 years or over (29% said they didn’t receive statements).
Table 7.4.2b Reading and understanding superannuation fund statements
All those who received superannuation fund statements but did not read them were asked why this was the case. As shown in Table 7.4.2c, the reasons mentioned most often were:
Those relating to a lack of interest – 36% “couldn’t be bothered”, 14% “don’t have the time”, 13% feel that “other things are more important” and 4% “just assume they’re correct”.
A further 23% found their statements too difficult to understand. Females (30%) were significantly more likely than males (14%) to give this response.
Table 7.4.2c Reasons for not reading superannuation fund statements
Reasons for not reading superannuation statements 2008
Base: Did not read superannuation fund statement (n=131)
%
Lack of time/interest
Couldn't be bothered. . . . . . . . . . . . . . . . . . . . . . . . . . . . . . . . . . . . . . . . . . . . . . . . . . . . . . . . . . . . . . . . . . . . .36
Don't have time . . . . . . . . . . . . . . . . . . . . . . . . . . . . . . . . . . . . . . . . . . . . . . . . . . . . . . . . . . . . . . . . . . . . .14
Other priorities more important . . . . . . . . . . . . . . . . . . . . . . . . . . . . . . . . . . . . . . . . . . . . . . . . . . . . . . . . . . . . . . . . . . . . .13
Just assume they're correct/ok . . . . . . . . . . . . . . . . . . . . . . . . . . . . . . . . . . . . . . . . . . . . . . . . . . . . . . . . . . . . . . . . . . . . .4
Other reasons
Too difficult to understand . . . . . . . . . . . . . . . . . . . . . . . . . . . . . . . . . . . . . . . . . . . . . . . . . . . . . . . . . . . . . . . . . . . . .23
Someone else reads them . . . . . . . . . . . . . . . . . . . . . . . . . . . . . . . . . . . . . . . . . . . . . . . . . . . . . . . . . . . . . . . . . . . . .8
All other reasons . . . . . . . . . . . . . . . . . . . . . . . . . . . . . . . . . . . . . . . . . . . . . . . . . . . . . . . . . . . . . . . . . . . . .12
Unsure/Can't recall . . . . . . . . . . . . . . . . . . . . . . . . . . . . . . . . . . . . . . . . . . . . . . . . . . . . . . . . . . . . . . . . . . . . . . . . . . .4
Unprompted question, multiple responses allowed.
Why don't you read your superannuation or rollover fund statements?
Reading superannuation statements 2005 2008
% %
Base: Have superannuation (n= 2629) (n=845)
Don't recall receiving fund statements . . . . . . . . . . . . . . . . . . . . . . . . . . . . . . . . . . . . . . . . . . . . . . . . . . . . . . . . . . . . . . . . . . . . . . . . . . . 9 8
Receive fund statements but don't read them . . . . . . . . . . . . . . . . . . . . . . . . . . . . . . . . . . . . . . . . . . . . . . . . . . . . . . . . . . . . . . . . . . . . . . . . . . . 15 17
Receive fund statements and read them . . . . . . . . . . . . . . . . . . . . . . . . . . . . . . . . . . . . . . . . . . . . . . . . . . . . . . . . . . . . . . . . . . . . . . . . . . . 76 75
Do you receive superannuation fund statements?
IF YES: Do you read these?
Survey
Base: A randomly selected subset of eligible respondents in 2008, all eligible respondents in 2005.
Due to a different question format, 2002 results are not comparable.

ANZ Survey of Adult Financial Literacy in Australia (2008) 73
The Social Research Centre
These reasons were much the same as in 2005 apart from a slight decrease (from 10% to 4%) in the proportion who said they just assume their statements are correct.
Those who did read the statements from their superannuation fund were asked what they generally looked for when they did this. As shown in Table 7.4.2d:
Fund members were most likely to look for information on the performance and current value of their fund: specifically the investment return (42%) and the current value of their investment (38%).
After this, topics of interest included the management fees charged for operating their fund (21%), issues relating to the fund’s administration including checking everything is right (14%) and looking at the breakdown of investments (12%), and details of employer (12%) and personal (7%) contributions to the fund.
Compared with 2005, there was greater mention of more specific aspects such as fund performance, the fees and the breakdown of the investments. There was less mention of just generally checking the accuracy of the statement.
Table 7.4.2d Things looked for when reading superannuation fund statements
Things looked for when reading superannuation fund
statements 2005 2008
% %
Base: Read superannuation fund statements (n=1011) (n=644)
Fund performance/value
Value of investment . . . . . . . . . . . . . . . . . . . . . . . . . . . . . . . . . . . . . . . . . . . . . . . . . . . . . . . . . . . . . . . . . . . . . . . . . . . 44 38
Investment return/performance . . . . . . . . . . . . . . . . . . . . . . . . . . . . . . . . . . . . . . . . . . . . . . . . . . . . . . . . . . . . . . . . . . . . . . . . . . . 36 42
Balance of account . . . . . . . . . . . . . . . . . . . . . . . . . . . . . . . . . . . . . . . . . . . . . . . . . . . . . . . . . . . . . . . . . . . . . . . . . . . - 6
Costs of operating fund
Management fees . . . . . . . . . . . . . . . . . . . . . . . . . . . . . . . . . . . . . . . . . . . . . . . . . . . . . . . . . . . . . . . . . . . . . . . . . . . 16 21
Exit fees . . . . . . . . . . . . . . . . . . . . . . . . . . . . . . . . . . . . . . . . . . . . . . . . . . . . . . . . . . . . . . . . . . . . . . . . . . . 5 8
Administrative issues/arrangements
To check everything is right . . . . . . . . . . . . . . . . . . . . . . . . . . . . . . . . . . . . . . . . . . . . . . . . . . . . . . . . . . . . . . . . . . . . . . . . . . . 26 14
Break down of investments . . . . . . . . . . . . . . . . . . . . . . . . . . . . . . . . . . . . . . . . . . . . . . . . . . . . . . . . . . . . . . . . . . . . . . . . . . . 4 12
Details of fund beneficiaries . . . . . . . . . . . . . . . . . . . . . . . . . . . . . . . . . . . . . . . . . . . . . . . . . . . . . . . . . . . . . . . . . . . . . . . . . . . 1 2
Insurance information/benefits . . . . . . . . . . . . . . . . . . . . . . . . . . . . . . . . . . . . . . . . . . . . . . . . . . . . . . . . . . . . . . . . . . . . . . . . . . . 2 3
Contribution information
Employer contributions . . . . . . . . . . . . . . . . . . . . . . . . . . . . . . . . . . . . . . . . . . . . . . . . . . . . . . . . . . . . . . . . . . . . . . . . . . . 10 12
Personal contributions . . . . . . . . . . . . . . . . . . . . . . . . . . . . . . . . . . . . . . . . . . . . . . . . . . . . . . . . . . . . . . . . . . . . . . . . . . . 7 7
All other things . . . . . . . . . . . . . . . . . . . . . . . . . . . . . . . . . . . . . . . . . . . . . . . . . . . . . . . . . . . . . . . . . . . . . . . . . . . 2 8
Nothing in particular . . . . . . . . . . . . . . . . . . . . . . . . . . . . . . . . . . . . . . . . . . . . . . . . . . . . . . . . . . . . . . . . . . . . . . . . . . . 5 3
Unprompted question, multiple responses allowed.
And what do you generally look for when you read your superannuation
fund statements?
Survey

ANZ Survey of Adult Financial Literacy in Australia (2008) 74
The Social Research Centre
As a final measure of the communication effectiveness of superannuation fund statements, all those who received them were asked whether they found annual statements from a superannuation fund difficult or easy to understand. Results are presented in Table 7.4.2e.
Approximately two-thirds (65%) of those who received a superannuation fund statement said they found such statements “easy” to understand – 12% “very easy”, 53% “easy”.
Conversely, 31% found it “difficult” (4% “very difficult”, 27% “difficult”) to understand these statements. While this result is not significantly different from 2005, it is lower than the 36% who found it “difficult” to read an annual superannuation statement in 2002.
Those most likely to be experiencing difficulty in understanding superannuation fund statements in 2008 included people with low financial literacy scores (46% of those in quintile one versus 25% of those in quintile five) and those who received statements but did not read them (50%).
Table 7.4.2e Ease of understanding an annual superannuation fund statement
Ease of understanding superannuation statements 2002 2005 2008
% % %
Base: Receive superannuation fund statements (n=1132) (n=1192) (n=777)
Very difficult . . . . . . . . . . . . . . . . . . . . . . . . . . . . . . . . . . . . . . . . . . . . . . . . . . . . . . . . . . . . . . . . . . . . . . . . . . . 5 6 4
Difficult . . . . . . . . . . . . . . . . . . . . . . . . . . . . . . . . . . . . . . . . . . . . . . . . . . . . . . . . . . . . . . . . . . . . . . . . . . . 31 28 27
Net: "Difficult" . . . . . . . . . . . . . . . . . . . . . . . . . . . . . . . . . . . . . . . . . . . . . . . . . . . . . . . . . . . . . . . . . . . . . . . . . . . 36 34 31
Easy . . . . . . . . . . . . . . . . . . . . . . . . . . . . . . . . . . . . . . . . . . . . . . . . . . . . . . . . . . . . . . . . . . . . . . . . . . . 48 52 53
Very easy . . . . . . . . . . . . . . . . . . . . . . . . . . . . . . . . . . . . . . . . . . . . . . . . . . . . . . . . . . . . . . . . . . . . . . . . . . . 13 12 12
Net: "Easy" . . . . . . . . . . . . . . . . . . . . . . . . . . . . . . . . . . . . . . . . . . . . . . . . . . . . . . . . . . . . . . . . . . . . . . . . . . . 61 64 65
Can't say . . . . . . . . . . . . . . . . . . . . . . . . . . . . . . . . . . . . . . . . . . . . . . . . . . . . . . . . . . . . . . . . . . . . . . . . . . . 3 3 4
Prompted question
Base: A randomly selected subset of eligible respondents in each survey
Do you find understanding an annual statement for a superannuation
fund ….
Survey

ANZ Survey of Adult Financial Literacy in Australia (2008) 75
The Social Research Centre
Superannuation fund performance
As discussed earlier (see Table 7.4.2d), many of those who read their superannuation statements looked for information on the performance of their fund. To better understand how people assess fund performance, two questions were asked.
The first of these required respondents to select the best indicator of fund performance from the list shown in Table 7.4.2f.
Slightly more than two-thirds of those asked (68%) selected “the amount of return left after the fees are taken out”, less than the 77% who chose this alternative in 2005. In the 2008 survey, respondents were more likely to select “the return” (12% versus 8% in 2005) or were unable to select any of the responses (13% versus 8% in 2005).
Those in quintile one were the most likely to be unable to select an alternative (36%) compared with just 3% of quintile five who were unable to do this.
Table 7.4.2f Indicators of superannuation fund performance
The second question asked respondents about the sorts of things that can result in under-performance by a superannuation or other managed investment fund. Things mentioned most frequently included (see Table 7.4.2g):
Failure to contribute sufficient funds (22%);
Poor choice of fund including choosing a fund which is unsuitable for current circumstances (eg: a conservative fund for a person with many years until retirement) or selecting a fund with a very high risk profile (both 10%); and
The lack of a long term investment focus including withdrawing money early (15%) and frequently switching funds (6%).
In addition, 42% didn’t know what factors resulted in a reduction of the final value of a superannuation fund. Those most likely to be in this situation were young people aged 18-24 years (62%) and members of quintiles one (60%) and two (61%).
There was no significant difference from the responses given in 2005 apart from slightly fewer mentions of “switching funds” (down from 11% to 6%), possibly a result of this topic having a higher profile in 2005 when the choice of fund legislation was introduced.
Superannuation fund performance 2005 2008
% %
Base: Have superannuation, employed and under 65 (n= 1897) (n=550)
The amount of return left after the fees are taken out . . . . . . . . . . . . . . . . . . . . . . . . . . . . . . . . . . . . . . . . . . . . . . . . . . . . . . . . . . . . . . . . . . . . . . . . . . . 77 68
The return . . . . . . . . . . . . . . . . . . . . . . . . . . . . . . . . . . . . . . . . . . . . . . . . . . . . . . . . . . . . . . . . . . . . . . . . . . . 8 12
The per-unit cost . . . . . . . . . . . . . . . . . . . . . . . . . . . . . . . . . . . . . . . . . . . . . . . . . . . . . . . . . . . . . . . . . . . . . . . . . . . 4 5
The fees . . . . . . . . . . . . . . . . . . . . . . . . . . . . . . . . . . . . . . . . . . . . . . . . . . . . . . . . . . . . . . . . . . . . . . . . . . . 3 2
Can't say . . . . . . . . . . . . . . . . . . . . . . . . . . . . . . . . . . . . . . . . . . . . . . . . . . . . . . . . . . . . . . . . . . . . . . . . . . . 8 13
Survey
Which one of the following gives the best indication of how your
superannuation fund or managed investment is performing?
Prompted question.
Base: A randomly selected subset of all eligible respondents in 2008, all eligible respondents in 2005

ANZ Survey of Adult Financial Literacy in Australia (2008) 76
The Social Research Centre
Table 7.4.2g Indicators of superannuation fund under-performance
Superannuation fund under-performance 2008
%
Base: Have superannuation, employed and under 65 (n=550)
Not contributing sufficient funds . . . . . . . . . . . . . . . . . . . . . . . . . . . . . . . . . . . . . . . . . . . . . . . . . . . . . . . . . . . . . . . . . . . . . . . . . . . 22
Poor choice of fund
Poor fund choice for life circumstances . . . . . . . . . . . . . . . . . . . . . . . . . . . . . . . . . . . . . . . . . . . . . . . . . . . . . . . . . . . . . . . . . . . . . . . . . . . 10
Selecting a fund with a very high risk profile . . . . . . . . . . . . . . . . . . . . . . . . . . . . . . . . . . . . . . . . . . . . . . . . . . . . . . . . . . . . . . . . . . . . . . . . . . . 10
Choosing a fund with high fees and charges . . . . . . . . . . . . . . . . . . . . . . . . . . . . . . . . . . . . . . . . . . . . . . . . . . . . . . . . . . . . . . . . . . . . . . . . . . . 7
Poor fund management . . . . . . . . . . . . . . . . . . . . . . . . . . . . . . . . . . . . . . . . . . . . . . . . . . . . . . . . . . . . . . . . . . . . . . . . . . . 2
Short term focus
Withdrawing money early . . . . . . . . . . . . . . . . . . . . . . . . . . . . . . . . . . . . . . . . . . . . . . . . . . . . . . . . . . . . . . . . . . . . . . . . . . . 15
Switching funds frequently . . . . . . . . . . . . . . . . . . . . . . . . . . . . . . . . . . . . . . . . . . . . . . . . . . . . . . . . . . . . . . . . . . . . . . . . . . . 6
Not considering long term performance . . . . . . . . . . . . . . . . . . . . . . . . . . . . . . . . . . . . . . . . . . . . . . . . . . . . . . . . . . . . . . . . . . . . . . . . . . . 5
Switching as soon as performance drops . . . . . . . . . . . . . . . . . . . . . . . . . . . . . . . . . . . . . . . . . . . . . . . . . . . . . . . . . . . . . . . . . . . . . . . . . . . 3
Relying on short term performance . . . . . . . . . . . . . . . . . . . . . . . . . . . . . . . . . . . . . . . . . . . . . . . . . . . . . . . . . . . . . . . . . . . . . . . . . . . 3
All other things . . . . . . . . . . . . . . . . . . . . . . . . . . . . . . . . . . . . . . . . . . . . . . . . . . . . . . . . . . . . . . . . . . . . . . . . . . . 11
Can't say . . . . . . . . . . . . . . . . . . . . . . . . . . . . . . . . . . . . . . . . . . . . . . . . . . . . . . . . . . . . . . . . . . . . . . . . . . . 42
Unprompted question, multiple responses allowed.
What are the types of things people commonly do that often result in the
final value of superannuation or managed investments being reduced?

ANZ Survey of Adult Financial Literacy in Australia (2008) 77
The Social Research Centre
Advantages of superannuation over other investments
Those superannuation fund members who were under 65 years of age were asked what advantages they thought superannuation offered compared to other investments. As shown in Table 7.4.2h, these respondents most often referred to:
The tax advantages associated with superannuation including favourable tax treatment of contributions (30%), tax-free pension payments for those aged 60 years or over (8%) and the tax-free status of a superannuation fund that is paying a pension (6%).
The fact that the money is locked away so you can’t get at it (29%) and perceptions of superannuation as a secure, low risk investment (15%).
One in five (20%) of those asked were unable to nominate any advantage of superannuation. This occurred most frequently amongst young people aged 18-24 years (35%) and members of quintiles one (46%) and two (34%).
Table 7.4.2h Advantages of superannuation over other investments
Advantages of superannuation over other investments 2008
Base: Have superannuation and under 65 years (n=766)
%
Tax related advantages
Lower tax/favourable tax treatment of contributions . . . . . . . . . . . . . . . . . . . . . . . . . . . . . . . . . . . . . . . . . . . . . . . . . . . . . . . . . . . . . . . . . . . . . . . . . . . .30
No tax on payments if you're 60 years or over . . . . . . . . . . . . . . . . . . . . . . . . . . . . . . . . . . . . . . . . . . . . . . . . . . . . . . . . . . . . . . . . . . . . . . . . . . . .8
No tax on superannuation fund if it's paying a pension . . . . . . . . . . . . . . . . . . . . . . . . . . . . . . . . . . . . . . . . . . . . . . . . . . . . . . . . . . . . . . . . . . . . . . . . . . . .6
Nature of investment
Money is locked away so you can't get at it . . . . . . . . . . . . . . . . . . . . . . . . . . . . . . . . . . . . . . . . . . . . . . . . . . . . . . . . . . . . . . . . . . . . . . . . . . . .29
Secure/safe /low risk . . . . . . . . . . . . . . . . . . . . . . . . . . . . . . . . . . . . . . . . . . . . . . . . . . . . . . . . . . . . . . . . . . . . . . . . . . . .15
Long term investment gives good return . . . . . . . . . . . . . . . . . . . . . . . . . . . . . . . . . . . . . . . . . . . . . . . . . . . . . . . . . . . . . . . . . . . . . . . . . . . .7
Other advantages
Government co-contribution . . . . . . . . . . . . . . . . . . . . . . . . . . . . . . . . . . . . . . . . . . . . . . . . . . . . . . . . . . . . . . . . . . . . . . . . . . . .9
Compulsory, regular contributions . . . . . . . . . . . . . . . . . . . . . . . . . . . . . . . . . . . . . . . . . . . . . . . . . . . . . . . . . . . . . . . . . . . . . . . . . . . .6
All other responses . . . . . . . . . . . . . . . . . . . . . . . . . . . . . . . . . . . . . . . . . . . . . . . . . . . . . . . . . . . . . . . . . . . . . . . . . . . .6
Can't say . . . . . . . . . . . . . . . . . . . . . . . . . . . . . . . . . . . . . . . . . . . . . . . . . . . . . . . . . . . . . . . . . . . . . . . . . . . .20
What advantages does superannuation have compared to other types
of investments?
Unprompted question, multiple responses allowed.
Base: A randomly selected subset of all eligible respondents

ANZ Survey of Adult Financial Literacy in Australia (2008) 78
The Social Research Centre
7.4.3 Joining a new superannuation fund
All those who were superannuation fund members were asked if they had ever chosen a superannuation fund33. Those who had chosen a fund were then asked about the extent to which they shop around when arranging a new fund. Those who don’t shop around at all were asked why not. Results are shown in Table 7.4.3a which shows that:
42% of superannuation fund members said they had chosen a superannuation fund at some time.
Table 7.4.3a Comparison shopping for a superannuation fund
33 This was not directly comparable with the question used in 2005 which asked fund members if they had ever had the ability to choose a superannuation fund.
Shopping around for superannuation funds 2008
%
Base: Have superannuation (n=1296)
Yes have chosen superannuation fund . . . . . . . . . . . . . . . . . . . . . . . . . . . . . . . . . . . . . . . . . . . . . . . . . . . . . . . . . . . . . . . . . . . . . . . . . 42
No, have not chosen superannuation fund . . . . . . . . . . . . . . . . . . . . . . . . . . . . . . . . . . . . . . . . . . . . . . . . . . . . . . . . . . . . . . . .58
Base: Have chosen super fund (n=524)
A lot . . . . . . . . . . . . . . . . . . . . . . . . . . . . . . . . . . . . . . . . . . . . . . . . . . . . . . . . . . . . . . . . . . . . . . . . . 9
A fair bit . . . . . . . . . . . . . . . . . . . . . . . . . . . . . . . . . . . . . . . . . . . . . . . . . . . . . . . . . . . . . . . . 18
A little . . . . . . . . . . . . . . . . . . . . . . . . . . . . . . . . . . . . . . . . . . . . . . . . . . . . . . . . . . . . . . . . 44
Net: Any shopping round at all. . . . . . . . . . . . . . . . . . . . . . . . . . . . . . . . . . . . . . . . . . . . . . . . . . . . . . . . . . . . . . . .71
Not at all . . . . . . . . . . . . . . . . . . . . . . . . . . . . . . . . . . . . . . . . . . . . . . . . . . . . . . . . . . . . . . . . 28
Can't say . . . . . . . . . . . . . . . . . . . . . . . . . . . . . . . . . . . . . . . . . . . . . . . . . . . . . . . . . . . . . . . . 1
Base: Don't shop around for super fund (n=150)
Already had relationship with/happy with a provider . . . . . . . . . . . . . . . . . . . . . . . . . . . . . . . . . . . . . . . . . . . . . . . . . . . . . . . . . . . . . . . . . . . . .19
Take someone else's advice
Go with recommendation of financial expert . . . . . . . . . . . . . . . . . . . . . . . . . . . . . . . . . . . . . . . . . . . . . . . . . . . . . . . . . . . . . . . . . . . . .11
Just go with what is recommended by friend/family member . . . . . . . . . . . . . . . . . . . . . . . . . . . . . . . . . . . . . . . . . . . . . . . . . . . . . . . . . . . . . . . . . . . . .10
Spouse/partner does shopping around. . . . . . . . . . . . . . . . . . . . . . . . . . . . . . . . . . . . . . . . . . . . . . . . . . . . . . . . . . . . . . . . . . . . .1
Lack of time/interest
Couldn't be bothered. . . . . . . . . . . . . . . . . . . . . . . . . . . . . . . . . . . . . . . . . . . . . . . . . . . . . . . . . . . . . . . . . . . . .16
Just went with employer/industry fund . . . . . . . . . . . . . . . . . . . . . . . . . . . . . . . . . . . . . . . . . . . . . . . . . . . . . . . . . . . . . . . . . . . . .11
Don't have the time . . . . . . . . . . . . . . . . . . . . . . . . . . . . . . . . . . . . . . . . . . . . . . . . . . . . . . . . . . . . . . . . . . . . .8
"They're all the same" . . . . . . . . . . . . . . . . . . . . . . . . . . . . . . . . . . . . . . . . . . . . . . . . . . . . . . . . . . . . . . . . . . . . .5
Lack of knowledge/information
Lack of knowledge about superannuation . . . . . . . . . . . . . . . . . . . . . . . . . . . . . . . . . . . . . . . . . . . . . . . . . . . . . . . . . . . . . . . . . . . . .7
Too difficult to make comparisons/get information . . . . . . . . . . . . . . . . . . . . . . . . . . . . . . . . . . . . . . . . . . . . . . . . . . . . . . . . . . . . . . . . . . . . .4
Set up own self-managed fund . . . . . . . . . . . . . . . . . . . . . . . . . . . . . . . . . . . . . . . . . . . . . . . . . . . . . . . . . . . . . . . . . . . . .4
All other reasons . . . . . . . . . . . . . . . . . . . . . . . . . . . . . . . . . . . . . . . . . . . . . . . . . . . . . . . . . . . . . . . . . . . . .9
Unsure/Can't recall . . . . . . . . . . . . . . . . . . . . . . . . . . . . . . . . . . . . . . . . . . . . . . . . . . . . . . . . . . . . . . . . . . . . . . . . . . .3
Unprompted question, multiple responses allowed.
Have you ever chosen a superannuation fund?
When arranging a new superannuation policy, do you shop
around …
What is the main reason you don't shop around?
Base: A randomly selected subset of all eligible respondents
Prompted question.

ANZ Survey of Adult Financial Literacy in Australia (2008) 79
The Social Research Centre
Of those who had chosen a fund, 71% said they shop around when arranging a new superannuation fund - 44% “a little”, 18% “a fair bit” and 9% “a lot”.
Just over one in four (28%) said they do not shop around at all. Financial literacy amongst this group was slightly lower than amongst those who do shop around at all (mean FLS of 90.4 versus 95.0)
Reasons for not shopping around that were mentioned most often included:
o The presence of an existing, satisfactory relationship with a superannuation provider (19%), and
o Lack of interest in the issue - 16% couldn’t be bothered, 11% just went with their employer or industry fund, and 8% didn’t have the time.
In addition to questions about comparison shopping, all fund members under 65 years of age and in paid employment were asked what factors they would consider when choosing a superannuation fund. As shown in Table 7.4.3b, the things considered most often were:
The fees, charges and costs (41%);
The performance of the fund (25% long-term performance and 16% recent level of performance) and the returns achieved (9%); and
The nature of the fund and its investment strategy - that is, the overall risk level (18%) and whether high and low risk investment options are available (8%).
Table 7.4.3b Consideration factors when choosing a superannuation fund
Compared to 2005, there was:
Less mention of fund performance (long-term performance down from 33% to 25%, short-term performance down from 20% to 16%) and investment options (down from 16% to 8%); and
More frequent mention of fees (up from 37% to 41%), fund risk and the degree of diversification (between them up 4 points to 23%) and comparative ratings by superannuation fund rating organisations (up 4 points to 4%).
Considerations when choosing a super fund 2008
Base: Have superannuation, employed and under 65 (n=550)
%
Performance
Long-term level of performance . . . . . . . . . . . . . . . . . . . . . . . . . . . . . . . . . . . . . . . .25
Recent level of performance . . . . . . . . . . . . . . . . . . . . . . . . . . . . . . . . 16
Investment returns achieved by the fund. . . . . . . . . . . . . . . . . . . . . . . . . . . . . . . . . . . . .9
Costs
Fees/charges/costs . . . . . . . . . . . . . . . . . . . . . . . . . . . . . . . . . . . . . . . . 41
Nature of fund/investments
How risky the fund is . . . . . . . . . . . . . . . . . . . . . . . . . . . . . . . . . . . . . 18
Investment options offered/High risk and low risk . . . . . . . . . . . . . . . . . . . . . . . . . . . . . . . . . . . . . . . .8
Diversity/types of investments . . . . . . . . . . . . . . . . . . . . . . . . . . . . . . . . . . . . . .6
Reputation/Recommendation
Recommendation by people you trust . . . . . . . . . . . . . . . . . . . . . . . . . . . . . . . . . . . . .7
Reputable/trustworthy . . . . . . . . . . . . . . . . . . . . . . . . . . . . . . . . . . . . . 9
Comparative ratings by rating organisations . . . . . . . . . . . . . . . . . . . . . . . . . . . . . . . . . . . . .4
Additional services/benefits
Availability of expert advice . . . . . . . . . . . . . . . . . . . . . . . . . . . . . . . . . . . . . . 5
Extra benefits like life insurance . . . . . . . . . . . . . . . . . . . . . . . . . . . . . . . . . . . . . .1
Other considerations . . . . . . . . . . . . . . . . . . . . . . . . . . . . . . . . . . . . . . 13
Can't say . . . . . . . . . . . . . . . . . . . . . . . . . . . . . . . . . . . . . . . . . . . . . . . . . . . . . . . . .18
What things would you consider when choosing a
superannuation fund?
Unprompted question, multiple responses allowed.
Base: Randomly selected subset of eligible respondents

ANZ Survey of Adult Financial Literacy in Australia (2008) 80
The Social Research Centre
7.5 Retirement Planning and Expectations This section examines the community’s expectations about the role of government in filling any retirement funding shortfall as well as their views on retirement income requirements and how to calculate these.
Expectations of government support in retirement
All respondents under 65 years of age were asked whether they agreed or disagreed with the statement “I don’t think it really matters much about superannuation or planning and saving for retirement because the government will make up the gap”. As shown in Table 7.5.1a:
The great majority of under 65’s (91%) disagreed with this statement indicating most people of this age feel they will need to self-fund their retirement.
The overall level of disagreement was slightly lower than in 2005 when 94% of under 65’s disagreed with this statement. At the same time the proportion who “strongly disagree” has increased significantly (from 49% to 57%) since 2005.
Strong disagreement with the view expressed by this statement appeared to be income dependent - 67% of those with household incomes of $100,000 or more strongly disagreed versus 40% of those with household incomes of less than $25,000. As people with higher household incomes would be the most likely to have difficulty meeting eligibility requirements for Centrelink payments, this finding is not unexpected. However, along with the increase in “strong” disagreement, it does point to greater realism in the role government is expected to play in making up any gaps in retirement funding.
Table 7.5.1a Expectations of government support for retirees
Expectations of government support 2005 2008
Base: Under 65 years (n=1516) (n=2821)
% %
Strongly agree . . . . . . . . . . . . . . . . . . . . . . . . . . . . . . . . . . . . . . . . . . . . . . . . . . . . . . . . . . . . . . . . . . . . . . . . . . . .1 1
Agree . . . . . . . . . . . . . . . . . . . . . . . . . . . . . . . . . . . . . . . . . . . . . . . . . . . . . . . . . . . . . . . . . . . . . . . . . . . . 4 5
Net: "Agree" . . . . . . . . . . . . . . . . . . . . . . . . . . . . . . . . . . . . . . . . . . . . . . . . . . . . . . . . . . . . . . . . . . . . . . . . . . . .5 6
Strongly disagree . . . . . . . . . . . . . . . . . . . . . . . . . . . . . . . . . . . . . . . . . . . . . . . . . . . . . . . . . . . . . . . . . . . . . . . . . . . .49 57
Disagree . . . . . . . . . . . . . . . . . . . . . . . . . . . . . . . . . . . . . . . . . . . . . . . . . . . . . . . . . . . . . . . . . . . . . . . . . . . .45 34
Net: "Disagree" . . . . . . . . . . . . . . . . . . . . . . . . . . . . . . . . . . . . . . . . . . . . . . . . . . . . . . . . . . . . . . . . . . . . . . . . . . . .94 91
Can't say . . . . . . . . . . . . . . . . . . . . . . . . . . . . . . . . . . . . . . 1 3
Survey
I don't think it really matters much about superannuation or planning and
saving for retirement because the government will make up the gap
Unprompted question, multiple responses allowed.
Base: Randomly selected subset of eligible respondents in 2005, all eligible respondents in 2008
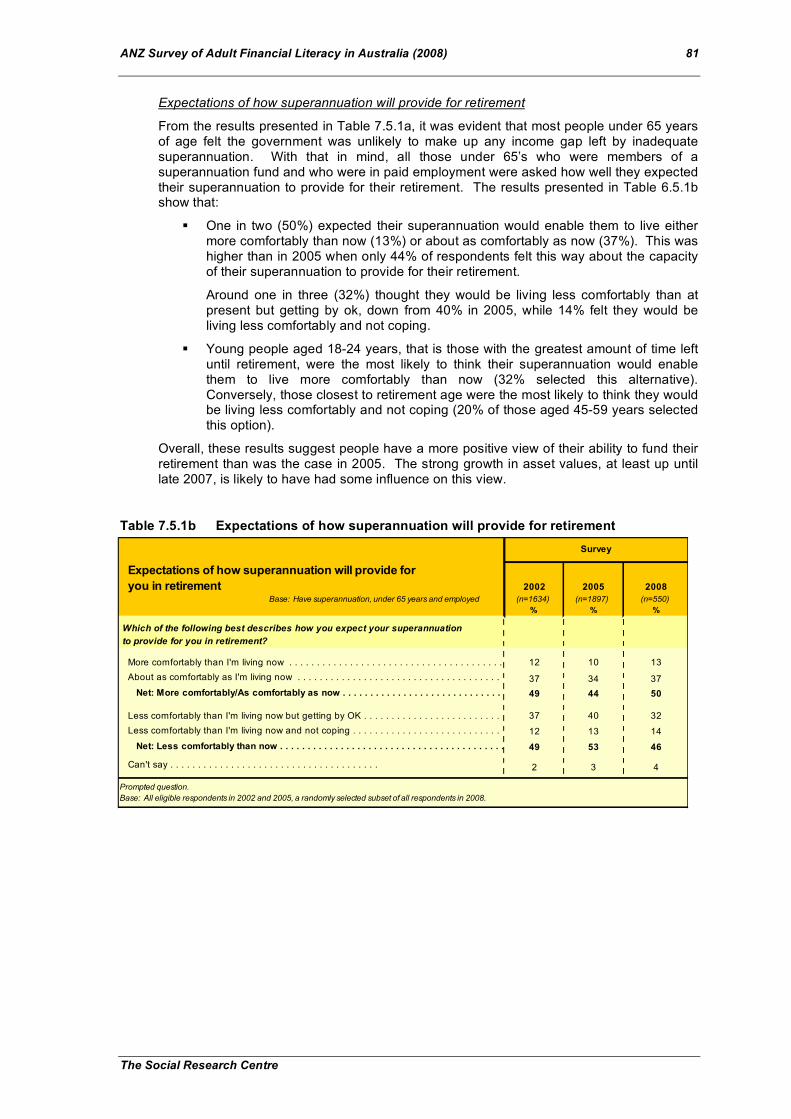
ANZ Survey of Adult Financial Literacy in Australia (2008) 81
The Social Research Centre
Expectations of how superannuation will provide for retirement
From the results presented in Table 7.5.1a, it was evident that most people under 65 years of age felt the government was unlikely to make up any income gap left by inadequate superannuation. With that in mind, all those under 65’s who were members of a superannuation fund and who were in paid employment were asked how well they expected their superannuation to provide for their retirement. The results presented in Table 6.5.1b show that:
One in two (50%) expected their superannuation would enable them to live either more comfortably than now (13%) or about as comfortably as now (37%). This was higher than in 2005 when only 44% of respondents felt this way about the capacity of their superannuation to provide for their retirement.
Around one in three (32%) thought they would be living less comfortably than at present but getting by ok, down from 40% in 2005, while 14% felt they would be living less comfortably and not coping.
Young people aged 18-24 years, that is those with the greatest amount of time left until retirement, were the most likely to think their superannuation would enable them to live more comfortably than now (32% selected this alternative). Conversely, those closest to retirement age were the most likely to think they would be living less comfortably and not coping (20% of those aged 45-59 years selected this option).
Overall, these results suggest people have a more positive view of their ability to fund their retirement than was the case in 2005. The strong growth in asset values, at least up until late 2007, is likely to have had some influence on this view.
Table 7.5.1b Expectations of how superannuation will provide for retirement
Expectations of how superannuation will provide for
you in retirement 2002 2005 2008
Base: Have superannuation, under 65 years and employed (n=1634) (n=1897) (n=550)
% % %
More comfortably than I'm living now . . . . . . . . . . . . . . . . . . . . . . . . . . . . . . . . . . . . . . . . . . . . . . . . . . . . . . . . . . . . . . . . . . . . . . . . . . . .12 10 13
About as comfortably as I'm living now . . . . . . . . . . . . . . . . . . . . . . . . . . . . . . . . . . . . . . . . . . . . . . . . . . . . . . . . . . . . . . . . . . . . . . . . . . . .37 34 37
Net: More comfortably/As comfortably as now . . . . . . . . . . . . . . . . . . . . . . . . . . . . . . . . . . . . . . . . . . . . . . . . . . . . . . . . . . . . . . . . . . . . . . . . . . . .49 44 50
Less comfortably than I'm living now but getting by OK . . . . . . . . . . . . . . . . . . . . . . . . . . . . . . . . . . . . . . . . . . . . . . . . . . . . . . . . . . . . . . . . . . . . . . . . . . . .37 40 32
Less comfortably than I'm living now and not coping . . . . . . . . . . . . . . . . . . . . . . . . . . . . . . . . . . . . . . . . . . . . . . . . . . . . . . . . . . . . . . . . . . . . . . . . . . . .12 13 14
Net: Less comfortably than now . . . . . . . . . . . . . . . . . . . . . . . . . . . . . . . . . . . . . . . . . . . . . . . . . . . . . . . . . . . . . . . . . . . . . . . . . . . .49 53 46
Can't say . . . . . . . . . . . . . . . . . . . . . . . . . . . . . . . . . . . . . . 2 3 4
Which of the following best describes how you expect your superannuation
to provide for you in retirement?
Survey
Prompted question.
Base: All eligible respondents in 2002 and 2005, a randomly selected subset of all respondents in 2008.

ANZ Survey of Adult Financial Literacy in Australia (2008) 82
The Social Research Centre
Income required for retirement
In order to understand the income levels people think they might require in retirement, the same fund members (under 65 years, in paid employment) were asked if they had identified a figure for how much they thought they would need to live on when they retired. Those who had done so, were asked what annual income they thought they would need. As shown in Table 7.5.1c:
27% of these respondents had identified a figure. Older people aged 45-59 years (34% versus just 13% of those aged 18-24 years) and those with higher personal incomes of $80,000 or more (46%) were the most likely to have done so. Those who had identified a figure also had a higher mean financial literacy score (98.0) than those who had not done so (mean FLS 90.1).
The proportion who said they had identified a figure was lower than in 2005 (down 8 points from 35% to 27%). While there is no clear reason for this decline it is evident that the great majority of the superannuation fund members who were asked this question had not identified an income target their retirement.
Those who had identified a figure were most likely to nominate an annual income between $25,000 and $75,000 with an average income of just on $60,000. Those with a partner nominated a higher amount than did singles ($61,800 versus $53,700) as did those with household incomes of $100,000 or more ($69,500 versus $44,200 for those with household incomes below $80,000).
For the most part these figures appear realistic suggesting those who have identified an income figure have put some thought into establishing this number. Nevertheless there also appears to be a significant number of people, for example 66% of those aged 45-59 years, who have not identified a target retirement income despite being at an age where retirement planning might be expected to have become more specific.
Table 7.5.1c Expected retirement income requirement
Expectations of required retirement income 2005 2008
% %
Base: Have superannuation, under 65 and employed (n=1897) (n=550)
Yes have identified a figure . . . . . . . . . . . . . . . . . . . . . . . . . . . . . . . . . . . . . . . . . . . . . . . . . . . . . . . . . . . . . . . . . . . . . . . . . 35 27
No, have not identified a figure . . . . . . . . . . . . . . . . . . . . . . . . . . . . . . . . . . . . . . . . . . . . . . . . . . . . . . . . . . . . . . . .64 73
Can't say . . . . . . . . . . . . . . . . . . . . . . . . . . . . . . . . . . . . . . . . . . . . . . . . . . . . . . . . . . . . . . . .1 1
Approximately how much per year do you think you will need?
Base: Have identified an amount na (n=155)
Less than $15,000 . . . . . . . . . . . . . . . . . . . . . . . . . . . . . . . . . . . . . . . . . . . . . . . . . . . . . . . . . . . . . . . . . . . . . . . . . na 1
$15,000 to $24,999 . . . . . . . . . . . . . . . . . . . . . . . . . . . . . . . . . . . . . . . . . . . . . . . . . . . . . . . . . . . . . . . . . . . . . . . . . na 4
$25,000 to $49,999 . . . . . . . . . . . . . . . . . . . . . . . . . . . . . . . . . . . . . . . . . . . . . . . . . . . . . . . . . . . . . . . . . . . . . . . . . na 34
$50,000 to $74,999 . . . . . . . . . . . . . . . . . . . . . . . . . . . . . . . . . . . . . . . . . . . . . . . . . . . . . . . . . . . . . . . . . . . . . . . . . na 32
$75,000 to $99,999 . . . . . . . . . . . . . . . . . . . . . . . . . . . . . . . . . . . . . . . . . . . . . . . . . . . . . . . . . . . . . . . . . . . . . . . . . na 10
$100,000 or more . . . . . . . . . . . . . . . . . . . . . . . . . . . . . . . . . . . . . . . . . . . . . . . . . . . . . . . . . . . . . . . . . . . . . . . . . na 15
Unsure . . . . . . . . . . . . . . . . . . . . . . . . . . . . . . . . . . . . . . . . . . . . . . . . . . . . . . . . . . . . . . . . . . . . . . . . . . .na 4
Survey
Have you identified a figure for how much per year you
will need to live on when you retire?
Unprompted question. Not asked in 2005.
Base: All eligible respondents in 2005, randomly selected subset of eligible respondents in 2008

ANZ Survey of Adult Financial Literacy in Australia (2008) 83
The Social Research Centre
Factors to consider and sources of information when calculating retirement funding
The same fund members were also asked what factors should be taken into account when calculating the adequacy of current retirement funding. From Table 6.5.1d it is evident that respondents were most likely to mention:
Their expected living standards in retirement including the costs that might have to be met (37%), their current cost of living (32%) and their desired standard of living in retirement (24%)
Their expected future financial situation including expected investment earnings (11%), home ownership (11%), the value of assets on retirement (10%), the time left until retirement (14%), current level of savings (11%) and their expected superannuation benefits (10%), and
Their expected life span (14%).
There were no significant differences from the responses recorded in the 2005 survey.
Table 7.5.1d Factors to consider when calculating adequacy of retirement funding
Factors influencing perceived adequacy of retirement funding 2008
%
Base: Have superannuation, under 65 and employed (n=550)
Expected future living standards/requirements
Costs might need to meet during retirement . . . . . . . . . . . . . . . . . . . . . . . . . . . . . . . . . . . . . . . . . . . . . . . . . . . . . . . . . . . . . . . . . . . . . . . . . 37
Current cost of living . . . . . . . . . . . . . . . . . . . . . . . . . . . . . . . . . . . . . . . . . . . . . . . . . . . . . . . . . . . . . . . .32
Desired standard of living in retirement . . . . . . . . . . . . . . . . . . . . . . . . . . . . . . . . . . . . . . . . . . . . . . . . . . . . . . . . . . . . . . . .24
Inflation/Expected inflation . . . . . . . . . . . . . . . . . . . . . . . . . . . . . . . . . . . . . . . . . . . . . . . . . . . . . . . . . . . . . . . . . . . . . . . . . 10
State of health . . . . . . . . . . . . . . . . . . . . . . . . . . . . . . . . . . . . . . . . . . . . . . . . . . . . . . . . . . . . . . . .5
Family dependencies . . . . . . . . . . . . . . . . . . . . . . . . . . . . . . . . . . . . . . . . . . . . . . . . . . . . . . . . . . . . . . . .3
Expected future financial situation
Length of time before retirement . . . . . . . . . . . . . . . . . . . . . . . . . . . . . . . . . . . . . . . . . . . . . . . . . . . . . . . . . . . . . . . . . . . . . . . . . 14
Expected earnings from investments . . . . . . . . . . . . . . . . . . . . . . . . . . . . . . . . . . . . . . . . . . . . . . . . . . . . . . . . . . . . . . . . . . . . . . . . . 11
Whether own home or not . . . . . . . . . . . . . . . . . . . . . . . . . . . . . . . . . . . . . . . . . . . . . . . . . . . . . . . . . . . . . . . . . . . . . . . . . 11
Current savings . . . . . . . . . . . . . . . . . . . . . . . . . . . . . . . . . . . . . . . . . . . . . . . . . . . . . . . . . . . . . . . . . . . . . . . . . 11
Value of assets on retirement . . . . . . . . . . . . . . . . . . . . . . . . . . . . . . . . . . . . . . . . . . . . . . . . . . . . . . . . . . . . . . . . . . . . . . . . . 10
Expected superannuation benefits . . . . . . . . . . . . . . . . . . . . . . . . . . . . . . . . . . . . . . . . . . . . . . . . . . . . . . . . . . . . . . . . . . . . . . . . . 10
Eligibility for pension/government benefits . . . . . . . . . . . . . . . . . . . . . . . . . . . . . . . . . . . . . . . . . . . . . . . . . . . . . . . . . . . . . . . . . . . . . . . . . 6
Current level of debt and ability to rerepay . . . . . . . . . . . . . . . . . . . . . . . . . . . . . . . . . . . . . . . . . . . . . . . . . . . . . . . . . . . . . . . . . . . . . . . . . 6
Whether or not will do some paid work after retiring. . . . . . . . . . . . . . . . . . . . . . . . . . . . . . . . . . . . . . . . . . . . . . . . . . . . . . . . . . . . . . . . . . . . . . . . . 5
Other factors
Expected life span . . . . . . . . . . . . . . . . . . . . . . . . . . . . . . . . . . . . . . . . . . . . . . . . . . . . . . . . . . . . . . . . . . . . . . . . . 14
All other factors mentioned . . . . . . . . . . . . . . . . . . . . . . . . . . . . . . . . . . . . . . . . . . . . . . . . . . . . . . . . . . . . . . . . . . . . . . . . . . .7
Unsure . . . . . . . . . . . . . . . . . . . . . . . . . . . . . . . . . . . . . . . . . . . . . . . . . . . . . . . . . . . . . . . . . . . . . . . . . . .16
Unprompted question, multiple responses allowed.
Base: All eligible respondents in '05, randomly selected subset of eligible respondents in '08
What factors would someone need to take into account if they were
trying to calculate whether their current arrangements were enough
for future retirement?

ANZ Survey of Adult Financial Literacy in Australia (2008) 84
The Social Research Centre
These same superannuation fund members were also asked what sources they would use to obtain information on how much they might need for retirement. As shown in Table 7.5.1e:
By far the most frequently mentioned source of information was a financial planner or adviser (48%). This was followed by other finance professionals such as an accountant or tax specialist (14%).
Apart from finance professionals, there was also relatively frequent mention of:
o The internet (12% general internet search, 9% specific internet sites), and
o Information from family or friends (11%).
Those aged 45-59 years were the most likely to mention finance professionals (78% mentioned at least one of the finance professionals shown in Table 7.5.1e versus 68% of the total sample) while 18-24 years olds were the most likely to mention seeking advice from family or friends (24%).
These results were not significantly different from those reported in 2005, apart from an increase in the mention of internet search options (up from 6% in 2005 to 12% for general internet search).
Table 7.5.1e Sources of information for working out amount needed for retirement
Sources of information on how much needed for retirement 2008
%
Base: Have superannuation, under 65 and employed (n=550)
Finance professional
Financial planner or adviser . . . . . . . . . . . . . . . . . . . . . . . . . . . . . . . . . . . . . . . . . . . . . . . . . . . . . . . . . . . . . . . . . . . . . . . . . 48
An accountant or tax specialist. . . . . . . . . . . . . . . . . . . . . . . . . . . . . . . . . . . . . . . . . . . . . . . . . . . . . . . . . . . . . . . .14
Bank manager or bank employee . . . . . . . . . . . . . . . . . . . . . . . . . . . . . . . . . . . . . . . . . . . . . . . . . . . . . . . . . . . . . . . . . . . . . . . . . 6
Financial counsellor . . . . . . . . . . . . . . . . . . . . . . . . . . . . . . . . . . . . . . . . . . . . . . . . . . . . . . . . . . . . . . . . . . . . . . . . . 7
My superannuation fund . . . . . . . . . . . . . . . . . . . . . . . . . . . . . . . . . . . . . . . . . . . . . . . . . . . . . . . . . . . . . . . . . . . . . . . . . 6
Superannuation seminars . . . . . . . . . . . . . . . . . . . . . . . . . . . . . . . . . . . . . . . . . . . . . . . . . . . . . . . . . . . . . . . . . . . . . . . . . 2
Other source/Own research
Family or friends . . . . . . . . . . . . . . . . . . . . . . . . . . . . . . . . . . . . . . . . . . . . . . . . . . . . . . . . . . . . . . . .11
Specific internet site . . . . . . . . . . . . . . . . . . . . . . . . . . . . . . . . . . . . . . . . . . . . . . . . . . . . . . . . . . . . . . . . . . . . . . . . . 9
General search on the internet . . . . . . . . . . . . . . . . . . . . . . . . . . . . . . . . . . . . . . . . . . . . . . . . . . . . . . . . . . . . . . . . . . . . . . . . . 12
Would work it out myself . . . . . . . . . . . . . . . . . . . . . . . . . . . . . . . . . . . . . . . . . . . . . . . . . . . . . . . . . . . . . . . . . . . . . . . . . 4
All other sources mentioned . . . . . . . . . . . . . . . . . . . . . . . . . . . . . . . . . . . . . . . . . . . . . . . . . . . . . . . . . . . . . . . . . . . . . . . . . . .7
Unsure . . . . . . . . . . . . . . . . . . . . . . . . . . . . . . . . . . . . . . . . . . . . . . . . . . . . . . . . . . . . . . . . . . . . . . . . . . .9
Unprompted question, multiple responses allowed.
Base: All eligible respondents in '05, randomly selected subset of eligible respondents in '08
Where would you get information on how much you need
for retirement?

ANZ Survey of Adult Financial Literacy in Australia (2008) 85
The Social Research Centre
7.6 Retirement income This section looks at retirement income stream products including the incidence and type of products held and the acquisition process for them. Given their potential to supplement retirement income, consideration is also given to the incidence of reverse equity loans in this section.
7.6.1 Incidence and types of retirement income stream products
All respondents were asked if they held retirement income stream products. As mentioned earlier, 20% of those aged 55 years or over said they did. Those aged 55 years or over who said they had a retirement income stream product were asked what type of product it was. As shown in Table 7.6.1a34:
The types of products mentioned most often were allocated pensions (37%), lifetime pensions or annuities (24%), life expectancy and market-linked pensions or annuities (both 15%).
Some changes were evident since 2005, in particular significant increases in the reported use of allocated pensions (up from 16% to 37%) and market-linked pensions or annuities (up from 8% to 15%) while the reported use of lifetime pensions and annuities (down from 45% to 24%) has decreased. These are in-line with changes made under Simpler Super which enhanced the flexibility of allocated pensions and removed the 50% discount previously applied to lifetime pensions and annuities by Centrelink’s age pension assets test.
Table 7.6.1a Incidence and types of retirement income products
34 The descriptions used in the survey for each product type are shown in italics
Incidence and type of retirement income
stream products 2005 2008
% %
Base: All aged 55 years or over (n=1096) (n=1303)
Yes have a retirement income stream product . . . . . . . . . . . . . . . . . . . . . . . . . . . . . . . . . . . . . . . . . . . . . . . . . . . . . . . . . . . . . . . . . . . . . . . . . 24 20
No don't have this type of product . . . . . . . . . . . . . . . . . . . . . . . . . . . . . . . . . . . . . . . . . . . . . . . . . . . . . . . . . . . . . . . .76 80
Base: Have retirement income stream product and aged 55 years or over (n=261) (n=255)
Lifetime pension/annuity
A set income that you receive for the rest of your life . . . . . . . . . . . . . . . . . . . . . . . . . . . . . . . . . . . . . . . . . . . . . . . . . . . . . . . . . . . . . . . . . . . . . . . . . 45 24
Allocated pension
A regular income you receive until the money runs out that can adjust from
year to year and that is linked to the investment market . . . . . . . . . . . . . . . . 16 37
Life expectancy pension/annuity
A set income that you receive for a term based on your life expectancy . . . . . . . . . . . . . . . . . . . . . . . . . . . . . . . . . . . . . . . . . . . . . . . . . . . . . . . . . . . . . . . . . . . . . . . . . 12 15
Market linked pension/annuity
A set income that you receive for a term based on your life expectancy that
is linked to the investment market . . . . . . . . . . . . . . . . . . . . . . . . . . . . . . . . .. 8 15
Fixed term pension/annuity
A set income that you receive for a specified term (eg: 10 years). . . . . . . . . . . . . . . . . . . . . . . . . . . . . . . . . . . . . . . . . . . . . . . . . . . . . . . . . . . . . . . . . . . . . . . . . 10 10
Other type . . . . . . . . . . . . . . . . . . . . . . . . . . . . . . . . . . . . . . . . . . . . . . . . . . . . . . . . . . . . . . . . . . . . . . . . . . .14 8
Unsure . . . . . . . . . . . . . . . . . . . . . . . . . . . . . . . . . . . . . . . . . . . . . . . . . . . . . . . . . . . . . . . . . . . . . . . . . . .5 7
Survey
Incidence of retirement income stream products
Which of the following best matches the features of the retirement
income stream product you have?
Prompted question, multiple responses allowed.

ANZ Survey of Adult Financial Literacy in Australia (2008) 86
The Social Research Centre
7.6.2 Acquisition of retirement income stream products
All those who held a retirement income stream product of any sort were asked how much they shop around when arranging a new product of this type. Those who do not shop around were asked why not. Responses are shown in Table 7.6.2a.
57% reported some degree of comparison shopping for this type of product, a slight increase on the figure of 42% reported in the 2005 survey.
Table 7.6.2a Comparison shopping for retirement income products
As shown in Table 7.6.2b, those who said they do not shop around (40%) were most likely to mention an existing relationship with a provider of these products (34%) or acting on the advice of a financial expert (32%). These results were consistent with those recorded in 2005.
Table 7.6.2b Reasons for not shopping around for retirement income products
Shopping around for retirement income products 2005 2008
% %
Base: Have arranged a new retirement income stream product/55 yrs + (n=93)** (n=228)
A lot . . . . . . . . . . . . . . . . . . . . . . . . . . . . . . . . . . . . . . . . . . . . . . . . . . . . . . . . . . . . . . . . . . . . . . . . . 7 14
A fair bit . . . . . . . . . . . . . . . . . . . . . . . . . . . . . . . . . . . . . . . . . . . . . . . . . . . . . . . . . . . . . . . . 14 16
A little . . . . . . . . . . . . . . . . . . . . . . . . . . . . . . . . . . . . . . . . . . . . . . . . . . . . . . . . . . . . . . . . 21 27
Net: Any shopping round at all. . . . . . . . . . . . . . . . . . . . . . . . . . . . . . . . . . . . . . . . . . . . . . . . . . . . . . . . . . . . . . . .42 57
Not at all . . . . . . . . . . . . . . . . . . . . . . . . . . . . . . . . . . . . . . . . . . . . . . . . . . . . . . . . . . . . . . . . 52 40
Never needed to do this/can't say . . . . . . . . . . . . . . . . . . . . . . . . . . . . . . . . . . . . . . . . . . . . . . . . . . . . . . . . . . . . . . . .6 3
Survey
When arranging a new retirement income stream product, do
you shop around ….
Prompted question.
Base: Randomly selected subset of eligible respondents in 2005, all eligible respondents in 2008.
** Caution small sample size. Results are indicative only
Why not shop around for retirement income products2008
%
What is the main reason you don't shop around?
Base: Do not shop around for retirement income stream product/55 yrs+ (n=92)**
Already had relationship with/happy with a provider . . . . . . . . . . . . . . . . . . . . . . . . . . . . . . . . . . . . . . . . . . . . . . . . . . . . . . . . . . . . . . . . . . . . .34
Take someone else's advice
Go with recommendation of financial expert/broker . . . . . . . . . . . . . . . . . . . . . . . . . . . . . . . . . . . . . . . . . . . . . . . . . . . . . . . . . . . . . . . . . . . . .32
Just go with what is recommended by friend/family member . . . . . . . . . . . . . . . . . . . . . . . . . . . . . . . . . . . . . . . . . . . . . . . . . . . . . . . . . . . . . . . . . . . . .6
Spouse/partner does shopping around . . . . . . . . . . . . . . . . . . . . . . . . . . . . . . . . . . . . . . . . . . . . . . . . . . . . . . . . . . . . . . . . . . . . .-
Lack of time/interest
Couldn't be bothered. . . . . . . . . . . . . . . . . . . . . . . . . . . . . . . . . . . . . . . . . . . . . . . . . . . . . . . . . . . . . . . . . . . . .4
"They're all the same" . . . . . . . . . . . . . . . . . . . . . . . . . . . . . . . . . . . . . . . . . . . . . . . . . . . . . . . . . . . . . . . . . . . . .1
Don't have the time . . . . . . . . . . . . . . . . . . . . . . . . . . . . . . . . . . . . . . . . . . . . . . . . . . . . . . . . . . . . . . . . . . . . .3
Too difficult to make comparisons/get information . . . . . . . . . . . . . . . . . . . . . . . . . . . . . . . . . . . . . . . . . . . . . . . . . . . . . . . . . . . . . . . . . . . . .4
Have no say/only one scheme available . . . . . . . . . . . . . . . . . . . . . . . . . . . . . . . . . . . . . . . . . . . . . . . . . . . . . . . . . . . . . . . . . . . . .10
All other reasons . . . . . . . . . . . . . . . . . . . . . . . . . . . . . . . . . . . . . . . . . . . . . . . . . . . . . . . . . . . . . . . . . . . . .9
Unsure/Can't recall . . . . . . . . . . . . . . . . . . . . . . . . . . . . . . . . . . . . . . . . . . . . . . . . . . . . . . . . . . . . . . . . . . . . . . . . . . .6
Unprompted question, multiple responses allowed.
** Caution small sample size. Results are indicative only
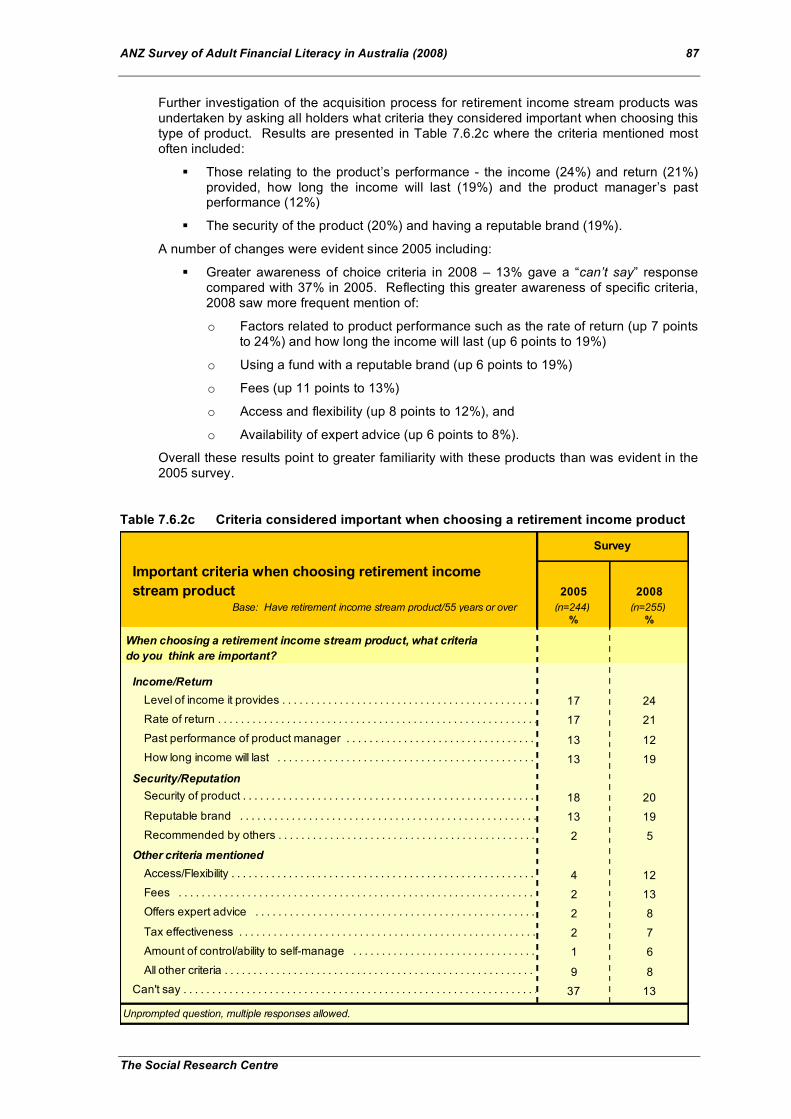
ANZ Survey of Adult Financial Literacy in Australia (2008) 87
The Social Research Centre
Further investigation of the acquisition process for retirement income stream products was undertaken by asking all holders what criteria they considered important when choosing this type of product. Results are presented in Table 7.6.2c where the criteria mentioned most often included:
Those relating to the product’s performance - the income (24%) and return (21%) provided, how long the income will last (19%) and the product manager’s past performance (12%)
The security of the product (20%) and having a reputable brand (19%).
A number of changes were evident since 2005 including:
Greater awareness of choice criteria in 2008 – 13% gave a “can’t say” response compared with 37% in 2005. Reflecting this greater awareness of specific criteria, 2008 saw more frequent mention of:
o Factors related to product performance such as the rate of return (up 7 points to 24%) and how long the income will last (up 6 points to 19%)
o Using a fund with a reputable brand (up 6 points to 19%)
o Fees (up 11 points to 13%)
o Access and flexibility (up 8 points to 12%), and
o Availability of expert advice (up 6 points to 8%).
Overall these results point to greater familiarity with these products than was evident in the 2005 survey.
Table 7.6.2c Criteria considered important when choosing a retirement income product
Important criteria when choosing retirement income
stream product 2005 2008
Base: Have retirement income stream product/55 years or over (n=244) (n=255)
% %
Income/Return
Level of income it provides . . . . . . . . . . . . . . . . . . . . . . . . . . . . . . . . . . . . . . . . . . . . . . . . . . . . . . . . . . . . . . . . . . . . . . . . . . . .17 24
Rate of return . . . . . . . . . . . . . . . . . . . . . . . . . . . . . . . . . . . . . . . . . . . . . . . . . . . . . . . . . . . . . . . . . . . . . . . . . . . .17 21
Past performance of product manager . . . . . . . . . . . . . . . . . . . . . . . . . . . . . . . . . . . . . . . . . . . . . . . . . . . . . . . . . . . . . . . . . . . . . . . . . . . .13 12
How long income will last . . . . . . . . . . . . . . . . . . . . . . . . . . . . . . . . . . . . . . . . . . . . . . . . . . . . . . . . . . . . . . . . . . . . . . . . . . . .13 19
Security/Reputation
Security of product . . . . . . . . . . . . . . . . . . . . . . . . . . . . . . . . . . . . . . . . . . . . . . . . . . . . . . . . . . . . . . . . . . . . . . . . . . . .18 20
Reputable brand . . . . . . . . . . . . . . . . . . . . . . . . . . . . . . . . . . . . . . . . . . . . . . . . . . . . . . . . . . . . . . . . . . . . . . . . . . . .13 19
Recommended by others . . . . . . . . . . . . . . . . . . . . . . . . . . . . . . . . . . . . . . . . . . . . . . . . . . . . . . . . . . . . . . . . . . . . . . . . . . . .2 5
Other criteria mentioned
Access/Flexibility . . . . . . . . . . . . . . . . . . . . . . . . . . . . . . . . . . . . . . . . . . . . . . . . . . . . . . . . . . . . . . . . . . . . . . . . . . . .4 12
Fees . . . . . . . . . . . . . . . . . . . . . . . . . . . . . . . . . . . . . . . . . . . . . . . . . . . . . . . . . . . . . . . . . . . . . . . . . . . .2 13
Offers expert advice . . . . . . . . . . . . . . . . . . . . . . . . . . . . . . . . . . . . . . . . . . . . . . . . . . . . . . . . . . . . . . . . . . . . . . . . . . . .2 8
Tax effectiveness . . . . . . . . . . . . . . . . . . . . . . . . . . . . . . . . . . . . . . . . . . . . . . . . . . . . . . . . . . . . . . . . . . . . . . . . . . . .2 7
Amount of control/ability to self-manage . . . . . . . . . . . . . . . . . . . . . . . . . . . . . . . . . . . . . . . . . . . . . . . . . . . . . . . . . . . . . . . . . . . . . . . . . . . .1 6
All other criteria . . . . . . . . . . . . . . . . . . . . . . . . . . . . . . . . . . . . . . . . . . . . . . . . . . . . . . . . . . . . . . . . . . . . . . . . . . . .9 8
Can't say . . . . . . . . . . . . . . . . . . . . . . . . . . . . . . . . . . . . . . . . . . . . . . . . . . . . . . . . . . . . . . . . . . . . . . . . . . . .37 13
Unprompted question, multiple responses allowed.
Survey
When choosing a retirement income stream product, what criteria
do you think are important?

ANZ Survey of Adult Financial Literacy in Australia (2008) 88
The Social Research Centre
7.6.3 Reverse equity loans
All respondents aged 60 years or over were asked if they knew what a reverse equity loan was and, if so, what things they would consider when deciding whether or not to take out a loan of this type. As shown in Table 7.6.3a:
More than one in two (54%) of those aged 60 years or over either didn’t know (51%) or were unsure (3%) what a reverse equity loan was. Those from financial literacy quintiles one (72%) and two (63%) were the most likely to give these responses.
By contrast, affirmative responses to this question were most likely to come from members of financial literacy quintiles three (57%), four (66%) and five (73%).
When asked what things they would consider when deciding whether or not to take out one of these products, 14% of those who knew what a reverse equity loan was said they would never take one out while another 33% said they didn’t know what to consider. Apart from this, the considerations mentioned most often were:
o The interest rate (13%)
o Life expectancy (11%)
o Conditions of the loan (11%), and
o The size of the loan that would be required (10%).
Given that 54% didn’t know what a reverse equity loan was and one in three of those who did (another 15% of all those aged 60 years or over) didn’t know what to consider when deciding whether or not to take one out, this product appears to be unfamiliar to the majority of the 60 years plus population.
Table 7.6.3a Knowledge of reverse equity loans
Knowledge of reverse equity loans 2008
%
Do you know what a reverse equity loan is?
Base: Total sample aged 60 years or over (n=954)
Yes, know what it is . . . . . . . . . . . . . . . . . . . . . . . . . . . . . . . . . . . . . . . . . . . . . . . . . . . . . . . . . . . . . . . . . . . . . . . . . 46
No, don't know what it is . . . . . . . . . . . . . . . . . . . . . . . . . . . . . . . . . . . . . . . . . . . . . . . . . . . . . . . . . . . . . . . .51
Unsure . . . . . . . . . . . . . . . . . . . . . . . . . . . . . . . . . . . . . . . . . . . . . . . . . . . . . . . . . . . . . . . .3
Base: Know what reverse equity loan is (n=443)
Would never take one out . . . . . . . . . . . . . . . . . . . . . . . . . . . . . . . . . . . . . . . . . . . . . . . . . . . . . . . . . . . . . . . . . . . . .14
The interest rate . . . . . . . . . . . . . . . . . . . . . . . . . . . . . . . . . . . . . . . . . . . . . . . . . . . . . . . . . . . . . . . . . . . . .13
How long I expect to live . . . . . . . . . . . . . . . . . . . . . . . . . . . . . . . . . . . . . . . . . . . . . . . . . . . . . . . . . . . . . . . . . . . . .11
The conditions of the loan . . . . . . . . . . . . . . . . . . . . . . . . . . . . . . . . . . . . . . . . . . . . . . . . . . . . . . . . . . . . . . . . . . . . .11
The size of the loan that would be needed . . . . . . . . . . . . . . . . . . . . . . . . . . . . . . . . . . . . . . . . . . . . . . . . . . . . . . . . . . . . . . . . . . . . .10
My ongoing expenses . . . . . . . . . . . . . . . . . . . . . . . . . . . . . . . . . . . . . . . . . . . . . . . . . . . . . . . . . . . . . . . . . . . . .9
Whether it was really necessary . . . . . . . . . . . . . . . . . . . . . . . . . . . . . . . . . . . . . . . . . . . . . . . . . . . . . . . . . . . . . . . . . . . . .9
How children feel about it . . . . . . . . . . . . . . . . . . . . . . . . . . . . . . . . . . . . . . . . . . . . . . . . . . . . . . . . . . . . . . . . . . . . .7
Might need the money/equity to move into a retirement village . . . . . . . . . . . . . . . . . . . . . . . . . . . . . . . . . . . . . . . . . . . . . . . . . . . . . . . . . . . . . . . . . . . . .4
All other considerations . . . . . . . . . . . . . . . . . . . . . . . . . . . . . . . . . . . . . . . . . . . . . . . . . . . . . . . . . . . . . . . . . . . . .8
Don't know . . . . . . . . . . . . . . . . . . . . . . . . . . . . . . . . . . . . . . . . . . . . . . . . . . . . . . . . . . . . . . . . . . . . . . . . . . .33
What things would you consider when deciding whether or not
to take out a reverse equity loan?
Unprompted question, multiple responses allowed.

ANZ Survey of Adult Financial Literacy in Australia (2008) 89
The Social Research Centre
7.7 Financial planners Making informed investment decisions is an important aspect of financial literacy and one way of doing this is by obtaining input from a professional financial planner or adviser. This section looks at the community’s use of financial planners and advisers – how widely they are used, how they are chosen and how any potential conflicts of interest in their recommendations are identified.
7.7.1 Use of financial planners
As shown in Table 7.7.1a:
34% of respondents had consulted a financial planner or adviser about their finances. This was the same incidence as in the 2005 survey.
Those most likely to have consulted a financial planner were people aged 55-69 years (48%), that is, those either approaching retirement or recently retired. Use of financial planners was also associated with higher levels of financial literacy (50% of quintile five), household incomes of $100,000 or more (42%) and personal incomes of $80,000 or more (46%).
Conversely, those least likely to have consulted a financial planner were young people aged 18-24 years (13%). Other groups where use of financial planners was below average included those living in areas of greatest relative socio-economic disadvantage (that is, SEIFA group one 29%), those with household incomes less than $25,000 (22%), single parents (27%) and those whose main source of income was a government benefit or allowance (27%).
Table 7.7.1a Use of financial planners
Use of financial planners 2005 2008
% %
Base: Total sample (n=3513) (n=3500)
Yes, have consulted a financial planner or adviser . . . . . . . . . . . . . . . . . . . . . . . . . . . . . . . . . . . . . . . . . . . . . . . . . . . . . . . . . . . . . . . . . . . . . . . . . 34 34
No, have not done so . . . . . . . . . . . . . . . . . . . . . . . . . . . . . . . . . . . . . . . . . . . . . . . . . . . . . . . . . . . . . . . .66 66
Survey
And have you (ever) consulted any of the following people
regarding your finances?
Prompted question where a list of financial service providers (including financial planners/advisers)
was read out to respondents.

ANZ Survey of Adult Financial Literacy in Australia (2008) 90
The Social Research Centre
7.7.2 Choosing a financial adviser
All those who had chosen a financial planner or adviser were asked how much comparison shopping they do when deciding which adviser to use. As shown in Table 7.7.2a:
59% of these respondents say they do at least a little comparison shopping when choosing a financial planner or adviser, not significantly different from the results obtained in 2005 (63%) and 2002 (57%), while
41% said they do not shop around at all, particularly those aged 70 years or over (58%).
Table 7.7.2a Comparison shopping when choosing a financial planner/adviser
Shopping around for financial planners/advisers 2002 2005 2008
% % %
Base: Have chosen a financial adviser (n=792) (n=556) (n=568)
A lot . . . . . . . . . . . . . . . . . . . . . . . . . . . . . . . . . . . . . . . . . . . . . . . . . . . . . . . . . . . . . . . . . . . . . . . . . 12 11 10
A fair bit . . . . . . . . . . . . . . . . . . . . . . . . . . . . . . . . . . . . . . . . . . . . . . . . . . . . . . . . . . . . . . . .15 16 14
A little . . . . . . . . . . . . . . . . . . . . . . . . . . . . . . . . . . . . . . . . . . . . . . . . . . . . . . . . . . . . . . . .30 36 35
Net: Any shopping round at all. . . . . . . . . . . . . . . . . . . . . . . . . . . . . . . . . . . . . . . . . . . . . . . . . . . . . . . . . . . . . . . .57 63 59
Not at all . . . . . . . . . . . . . . . . . . . . . . . . . . . . . . . . . . . . . . . . . . . . . . . . . . . . . . . . . . . . . . . .42 35 41
Can't say . . . . . . . . . . . . . . . . . . . . . . . . . . . . . . . . . . . . . . . . . . . . . . . . . . . . . . . . . . . . . . . .1 2 -
Survey
Prompted question.
In each survey, the base is a randomly selected subset of all eligible respondents.
When choosing a financial planner or adviser,
do you shop around ….

ANZ Survey of Adult Financial Literacy in Australia (2008) 91
The Social Research Centre
Those who do not shop around when choosing a financial planner or adviser were asked why not. As shown in Table 7.7.2b, the reasons given most often for not shopping around were:
The existence of a satisfactory, pre-existing relationship with a financial adviser (31%), and
Taking someone else’s advice – 27% that of a friend or family member, 23% advice from a financial expert.
These responses were not significantly different from those reported in 2005 apart from a slight increase in mentions of a satisfactory existing relationship.
Table 7.7.2b Reasons for not shopping around when choosing a financial planner/ adviser
Shopping around for financial advisers 2008
%
Base: Do not shop around for a financial planner/adviser (n=236)
Already had relationship with/happy with a provider . . . . . . . . . . . . . . . . . . . . . . . . . . . . . . . . . . . . . . . . . . . . . . . . . . . . . . . . . . . . . . . . . . . . .31
Take someone else's advice
Just go with what is recommended by friend/family member . . . . . . . . . . . . . . . . . . . . . . . . . . . . . . . . . . . . . . . . . . . . . . . . . . . . . . . . . . . . . . . . . . . . .27
Go with recommendation of financial expert . . . . . . . . . . . . . . . . . . . . . . . . . . . . . . . . . . . . . . . . . . . . . . . . . . . . . . . . . . . . . . . . . . . . .23
Spouse/partner does shopping around . . . . . . . . . . . . . . . . . . . . . . . . . . . . . . . . . . . . . . . . . . . . . . . . . . . . . . . . . . . . . . . . . . . . .2
Lack of time/interest
Don't have the time . . . . . . . . . . . . . . . . . . . . . . . . . . . . . . . . . . . . . . . . . . . . . . . . . . . . . . . . . . . . . . . . . . . . .3
Couldn't be bothered. . . . . . . . . . . . . . . . . . . . . . . . . . . . . . . . . . . . . . . . . . . . . . . . . . . . . . . . . . . . . . . . . . . . .6
"They're all the same" . . . . . . . . . . . . . . . . . . . . . . . . . . . . . . . . . . . . . . . . . . . . . . . . . . . . . . . . . . . . . . . . . . . . .2
Too difficult to make comparisons/get information . . . . . . . . . . . . . . . . . . . . . . . . . . . . . . . . . . . . . . . . . . . . . . . . . . . . . . . . . . . . . . . . . . . . .5
All other reasons . . . . . . . . . . . . . . . . . . . . . . . . . . . . . . . . . . . . . . . . . . . . . . . . . . . . . . . . . . . . . . . . . . . . .5
Unsure/Can't recall . . . . . . . . . . . . . . . . . . . . . . . . . . . . . . . . . . . . . . . . . . . . . . . . . . . . . . . . . . . . . . . . . . . . . . . . . . .3
What is the main reason you don't shop around?
Unprompted question, multiple responses allowed

ANZ Survey of Adult Financial Literacy in Australia (2008) 92
The Social Research Centre
In addition to comparison shopping, all those who had chosen a financial planner or adviser were asked what things had made them feel positive about the financial planner they had chosen. As shown in Table 7.7.2c:
The perceived competence of the planner (36% mentioned their planner’s “knowledge/ professionalism”);
The quality of service (19% mentioned “friendly, good people skills”, 14% “reliable, efficient service” and 12% “attentive, personal service”); and
Positive reputation either from personal word of mouth (21% mentioned the recommendation of a friend or family member) or the reputation of the brand (16%). The frequent use of recommendations by friends and family members points to the importance of personal networks when choosing a financial planner or adviser.
Table 7.7.2c Reasons for feeling positive about a financial planner
Positive perceptions of financial planners 2008
%
Base: Have chosen a financial planner/adviser (n=568)
Perceived Competence
Knowledge/professionalism . . . . . . . . . . . . . . . . . . . . . . . . . . . . . . . . . . . . . . . . . . . . . . . . . . . . . . . . . . . . . . . . . . . . .36
Gets good results . . . . . . . . . . . . . . . . . . . . . . . . . . . . . . . . . . . . . . . . . . . . . . . . . . . . . . . . . . . . . . . . . . . . .3
Service
Friendly, good people skills . . . . . . . . . . . . . . . . . . . . . . . . . . . . . . . . . . . . . . . . . . . . . . . . . . . . . . . . . . . . . . . . . . . . .19
Reliable, efficient service . . . . . . . . . . . . . . . . . . . . . . . . . . . . . . . . . . . . . . . . . . . . . . . . . . . . . . . . . . . . . . . . . . . . .14
Attentive, personal service . . . . . . . . . . . . . . . . . . . . . . . . . . . . . . . . . . . . . . . . . . . . . . . . . . . . . . . . . . . . . . . . . . . . .12
Recommendation/Reputation
Recommended by friend or family member . . . . . . . . . . . . . . . . . . . . . . . . . . . . . . . . . . . . . . . . . . . . . . . . . . . . . . . . . . . . . . . . . . . . .21
Reputable brand . . . . . . . . . . . . . . . . . . . . . . . . . . . . . . . . . . . . . . . . . . . . . . . . . . . . . . . . . . . . . . . . . . . . .16
Recommended by financial expert . . . . . . . . . . . . . . . . . . . . . . . . . . . . . . . . . . . . . . . . . . . . . . . . . . . . . . . . . . . . . . . . . . . . .9
It's someone I know personally/through work . . . . . . . . . . . . . . . . . . . . . . . . . . . . . . . . . . . . . . . . . . . . . . . . . . . . . . . . . . . . . . . . . . . . .5
Past experience . . . . . . . . . . . . . . . . . . . . . . . . . . . . . . . . . . . . . . . . . . . . . . . . . . . . . . . . . . . . . . . . . . . . .3
Endorsements/Testimonials . . . . . . . . . . . . . . . . . . . . . . . . . . . . . . . . . . . . . . . . . . . . . . . . . . . . . . . . . . . . . . . . . . . . .2
Other reasons
Fees . . . . . . . . . . . . . . . . . . . . . . . . . . . . . . . . . . . . . . . . . . . . . . . . . . . . . . . . . . . . . . . . . . . . .6
Convenience . . . . . . . . . . . . . . . . . . . . . . . . . . . . . . . . . . . . . . . . . . . . . . . . . . . . . . . . . . . . . . . . . . . . .6
Independence . . . . . . . . . . . . . . . . . . . . . . . . . . . . . . . . . . . . . . . . . . . . . . . . . . . . . . . . . . . . . . . . . . . . .4
All other reasons . . . . . . . . . . . . . . . . . . . . . . . . . . . . . . . . . . . . . . . . . . . . . . . . . . . . . . . . . . . . . . . . . . . . .7
No particular reason . . . . . . . . . . . . . . . . . . . . . . . . . . . . . . . . . . . . . . . . . . . . . . . . . . . . . . . . . . . . . . . . . . . . .3
Don't know . . . . . . . . . . . . . . . . . . . . . . . . . . . . . . . . . . . . . . . . . . . . . . . . . . . . . . . . . . . . . . . . . . . . . . . . . . .7
What are the things that made you feel positive about the
financial planner you chose?
Unprompted question, multiple responses allowed
Base is a randomly selected subset of all eligible respondents.

ANZ Survey of Adult Financial Literacy in Australia (2008) 93
The Social Research Centre
7.7.3 Financial planners and conflict of interest
All those who had chosen a financial planner or adviser were asked whether they considered the possibility of their financial planner having conflicts of interest when making investment recommendations. Those who said they did consider this were asked what things they looked at to see if there was a conflict. Results are shown in Table 7.7.3a:
Approximately one in three (35%) said they do not consider whether there are any conflicts of interest in their planner’s investment recommendations.
Members of quintile one were the most likely to say this (48%) while those from quintile five were the least likely to do so (24%).
When asked why they did not consider the possibility of conflict, the most common reason given by this group of respondents was to say they trusted their planner (54% of this group).
A further 9% said they didn’t consider conflict because the planner was a friend or family member, 6% because the planner knew their needs/financial situation and 16% were unable to offer any reason at all.
It appears from these results that those who did not consider the possibility of a conflict were prepared to accept that whatever recommendations the planner made would be in their best interests.
Table 7.7.3a Consideration of financial planners and conflict of interest
Financial planners and conflicts of interest 2008
%
Base: Have chosen a financial planner/adviser (n=568)
Yes consider whether there are conflicts of interest . . . . . . . . . . . . . . . . . . . . . . . . . . . . . . . . . . . . . . . . . . . . . . . . . . . . . . . . . . . . . . . . . . . . . . . . . 58
No don't do this . . . . . . . . . . . . . . . . . . . . . . . . . . . . . . . . . . . . . . . . . . . . . . . . . . . . . . . . . . . . . . . . 35
Have never needed to do this . . . . . . . . . . . . . . . . . . . . . . . . . . . . . . . . . . . . . . . . . . . . . . . . . . . . . . . . . . . . . . . .5
Can't say . . . . . . . . . . . . . . . . . . . . . . . . . . . . . . . . . . . . . . . . . . . . . . . . . . . . . . . . . . . . . . . . 2
Base: Don't consider whether there is a conflict (n=199)
Trust the planner/have confidence in them . . . . . . . . . . . . . . . . . . . . . . . . . . . . . . . . . . . . . . . . . . . . . . . . . . . . . . . . . . . . . . . . . . . . .54
Planner is a family member or friend . . . . . . . . . . . . . . . . . . . . . . . . . . . . . . . . . . . . . . . . . . . . . . . . . . . . . . . . . . . . . . . . . . . . .9
Planner knows personal needs/financial situation . . . . . . . . . . . . . . . . . . . . . . . . . . . . . . . . . . . . . . . . . . . . . . . . . . . . . . . . . . . . . . . . . . . . .6
All other responses . . . . . . . . . . . . . . . . . . . . . . . . . . . . . . . . . . . . . . . . . . . . . . . . . . . . . . . . . . . . . . . . . . . . .15
Don't know . . . . . . . . . . . . . . . . . . . . . . . . . . . . . . . . . . . . . . . . . . . . . . . . . . . . . . . . . . . . . . . . . . . . . . . . . . .16
When your financial planner makes investment recommendations, do you
consider whether they have any conflicts of interest?
Why do you say that?
Unprompted question, multiple responses allowed
Base is a randomly selected subset of all respondents.

ANZ Survey of Adult Financial Literacy in Australia (2008) 94
The Social Research Centre
Also as shown in Table 7.7.3a, 58% of these respondents said they did consider the possibility of conflict when their planner made investment recommendations.
When deciding if a conflict existed, those who considered the possibility were most likely to check to see if the planner receives a commission from the product provider (43%).
Other indicators considered included (see Table 7.7.3b):
o The planner’s fee structure to see if it was based on the amount invested (7%) or a flat fee (5%)
o Whether or not the planner recommends products from more than one provider (19%), particularly those working in upper white collar occupations (24%) and those with household incomes of $150,000 or more (26%), and
o Checking if the planning company is independent (16%).
Table 7.7.3b Things looked at to see if financial planner has a conflict of interest
Financial planners and conflicts of interest 2008
%
Base: Consider whether there is a conflict (n=323)
Fee structure
Whether planner gets a commission from the product provider . . . . . . . . . . . . . . . . . . . . . . . . . . . . . . . . . . . . . . . . . . . . . . . . . . . . . . . . . . . . . . . . . . . . .43
Planner's fee is based on the amount you have invested . . . . . . . . . . . . . . . . . . . . . . . . . . . . . . . . . . . . . . . . . . . . . . . . . . . . . . . . . . . . . . . . . . . . .7
Planner charges a flat fee unrelated to products sold or amount invested . . . . . . . . . . . . . . . . . . . . . . . . . . . . . . . . . . . . . . . . . . . . . . . . . . . . . . . . . . . . . . . . . . . . .5
Recommendation of product from one or more providers (19%)
Planner only recommends products from one provider . . . . . . . . . . . . . . . . . . . . . . . . . . . . . . . . . . . . . . . . . . . . . . . . . . . . . . . . . . . . . . . . . . . . .11
Planner recommends products from different providers . . . . . . . . . . . . . . . . . . . . . . . . . . . . . . . . . . . . . . . . . . . . . . . . . . . . . . . . . . . . . . . . . . . . .10
Planner/Planning company is independent . . . . . . . . . . . . . . . . . . . . . . . . . . . . . . . . . . . . . . . . . . . . . . . . . . . . . . . . . . . . . . . . . . . . .16
Reputation/trustworthiness of company/planner . . . . . . . . . . . . . . . . . . . . . . . . . . . . . . . . . . . . . . . . . . . . . . . . . . . . . . . . . . . . . . . . . . . . .10
All other responses . . . . . . . . . . . . . . . . . . . . . . . . . . . . . . . . . . . . . . . . . . . . . . . . . . . . . . . . . . . . . . . . . . . . .8
Nothing in particular . . . . . . . . . . . . . . . . . . . . . . . . . . . . . . . . . . . . . . . . . . . . . . . . . . . . . . . . . . . . . . . . . . . . .8
Don't know . . . . . . . . . . . . . . . . . . . . . . . . . . . . . . . . . . . . . . . . . . . . . . . . . . . . . . . . . . . . . . . . . . . . . . . . . . .10
What specific things do you look at to see if there is a conflict?
Unprompted question, multiple responses allowed

ANZ Survey of Adult Financial Literacy in Australia (2008) 95
The Social Research Centre
Section 8 Insurance
8.1 Introduction and key findings Those who behave in a financially literate fashion might be expected to protect their financial situation through the use of risk insurance. Hence, this section examines the community incidence, understanding and acquisition of risk insurance products.
Key findings
Incidence of risk insurance
The community incidence of different types of risk insurance varied considerably.
Of those who owned or were purchasing a motor vehicle, 97% held either comprehensive (87%) or third party (10%) insurance. Those with lower personal incomes were more likely to have third party insurance (14% amongst those with personal incomes below $25,000). The high overall incidence of vehicle insurance and the willingness of those with lower incomes to use third party insurance suggest the need for motor vehicle insurance beyond the compulsory component is well understood and acted on.
80% of those who either owned or who were purchasing their home had building insurance and 74% of those who owned, who were purchasing or who were renting their home had contents insurance. Both types of insurance were less likely to be held by people under 35 years of age, those with personal incomes of less than $58,000 and those using a language other than English at home
Of all respondents:
o 55% had private health insurance, most often those aged 35-69 years (60%) earning personal incomes of at least $80,000 per year (80%);
o 34% said they had life insurance35, particularly males aged 35-59 years earning personal incomes of at least $80,000 per year (58%), who had significant debt (61% of males with a mortgage of $300,000 or more) and who had a partner and children living at home (56%).
Of those working full-time, 30% had income protection insurance. Those most likely to have this were people aged 35-44 years (37%), those with personal incomes of $100,000 or more (47%), those with debt commitments (45% amongst people with mortgages of $300,000 or more) and those with a partner and children living at home (38%).
Those with relatively lower levels of financial literacy were significantly less likely to hold the above types of insurance.
Understanding of risk insurance
Of those who have insurance:
o 54% were aware that a claim could be refused if the policyholder did not meet their duty of accurate disclosure, slightly more than the 51% reported in 2005. Forty-six percent (34% “no”, 12% “don’t know”) were not aware of this. Lack of awareness was greatest amongst those aged over 60 years (65%) and those with relatively lower financial literacy (83% of quintile one).
o 68% were aware of the cooling off period for those taking out a new insurance policy, not significantly different from 2005, while 32% were not (14% “no”, 18% “don’t know”). Males aged 18-24 years (48%) and, once again, those with relatively lower financial literacy (42% of quintile one) were the most likely to be unaware of this.
35 This is likely to be an under-estimate as many respondents would have life insurance as part of their superannuation.

ANZ Survey of Adult Financial Literacy in Australia (2008) 96
The Social Research Centre
Acquiring risk insurance
75% of those who had arranged an insurance policy shop around when they do this. The presence of a satisfactory relationship with the insurer was the main reason for not shopping around (49%).
When arranging a new policy (other than life insurance) 47% spontaneously mentioned the level of cover as a factor they take into consideration. This fell to 30% when renewing an insurance policy. These figures were not significantly different from those recorded in the 2005 survey and suggest there has been little improvement in the community’s awareness of the risk of being under-insured.

ANZ Survey of Adult Financial Literacy in Australia (2008) 97
The Social Research Centre
8.2 Incidence of insurance products The need for particular types of insurance is influenced by a person’s specific situation - for example, someone who does not own a motor vehicle does not need motor vehicle insurance. Hence, Table 8.2.1a shows the 2002 and 2008 incidence of insurance products amongst the people who are most likely to need them. For example, it shows the incidence of building insurance amongst those who own or who are purchasing their home, motor vehicle insurance amongst those who own or who are purchasing a motor vehicle and income protection insurance amongst those in full-time paid work. The incidence of private health insurance and life insurance is presented for the total sample.
From Table 8.2.1a it is evident that:
Private health insurance was held by 55% of all respondents, most frequently by those aged 35-69 years (60%). Of all 35-69 year olds, those most likely to have private health insurance were those living with a partner (68%) and those with personal incomes of $80,000 or more (80%).
Of all respondents, 34% said they have life insurance. It should be noted that this figure probably under-estimates the true incidence of life insurance as many respondents will have life insurance cover included in their superannuation. With that proviso, holders of life insurance were most likely to be males (39% versus 30% of females), particularly males aged 35-59 years (52%), who earned annual personal incomes of $80,000 or more (58%), who held a mortgage of $300,000 or more (61%) and who lived in a family household with a partner and dependent children (56%).
Of those respondents who either owned their home, were buying it or who were renting, 74% had contents insurance. Those least likely to have insured the contents of their home included younger people (52% of those aged under 35 years had contents insurance), those facing some degree of socio-economic disadvantage (contents insurance was held by 69% of those with personal incomes under $58,000, 65% of single parents and 57% of those employed on a casual basis) and those people speaking a language other than English at home (57%).
Table 8.2.1a Incidence of insurance products amongst relevant population groups
Insurance products held 2002 2008
% %
Insurance
Base: Total sample (n=3548) (n=3500)
Private health insurance . . . . . . . . . . . . . . . . . . . . . . . . . . . . . . . . . . . . . .57 55
Life insurance . . . . . . . . . . . . . . . . . . . . . . . . . . . . . . . . . . . . . . 33 34
Base: Own/Buying/Renting a home na (n=3413)
Contents insurance . . . . . . . . . . . . . . . . . . . . . . . . . . . . . . . . . . . . . .na 74
Base: Own/Buying a home (n=2688) (n=2579)
Building insurance . . . . . . . . . . . . . . . . . . . . . . . . . . . . . . . . . . . . . .na 80
Net: Building or contents insurance . . . . . . . . . . . . . . . . . . . . . . . . . . . . . . . . . . . . . .86 88
Base: Own/Buying a motor vehicle na (n=2804)
Comprehensive motor vehicle insurance . . . . . . . . . . . . . . . . . . . . . . . . . . . . . . . . . . . . . .na 87
Third party motor vehicle insurance only . . . . . . . . . . . . . . . . . . . . . . . . . . . . . . . . . . . . . .na 10
Base: Working full-time na (n=1434)
Income protection insurance . . . . . . . . . . . . . . . . . . . . . . . . . . . . . . . . . . . . . .na 30
Survey
ANZ Survey of Adult Financial Literacy in Australia (2008) 98
The Social Research Centre
Amongst those respondents who either owned their home or were buying it, 80% had building insurance. Those least likely to have insured their residence had a similar profile to those who did not insure their contents. That is, they were younger (55% of those under 35 years had building insurance), with personal incomes below $58,000 (77%) and working on a casual basis (61%) and speaking a language other than English at home (72%). Single parents however (80%) were not below average here and were more willing to insure the building they live in than its contents.
Amongst those who either own or who are buying a motor vehicle, 97% have motor vehicle insurance – 87% have comprehensive motor vehicle insurance and 10% have third party insurance.
Younger vehicle owners aged 18-24 years were less likely to have any motor vehicle insurance (91%) – only 66% of vehicle owners in this age group held comprehensive insurance although they were the most likely to have third party insurance (25%). Apart from age, those least likely to have comprehensive insurance were people with household incomes below $58,000 (82%) or personal incomes below $25,000 (80%). Both of these income groups also had an above average incidence of third party insurance (13% and 14% respectively).
Amongst vehicle owners there was only a slight variation in the likelihood of having some form of vehicle insurance between financial literacy quintiles one (93%) and five (98%) suggesting that the need for vehicle insurance beyond the compulsory component is both widely understood and acted on.
Thirty percent of those working full-time had income protection insurance. Those most likely to hold this type of insurance were people aged 35-44 years (37%), people living in a family household with a partner and dependent children (38%), those with mortgage outstandings of $300,000 or more (45%) and those with personal incomes of $100,000 or more (47%).
Also as discussed in Section 2.5, the incidence of these types of insurance (except motor vehicle insurance as discussed above) generally showed a strong association with financial literacy - ownership of insurance products was considerably higher amongst those with higher financial literacy scores and lower amongst those with lower scores.

ANZ Survey of Adult Financial Literacy in Australia (2008) 99
The Social Research Centre
8.3 Understanding of insurance products All those who held insurance were asked about the duty of accurate disclosure applicable to consumers who take out insurance products and all respondents were asked about the cooling off period during which a new house and contents policy can be cancelled. The descriptions used for each of these issues, and the responses obtained, are shown in Table 8.3.1a.
Just over 1 in 2 of those who held insurance (54%) were aware that an insurance company could refuse a claim if the policy holder did not make accurate disclosure of matters relevant to the loss. This was slightly higher than the 2005 result of 51%.
Those least likely to be aware of their duty of accurate disclosure, that is the 46% who gave a response of “no” or “can’t say”, included those aged 60 years or over (65%) and those with household incomes less than $58,000 (57%). From a financial literacy perspective, those from quintiles one and two were the least likely to be aware of the need for accurate disclosure (83% and 62% respectively gave “no” or “can’t say” responses).
At 68%, awareness of the cooling off period applicable to house and contents insurance policies was higher than awareness of the need for accurate disclosure. Awareness of the cooling off period in 2008 did not differ significantly from the result of 65% recorded in 2005.
Those most likely to be in the 32% who were not aware of the cooling off period were people classified in financial literacy quintile one (42% “no” or “can’t say”) and 18-24 year old males (48% “no” or “can’t say”).
Table 8.3.1a Awareness of important requirements of insurance products
Insurance rights and responsibilities 2005 2008
% %
Base: Have insurance (n=2892) (n=3289)
Yes - claim can be refused . . . . . . . . . . . . . . . . . . . . . . . . . . . . . . . . . . . . . . . . . . . . . . . . . . . . . . . . . . . . . . . . . . . . . . . . . 51 54
No . . . . . . . . . . . . . . . . . . . . . . . . . . . . . . . . . . . . . . . . . . . . . . . . . . . . . . . . . . . . . . . . 37 34
Can't say . . . . . . . . . . . . . . . . . . . . . . . . . . . . . . . . . . . . . . . . . . . . . . . . . . . . . . . . . . . . . . . .12 12
Base: Total sample (n=1756) (n=1162)
Yes - aware of cooling off period . . . . . . . . . . . . . . . . . . . . . . . . . . . . . . . . . . . . . . . . . . . . . . . . . . . . . . . . . . . . . . . . . . . . . . . . . 65 68
No . . . . . . . . . . . . . . . . . . . . . . . . . . . . . . . . . . . . . . . . . . . . . . . . . . . . . . . . . . . . . . . . 13 14
Can't say . . . . . . . . . . . . . . . . . . . . . . . . . . . . . . . . . . . . . . . . . . . . . . . . . . . . . . . . . . . . . . . .22 18
As far as you are aware, is there a cooling off period after
taking out a new house and contents insurance policy during
which time you can cancel the policy and have your premium
fully refunded?
Survey
As far as you are aware, can your insurance company refuse
your claim because when you took out or renewed the policy
you did not accurately answer some specific questions asked
by the insurer that were relevant to the loss?
In each survey, the base is a randomly selected subset of all respondents.

ANZ Survey of Adult Financial Literacy in Australia (2008) 100
The Social Research Centre
8.4 Acquisition of insurance products All those who had arranged a new insurance policy were asked about the extent of comparison shopping they undertake when arranging a new policy. Those who don’t shop around at all were asked why they didn’t do so. As shown in Table 8.4.1a:
75% of these respondents undertake some comparison shopping when looking for a new insurance policy while 24% do not. This result is not significantly different from that of 2005 (74%). However, the proportion shopping around for a new insurance policy in 2008 was lower than in 2002 (81%). It is possible that increased use of direct debit to pay premiums has made the task of switching suppliers a little more complex and, as a result has discouraged some consumers from shopping around when policies are due for renewal.
Lack of comparison shopping was at its highest amongst older people - 47% of those aged 70 years or over do not shop around at all when arranging a new insurance policy.
Table 8.4.1a Comparison shopping for insurance products
Shopping around for insurance 2002 2005 2008
% % %
When arranging a new insurance policy, do you shop around ...
Base: Have arranged a new insurance policy (n=1470) (n=1321) (n=1052)
A lot . . . . . . . . . . . . . . . . . . . . . . . . . . . . . . . . . . . . . . . . . . . . . . . . . . . . . . . . . . . . . . . . . . . . . . . . . 25 21 18
A fair bit . . . . . . . . . . . . . . . . . . . . . . . . . . . . . . . . . . . . . . . . . . . . . . . . . . . . . . . . . . . . . . . .31 25 24
A little . . . . . . . . . . . . . . . . . . . . . . . . . . . . . . . . . . . . . . . . . . . . . . . . . . . . . . . . . . . . . . . . 25 28 33
Net: Any shopping round at all. . . . . . . . . . . . . . . . . . . . . . . . . . . . . . . . . . . . . . . . . . . . . . . . . . . . . . . . . . . . . . . .81 74 75
Not at all . . . . . . . . . . . . . . . . . . . . . . . . . . . . . . . . . . . . . . . . . . . . . . . . . . . . . . . . . . . . . . . .18 24 24
Can't say . . . . . . . . . . . . . . . . . . . . . . . . . . . . . . . . . . . . . . . . . . . . . . . . . . . . . . . . . . . . . . . .1 2 1
Survey
Prompted question.
In each survey, the base is a randomly selected subset of all eligible respondents.

ANZ Survey of Adult Financial Literacy in Australia (2008) 101
The Social Research Centre
Reasons given for not shopping around included already having a satisfactory relationship with an insurance provider (49%), lack of interest (20% couldn’t be bothered) and accepting the recommendation of a financial expert (10%) or that of a friend or family member (8%).
Compared to 2005, there has been an increase in the proportion who said they don’t shop around because of their existing relationship with an insurance provider (up 10 points from 39%).
Table 8.4.1b Reasons for not shopping around for insurance products
Shopping around for insurance 2008
%
Base: Don't shop around for insurance policy (n=259)
Already have relationship with/happy with provider . . . . . . . . . . . . . . . . . . . . . . . . . . . . . . . . . . . . . . . . . . . . . . . . . . . . . . . . . . . . . . . . . . . . .49
Take someone else's advice
Go with recommendation of financial expert . . . . . . . . . . . . . . . . . . . . . . . . . . . . . . . . . . . . . . . . . . . . . . . . . . . . . . . . . . . . . . . . . . . . .10
Just go with what is recommended by friend/family member . . . . . . . . . . . . . . . . . . . . . . . . . . . . . . . . . . . . . . . . . . . . . . . . . . . . . . . . . . . . . . . . . . . . .8
Spouse/partner does shopping around . . . . . . . . . . . . . . . . . . . . . . . . . . . . . . . . . . . . . . . . . . . . . . . . . . . . . . . . . . . . . . . . . . . . .2
Lack of time/interest
Couldn't be bothered. . . . . . . . . . . . . . . . . . . . . . . . . . . . . . . . . . . . . . . . . . . . . . . . . . . . . . . . . . . . . . . . . . . . .20
"They're all the same" . . . . . . . . . . . . . . . . . . . . . . . . . . . . . . . . . . . . . . . . . . . . . . . . . . . . . . . . . . . . . . . . . . . . .1
Don't have the time . . . . . . . . . . . . . . . . . . . . . . . . . . . . . . . . . . . . . . . . . . . . . . . . . . . . . . . . . . . . . . . . . . . . .6
Too difficult to make comparisons/get information . . . . . . . . . . . . . . . . . . . . . . . . . . . . . . . . . . . . . . . . . . . . . . . . . . . . . . . . . . . . . . . . . . . . .1
All other reasons . . . . . . . . . . . . . . . . . . . . . . . . . . . . . . . . . . . . . . . . . . . . . . . . . . . . . . . . . . . . . . . . . . . . .5
Unsure/Can't recall . . . . . . . . . . . . . . . . . . . . . . . . . . . . . . . . . . . . . . . . . . . . . . . . . . . . . . . . . . . . . . . . . . . . . . . . . . .3
What is the main reason you don't shop around?
Unprompted question, multiple responses allowed.

ANZ Survey of Adult Financial Literacy in Australia (2008) 102
The Social Research Centre
In addition to arranging a new policy, all those with insurance were asked what factors they took into account when first taking out an insurance policy other than life insurance and secondly, what factors they considered when renewing an insurance policy other than life insurance.
Of interest from a financial literacy perspective was the extent to which level of cover was mentioned as a consideration given that under-insurance is generally regarded as a widespread problem in the Australian community. As shown in Table 8.4.1c, the factors people were most likely to consider when first taking out a policy were as follows.
The level of cover needed. In total, 47% of those with insurance mentioned this as a consideration - 41% who made a general mention of the level of cover and 15% who specifically mentioned “making sure you’re not under-insured”.
Those least likely to mention the level of cover included 18-24 years olds (34%) and those aged 70 years or over (37%). There was substantial differentiation between quintiles with 24% of quintile one versus 67% of quintile five mentioning the level of cover as something they would consider when opening a new insurance policy.
Apart from the level of cover, other considerations mentioned were the premium (53%), the nature of the policy including the benefits offered (14%), the size of any excess (15%) and the reputation of the insurance provider (20%).
Mention of these considerations was similar to 2005 apart from the excess (up from 11% to 15%) and the brand or reputation of the supplier (up from 17% to 20%).
Table 8.4.1c Considerations when first taking out an insurance policy
Considerations when opening a new insurance policy 2008
%
Base: Have insurance other than life insurance (n=3304)
Level of cover (Net: 47%)
The level of cover - general . . . . . . . . . . . . . . . . . . . . . . . . . . . . . . . . . . . . . . . . . . . . . . . . . . . . . . . . . . . . . . . . . . . . .41
The level of cover to make sure you're not under-insured . . . . . . . . . . . . . . . . . . . . . . . . . . . . . . . . . . . . . . . . . . . . . . . . . . . . . . . . . . . . . . . . . . . . .15
Pricing/Deal
The premium . . . . . . . . . . . . . . . . . . . . . . . . . . . . . . . . . . . . . . . . . . . . . . . . . . . . . . . . . . . . . . . . . . . . .53
Fees . . . . . . . . . . . . . . . . . . . . . . . . . . . . . . . . . . . . . . . . . . . . . . . . . . . . . . . . . . . . . . . . . . . . . 4
Value for money/best deal . . . . . . . . . . . . . . . . . . . . . . . . . . . . . . . . . . . . . . . . . . . . . . . . . . . . . . . . . . . . . . . . . . . . .3
Bonus/rewards for staying with company . . . . . . . . . . . . . . . . . . . . . . . . . . . . . . . . . . . . . . . . . . . . . . . . . . . . . . . . . . . . . . . . . . . . .1
Nature of the policy
The excess . . . . . . . . . . . . . . . . . . . . . . . . . . . . . . . . . . . . . . . . . . . . . . . . . . . . . . . . . . . . . . . . . . . . .15
Benefits included . . . . . . . . . . . . . . . . . . . . . . . . . . . . . . . . . . . . . . . . . . . . . . . . . . . . . . . . . . . . . . . . . . . . .14
Offers replacement value or market value . . . . . . . . . . . . . . . . . . . . . . . . . . . . . . . . . . . . . . . . . . . . . . . . . . . . . . . . . . . . . . . . . . . . .1
Provider's reputation
Brand or reputation of the supplier . . . . . . . . . . . . . . . . . . . . . . . . . . . . . . . . . . . . . . . . . . . . . . . . . . . . . . . . . . . . . . . . . . . .20
Trustworthy, stable company . . . . . . . . . . . . . . . . . . . . . . . . . . . . . . . . . . . . . . . . . . . . . . . . . . . . . . . . . . . . . . . . . . . . .1
Recommendation of family, friends . . . . . . . . . . . . . . . . . . . . . . . . . . . . . . . . . . . . . . . . . . . . . . . . . . . . . . . . . . . . . . . . . . . . .1
Experience of dealing with the company . . . . . . . . . . . . . . . . . . . . . . . . . . . . . . . . . . . . . . . . . . . . . . . . . . . . . . . . . . . . . . . . . . . . .1
Service quality
Easy to make premium payments (direct debit, monthly, etc). . . . . . . . . . . . . . . . . . . . . . . . . . . . . . . . . . . . . . . . . . . . . . . . . . . . . . . . . . . . . . . . . . . . .2
Standard of customer service . . . . . . . . . . . . . . . . . . . . . . . . . . . . . . . . . . . . . . . . . . . . . . . . . . . . . . . . . . . . . . . . . . . . .2
Easy to make claims . . . . . . . . . . . . . . . . . . . . . . . . . . . . . . . . . . . . . . . . . . . . . . . . . . . . . . . . . . . . . . . . . . . . .2
All other considerations . . . . . . . . . . . . . . . . . . . . . . . . . . . . . . . . . . . . . . . . . . . . . . . . . . . . . . . . . . . . . . . . . . . . .6
None, don’t consider any . . . . . . . . . . . . . . . . . . . . . . . . . . . . . . . . . . . . . . . . . . . . . . . . . . . . . . . . . . . . . . . . . . . . . . . . . . .4
Unsure/Can't recall . . . . . . . . . . . . . . . . . . . . . . . . . . . . . . . . . . . . . . . . . . . . . . . . . . . . . . . . . . . . . . . . . . . . . . . . . . .8
Unprompted question, multiple responses allowed.
What factors do you take into consideration when FIRST taking
out or setting up an insurance policy other than life insurance?

ANZ Survey of Adult Financial Literacy in Australia (2008) 103
The Social Research Centre
When asked about the factors considered when renewing an insurance policy, mentions of the level of cover fell to 30% (versus 47% for a new policy) - 24% making a general mention of this and 12% specifically mentioning “making sure you’re not under-insured”. Young people (18% of 18-24 year olds), older people (24% of those aged 70 years plus) and members of quintile one (13%) remained the least likely to consider the level of cover.
Other considerations mentioned included the premium which, at 47%, was the factor mentioned most often, the benefits of the policy, the size of the excess, the reputation of the supplier and the standard of customer service (all 11%).
No differences were evident from the 2005 results apart from more frequent mention of the excess (up from 7% to 11%).
Table 8.4.1d Considerations when renewing an insurance policy
Considerations when renewing an insurance policy 2008
%
Base: Have insurance other than life insurance (n=3304)
Level of cover (Net: 30%)
The level of cover - general . . . . . . . . . . . . . . . . . . . . . . . . . . . . . . . . . . . . . . . . . . . . . . . . . . . . . . . . . . . . . . . . . . . . .24
The level of cover to make sure you're not under-insured . . . . . . . . . . . . . . . . . . . . . . . . . . . . . . . . . . . . . . . . . . . . . . . . . . . . . . . . . . . . . . . . . . . . .12
Pricing/Deal
The premium . . . . . . . . . . . . . . . . . . . . . . . . . . . . . . . . . . . . . . . . . . . . . . . . . . . . . . . . . . . . . . . . . . . . .47
Fees . . . . . . . . . . . . . . . . . . . . . . . . . . . . . . . . . . . . . . . . . . . . . . . . . . . . . . . . . . . . . . . . . . . . . 2
Value for money/best deal . . . . . . . . . . . . . . . . . . . . . . . . . . . . . . . . . . . . . . . . . . . . . . . . . . . . . . . . . . . . . . . . . . . . .6
Bonus/rewards for staying with company . . . . . . . . . . . . . . . . . . . . . . . . . . . . . . . . . . . . . . . . . . . . . . . . . . . . . . . . . . . . . . . . . . . . .1
Nature of the policy
Benefits included . . . . . . . . . . . . . . . . . . . . . . . . . . . . . . . . . . . . . . . . . . . . . . . . . . . . . . . . . . . . . . . . . . . . .11
The excess . . . . . . . . . . . . . . . . . . . . . . . . . . . . . . . . . . . . . . . . . . . . . . . . . . . . . . . . . . . . . . . . . . . . .11
Any changes to what the policy covers . . . . . . . . . . . . . . . . . . . . . . . . . . . . . . . . . . . . . . . . . . . . . . . . . . . . . . . . . . . . . . . . . . . . .2
Whether policy offers replacement value or market value . . . . . . . . . . . . . . . . . . . . . . . . . . . . . . . . . . . . . . . . . . . . . . . . . . . . . . . . . . . . . . . . . . . . .<1
Provider's reputation
Brand or reputation of the supplier . . . . . . . . . . . . . . . . . . . . . . . . . . . . . . . . . . . . . . . . . . . . . . . . . . . . . . . . . . . . . . . . . . . .11
Trustworthy, stable company . . . . . . . . . . . . . . . . . . . . . . . . . . . . . . . . . . . . . . . . . . . . . . . . . . . . . . . . . . . . . . . . . . . . .1
Recommendation of family, friends . . . . . . . . . . . . . . . . . . . . . . . . . . . . . . . . . . . . . . . . . . . . . . . . . . . . . . . . . . . . . . . . . . . . .-
Experience of dealing with the company . . . . . . . . . . . . . . . . . . . . . . . . . . . . . . . . . . . . . . . . . . . . . . . . . . . . . . . . . . . . . . . . . . . . .3
Service quality
Standard of customer service . . . . . . . . . . . . . . . . . . . . . . . . . . . . . . . . . . . . . . . . . . . . . . . . . . . . . . . . . . . . . . . . . . . . .11
Easy to make premium payments (direct debit, monthly, etc). . . . . . . . . . . . . . . . . . . . . . . . . . . . . . . . . . . . . . . . . . . . . . . . . . . . . . . . . . . . . . . . . . . . .1
Easy to make claims . . . . . . . . . . . . . . . . . . . . . . . . . . . . . . . . . . . . . . . . . . . . . . . . . . . . . . . . . . . . . . . . . . . . .1
Ease of renewal process . . . . . . . . . . . . . . . . . . . . . . . . . . . . . . . . . . . . . . . . . . . . . . . . . . . . . . . . . . . . . . . . . . . . .1
Date for policy renewal . . . . . . . . . . . . . . . . . . . . . . . . . . . . . . . . . . . . . . . . . . . . . . . . . . . . . . . . . . . . . . . . . . . . .2
All other considerations . . . . . . . . . . . . . . . . . . . . . . . . . . . . . . . . . . . . . . . . . . . . . . . . . . . . . . . . . . . . . . . . . . . . .5
None, don't consider any . . . . . . . . . . . . . . . . . . . . . . . . . . . . . . . . . . . . . . . . . . . . . . . . . . . . . . . . . . . . . . . . . . . . . . . . . . .13
Unsure/Can't recall . . . . . . . . . . . . . . . . . . . . . . . . . . . . . . . . . . . . . . . . . . . . . . . . . . . . . . . . . . . . . . . . . . . . . . . . . . .7
Unprompted question, multiple responses allowed.
And what factors do you take into consideration when RENEWING
an insurance policy other than life insurance?

ANZ Survey of Adult Financial Literacy in Australia (2008) 104
The Social Research Centre
Section 9 Consumer Rights and Responsibilities
9.1 Introduction and key findings Awareness of one’s rights and responsibilities as a consumer of financial products and services represents an important aspect of financial literacy. This section of the report examines consumers’ knowledge of their rights and responsibilities in a number of areas, looks at how people said they would handle complaints against a provider of financial services and what further education the community itself sees as appropriate in this area.
Key findings
Awareness of rights and responsibilities
Consumers’ awareness of their rights, responsibilities and protections appears to be largely unchanged since 2005.
Almost all respondents agreed that providers of financial products and services have a legal duty to provide clear information to consumers – 95% versus 94% in the 2005 survey
78% of respondents (versus 79% in 2005) were aware that providers of professional advice about financial services are legally bound to inform clients of any commissions they might receive as a result of their advice. Those least likely to be aware of this were females aged 70 years or over (66%), single parents (65%) and those whose main source of income is a government benefit or allowance (67%)
93% agreed that consumers have a duty of honest disclosure when taking out a financial service or product versus 94% in 2005.
87% were aware that the card holder has sole responsibility for any lost money if the PIN and access card are kept together in a stolen wallet (versus 89% in 2002 and 88% in 2005).
There was a change in the proportion that correctly said the statement ASIC checks the accuracy of all prospectuses lodged with it was false. This rose to 19% from 15% in 2005. However, the great majority of respondents continued to think this statement was true (52%) or were unable to say (29%). This points to a relatively widespread lack of detailed understanding of ASIC’s role in checking the accuracy of prospectuses. It also points to increased investment risk for those who assume the claims and projections made in a prospectus are accurate because the document has been lodged with ASIC.
Complaints
Consumers were a little more confident they would know how to make an effective complaint against a bank or other financial institution than in 2005 – 63% were confident or very confident about this compared with 58% in 2005. At the same time almost half (45%) of those in quintile one were not confident they knew how to make an effective complaint against a bank or other financial institution.
When it came to who respondents would contact if they wanted to make a complaint, 17% were unsure who they would approach (particularly 25-34 year old males - 28% and people working in lower blue collar occupations – 30%). Those who gave a response were most likely to mention an industry ombudsman (36%) or a government department like Consumer Affairs or ASIC (26%).
Further education
51% of respondents felt they needed further financial education or information. Those under 35 years of age were the most likely to feel this way (64%) while people aged 60 years or over (26%) were the least likely to do so.
Investing (39%) and superannuation (25%) were mentioned most often as topics of interest.

ANZ Survey of Adult Financial Literacy in Australia (2008) 105
The Social Research Centre
9.2 Knowledge of consumer rights and responsibilities This section looks at consumers’ awareness of their rights, responsibilities and protections as they relate to financial services.
9.2.1 Awareness of providers’ responsibilities and consumers’ protections
Consumers’ awareness of the responsibilities of providers of financial services was examined in the following areas:
Financial services providers’ duty to provide clear information to consumers
The legal duty of providers of professional advice to inform their clients of commissions they may receive as a result of the advice they give, and
The role of ASIC in checking the accuracy of prospectuses that are lodged with it.
Looking at each of these issues in turn (see Table 9.2.1a) it is evident that:
Almost all respondents (95%) agreed with the statement “providers of financial products and services have a legal duty to provide clear information to consumers”. Those in financial literacy quintile one were slightly more likely to disagree with this statement (8%) than those in higher quintiles, but even amongst the members of this group, there was 87% agreement with the statement.
Compared to the 2005 results, respondents in 2008 were more likely to agree strongly (55% versus 47%) and less likely to just agree (40% versus 47%). However, the overall levels of agreement and disagreement did not differ significantly between the two surveys.
Approximately three out of every four (78%) respondents thought it true that providers of professional advice about financial products are legally required to tell their clients about any commissions that may result from the advice they provide. This result was not significantly different from that recorded in 2005.
Those least likely to consider this proposition to be true included older females (66% of those aged 70 years or more), people from areas of greatest relative socio-economic disadvantage (SEIFA group one 70%) including single parents (65%) and those whose main source of income was a Government benefit or allowance (67%).
Nineteen percent of respondents were aware that ASIC’s role does not include any obligation to check the accuracy of any prospectus that is lodged with it. This was an increase of four percentage points on the 2005 figure of 15%.
Males aged 55 years or over (28%) were the group most likely to say the statement was false. However, there were few other subgroup differences even between those with high and low levels of financial literacy (19% of quintile one and 19% of quintile five said the statement was false).
By contrast, 52% of respondents incorrectly said the statement was true. Further, those holding investments in shares, managed funds or debentures, bonds, notes or derivatives were more likely to think this statement was true than were those who did not have any of these investments (56% versus 49%).
Males aged 25-34 years (72%) and members of quintile five (61%) were the most likely to say the statement was true.
Overall, these results point to relatively widespread lack of detailed understanding of ASIC’s role in checking the accuracy of prospectuses and to increased investment risk for those who assume all claims and projections made in a prospectus are accurate because the document has been lodged with ASIC.

ANZ Survey of Adult Financial Literacy in Australia (2008) 106
The Social Research Centre
Table 9.2.1a Providers’ responsibilities and consumer protection
Awareness of providers' responsibilities and consumer
protections 2005 2008
% %
Base: Total sample (n=1756) (n=3500)
Strongly agree . . . . . . . . . . . . . . . . . . . . . . . . . . . . . . . . . . . . . . . . . . . . . . . . . . . . . . . . . . . . . . . . . . . . . . . . . . . .47 55
Agree . . . . . . . . . . . . . . . . . . . . . . . . . . . . . . . . . . . . . . . . . . . . . . . . . . . . . . . . . . . . . . . . . . . . . . . . . . . . 47 40
Net: "Agree" . . . . . . . . . . . . . . . . . . . . . . . . . . . . . . . . . . . . . . . . . . . . . . . . . . . . . . . . . . . . . . . . . . . . . . . . . . . .94 95
Strongly disagree . . . . . . . . . . . . . . . . . . . . . . . . . . . . . . . . . . . . . . . . . . . . . . . . . . . . . . . . . . . . . . . . . . . . . . . . . . . .2 1
Disagree . . . . . . . . . . . . . . . . . . . . . . . . . . . . . . . . . . . . . . . . . . . . . . . . . . . . . . . . . . . . . . . . . . . . . . . . . . . .3 2
Net: "Disagree" . . . . . . . . . . . . . . . . . . . . . . . . . . . . . . . . . . . . . . . . . . . . . . . . . . . . . . . . . . . . . . . . . . . . . . . . . . . .5 3
Can't say . . . . . . . . . . . . . . . . . . . . . . . . . . . . . . . . . . . . . . . . . . . . . . . . . . . . . . . . . . . . . . . . . . . . . . . . . . 1 2
Prompted question
Base for 2005 survey is a randomly selected subset of all respondents.
Base: Total sample (n=1756) (n=1162)
True . . . . . . . . . . . . . . . . . . . . . . . . . . . . . . . . . . . . . . . . . . . . . . . . . . . . . . . . . . . . . . . . . . . . . . . . . . . . 79 78
False . . . . . . . . . . . . . . . . . . . . . . . . . . . . . . . . . . . . . . . . . . . . . . . . . . . . . . . . . . . . . . . . . . . . . . . . . . . . 11 11
Can't say . . . . . . . . . . . . . . . . . . . . . . . . . . . . . . . . . . . . . . . . . . . . . . . . . . . . . . . . . . . . . . . . . . . . . . . . . . 10 11
True . . . . . . . . . . . . . . . . . . . . . . . . . . . . . . . . . . . . . . . . . . . . . . . . . . . . . . . . . . . . . . . . . . . . . . . . . . . . 57 52
False . . . . . . . . . . . . . . . . . . . . . . . . . . . . . . . . . . . . . . . . . . . . . . . . . . . . . . . . . . . . . . . . . . . . . . . . . . . . 15 19
Can't say . . . . . . . . . . . . . . . . . . . . . . . . . . . . . . . . . . . . . . . . . . . . . . . . . . . . . . . . . . . . . . . . . . . . . . . . . . 28 29
In each survey, the base is a randomly selected subset of all respondents.
The Australian Securities and Investments Commission checks the
accuracy of all prospectuses lodged with it
If providers of professional advice about financial products may receive
commissions as a result of their advice, they are required by law to tell
their clients
Survey
Providers of financial products and services have a legal duty to provide
clear information to consumers

ANZ Survey of Adult Financial Literacy in Australia (2008) 107
The Social Research Centre
9.2.2 Awareness of consumers’ responsibilities
Awareness of consumers’ responsibilities
Consumers’ awareness of their responsibilities as users of financial products and services was tested by asking all respondents:
If they agreed or disagreed with the statement “consumers have a duty of honest disclosure when taking out a financial service or product and may face penalties for not doing so”; and
Who they thought was liable for the lost money in a scenario where both debit card and PIN were kept together in a stolen wallet.
Results for both of these statements are presented in Table 9.2.2a.
Virtually all respondents (93%) agreed they have a duty of honest disclosure when taking out a financial product or service (37% strongly agree, 56% agree). This result is not significantly different from that of 2005 when 94% of respondents agreed with this statement, although there has been a slight increase in the proportion who agree strongly.
As in previous surveys, most respondents (87%) were aware that the liability for stolen money rests with the cardholder if the PIN and card have been kept together.
Older people aged 70 years or over, that is those who make the least use of electronic banking channels, were the least likely to place sole responsibility on the card holder (74%). This response was also low amongst members of financial literacy quintile one (67%), a result which is partly attributable to the relatively high proportion of older people in this quintile (26% of quintile one were aged 70 years or over compared with 11% of the total sample). At the same time, 16% of those quintile one members who were under 45 years of age thought the responsibility would be shared equally between the card holder and the bank, well above the figure of 6% for the total sample. Hence, it appears that financial literacy is also a factor in people’s awareness on this issue.
Table 9.2.2a Awareness of consumers’ responsibilities
Awareness of consumers' responsibilities 2002 2005 2008
Base: Total sample (n=1767) (n=1756) (n=3500)
% % %
Strongly agree . . . . . . . . . . . . . . . . . . . . . . . . . . . . . . . . . . . . . . . . . . . . . . . . . . . . . . . . . . . . . . . . . . . . . . . . . . . .na 32 37
Agree . . . . . . . . . . . . . . . . . . . . . . . . . . . . . . . . . . . . . . . . . . . . . . . . . . . . . . . . . . . . . . . . . . . . . . . . . . . .na 62 56
Net: "Agree" . . . . . . . . . . . . . . . . . . . . . . . . . . . . . . . . . . . . . . . . . . . . . . . . . . . . . . . . . . . . . . . . . . . . . . . . . . . .na 94 93
Strongly disagree . . . . . . . . . . . . . . . . . . . . . . . . . . . . . . . . . . . . . . . . . . . . . . . . . . . . . . . . . . . . . . . . . . . . . . . . . . . .na 1 1
Disagree . . . . . . . . . . . . . . . . . . . . . . . . . . . . . . . . . . . . . . . . . . . . . . . . . . . . . . . . . . . . . . . . . . . . . . . . . . . .na 3 3
Net: "Disagree" . . . . . . . . . . . . . . . . . . . . . . . . . . . . . . . . . . . . . . . . . . . . . . . . . . . . . . . . . . . . . . . . . . . . . . . . . . . .na 4 4
Can't say . . . . . . . . . . . . . . . . . . . . . . . . . . . . . . . . . . . . . . . . . . . . . . . . . . . . . . . . . . . . . . . . . . . . . . . . . . na 2 3
Card holder only . . . . . . . . . . . . . . . . . . . . . . . . . . . . . . . . . . . . . . . . . . . . . . . . . . . . . . . . . . . . . . . . . . . . . . . . . . . .89 88 87
Both the bank and the card holder in equal part . . . . . . . . . . . . . . . . . . . . . . . . . . . . . . . . . . . . . . . . . . . . . . . . . . . . . . . . . . . . . . . . . . . . . . . . . . . .5 6 6
The bank only . . . . . . . . . . . . . . . . . . . . . . . . . . . . . . . . . . . . . . . . . . . . . . . . . . . . . . . . . . . . . . . . . . . .2 3 3
Can't say . . . . . . . . . . . . . . . . . . . . . . . . . . . . . . . . . . . . . . . . . . . . . . . . . . . . . . . . . . . . . . . . . . . . . . . . . . 4 3 4
Survey
Prompted question. Question not asked in 2002.
Base for 2005 survey is a randomly selected subset of all respondents.
Prompted question.
Bases for 2002 and 2005 surveys are randomly selected subsets of all respondents.
A person keeps their PIN number on a piece of paper in their wallet, along
with their ATM or bank card. If the wallet is stolen and the card and PIN
number are used to take money from an account, who is liable for the lost
money?
Consumers have a duty of honest disclosure when taking out a financial
service or product and may face penalties for not doing so

ANZ Survey of Adult Financial Literacy in Australia (2008) 108
The Social Research Centre
9.2.3 Complaints
The ability to make an effective complaint when experiencing difficulties with a bank or other financial institution is also an important element of financial literacy. As shown in Table 9.2.3a:
Two thirds of respondents (67%) agreed they were very clear about their rights if they had a problem with a financial institution - 16% “strongly agree” and 51% “agree”. Twenty-eight percent disagreed with the statement and a further 5% could not say.
Those from financial literacy quintile five were the most likely to agree with the statement (75%) while those from quintile one (63%) were the least likely to do so. However, agreement did not fall below 60% for any of the subgroups evaluated in this project.
Similar results were evident when respondents were asked how confident they were about making an effective complaint against a bank or financial institution. Sixty-three percent of respondents said they were confident they could do this, slightly more than in 2005 (58%).
Responses appeared to be associated with financial literacy with 45% of those in quintile one “not very” or “not at all” confident compared with 26% of quintile five.
Table 9.2.3a Ability to handle problems experienced when dealing with a bank or other financial institution
\\
Problems when dealing with a bank or financial institution 2002 2005 2008
% % %
Base: Total sample na (n=1756) (n=3500)
Strongly agree . . . . . . . . . . . . . . . . . . . . . . . . . . . . . . . . . . . . . . . . . . . . . . . . . . . . . . . . . . . . . . . . . . . . . . . . . . . . na 12 16
Agree . . . . . . . . . . . . . . . . . . . . . . . . . . . . . . . . . . . . . . . . . . . . . . . . . . . . . . . . . . . . . . . . . . . . . . . . . . . . na 56 51
Net: "Agree" . . . . . . . . . . . . . . . . . . . . . . . . . . . . . . . . . . . . . . . . . . . . . . . . . . . . . . . . . . . . . . . . . . . . . . . . . . . . na 68 67
Strongly disagree . . . . . . . . . . . . . . . . . . . . . . . . . . . . . . . . . . . . . . . . . . . . . . . . . . . . . . . . . . . . . . . . . . . . . . . . . . . . na 3 4
Disagree . . . . . . . . . . . . . . . . . . . . . . . . . . . . . . . . . . . . . . . . . . . . . . . . . . . . . . . . . . . . . . . . . . . . . . . . . . . . na 26 24
Net: "Disagree" . . . . . . . . . . . . . . . . . . . . . . . . . . . . . . . . . . . . . . . . . . . . . . . . . . . . . . . . . . . . . . . . . . . . . . . . . . . . na 29 28
Can't say . . . . . . . . . . . . . . . . . . . . . . . . . . . . . . . . . . . . . . . . . . . . . . . . . . . . . . . . . . . . . . . . . . . . . . . . . . na 3 5
Prompted question.
Base for 2005 survey is a randomly selected subset of all respondents.
Base: Total sample (n=1767) (n=1756) (n=1205)
Very confident . . . . . . . . . . . . . . . . . . . . . . . . . . . . . . . . . . . . . . . . . . . . . . . . . . . . . . . . . . . . . . . . . . . . . . . . . . . . 19 21 22
Fairly confident . . . . . . . . . . . . . . . . . . . . . . . . . . . . . . . . . . . . . . . . . . . . . . . . . . . . . . . . . . . . . . . . . . . . . . . . . . . . 40 37 41
Net: "Confident" . . . . . . . . . . . . . . . . . . . . . . . . . . . . . . . . . . . . . . . . . . . . . . . . . . . . . . . . . . . . . . . . . . . . . . . . . . . . 59 58 63
Not very confident . . . . . . . . . . . . . . . . . . . . . . . . . . . . . . . . . . . . . . . . . . . . . . . . . . . . . . . . . . . . . . . . . . . . . . . . . . . . 29 27 24
Not at all confident . . . . . . . . . . . . . . . . . . . . . . . . . . . . . . . . . . . . . . . . . . . . . . . . . . . . . . . . . . . . . . . . . . . . . . . . . . . . 11 12 12
Net: "Not confident" . . . . . . . . . . . . . . . . . . . . . . . . . . . . . . . . . . . . . . . . . . . . . . . . . . . . . . . . . . . . . . . . . . . . . . . . . . . . 40 39 36
Can't say . . . . . . . . . . . . . . . . . . . . . . . . . . . . . . . . . . . . . . . . . . . . . . . . . . . . . . . . . . . . . . . . . . . . . . . . . . 2 2 1
Prompted question.
In each survey, the base is a randomly selected subset of all respondents.
Survey
How confident are you that you would know how to make an effective
complaint against a bank or financial institution?
You are very clear about your rights if you have a problem with a
financial institution

ANZ Survey of Adult Financial Literacy in Australia (2008) 109
The Social Research Centre
Respondents were also asked36 who they would contact if they experienced difficulties with a financial product which they were unable to resolve with the provider. As shown in Table 9.2.3b:
The most common response was an industry ombudsman (36%) followed by a Government organisation like Consumer Affairs or ASIC (26%).
In addition, more than 1 in 10 mentioned professional advisers such as a solicitor (14%) or a financial adviser or accountant (13%); while
Thirteen percent would seek assistance from family or friends.
Seventeen percent were unsure where they would get help from in these circumstances. Those most likely to say this were 25-34 year old males (28%) and people currently working in lower blue collar occupations (30%).
Of those “confident” they knew how to make an effective complaint (see Table 9.2.3a) only 11% were unsure who they would talk to. Members of this group were more likely than average to contact an industry ombudsman (43%) or government organisation like Consumer Affairs or ASIC (31%).
Table 9.2.3b Who would be contacted if difficulties could not be resolved with the provider of the financial product or service
36 This question was used for the first time in the 2008 survey. The 2005 survey used four separate questions to ask about problems with banking products, insurance, superannuation or managed fund and financial planner/adviser.
Complaint resolution 2008
%
Base: Total sample (n=1205)
Industry ombudsman/ombudsman . . . . . . . . . . . . . . . . . . . . . . . . . . . . . . . . . . . . . . . . . . . . . . . . . . . . . . . . . . . . . . . . . . . . . . . . . . . . . . . . . . . . . . . . .36
Government organisation like Consumer Affairs, ASIC . . . . . . . . . . . . . . . . . . . . . . . . . . . . . . . . . . . . . . . . . . . . . . . . . . . . . . . . . . . . . . . . . . . . . . . . . . . . . . . . . . . . . . . . .26
Solicitor or lawyer . . . . . . . . . . . . . . . . . . . . . . . . . . . . . . . . . . . . . . . . . . . . . . . . . . . . . . . . . . . . . . . . . . . . . . . . . . . . . . . . . . . . . . . . .14
Financial adviser/accountant . . . . . . . . . . . . . . . . . . . . . . . . . . . . . . . . . . . . . . . . . . . . . . . . . . . . . . . . . . . . . . . . . . . . . . . . . . . . . . . . . . . . . . . . .13
Family or friends . . . . . . . . . . . . . . . . . . . . . . . . . . . . . . . . . . . . . . . . . . . . . . . . . . . . . . . . . . . . . . . . . . . . . . . . . . . . . . . . . . . . . . . . .13
Industry/professional association . . . . . . . . . . . . . . . . . . . . . . . . . . . . . . . . . . . . . . . . . . . . . . . . . . . . . . . . . . . . . . . . . . . . . . . . . . . . . . . . . . . . . . . . .5
Bank manager . . . . . . . . . . . . . . . . . . . . . . . . . . . . . . . . . . . . . . . . . . . . . . . . . . . . . . . . . . . . . . . . . . . . . . . . . . . . . . . . . . . . . . . . .5
Dept of fair trading . . . . . . . . . . . . . . . . . . . . . . . . . . . . . . . . . . . . . . . . . . . . . . . . . . . . . . . . . . . . . . . . . . . . . . . . . . . . . . . . . . . . . . . . .1
Provider . . . . . . . . . . . . . . . . . . . . . . . . . . . . . . . . . . . . . . . . . . . . . . . . . . . . . . . . . . . . . . . . . . . . . . . . . . . . . . . . . . . . . . . . .1
Local MP . . . . . . . . . . . . . . . . . . . . . . . . . . . . . . . . . . . . . . . . . . . . . . . . . . . . . . . . . . . . . . . . . . . . . . . . . . . . . . . . . . . . . . . . .1
Unsure . . . . . . . . . . . . . . . . . . . . . . . . . . . . . . . . . . . . . . . . . . . . . . . . . . . . . . . . . . . . . . . . . . . . . . . . . . . 17
Unprompted question, multiple responses allowed.
Base is a randomly selected subset of all respondents.
If you experienced difficulty with a financial product like a credit card, loan,
insurance policy, superannuation or financial planner that you were unable to
resolve with the provider of that service, who would you contact or talk to?

ANZ Survey of Adult Financial Literacy in Australia (2008) 110
The Social Research Centre
9.2.4 Further education in relation to finance
Interest in self-education and the perceived need for further learning about financial matters and keeping up to date are important aspects of financial literacy. This section looks at how well informed people feel they are when making financial decisions, their perceived need for further education and information on financial matters, the topic areas of greatest interest to them and the preferred methods of delivering education or information.
How well informed consumers generally feel when making financial decisions
To assess the extent to which people feel they make informed financial decisions, all respondents were asked if they agreed or disagreed with the statement “you generally feel well informed when making financial decisions”. As shown in Table 9.2.4a:
Most respondents (85%) agreed with this proposition although only 20% did so strongly. There was above average agreement amongst older people (89% of those aged 60 years or over versus 76% of 18-24 year olds). Despite this apparent confidence, 53% of those aged 60 years or over had FLSs that placed them in the lowest financial literacy quintiles (that is, quintiles one or two). Thus, while many of these people might feel they are well informed when making financial decisions, there are indications that, for some in this group, this feeling may be misplaced.
At the same time, feeling well informed about financial decisions was also above average amongst those aged under 60 years who were earning higher incomes (93% of those with household incomes of $150,000 or more; 94% of those with personal incomes of $100,000 or more). For these higher income earners, 15% of those who agreed they felt well informed when making financial decisions were members of financial literacy quintiles one or two.
Overall, members of quintile one were less likely to agree with the statement than were those in quintile five (76% versus 92%). However, it is interesting that three-quarters of those whose financial literacy appears relatively low (that is, members of quintile one) nevertheless feel they are generally well informed when making financial decisions.
Thirteen percent of respondents disagreed they felt well informed when making financial decisions. Those most likely to give this response were 18-24 year olds (21%) and those people currently working in lower blue collar occupations (19%).
Table 9.2.4a How well informed consumers feel when making financial decisions
Informed Consumer 2005 2008
Base: Total sample (n=1756) (n=3500)
% %
Strongly agree . . . . . . . . . . . . . . . . . . . . . . . . . . . . . . . . . . . . . . . . . . . . . . . . . . . . . . . . . . . . . . . . . . . . . . . . . . . .18 20
Agree . . . . . . . . . . . . . . . . . . . . . . . . . . . . . . . . . . . . . . . . . . . . . . . . . . . . . . . . . . . . . . . . . . . . . . . . . . . . 66 65
Net: "Agree" . . . . . . . . . . . . . . . . . . . . . . . . . . . . . . . . . . . . . . . . . . . . . . . . . . . . . . . . . . . . . . . . . . . . . . . . . . . .84 85
Strongly disagree . . . . . . . . . . . . . . . . . . . . . . . . . . . . . . . . . . . . . . . . . . . . . . . . . . . . . . . . . . . . . . . . . . . . . . . . . . . .2 2
Disagree . . . . . . . . . . . . . . . . . . . . . . . . . . . . . . . . . . . . . . . . . . . . . . . . . . . . . . . . . . . . . . . . . . . . . . . . . . . .12 11
Net: "Disagree" . . . . . . . . . . . . . . . . . . . . . . . . . . . . . . . . . . . . . . . . . . . . . . . . . . . . . . . . . . . . . . . . . . . . . . . . . . . .14 13
Can't say . . . . . . . . . . . . . . . . . . . . . . . . . . . . . . . . . . . . . . . . . . . . . . . . . . . . . . . . . . . . . . . . . . . . . . . . . . 2 2
Prompted questions with read out codeframe
Base for 2005 survey is a randomly selected subset of all respondents.
You generally feel well informed when making financial decisions
Survey

ANZ Survey of Adult Financial Literacy in Australia (2008) 111
The Social Research Centre
Perceived need for further education or information in relation to finance
As shown in Table 9.2.4b:
While most respondents felt their decision-making to be generally well informed, 51% felt they needed some further education or information about financial matters. This was slightly less than the 56% who felt they needed further education or information in 2005, possibly reflecting less interest in, and enthusiasm for, financial matters when markets are less positive and the chances of losing money are higher.
Those under 35 years of age were the most likely to feel they needed further financial education or information (64%) while those aged 60 or over were the least likely to do so (26%). These results are in line with the earlier observation that those aged 60 or over were more likely to say they feel well-informed when making financial decisions.
Table 9.2.4b Need for further education or information
Those who expressed interest in further education or information were asked what finance topics they would like more information on. As shown in Table 9.2.4c, the topics mentioned most often were:
Investing (39%) and superannuation (25%). Interest in both of these topics was above average amongst members of quintile five (50% investing and 33% superannuation). This may point to an interest in self-education which may be a factor in the relatively higher level of financial literacy achieved by this group.
Fourteen percent expressed interest in information on budgeting (24% of single parents and 27% of those in lower blue collar occupations), and
Thirteen percent mentioned taxation.
For the most part these results were not significantly different from those recorded in 2005 with the only significant changes being:
Less mention of information on how to make complaints and resolve disputes (down from 12% to 7%), and
More frequent mention of information on taxation (up from 7% to 13%).
Need for further finance education/information 2005 2008
% %
Base: Total sample (n=1756) (n=1779)
Yes . . . . . . . . . . . . . . . . . . . . . . . . . . . . . . . . . . . . . . . . . . . . . . . . . . . . . . . . . . . . . . . . . . . . . . . . . . . . 56 51
No . . . . . . . . . . . . . . . . . . . . . . . . . . . . . . . . . . . . . . . . . . . . . . . . . . . . . . . . . . . . . . . . . . . . . . . . . . . . 43 48
Unsure . . . . . . . . . . . . . . . . . . . . . . . . . . . . . . . . . . . . . . . . . . . . . . . . . . . . . . . . . . . . . . . . . . . . . . . . . . 1 1
In both surveys, the base is a randomly selected subset of all respondents.
Survey
Do you feel you need further education or information in relation to
finance?

ANZ Survey of Adult Financial Literacy in Australia (2008) 112
The Social Research Centre
Table 9.2.4c Topics for further education or information
Topics for further finance education/information 2008
%
Base: Those needing further education/information (n=861)
Investing . . . . . . . . . . . . . . . . . . . . . . . . . . . . . . . . . . . . . . . . . . . . . . . . . . . . . . . . . . . . . . . . . . . . . . . . . . . .39
Superannuation . . . . . . . . . . . . . . . . . . . . . . . . . . . . . . . . . . . . . . . . . . . . . . . . . . . . . . . . . . . . . . . . . . . . . . . . . . . .25
Budgeting . . . . . . . . . . . . . . . . . . . . . . . . . . . . . . . . . . . . . . . . . . . . . . . . . . . . . . . . . . . . . . . . . . . . . . . . . . . . . . . . . . . . . . . . . . . . . . 14
Taxation . . . . . . . . . . . . . . . . . . . . . . . . . . . . . . . . . . . . . . . . . . . . . . . . . . . . . . . . . . . . . . . . . . . . . . . . . . . . . . . . . . . . . . . . . . . . . . 13
Borrowing, loans and mortgages . . . . . . . . . . . . . . . . . . . . . . . . . . . . . . . . . . . . . . . . . . . . . . . . . . . . . . . . . . . . . . . . . . . . . . . . . . . . . . . . . . . . . . . . . . . . . . 9
Managing debt . . . . . . . . . . . . . . . . . . . . . . . . . . . . . . . . . . . . . . . . . . . . . . . . . . . . . . . . . . . . . . . . . . . . . . . . . . . . . . . . . . . . . . . . . . . . . . 9
How to make complaints/resolve disputes . . . . . . . . . . . . . . . . . . . . . . . . . . . . . . . . . . . . . . . . . . . . . . . . . . . . . . . . . . . . . . . . . . . . . . . . . . 7
Financial management and planning . . . . . . . . . . . . . . . . . . . . . . . . . . . . . . . . . . . . . . . . . . . . . . . . . . . . . . . . . . . . . . . . . . . . . . . . . . . .7
Business finance . . . . . . . . . . . . . . . . . . . . . . . . . . . . . . . . . . . . . . . . . . . . . . . . . . . . . . . . . . . . . . . . . . . . . . . . . . . . . . . . . . . . . . . . . . . . . . 5
Retirement planning . . . . . . . . . . . . . . . . . . . . . . . . . . . . . . . . . . . . . . . . . . . . . . . . . . . . . . . . . . . . . . . . . . . . . . . . . . . . . . . . . . . . . . . . . . . . . . 3
Insurance . . . . . . . . . . . . . . . . . . . . . . . . . . . . . . . . . . . . . . . . . . . . . . . . . . . . . . . . . . . . . . . . . . . . . . . . . . . . . . . . . . . . . . . . . . . . . . 3
General banking information. . . . . . . . . . . . . . . . . . . . . . . . . . . . . . . . . . . . . . . . . . . . . . . . . . . . . . . . . . . . . . . . . . . . . . . . . . . . . . . . . . . . . . . . . . . . . . 2
Consumers' rights and responsibilities . . . . . . . . . . . . . . . . . . . . . . . . . . . . . . . . . . . . . . . . . . . . . . . . . . . . . . . . . . . . . . . . . . . . . . . . . . . . . . . . . . . . . . . . . . . . . . 2
Interest rates . . . . . . . . . . . . . . . . . . . . . . . . . . . . . . . . . . . . . . . . . . . . . . . . . . . . . . . . . . . . . . . . . . . . . . . . . . . . . . . . . . . . . . . . . . . . . . 2
Other responses . . . . . . . . . . . . . . . . . . . . . . . . . . . . . . . . . . . . . . . . . . . . . . . . . . . . . . . . . . . . . . . . . . . . . . . . . . . . . . . . . . . . . . . . . . . . . . 5
Can't say . . . . . . . . . . . . . . . . . . . . . . . . . . . . . . . . . . . . . . . . . . . . . . . . . . . . . . . . . . . . . . . . . . . . . . . . . . 16
Unprompted question, multiple responses allowed
What finance topics would you like more information on?

ANZ Survey of Adult Financial Literacy in Australia (2008) 113
The Social Research Centre
Those who said they would like more information about financial issues were also asked how they would like that information provided. Table 9.2.4d presents the results from this question for all of those wanting more information as well as separately for the four topics of greatest interest. It is evident that:
Government bodies were mentioned frequently as a potential source of information, particularly for information on tax (36%) and superannuation (31%). Financial institutions were also mentioned relatively frequently as a source of information for budgeting, tax and superannuation.
Insofar as delivery channels were concerned, the internet is clearly the preferred option for information on all four topics followed by books (15%) and newspaper and magazine articles (14%).
Those aged under 35 years were most likely to mention the internet as a preferred delivery channel for any financial information (49%) as were those with annual household incomes of $100,000 or more (47%). Members of quintile five were more likely than average to mention newspaper/magazine articles as an information source (20% versus 14% overall).
Few differences were evident in the preferred source of information for different topics apart from less interest in seeing information about investment from government bodies (18%) and slightly more interest in receiving information on budgeting through formal courses offered by TAFE or adult education (20%).
Table 9.2.4d Preferred channels for additional information about financial issues
Preferred channels for delivery of additional
financial informationAny
Information
Invest-
ment
Super-
annuation Budgeting Tax
% % % % %
Base: Nominated a topic for further education/information (n=719) (n=317) (n=215) (n=113) (n=104)
Industry/Government body/Finance professional
Communication from financial institutions . . . . . . . . . . . . . . . . . . . . . . . . . . . . . . . . . . . . . . . . . . . . . . . . . . . . . . . . . . . . . . . . . . . . . . . . . . . .27 22 28 30 30
Communication from government bodies. . . . . . . . . . . . . . . . . . . . . . . . . . . . . . . . . . . . . . . . . . . . . . . . . . . . . . . . . . . . . . . . . . . . . . . . . . . .23 18 31 27 36
Financial adviser or planner . . . . . . . . . . . . . . . . . . . . . . . . . . . . . . . . . . . . . . . . . . . . . . . . . . . . . . . . . . . . . . . . . . . . . . . . . . . . . . . . . . . . . . . . . . . . . . 5 6 1 4 5
Formal courses through TAFE, CAE etc. . . . . . . . . . . . . . . . . . . . . . . . . . . . . . . . . . . . . . . . . . . . . . . . . . . . . . . . . . . . . . . . . . . . . . . . . . . .9 13 8 20 14
Delivery Channels
Internet . . . . . . . . . . . . . . . . . . . . . . . . . . . . . . . . . . . . . . . . . . . . . . . . . . . . . . . . . . . . . . . . . . . . . . . . . . . . . . . . . . . . . . . . . . . . . . 38 44 45 43 49
Books on finance . . . . . . . . . . . . . . . . . . . . . . . . . . . . . . . . . . . . . . . . . . . . . . . . . . . . . . . . . . . . . . . . . . . . . . . . . . . . . . . . . . . . . . . . . . . . . . 15 17 14 22 19
Newspaper or magazine articles . . . . . . . . . . . . . . . . . . . . . . . . . . . . . . . . . . . . . . . . . . . . . . . . . . . . . . . . . . . . . . . . . . . . . . . . . . . . . . . . . . . . . . . . . . . . . . 14 13 8 10 13
Television/radio advertising . . . . . . . . . . . . . . . . . . . . . . . . . . . . . . . . . . . . . . . . . . . . . . . . . . . . . . . . . . . . . . . . . . . . . . . . . . . . . . . . . . . . . . . . . . . . . . 8 8 8 7 10
Personal, face to face contact . . . . . . . . . . . . . . . . . . . . . . . . . . . . . . . . . . . . . . . . . . . . . . . . . . . . . . . . . . . . . . . . . . . . . . . . . . . . . . . . . . . . . . . . . . . . . . 7 4 4 5 2
By mail . . . . . . . . . . . . . . . . . . . . . . . . . . . . . . . . . . . . . . . . . . . . . . . . . . . . . . . . . . . . . . . . . . . . . . . . . . . . . . . . . . . . . . . . . . . . . . 7 7 6 6 5
Brochures or pamphlets . . . . . . . . . . . . . . . . . . . . . . . . . . . . . . . . . . . . . . . . . . . . . . . . . . . . . . . . . . . . . . . . . . . . . . . . . . . . . . . . . . . . . . . . . . . . . . 6 4 3 8 -
Seminars or workshops . . . . . . . . . . . . . . . . . . . . . . . . . . . . . . . . . . . . . . . . . . . . . . . . . . . . . . . . . . . . . . . . . . . . . . . . . . . . . . . . . . . . . . . . . . . . . . 6 6 5 4 5
Other responses . . . . . . . . . . . . . . . . . . . . . . . . . . . . . . . . . . . . . . . . . . . . . . . . . . . . . . . . . . . . . . . . . . . . . . . . . . . . . . . . . . . . . . . . . . . . . . 7 6 5 4 2
Can't say . . . . . . . . . . . . . . . . . . . . . . . . . . . . . . . . . . . . . . . . . . . . . . . . . . . . . . . . . . . . . . . . . . . . . . . . . . 5 4 3 3 2
Unprompted question, multiple responses allowed
And how would you like information on ( …topic…) made
available to you?
Financial Topic

ANZ Survey of Adult Financial Literacy in Australia (2008) 114
The Social Research Centre
While sample sizes are a restriction on further analysis, there were some subgroups that appeared more likely than others to prefer particular sources/channels for the delivery of information on specific topics. These included:
Investing
Those with household incomes of $100,000 or more were more likely than those earning less than this to express a preference for information from financial institutions (27% versus 17% of those with household incomes under $100,000).
Those from quintile one were more likely to prefer formal courses offered through TAFE or CAE (27% compared with 13% of the all those wanting information on investing).
Members of quintile five (60% versus 44% of all those wanting information on investing) were more likely than average to nominate the internet as their preferred delivery channel, while preference for the internet was well below average (27%) amongst those age 60 years or over.
Those in quintile two (20%) and those who left school at or before the end of year 10 (19%) were more likely than average to prefer to receive investing information by mail, brochure or pamphlet.
Superannuation
Those in quintile five were more likely to express a preference for information in newspapers and magazines (17% versus 8% of all those wanting information on superannuation).
Preference for seminars and workshops was higher amongst those working in upper white collar occupations (12% versus 5% of all those wanting superannuation information).
Available sample sizes do not support this level of analysis for any of the other topics considered in this research.

ANZ Survey of Adult Financial Literacy in Australia (2008) 115
The Social Research Centre
Section 10 On-line money and financial management
10.1 Introduction and key findings The past few years have seen rapid growth in use of the internet for such financial services as on-line banking, obtaining information about financial products and applying for them. At the same time, while use of the internet is widespread, it is also the case that internet access is limited or non-existent for some sections of the community. Limited internet access in turn has the potential to restrict access to and use of the financial system. Hence, this section of the report examines the community’s use of the internet for various aspects of financial management.
Key findings
General use of the internet
Most respondents (72%) had internet access from their home although 20% did not use the internet at all. Older people were the most likely to be non-users (67% of those aged 70 years or over did not use the internet). However there was also a small group of 18-54 year olds who did not use the internet. Non-users here were over-represented amongst those with relatively lower financial literacy (19% of quintile one did not use the internet versus 9% of all 18-54 year olds), people living outside capital cities (14%), those working in lower blue collar occupations (22%), those whose main source of income was a government benefit or allowance (18%) and those whose education did not go beyond Year 10 (19%).
Use of the internet for financial matters
17% of respondents said they had used the internet to obtain or apply for a financial product (25% of 25-44 year olds, 25% amongst members of quintile five). Applications were made most often for credit cards (23%), personal loans (19%), everyday bank accounts (17%) and high interest savings accounts (16%).
Use of on-line calculators increased from 25% in 2005 to 34% in the 2008 survey. Again, the likelihood of doing this was highest amongst people aged 25-44 years (49%) and those with relatively higher financial literacy scores from quintile five (48%). Information on loans (calculating repayments 78%, calculating how much can be borrowed 68%) was accessed most often.
Perceived risk of internet banking
The proportion of internet users who perceived a risk in using internet banking was unchanged – 78% in both the 2005 and 2008 surveys. The types of risk mentioned were similar to those given in 2005 apart from a substantial increase in awareness of identity theft, which was mentioned by 23% in 2008 and not at all in 2005.
19% did not think there was any risk in using internet banking, a point of view that was most likely to be found amongst members of quintile one where 30% thought there was no risk or were unable to say.
There was also no change in the proportion aware of ways to minimise the risks of on-line banking – 66% of those who thought there were risks in 2005, 63% of these respondents in 2008. This left 37% who didn’t know how to minimise the risks or who said they were unsure how to do this. Lack of awareness of risk minimisation techniques was highest amongst internet users from quintile one (49% not aware, 11% unsure)
Using up to date anti-virus software (38%), firewalls (26%) and regular password changes (22%) were mentioned most often as ways of reducing risk. In comparison to 2005 there was more frequent mention of up to date anti-virus software, password security, closing browsers after use and avoiding the use of public computers.

ANZ Survey of Adult Financial Literacy in Australia (2008) 116
The Social Research Centre
10.2 Internet access All respondents were asked where they usually accessed the internet from. As shown in Figure 10.2.1a:
Almost 3 out of every four respondents (72%) usually accessed the internet from their home. In addition, 16% reported accessing the internet from their place of work although majority of these respondents also had internet access from their home (68%).
Twenty percent of respondents did not use the internet.
Figure 10.2.1a Access to the internet
Base: Randomly selected subset of all respondents (n=1162) Question: Where do you usually access the internet from? (Unprompted question, multiple response)
Internet non-users - 60 years or over
Amongst people aged 60 years or over, 52% said they didn’t use the internet (39% of 60-69 year olds, 67% of those aged 70 years or over). Amongst people aged 60 years or over, non-users of the internet were most likely to be found amongst:
o Females (60% versus 43% of males);
o Those who did not complete any post-secondary education (61%);
o Those with household incomes of less than $58,000 per year (60%); and
o Members of financial literacy quintile one (78%).
1
20
1
1
2
2
16
72
0 25 50 75 100
Unsure/Refused
Don't use the internet
Somewhere else
School
Neighbour's/Friend's house
Library
Work
Home

ANZ Survey of Adult Financial Literacy in Australia (2008) 117
The Social Research Centre
Internet non-users - 18-54 years
There was also a relatively small group of 9% of those people aged 18-54 years (that is, people of pre-retirement age) who said they did not use the internet. Non-users in this age group were over-represented amongst:
o Females aged 45-54 years (16%);
o Members of financial literacy quintile one (19%);
o People living outside Australia’s capital cities (14%);
o People living in single person households (19%);
o Those with household incomes under $58,000 (16%), working in lower blue collar occupations (22%), those whose education did not go beyond Year 10 (19%) and those whose main source of income was a Government benefit or allowance (18%).
Thus, while age still appears to be a factor in non-use of the internet amongst under 55’s, there are indications that socio-economic, financial literacy and possibly geographic factors also have a role to play.

ANZ Survey of Adult Financial Literacy in Australia (2008) 118
The Social Research Centre
10.3 Use of the internet for accessing financial products and services This section looks at use of the internet to obtain financial products and to make comparisons between them by using on-line calculators.
10.3.1 Application for financial products over the internet
All internet users were asked if they had ever applied for or obtained a financial product over the internet. As shown in Table 10.3.1a:
Around one in five (17%) respondents had done this. People aged 25-44 years (25%) and those with higher levels of financial literacy (25% of quintile five members) were the most likely to have used the internet in this way.
The types of product involved most often were mortgages and other consumer finance products (credit card 23%, personal loan 19%, mortgage 10%), transacting or deposit accounts (everyday bank account 17%, high interest savings account 16%) and insurance (17%).
Table 10.3.1a Types of financial product applied for over the internet
Financial products applied for/obtained on-line 2008
%
Base: Total sample (n=1162)
Don't use the internet . . . . . . . . . . . . . . . . . . . . . . . . . . . . . . . . . . . . . . . . . . . . . . . . . . . . . . . . . . . . . . . . . . . . .20
Yes - have applied for or obtained financial product over the internet . . . . . . . . . . . . . . . . . . . . . . . . . . . . . . . . . . . . . . . . . . . . . . . . . . . . . . . . . . . . . . . . . . . . .17
No - have not done this . . . . . . . . . . . . . . . . . . . . . . . . . . . . . . . . . . . . . . . . . . . . . . . . . . . . . . . . . . . . . . . . . . . . .63
Base is a randomly selected subset of all respondents.
Base: Have applied/obtained financial products on-line (n=181)
Transacting/Deposit account
Everyday bank account. . . . . . . . . . . . . . . . . . . . . . . . . . . . . . . . . . . . . . . . . . . . . . . . . . . . . . . . . . . . . . . . . . . . .17
High interest savings account . . . . . . . . . . . . . . . . . . . . . . . . . . . . . . . . . . . . . . . . . . . . . . . . . . . . . . . . . . . . . . . . . . . . .16
Term deposit . . . . . . . . . . . . . . . . . . . . . . . . . . . . . . . . . . . . . . . . . . . . . . . . . . . . . . . . . . . . . . . . . . . . .3
Loan/finance product
Credit card . . . . . . . . . . . . . . . . . . . . . . . . . . . . . . . . . . . . . . . . . . . . . . . . . . . . . . . . . . . . . . . . . . . . .23
Personal loan . . . . . . . . . . . . . . . . . . . . . . . . . . . . . . . . . . . . . . . . . . . . . . . . . . . . . . . . . . . . . . . . . . . . .19
Mortgage . . . . . . . . . . . . . . . . . . . . . . . . . . . . . . . . . . . . . . . . . . . . . . . . . . . . . . . . . . . . . . . . . . . . . 10
Other product
Insurance . . . . . . . . . . . . . . . . . . . . . . . . . . . . . . . . . . . . . . . . . . . . . . . . . . . . . . . . . . . . . . . . . . . . .17
Shares . . . . . . . . . . . . . . . . . . . . . . . . . . . . . . . . . . . . . . . . . . . . . . . . . . . . . . . . . . . . . . . . . . . . . 6
Something else . . . . . . . . . . . . . . . . . . . . . . . . . . . . . . . . . . . . . . . . . . . . . . . . . . . . . . . . . . . . . . . . . . . . .14
Unsure/Can't recall . . . . . . . . . . . . . . . . . . . . . . . . . . . . . . . . . . . . . . . . . . . . . . . . . . . . . . . . . . . . . . . . . . . . . . . . . . .4
Unprompted question, multiple responses allowed
Have you ever applied for or obtained a financial product over the
internet?
Which products did you apply for or obtain online?

ANZ Survey of Adult Financial Literacy in Australia (2008) 119
The Social Research Centre
10.3.2 Use of on-line calculators to compare financial products
All respondents were asked if they had ever visited an internet site with calculators for comparing financial products. Those who had done this were asked what they had used these calculators for. As shown in Table 10.3.2a:
Approximately one in three respondents (34%) had used on-line calculators, considerably more than in 2005 when 25% had done so. People aged 25-44 years were the most likely to have done this (49%) as were those with higher financial literacy scores (46% of quintile four and 48% of quintile five).
Table 10.3.2a Use of on-line calculators
Table 10.3.2b shows that on-line calculators were used most often specifically for:
Loan related matters such as calculating loan repayments (78%) and assessing the amount that could be borrowed (68%);
Comparing interest rates (64%);
Comparing fees and charges (51%);
Obtaining information about retirement planning (28%) and superannuation (17%); and
Obtaining help with budgeting (33%).
Table 10.3.2b Tasks for which on-line calculators have been used
Use of on-line calculators 2005 2008
% %
Base: Total sample (n=1756) (n=1162)
Yes - have visited internet site with calculators . . . . . . . . . . . . . . . . . . . . . . . . . . . . . . . . . . . . . . . . . . . . . . . . . . . . . . . . . . . . . . . . . . . . .25 34
No - have not done this/Don't use the internet . . . . . . . . . . . . . . . . . . . . . . . . . . . . . . . . . . . . . . . . . . . . . . . . . . . . . . . . . . . . . . . . . . . . .75 66
In both surveys, the base is a randomly selected subset of all respondents
Have you ever visited an Internet site with calculators for comparing
financial products?
Survey
Use of on-line calculators 2008
%
Base: Have used on-line calculators (n=362)
Calculate repayments on loans. . . . . . . . . . . . . . . . . . . . . . . . . . . . . . . . . . . . . . . . . . . . . . . . . . . . . . . . . . . . . . . . . . . . .78
Calculate how much you can borrow . . . . . . . . . . . . . . . . . . . . . . . . . . . . . . . . . . . . . . . . . . . . . . . . . . . . . . . . . . . . . . . . . . . . .68
Compare interest rates. . . . . . . . . . . . . . . . . . . . . . . . . . . . . . . . . . . . . . . . . . . . . . . . . . . . . . . . . . . . . . . . . . . . .64
Compare fees and charges . . . . . . . . . . . . . . . . . . . . . . . . . . . . . . . . . . . . . . . . . . . . . . . . . . . . . . . . . . . . . . . . . . . . .51
Obtain help in budgeting . . . . . . . . . . . . . . . . . . . . . . . . . . . . . . . . . . . . . . . . . . . . . . . . . . . . . . . . . . . . . . . . . . . . .33
Find out how much you need in retirement. . . . . . . . . . . . . . . . . . . . . . . . . . . . . . . . . . . . . . . . . . . . . . . . . . . . . . . . . . . . . . . . . . . . .28
Help compare superannuation options . . . . . . . . . . . . . . . . . . . . . . . . . . . . . . . . . . . . . . . . . . . . . . . . . . . . . . . . . . . . . . . . . . . . .17
Help compare other financial products . . . . . . . . . . . . . . . . . . . . . . . . . . . . . . . . . . . . . . . . . . . . . . . . . . . . . . . . . . . . . . . . . . . . .49
Something else . . . . . . . . . . . . . . . . . . . . . . . . . . . . . . . . . . . . . . . . . . . . . . . . . . . . . . . . . . . . . . . . . . . . .4
Unsure/Can't recall . . . . . . . . . . . . . . . . . . . . . . . . . . . . . . . . . . . . . . . . . . . . . . . . . . . . . . . . . . . . . . . . . . . . . . . . . . .5
Prompted question, multiple responses allowed
Have you ever used the (internet) calculators to do any of the
following?

ANZ Survey of Adult Financial Literacy in Australia (2008) 120
The Social Research Centre
Compared to 2005, there was slightly greater use of on-line calculators to calculate loan repayments (up from 71% to 78%), to compare the fees and charges on financial products (up from 44% to 51%), to obtain help in budgeting (up from 27% to 33%) and to compare superannuation options (up from 12% to 17%).
10.4 Risks associated with internet banking Appreciation of risk in financial matters is an important aspect of financial literacy. To explore perceptions of the risks associated with using the internet for financial dealings, all internet users were asked if they thought there were risks associated with internet banking.
As shown in Table 10.4a, the position was similar to that in 2005 with 78% of internet users thinking there were risks associated with internet banking, 19% not doing so and 3% unsure. Few subgroup differences were evident on this measure apart from the relatively high proportion (30%) of those internet users in quintile one (55% of all quintile one members were internet users) who thought there was no risk or who were unsure.
Table 10.4a Perceived risk associated with internet banking
Those who thought there were risks most often cited key logging and hacking (53%), the use of unsecured websites (23%), identity theft (23%) and credit card fraud (17%) as examples.
This too was similar to the situation in 2005 apart from the significant increase in awareness of identity theft which was not mentioned at all in 2005 but was mentioned by 23% in 2008.
Table 10.4b Nature of risks associated with internet banking
Risk and on-line banking 2005 2008
% %
Do you think that there are risks associated with internet banking?
Base: Use the internet (n=1095) (n=913)
Yes. . . . . . . . . . . . . . . . . . . . . . . . . . . . . . . . . . . . . . . . . . . . . . . . . . . . . . . . . . . . . . . . . . . . . . . . . . . . . . 78 78
No. . . . . . . . . . . . . . . . . . . . . . . . . . . . . . . . . . . . . . . . . . . . . . . . . . . . . . . . . . . . . . . . . . . . . . . . . . . . . . 20 19
Unsure. . . . . . . . . . . . . . . . . . . . . . . . . . . . . . . . . . . . . . . . . . . . . . . . . . . . . . . . . . . . . . . . . . . . . . . . . . . . . . 2 3
Survey
In both surveys, the base is a randomly selected subset of all respondents
Risks associated with on-line banking 2008
%
What are some of those risks?
Base: See risks associated with internet banking (n=722)
Key logging/hackers . . . . . . . . . . . . . . . . . . . . . . . . . . . . . . . . . . . . . . . . . . . . . . . . . . . . . . . . . . . . . . . . . . . . .53
Unsecured websites . . . . . . . . . . . . . . . . . . . . . . . . . . . . . . . . . . . . . . . . . . . . . . . . . . . . . . . . . . . . . . . . . . . . .23
Identity theft . . . . . . . . . . . . . . . . . . . . . . . . . . . . . . . . . . . . . . . . . . . . . . . . . . . . . . . . . . . . . . . . . . . . .23
Credit card fraud . . . . . . . . . . . . . . . . . . . . . . . . . . . . . . . . . . . . . . . . . . . . . . . . . . . . . . . . . . . . . . . . . . . . .17
Lack of security of personal details/Privacy issues . . . . . . . . . . . . . . . . . . . . . . . . . . . . . . . . . . . . . . . . . . . . . . . . . . . . . . . . . . . . . . . . . . . . .11
e-mail scams . . . . . . . . . . . . . . . . . . . . . . . . . . . . . . . . . . . . . . . . . . . . . . . . . . . . . . . . . . . . . . . . . . . . .9
Phishing . . . . . . . . . . . . . . . . . . . . . . . . . . . . . . . . . . . . . . . . . . . . . . . . . . . . . . . . . . . . . . . . . . . . .8
Money laundering . . . . . . . . . . . . . . . . . . . . . . . . . . . . . . . . . . . . . . . . . . . . . . . . . . . . . . . . . . . . . . . . . . . . .6
Viruses . . . . . . . . . . . . . . . . . . . . . . . . . . . . . . . . . . . . . . . . . . . . . . . . . . . . . . . . . . . . . . . . . . . . .2
Other . . . . . . . . . . . . . . . . . . . . . . . . . . . . . . . . . . . . . . . . . . . . . . . . . . . . . . . . . . . . . . . . . . . . .12
Unsure . . . . . . . . . . . . . . . . . . . . . . . . . . . . . . . . . . . . . . . . . . . . . . . . . . . . . . . . . . . . . . . . . . . . . . . . . . .4
Unprompted question, multiple responses allowed

ANZ Survey of Adult Financial Literacy in Australia (2008) 121
The Social Research Centre
Those who thought there were risks associated with internet banking were also asked if they were aware of any ways of minimising these risks and, if so, what things could be done. Results are presented in Table 10.4c and 10.4d.
Sixty-three percent of these respondents were aware of ways in which risks could be minimised while 33% were not and 4% were unsure. These results were not significantly different from those recorded in 2005.
Those from financial literacy quintile one were the most likely to be unaware of ways in which the risks of on-line banking might be minimised (49% not aware, 11% unsure) while those in quintiles four (74% aware) and five (75% aware) were the most likely to be aware of risk minimisation strategies.
Table 10.4c Minimising the risk associated with internet banking
Mentioned most often as ways to minimise risk were using up to date anti-virus software (38%), using a firewall (26%) and regular password changes (22%).
Compared to 2005 there was greater mention of using up to date anti-virus software (up 11 points), keeping passwords secure (up 12 points), closing browsers after use (up 8 points) and avoiding the use of public computers (up 6 points). Against this there was less mention of firewalls (down 6 points) and ensuring the bank has good security (down 5 points).
Table 10.4d Ways of minimising the risk associated with internet banking
Ways of minimising risk with on-line banking 2008
%
Base: Think there are ways to minimise risks (n=459)
Up to date anti-virus software . . . . . . . . . . . . . . . . . . . . . . . . . . . . . . . . . . . . . . . . . . . . . . . . . . . . . . . . . . . . . . . . . . . . .38
Use a firewall . . . . . . . . . . . . . . . . . . . . . . . . . . . . . . . . . . . . . . . . . . . . . . . . . . . . . . . . . . . . . . . . . . . . .26
Change password regularly . . . . . . . . . . . . . . . . . . . . . . . . . . . . . . . . . . . . . . . . . . . . . . . . . . . . . . . . . . . . . . . . . . . . .22
Ensure bank has good security in place . . . . . . . . . . . . . . . . . . . . . . . . . . . . . . . . . . . . . . . . . . . . . . . . . . . . . . . . . . . . . . . . . . . . .14
Don't use links in e-mails which claim to go to FI websites . . . . . . . . . . . . . . . . . . . . . . . . . . . . . . . . . . . . . . . . . . . . . . . . . . . . . . . . . . . . . . . . . . . . .12
Keep passwords secure . . . . . . . . . . . . . . . . . . . . . . . . . . . . . . . . . . . . . . . . . . . . . . . . . . . . . . . . . . . . . . . . . . . . .12
Don't open suspect files . . . . . . . . . . . . . . . . . . . . . . . . . . . . . . . . . . . . . . . . . . . . . . . . . . . . . . . . . . . . . . . . . . . . .8
Close browser after using . . . . . . . . . . . . . . . . . . . . . . . . . . . . . . . . . . . . . . . . . . . . . . . . . . . . . . . . . . . . . . . . . . . . .8
Check for viruses . . . . . . . . . . . . . . . . . . . . . . . . . . . . . . . . . . . . . . . . . . . . . . . . . . . . . . . . . . . . . . . . . . . . .7
Don't use public computers . . . . . . . . . . . . . . . . . . . . . . . . . . . . . . . . . . . . . . . . . . . . . . . . . . . . . . . . . . . . . . . . . . . . .6
Other . . . . . . . . . . . . . . . . . . . . . . . . . . . . . . . . . . . . . . . . . . . . . . . . . . . . . . . . . . . . . . . . . . . . .9
Unsure . . . . . . . . . . . . . . . . . . . . . . . . . . . . . . . . . . . . . . . . . . . . . . . . . . . . . . . . . . . . . . . . . . . . . . . . . . .5
Unprompted question, multiple responses allowed
What things can you do to minimise the risks associated with
internet banking?
Minimising risk and on-line banking 2005 2008
% %
Are you aware of any ways in which these risks can be minimised?
Base: See risks associated with internet banking (n=854) (n=722)
Yes. . . . . . . . . . . . . . . . . . . . . . . . . . . . . . . . . . . . . . . . . . . . . . . . . . . . . . . . . . . . . . . . . . . . . . . . . . . . . . 66 63
No. . . . . . . . . . . . . . . . . . . . . . . . . . . . . . . . . . . . . . . . . . . . . . . . . . . . . . . . . . . . . . . . . . . . . . . . . . . . . . 31 33
Unsure. . . . . . . . . . . . . . . . . . . . . . . . . . . . . . . . . . . . . . . . . . . . . . . . . . . . . . . . . . . . . . . . . . . . . . . . . . . . . . 3 4
Survey

ANZ Survey of Adult Financial Literacy in Australia (2008) 122
The Social Research Centre
Appendix One: Survey Questionnaire
SECTION A1: INTRODUCTION AND SCREENING Q1 Good [Morning/ Afternoon/ Evening]. My name is (SAY NAME) from The Social Research Centre.
Today we're doing a survey to assess attitudes to financial matters amongst adults aged 18 or over living in Australia. We're not trying to sell you anything, but simply collecting information for an important national survey. Your responses will be confidential to the Social Research Centre, and details of individual respondents will not be passed to any other organisation. May I speak to the person in the household aged 18 years or older who is next in line for a birthday? IF NEW RESPONDENT, REPEAT INTRODUCTION We are contacting people randomly from the White Pages Telephone Listings. The survey will take approximately 20 minutes and will be used for Research purposes only. IF NECESSARY SAY: Is now a good time or would it be more convenient if I made an appointment to speak to you at another time? [SA]
Code Route
Yes – CONTINUE .................................................................................................................................................................. 01
Yes - ARRANGE CALLBACK ............................................................................................................................................. 02
No .............................................................................................................................................................................................. 03 Q2 QSEX
RECORD SEX OF RESPONDENT (DO NOT READ OUT) [SA]
Code Route
Male .......................................................................................................................................................................................... 01
Female...................................................................................................................................................................................... 02 Q3 DEM2
READ OUT. IF REFUSES TERMINATE Just so I know which questions to ask in the survey, would you mind telling me your age please? [SA]
Code Route
18-19......................................................................................................................................................................................... 01
20-24......................................................................................................................................................................................... 02
25-29......................................................................................................................................................................................... 03
30-34......................................................................................................................................................................................... 04
35-39......................................................................................................................................................................................... 05
40-44......................................................................................................................................................................................... 06
45-49......................................................................................................................................................................................... 07
50-54......................................................................................................................................................................................... 08
55-59......................................................................................................................................................................................... 09
60-64......................................................................................................................................................................................... 10
65-69......................................................................................................................................................................................... 11
70+ ............................................................................................................................................................................................ 12
Refused .................................................................................................................................................................................... 98

ANZ Survey of Adult Financial Literacy in Australia (2008) 123
The Social Research Centre
Q4A DEM4
Do you do paid work of any kind? [IF YES, ASK] Do you work full-time for 35 hours or more per week, part-time or are you employed as a casual? [SA]
Code Route
Full-time (35 hours or more per week).............................................................................................................................. 01
Part-time (Less than 35 hours per week) ......................................................................................................................... 02
Casual .................................................................................................................................................................... 03
No - don’t do any paid work .................................................................................................................................. 04
Refused.................................................................................................................................................................. 98 Q4B DEM4B
IF CODES 1, 2 OR 3 AT Q4 Do you work for an employer or are you self-employed? [SA]
Code Route
Work for an employer............................................................................................................................................................ 01
Self-employed ........................................................................................................................................................ 02
Other (eg: labour hire company) ...................................................................................................................................... 03
Refused.................................................................................................................................................................. 98 Q4C DEM4C
READ OUT And which of these best describes your main activity? [SA]
Code Route
In paid employment ............................................................................................................................................................... 01
Unemployed........................................................................................................................................................... 02
Student ..................................................................................................................................................................................... 03
Retired ...................................................................................................................................................................................... 04
Home duties ........................................................................................................................................................... 05
(Other) ..................................................................................................................................................................................... 06
(Refused) ............................................................................................................................................................... 98

ANZ Survey of Adult Financial Literacy in Australia (2008) 124
The Social Research Centre
SECTION A. MONEY AND THE EXCHANGE OF MONEY
Q5 A1
READ OUT, MULTIPLE RESPONSE ROTATE CODE FRAME Firstly, I'd like to talk about ways of paying for goods and services. Which of the following payment methods do you, yourself, use? [MA]
Code Route
Cash.......................................................................................................................................................................................... 01
Cheques................................................................................................................................................................................... 02
Money orders .......................................................................................................................................................................... 03
Credit cards ............................................................................................................................................................................. 04
Store cards .............................................................................................................................................................................. 05
ATMs (Automatic Teller Machines).................................................................................................................................... 06
EFTPOS (Electronic Funds Transfer At Point Of Sale) ................................................................................................ 07
Direct Debit.............................................................................................................................................................................. 08
Bpay .......................................................................................................................................................................................... 09
Telephone Banking................................................................................................................................................................ 10
Internet Banking ..................................................................................................................................................................... 11
Loans from a financial institution ........................................................................................................................................ 12
Loans from family and friends............................................................................................................................................. 13
Payday loans ......................................................................................................................................................... 14
Laybys ...................................................................................................................................................................................... 15
Visa Debit card or Debit MasterCard.................................................................................................................... 16
None of these (DO NOT READ OUT)............................................................................................................................... 17
Can't say (DO NOT READ OUT) .......................................................................................................................... 99 Q6 A2
READ OUT RESPONSES NOT MENTIONED IN Q5 IF RESPONDENT HAS NOT USED EVERY PAYMENT METHOD (CODES 2 to 12, 14 IN Q5), ASK READ OUT, MULTIPLE RESPONSE ROTATE CODE FRAME What other payment methods do you know how to use, even if you don't use them yourself [MA]
Code Route
Cheques................................................................................................................................................................................... 02
Money orders .......................................................................................................................................................................... 03
Credit cards ............................................................................................................................................................................. 04
Store cards .............................................................................................................................................................................. 05
ATMs (Automatic Teller Machines).................................................................................................................................... 06
EFTPOS (Electronic Funds Transfer At Point Of Sale) ................................................................................................ 07
Direct Debit.............................................................................................................................................................................. 08
Bpay .......................................................................................................................................................................................... 09

ANZ Survey of Adult Financial Literacy in Australia (2008) 125
The Social Research Centre
Q6 A2 READ OUT RESPONSES NOT MENTIONED IN Q5 IF RESPONDENT HAS NOT USED EVERY PAYMENT METHOD (CODES 2 to 12, 14 IN Q5), ASK READ OUT, MULTIPLE RESPONSE ROTATE CODE FRAME What other payment methods do you know how to use, even if you don't use them yourself [MA]
Code Route
Telephone Banking................................................................................................................................................................ 10
Internet Banking ..................................................................................................................................................................... 11
Loans from a financial institution ........................................................................................................................................ 12
Payday loans ......................................................................................................................................................... 14
Laybys ...................................................................................................................................................................................... 15
Visa Debit card or Debit MasterCard.................................................................................................................... 16
(None of these) ...................................................................................................................................................... 17
Can't say (DO NOT READ OUT) .......................................................................................................................... 99

ANZ Survey of Adult Financial Literacy in Australia (2008) 126
The Social Research Centre
SECTION B - BASIC FINANCIAL SERVICES Q7-Q10 – 100% of Respondents Q7 B1
INTERVIEWER TO REFER TO 'TERM DEFINITIONS' CARD AS NECESSARY.] READ OUT, MULTIPLE RESPONSE Which of the following do you have yourself or jointly with someone else? [MA]
Code Route
An ordinary or everyday account with a bank, building society or credit union ....................................................... 01
A high interest savings account ............................................................................................................................ 02
Superannuation fund............................................................................................................................................................. 03
Managed Investments other than Superannuation ........................................................................................................ 04
Shares ...................................................................................................................................................................................... 05
Term Deposits ........................................................................................................................................................................ 06
An Investment Property ........................................................................................................................................................ 07
Other investments such as debentures, bonds, notes or derivatives................................................................. 08
[ONLY READ THIS OPTION IF RESPONDENT HAS AN INVESTMENT PROPERTY; OTHERWISE GO TO CODE 10] A Mortgage on an Investment Property............................................................................................................ 09
A Mortgage for your own home .......................................................................................................................................... 10
A Home Equity Loan ............................................................................................................................................................. 11
An equity release product like a reverse mortgage or shared appreciation mortgage .......................................... 12
A Personal Loan..................................................................................................................................................................... 13
A Loan by line of credit or overdraft................................................................................................................................... 14
A "Margin" Loan, which is a loan solely to purchase Shares or Managed Investments........................................ 15
A Lease or Hire Purchase Agreement .............................................................................................................................. 16
Home Building Insurance ..................................................................................................................................................... 17
Home Contents Insurance .................................................................................................................................... 18
Comprehensive Vehicle Insurance .................................................................................................................................... 19
[ONLY READ IF OPTION IF RESPONDENT DOES NOT HAVE COMPREHENSIVE VEHICLE INSURANCE, OTHERWISE GO TO CODE 21] Third Party Vehicle Insurance.................................................................................................................................... 20
Private Health Insurance ...................................................................................................................................................... 21
Life Insurance. ........................................................................................................................................................................ 22
Retirement Income Stream Product such as an annuity or pension.......................................................................... 23
Income Protection Insurance .............................................................................................................................................. 24
Any other type of insurance (eg: consumer finance insurance).................................................................................. 25
None (DO NOT READ OUT)............................................................................................................................................... 26
Can't say (DO NOT READ OUT) ....................................................................................................................................... 99

ANZ Survey of Adult Financial Literacy in Australia (2008) 127
The Social Research Centre
Q8A B6
[IF RESPONDENT DOES NOT HAVE A MORTGAGE ON OWN HOME OR AN INVESTMENT PROPERTY MORTGAGE (Q7/7-8) ASK] You said that you don’t have a mortgage, are you considering taking one on in the next 12 months? [SA]
Code Route
Yes ............................................................................................................................................................................................ 01
No .............................................................................................................................................................................................. 02
Can't say .................................................................................................................................................................................. 99 Q8 B7
READ OUT, SINGLE RESPONSE ROTATE CODE FRAME Who is responsible for money management in your household? [SA] (IF NECESSARY: managing money can be things like organizing loans, investments and paying the bills)
Code Route
Yourself .................................................................................................................................................................................... 01
Your Partner............................................................................................................................................................................ 02
You and your Partner jointly ................................................................................................................................................ 03
Family Member....................................................................................................................................................................... 04
(DON'T READ) Someone else............................................................................................................................................ 05
(DON'T READ) Can't say ..................................................................................................................................................... 99 Q9 B9A
READ OUT, MULTIPLE RESPONSE ROTATE CODE FRAME Have you read or used any of the following sources over these last 5 years to assist with your financial decision-making? [MA]
Code Route
Financial sections of newspapers or magazines ............................................................................................................ 01
Printed books or other financial publications ................................................................................................................... 02
Finance-related sites on the Internet................................................................................................................................. 03
Seminars .................................................................................................................................................................................. 04
Publications from the finance industry .............................................................................................................................. 05
Publications from Government (eg. ASIC, FaHCSIA, Fair Trading, Consumer Affairs)........................................ 06
Publications from community organisations (eg. financial counselling) .................................................................... 07
[DON'T READ] None............................................................................................................................................................. 08
Other [PLEASE SPECIFY] ................................................................................................................................................. 09
[DON'T READ] Can't say ..................................................................................................................................................... 99
[DON'T READ] Refused ........................................................................................................................................ 98

ANZ Survey of Adult Financial Literacy in Australia (2008) 128
The Social Research Centre
Q10 B3
READ OUT, MULTIPLE RESPONSE ROTATE CODE FRAME And have you consulted any of the following people regarding your finances? [MA] (IF NECESSARY: Have you ever done this?)
Code Route
An Accountant ........................................................................................................................................................................ 01
A Mortgage Broker ................................................................................................................................................................ 02
A Stock Broker........................................................................................................................................................................ 03
An Insurance Broker ............................................................................................................................................................. 04
A Taxation Specialist............................................................................................................................................................. 05
A Financial Counsellor.......................................................................................................................................................... 06
A Bank Manager or Bank Employee ................................................................................................................................. 07
A Financial Planner or Advisor ........................................................................................................................................... 08
Family or friends..................................................................................................................................................................... 09
Centrelink Financial Information Service Officers .......................................................................................................... 10
Someone else......................................................................................................................................................................... 11
[DON'T READ] None............................................................................................................................................................. 12
[DON'T READ] Can't say ..................................................................................................................................................... 99 Q11 D6
[IF HAVE INVESTMENT (Q7/4-8), ASK] [DO NOT READ OUT] [SINGLE RESPONSE ] Thinking about your most recent investment, what did you decide to invest in? [SA]
Code Route
Property.................................................................................................................................................................. 01
Shares .................................................................................................................................................................... 02
Managed Investment............................................................................................................................................. 03
Term Deposit ......................................................................................................................................................... 04
Superannuation ..................................................................................................................................................... 05
Debentures............................................................................................................................................................. 06
Bonds ..................................................................................................................................................................... 07
Derivatives ............................................................................................................................................................. 08
Other [PLEASE SPECIFY] ................................................................................................................................................. 09
[DON'T READ] Can't recall .................................................................................................................................................. 99
[DON'T READ] Refused ........................................................................................................................................ 98

ANZ Survey of Adult Financial Literacy in Australia (2008) 129
The Social Research Centre
Q12 D6B
[IF NOMINATE INVESTMENT Q11/1-9 ASK] [DO NOT READ OUT] [MULTIPLE RESPONSE] How did you find out about this investment? [MA]
Code Route
Friends and family ................................................................................................................................................. 01
Financial sections of newspapers or magazines ............................................................................................................ 02
Printed books or other financial publications ................................................................................................................... 03
Finance-related sites on the Internet................................................................................................................................. 04
Seminars .................................................................................................................................................................................. 05
Publications from the finance industry .............................................................................................................................. 06
Publications from Government (eg. ASIC, FaHCSIA, Fair Trading, Consumer Affairs)........................................ 07
Publications from community organisations (eg. financial counselling) .................................................................... 08
Advertisements ...................................................................................................................................................... 09
[DON'T READ] None............................................................................................................................................................. 10
Other [PLEASE SPECIFY] ................................................................................................................................................. 11
[DON'T READ] Can't say ..................................................................................................................................................... 99 Q13 D6C
[IF NOMINATE INVESTMENT Q11/1-9 ASK] [DO NOT READ OUT] [MULTIPLE RESPONSE] And what were you looking for in this investment? [MA]
Code Route
Accessibility/flexibility ............................................................................................................................................ 01
Long term capital gains ......................................................................................................................................... 02
Diversification/Portfolio diversification .................................................................................................................. 03
Ethical investment.................................................................................................................................................. 04
Higher long term returns than cash ...................................................................................................................... 05
Income stream - now / in the near term................................................................................................................ 06
Income stream - in the future / in retirement ........................................................................................................ 07
Low risk/Safety/security........................................................................................................................................................ 08
Return..................................................................................................................................................................... 09
Saving for the future .............................................................................................................................................. 10
Short term financial gain........................................................................................................................................ 11
Tax free/Tax effective/Tax benefits ...................................................................................................................... 12
Nothing in particular .............................................................................................................................................................. 13
Other [PLEASE SPECIFY] ................................................................................................................................................. 14
Can't say .................................................................................................................................................................................. 99
Refused.................................................................................................................................................................. 98

ANZ Survey of Adult Financial Literacy in Australia (2008) 130
The Social Research Centre
SECTION C1. FINANCIAL RECORDS AND INFORMATION - COMPARISON SHOPPING Q14 D1AA
ASK ALL [DON’T READ] [MULTIPLE RESPONSE] Thinking now about fees and charges, what specific steps do you take to minimise or avoid fees and charges relating to your everyday banking? [MA]
Code Route
ATM USE - Only use ATMs from the same bank as my account............................................................................... 01
GENERAL BANKING - Keeping the number of transactions I make to my monthly limit..................................... 02
GENERAL BANKING - Use internet or telephone banking................................................................................. 03
CARD USE - Minimise the number of transaction I make per month........................................................................ 04
CARD USE - Make fewer but larger cash withdrawals rather than more but smaller cash withdrawals........... 05
CARD USE - Withdraw cash when paying for other purchases (e.g. petrol, groceries) ....................................... 06
BRANCH USE - I minimise the number of branch visits .............................................................................................. 07
CREDIT CARD - Pay off monthly credit card balance in full ....................................................................................... 08
CREDIT CARD - Ensure the minimum monthly payments are made on credit card ............................................. 09
CREDIT CARD - Make sure card limit is not exceeded ...................................................................................... 10
ACCOUNTS - Pay a flat account keeping fee which caps monthly charges ........................................................... 11
ACCOUNTS - Keep at least a minimum amount in account ....................................................................................... 12
CHEQUE ACCOUNT - Closed cheque accounts........................................................................................................... 13
CHEQUE ACCOUNT - Minimise the amount of money sitting in cheque accounts .............................................. 14
Other [SPECIFY].................................................................................................................................................................... 15
None/Don’t take any steps .................................................................................................................................... 16
Can't say .................................................................................................................................................................................. 99
Refused.................................................................................................................................................................. 98

ANZ Survey of Adult Financial Literacy in Australia (2008) 131
The Social Research Centre
SECTION COMPARISON SHOPPING Introduction The next few questions are about what you do when you need a financial product like an everyday banking account, an investment or a loan. In particular, whether you shop around by comparing financial products from different organisations. EVERYDAY BANKING ACCOUNTS Q15 D2
[IF HAVE ORDINARY, EVERYDAY ACCOUNT (Q7/1), ASK] [READ OUT] [SINGLE RESPONSE] When arranging a new ordinary or everyday account with a bank, building society or credit union, do you shop around? [SA]
Code Route
A lot ........................................................................................................................................................................................... 01
A fair bit .................................................................................................................................................................................... 02
A little ........................................................................................................................................................................................ 03
Not at all ................................................................................................................................................................................... 04
[DON'T READ] Have never done this/needed to do this .............................................................................................. 05
[DON'T READ] Can't say ..................................................................................................................................................... 99 Q16 D3
[IF NO SHOPPING AROUND D2/4), ASK] [DON’T READ] [MULTIPLE RESPONSE] What is the main reason you didn’t shop around? What else? Anything else? [MA]
Code Route
Couldn't be bothered ............................................................................................................................................................. 01
Don't have the time................................................................................................................................................................ 02
"They're all the same" ........................................................................................................................................................... 03
Just go with what is recommended by friend or family member ................................................................................. 04
Just go with what is recommended by financial expert................................................................................................. 05
Only one bank in town .......................................................................................................................................................... 06
Have never arranged a new ordinary/everyday account .............................................................................................. 07
Spouse/partner does shopping around............................................................................................................................. 08
Part of a package or combined with another product.................................................................................................... 09
Had no choice/No say in it .................................................................................................................................... 10
Too difficult to make comparisons/get information .............................................................................................. 11
Other [SPECIFY].................................................................................................................................................................... 12
Can't Say.................................................................................................................................................................................. 99
Refused.................................................................................................................................................................. 98
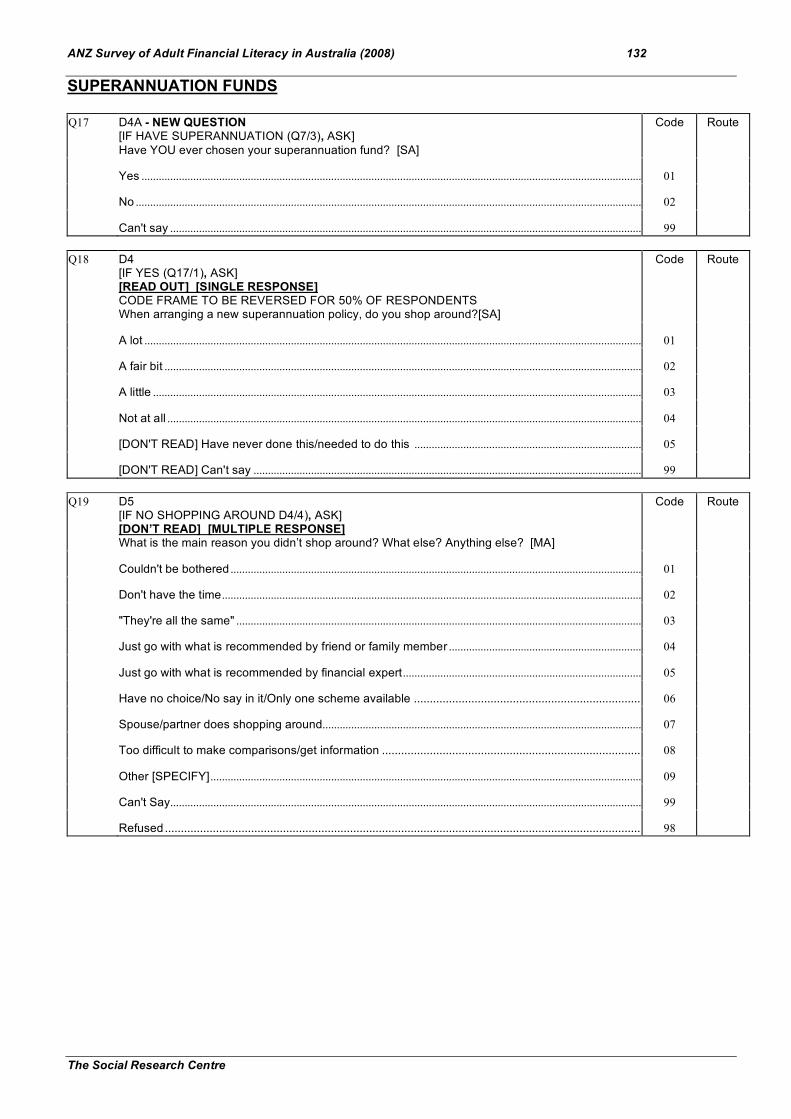
ANZ Survey of Adult Financial Literacy in Australia (2008) 132
The Social Research Centre
SUPERANNUATION FUNDS Q17 D4A - NEW QUESTION
[IF HAVE SUPERANNUATION (Q7/3), ASK] Have YOU ever chosen your superannuation fund? [SA]
Code Route
Yes ............................................................................................................................................................................................ 01
No .............................................................................................................................................................................................. 02
Can't say .................................................................................................................................................................................. 99 Q18 D4
[IF YES (Q17/1), ASK] [READ OUT] [SINGLE RESPONSE] CODE FRAME TO BE REVERSED FOR 50% OF RESPONDENTS When arranging a new superannuation policy, do you shop around?[SA]
Code Route
A lot ........................................................................................................................................................................................... 01
A fair bit .................................................................................................................................................................................... 02
A little ........................................................................................................................................................................................ 03
Not at all ................................................................................................................................................................................... 04
[DON'T READ] Have never done this/needed to do this ............................................................................................. 05
[DON'T READ] Can't say ..................................................................................................................................................... 99 Q19 D5
[IF NO SHOPPING AROUND D4/4), ASK] [DON’T READ] [MULTIPLE RESPONSE] What is the main reason you didn’t shop around? What else? Anything else? [MA]
Code Route
Couldn't be bothered ............................................................................................................................................................. 01
Don't have the time................................................................................................................................................................ 02
"They're all the same" ........................................................................................................................................................... 03
Just go with what is recommended by friend or family member ................................................................................. 04
Just go with what is recommended by financial expert................................................................................................. 05
Have no choice/No say in it/Only one scheme available .................................................................................... 06
Spouse/partner does shopping around............................................................................................................................. 07
Too difficult to make comparisons/get information .............................................................................................. 08
Other [SPECIFY].................................................................................................................................................................... 09
Can't Say.................................................................................................................................................................................. 99
Refused.................................................................................................................................................................. 98

ANZ Survey of Adult Financial Literacy in Australia (2008) 133
The Social Research Centre
RETIREMENT INCOME STREAMS Q20 D5A
[IF HAVE RETIREMENT INCOME STREAM PRODUCT (Q7/23), ASK] [READ OUT] [SINGLE RESPONSE] CODE FRAME TO BE REVERSED FOR 50% OF RESPONDENTS When arranging a new retirement income stream product, do you shop around?[SA]
Code Route
A lot ........................................................................................................................................................................................... 01
A fair bit .................................................................................................................................................................................... 02
A little ........................................................................................................................................................................................ 03
Not at all ................................................................................................................................................................................... 04
[DON'T READ] Have never done this/needed to do this .............................................................................................. 05
[DON'T READ] Can't say ..................................................................................................................................................... 99 Q21 D5B
[IF NOT SHOPPED AROUND (Q20/4), ASK] [DON’T READ] [MULTIPLE RESPONSE] What’s the main reason you didn’t shop around? What else? Anything else? [MA]
Code Route
Couldn't be bothered ............................................................................................................................................................. 01
Don't have the time................................................................................................................................................................ 02
"They're all the same" ........................................................................................................................................................... 03
Just go with what is recommended by friend or family member ................................................................................. 04
Just go with what is recommended by financial expert................................................................................................. 05
Have no choice/no say in it, only one scheme is available .......................................................................................... 06
Spouse/ partner does shopping around ........................................................................................................................... 07
Too difficult to make comparisons/get information .............................................................................................. 08
Other [SPECIFY].................................................................................................................................................................... 09
Can't say .................................................................................................................................................................................. 99
Refused.................................................................................................................................................................. 98 MORTGAGES/MORTGAGE BROKERS Q22 D8
[IF HAVE A MORTGAGE (Q7/9-10), ASK [READ OUT] [SINGLE RESPONSE] CODE FRAME TO BE REVERSED FOR 50% OF RESPONDENTS When arranging a new mortgage, did you shop around? [SA]
Code Route
A lot ........................................................................................................................................................................................... 01
A fair bit .................................................................................................................................................................................... 02
A little ........................................................................................................................................................................................ 03
Not at all ................................................................................................................................................................................... 04
[DON'T READ] Have never done this/needed to do this .............................................................................................. 05
[DON'T READ] Can't say ..................................................................................................................................................... 99

ANZ Survey of Adult Financial Literacy in Australia (2008) 134
The Social Research Centre
Q23 D8B
[IF HAVE A MORTGAGE (Q7/9-10), ASK [READ OUT] [SINGLE RESPONSE] Did you use a mortgage broker?
Code Route
Yes ............................................................................................................................................................................................ 01
No .............................................................................................................................................................................................. 02
[DON'T READ] Have never needed to do this ................................................................................................................ 03
[DON'T READ] Can't say ..................................................................................................................................................... 99
[DON'T READ] Refused ....................................................................................................................................................... 98 Q24 D8C
[IF “YES - MORTGAGE BROKER” (D8B/1), ASK] [DON’T READ] [MULTIPLE RESPONSE] What were the things that you considered when deciding which mortgage broker to use? What else? Anything else? [MA]
Code Route
Independence ......................................................................................................................................................................... 01
Reputable brand..................................................................................................................................................................... 02
Recommended by financial expert .................................................................................................................................... 03
Recommended by friend or family member..................................................................................................................... 04
Got the best deal ................................................................................................................................................... 05
They were on my side ........................................................................................................................................... 06
They ‘knew the market’ ......................................................................................................................................... 07
Fees........................................................................................................................................................................ 08
Convenience / I didn’t have to run around ....................................................................................................................... 09
Impressed with professionalism/knowledge .................................................................................................................... 10
Friendly, good people skills................................................................................................................................... 11
Attentive, personal service .................................................................................................................................... 12
Endorsements (by celebrity or consumer testimonial) .................................................................................................. 13
Whether they are paid by commission ................................................................................................................. 14
No particular reason why I chose that broker/ didn't think too much about it .......................................................... 15
Other [SPECIFY].................................................................................................................................................................... 16
Can't say .................................................................................................................................................................................. 99
Refused.................................................................................................................................................................. 98
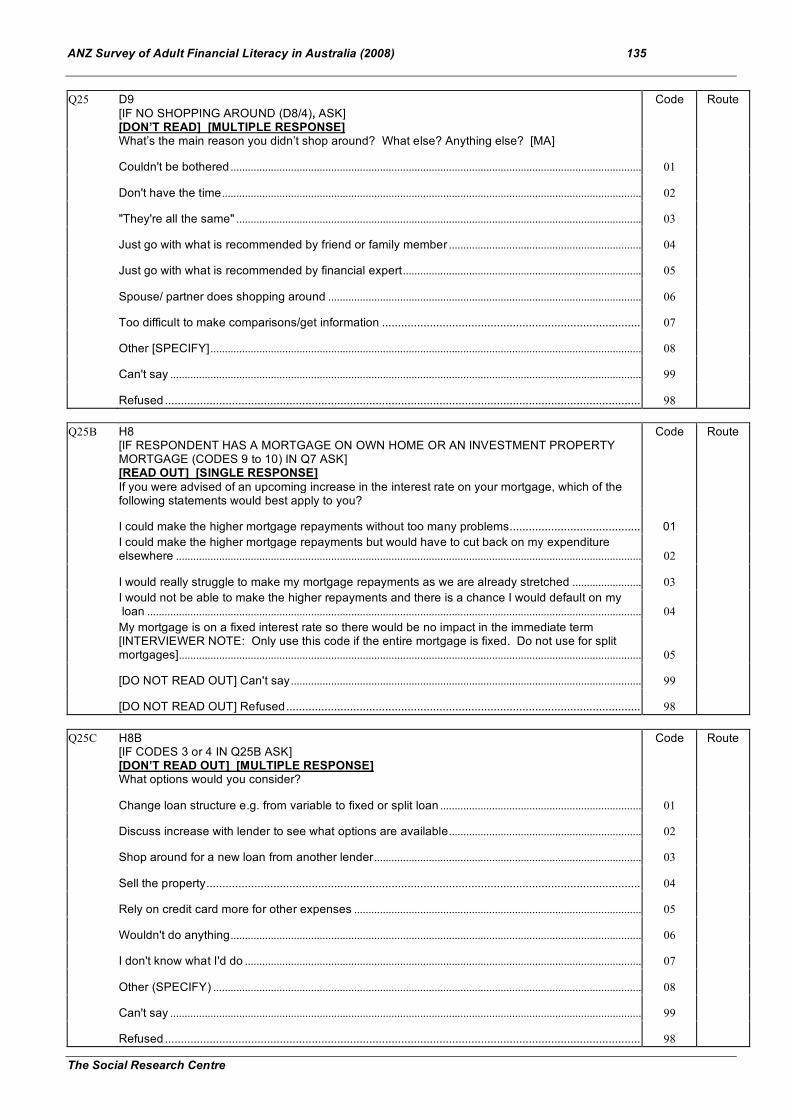
ANZ Survey of Adult Financial Literacy in Australia (2008) 135
The Social Research Centre
Q25 D9
[IF NO SHOPPING AROUND (D8/4), ASK] [DON’T READ] [MULTIPLE RESPONSE] What’s the main reason you didn’t shop around? What else? Anything else? [MA]
Code Route
Couldn't be bothered ............................................................................................................................................................. 01
Don't have the time................................................................................................................................................................ 02
"They're all the same" ........................................................................................................................................................... 03
Just go with what is recommended by friend or family member ................................................................................. 04
Just go with what is recommended by financial expert................................................................................................. 05
Spouse/ partner does shopping around ........................................................................................................................... 06
Too difficult to make comparisons/get information .............................................................................................. 07
Other [SPECIFY].................................................................................................................................................................... 08
Can't say .................................................................................................................................................................................. 99
Refused.................................................................................................................................................................. 98 Q25B H8
[IF RESPONDENT HAS A MORTGAGE ON OWN HOME OR AN INVESTMENT PROPERTY MORTGAGE (CODES 9 to 10) IN Q7 ASK] [READ OUT] [SINGLE RESPONSE] If you were advised of an upcoming increase in the interest rate on your mortgage, which of the following statements would best apply to you?
Code Route
I could make the higher mortgage repayments without too many problems...................................................... 01
I could make the higher mortgage repayments but would have to cut back on my expenditure elsewhere ................................................................................................................................................................................ 02
I would really struggle to make my mortgage repayments as we are already stretched ...................................... 03
I would not be able to make the higher repayments and there is a chance I would default on my loan .......................................................................................................................................................................................... 04
My mortgage is on a fixed interest rate so there would be no impact in the immediate term [INTERVIEWER NOTE: Only use this code if the entire mortgage is fixed. Do not use for split mortgages]............................................................................................................................................................................... 05
[DO NOT READ OUT] Can't say ........................................................................................................................................ 99
[DO NOT READ OUT] Refused............................................................................................................................ 98 Q25C H8B
[IF CODES 3 or 4 IN Q25B ASK] [DON’T READ OUT] [MULTIPLE RESPONSE] What options would you consider?
Code Route
Change loan structure e.g. from variable to fixed or split loan .................................................................................... 01
Discuss increase with lender to see what options are available................................................................................. 02
Shop around for a new loan from another lender........................................................................................................... 03
Sell the property..................................................................................................................................................... 04
Rely on credit card more for other expenses .................................................................................................................. 05
Wouldn't do anything............................................................................................................................................................. 06
I don't know what I'd do ........................................................................................................................................................ 07
Other (SPECIFY) ................................................................................................................................................................... 08
Can't say .................................................................................................................................................................................. 99
Refused.................................................................................................................................................................. 98
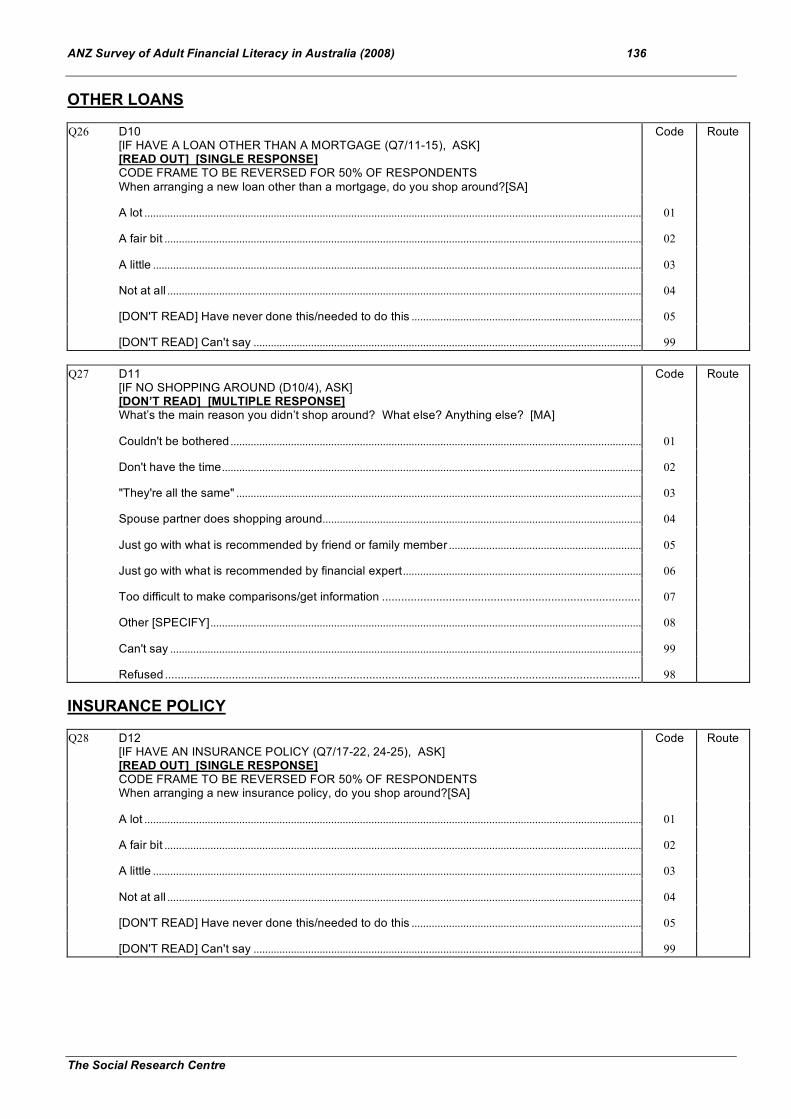
ANZ Survey of Adult Financial Literacy in Australia (2008) 136
The Social Research Centre
OTHER LOANS Q26 D10
[IF HAVE A LOAN OTHER THAN A MORTGAGE (Q7/11-15), ASK] [READ OUT] [SINGLE RESPONSE] CODE FRAME TO BE REVERSED FOR 50% OF RESPONDENTS When arranging a new loan other than a mortgage, do you shop around?[SA]
Code Route
A lot ........................................................................................................................................................................................... 01
A fair bit .................................................................................................................................................................................... 02
A little ........................................................................................................................................................................................ 03
Not at all ................................................................................................................................................................................... 04
[DON'T READ] Have never done this/needed to do this .............................................................................................. 05
[DON'T READ] Can't say ..................................................................................................................................................... 99 Q27 D11
[IF NO SHOPPING AROUND (D10/4), ASK] [DON’T READ] [MULTIPLE RESPONSE] What’s the main reason you didn’t shop around? What else? Anything else? [MA]
Code Route
Couldn't be bothered ............................................................................................................................................................. 01
Don't have the time................................................................................................................................................................ 02
"They're all the same" ........................................................................................................................................................... 03
Spouse partner does shopping around............................................................................................................................. 04
Just go with what is recommended by friend or family member ................................................................................. 05
Just go with what is recommended by financial expert................................................................................................. 06
Too difficult to make comparisons/get information .............................................................................................. 07
Other [SPECIFY].................................................................................................................................................................... 08
Can't say .................................................................................................................................................................................. 99
Refused.................................................................................................................................................................. 98 INSURANCE POLICY Q28 D12
[IF HAVE AN INSURANCE POLICY (Q7/17-22, 24-25), ASK] [READ OUT] [SINGLE RESPONSE] CODE FRAME TO BE REVERSED FOR 50% OF RESPONDENTS When arranging a new insurance policy, do you shop around?[SA]
Code Route
A lot ........................................................................................................................................................................................... 01
A fair bit .................................................................................................................................................................................... 02
A little ........................................................................................................................................................................................ 03
Not at all ................................................................................................................................................................................... 04
[DON'T READ] Have never done this/needed to do this .............................................................................................. 05
[DON'T READ] Can't say ..................................................................................................................................................... 99

ANZ Survey of Adult Financial Literacy in Australia (2008) 137
The Social Research Centre
Q29 D13
[IF NO SHOPPING AROUND (D12/4), ASK] [DON’T READ] [MULTIPLE RESPONSE] What’s the main reason you didn’t shop around? What else? Anything else? [MA]
Code Route
Couldn't be bothered ............................................................................................................................................................. 01
Don't have time....................................................................................................................................................................... 02
"They're all the same" ........................................................................................................................................................... 03
Just go with what is recommended by friend or family member ................................................................................. 04
Just go with what is recommended by financial expert................................................................................................. 05
Spouse/ partner does shopping around ........................................................................................................................... 06
Too difficult to make comparisons/get information .............................................................................................. 07
Just renewed my existing policy ........................................................................................................................... 08
Other [SPECIFY].................................................................................................................................................................... 09
Can't say .................................................................................................................................................................................. 99
Refused.................................................................................................................................................................. 98 FINANCIAL PLANNER Q30 D14
[IF USED A FINANCIAL PLANNER OR ADVISOR (Q10/8), ASK [READ OUT] [SIBGLE RESPONSE] CODE FRAME TO BE REVERSED FOR 50% OF RESPONDENTS When choosing a financial planner or advisor, do you shop around?[SA]
Code Route
A lot ........................................................................................................................................................................................... 01
A fair bit .................................................................................................................................................................................... 02
A little ........................................................................................................................................................................................ 03
Not at all ................................................................................................................................................................................... 04
[DON'T READ] Have never done this/needed to do this .............................................................................................. 05
[DON'T READ] Can't say ..................................................................................................................................................... 99 Q31 D15
[IF NO SHOPPING AROUND (D14/4), ASK] [DON’T READ] [MULTIPLE RESPONSE] What’s the main reason you didn’t shop around? What else? Anything else? [MA]
Code Route
Couldn't be bothered ............................................................................................................................................................. 01
Don't have the time................................................................................................................................................................ 02
"They're all the same" ........................................................................................................................................................... 03
Just go with what is recommended by friend or family member ................................................................................. 04
Just go with what is recommended by financial expert................................................................................................. 05
Spouse/ partner does shopping around ........................................................................................................................... 06
Too difficult to make comparisons/get information .............................................................................................. 07
Other [SPECIFY].................................................................................................................................................................... 08
Can't say .................................................................................................................................................................................. 99
Refused.................................................................................................................................................................. 98

ANZ Survey of Adult Financial Literacy in Australia (2008) 138
The Social Research Centre
Q32 D15B
[IF HAVE A FINANCIAL PLANNER OR ADVISOR (Q10/8)), ASK] [DON’T READ] [MULTIPLE RESPONSE] What were the things that made you feel positive about the financial planner you chose? What else? Anything else? [MA]
Code Route
Independence ......................................................................................................................................................................... 01
Reputable brand..................................................................................................................................................................... 02
Recommended by financial expert .................................................................................................................................... 03
Recommended by friend or family member..................................................................................................................... 04
Fees........................................................................................................................................................................ 05
Convenience ........................................................................................................................................................................... 06
Impressed with professionalism/knowledge .................................................................................................................... 07
Friendly, good people skills................................................................................................................................... 08
Attentive personal service ..................................................................................................................................... 09
Endorsements (by celebrity or consumer testimonial) .................................................................................................. 10
Attentive personal service ..................................................................................................................................... 11
Reliable/efficient service........................................................................................................................................ 12
Friendly, good people skills................................................................................................................................... 13
No particular reason why I chose that planner/ didn't think too much about it ........................................................ 14
Other [SPECIFY].................................................................................................................................................................... 15
Can't say .................................................................................................................................................................................. 99
Refused.................................................................................................................................................................. 98 Q33 D15C
[IF HAVE A FINANCIAL PLANNER OR ADVISOR (Q10/8)), ASK] [SINGLE RESPONSE] When your financial planner makes investment recommendations, do you consider whether they have any conflicts of interest?
Code Route
Yes ............................................................................................................................................................................................ 01
No .............................................................................................................................................................................................. 02
Can't say .................................................................................................................................................................................. 99
Refused.................................................................................................................................................................. 98

ANZ Survey of Adult Financial Literacy in Australia (2008) 139
The Social Research Centre
Q33B D15D
[IF HAVE A FINANCIAL PLANNER OR ADVISOR (Q10/8) AND CODE 1 AT Q33), ASK] [DO NOT READ OUT] [MULTIPLE RESPONSE] What specific things do you look at to see if there is a conflict? Anything else? [MA]
Code Route
Planner gets a commission from the provider of the products sold ........................................................................... 01
Planner’s fee is based on the amount you have invested................................................................................... 02
Planner charges a flat fee not related to products sold or amount invested ............................................................ 03
Planner recommends products from different providers............................................................................................... 04
Planner only recommends products from one provider ................................................................................................ 05
Planner/Planning company is independent ..................................................................................................................... 06
Nothing in particular / don't think too much about it ....................................................................................................... 07
Other [SPECIFY].................................................................................................................................................................... 08
Can't say .................................................................................................................................................................................. 99
Refused.................................................................................................................................................................. 98 Q33C D15E
[IF HAVE A FINANCIAL PLANNER OR ADVISOR (Q10/8) AND CODE 2 AT Q33), ASK] [RECORD VERBATIM] [MULTIPLE RESPONSE] Why do you say that? Anything else? [MA]
Code Route
Reason give [SPECIFY] ....................................................................................................................................................... 01
Can't say .................................................................................................................................................................................. 99
Refused.................................................................................................................................................................. 98

ANZ Survey of Adult Financial Literacy in Australia (2008) 140
The Social Research Centre
SECTION C2: USE OF RATINGS AGENCIES Q34A D16B
[READ OUT] [MULTIPLE RESPONSE] Have you ever used the following types of organisation to compare financial products or services? [MA]
Code Route
A financial products rating agency like Cannex, Morningstar or SuperRatings ...................................................... 01
An organisation like the Australian Consumers’ Association or its magazine Choice....................................... 02
[DO NOT READ] No/None of these................................................................................................................................... 03
[DO NOT READ] Can't say .................................................................................................................................................. 99
[DO NOT READ] Refused..................................................................................................................................... 98 Q34B D16C
[DO NOT READ] [MULTIPLE RESPONSE] What types of financial products or services did you compare? [MA]
Code Route
Superannuation funds........................................................................................................................................................... 01
Managed funds/Managed investments ................................................................................................................ 02
Retirement income products/Allocated pensions/Market linked pensions ......................................................... 03
Everyday banking accounts .................................................................................................................................. 04
On-line savings accounts ...................................................................................................................................... 05
Mortgage products/Home loans/Investment loans .............................................................................................. 06
Personal loans ....................................................................................................................................................... 07
Credit cards............................................................................................................................................................ 08
Financial advisors .................................................................................................................................................. 09
Insurance ............................................................................................................................................................... 10
Other (Specify)....................................................................................................................................................... 11
Can't say .................................................................................................................................................................................. 99
Refused.................................................................................................................................................................. 98

ANZ Survey of Adult Financial Literacy in Australia (2008) 141
The Social Research Centre
SECTION C3: CHECKING ACCOUNT TRANSACTIONS/STATEMENTS Next I have some questions about the account statements financial institutions provide to people who use their products and services. CREDIT/STORE CARD STATEMENTS Q38 D18
[IF USES CREDIT CARD OR STORE CARD (Q5/4-5), ASK] [SINGLE RESPONSE] Do you check your credit card or store card transactions? (IF NECESSARY: You could check your transactions online or when you receive your statement)
Code Route
Yes ............................................................................................................................................................................................ 01
No .............................................................................................................................................................................................. 02
Can't say .................................................................................................................................................................................. 99
Refused.................................................................................................................................................................. 98 Q39 D18B
[IF READ CREDIT CARD OR STORE CARD STATEMENTS (Q39/1), ASK] [DON’T READ] [MULTIPLE RESPONSE] And what do you generally look for when you check your credit card or store card transactions? What else? Anything else? [MA] [IF “CHECK THAT EVERYTHING IS RIGHT” PROBE: “What in particular do you look for?”]
Code Route
Account balance..................................................................................................................................................................... 01
Account fees ........................................................................................................................................................................... 02
Interest charged ..................................................................................................................................................................... 03
Transactions are correct / not fraudulent ............................................................................................................. 04
Reward scheme points/information ................................................................................................................................... 05
Amount spent.......................................................................................................................................................................... 06
Amount repaid ........................................................................................................................................................................ 07
Available credit ....................................................................................................................................................................... 08
Foreign exchange fees ......................................................................................................................................................... 09
Date of transactions .............................................................................................................................................................. 10
Date of statement................................................................................................................................................................... 11
Minimum payment due ......................................................................................................................................................... 12
Cash advances....................................................................................................................................................................... 13
Date payment is due ............................................................................................................................................................. 14
To check that everything is right......................................................................................................................................... 15
Nothing in particular .............................................................................................................................................................. 16
Other [SPECIFY].................................................................................................................................................................... 17
Can't say .................................................................................................................................................................................. 99
Refused.................................................................................................................................................................. 98

ANZ Survey of Adult Financial Literacy in Australia (2008) 142
The Social Research Centre
Q40 D24B [IF DON’T READ CREDIT CARD OR STORE CARD STATEMENTS (D18/2 OR 99), ASK] [DON’T READ] [MULTIPLE RESPONSE] Why don’t you check your CREDIT CARD OR STORE CARD transactions? What else? Anything else? [MA]
Code Route
Couldn't be bothered ............................................................................................................................................................. 01
Don't have the time................................................................................................................................................................ 02
Other priorities more important ........................................................................................................................................... 03
Just assume they're correct/ok ........................................................................................................................................... 04
Too difficult to understand.................................................................................................................................................... 05
Someone else reads them ................................................................................................................................................... 06
Find it too depressing/ worried about how much I might have spent......................................................................... 07
Other [SPECIFY].................................................................................................................................................................... 08
Can't say .................................................................................................................................................................................. 99
Refused.................................................................................................................................................................. 98 SUPERANNUATION STATEMENTS Q41 D20
[IF HAVE SUPERANNUATION (Q7/3), ASK] [SINGLE RESPONSE] Do you receive superannuation fund statements? [SA]
Code Route
Yes ............................................................................................................................................................................................ 01
No .............................................................................................................................................................................................. 02
Can't say .................................................................................................................................................................................. 99
Refused.................................................................................................................................................................. 98 Q42 D20A
[IF RECEIVE SUPERANNUATION STATEMENTS (Q43/1), ASK] [SINGLE RESPONSE] Do you read these at all? [SA]
Code Route
Yes ............................................................................................................................................................................................ 01
No .............................................................................................................................................................................................. 02
Can't say .................................................................................................................................................................................. 99
Refused.................................................................................................................................................................. 98

ANZ Survey of Adult Financial Literacy in Australia (2008) 143
The Social Research Centre
Q43 D20B
[IF READ SUPERANNUATION STATEMENTS (D20A/1), ASK] [DON’T READ] [MULTIPLE RESPONSE]
And what do you generally look for when you receive your superannuation fund statements? What else? Anything else? [MA] [IF RESPONDENTS SAYS “FEES” PROBE FOR TYPE OF FEES]
Code Route
Exit fees ................................................................................................................................................................................... 01
Management fees .................................................................................................................................................................. 02
Life insurance premiums ...................................................................................................................................................... 03
Break down of investments ................................................................................................................................................. 04
Value of investment ............................................................................................................................................................... 05
Employer contributions ......................................................................................................................................................... 06
Personal contributions .......................................................................................................................................................... 07
Investment return/Performance .......................................................................................................................................... 08
Death or Disablement benefit ............................................................................................................................................. 09
Beneficiaries............................................................................................................................................................................ 10
Set-up fees .............................................................................................................................................................................. 11
To check that everything is right......................................................................................................................................... 12
Nothing in particular .............................................................................................................................................................. 13
Other [SPECIFY].................................................................................................................................................................... 14
Can't say .................................................................................................................................................................................. 99
Refused.................................................................................................................................................................. 98 Q44 D24D
[IF DON’T READ SUPERANNUATION STATEMENTS (D20A/2 or 99), ASK] [DON’T READ] [MULTIPLE RESPONSE] Why don’t you read your SUPERANNUATION FUND STATEMENTS? What else? Anything else? [MA]
Code Route
Couldn't be bothered ............................................................................................................................................................. 01
Don't have time....................................................................................................................................................................... 02
Other priorities more important ........................................................................................................................................... 03
Just assume they're correct/OK ......................................................................................................................................... 04
Too difficult to understand.................................................................................................................................................... 05
Someone else reads them ................................................................................................................................................... 06
Find them too depressing/worried about what I might find.................................................................................. 07
Other [SPECIFY].................................................................................................................................................................... 08
Can't say .................................................................................................................................................................................. 99
Refused.................................................................................................................................................................. 98

ANZ Survey of Adult Financial Literacy in Australia (2008) 144
The Social Research Centre
Q45 D27
[ASK ALL] [READ OUT] [SINGLE RESPONSE] CODE FRAME TO BE REVERSED FOR 50% OF RESPONDENTS Do you find understanding an annual statement for a superannuation fund? [SA]
Code Route
Very difficult............................................................................................................................................................................. 01
Difficult...................................................................................................................................................................................... 02
Easy .......................................................................................................................................................................................... 03
Very easy ................................................................................................................................................................................. 04
[DON'T READ] Can't say ..................................................................................................................................................... 99
[DON'T READ] Refused ....................................................................................................................................................... 98

ANZ Survey of Adult Financial Literacy in Australia (2008) 145
The Social Research Centre
SECTION D: SUPERANNUATION Q46 B1AA
[IF HAS SUPER (Q7/3) ASK] [SINGLE RESPONSE] Approximately how many Superannuation or Roll-over funds do you have? [SA]
Code Route
One............................................................................................................................................................................................ 01
Two............................................................................................................................................................................................ 02
Three......................................................................................................................................................................................... 03
Four or more ........................................................................................................................................................................... 04
Can't say .................................................................................................................................................................................. 99
Refused.................................................................................................................................................................. 98 Q47 B1A
[IF HAS SUPER (Q7/3) ASK] INTERVIEWER TO REFER TO 'TERM DEFINITIONS' CARD AS NECESSARY. [READ OUT] [MULTIPLE RESPONSE] ROTATE CODE FRAME And which of the following fund types do you or your employer currently contribute to? [MA]
Code Route
Self-managed superannuation fund .................................................................................................................................. 01
Industry fund ........................................................................................................................................................................... 02
Corporation or Employer fund ............................................................................................................................................. 03
Retail ......................................................................................................................................................................................... 04
Public Sector ........................................................................................................................................................................... 05
Retirement Savings Account (RSA) .................................................................................................................................. 06
DO NOT READ OUT: Other (SPECIFY) .......................................................................................................................... 07
DO NOT READ OUT: Can't say ......................................................................................................................................... 99
DO NOT READ OUT: Refused............................................................................................................................. 98 Q48 G10C
[DON’T READ] [MULTIPLE RESPONSE] As far as you are aware, what are the potential problems with having more than one superannuation fund? [MA] (IF RESPONDENT SAYS “FEES” PROBE FOR FEE TYPE)
Code Route
Multiple entry and set-up fees ............................................................................................................................................. 01
Multiple exit fees .................................................................................................................................................................... 02
Multiple administration or management fees................................................................................................................... 03
Lose track of them ................................................................................................................................................................. 04
None ......................................................................................................................................................................................... 05
Other [SPECIFY].................................................................................................................................................................... 06
Can't say .................................................................................................................................................................................. 99
Refused.................................................................................................................................................................. 98

ANZ Survey of Adult Financial Literacy in Australia (2008) 146
The Social Research Centre
Q49 G1
[SINGLE RESPONSE] Please tell me if you think the following statements about superannuation are true or false. Employers are required by law to make superannuation payments on behalf of their employees [SA]
Code Route
True ........................................................................................................................................................................................... 01
False ......................................................................................................................................................................................... 02
Can't say .................................................................................................................................................................................. 99
Refused.................................................................................................................................................................. 98 Q50 G2
[SINGLE RESPONSE] Employees cannot make superannuation payments additional to any payments made by their employer [SA]
Code Route
True ........................................................................................................................................................................................... 01
False ......................................................................................................................................................................................... 02
Can't say .................................................................................................................................................................................. 99
Refused.................................................................................................................................................................. 98 Q51 G6
[SINGLE RESPONSE] CODE FRAME TO BE REVERSED FOR 50% OF RESPONDENTS As far as you are aware, is superannuation taxed at a Lower, Higher or the Same rate than other investments? [SA]
Code Route
Lower rate ................................................................................................................................................................................ 01
Higher rate ............................................................................................................................................................................... 02
Same rate ................................................................................................................................................................................ 03
Can't say .................................................................................................................................................................................. 99
Refused.................................................................................................................................................................. 98 Q52 G7
[READ OUT] [SINGLE RESPONSE] CODE FRAME TO BE REVERSED FOR 50% OF RESPONDENTS Which ONE of the following statements best describes how you expect your superannuation to provide for you in retirement? [SA]
Code Route
More comfortably than I'm living now ................................................................................................................................ 01
About as comfortably as I'm living now............................................................................................................................. 02
Less comfortably than I'm living now, but getting by OK .............................................................................................. 03
Less comfortably than I'm living now, and not coping ................................................................................................... 04
[DON'T READ] Can't say ..................................................................................................................................................... 99
[DON’T READ] Refused........................................................................................................................................ 98

ANZ Survey of Adult Financial Literacy in Australia (2008) 147
The Social Research Centre
Q53 G8
[SINGLE RESPONSE] Have you identified a figure for how much per year you will need to live on when you retire? [SA]
Code Route
Yes ............................................................................................................................................................................................ 01
No .............................................................................................................................................................................................. 02
Can't say .................................................................................................................................................................................. 99
Refused.................................................................................................................................................................. 98 Q53B G8B1
[ASK IF YES (Q53/1), AT Q53] [SINGLE RESPONSE] Approximately how much per year do you think you will need? [SA]
Code Route
Less than $15,000 ................................................................................................................................................................ 01
$15,000 to $24,999................................................................................................................................................................ 02
$25,000 to $49,999................................................................................................................................................ 03
$50,000 to $74,999................................................................................................................................................ 04
$75,000 to $99,999................................................................................................................................................ 05
$100,000 or more .................................................................................................................................................. 06
Can't say .................................................................................................................................................................................. 99
Refused.................................................................................................................................................................. 98 Q54 G8B2
[DON’T READ] [MULTIPLE RESPONSE] Please tell me what factors someone would need to take into account if they were trying to calculate whether their current arrangements were enough for future retirement? What else? Anything else? [MA]
Code Route
Length of time before retirement ........................................................................................................................................ 01
Current savings ...................................................................................................................................................................... 02
Eligibility for the pension or government benefits........................................................................................................... 03
Expected earnings from investments ................................................................................................................................ 04
Expected superannuation benefits .................................................................................................................................... 05
Intention to still do some paid work while in retirement................................................................................................. 06
Desired standard of living in retirement ............................................................................................................................ 07
What costs might need to be met during retirement ...................................................................................................... 08
Expected life span ................................................................................................................................................................. 09
Value of assets upon retirement......................................................................................................................................... 10
Current cost of living ............................................................................................................................................................. 11
Whether own home or not.................................................................................................................................................... 12
Other [SPECIFY].................................................................................................................................................................... 13
Can't say .................................................................................................................................................................................. 99
Refused.................................................................................................................................................................. 98

ANZ Survey of Adult Financial Literacy in Australia (2008) 148
The Social Research Centre
Q55 G8C [DON'T READ] [MULTIPLE RESPONSE] Where would you go to get information on working out how much you need for your retirement? [MA]
Code Route
An Accountant ........................................................................................................................................................................ 01
A Taxation Specialist........................................................................................................................................................... 0 02
A Financial Counsellor.......................................................................................................................................................... 03
A Bank Manager or Bank Employee ................................................................................................................................. 04
A Financial Planner or Advisor ........................................................................................................................................... 05
General search on the internet ........................................................................................................................................... 06
A specific internet site (e.g. ASIC) ..................................................................................................................................... 07
Family or friends..................................................................................................................................................................... 08
Other (SPECIFY) ................................................................................................................................................... 09
Can’t say ................................................................................................................................................................ 99
Refused.................................................................................................................................................................. 98 Q56 G10D
[DON’T READ] [MULTIPLE RESPONSE] What advantages does superannuation have compared to other types of investment? [MA]
Code Route
Lower tax on contributions/favourable tax treatment of contributions ...................................................................... 01
No tax on payments if you’re 60 years or over .................................................................................................... 02
No tax if superannuation fund is paying a pension.............................................................................................. 03
Money is locked away so you can’t get at/spend it.............................................................................................. 04
Government co-contributes money 05
Other [SPECIFY].................................................................................................................................................................... 06
Can't say .................................................................................................................................................................................. 99
Refused.................................................................................................................................................................. 98 Q57 G11
[DON’T READ] [MULTIPLE RESPONSE] What things would you consider when choosing a superannuation fund? [MA]
Code Route
Fees/charges/costs ............................................................................................................................................................... 01
Long-term level of performance.......................................................................................................................................... 02
Recent level of performance ............................................................................................................................................... 03
Availability of expert advice ................................................................................................................................................. 04
Recommendation by people you trust .............................................................................................................................. 05
The number of fund options they offer/they offer high risk and low risk product options ...................................... 06
How risky the fund is ............................................................................................................................................................. 07
Comparison ratings by organisations like SuperRatings..................................................................................... 08
Other [SPECIFY} ................................................................................................................................................................... 09
Can't say .................................................................................................................................................................................. 99
Refused.................................................................................................................................................................. 98

ANZ Survey of Adult Financial Literacy in Australia (2008) 149
The Social Research Centre
Q58 D16
[READ OUT] [SINGLE RESPONSE] Which one of the following gives the best indication of how your superannuation fund or managed investment is performing? [SA]
Code Route
The Per-Unit cost ................................................................................................................................................................... 01
The Return............................................................................................................................................................................... 02
The Fees.................................................................................................................................................................................. 03
The amount of return left after the fees are taken out ................................................................................................... 04
[DON'T READ] Can't say ..................................................................................................................................................... 99
[DON'T READ] Refused ........................................................................................................................................ 98 Q59 G14
[DON’T READ] [MULTIPLE RESPONSE] As far as you are aware, what are the types of things that people commonly do that often result in the final value of superannuation or managed investment being reduced? What else? Anything else? [MA]
Code Route
Switching funds frequently ................................................................................................................................................... 01
Poor fund choices for their life circumstances................................................................................................................. 02
Choosing a fund with high fees and charges .................................................................................................................. 03
Relying on short term performance record ...................................................................................................................... 04
Not considering long term performance ........................................................................................................................... 05
Switching as soon as the performance drops ................................................................................................................. 06
Selecting a fund with a very high risk profile ................................................................................................................... 07
Not contributing sufficient funds ......................................................................................................................................... 08
Other [SPECIFY].................................................................................................................................................................... 09
Can't say .................................................................................................................................................................................. 99
Refused.................................................................................................................................................................. 98

ANZ Survey of Adult Financial Literacy in Australia (2008) 150
The Social Research Centre
SECTION E: RETIREMENT INCOME STREAM PRODUCTS Q60 B1C
[IF HAVE RETIREMENT INCOME STREAM PRODUCT (Q7/23), ASK] INTERVIEWER TO REFER TO 'TERM DEFINITIONS' CARD AS NECESSARY. [READ OUT] [MULTIPLE RESPONSE] ROTATE CODE FRAME You said earlier you have a retirement income product. Which of the following best matches the features of the Retirement Income Stream product you have? If you are not absolutely sure, please say. [SA]
Code Route
A set income that you receive for the rest of your life ................................................................................................... 01
A set income that you receive for a specified term (e.g. 10 years) ............................................................................ 02
A set income that you receive for a term that is based on your life expectancy ..................................................... 03
A set income that you receive for a term that is based on your life expectancy that is linked to the investment market, that is, can fluctuate with the investment market ....................................................................... 04
A regular income that you receive until the money runs out that can adjust from year to year and that is linked to the investment market (i.e. can fluctuate with the investment market)......................................... 05
Some other type (PLEASE SPECIFY).............................................................................................................................. 06
[DON'T READ] Can't say ..................................................................................................................................................... 99
[DON'T READ] Refused ........................................................................................................................................ 98 Q61 G13
[IF HAVE RETIREMENT INCOME STREAM PRODUCT (Q7/23), ASK] [DON’T READ] [MULTIPLE RESPONSE] When choosing a retirement income stream product, what criteria do you think are important? What else? Anything else? [MA]
Code Route
Level of income it provides .................................................................................................................................................. 01
How long income will last (e.g. for a set period, lifetime etc) ....................................................................................... 02
Fees .......................................................................................................................................................................................... 03
Rate of return .......................................................................................................................................................................... 04
Past performance of fund manager ................................................................................................................................... 05
Reputable brand of fund manager ..................................................................................................................................... 06
Expert advice .......................................................................................................................................................................... 07
Control/self-managed............................................................................................................................................................ 08
Tax effectiveness ................................................................................................................................................................... 09
Recommended by others ..................................................................................................................................................... 10
Flexibility .................................................................................................................................................................................. 11
Access ...................................................................................................................................................................................... 12
No choice, I am in a defined benefit scheme ....................................................................................................... 13
Other (SPECIFY) ................................................................................................................................................... 14
Can't say .................................................................................................................................................................................. 99
Refused.................................................................................................................................................................. 98

ANZ Survey of Adult Financial Literacy in Australia (2008) 151
The Social Research Centre
SECTION F: PERSONAL DEBT We are now going to ask a few questions about debt. Feel free to answer only those questions that you are comfortable with. Thinking about owing money, borrowing money, credit cards, leasing, hire purchase arrangements, mortgage payments or rent and household bills…. Q62 HX1
[READ OUT] [SINGLE RESPONSE] CODE FRAME TO BE REVERSED FOR 50% OF RESPONDENTS How comfortable are you with the total amount of money you now owe? Would you say you are... [SA]
Code Route
Very uncomfortable ............................................................................................................................................................... 01
Somewhat uncomfortable .................................................................................................................................................... 02
Neither comfortable nor uncomfortable ............................................................................................................................ 03
Fairly comfortable .................................................................................................................................................................. 04
Very comfortable .................................................................................................................................................................... 05
[DON'T READ] Can't say ..................................................................................................................................................... 98
[DON'T READ] Refused ....................................................................................................................................................... 99 Q63 HX2
[READ OUT] [SINGLE RESPONSE] CODE FRAME TO BE REVERSED FOR 50% OF RESPONDENTS Which one of the following statements BEST describes how you generally feel about your CURRENT financial situation? Would you say it feels?... [SA]
Code Route
Out of control ALL of the time ............................................................................................................................................. 01
Out of control MOST of the time......................................................................................................................................... 02
Fluctuates between being in and out of control .............................................................................................................. 03
In control MOST of the time................................................................................................................................................. 04
In control ALL of the time ..................................................................................................................................................... 05
[DON'T READ] Can't say ..................................................................................................................................................... 98
[DON'T READ] Refused ....................................................................................................................................................... 99 Q64 A2A
[READ OUT] [MULTIPLE RESPONSE] ROTATE CODE FRAME I am going to read out a list of places people go to borrow money to make a purchase or when they need some cash. This can include borrowing for a mortgage or car through to borrowing to help out with household bills. Which of the following, if any, have YOU PERSONALLY used to borrow money in the last 12 months for any purpose? [MA]
Code Route
Bank, building society or credit union................................................................................................................................ 01
Family or friends..................................................................................................................................................................... 02
Pay day lender........................................................................................................................................................................ 03
Pawnbroker or Cash Converters ........................................................................................................................................ 04
Finance company................................................................................................................................................................... 05
Retailer finance (e.g. Harvey Norman) ............................................................................................................................. 06
Debt Rescue or Debt Relief company............................................................................................................................... 07

ANZ Survey of Adult Financial Literacy in Australia (2008) 152
The Social Research Centre
Q64 A2A [READ OUT] [MULTIPLE RESPONSE] ROTATE CODE FRAME I am going to read out a list of places people go to borrow money to make a purchase or when they need some cash. This can include borrowing for a mortgage or car through to borrowing to help out with household bills. Which of the following, if any, have YOU PERSONALLY used to borrow money in the last 12 months for any purpose? [MA]
Code Route
Cash advance on your salary from your employer ........................................................................................................ 08
Store loan or interest free deal ........................................................................................................................................... 09
Other [SPECIFY].................................................................................................................................................................... 10
[DON'T READ] None............................................................................................................................................................. 11
[DON'T READ] Can't say ..................................................................................................................................................... 99
[DON'T READ] Refused ....................................................................................................................................................... 98 Q65 HY1
[Yes continues, if No, Can't recall or Refused skip to SECTION G] [SINGLE RESPONSE] At any time in the last 12 months have you NOT been able to make a repayment on any loans, mortgages, credit cards or any other types of repayments that you have? I’m NOT talking about utility bills, just loans, cards and other types of borrowings [SA]
Code Route
Yes ............................................................................................................................................................................................ 01
No .............................................................................................................................................................................................. 02
Can't say .................................................................................................................................................................................. 99
Refused.................................................................................................................................................................. 98 Q66 HY2
[DON’T READ] [MULTIPLE RESPONSE] Could you please tell me what repayment it was that you were unable to meet? Were there any others? [MA]
Code Route
Credit card ............................................................................................................................................................................... 01
Charge card............................................................................................................................................................................. 02
Store card ................................................................................................................................................................................ 03
Mortgage .................................................................................................................................................................................. 04
Personal loan .......................................................................................................................................................................... 05
Personal overdraft ................................................................................................................................................................. 06
Hire purchase.......................................................................................................................................................................... 07
Car lease.................................................................................................................................................................................. 08
Other [SPECIFY].................................................................................................................................................................... 09
Can't say .................................................................................................................................................................................. 99
Refused.................................................................................................................................................................. 98

ANZ Survey of Adult Financial Literacy in Australia (2008) 153
The Social Research Centre
Q67 HY3
[DON’T READ] [MULTIPLE RESPONSE] Would you mind telling me what were the main reasons you could not make this (these) payments? Any others? [MA]
Code Route
Borrowed too much money originally ................................................................................................................................ 01
Over spent on my credit card/charge/store card ............................................................................................................ 02
Interest rates went up ........................................................................................................................................................... 03
I did not budget correctly/I did not plan properly............................................................................................................. 04
I had a loss of income/lost my job ...................................................................................................................................... 05
Partner lost income/lost job ................................................................................................................................................. 06
I had an unexpected emergency expenditure ................................................................................................................. 07
An expense I had was a lot more than expected ........................................................................................................... 08
I had unexpected medical expenses/illness in the family ............................................................................................. 09
Relationship breakdown ....................................................................................................................................................... 10
Other [SPECIFY].................................................................................................................................................................... 11
[DON'T READ] Can't say ..................................................................................................................................................... 99
[DON'T READ] Refused ....................................................................................................................................................... 98 Q68 HY4
[ASK FOR EACH REPAYMENT TYPE MENTIONED IN Q66] [SINGLE RESPONSE] You mentioned that at some stage in the last 12 months you were NOT able to make a repayment on <INSERT FROM Q66>. Have you since been able to make the minimum repayment required? [SA]
Code Route
Yes ............................................................................................................................................................................................ 01
No .............................................................................................................................................................................................. 02
Can’t say .................................................................................................................................................................................. 99
Refused.................................................................................................................................................................. 98 Q69
[ASK FOR EACH REPAYMENT TYPE MENTIONED IN Q66 AND 'YES' AT Q68] [SINGLE RESPONSE] Approximately, how long after the payment was due were you able to again make the minimum repayment in relation to the <INSERT FROM Q66>? [SA]
Code Route
1 Month .................................................................................................................................................................................... 01
2 Months .................................................................................................................................................................................. 02
3 Months .................................................................................................................................................................................. 03
4-5 Months............................................................................................................................................................................... 04
6-9 Months............................................................................................................................................................................... 05
10-12 Months .......................................................................................................................................................................... 06
Can’t say ................................................................................................................................................................ 99
Refused.................................................................................................................................................................. 98

ANZ Survey of Adult Financial Literacy in Australia (2008) 154
The Social Research Centre
SECTION G. RISK AND RETURN (INCLUDING INSURANCE)
Q70 F1A
[IF RESPONDENT HAS INSURANCE (Q7/17-21,24-25) ASK] [DON’T READ] [MULTIPLE RESPONSE] Now thinking about insurance, what factors do you take into consideration when FIRST taking out or setting up an insurance policy other than life insurance? [MA]
Code Route
The premium ........................................................................................................................................................................... 01
The excess .............................................................................................................................................................................. 02
The level of cover - general ................................................................................................................................................. 03
The level of cover to make sure you are not underinsured .......................................................................................... 04
Brand or reputation of the supplier .................................................................................................................................... 05
Benefits included.................................................................................................................................................................... 06
I don't know enough about it so rely on the insurance agent to help me .................................................................. 07
Other [SPECIFY].................................................................................................................................................................... 08
None....................................................................................................................................................................... 09
Can't say .................................................................................................................................................................................. 99
Refused.................................................................................................................................................................. 98 Q71 F1
[IF RESPONDENT HAS INSURANCE (Q7/17-21, 24-25) ASK] [DON’T READ] [MULTIPLE RESPONSE] And what factors do you take into consideration when RENEWING an insurance policy other than life insurance? [MA]
Code Route
The premium.......................................................................................................................................................... 01
The excess............................................................................................................................................................. 02
The level of cover - general................................................................................................................................... 03
The level of cover to make sure you are not underinsured................................................................................. 04
Brand or reputation of the supplier ....................................................................................................................... 05
Benefits included ................................................................................................................................................... 06
The date payment of the policy renewal is needed ............................................................................................. 07
Good customer service ......................................................................................................................................... 08
Other [SPECIFY] ................................................................................................................................................... 09
None....................................................................................................................................................................... 10
Can’t say ................................................................................................................................................................ 99
Refused.................................................................................................................................................................. 98

ANZ Survey of Adult Financial Literacy in Australia (2008) 155
The Social Research Centre
Q72 F2A
[IF RESPONDENT HAS HOUSE, CONTENTS OR CAR INSURANCE (Q7/17-20) ASK] [SINGLE RESPONSE] As far as you are aware, can your insurance company refuse your claim because when you took out or renewed the policy you did not accurately answer some specific questions asked by the insurer that were relevant to the loss? [SA]
Code Route
Yes ............................................................................................................................................................................................ 01
No .............................................................................................................................................................................................. 02
Position varies from insurer to insurer .............................................................................................................................. 03
Can't say .................................................................................................................................................................................. 99
Refused.................................................................................................................................................................. 98 Q73 F3
[READ OUT] [SINGLE RESPONSE] Next a couple of questions about investing. I’m going to read you a statement. Please tell me whether you think the statement is true or false. An investment with a high return is likely to have higher than average risks. [SA]
Code Route
True ........................................................................................................................................................................................... 01
False ......................................................................................................................................................................................... 02
Can't say .................................................................................................................................................................................. 99
Refused.................................................................................................................................................................. 98 Q74 F4
[READ OUT] [SINGLE RESPONSE] CODE FRAME TO BE REVERSED FOR 50% OF RESPONDENTS Which ONE of the following is the most accurate statement about fluctuations in market values? [SA]
Code Route
Investments that fluctuate in value are not good in the long term .............................................................................. 01
Good investments are always increasing in value ......................................................................................................... 02
Short-term fluctuations in market value can be expected, even with good investments....................................... 03
[DON'T READ] Can't say ..................................................................................................................................................... 99
[DON'T READ] Refused ....................................................................................................................................................... 98 Q75 F5
[READ OUT] [SINGLE RESPONSE] CODE FRAME TO BE REVERSED FOR 50% OF RESPONDENTS Which ONE of the following would you recommend for an investment advertised as having a return well above market rates and no risk? [SA]
Code Route
Consider it "too good to be true" and not invest ............................................................................................................. 01
Invest lightly to see how it goes before investing more heavily .................................................................................. 02
Invest heavily to maximise your return.............................................................................................................................. 03
[DON'T READ] Can't say ..................................................................................................................................................... 99
[DON'T READ] Refused ....................................................................................................................................................... 98

ANZ Survey of Adult Financial Literacy in Australia (2008) 156
The Social Research Centre
Q76 F8
[ASK ALL] [READ OUT] [SINGLE RESPONSE] Thinking about investing over five years or more, how important do you consider diversification of your funds across different types of investments? Would you say it is..[SA]
Code Route
Very important ........................................................................................................................................................................ 01
Quite important ....................................................................................................................................................................... 02
Of some importance .............................................................................................................................................................. 03
Not at all important ................................................................................................................................................................ 04
[DON'T READ] Can’t say ..................................................................................................................................................... 99
[DON'T READ] Refused ....................................................................................................................................................... 98 Q77 F6
[IF HAS CREDIT CARD (Q5/4) ASK] [READ OUT] [SINGLE RESPONSE] CODE FRAME TO BE REVERSED FOR 50% OF RESPONDENTS If you, as primary holder of a credit card, arrange for a second person to be provided with a card in your name, which ONE of the following most accurately describes your responsibility for debt incurred by that person on the card? [SA]
Code Route
You are not responsible for any debt the other person incurs on the card - they are............................................ 01
You and the other person are each responsible for half the total debt on the card ............................................... 02
You are only responsible for debt incurred on the card by the other person if they are less than 18 years old................................................................................................................................................................................... 03
You are entirely responsible for any debt the other person incurs on the card ....................................................... 04
[DON'T READ] Can't say ..................................................................................................................................................... 99
[DON'T READ] Refused ....................................................................................................................................................... 98 Q78 F7
ONLY ASK IF HAS MORTGAGE OR LOAN (Q7/9,10,11,13,14,15) - NOT EQUITY RELEASE [READ OUT] [SINGLE RESPONSE] CODE FRAME TO BE REVERSED FOR 50% OF RESPONDENTS If two people jointly take out a loan, which ONE of the following most accurately describes the responsibility for repayment of the loan? [SA]
Code Route
Each person is responsible for repayment of half the loan .......................................................................................... 01
Both persons are responsible for repayment of the entire loan .................................................................................. 02
Only one person must be responsible for repayment of the entire loan ................................................................... 03
The older of the two persons is responsible for repayment of the entire loan ......................................................... 04
[DON'T READ] Can't say ..................................................................................................................................................... 99
[DON'T READ] Refused ....................................................................................................................................................... 98

ANZ Survey of Adult Financial Literacy in Australia (2008) 157
The Social Research Centre
SECTION H. SPENDING MONEY AND BUDGETING
Q79 E2 [READ OUT] [SINGLE RESPONSE] CODE FRAME TO BE REVERSED FOR 50% OF RESPONDENTS Which ONE of the following statements best applies to you? [SA]
Code Route
I try to save on a regular basis if I possibly can .............................................................................................................. 01
I save only when I want to save up for something big or special................................................................................ 02
There's no point in trying to save because there's never enough money................................................................. 03
Saving is not something I need to do ................................................................................................................................ 04
[DON'T READ] Can't say ..................................................................................................................................................... 99
[DON'T READ] Refused ........................................................................................................................................ 98 Q80 E4
[READ OUT] [SINGLE RESPONSE] CODE FRAME TO BE REVERSED FOR 50% OF RESPONDENTS Which ONE of the following best describes the extent to which you control your regular household expenses/ personal expenses? [SA]
Code Route
I don't keep an eye on expenses at all.............................................................................................................................. 01
I keep my eye on expenses a bit........................................................................................................................................ 02
Without keeping written records, I keep a fairly close eye on expenses .................................................................. 03
I use written records to keep a close eye on expenses ................................................................................................ 04
[DON'T READ] Can't say ..................................................................................................................................................... 99
[DON'T READ] Refused ........................................................................................................................................ 98

ANZ Survey of Adult Financial Literacy in Australia (2008) 158
The Social Research Centre
SECTION I. MAKING PERSONAL LIFE CHOICES Q81 – 100% of Respondents Q81 I1 -I6 [ASK ALL] [ASK I7 IF UNDER 65 YEARS]
ROTATE STATEMENTS CODE FRAME TO BE REVERSED FOR 50% OF RESPONDENTS INTRO I would now like to read out a number of statements relating to financial issues. Please tell me whether you Strongly Disagree, Disagree, Agree or Strongly Agree with each of these statements... [SINGLE RESPONSE]
Strongly
Disagree Disagree Agree Strongly
Agree Can't say
(R1) It is important to me to have a long-term financial plan................................................................................................. 01 02 03 04 99
(R2) It is important to me to have a financial plan for the short-term................................................................................................................................................................................. 01 02) 03 04 99
(R3) I spend all of my income as I get it and don't really plan for the future ................................................................................................................................................................... 01 02 03 04 99
(R4) I feel out of control with my borrowing and credit card generally................................................................................................................................................................................... 01 02 03 04 99
(R5) If I had a major loss of income I could manage for a period of time .......................................................................................................................................................................... 01 02 03 04 99
(R6) I have problems setting money aside for major financial outlays [IF NECESSARY, EXPLAIN: A major financial outlay might be something like paying vehicle insurance or taking a holiday] ............................................................................................................................... 01 02 03 04 99
(R7) I don't think it really matters much about superannuation or planning and saving for retirement because the government will make up the gap............................................................................................................... 01 02 03 04 99
Q82 I9
[READ OUT] [SINGLE RESPONSE] ROTATE CODE FRAME
Thinking about debts and borrowing money, which ONE of the following is most likely to give someone a bad credit rating? [SA]
Code Route
Asking the bank for an increased overdraft ..................................................................................................................... 01
Borrowing from an organisation other than a bank ........................................................................................................ 02
Taking out a second mortgage to buy your own home ................................................................................................. 03
Being more than 60 days late with the minimum payment on a credit card............................................................. 04
[DON'T READ] Can't say ..................................................................................................................................................... 99
[DON'T READ] Refused ........................................................................................................................................ 98 Q83 I9A
[DON’T READ] [MULTIPLE RESPONSE] As far as you are aware, what sort of information is collected to determine your credit rating? What else? Anything else? [MA]
Code Route
Repayment defaults .............................................................................................................................................................. 01
Late payments - 2 months (60 days) or more ................................................................................................................. 02
Late payments - less than 2 months (60 days) ............................................................................................................... 03
Late payments - any time period ........................................................................................................................................ 04
Loan or credit refusals .......................................................................................................................................................... 05

ANZ Survey of Adult Financial Literacy in Australia (2008) 159
The Social Research Centre
Q83 I9A [DON’T READ] [MULTIPLE RESPONSE] As far as you are aware, what sort of information is collected to determine your credit rating? What else? Anything else? [MA]
Code Route
Any loan or credit applications made.................................................................................................................... 06
Other [SPECIFY].................................................................................................................................................................... 07
Can't say .................................................................................................................................................................................. 99
Refused.................................................................................................................................................................. 98 Q84 I11
[DON’T READ] [MULTIPLE RESPONSE] If a sudden loss of income caused difficulty in meeting your financial commitments, who would you go to? Who else? Anyone else? [MA]
Code Route
Family ....................................................................................................................................................................................... 01
Friend........................................................................................................................................................................................ 02
Financial planner/advisor ..................................................................................................................................................... 03
Financial counsellor............................................................................................................................................................... 04
Accountant............................................................................................................................................................................... 05
Solicitor..................................................................................................................................................................................... 06
Bank/financial institution....................................................................................................................................................... 07
Pawn broker/Cash converters............................................................................................................................................. 08
Pay day lender........................................................................................................................................................................ 09
Government agency e.g. centrelink ................................................................................................................................... 10
Charity organisation e.g. Salvation Army. St Vincent de Paul..................................................................................... 11
Other [SPECIFY].................................................................................................................................................................... 12
Can't say .................................................................................................................................................................................. 99
Refused.................................................................................................................................................................. 98

ANZ Survey of Adult Financial Literacy in Australia (2008) 160
The Social Research Centre
SECTION J. CONSUMER RIGHTS AND RESPONSIBILITIES Q85 J1
[READ OUT] [SINGLE RESPONSE] ROTATE CODE FRAME
A person keeps their PIN number on a piece of paper in their wallet, along with their ATM or bank card. If the wallet is stolen and the card and PIN number are used to take money from an account, who is liable for the lost money? [SA]
Code Route
The Bank Only ........................................................................................................................................................................ 01
Both the bank and the card-holder, in equal part ........................................................................................................... 02
The card-holder only ............................................................................................................................................................. 03
[DON'T READ] Can't say ..................................................................................................................................................... 99
[DON'T READ] Refused ........................................................................................................................................ 98 Q86 J2-3 / J6-7
ROTATE STATEMENTS CODE FRAME TO BE REVERSED FOR 50% OF RESPONDENTS I will now read out a number of statements relating to consumer rights and responsibilities and would like you to tell me whether you Strongly Disagree, Disagree, Agree or Strongly Agree with each of these statements... [SINGLE RESPONSE]]
Strongly
Disagree Disagree Agree Strongly
Agree Can't say
(R1) You generally feel well informed when making financial decisions .................................................................................................................................................................. 01 02 03 04 99
(R2) Providers of financial products and services have a legal duty to provide clear information to consumers .................................................................................................... 01 02 03 04 99
(R3) You are very clear about your rights if you have a problem with a financial institution ..................................................................................................................................... 01 02 03 04 99
(R4) Consumers have a duty of honest disclosure when taking out a financial service or product and may face penalties for not doing so ..................................................................................................................................................... 01 02 03 04 99
Q87 J16-J17
And now please tell me whether, as far as you know, each of the following statements is true or false... [SINGLE RESPONSE]
True False Can't say
(R1) The Australian Securities and Investment Commission checks the accuracy of all prospectuses lodged with it...................................................................................................................... 01 02 99
(R2) If providers of professional advice about financial products may receive commissions as a result of their advice, they are required by law to tell this to their clients .......................................................................................................................................................................... 01 02 99
Q88 J14A
[SINGLE RESPONSE] As far as you are aware, is there a cooling off period after taking out a new house and contents insurance policy during which time you can cancel the policy and have your premium fully refunded? [SA]
Code Route
Yes ............................................................................................................................................................................................ 01
No .............................................................................................................................................................................................. 02
Can't say .................................................................................................................................................................................. 99
Refused.................................................................................................................................................................. 98
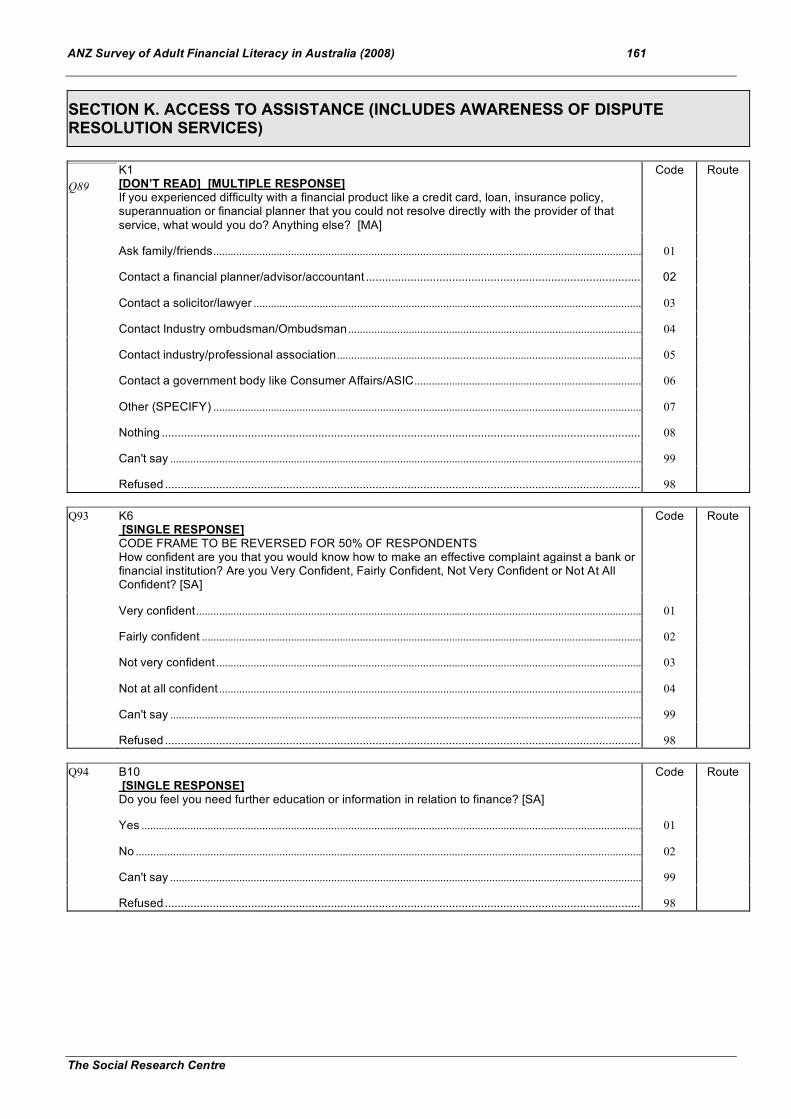
ANZ Survey of Adult Financial Literacy in Australia (2008) 161
The Social Research Centre
SECTION K. ACCESS TO ASSISTANCE (INCLUDES AWARENESS OF DISPUTE RESOLUTION SERVICES)
Q89 K1 [DON’T READ] [MULTIPLE RESPONSE] If you experienced difficulty with a financial product like a credit card, loan, insurance policy, superannuation or financial planner that you could not resolve directly with the provider of that service, what would you do? Anything else? [MA]
Code Route
Ask family/friends................................................................................................................................................................... 01
Contact a financial planner/advisor/accountant ................................................................................................... 02
Contact a solicitor/lawyer ..................................................................................................................................................... 03
Contact Industry ombudsman/Ombudsman .................................................................................................................... 04
Contact industry/professional association........................................................................................................................ 05
Contact a government body like Consumer Affairs/ASIC............................................................................................. 06
Other (SPECIFY) ................................................................................................................................................................... 07
Nothing ................................................................................................................................................................... 08
Can't say .................................................................................................................................................................................. 99
Refused.................................................................................................................................................................. 98 Q93 K6
[SINGLE RESPONSE] CODE FRAME TO BE REVERSED FOR 50% OF RESPONDENTS How confident are you that you would know how to make an effective complaint against a bank or financial institution? Are you Very Confident, Fairly Confident, Not Very Confident or Not At All Confident? [SA]
Code Route
Very confident......................................................................................................................................................................... 01
Fairly confident ....................................................................................................................................................................... 02
Not very confident .................................................................................................................................................................. 03
Not at all confident ................................................................................................................................................................. 04
Can't say .................................................................................................................................................................................. 99
Refused.................................................................................................................................................................. 98 Q94 B10
[SINGLE RESPONSE] Do you feel you need further education or information in relation to finance? [SA]
Code Route
Yes ............................................................................................................................................................................................ 01
No .............................................................................................................................................................................................. 02
Can't say .................................................................................................................................................................................. 99
Refused.................................................................................................................................................................. 98
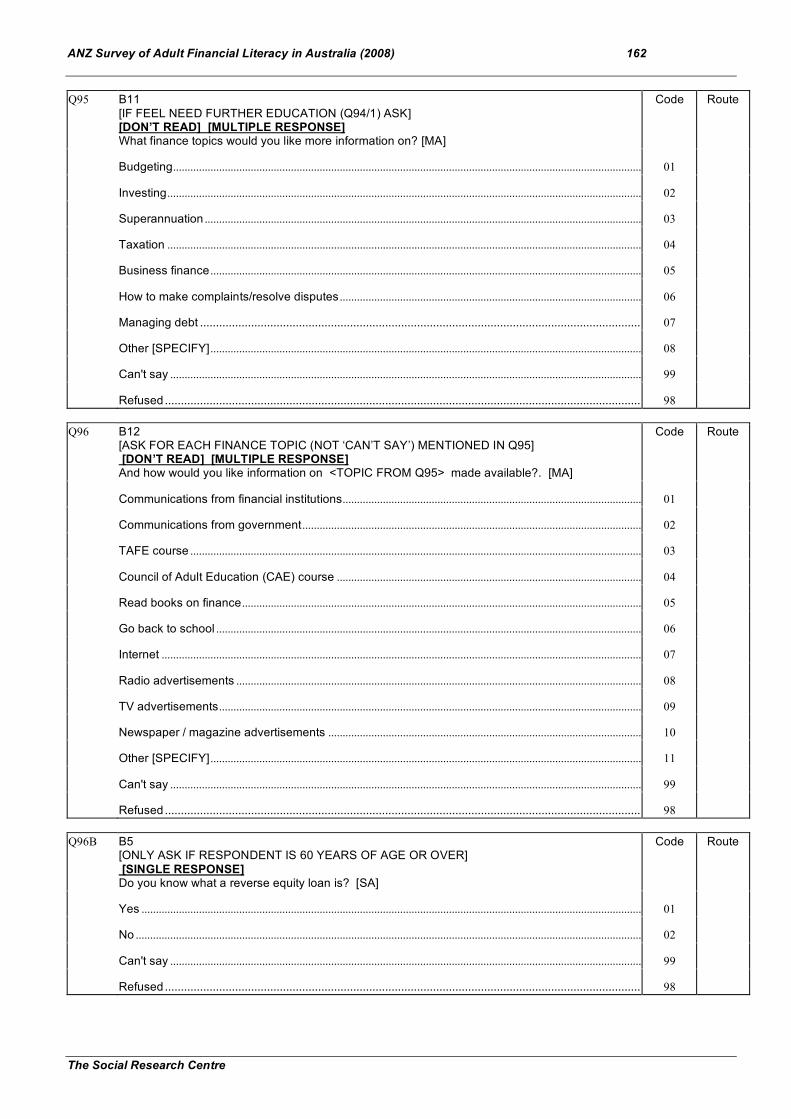
ANZ Survey of Adult Financial Literacy in Australia (2008) 162
The Social Research Centre
Q95 B11
[IF FEEL NEED FURTHER EDUCATION (Q94/1) ASK] [DON’T READ] [MULTIPLE RESPONSE] What finance topics would you like more information on? [MA]
Code Route
Budgeting................................................................................................................................................................................. 01
Investing................................................................................................................................................................................... 02
Superannuation ...................................................................................................................................................................... 03
Taxation ................................................................................................................................................................................... 04
Business finance .................................................................................................................................................................... 05
How to make complaints/resolve disputes ....................................................................................................................... 06
Managing debt ....................................................................................................................................................... 07
Other [SPECIFY].................................................................................................................................................................... 08
Can't say .................................................................................................................................................................................. 99
Refused.................................................................................................................................................................. 98 Q96 B12
[ASK FOR EACH FINANCE TOPIC (NOT ‘CAN’T SAY’) MENTIONED IN Q95] [DON’T READ] [MULTIPLE RESPONSE] And how would you like information on <TOPIC FROM Q95> made available?. [MA]
Code Route
Communications from financial institutions...................................................................................................................... 01
Communications from government.................................................................................................................................... 02
TAFE course ........................................................................................................................................................................... 03
Council of Adult Education (CAE) course ........................................................................................................................ 04
Read books on finance......................................................................................................................................................... 05
Go back to school .................................................................................................................................................................. 06
Internet ..................................................................................................................................................................................... 07
Radio advertisements ........................................................................................................................................................... 08
TV advertisements................................................................................................................................................................. 09
Newspaper / magazine advertisements ........................................................................................................................... 10
Other [SPECIFY].................................................................................................................................................................... 11
Can't say .................................................................................................................................................................................. 99
Refused.................................................................................................................................................................. 98 Q96B B5
[ONLY ASK IF RESPONDENT IS 60 YEARS OF AGE OR OVER] [SINGLE RESPONSE] Do you know what a reverse equity loan is? [SA]
Code Route
Yes ............................................................................................................................................................................................ 01
No .............................................................................................................................................................................................. 02
Can't say .................................................................................................................................................................................. 99
Refused.................................................................................................................................................................. 98

ANZ Survey of Adult Financial Literacy in Australia (2008) 163
The Social Research Centre
Q96C
[IF YES (Q96B/1) ASK] [DO NOT READ OUT] [MULTIPLE RESPONSE] What things would you consider when deciding whether or not to take out a reverse equity loan? [MA]
Code Route
How long I expect to live ...................................................................................................................................................... 01
My ongoing expenses........................................................................................................................................................... 02
Whether I might need money to move into a retirement village.......................................................................... 03
Whether I should take a lump sum or an income stream ............................................................................................. 04
The conditions of the loan.................................................................................................................................................... 05
How my children feel about it .............................................................................................................................................. 06
The interest rate ..................................................................................................................................................................... 07
How much I would need/Size of the loan ............................................................................................................. 08
Anything else [SPECIFY] ..................................................................................................................................................... 09
[DON'T READ OUT] Can't say ........................................................................................................................................... 99
[DON'T READ OUT] Refused ............................................................................................................................................. 98

ANZ Survey of Adult Financial Literacy in Australia (2008) 164
The Social Research Centre
SECTION L. INTERNET AND ONLINE BANKING Q97 – 100% of Respondents Q97 B5A
[DO NOT READ OUT] [MULTIPLE RESPONSE] And now some questions about internet banking and online calculators. Where do you usually access the internet from? [MA]
Code Route
Home ....................................................................................................................................................................................... 01
Work.......................................................................................................................................................................................... 02
University/TAFE/School ........................................................................................................................................ 03
Library .................................................................................................................................................................... 04
Neighbour/friend/relative’s home .......................................................................................................................... 05
Somewhere else .................................................................................................................................................... 06
Don’t use the internet ............................................................................................................................................ 07
Can't say ................................................................................................................................................................ 99
Refused.................................................................................................................................................................. 98 Q98 B5
ASK IF NOT CODE 7 AT B5A [SINGLE RESPONSE] Have you ever visited an Internet site with calculators for comparing financial products? [SA]
Code Route
Yes ............................................................................................................................................................................................ 01
No .............................................................................................................................................................................................. 02
Can't say .................................................................................................................................................................................. 99
Refused.................................................................................................................................................................. 98 Q99
[IF YES (Q98/1) ASK] [READ OUT] [MULTIPLE RESPONSE] ROTATE CODE FRAME And have you ever used the calculators to do any of the following? [MA]
Code Route
Compare interest rates ......................................................................................................................................................... 01
Compare fees and charges ................................................................................................................................................. 02
Calculate how much you can borrow ................................................................................................................................ 03
Calculate repayments on loans .......................................................................................................................................... 04
Help you in budgeting ........................................................................................................................................................... 05
Help you compare superannuation options ..................................................................................................................... 06
Help you compare other financial products ..................................................................................................................... 07
How much you need in retirement........................................................................................................................ 08
Anything else [SPECIFY] ..................................................................................................................................................... 09
[DON'T READ OUT] Can't say ........................................................................................................................................... 99
[DON'T READ OUT] Refused ............................................................................................................................................. 98

ANZ Survey of Adult Financial Literacy in Australia (2008) 165
The Social Research Centre
Q100 ASK IF NOT CODE 7 AT B5A [SINGLE RESPONSE] Have you ever applied for or obtained a financial product over the internet? [SA]
Yes ............................................................................................................................................................................................. 01
No............................................................................................................................................................................................... 02
Can't say ................................................................................................................................................................................... 99
Refused.................................................................................................................................................................. 98
Q101 [IF YES (Q100/1) ASK]
[DO NOT READ OUT] [MULTIPLE RESPONSE] And which products did you apply for or obtain online? [MA]
Code Route
Everyday bank account ........................................................................................................................................................ 01
Mortgage .................................................................................................................................................................................. 02
Personal loan .......................................................................................................................................................................... 03
Superannuation ...................................................................................................................................................................... 04
Insurance ................................................................................................................................................................................. 05
Term deposit ........................................................................................................................................................................... 06
High interest savings account ............................................................................................................................................. 07
Anything else [SPECIFY] ..................................................................................................................................................... 08
[DON'T READ OUT] Can't say ........................................................................................................................................... 99
[DON'T READ OUT] Refused ............................................................................................................................................. 98 Q102 A3
[IF USE OR KNOW HOW TO USE INTERNET BANKING (Q5/11 or Q6/11) ASK] [SINGLE RESPONSE] Do you think there are risks associated with internet banking? [SA]
Code Route
Yes ............................................................................................................................................................................................ 01
No .............................................................................................................................................................................................. 02
Can't say .................................................................................................................................................................................. 99
Refused.................................................................................................................................................................. 98 Q103 [IF YES (Q102/1), ASK]
[DON’T READ OUT] [MULTIPLE RESPONSE] What are some of those risks? What others? Any others? [MA]
Code Route
Email scams ............................................................................................................................................................................ 01
Key logging - hackers ........................................................................................................................................................... 02
Credit card fraud .................................................................................................................................................................... 03
Unsecured sites...................................................................................................................................................................... 04
Money laundering .................................................................................................................................................................. 05
Phishing ................................................................................................................................................................................... 06
Identity theft............................................................................................................................................................ 07
Other [SPECIFY].................................................................................................................................................................... 08
Can't say .................................................................................................................................................................................. 99
Refused.................................................................................................................................................................. 98
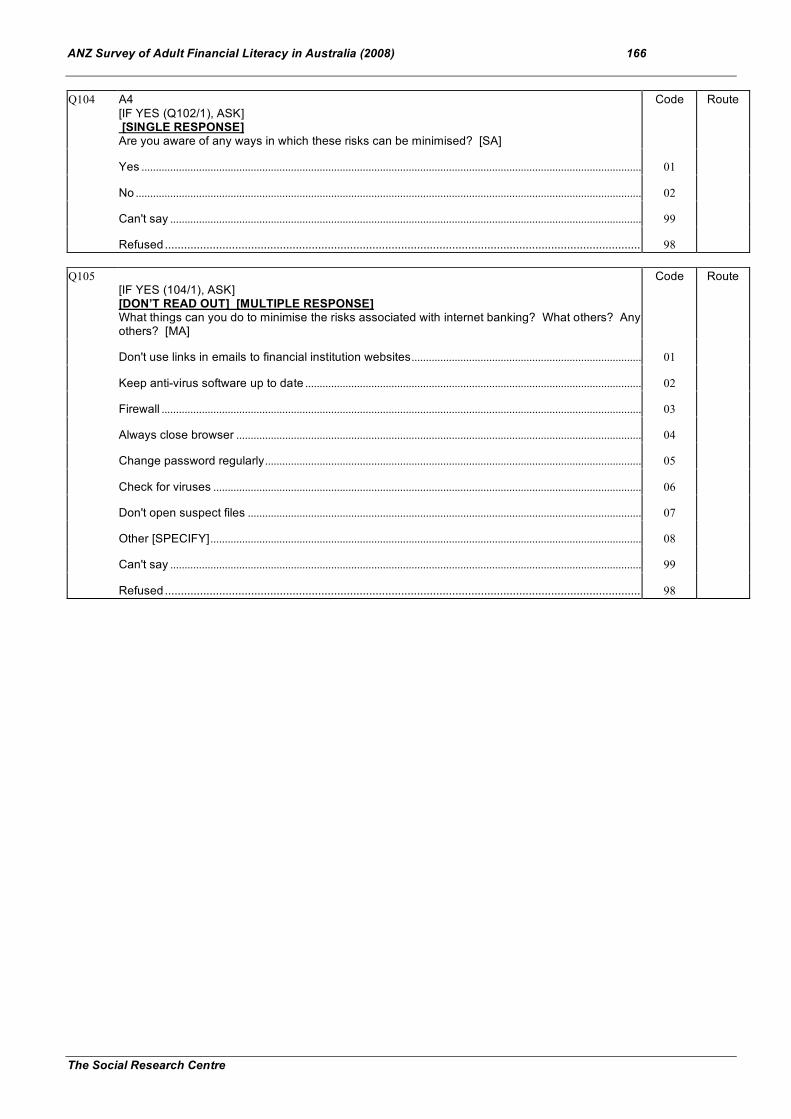
ANZ Survey of Adult Financial Literacy in Australia (2008) 166
The Social Research Centre
Q104 A4
[IF YES (Q102/1), ASK] [SINGLE RESPONSE] Are you aware of any ways in which these risks can be minimised? [SA]
Code Route
Yes ............................................................................................................................................................................................ 01
No .............................................................................................................................................................................................. 02
Can't say .................................................................................................................................................................................. 99
Refused.................................................................................................................................................................. 98 Q105
[IF YES (104/1), ASK] [DON’T READ OUT] [MULTIPLE RESPONSE] What things can you do to minimise the risks associated with internet banking? What others? Any others? [MA]
Code Route
Don't use links in emails to financial institution websites.............................................................................................. 01
Keep anti-virus software up to date ................................................................................................................................... 02
Firewall ..................................................................................................................................................................................... 03
Always close browser ........................................................................................................................................................... 04
Change password regularly................................................................................................................................................. 05
Check for viruses ................................................................................................................................................................... 06
Don't open suspect files ....................................................................................................................................................... 07
Other [SPECIFY].................................................................................................................................................................... 08
Can't say .................................................................................................................................................................................. 99
Refused.................................................................................................................................................................. 98

ANZ Survey of Adult Financial Literacy in Australia (2008) 167
The Social Research Centre
SECTION M. ARITHMETIC/ MATHEMATIC LITERACY (100% OF RESPONDENTS) Q106-Q111 – 100% of Respondents Q106 L19
[SINGLE RESPONSE] Now finally, I’d just like to finish with a few questions that are like a quick quiz. We appreciate that this may be difficult to do over the phone. Please just say if you don’t know the answer to a question. If a person spent $13 on lunch one day but only $8 the next day, how much did they spend on lunch over the two days? [SA]
Code Route
$21 ............................................................................................................................................................................................ 01
Other [SPECIFY].................................................................................................................................................................... 02
Can't say .................................................................................................................................................................................. 99
Refused.................................................................................................................................................................. 98 Q107 L20
[SINGLE RESPONSE] If a person pays for goods valued at $165 with four $50 notes, how much change would they receive? [SA]
Code Route
$35 ............................................................................................................................................................................................ 01
Other [SPECIFY].................................................................................................................................................................... 02
Can't say .................................................................................................................................................................................. 99
Refused.................................................................................................................................................................. 98 Q108 L21
[SINGLE RESPONSE] If 20 lotto players each won a prize of $350, what is the total amount paid out in prize money to them? [SA]
Code Route
$7,000....................................................................................................................................................................................... 01
Other (SPECIFY) ................................................................................................................................................................... 98
Can't say .................................................................................................................................................................................. 99
Refused.................................................................................................................................................................. 98 Q109 L22
[SINGLE RESPONSE] If a lottery win of $18,000 is shared equally between six people, how much will each person receive? [SA]
Code Route
$3,000....................................................................................................................................................................................... 01
Other [SPECIFY].................................................................................................................................................................... 02
Can't say .................................................................................................................................................................................. 99
Refused.................................................................................................................................................................. 98

ANZ Survey of Adult Financial Literacy in Australia (2008) 168
The Social Research Centre
Q110 L23
[SINGLE RESPONSE] If a person takes home $1,400 a month and 50% of this goes on rent, what is their monthly rent? [SA]
Code Route
$700 .......................................................................................................................................................................................... 01
Other [SPECIFY].................................................................................................................................................................... 02
Can't say .................................................................................................................................................................................. 99
Refused.................................................................................................................................................................. 98 Q111 L24
[SINGLE RESPONSE] If a refrigerator priced at $1,000 is discounted by 10% at a sale, how much would it cost? [SA]
Code Route
$900 .......................................................................................................................................................................................... 01
Other [SPECIFY].................................................................................................................................................................... 02
Can't say .................................................................................................................................................................................. 99
Refused.................................................................................................................................................................. 98

ANZ Survey of Adult Financial Literacy in Australia (2008) 169
The Social Research Centre
SECTION N: DEMOGRAPHICS (100% OF RESPONDENTS)
Q112 DEM9 [ASK ALL] [SINGLE RESPONSE] I would now like to ask a few questions to ensure we reach a cross-section of the population. As with all the survey, individual respondent information remains confidential. What is the highest level of education you have completed? [SA]
Code Route
Primary school or below ....................................................................................................................................................... 01
Secondary - Year 10/4th form or below ............................................................................................................................. 02
Secondary - Year 11/5th form............................................................................................................................... 03
Secondary - Year 12/6th form .............................................................................................................................................. 04
Trade/apprenticeship qualification ..................................................................................................................................... 05
Other TAFE/Technical certificate or diploma ....................................................................................................... 06
Undergraduate certificate or diploma ................................................................................................................................ 07
Degree/Masters Degree/Doctorate ................................................................................................................................... 08
Other (SPECIFY) ................................................................................................................................................................... 09
Refused.................................................................................................................................................................. 98 Q113 DEM3
READ OUT, SINGLE RESPONSE Which of the following best describes your household situation? [SA]
Code Route
Single - Live Alone................................................................................................................................................................. 01
Single - Live in Shared Household .................................................................................................................................... 02
Single Parent .......................................................................................................................................................................... 03
Couple - Children At Home.................................................................................................................................................. 04
Couple - No Children At Home ........................................................................................................................................... 05
[DON'T READ] Other (SPECIFY) ...................................................................................................................................... 06
[DON'T READ] Can't say ..................................................................................................................................................... 99
[DON'T READ] Refused ........................................................................................................................................ 98

ANZ Survey of Adult Financial Literacy in Australia (2008) 170
The Social Research Centre
Q114 [IF CHILDREN AT HOME (Q113/2-4) ASK
[SINGLE RESPONSE] How many children aged under 16 live in your household? [SA]
Code Route
1 ................................................................................................................................................................................................. 01
2 ................................................................................................................................................................................................. 02
3 ................................................................................................................................................................................................. 03
4 ................................................................................................................................................................................................. 04
5 ................................................................................................................................................................................................. 05
6 ................................................................................................................................................................................................. 06
7 ................................................................................................................................................................................................. 07
8+............................................................................................................................................................................................... 08
NONE ....................................................................................................................................................................................... 09
Refused.................................................................................................................................................................. 98 Q114B [IF CHILDREN AT HOME (Q113/2-4) ASK
[SINGLE RESPONSE] And how many dependent children aged 16 or over? [SA]
Code Route
1 ................................................................................................................................................................................................. 01
2 ................................................................................................................................................................................................. 02
3 ................................................................................................................................................................................................. 03
4 ................................................................................................................................................................................................. 04
5 ................................................................................................................................................................................................. 05
6 ................................................................................................................................................................................................. 06
7 ................................................................................................................................................................................................. 07
8+............................................................................................................................................................................................... 08
NONE ....................................................................................................................................................................................... 09
Refused.................................................................................................................................................................. 98 Q115 C1
[IF IN PAID EMPLOYMENT (Q4/1-5), ASK] [SINGLE RESPONSE] What is your main source of income? [SA]
Code Route
Wages or salary ..................................................................................................................................................... 01
Self employed earnings or proceeds from a business .................................................................................................. 02
Government benefit or allowance (including Parenting Payment, Age Pension) .............................................. 03
Superannuation/Self-funded retirement income .................................................................................................. 04
Other (specify) ....................................................................................................................................................... 05
Can’t say ................................................................................................................................................................ 99
Refused .................................................................................................................................................................................... 98

ANZ Survey of Adult Financial Literacy in Australia (2008) 171
The Social Research Centre
Q117 DEM6
[SINGLE RESPONSE] What is your/ was your last/ main occupation - the position and industry? [SA]
Code Route
Managers
Professionals .......................................................................................................................................................................... 01
Technicians and trades workers......................................................................................................................................... 02
Community and personal service workers ....................................................................................................................... 03
Clerical and administrative workers ................................................................................................................................... 04
Sales workers ......................................................................................................................................................................... 05
Machinery operators and drivers........................................................................................................................................ 06
Labourers................................................................................................................................................................................. 07
Other (Specify) ....................................................................................................................................................................... 08
No occupation......................................................................................................................................................................... 09
Refused.................................................................................................................................................................. 98 Q118 DEM7
[RECORD WHETHER RESPONDENT IS/ WAS WORKING IN FINANCE, SUCH AS WORKING IN A BANK, BEING AN ACCOUNTANT, FINANCIAL PLANNER/ ADVISOR, WORKING IN SUPERANNUATION, ETC.] [IF NOT SPECIFIED TYPE OF OCCUPATION ASK] [SINGLE RESPONSE] Are you / Were you working in finance, such as working in a bank, being an accountant, financial planner/advisor or working in superannuation, etc.? [SA]
Code Route
Working in finance ................................................................................................................................................................. 01
Not working in finance .......................................................................................................................................................... 02
Can't say .................................................................................................................................................................................. 99
Refused.................................................................................................................................................................. 98 Q119 DEM8
[IF RESPONDENT HAS OCCUPATION (Q117/1-8) AND “NOT WORKING” AT DEM4, ASK] [SINGLE RESPONSE] Are you / Were you self-employed in this occupation? [SA]
Code Route
Yes ............................................................................................................................................................................................ 01
No .............................................................................................................................................................................................. 02
Can’t say .................................................................................................................................................................................. 99
Refused.................................................................................................................................................................. 98

ANZ Survey of Adult Financial Literacy in Australia (2008) 172
The Social Research Centre
Q120 DEM11
[SINGLE RESPONSE] Do you or your family own your residence outright, or are you paying it off, or are you renting it? [SA]
Code Route
Own outright............................................................................................................................................................................ 01
Paying off ................................................................................................................................................................................. 02
Renting ..................................................................................................................................................................................... 03
Other [SPECIFY].................................................................................................................................................................... 04
Can't say .................................................................................................................................................................................. 99
Refused.................................................................................................................................................................. 98 Q121 DEM12
[IF RESPONDENT OWNS OR IS PAYING OFF RESIDENCE (Q120/1-2), ASK] [SINGLE RESPONSE] What is the approximate current value of your home? [SA]
Code Route
Under $100,000...................................................................................................................................................................... 01
$100,00-$124,999.................................................................................................................................................................. 02
$125,000-$149,999 ............................................................................................................................................................... 03
$150,000-$174,999 ............................................................................................................................................................... 04
$175,000-$199,999 ............................................................................................................................................................... 05
$200,000-$224,999 ............................................................................................................................................................... 06
$225,000-$249,999 ............................................................................................................................................................... 07
$250,000-$274,999 ............................................................................................................................................................... 08
$275,000-$299,999 ............................................................................................................................................................... 09
$300,000-$324,999 ............................................................................................................................................................... 10
$325,000-$349,999 ............................................................................................................................................................... 11
$350,000-$374,999 ............................................................................................................................................................... 12
$375,000-$399,999 ............................................................................................................................................................... 13
$400,000-$424,999 ............................................................................................................................................................... 14
$425,000-$449,999 ............................................................................................................................................................... 15
$450,000-$474,999 ............................................................................................................................................................... 16
$475,000-$499,999 ............................................................................................................................................................... 17
$500,000-$549,999 ............................................................................................................................................................... 18
$550,000-$599,999 ............................................................................................................................................................... 19
$600,000-$649,999 ............................................................................................................................................................... 20
$650,000-$699,999 ............................................................................................................................................................... 21
$700,000-$749,999 ............................................................................................................................................................... 22
$750,000-$799,999 ............................................................................................................................................................... 23
$800,000-$849,999 ............................................................................................................................................................... 24
$850,000-$899,999 ............................................................................................................................................................... 25
$900,000-$949,999 ............................................................................................................................................................... 26

ANZ Survey of Adult Financial Literacy in Australia (2008) 173
The Social Research Centre
Q121 DEM12 [IF RESPONDENT OWNS OR IS PAYING OFF RESIDENCE (Q120/1-2), ASK] [SINGLE RESPONSE] What is the approximate current value of your home? [SA]
Code Route
$950,000-$999,999 ............................................................................................................................................................... 27
$1 million or more .................................................................................................................................................................. 28
Other (SPECIFY) ................................................................................................................................................................... 98
Can't say .................................................................................................................................................................................. 99
Refused.................................................................................................................................................................. 98 Q123 DEM14
[SINGLE RESPONSE] Do you speak a language other than English at home? [IF YES, ASK] What is that language? [SA]
Code Route
No - English only .................................................................................................................................................................... 01
Yes, Arabic (including Lebanese) ...................................................................................................................................... 02
Yes, Cantonese...................................................................................................................................................................... 03
Yes, German ........................................................................................................................................................................... 04
Yes, Greek............................................................................................................................................................................... 05
Yes, Italian ............................................................................................................................................................................... 06
Yes, Mandarin......................................................................................................................................................................... 07
Yes, Serbian/Croatian........................................................................................................................................................... 08
Yes, Spanish ........................................................................................................................................................................... 09
Yes, Vietnamese .................................................................................................................................................................... 10
Yes, other Asian language................................................................................................................................................... 11
Yes, other European language ........................................................................................................................................... 12
Yes, Aboriginal/indigenous Australian .............................................................................................................................. 13
Yes, Pidgin .............................................................................................................................................................................. 14
Yes, Samoan .......................................................................................................................................................................... 15
Yes, other Polynesian/Pacific island ................................................................................................................................. 16
Yes, other Middle Eastern.................................................................................................................................................... 17
Yes, African ............................................................................................................................................................................. 18
Yes, other [SPECIFY] ........................................................................................................................................................... 98
Can’t say ................................................................................................................................................................................. 99
Refused.................................................................................................................................................................. 98 Q124 DEM14A
[SINGLE RESPONSE] Are you of Aboriginal or Torres Straight Islander descent? [SA]
Code Route
Yes ............................................................................................................................................................................................ 01
No .............................................................................................................................................................................................. 02
Can't say .................................................................................................................................................................................. 99
Refused.................................................................................................................................................................. 98

ANZ Survey of Adult Financial Literacy in Australia (2008) 174
The Social Research Centre
Q125 DEM14B
[SINGLE RESPONSE] Do you personally own or are you paying off a motor vehicle? [SA]
Code Route
Yes - own or paying off ......................................................................................................................................................... 01
No .............................................................................................................................................................................................. 02
Can’t say .................................................................................................................................................................................. 99
Refused.................................................................................................................................................................. 98 Q126 DEM15
[READ OUT AND PROBE TO CODE] [SINGLE RESPONSE] Would you mind telling me your approximate annual income from all sources before tax?[SA] PROBE IF CAN'T SAY : Well, what's your best guess?
Code Route
Less than $5,999 ................................................................................................................................................................... 01
$6,000-$9,999......................................................................................................................................................................... 02
$10,000-$14,999 .................................................................................................................................................................... 03
$15,000-$19,999 .................................................................................................................................................................... 04
$20,000-$24,999 .................................................................................................................................................................... 05
$25,000-$29,999 .................................................................................................................................................................... 06
$30,000-$34,999 .................................................................................................................................................................... 07
$35,000-$39,999 .................................................................................................................................................................... 08
$40,000-$44,999 .................................................................................................................................................................... 09
$45,000-$49,999 .................................................................................................................................................................... 10
$50,000-$59,999 .................................................................................................................................................................... 11
$60,000-$69,999 .................................................................................................................................................................... 12
$70,000-$79,999 .................................................................................................................................................................... 13
$80,000-$89,999 .................................................................................................................................................................... 14
$90,000-$99,999 .................................................................................................................................................................... 15
$100,000 to $119,999 ........................................................................................................................................... 16
$120,000 to $139,999 ........................................................................................................................................... 17
$140,000 to $149,999 ........................................................................................................................................... 18
$150,000 or more................................................................................................................................................................... 19
Can't say .................................................................................................................................................................................. 98
Refused .................................................................................................................................................................................... 99 Q127 DEM16
ASK IF 'CAN'T SAY' OR 'REFUSED' AT Q126 [SINGLE RESPONSE] Well, could you tell me whether your income would be over $50,000 or under $50,000 per annum? [SA]
Code Route
Under $50,000 ........................................................................................................................................................................ 01
$50,000 or more ..................................................................................................................................................................... 02
Can't say .................................................................................................................................................................................. 98
Refused .................................................................................................................................................................................... 99

ANZ Survey of Adult Financial Literacy in Australia (2008) 175
The Social Research Centre
Q128 DEM17
[READ OUT AND PROBE TO CODE] [SINGLE RESPONSE] Would you mind telling me your approximate annual household income from all sources before tax? [SA] PROBE IF CAN'T SAY : Well, what's your best guess?
Code Route
Less than $5,999 ................................................................................................................................................................... 01
$6,000-$9,999......................................................................................................................................................................... 02
$10,000-$14,999 .................................................................................................................................................................... 03
$15,000-$19,999 .................................................................................................................................................................... 04
$20,000-$24,999 .................................................................................................................................................................... 05
$25,000-$29,999 .................................................................................................................................................................... 06
$30,000-$34,999 .................................................................................................................................................................... 07
$35,000-$39,999 .................................................................................................................................................................... 08
$40,000-$44,999 .................................................................................................................................................................... 09
$45,000-$49,999 .................................................................................................................................................................... 10
$50,000-$59,999 .................................................................................................................................................................... 11
$60,000-$69,999 .................................................................................................................................................................... 12
$70,000-$79,999 .................................................................................................................................................................... 13
$80,000-$89,999 .................................................................................................................................................................... 14
$90,000-$99,999 .................................................................................................................................................................... 15
$100,000-$109,999 ............................................................................................................................................................... 16
$110,000-$119,999 ............................................................................................................................................................... 17
$120,000-$129,999 ............................................................................................................................................................... 18
$130,000-$139,999 ............................................................................................................................................................... 19
$140,000-$149,999 ............................................................................................................................................................... 20
$150,000 or more................................................................................................................................................................... 21
Can't say .................................................................................................................................................................................. 99
Refused .................................................................................................................................................................................... 98

ANZ Survey of Adult Financial Literacy in Australia (2008) 176
The Social Research Centre
Q129 DEM18
ASK IF 'CAN'T SAY' OR 'REFUSED' AT Q128 [SINGLE RESPONSE] Well, could you tell me whether your household income would be over $100,000 or under $100,000 per annum? [SA]
Code Route
Under $100,000...................................................................................................................................................................... 01
$100,000 or more................................................................................................................................................................... 02
Can't say .................................................................................................................................................................................. 99
Refused .................................................................................................................................................................................... 98 Q130 DEM19
[READ OUT AND PROBE TO CODE] [SINGLE RESPONSE] Thinking about the total amount of money you now have, either on your own or jointly with someone else, in all savings and investments, INCLUDING in a bank, building society or credit union accounts, superannuation or other investments but EXCLUDING YOUR OWN HOME in which of the following does the money you have fall?[SA] PROBE IF CAN'T SAY : Well, what's your best guess?
Code Route
Less than $100 ....................................................................................................................................................................... 01
$100-$499................................................................................................................................................................................ 02
$500-$999................................................................................................................................................................................ 03
$1,000-$1,999......................................................................................................................................................................... 04
$2,000-$4,999......................................................................................................................................................................... 05
$5,000-$9,999......................................................................................................................................................................... 06
$10,000-$19,999 .................................................................................................................................................................... 07
$20,000-$49,999 .................................................................................................................................................................... 08
$50,000-$99,999 .................................................................................................................................................................... 09
$100,000-$249,999 ............................................................................................................................................................... 10
$250,000-$499,999 ............................................................................................................................................................... 11
$500,000-$749,999 ............................................................................................................................................................... 12
$750,000-$999,999 ............................................................................................................................................................... 13
$1 Million or more .................................................................................................................................................................. 14
[DO NOT READ] Can't say .................................................................................................................................................. 99
[DO NOT READ] Refused.................................................................................................................................................... 98 Q131 DEM20
ASK IF 'CAN'T SAY' OR 'REFUSED' AT Q130 [SINGLE RESPONSE] Well, could you tell me whether it would be over $100,000 or under $100,000? [SA]
Code Route
Under $100,000...................................................................................................................................................................... 01
$100,000 or more................................................................................................................................................................... 02
Can't say .................................................................................................................................................................................. 99
Refused .................................................................................................................................................................................... 98

ANZ Survey of Adult Financial Literacy in Australia (2008) 177
The Social Research Centre
Q132 DEM20A ASK IF HAVE MORTGAGE (Q7/9-10) [READ OUT AND PROBE TO CODE] [SINGLE RESPONSE] Thinking about the money you now owe on any mortgage, either on your own or jointly with someone else, in which of the following does the total mortgage amount fall?[SA] PROBE IF CAN'T SAY : Well, what's your best guess?
Code Route
Less than $100 ....................................................................................................................................................................... 01
$100-$499................................................................................................................................................................................ 02
$500-$999................................................................................................................................................................................ 03
$1,000-$1,999......................................................................................................................................................................... 04
$2,000-$4,999......................................................................................................................................................................... 05
$5,000-$9,999......................................................................................................................................................................... 06
$10,000-$19,999 .................................................................................................................................................................... 07
$20,000-$49,999 .................................................................................................................................................................... 08
$50,000-$99,999 .................................................................................................................................................................... 09
$100,000-$249,999 ............................................................................................................................................................... 10
$250,000-$499,999 ............................................................................................................................................................... 11
$500,000-$749,999 ............................................................................................................................................................... 12
$750,000-$999,999 ............................................................................................................................................................... 13
$1 Million or more .................................................................................................................................................................. 14
[DO NOT READ] Can't say .................................................................................................................................................. 99
[DO NOT READ] Refused.................................................................................................................................................... 98

ANZ Survey of Adult Financial Literacy in Australia (2008) 178
The Social Research Centre
Q133 DEM21
[READ OUT AND PROBE TO CODE] [SINGLE RESPONSE] Apart from any mortgages currently held, what is the total amount of money you owe, either on your own or jointly with someone else, on all your loans, credit cards etc?[SA] PROBE IF CAN'T SAY : Well, what's your best guess?
Code Route
Less than $100 ....................................................................................................................................................................... 01
$100-$499................................................................................................................................................................................ 02
$500-$999................................................................................................................................................................................ 03
$1,000-$1,999......................................................................................................................................................................... 04
$2,000-$4,999......................................................................................................................................................................... 05
$5,000-$9,999......................................................................................................................................................................... 06
$10,000-$19,999 .................................................................................................................................................................... 07
$20,000-$49,999 .................................................................................................................................................................... 08
$50,000-$99,999 .................................................................................................................................................................... 09
$100,000-$249,999 ............................................................................................................................................................... 10
$250,000-$499,999 ............................................................................................................................................................... 11
$500,000-$749,999 ............................................................................................................................................................... 12
$750,000-$999,999 ............................................................................................................................................................... 13
$1 Million or more .................................................................................................................................................................. 14
[DO NOT READ] Can't say .................................................................................................................................................. 99
[DO NOT READ] Refused.................................................................................................................................................... 98 Q134 DEM22
ASK IF 'CAN'T SAY' OR 'REFUSED' AT Q133 [SINGLE RESPONSE] Well, could you tell me whether it would be over $100,000 or under $100,000 per annum? [SA]
Code Route
Under $100,000...................................................................................................................................................................... 01
$100,000 or more................................................................................................................................................................... 02
Can't say .................................................................................................................................................................................. 99
Refused .................................................................................................................................................................................... 98

ANZ Survey of Adult Financial Literacy in Australia (2008) 179
The Social Research Centre
Appendix Two: Adult Financial Literacy Framework
Adult Financial Literacy – Australia Framework of Skills and Knowledge
(based on an amended version of the framework produced by
the Adult Financial Literacy Advisory Group, UK, and revised in light of comment from key stakeholders)
Numerical Literacy and Standard Literacy Basic requirements Advanced competence Essential mathematical, reading and comprehension skills
• Ability to add, subtract, multiply and divide (with or without calculator)
• Ability to understand and calculate percentages (with or without calculator)
• Ability to read and comprehend basic English
• Ability to understand compound interest
• Ability to understand averages
Financial Understanding Basic requirements Advanced competence Understanding of what money is and how money is exchanged
• Understanding of the range of ways to pay for goods and services, including:
− Cash − Cheques − Money orders − Credit cards − Debit cards − Store cards − EFTPOS − Direct debit − Loans − Laybys
• Ability to compare the advantages and disadvantages of different forms of payment
• Understanding of the implications and key features of unsecured credit and debt, including both fixed:
− Personal loans − Lease − Hire purchase
…and revolving: − Credit cards − Store cards − Overdrafts − Other “line of credit” facilities
• Understanding of ways to compare interest rates and the effects of fees and other charges
• Understanding that some loans and purchase agreements are secured whilst others are unsecured, and the implications for default
• Understanding of the concept and implications of personal guarantor and co-borrower arrangements
• Understanding of how credit records are generated and the implications of bad records for future borrowing
Understanding of where money comes from and goes
• Ability to read a pay-slip • Recognition of household expenses
and regular financial commitments
• Understanding of how companies and other organisations are financed, including shares

ANZ Survey of Adult Financial Literacy in Australia (2008) 180
The Social Research Centre
Financial Competence Basic requirements Advanced competence Understanding of the main features of basic financial services
• Awareness of the availability and basic features of: − Basic banking − Electronic banking (e.g. ATMs;
EFTPOS; telephone banking; Internet banking)
− Mortgages − Superannuation − Other investments (e.g. shares;
term deposits; managed investments; life insurance with an investment element)
− Risk insurance products (e.g. house and contents insurance, including coverage and exclusions; health insurance)
• Awareness of the sorts of fees that apply to these services
• Awareness of the trade-off between fees and return
• Awareness that one should shop around before purchasing financial products
• Understanding that superannuation sets aside money for retirement, and involves compulsory employer contributions
• Understanding that personal contributions can be made to superannuation as an option
• Ability to check that an employer has been making compulsory contributions to superannuation
• Understanding of fixed interest rates vs. variable interest rates as they apply to mortgages
• Understanding of terms and conditions for early termination and other variations within mortgages
• Ability to make strategic use, to maximise personal financial advantage, of: − Basic banking − Electronic banking (e.g. ATMs;
EFTPOS; telephone banking; Internet banking)
− Mortgages − Superannuation − Other investments (e.g. shares;
term deposits; managed investments; life insurance with an investment element)
− Risk insurance products (e.g. house and contents insurance, including coverage and exclusions; health insurance)
• Ability to check records (e.g. Annual Statements) from superannuation funds to determine whether current contribution levels and % returns are appropriate for anticipated needs
• Knowledge concerning what constitutes an adequate level of insurance for total and permanent disablement or death benefit, and ability to check that a superannuation fund is providing it
• Understanding that taxation can be minimised through personal contributions to superannuation vs. other forms of investment
• Ability to use property for personal financial advantage (e.g. purchase investment property)
Ability to understand financial records and appreciation of the importance of reading and retaining them
• Ability to check accuracy of official financial records, such as: − Bank statements − ATM service statements − Credit card statements − Superannuation statements − Insurance policies and renewal
notices (e.g. understand coverage, exclusions and duty of disclosure)
− Loan documentation • Understanding of the need to keep
records
• Ability to reconcile a bank statement to allow for items not yet reconciled
• Ability to read an Annual Statement from a superannuation fund to see the asset classes invested in and % return over time
• Understanding of official financial records, such as prospectuses and Annual Statements for investment products
• Understanding of the need to monitor performance of investments over time

ANZ Survey of Adult Financial Literacy in Australia (2008) 181
The Social Research Centre
Financial Competence (continued) Basic requirements Advanced competence Attitudes to spending money and saving
• Understanding of the purpose of saving • Understanding of why you need to
save for retirement • Understanding that there is a variety of
places and ways in which to save money
• Understanding of how to use budgets to plan and control personal spending
• Ability to forecast and recognise the impact of irregular major financial outlays (e.g. vehicle registration; holidays)
• Ability to budget strategically to make payments as late as possible and keep money earning interest as long as possible
Awareness of risks associated with some financial products and appreciation of the relationship between risk and return
• Understanding of the purpose of insurance
• Awareness that both savings and borrowing are offered on differing terms and interest rates that vary over time
• Awareness that high return investments are also likely to involve high risk
• Understanding that market values can fall as well as rise
• Awareness that if it sounds “too good to be true”, then it probably isn’t true
• Awareness of the dangers of under-insurance
• Awareness that individuals are responsible for debts of spouse/other family members with whom they have a joint financial product
• Understanding of the value of diversification when investing
• Ability to identify potential risks and determine whether they need to be eliminated or mitigated against
• Understanding of managed investments
• Understanding of guarantees on investments
• Understanding that short-term ups and downs in value are less important for long-term investments
• Understanding of currency issues, including the impact of fluctuations in exchange rate for the Australian dollar
Financial Responsibility Basic requirements Advanced competence Ability to make appropriate personal life choices about financial issues
• Understanding of the difference between long-term and short-term needs
• Ability to prioritise different needs to balance income and expenditure within financial capacity
• Understanding of the difference between good (manageable and planned) debt and bad (unmanageable and unplanned) debt
• Ability to make informed choices when experiencing a drop in income
• Ability to assess the financial implications of personal life choices in terms of career choices and life-long learning opportunities

ANZ Survey of Adult Financial Literacy in Australia (2008) 182
The Social Research Centre
Financial Responsibility (continued) Basic requirements Advanced competence Understanding of consumer rights and responsibilities
• Understanding that consumers do have rights
• Understanding that consumers have a right to clear information about products both pre-purchase and ongoing post-purchase
• Awareness of and ability to access independent dispute resolution schemes for financial products
• Understanding of consumer responsibilities and the implications of not meeting them, including: − Duty of disclosure for risk
insurance − Safeguarding of PINs for
transaction banking
• Understanding and ability to check, before handing over money for an investment, that: − Financial products should only
be purchased from licensed financial businesses
− Advice should only be sought from persons employed by licensed advisory businesses
− Prospectuses must be lodged with ASIC
− Persons providing advice about financial products must disclose any commissions, important side-benefits and potential conflicts of interest
• Awareness of 14-day cooling-off period for insurance
Ability and confidence to access assistance when things go wrong
• Understanding that the finance sector is regulated
• Understanding of who one can call on to help with more complex issues (e.g. advisors; accountants)
• Awareness of where/whom to contact if things go wrong (e.g. consumer complaints department of financial institution; consumer association; financial counsellor; ombudsman)
• Ability to make complaints effectively • Awareness of the distinction between
financial advisors charging fee-for-service vs. taking commission, and understanding of its implications
• Broad understanding of the level of regulation of the finance sector
• Understanding that regulation of the finance sector is no guarantee of the safety of all financial products
• Ability to assess and compare different sources of financial advice and information
• Understanding of the processes and procedures for resolving disputes
Please note that other potential aspects of adult financial literacy (e.g. taxation; understanding of how and why
government is financed; awareness and understanding of government benefits; understanding of how fees are
calculated and how to minimise them) were agreed upon as being beyond the scope of the current project, and
therefore not included in the framework.

ANZ Survey of Adult Financial Literacy in Australia (2008) 183
The Social Research Centre
Appendix Three: Examples of Australian Geographic Classification Remoteness Areas
REMOTENESS STRUCTURE - AUSTRALIAN STANDARD GEOGRAPHICAL CLASSIFICATION
Remoteness area Description Examples
Major cities
Geographic distance imposes minimal restriction upon
accessibility to the widest range of goods, services and
opportunities for social interaction.
Sydney, Newcastle, Wollongong, Melbourne, Geelong, Brisbane, Gold
Coast, Adelaide, Perth and Canberra.
Inner regional
Geographic distance imposes some restriction upon
accessibility to the widest range of goods, services and
opportunities for social interaction.
Tamworth, Wagga Wagga (New South Wales), Ballarat, Bendigo
(Victoria), Rockhampton, Bundaberg, Gladstone (Queensland), the
Adelaide Hills (South Australia), Bunbury (Western Australia), Hobart
and Launceston (Tasmania).
Outer regional
Geographic distance imposes a moderate restriction upon
accessibility to the widest range of goods, services and
opportunities for social interaction.
Broken Hill, Griffith, Gunnedah (New South Wales), Horsham, Swan
Hill, Traralgon (Victoria), Roma, Cairns (Queensland), Port Augusta,
Mount Gambier (South Australia), Albany (Western Australia), Burnie
(Tasmania), and Darwin (Northern Territory).
Remote
Geographic distance imposes a high restriction upon
accessibility to the widest range of goods, services and
opportunities for social interaction.
Cobar (New South Wales), the northern Wimmera district (Victoria),
Charters Towers and Cooktown (Queensland), Port Lincoln (South
Australia), the Kalgoorlie gold-fields (Western Australia), parts of the
West Coast (Tasmania), Alice Springs, Katherine (Northern Territory).
Very remote
Geographic distance imposes the highest restriction upon
accessibility to the widest range of goods, services and
opportunities for social interaction.
The far west parts of New South Wales and Queensland, northern
South Australia and Western Australia, most of the Northern Territory
and Flinders and King Islands in Bass Strait (Tasmania).

ANZ Survey of Adult Financial Literacy in Australia (2008) 184
The Social Research Centre
* Inner Regional Australia: CDs with an average ARIA index value greater than 0.2 and less than or equal to 2.4
* Outer Regional Australia: CDs with an average ARIA index value greater than 2.4 and less than or equal to 5.92
* Remote Australia: CDs with an average ARIA index value greater than 5.92 and less than or equal to 10.53
* Very Remote Australia: CDs with an average ARIA index value greater than 10.53
Remoteness is calculated using the road distance to the nearest Urban Centre in each of five classes based on population size. The Remoteness classification divides Australia into
six Remoteness Areas: Major Cities of Australia; Inner Regional Australia; Outer Regional Australia; Remote Australia; Very Remote Australia; and Migratory. The glossary
accompanying this publication provides definitions of RAs used. For further information see Statistical Geography: Volume 1 - Australian Standard Geographical Classification
(ASGC), 2006 (cat. no. 1216.0).
The key element in producing the structure is the preparation of the Accessibility/Remoteness Index of Australia (ARIA+) grid. ARIA+ scores are first calculated for each Urban Centre
and are then interpolated to create a 1 km grid covering the whole of Australia. Each grid square carries a score of remoteness from an index of scores ranging from 0 (zero) through
to 15. The data custodian of the grid remains the National Key Centre for Social Applications of Geographic Information System (GISCA), Adelaide University, South Australia. ABS
Remoteness Areas are created by averaging the ARIA+ scores within Census Collection Districts (CDs), then aggregating the CDs up into the 6 ABS Remoteness Area categories
based on the averaged ARIA+ score.
Remoteness Area categories are defined in the ASGC Remoteness Classification as follows:
* Major Cities of Australia: CDs with an average Accessibility/Remoteness Index of Australia (ARIA) index value of 0 to 0.2