afm analysis of enamel damage due to … layer forming micromechanical retention. ... to...
TRANSCRIPT

Vladan Mirjanić, AFM testing of nanostructure of resilience orthodontic bonding solutions... Contemporary Materials, VII−1 (2016) Page 60 of 72
Original scientific papers UDK 616.314.17-085.242
doi: 10.7251/COMEN1601060M
AFM ANALYSIS OF ENAMEL DAMAGE DUE TO ETCHING WITH ORTHOPHOSPHORIC ACID
Vladan Mirjanić1*, Đorđe Mirjanić2
1 University of Banja Luka, Faculty of Medicine, Study Program Dentistry, Save Mrkalja 14, Banja Luka, Republic of Srpska
2 Community Health Center, Zdrave Korde 4, Banja Luka, Republic of Srpska
Summary: Bearing in mind that in the field of jaw orthopedics and related scientific
fields, there are no scientific studies that use the most modern technology based on the Atomic Force Microscopy (AFM) to investigate the nanostructure of tooth enamel after etching with 37% orthophosphoric acid, in this paper we will use this method, which is currently the most reliable, to determine the degree of tooth damage after its etching in the process of fixing orthodontic brackets. Considering the fact that the degree of enamel damage after etching cannot be realistically comprehended by the method called ’network’, because in this way the damage cannot be seen three dimensionally (the depth of the dama-ge), but only the damage in a single plane, a more precise analysis can be obtained with the application of the most contemporary method that we can apply in this case, and that is the application of AFM technology.
Keywords: Atomic Force Microscopy of enamel damage, etching, orthophosphoric acid.
1. INTRODUCTION The development of the properties of adhesion
of composite materials to hard tooth tissues, primarily enamel and dentin is one of the most important achie-vements in contemporary dentistry. The property of adhesion to enamel was found by Buonocore in 1955 [1], where he used the phosphoric acid to etch the surface layer of enamel due to the increase of reten-tion area and the free energy of the surface. Etching enamel creates pores in which later penetrates resin or adhesive system. Different morphological forms of etched enamel were found by Silverstone. The surface of enamel after laying the phosphoric acid was demi-neralized in a 5−10 μm layer, which is the area of etched enamel. The pores about 20 μm thick are crea-ted beneath the surface, and these are the areas of qualitative pores, while beneath that area there is the area of quantitative pores, about 20 μm thick.
Apart from these, there are self-etching adhesi-ves too, which can also achieve good adhesion. Low-viscosity monomers penetrate into the enamel surface and form, both within and around enamel prisms, a hybrid layer forming micromechanical retention. Having in mind that these structures are visible only under very high magnification (electronic microsco-pe), we should speak here about nanoretention on enamel surface. And finally, we should note here that
the action of self-etching adhesives on enamel surface is less aggressive than phosphoric acid, where the demineralization of surface is 1−2 μm.
Enamel prisms are formed through complex interaction of ectodermal and ectomesenchymal tis-sues and through the coordination of cells responsi-ble for their ameloblasts synthesis. Ameloblasts are created from the enamel body under the inductive influence of ectomesenchymal cells that migrate into the area of stomatodeum. Ectomesenchymal cells lead to ribbon-like multiplication of ectodermal cells and the creation of a horseshoe designated as dental lamina. At ten places in lines subsequent multiplica-tion of epithelial cells occurs in the form of the ball-like cell piles designated as dental bud. Epithelial cells exert inductive influence on ectomesenchymal cells, they multiply and deepen the ball which now assumes the shape of a hat. At this stage all the for-mative structures are differentiated with the bud, from which future dental tissues will arise [2−6].
Enamel surface is not flat. It has a wavy struc-ture because at places where Retzius’ striae end, the-se striae overlap in the form of steps, with the appea-rance of shallow grooves referred to as perikymata (Figure 1). In certain places, especially with primary (baby) teeth, there a few microns of enamel without prismatic organization on the surfaces – aprismatic enamel (Figure 2) [7,8].
* Corresponding author: [email protected]

Vladan Mirjanić, AFM testing of nanostructure of resilience orthodontic bonding solutions... Contemporary Materials, VII−1 (2016) Page 61 of 72
Figure 1. Perikymata Figure 2. Aprismatic enamel
Although enamel has pronounced hardness, it
is also fragile at the same time and similar to glass, so that for these reasons it could appear to be susceptible to breaking. Despite that, enamel can take loads higher than 1000 N several times during the day. The overall enamel microstructure is for-med in such a way to adjust to such loads. This is also owing to the support of elastic dentin and the structures such as enamel tufts at the dentin-enamel junction [4,6,9].
Enamel is in constant dynamic communica-tion with the ecosystem of oral cavity. The processes of demineralization and remineralization are always present and their balance ensures the enamel integrity. If the external aggressive factors direct the balance toward the demineralization activities, the integrity of the crystal lattice weakens, reducing the hardness and resistance of enamel, which, after cros-sing a certain limit of mechanical resistance of ena-mel leads to rupture and creation of cavities, as the beginning of an irreversible damage [2,10].
Etching enamel with acid causes selective demineralization which increases the free surface energy, but at the same time porosity and the contact surface too. Bonding to enamel (adhesion) [11] depends on the capacity of the resin to penetrate into the area between the crystal prisms [12] which leads to macromechanical retention. The infiltered resin surrounds the individual crystals of hydroxyapatite forming microthorns [13] thus creating a hybrid layer which accomplishes the retention mechanism at the nanolevel between the tooth and resin [14]. These micro thorns probably contribute to adhesion more than macro thorns which entering the area between the enamel prisms [15].
The retention capacities of etched enamel depend on the chemical structure of enamel mineral phase, the type of acid and time of etching [16].
Research has proved that the variations in time of etching from 15 to 90 seconds with 35−37% phosp-horic acid do not influence much the shear bond strength or orthodontic brackets [17].
With etching time damage is greater and this is primarily manifested by capturing complete ena-mel prisms which happens in the first 15 seconds. In the further course, between 15 and 30 seconds destruction spreads mainly in the depth covering the central prism regions [18].
Something that has not been investigated in detail so far is the surface roughness at the micro-scopic level [19] where the nano characterization of surface roughness could provide biophysical mecha-nisms on enamel surface [20]. AFM with high lateral and vertical resolution allows investigating roug-hness at micro and nano levels without major inter-ference of macroscopic components such as the wavy structure [21]. AFM microprobe does not require preparation of the sample and consequently endangering of the original surface. Thus it repre-sents a direct way to experimentally detect and quantify the surface roughness.
2. MATERIAL AND METHODS When analyzing the teeth after etching with
37% phosphoric acid, the material of work comprises 50 teeth of permanent dentition, which are fully intact (without caries, non repaired through conservative methods and without similar intervention therapeutic dentistry procedures); the total of 256 lines were done on each of these 50 teeth (the total 12.800 lines).
After extraction, the teeth were immediately placed in the solution of artificial saliva, in order to preserve the physiological mineralization of enamel. After this procedure, further preparation for the
Vladan Mirjanić, AFM testing of nanostructure of resilience orthodontic bonding solutions... Contemporary Materials, VII−1 (2016) Page 62 of 72
study included the following: the etching material (in the concentration of 37% of orthophosphoric acid), was applied on enamel surfaces on which, in clinical orthodontic practice, brackets are bonded to teeth. This material was left to act for 30 seconds, i.e. in the way that it is done in clinical practice. After this, the surface on which the etching agent had been laid was rinsed with demineralized water and after thorough drying tooth enamel was cut to the dimensions 3mm x 2mm x 2mm, and then the surfaces to be scanned were polished. Tooth enamel samples were fixed to the AFM microscope holder. Nanotechnological device JSPM-5200 which is loca-ted in NanoLab module for biomedical engineering at the Faculty of Mechanical Engineering of Belgra-de University was used to test the nanostructure of tooth enamel. This is an integrated nanosystem with multiple operating modes that enables the following functions: STM, AFM, MFM, ECSPM etc.
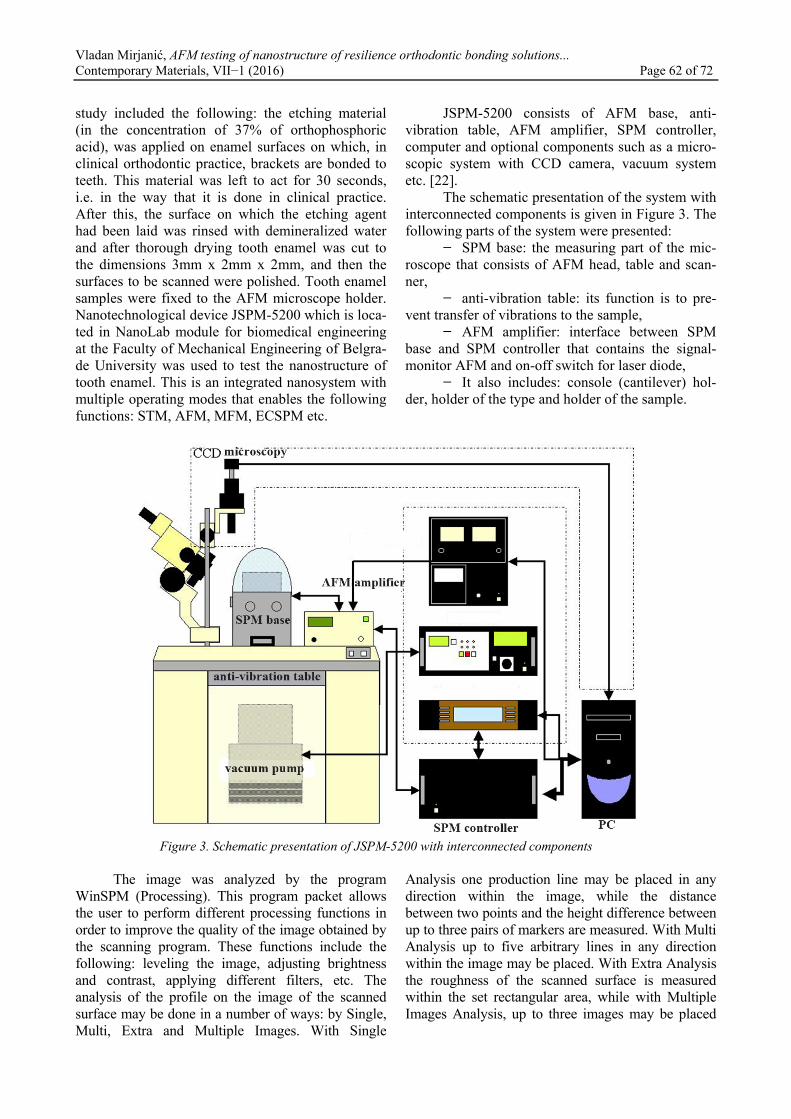
JSPM-5200 consists of AFM base, anti-vibration table, AFM amplifier, SPM controller, computer and optional components such as a micro-scopic system with CCD camera, vacuum system etc. [22].
The schematic presentation of the system with interconnected components is given in Figure 3. The following parts of the system were presented:
− SPM base: the measuring part of the mic-roscope that consists of AFM head, table and scan-ner,
− anti-vibration table: its function is to pre-vent transfer of vibrations to the sample,
− AFM amplifier: interface between SPM base and SPM controller that contains the signal-monitor AFM and on-off switch for laser diode,
− It also includes: console (cantilever) hol-der, holder of the type and holder of the sample.
Figure 3. Schematic presentation of JSPM-5200 with interconnected components
The image was analyzed by the program
WinSPM (Processing). This program packet allows the user to perform different processing functions in order to improve the quality of the image obtained by the scanning program. These functions include the following: leveling the image, adjusting brightness and contrast, applying different filters, etc. The analysis of the profile on the image of the scanned surface may be done in a number of ways: by Single, Multi, Extra and Multiple Images. With Single
Analysis one production line may be placed in any direction within the image, while the distance between two points and the height difference between up to three pairs of markers are measured. With Multi Analysis up to five arbitrary lines in any direction within the image may be placed. With Extra Analysis the roughness of the scanned surface is measured within the set rectangular area, while with Multiple Images Analysis, up to three images may be placed

Vladan Mirjanić, AFM testing of nanostructure of resilience orthodontic bonding solutions... Contemporary Materials, VII−1 (2016) Page 63 of 72
and the profile is analyzed on the same line. We have used the Multi Analysis of Profile.
This program, WinSPM (Processing), also allows generating of three-dimensional images of scanned surface (bird’s-eye view). The adjustable parameters are Position (direction of display), Zoom (height along the Z-axis) and Centering (centering the surface in relation to the screen).
We finally use the report making feature, which is used to display images, measurements, pro-files and 3D images in the form of the report for printing that are presented in the results of research. It is understood that the format of the A4 page is in vertical layout. The measurement data for the selec-ted 2D image may be displayed.
3. RESULTS The results of research of enamel surface
morphology will be presented by the regression analysis of analyzed etched-treated and non-treated teeth with roughness parameters Ra, Rq, Rzijs and Rz.
In the analysis of the results of obtained roug-hnesses through AFM the most used are: Roughness Average (Ra), Root Mean Square roughness (Rq), Ten Point Mean Roughness (Rzijs) and Mean Roug-hness Depth which is determined as the biggest height difference (Rz). Roughnesses are expressed in nanometers (nm) [23,24].
The Figures below, due to space limitation, present one AFM image (each) with appropriate displays of measurements places. Figure 4 shows the
general data of AFM image of non-treated sample, while Figure 5 presents the general data of AFM image of etched-treated sample. Figure 6 gives a presentation of measurement places and arithmetic means of average roughnesses of non-treated sam-ple, and Figure 7 presents the measurement places and arithmetic means of average roughnesses of etched-treated sample.
Figure 4. General data of AFM image – (Sample: 1;
Non-treated, scan 1)
Figure 5. Presentation of measurement places and arithmetic means of average tooth
roughnesses – (Sample: 1; Non-treated, image 1).

Vladan Mirjanić, AFM testing of nanostructure of resilience orthodontic bonding solutions... Contemporary Materials, VII−1 (2016) Page 64 of 72
Figure 6. General data of AFM image – (Sample: 1; Etched-treated, image 1)
Figure 7. Presentation of the measuring places and arithmetic means of average tooth roughnesses – (Sample: 1;
Etched – treated, image 1)
Due to the size of the table, we will here pre-sent only the mean values for roughness parameters. In Table 1 the mean values of parameters Ra, Rq, Rzijs and Rz for non-treated teeth are presented.
In Table 2 the mean values of the parameters Ra, Rq, Rzijs and Rz for etched-treated teeth are presented.

Vladan Mirjanić, AFM testing of nanostructure of resilience orthodontic bonding solutions... Contemporary Materials, VII−1 (2016) Page 65 of 72
Table 1. Mean values of parameters Ra, Rq, Rzijs and Rz for non-treated teeth
Samples: 1-50 Non-treated
Mean values of non-treated samples Ra [nm] Rz[nm] Rq[nm] Rzisj[nm]
Xsr-U1-NET 66.260 300.320 80.220 792.800
Xsr-U2-NET 16.240 77.360 19.860 216.300
Xsr-U3-NET 22.640 102.840 26.380 265.000
Xsr-U4-NET 55.380 316.420 71.300 461.200
Xsr-U5-NET 22.680 119.080 28.620 161.900
Xsr-U6-NET 111.640 450.100 129.580 1000.000
Xsr-U7-NET 84.380 414.440 104.020 903.600
Xsr-U8-NET 152.260 590.640 174.740 1070.000
Xsr-U9-NET 86.960 418.100 105.120 841.700 Samples: 1-50 Non-treated
Mean values of non-treated samples Ra [nm] Rz[nm] Rq[nm] Rzisj[nm]
Xsr-U10-NET 22.200 125.760 27.180 309.700
Xsr-U11-NET 70.920 303.740 79.840 677.200
Xsr-U12-NET 38.060 121.660 42.440 246.600
Xsr-U13-NET 27.280 120.860 31.480 286.100
Xsr-U14-NET 53.820 322.140 74.760 453.800
Xsr-U15-NET 23.020 104.180 28.500 176.300
Xsr-U16-NET 117.820 432.480 127.840 913.800
Xsr-U17-NET 82.400 430.920 104.820 962.200
Xsr-U18-NET 147.820 563.560 168.580 976.900
Xsr-U19-NET 86.900 432.980 104.880 770.500
Xsr-U20-NET 33.540 115.900 33.300 355.500
Xsr-U21-NET 65.840 266.540 76.080 895.600
Xsr-U22-NET 26.740 87.780 39.720 236.700
Xsr-U23-NET 22.300 105.320 36.320 251.300
Xsr-U24-NET 55.160 333.540 84.680 467.200
Xsr-U25-NET 21.940 117.220 27.940 181.900
Xsr-U26-NET 66.560 299.380 85.320 864.900
Xsr-U27-NET 16.660 76.840 20.640 228.000
Xsr-U28-NET 24.060 104.460 25.020 293.200
Xsr-U29-NET 53.340 291.940 73.320 394.600
Xsr-U30-NET 22.920 105.020 30.780 191.400
Xsr-U31-NET 111.720 492.520 131.020 920.000
Xsr-U32-NET 82.820 454.540 100.760 836.600
Xsr-U33-NET 145.000 519.700 177.820 900.600
Xsr-U34-NET 89.140 451.180 98.220 733.700

Vladan Mirjanić, AFM testing of nanostructure of resilience orthodontic bonding solutions... Contemporary Materials, VII−1 (2016) Page 66 of 72
Xsr-U35-NET 33.100 121.540 32.660 339.700
Xsr-U36-NET 63.180 266.120 70.940 1049.600
Xsr-U37-NET 28.840 99.000 44.080 210.600
Xsr-U38-NET 23.180 110.140 38.080 195.900
Xsr-U39-NET 56.860 353.940 91.480 460.100
Xsr-U40-NET 24.220 105.380 28.340 151.700
Xsr-U41-NET 111.440 479.160 132.780 884.700
Xsr-U42-NET 91.620 422.120 106.120 885.100
Xsr-U43-NET 152.140 562.140 189.600 1273.700
Xsr-U44-NET 88.080 473.120 99.420 922.300
Xsr-U45-NET 32.320 187.380 32.220 261.500
Xsr-U46-NET 74.560 329.020 86.680 556.600
Xsr-U47-NET 39.980 123.240 46.640 305.500
Xsr-U48-NET 25.180 134.200 32.660 252.500
Xsr-U49-NET 51.360 304.680 71.500 431.300
Xsr-U50-NET 18.820 113.660 27.340 224.900
Xsr-NET 60.826 275.086 74.033 552.850
Table 2. Mean values of parameters Ra, Rq, Rzijs and Rz for etched-treated teeth
Sample: 1-50 Etched - Treated
Mean values of treated (etched) samples Ra [nm] Rz [nm] Rq [nm] Rzisj [nm]
Xsr-U1-TRE 150.600 612.800 175.600 1750.000
Xsr-U2-TRE 183.800 714.620 210.120 1040.000
Xsr-U3-TRE 107.020 417.640 123.820 568.300
Xsr-U4-TRE 69.460 256.180 74.940 507.400
Xsr-U5-TRE 72.240 290.640 82.580 762.000
Xsr-U6-TRE 43.512 135.060 67.230 304.000
Xsr-U7-TRE 40.520 217.740 50.220 366.700
Xsr-U8-TRE 35.280 170.340 43.240 278.000
Xsr-U9-TRE 34.660 162.980 41.360 325.900
Xsr-U10-TRE 38.000 167.440 45.000 277.800
Xsr-U11-TRE 147.100 612.500 169.460 1660.300
Xsr-U12-TRE 191.720 714.840 206.400 908.900
Xsr-U13-TRE 103.780 400.200 123.780 535.100
Xsr-U14-TRE 68.060 253.460 74.460 574.400
Xsr-U15-TRE 70.800 295.420 83.880 815.300
Xsr-U16-TRE 5.492 33.480 7.330 102.700
Xsr-U17-TRE 40.900 209.640 51.360 382.600
Xsr-U18-TRE 33.360 174.780 42.240 294.900

Vladan Mirjanić, AFM testing of nanostructure of resilience orthodontic bonding solutions... Contemporary Materials, VII−1 (2016) Page 67 of 72
Xsr-U19-TRE 35.160 152.860 44.400 302.500
Xsr-U20-TRE 39.620 168.280 46.620 283.200
Xsr-U21-TRE 150.440 662.240 174.400 1679.000
Xsr-U22-TRE 186.700 714.260 210.880 1097.100
Xsr-U23-TRE 107.020 399.160 127.040 621.500
Xsr-U24-TRE 67.480 249.740 76.060 572.800
Xsr-U25-TRE 73.840 303.280 82.700 781.900
Xsr-U26-TRE 150.860 547.120 155.660 1534.300
Xsr-U27-TRE 192.180 797.860 205.140 1297.600
Xsr-U28-TRE 99.020 426.860 127.760 433.000
Xsr-U29-TRE 68.180 245.760 78.360 590.200
Xsr-U30-TRE 80.480 257.980 77.540 874.600
Xsr-U31-TRE 15.552 71.700 17.870 208.300
Xsr-U32-TRE 43.680 200.860 50.340 427.900
Xsr-U33-TRE 33.640 182.780 41.280 247.000
Xsr-U34-TRE 34.080 144.000 40.360 329.100
Xsr-U35-TRE 36.720 164.880 47.580 273.900
Xsr-U36-TRE 136.540 603.580 173.320 1619.900
Xsr-U37-TRE 175.620 762.060 223.460 921.800
Xsr-U38-TRE 112.920 367.480 124.160 460.400
Xsr-U39-TRE 63.780 249.100 70.740 694.300
Xsr-U40-TRE 64.940 283.520 86.740 722.800
Xsr-U41-TRE 79.552 135.720 67.430 483.500
Xsr-U42-TRE 43.380 217.580 48.600 369.800
Xsr-U43-TRE 35.800 167.880 44.500 367.300
Xsr-U44-TRE 36.440 165.900 44.540 365.200
Xsr-U45-TRE 43.380 162.740 43.980 288.800
Xsr-U46-TRE 160.820 596.220 161.340 2009.400
Xsr-U47-TRE 191.280 637.160 212.880 1148.500
Xsr-U48-TRE 114.080 390.580 115.820 500.700
Xsr-U49-TRE 75.120 248.560 81.660 654.100
Xsr-U50-TRE 71.360 298.300 78.340 620.900
Xsr-NET 85.119 336.315 97.090 684.712
The regression parameters of samples present
the functional dependence of roughness in relation to the place of measurement of each specified roug-hness of etched-treated as opposed to non-treated samples.
Table 3 presents the regression parameters of non-treated teeth by roughnesses (Ra, Rq Rzijs, Rz) of the adhesive.
Table 4 presents the regression parameters of etched-treated teeth by roughnesses (Ra, Rq, Rzijs, Rz) of adhesives.

Vladan Mirjanić, AFM testing of nanostructure of resilience orthodontic bonding solutions... Contemporary Materials, VII−1 (2016) Page 68 of 72
Table 3. Regression parameters of sample 1, 1-50, non-treated – Total data (with arithmetic means of measurement images)
Parameter designation
Regression equation (y=ax+b)
a b Determination coefficient (R2)
Correlation coefficient (r)
NET-Ra y = -0.0093x + 61.988 -0.0093 61.988 0.0002 0.0141
NET -Rz y = 0.0121x + 273.57 0.0121 273.57 0.00002 0.0045
NET -Rzijs y = -0.2249x + 581.08 -0.2249 581.08 0.0025 0.0500
NET -Rq y = 0.0027x + 73.699 0.0027 73.699 0.00001 0.0032
Table 4. Regression parameter of samples 1-50, etched-treated – Total data (with arithmetic means of measuring ima-ges)
Parameter designation
Regression equation (y=ax+b)
a b Determination coefficient (R2)
Correlation coefficient (r)
TRE-Ra y = -0.0105x + 86.439 0.0105 86.439 0.0001 0.0100 TRE –Rz y = -0.1813x + 359.07 -0.1813 359.07 0.0031 0.0557
TRE –Rzijs y = -0.0367x + 689.32 -0.0367 689.32 0.00003 0.0055 TRE –Rq y = -0.0398x + 102.08 -0.0398 102.08 0.0016 0.0400
4. DISCUSSION The reason we chose the investigation by
AFM is in the fact that AFM is currently the most reliable possible method for determining the degree of damage of enamel caused by its etching. There are numerous studies that showed the convenience of using AFM analyses to monitor both qualitative and quantitative changes on enamel surface [25−30].
Only with the development of AFM technology, a possibility was opened to monitor more subtle changes in enamel surface [31]. The AMF studies start to be used more and more in the researches in dentistry too, which monitor surface changes such as dental plaque and mineralized and coloured layers, surface properties of different mate-rials and morphological and mechanical changes in mineralized tissues.
AFM technology is suitable for monitoring the enamel structure ranging from individual crystals to prisms (from nano to micro level) [32−34]. At lower magnifications it presents the enamel prisms as deep recesses. Individual crystals are arranged in parallel and present the elongated hydroxyapatite plane. The crystal surfaces are unevenly compacted in this way forming the enamel surface roughness. At higher magnifications the crystals, show charac-teristic hexagonal appearance, each set at an angle of 60 degrees.
AFM has a number of significant advantages when it comes to investigation of dental tissues compared to the other techniques and especially SEM (Scanning Electron Microscopy); the basic possibility is in obtaining a three-dimensional profile of the test surface.
There are numerous papers [29,30,35−37] that underline and confirm that the AFM technique is especially suitable for investigation of the erosions on enamel surface, even those at the nano level. AFM can be used to clearly monitor the enamel structures from individual crystals to prisms (from nano to micro level) [33,35].
A big number of researches have been under-taken to date in order to determine the degree of enamel damage cause by the etching procedure, with the results that were compared between certain rese-archers, and which were confusing, to say the least [38−43]. The explanation of these and similar fin-dings is sought in partly different methodology, the size of the sample, insufficient precision at work, different methods of preparation-treating the prepa-rations intended for research, etc.. However, based on a thorough and very extensive research i.e. analysis of these results (over 90% of papers that dealt with this problematic in the past 15 years) we believe that the differences in the results between individual researches and researchers, even when the identical methodological procedures were applied, are probably due to different mineralization of ena-mel of tested teeth. This factor – the degree of tooth mineralization is hard or almost impossible to objec-tivize in this type of research, and which would give a fuller picture of the state of tooth enamel. This fac-tor is influenced by the race (it is different with the white and the black race), and is also different within the same race with different nations. Having in mind that mineralization is a dynamic process, i. e. that enamel is in constant interaction with the oral cavity ecosystem [44,45], the demineralization and remineralization processes are always present i. e.

Vladan Mirjanić, AFM testing of nanostructure of resilience orthodontic bonding solutions... Contemporary Materials, VII−1 (2016) Page 69 of 72
they are carried out permanently, while their balance ensures the enamel integrity. The current state depends on the patient’s age, diet, type of food and drinks (special influence is exerted by fizzy drinks [46−51]), the method and regularity of keeping oral hygiene, individual tendency to plaque creation, etc.
Based on tables 1 and 2 with the values of the parameters Ra, Rq, Rzijs and Rz, and their mean values for non-treated and etched-treated teeth we conclude that the mean values of roughnesses Ra, Rz, Rq, Rzijs of etched-treated samples are higher compared to the mean values of parameters of roug-hnesses of non-treated counterparts. Expressed in the percentages, the mean value of parameters Ra of etched-treated teeth is by 39.93% higher, that of Rz roughness is by 22.26% higher, while Rq and Rzijs roughnesses are by 31,14% and 23,85% higher, respectively, compared to the same roughness para-meters of non-treated samples.
The obtained results of the analysis of etched enamel as a preparation for bonding brackets suggest significant distortions in the structure compared to non-treated. All the parameters for measuring roug-hness are significantly higher with the surfaces trea-ted with acid. Investigating etched enamel areas show on AFM images, in addition to micro concavi-ties, the devastation areas of prismatic structures in wider intervals. Nevertheless, it is not possible to completely compare the findings due to the different degree of enamel mineralization with different per-sons and teeth. Similar results were recorded in other studies too. Endo et al. reported that enamel treated with 37% phosphoric acid becomes very porous with exposure to numerous crystals and the honeycomb structure [52]. The main advantage of AFM compared to other technologies is in the fact that it provides roughness quantification [53]. The changes of enamel surface compared to the type of surface treatment were reported [54−57]. Changes were observed in the morphology, surface roughness and the profile depth of treated enamel. The erosion effects are different compared to the acidity of trea-ting agents (acid, adhesives, etc.) and are related with clinical effects [58]. Surface hardness of ena-mel may be determined on AFM images based on the curve of cantilever force [59,60]. The easiest way to achieve this is to record the curves while the cantilever tip performs raster scanning through the sample [61,62]. Bayer et al. [63] investigated the creation of erosions under the influence of different acids on human enamel and discovered the existence of its loss, and also that pH is not the most signifi-cant in determining the erosive potential. Surface hardness may be determined by AFM on the basis of the curves after scanning [64, 65]. Thus, it was
determined that different acids, and especially phosphoric acid decreases the surface hardness, whereby pH is not a decisive factor. A number of possible factors are mentioned, whereby the self-bonding adhesives have higher hardness without the influence of thermal changes unlike the classical etching with acid. In etching with phosphoric acid, there is penetration of water in the contact zone that makes the enamel softer due to the loss of calcium [66]. Hanning et al. [67] reported that individual hydroxyapatite crystals on enamel surface are in a way encapsulated in the self-bonding adhesive system at the nano-level.
5. CONCLUSIONS
Based on the obtained results of research, the-ir statistical processing and detailed analyses, the following conclusions may be made:
− Based on the obtained values for the para-meters Ra, Rq, Rzijs and Rz and their mean values for non-treated and etched-treated teeth, we come to a conclusion that the mean values of roughnesses of Ra, Rq, Rzijs and Rz of etched-treated samples is higher than mean values of parameters of roughnes-ses of their non-treated counterparts. Expressed in percentages, the mean value of parameters of roug-hness of Ra of etched-treated samples is higher by 39.93%, of Rz roughness by 22.26%, and of Rq and Rzijs roughnesses are by 31,14% and 23,85% hig-her, respectively, compared to the same roughness parameters of non-treated samples.
− The obtained results of the analysis of etched enamel as preparation for bonding brackets show significant distortions in the structure compa-red to the treated counterparts. All the parameters for measuring roughness are significantly higher with the surfaces treated with acid. Investigating the etched enamel areas show on AFM images, in addi-tion to micro concavities the areas of devastation of prismatic structures at bigger intervals.
− Preparing enamel for bonding orthodontic bracket by etching with acid causes extensive chan-ges in the nanostructure of enamel crystals that can influence its biomechanical properties and resistance toward the action of acids from oral biofilm (caries) or microenvironment (erosion).
− Enamel treated with acids may be conside-red risky and requires enhanced preventive care because brushing the teeth with toothpaste contai-ning with fluoride is not sufficient.
− After debonding of orthodontic brackets bonded with composite material by enamel etching a

Vladan Mirjanić, AFM testing of nanostructure of resilience orthodontic bonding solutions... Contemporary Materials, VII−1 (2016) Page 70 of 72
long and complex treatment of enamel remineraliza-tion is necessary.
− Manufacturer’s instruction on the time of enamel etching should be strictly adhered to, becau-se the longer it is, the bigger is the damage of the central prism areas.
6. REFERENCES
[1] V. Jeromilov, Osnove stomatoloških mate-rijala, Stomatološki fakultet, Zagreb 2005.
[2] J. Vojinović i sar., Biologija zuba, Naučna knjiga, Beograd 1990.
[3] O. E. Smith, A. Nanci, Overview of morp-hological changes in enamel organ cells associated with major events in amelogenesis, Int J Dev Biol., Vol. 39 (1995) 153−161.
[4] M. A. Major, S. J. Nelson, Dental anatomy, physiology, and occlusion, 8th ed., W. B. Saunders, Philadelphia 2003.
[5] M. Bath-Balogh, M. J. Fehrenbach, Illu-strated Dental Embryology, Histology, Anatomy, 2nd ed., W. B. Saunders, Philadelphia 2006.
[6] R. C. Melfi, K. E. Alley, Permar's oral embryology and microscopic anatomy: a textbook for students in dental hygiene, Williams & Wilkins 1996.
[7] S. Chandra et al., Textbook of Dental and Oral Histology with Embryology and MCQS, 2nd edition, 2/E. Jaypee Brothers Medical Publishers (P) Ltd. 2010.
[8] N. Harris, F. Garcia-Godoy, N. Christine, Primary Preventive Dentistry, 7th edition, Pearson 2007.
[9] M. Goldberg, P. R. Garant, S. Takuma, Cell Biology of Tooth Enamel Formation, Karger 1990.
[10] J. P. Simoner, J. C. Hu, Dental enamel formation and its impact on clinical dentistry, J Dent Educ., Vol. 65 (2001) 896−905.
[11] D. R. Beech, T. Jalaly, Bonding of polymers to enamel: Influence of deposits formed during etching, etching time and period of water immersion, J Dent Res., Vol. 59 (1980) 1156−1162.
[12] M. J. Shinchi, K. Soma, N. Nakabayashi, The effect of phosphoric acid concentration on resin tag length and bond strength of a photo-cured resin to acid-etched enamel, Dent Mater., Vol. 16 (2000) 324−329.
[13] B. Van Meerbeek, J. De Munck, Y. Yoshida, S. Inoue, M. Vargas, P. Vijay, et al., Buo-nocore memorial lecture. Adhesion to enamel and
dentin: Current status and future challenges, Oper Dent., Vol. 28 (2003) 215−235.
[14] N. Nakabayashi, D. H. Pashley, Chapter III, Acid Conditioning and Hybridization of Substra-tes, Hybridization of Dental Hard Tissues, Tokyo: Quintessence Publishing Co., Ltd., 1998, 37−39.
[15] M. Hannig, H. Bock, B. Bott, W. Hoth-Hannig, Inter-crystallite nanoretention of self-etching adhesives at enamel imaged by transmission electron microscopy, Eur J Oral Sci., Vol. 110 (2002) 464−470.
[16] L. R. Legler, D. H. Retief, E. L. Bradley, F. R. Denys, P. L. Sadowsky, Effects of phosphoric acid concentration and etch duration on the shear bond strength of an orthodontic bonding resin to enamel, An in vitro study, Am J Orthod Dentofacial Orthop., Vol. 96 (1989) 485−492.
[17] W. W. Barkmeier, A. J. Gwinnett, S. E. Shaffer, Effects of reduced acid concentration and etching time on bond strength and enamel morphology, J Clin Orthod., Vol. 21 (1987) 395−398.
[18] B. B. Cerci, L. S. Roman, O. Guariza-Filho, E. S. Camargo, O. M. Tanaka, Dental enamel roughness with different acid etching times: Atomic force microscopy study, Eur J Gen Dent., Vol. 1 (2012) 187−191.
[19] E. B. L. Casas, F. S. Bastos, G. C. D. Godoy, V. T. L. Buono, Enamel wear and surface roughness characterization using 3D profilometry, Tribol Int., Vol. 41 (2008) 1232−1236.
[20] S. Sharma, S. E. Cross, C. Hsueh, R. P. Wali, A. Z. Stieg, J. K. Gimzewski, Nanocharacteri-zation in Dentistry, Int J Mol Sci., Vol. 11 (2010) 2523−2545.
[21] A. Méndez-Vilas, J. M. Bruque, M. L. González-Martín, Sensitivity of surface roughness parameters to changes in the density of scanning points in multi-scale AFM studies, Application to a biomaterial surface, Ultramicroscopy, Vol. 107 (2007) 617−625.
[22] L. Matija, et al., Uvod u nanotehnologije, Nauka, Beograd 2011.
[23] Đ. Mirjanić, V. Mirjanić, J. Vojinović, Uticaj agresivnog napitka na nanostrukturu gleđi zuba, Zbornik radova „Savremeni materijali“, Banja Luka 2014, 575−585.
[24] Đ. Mirjanić, V. Mirjanić, J. Vojinović, AFM analiza nanostrukture gleđi nakon djelovanja agresivnog napitka, Zbornik radova „Savremeni materijali“, Banja Luka 2015, 603−617.
[25] B. Neville, D. D. Damm, C. M. Allen, J. Bouquot, Oral and Maxillofacial Pathology, 3th Edi-tion, Saunders 2008.

Vladan Mirjanić, AFM testing of nanostructure of resilience orthodontic bonding solutions... Contemporary Materials, VII−1 (2016) Page 71 of 72
[26] S. R. Grobler, P. J. Senekal, J. A.
Laubscher, In vitro demineralization of enamel by orange juice, apple juice, Pepsi Cola and Diet Pepsi Cola, Clin Prev Dent., Vol. 12 (1990) 5−9.
[27] M. Eisenburger, M. Addy, Influence of liquid temperature and flow rate on enamel erosion and surface softening, J Oral Rehabil., Vol. 30 (2003) 1076−1080.
[28] A. J. White, C. Yorath, V. Hengel, S. D. Leary, M. C. D. N. J. M. Huysmans. M. E. Barbour, Human and bovine enamel erosion under ‘single-drink’ conditions, Eur J Oral Sci., Vol. 118 (2010) 604–609.
[29] A. Lussi, T. Jaeggi, S. Schärer, The influ-ence of different factors on in vitro enamel erosion, Caries Res., Vol. 27 (1993) 387–393.
[30] M. Barbour, R. P. Shellis, An investiga-tion using atomic force microscopy nanoindentation of dental enamel demineralization as a function of undissociated acid concentration and differential buffer capacity, Phys Med Biol., Vol. 52 (2007) 899−910.
[31] R. A. Freitas Jr., Nanodentistry. J. Am. Dent. Assoc. ,Vol. 131 (2000) 1559−1565.
[32] S. Kimyai, et al., Effect of three prophylaxis methods on surface roughness of gio-mer, Medicina Oral, Patología Oral y Cirugía Bucal, Vol. 16−1 (2011) e110−e114.
[33] P. Schaad, E. Paris, F. J. Cuisinier, J. C. Voegel, Atomic force microscopy study of human tooth enamel surfaces, Scanning Microscopy, Vol. 7 (1993) 1149−1152.
[34] G. J. Lee, et al., A quantitative AFM analysis of nano-scale surface roughness in various orthodontic brackets, Micron, Vol. 41−7 (2010) 775−782.
[35] C. Poggio, et al., Impact of two toothpa-stes on repairing enamel erosion produced by a soft drink: an AFM in vitro study, Journal of Dentistry, Vol. 38−11 (2010) 868−874.
[36] J. Gimzewski, M. J. Miles, High-speed atomic force microscopy of dental enamel dissolu-tion in citric acid, Arch. Histol. Cytol., Vol. 72 (2009) 328−335.
[37] N. Schlueter, A. Hara, R. P. Shellis, C. Ganss, Methods for the measurement and characte-rization of erosion in enamel and dentine, Caries Res., Vol. 45−1 (2011) 13−23.
[38] L. Eslamian, A. Borzabadi-Farahani, N. Mosavia, A. Ghasemi, A comparative study of shear bond strength between metal and ceramic brackets and artificially aged composite restorations using different surface treatments, The European Journal of Orthodontics, 2011.
[39] G. V. Newman, First direct bonding in ortodontia, Am J. Orthod Dentofacial Orthop, Vol. 101 (1992) 190−192.
[40] D. Battes, D. H. Retief, H. C. Jamison, F. R. Denys, Effects of acid etch parameters on enamel topography and composite resin-enamel bond strength, Pediatric Dentistry, Vol. 4 (1982) 106−110.
[41] D. H. Retief, A comparative study of three etching solutions; effects on enamel surface and adhesive-enamel interface, J. Oral Rehabil., Vol. 2 (1975) 75−96.
[42] B. Wendl, H. Droschl, A comparative in vitro study of the strength of directly bonded brac-kets using different curing techniques, European Journal of Orthodontics, Vol. 26−5 (2004) 535.
[43] V. Mitić, M. Janošević, Uticaj vremena aplikacije ortofosforne kiseline na jačinu veze orto-dontskih bravica na zub, Serbian Dental J., Vol. 55 (2008) 23−33.
[44] L. Bozec, J. de Groot, M. Odlyha, B. Nicholls, M. A. Horton, Mineralised tissues as nanomaterials: Analysis by atomic force microscopy, IEEE Proc. Nanobiotechnol., Vol. 152 (2005) 183−186.
[45] S. Chandra, et al., Textbook of Dental and Oral Histology with Embryology and MCQS, 2th edition, 2/E. Jaypee Brothers Medical Publishers (P) Ltd. 2011.
[46] E. O'Sullivan, A. Milosevic, UK National Clinical Guidelines in Paediatric Dentistry: diagno-sis, prevention and management of dental erosion. International Journal of Paediatric Dentistry, Vol. 18−1 (2008) 29–28.
[47] M. Edwards, S. L. Creanor, R. H. Foye, W. H. Gilmour, Buffering capacities of soft drinks: the potential influence on dental erosion, Journal of Oral Rehabilitation, Vol. 26−12 (1999) 923–927.
[48] C. R. Dugmore, W. P. Rock, A multifac-torial analysis of factors associated with dental ero-sion (PDF, British Dental Journal, Vol. 196−5 (2004) 283–286; discussion: 273.
[49] S. R. Grobler, G. van der Horst, Bioche-mical analysis of various cool drinks with regard to enamel erosion, de- and remineralization, J Dent Assoc S Africa, Vol. 37 (1982) 681−684.
[50] A. J. Rugg-Gunn, J. H. Nunn, Diet and dental erosion, Nutrition, diet, and oral health, Hong Kong: Oxford University Press 1999.
[51] M. J. Larsen, B. Nyvad, Enamel erosion by some soft drinks and orange juices relative to their pH, buffering effect and contents of calcium phosphate, Caries Res., Vol. 33 (1999) 81−87.
[52] T. Endo, R. Ozoe, K. Shinkai, M. Aoyagi, H. Kurokawa, Y. Katoh, S. Shimooka,

Vladan Mirjanić, AFM testing of nanostructure of resilience orthodontic bonding solutions... Contemporary Materials, VII−1 (2016) Page 72 of 72
Shear bond strength of brackets rebonded with a fluoride-releasing and recharging adhesive system, Angle Orthodontist, Vol. 79 (2009) 564−570.
[53] J. P. Loyola-Rodriguez, V. Zavala-Alonso, E. Reyes-Vela, N. Patiño-Marin, F. Ruiz, K. J. Anusavice, Atomic force microscopy observa-tion of the enamel roughness and depth profile after phosphoric acid etching, J Electron Microsc (Tokyo), Vol. 59 (2010) 119−125.
[54] Đ. Mirjanić, Atomska mikroskopija nano-strukture gleđi, magistarski rad, Medicinski fakultet Univerziteta u Banjoj Luci, Banja Luka 2012.
[55] M. Beyer, J. Reichert, J. Bossert, B. W. Sigusch, D. C. Watts, K. D. Jandt, Acids with an equivalent taste lead to different erosion of human dental enamel, Dent Mater., Vol. 27 (2011) 1017−1023.
[56] M. Hannig, C. Hannig, Nanomaterials in preventive dentistry, Nature Nanotechnol., Vol. 5 (2010) 565−569.
[57] C. R. Mattick, R. S. Hobson, A compara-tive micro-topographic study of the buccal enamel of different tooth types, J Orthod., Vol. 27 (2000) 143−148.
[58] Y. Hashimoto, Y. Hashimoto, A. Nishiu-ra, N. Matsumoto, Atomic force microscopy obser-vation of enamel surfaces treated with self etching Primer, Dent Mater J., Vol. 32−1 (2013) 181–188.
[59] K. Nakajima, H. Yamaguchi, J. C. Lee, M. Kageshima, T. Ikehara, T. Nishi, Nanorheology of polymer blends investigated by atomic force microscopy, Jpn J Appl Phys. Part 1: Regular Papers and Short Notes and Review Papers, Vol. 36 (1997) 3850−3854.
[60] T. Tsujioka, K. Tsuji, Metal-vapor depo-sition modulation on soft polymer surfaces, Appl Phys Express, Vol. 5 (2012) 021601−3.
[61] D. R. Baselt, J. D. Baldeschwieler, Ima-ging spectroscopy with the atomic force microscope, J Appl Phys., Vol. 76 (1994) 33−38.
[62] M. Radmacher, M. Fritz, J. P. Cleveland, D. A. Walters, P. K. Hansma, Imaging adhesion for-ces and elasticity of lysozyme adsorbed on mica with the atomic force microscope, Langmuir, Vol. 10 (1994) 3809−3814.
[63] M. Beyer, J. Reichert, J. Bossert, B. W. Sigusch, D. C. Watts, K. D. Jandt, Acids with an equivalent taste lead to different erosion of human dental enamel, Dent Mater., Vol. 27 (2011) 1017−1023.
[64] S. E. Bishara, V. V. Gordan, L. VonWald, J. R. Jakobsen, Shear bond strength of composite, glass ionomer, and acidic primer adhesi-ve systems, Am J Orthod Dentofacial Orthop., Vol. 115 (1999) 24−28.
[65] F. L. Romano, A. B. Correr, L. Correr-Sobrinho, M. B. B. A. Magnani, A. C. O. Ruellas, Clinical evaluation of the failure rates of metallic brackets, J Appl Oral Sci., Vol. 20 (2012) 228−234.
[66] S. Kitayama, T. Nikaido, M. Ikeda, R. M. Foxton, J. Tagami, Enamel bonding of self-etch and phosphoric acid-etch orthodontic adhesive systems, Dent Mater J., Vol. 26 (2007) 135−143.
[67] M. Hannig, C. Hannig, Nanomaterials in preventive dentistry, Nature Nanotechnol., Vol. 5 (2010) 565−569.
АФМ АНАЛИЗА ОШТЕЋЕЊА ГЛЕЂИ УСЉЕД ЈЕТКАЊА ОРТОФОСФОРНОМ КИСЕЛИНОМ
Сажетак: Имајући у виду да у области ортопедије вилица и сродних научних
области не постоје научна истраживања која користе данас најсавременију техноло-гију засновану на атомској микроскопији (АФМ) за испитивање наноструктуре глеђи зуба након јеткања 37% ортофосфорном киселином, у раду ће се утврдити, на данас најпоузданији могући начин, АФМ (Atomic Force Microscopy) методом степен оште-ћења глеђи зуба након њеног нагризања (јеткања) у циљу фиксирања ортодонтских бравица. Степен оштећења глеђи након јеткања не може се реално сагледати методом тзв. „мреже”, јер се оштећење, на овај начин, не може сагледати просторно (у дубини оштећења), већ се може видјети само оштећење у једној равни. Прецизнија анализа може се добити примјеном АФМ технологије, као најсавременије методе коју имамо у овом случају.
Кључне ријечи: атомска микроскопија, оштећење глеђи, јеткање, ортофос-форна киселина.